1. Introduction
In the early design stages, an (approximately) correct prediction of the performance of a turbomachine is critical, not only because it ensures that the type of components of the stage (impeller, diffuser and volute) are in line with current technology and with the design specifications, but also because it facilitates the subsequent final design task. The general performance maps available from manufacturers are usually limited to a small range of rotational speeds, pressure ratios and mass flow rates, and extrapolating on their basis at the onset of a selection or design task is especially risky. Current portable power generators are mainly based on internal combustion engines (ICEs) since they present higher values of efficiency compared to other engines; the main reason why ICEs are not convenient for micro power generation (5–30 kW) is because of their heaviness. Micro- and Ultra-Micro Gas Turbine (UMGT) devices, based on a micro compressor and a micro turbine installed on the same shaft, are more suitable for this scope for several reasons. They present a higher power density, both in terms of kW/kg and kW/m3, lower emissions, less moving elements, multi-fuel capability (they operate almost equally well with kerosene, natural gases, propane, etc.). The main reason why UMGTs are not currently realized is due to their low efficiency. In fact, while today large-scale commercial turbo-gas power plants reach the 40% mark, micro turbo-sets rarely exceed 15%. Low efficiency on such an engine is related to the high velocity the fluid has inside the turbo machinery channels which lower the efficiency of the compressor and the turbine, and the combustion process. The actual device is a single-stage radial compressor (C) and an axial turbine (T). The small dimensions of the turbo machinery lead to a very high rotational speed, which places severe demands on the bearings.
In addition, it can be remembered that the main problem of power conversion based on miniature turbomachinery is the lack of suitable performance data for such small-scale equipment. The described and presented tests could contribute to the advancement of compressor/turbine performance at small scale (<50 kW), and supply a valid help to design a highly efficient and robust power conversion technology. Since 1980 [
1,
2] several tests at a small scale has been carried out. In 2000 and 2001 [
3,
4] the first results have been published for a 4 mm diameter turbine with prismatic blades reaching 1,400,000 rpm and an output power of 5 W. In 2003 and 2004 [
5,
6], the articles give an overview of the 10 W Massachusetts Institute of Technology (MIT) micro-gas turbine project. In 2005, the feasibility study of a gas turbine engine with an output of 100 W, using 3D radial impellers operating at a pressure ratio of 3, requiring rotational speeds in excess of 850,000 rpm, has been presented. In 2006 Japanese researchers [
7], demonstrated the feasibility of a radial compressor rotating at 720,000 rpm reaching pressure ratios up to 2 and isentropic efficiencies in excess of 60%. This brief collection of research works clearly demonstrates the technical feasibility of such a devices but, at the same time, the lack of a detailed collection of experimental tests. Analizing the small-scale turbomachinery, such a machinery is affect by low Reynolds-number flows, a large relative tip clearance and a non-adiabatic flow condition.
The effect of low Reynolds-number flows in the compressor stages has been thoroughly captured in early work [
6,
7,
8] where a correction based on the machine Re-number and surface roughness was proposed. Since the early works by Wiesner and Stodola and Lowestein, one-dimensional prediction techniques and related semi-empirical loss correlations have been persistently developed. The prevailing approach is to lump together losses of different type in the form of either a slip factor, a loss coefficient, or both. The downside of such a model is that the effects of individual losses are not clearly characterized and some phenomenological information is lost. To validate the results some authors try to provide a combination of computational fluid dynamics (CFD) analysis and experimental tests [
8,
9]. Tip clearance has been investigated by various teams [
10,
11,
12,
13], all claiming that a 10% increase in tip clearance decreases performance by 3–4 points. Recent work, however, shows that this trend may be considerably smaller or even larger depending on the impeller geometry and suggests that so far no clear correlation was found [
14,
15]. All these considerations have suggested to carry out a campaign of tests on a small-scale gas turbine device, to fill those gaps, previously described in this paragraph. The tested device was a group for aero modelling [
16]. The knowledge of the performance of the system has been dictated by project program, in which this campaign has been carried out. In the framework of this research (Italian Research Program-project to build a high-performance GT device for vehicular application), it needed to find the “quasi-optimal” propulsion device and therefore the analysis of selected group becomes of fundamental importance.
In the following paragraphs, an in-depth analysis of the gas turbine device components will be presented, as well as the test bench assembly. Then in the methodology section the experimental campaigns carried out with kerosene and gas will be illustrated. The obtained experimental data were then integrated through thermodynamic numerical simulations, to obtain a reasonable preview regarding the net output power and an estimation of the cost of the KW produced.
2. Turbojet Configuration
The turbojet engine used for the experimental campaign is a Jetcat
® P60 SE (Ingenieurbüro CAT, Dottingen, Germany), whose technical characteristics are listed in
Table 1.
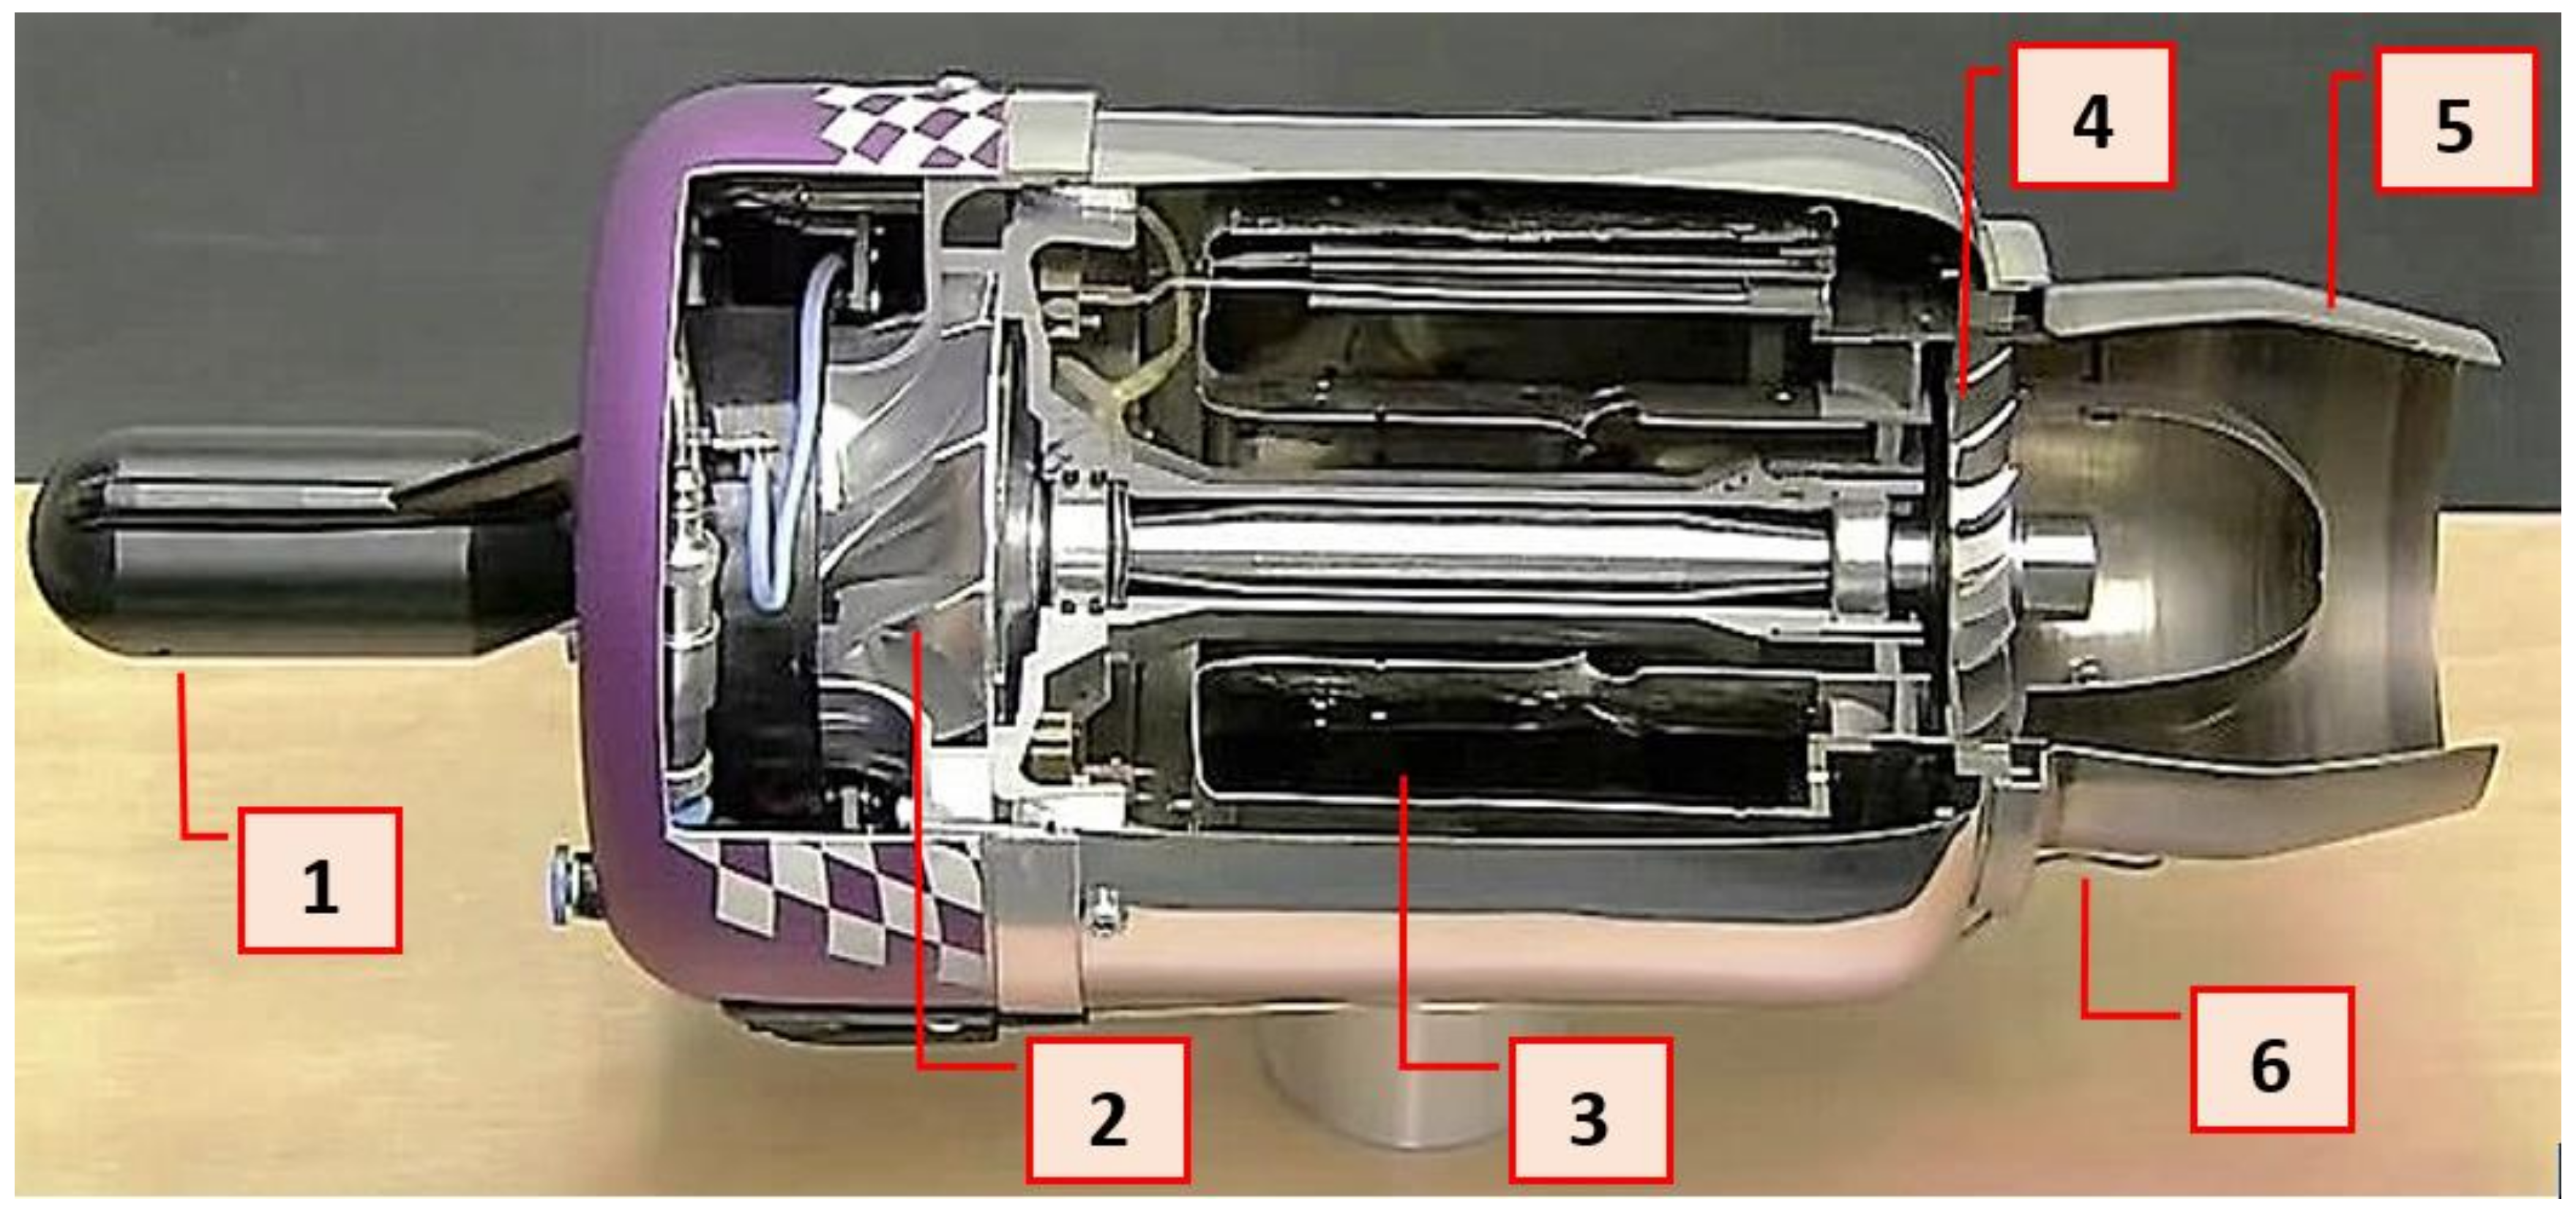
With reference to the
Figure 1 (turbine cut-away), it is possible to identify its main components: (1) electric motor (EM); (2) compressor (C); (3) combustion chamber (CC); (4) turbine; (5) nozzle and (6) thermocouple housing.
In details:
- (1)
This electric motor initializes the shaft rotation. When the RPM reach a pre-set value (flame stabilization), the starter motor is switched off, and the turbine drives the device. During the operating mode, the electric motor is used by a generator (DC), delivering an electrical signal to control unit (ECU). The signal is proportional to rotation speed (the device operates as a tachometer). Finally, in the shutdown procedure, the electric motor is switched on and operate as a cooling member, as long as the temperature does not drop to 100 °C.
The EM is coupled with the crankshaft by the compressor screw nut.
- (2)
The compressor is single-stage radial, centered on the crankshaft. The stator blades are aluminum made, that guarantees resistance and lightness. On this side, the fuel distribution system is realized, and constitutes the front cover of turbine (baseplate). A ceramic bearing allow the compressor blade alignment with the shaft. Such a compressor has been previously tested [
17] and all maps constructed. In any case, the compressor operation maps will be reported hereafter.
- (3)
The combustion chamber is obtained from a laser welded steel cylinder. The fuel distribution O-ring is manufactured on the baseplate. The parts correctly aligned are assembled in a metal stand. The fuel delivery is obtained by a system of pipes that enter into the chamber. The mixture is ignited by an electronically controlled spark plug.
- (4)
The stator vane are pressed on the end of the chamber, will redirect the flow of hot gasses to the turbine wheel. The axial turbine wheel and the shaft are install into the turbojet, sliding the shaft into the centre cylinder. The rotation induced to the turbine turns the compressor, feeding the process. Finally the turbine outlet gases come into the nozzle (5), maximizing the thrust.
- (5)
A nozzle is placed at the turbine outlet, to maximize thrust.
- (6)
A thermocouple is placed on the turbine side (ends in the nozzle), for measuring the outlet exhausted gas temperature.
3. Device Electronics
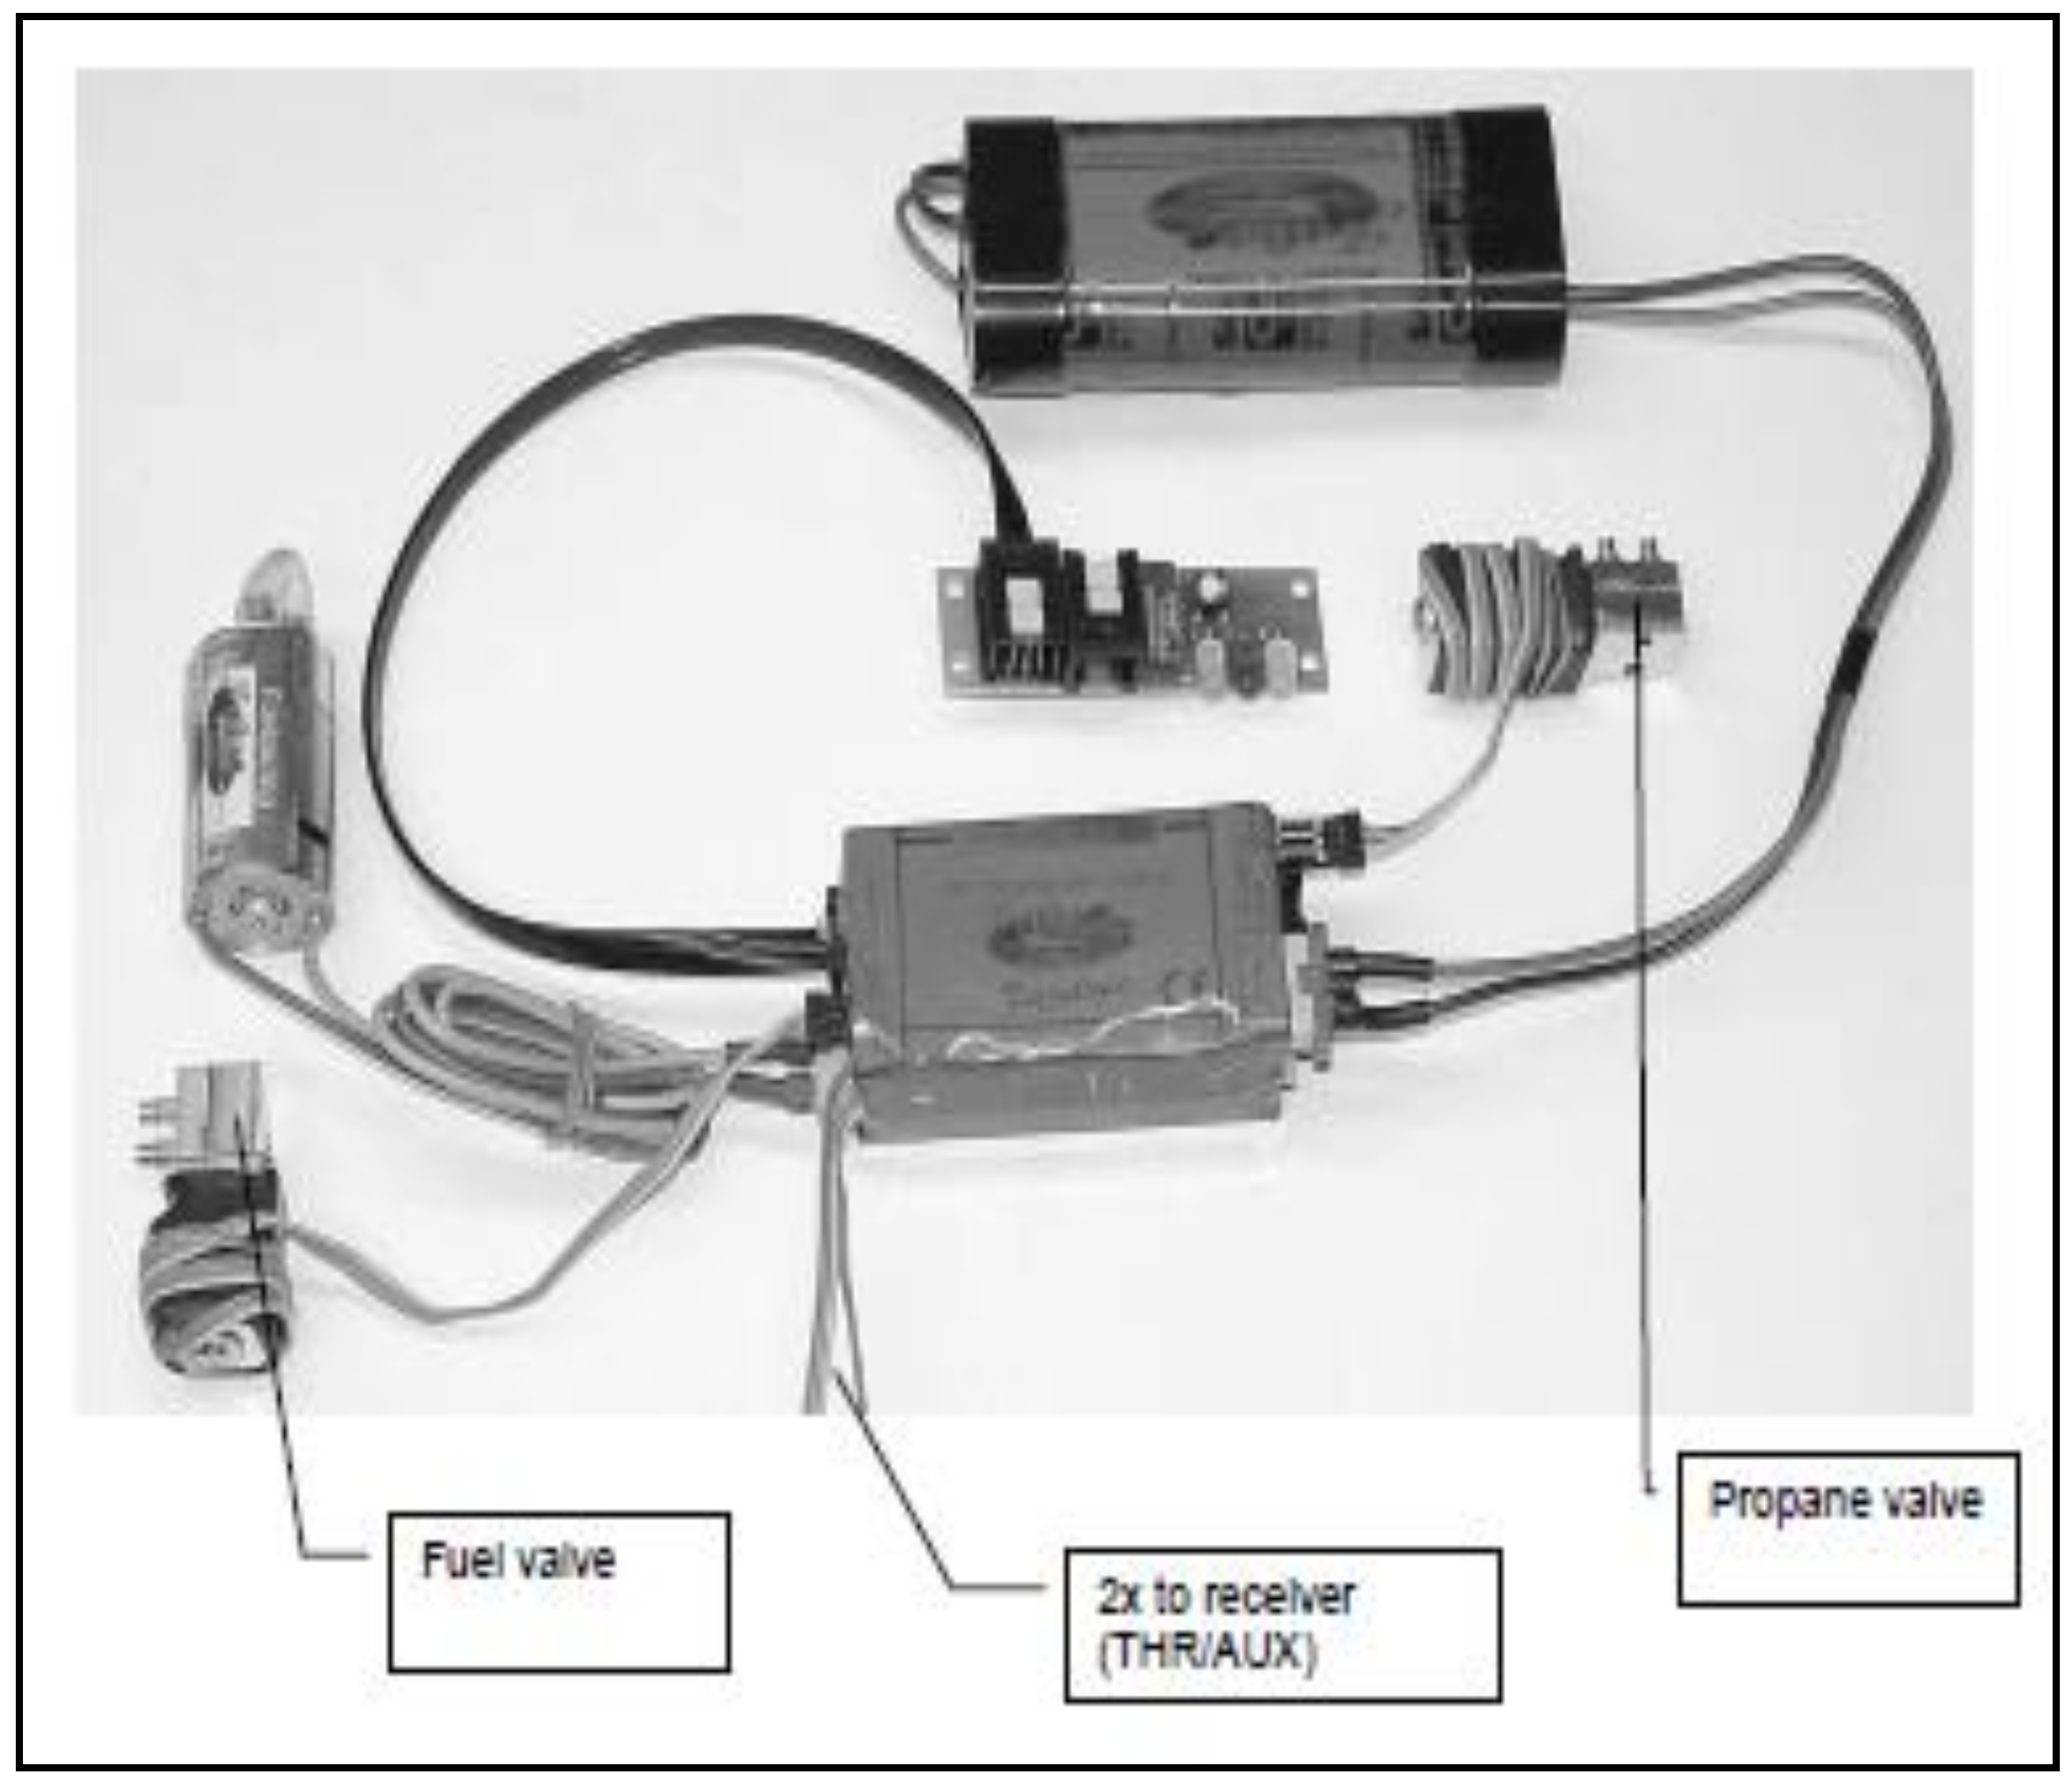
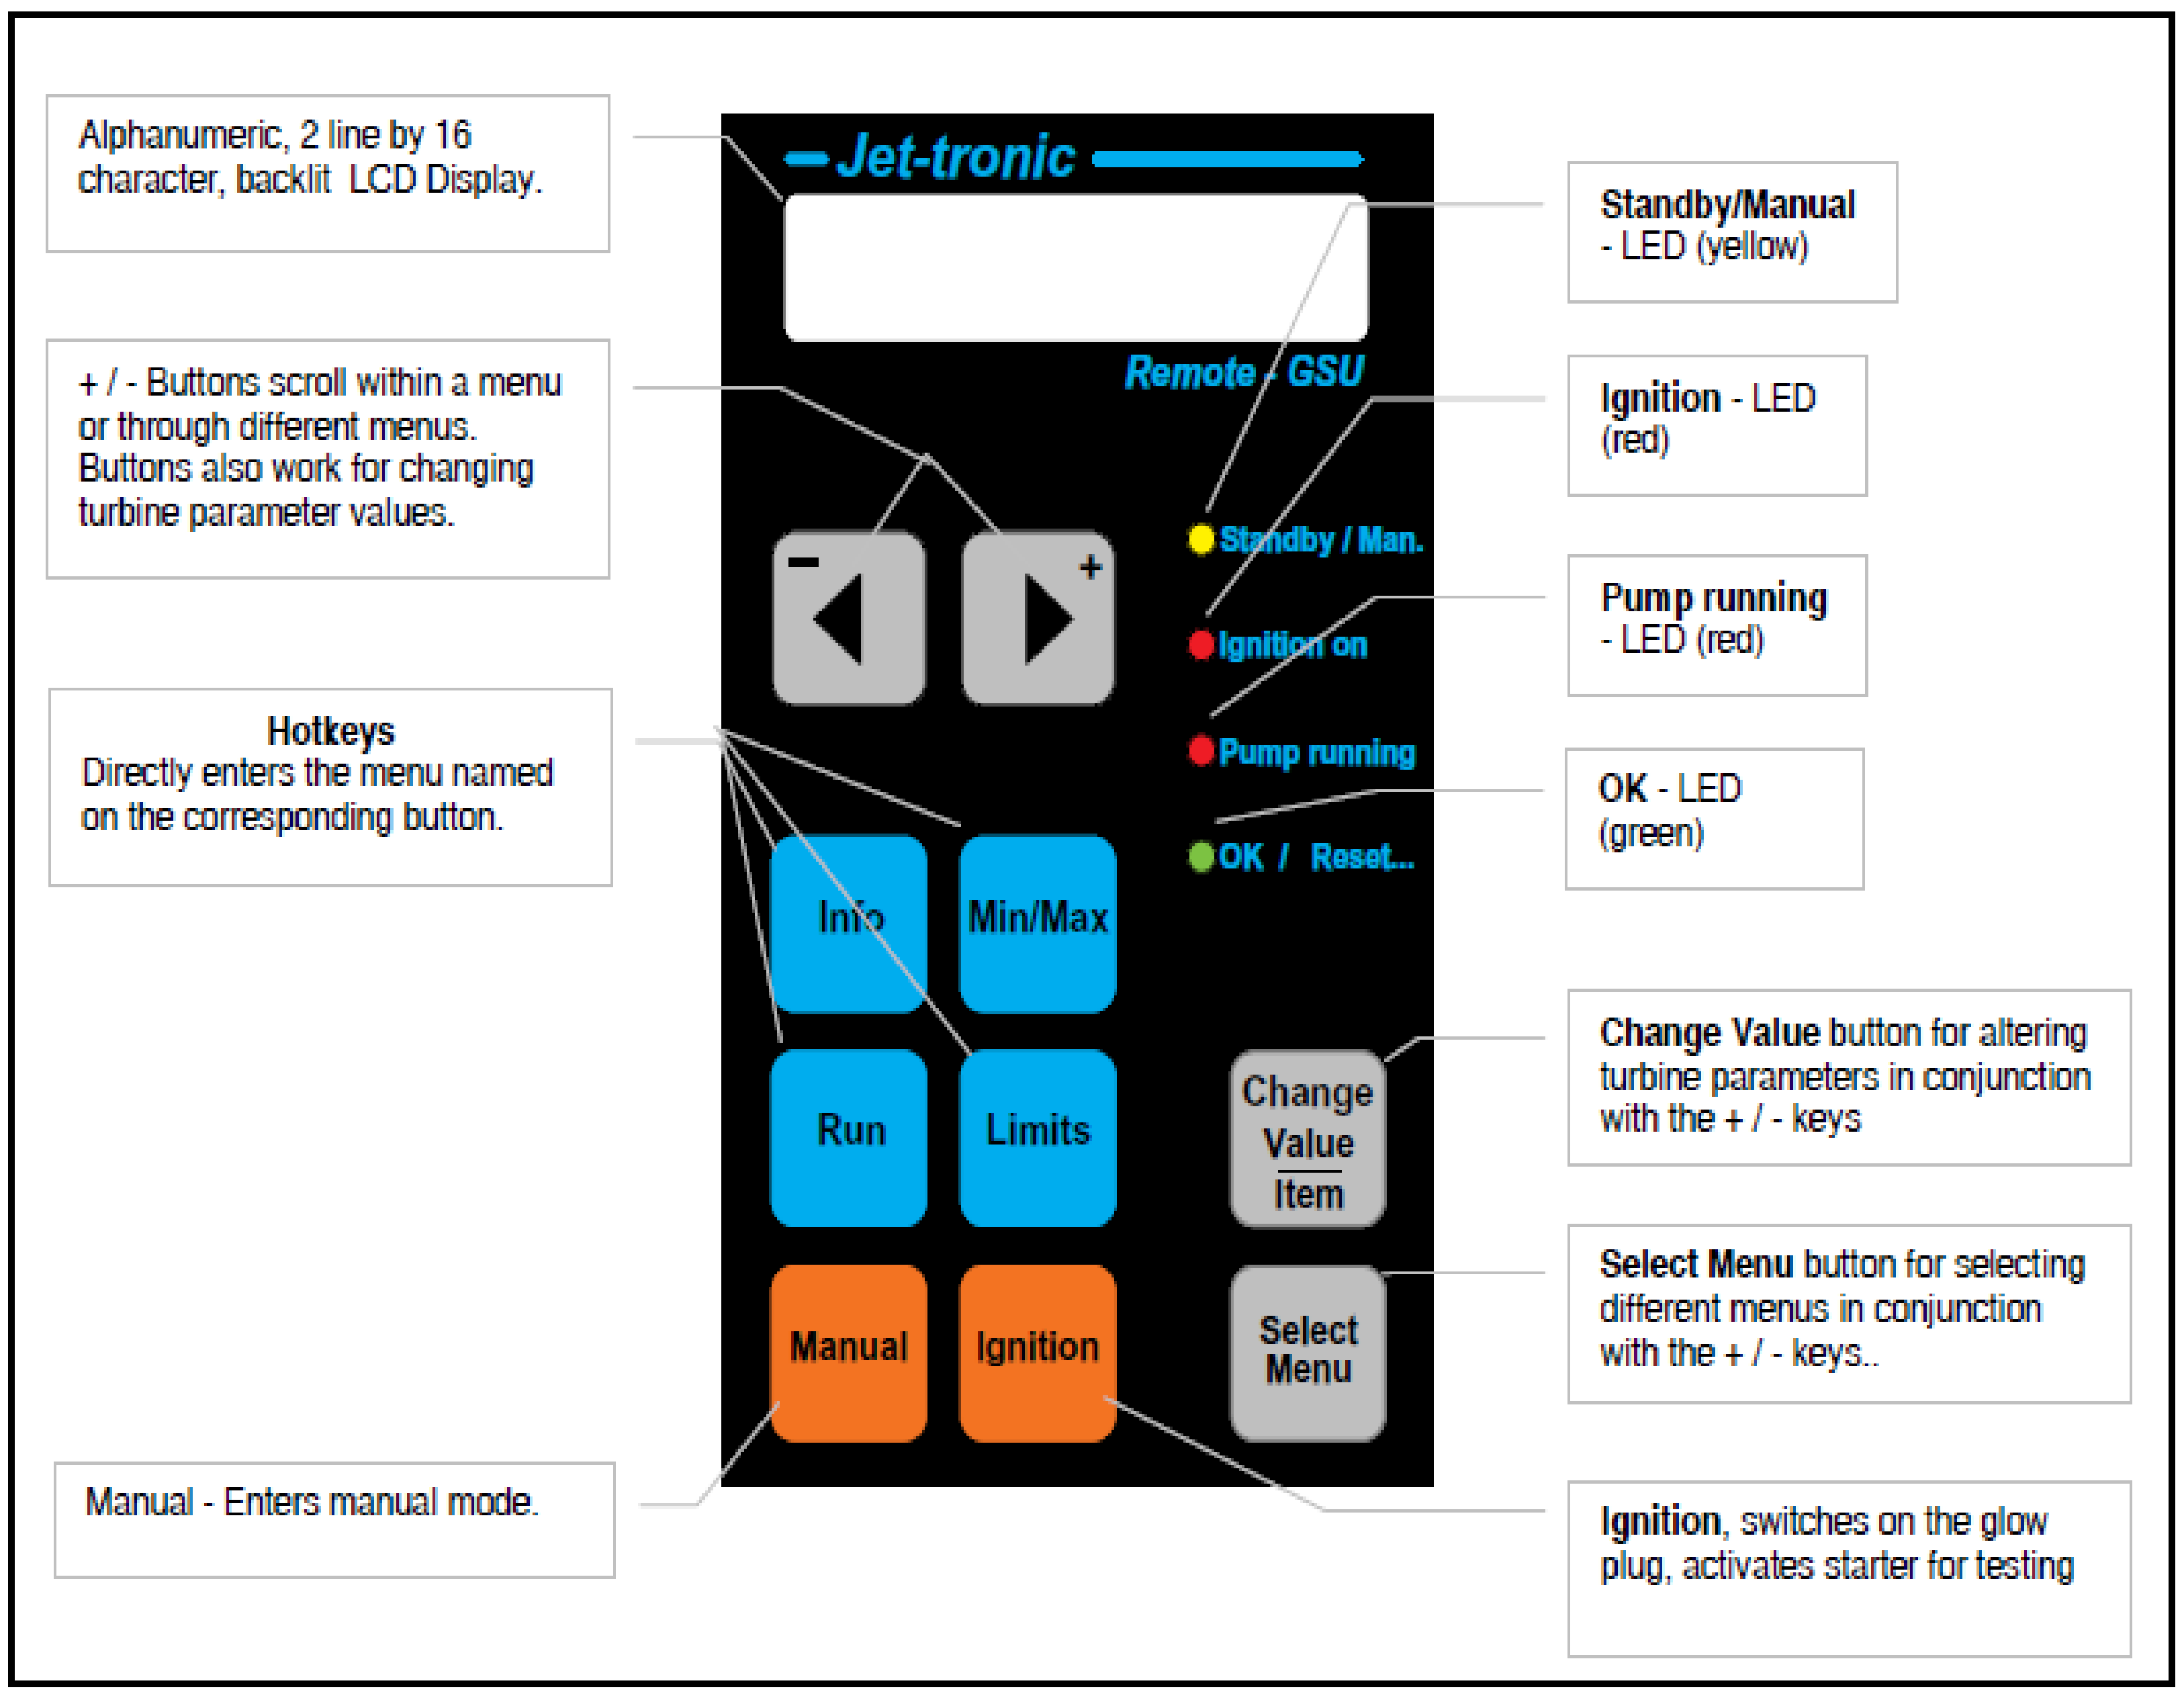
The ECU (
Figure 2) is a microcomputer that manages the ignition phase, controls the fuel solenoid valves, the kerosene pump and, in case of radio-commanded vehicle mounting, decodes the flight information. The Ground Support Unit (GSU) is the turbine control and maintenance system, directly connected to the ECU. Through the backlit alphanumeric display and 10 operational keys (
Figure 3), it is possible to monitor all ECU functions and change some parameters. The monitored functions are:
- (1)
exhaust gas temperature;
- (2)
number of revolutions/rpm;
- (3)
pump voltage;
- (4)
battery voltage.
The monitored and measured data are:
- (1)
total fuel consumption;
- (2)
total operation time;
- (3)
maximum speed;
- (4)
number of unsuccessful and failed starts;
- (5)
partial load time.
4. Test Bench Assembling
Test bench assembly has been created as follows: firstly, the hydraulic circuit for the fuel supply has been connected, then the electrical circuit for the regulation and control of the machine have been realized. Finally, the whole measuring chain for these devices has been realized.
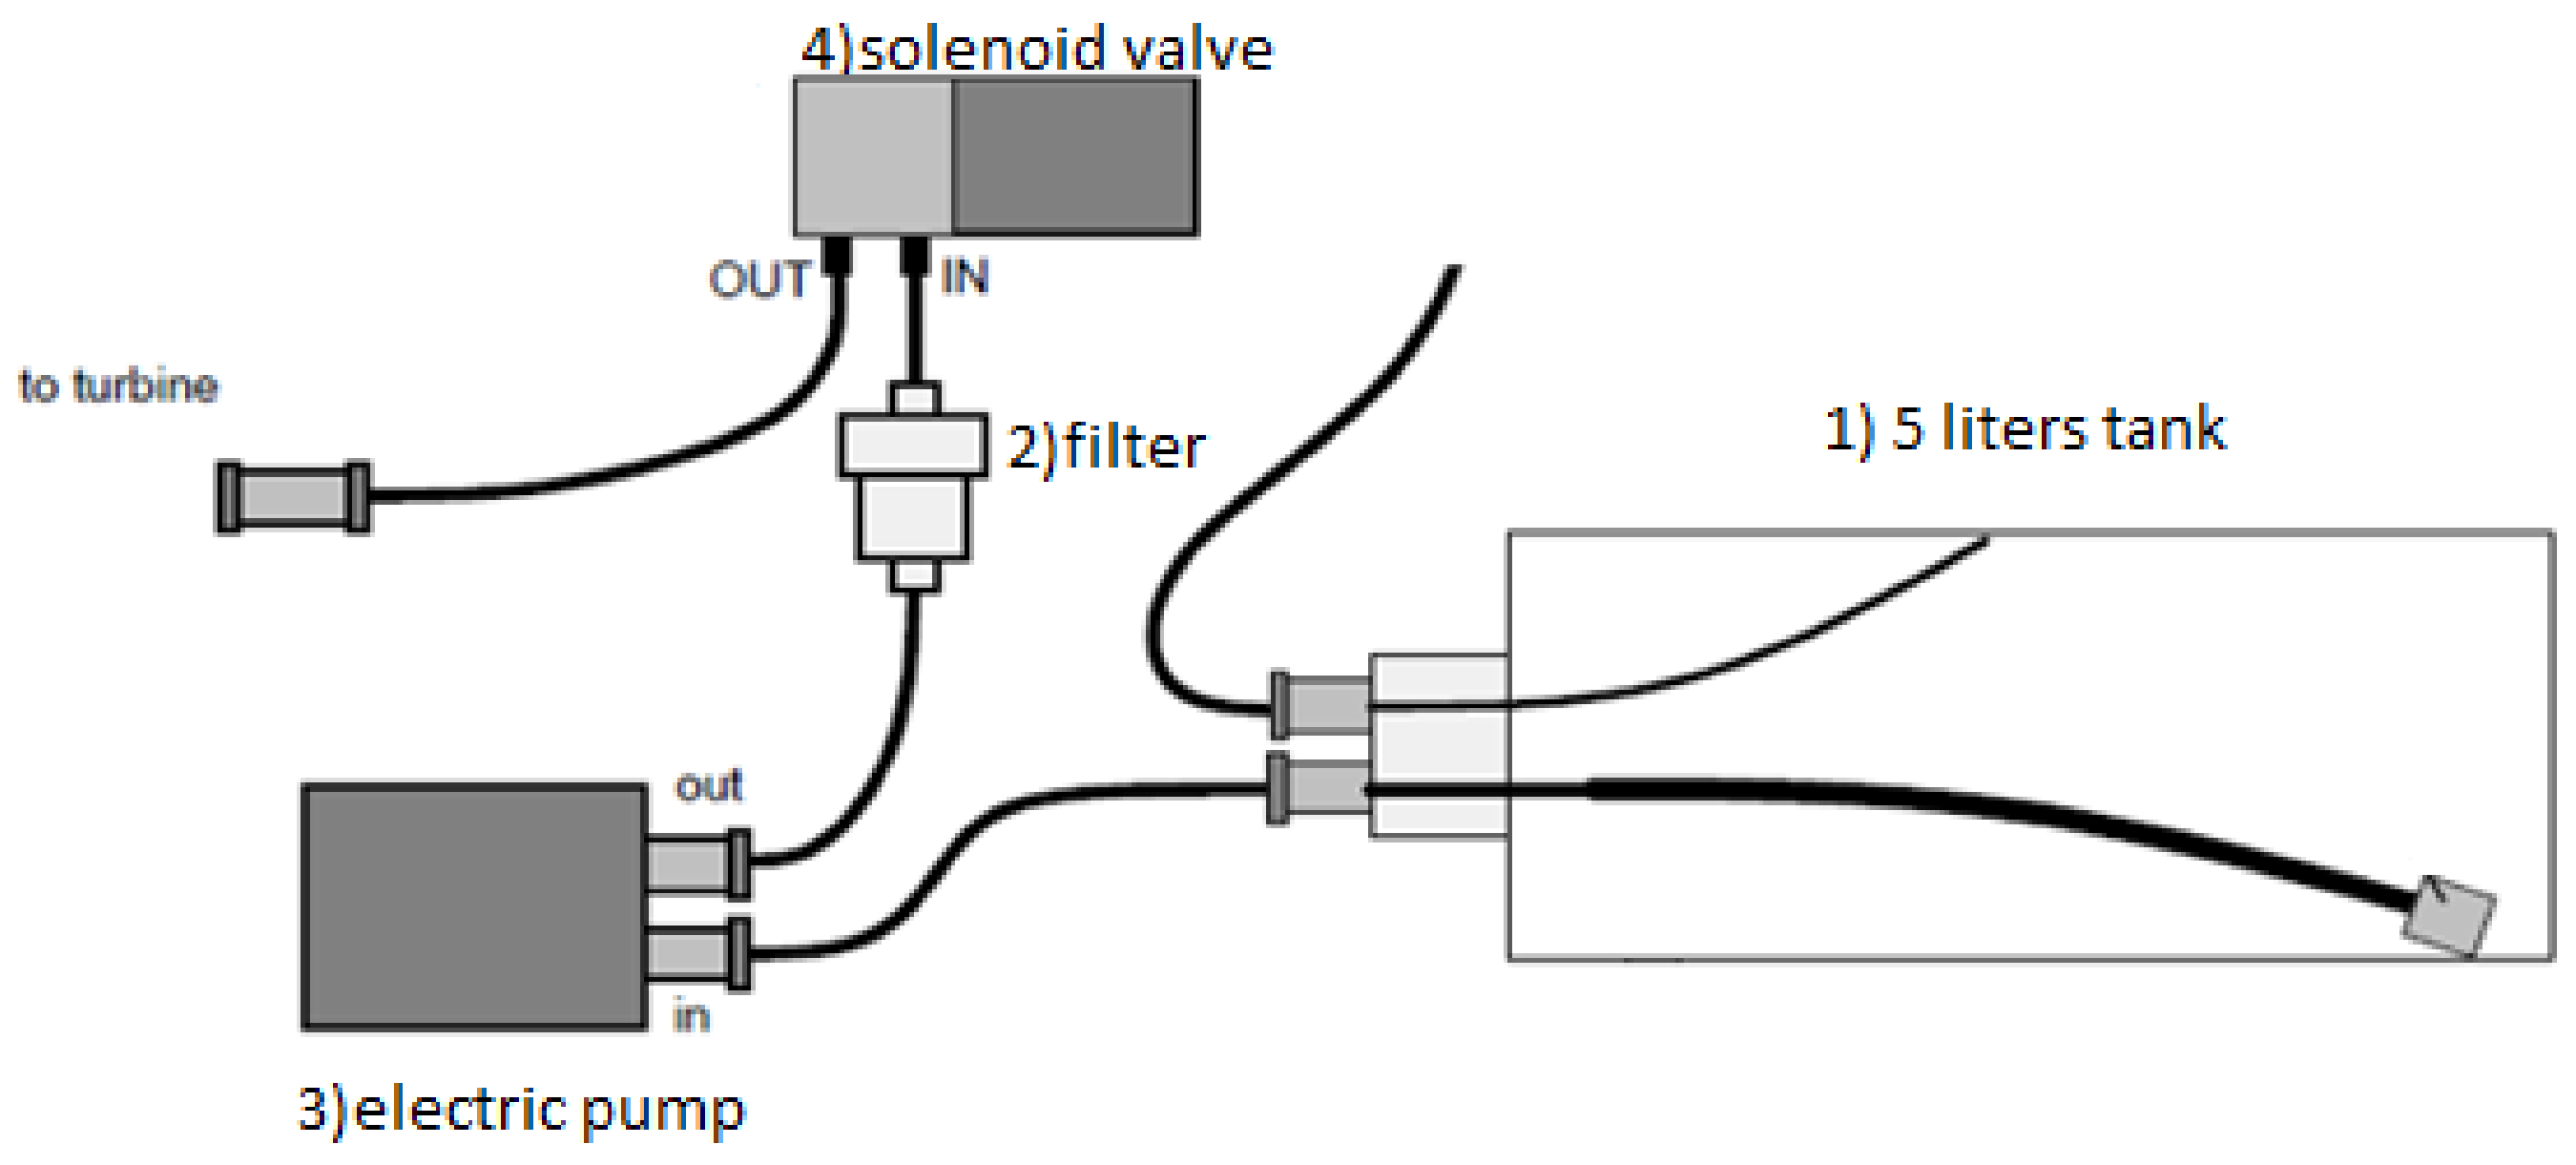
4.1. Hydraulic Circuit
The JetCat engine can use deodorized kerosene, 1-K kerosene or Jet-A1 as fuel. Fuel must be mixed with 5% synthetic turbine oil to ensure lubrification. JetCat itself recommends Aeroshell 500 turbine oil, although any turbine oil that conforms to MS23699 standards can be used [
16]. The input and output fuel piping must be connected to the electronic shut-off valve. When the engine runs at full power, the control unit ECU checks the fuel line, from the pump to the engine. The hydraulic system consists of the following components (
Figure 4):
- (1)
Five (5) liter tank;
- (2)
Filter;
- (3)
Electric pump (with its cables connected to the ECU);
- (4)
Solenoid valve (with its cables connected to the ECU);
- (5)
4 mm diameter tubes.
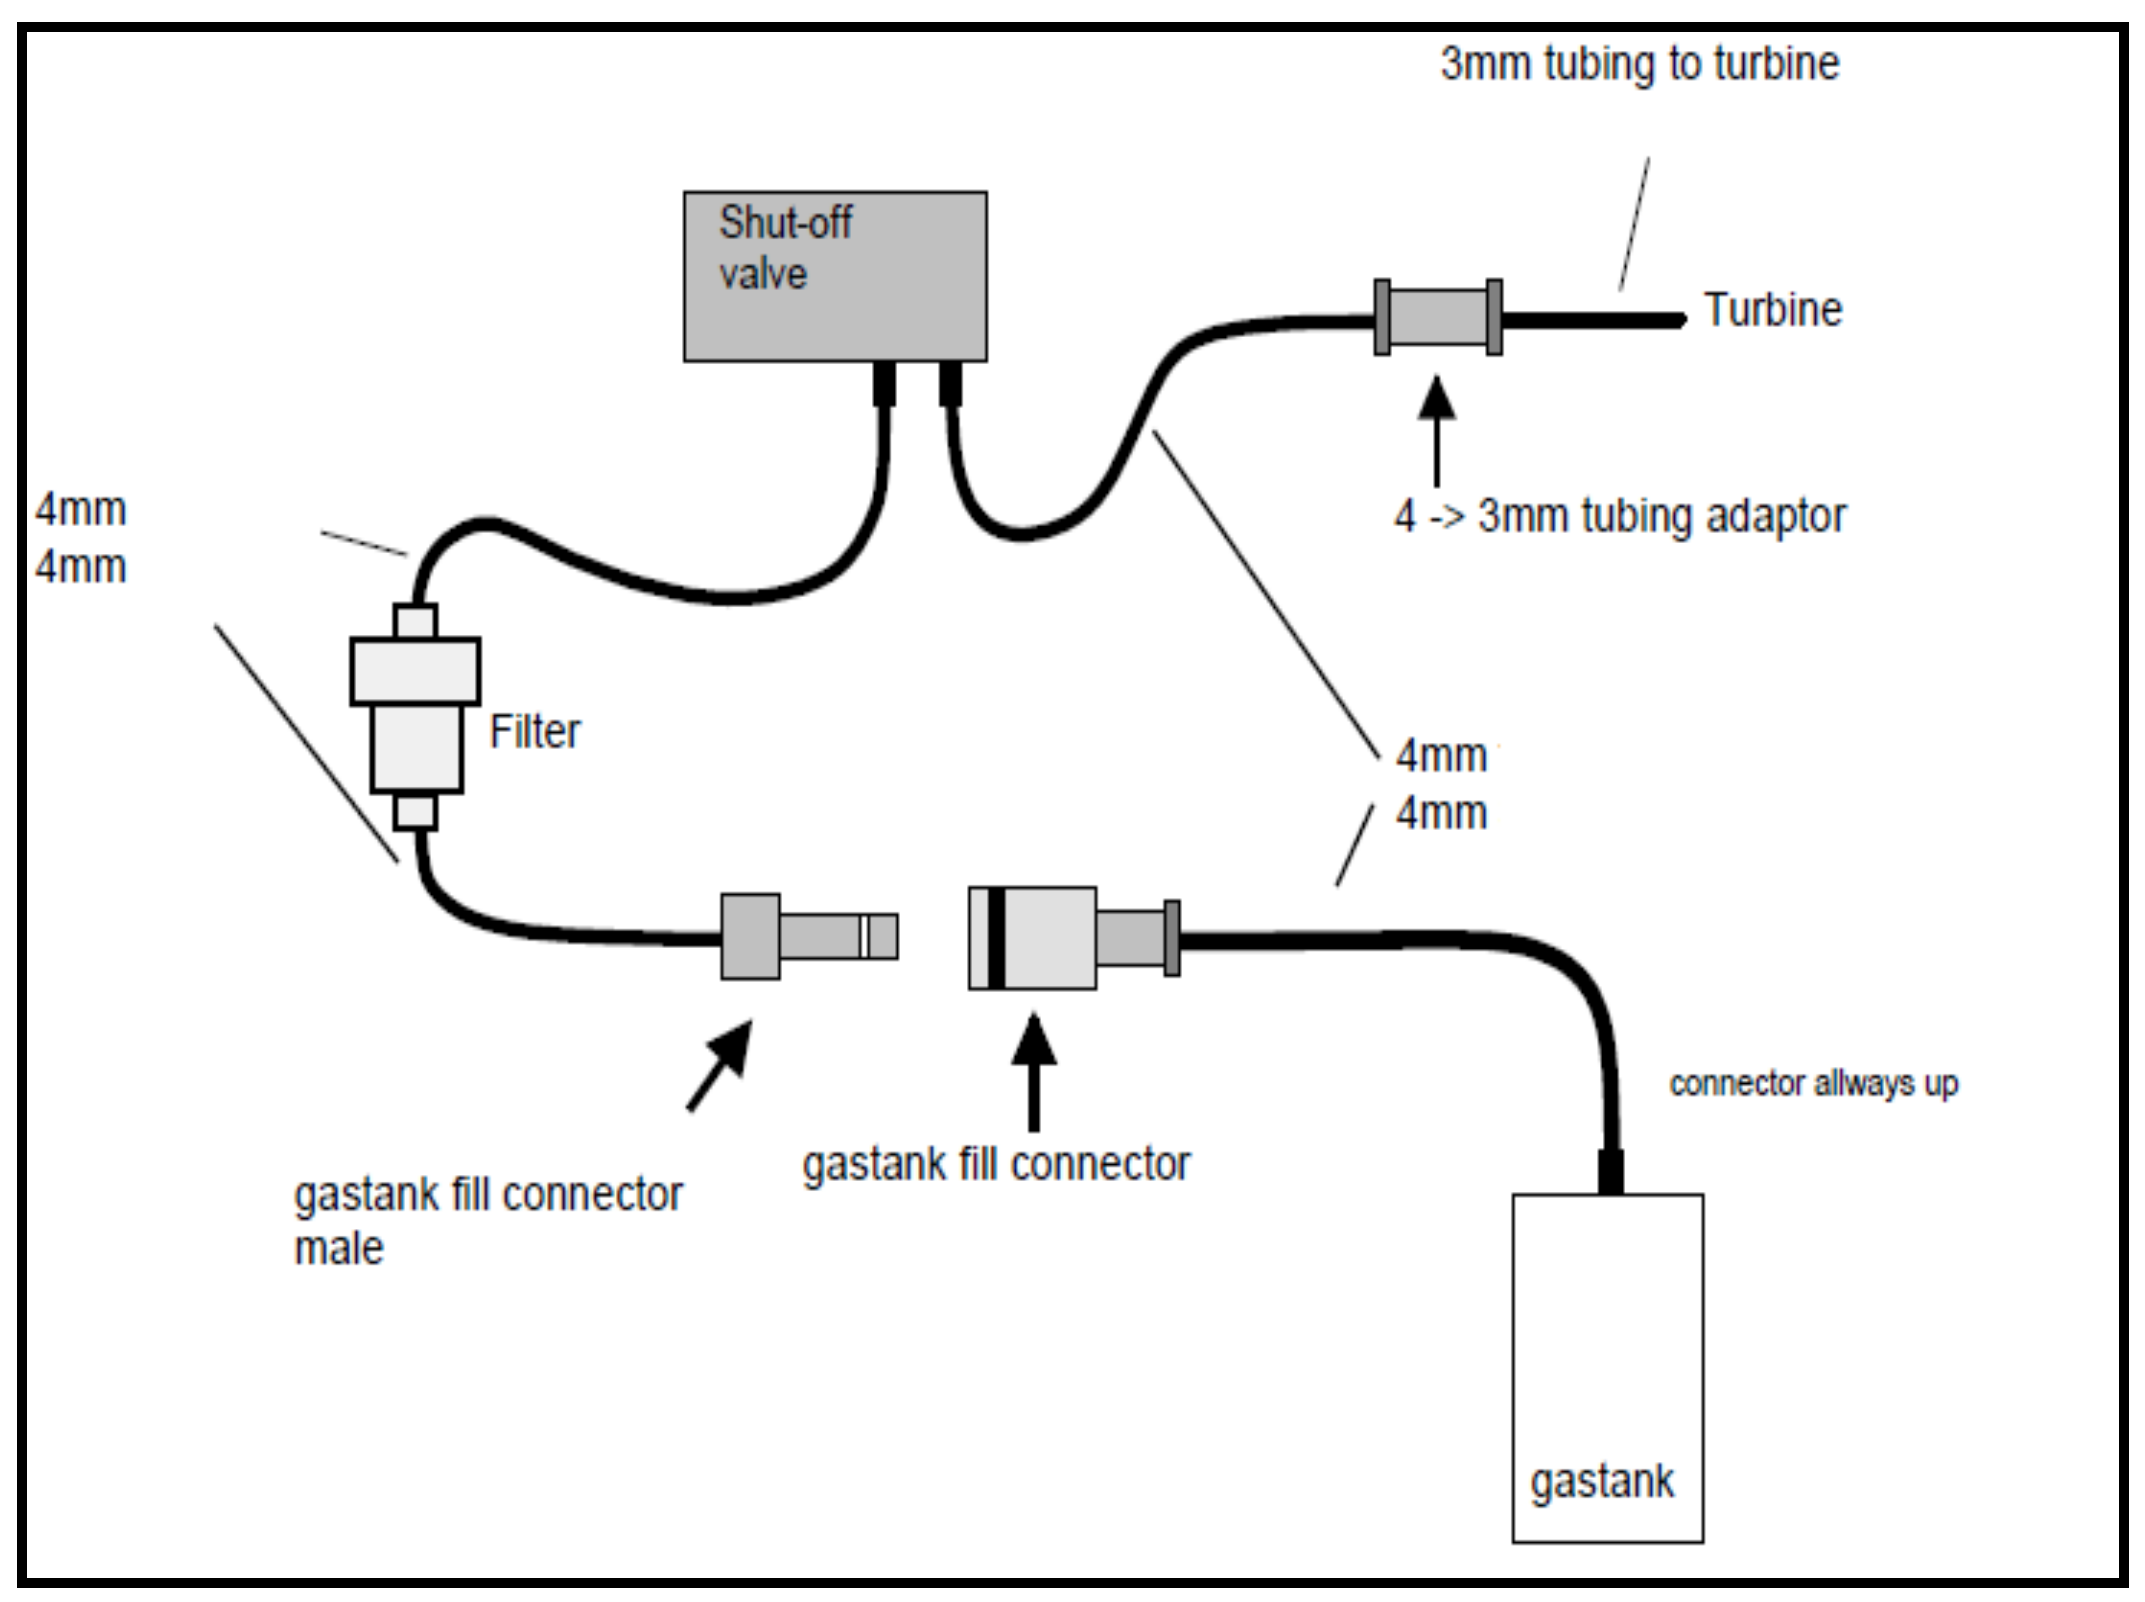
4.2. Gas Circuit
In
Figure 5 shows the fuel supply systems using a mixture of propane and butane gas. This configuration is used only for the start-up procedure. As can be noticed, the gas pipes are connected to the electronic shut-off valve. The gas starter tank can be mounted vertically or horizontally. If the tank is mounted in the vertical or lateral position, the offset nipple is positioned upward. In this way the amount of liquid propane that enters the turbine during startup is limited and adjusted. After each test session, the valve must be open to empty the tank. The propane filter is installed just before the starter gas valve.
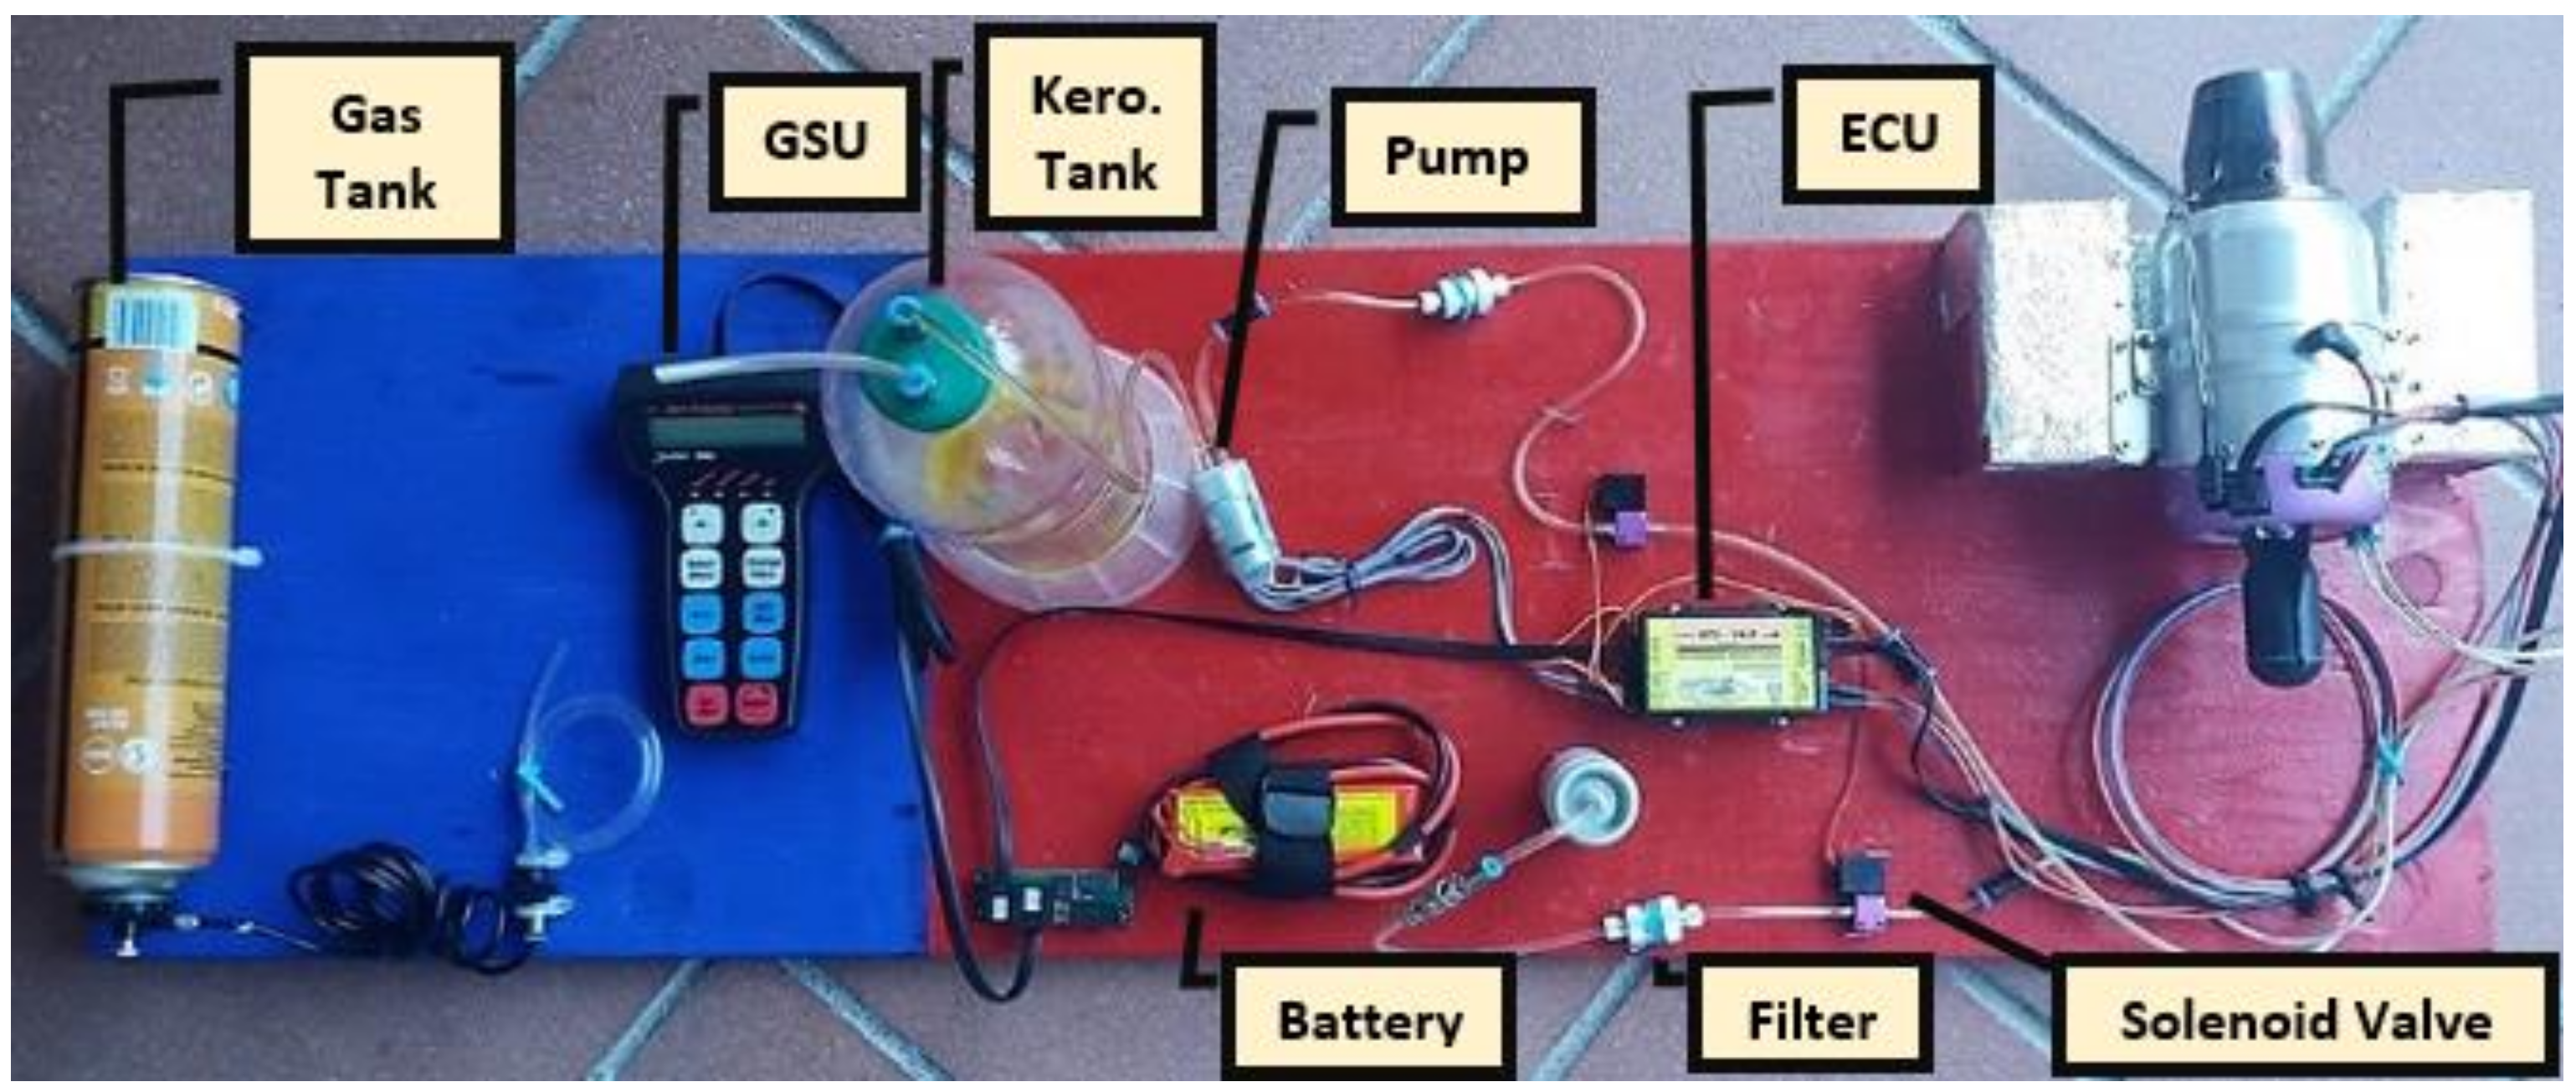
5. Experimental Campaigns
The experimental campaigns have been carried out in the department laboratory. The assembled test bench is shown in
Figure 6. Once the turbine is switched on and the operating point has been reached, the measurement campaign started, acquiring data from the speed of 50,000 rpm. The incremental step was 5000 rpm for each subsequent test. The test time was approximately 5 min for each “measuring station” for a total of 7 h 23 m 36 s. The tests have been repeated 10 times. The same test procedure, described in the following paragraphs, was adopted for all specific tests.
5.1. “Kerosene” Experimental Campaign
As previously described, the data measured were:
For these tests, the bench was set up with manifold with the anemometer on the turbojet front.
The instruments used are described below:
- (1)
NiCr-CuNi thermocouple (IEC 60584-11) [−20 ÷ 800 °C], ±1.5 °C
- (2)
Anemometer for measuring the velocity of air in the intake collector [0 ÷ 30 m/s], accuracy ±3%
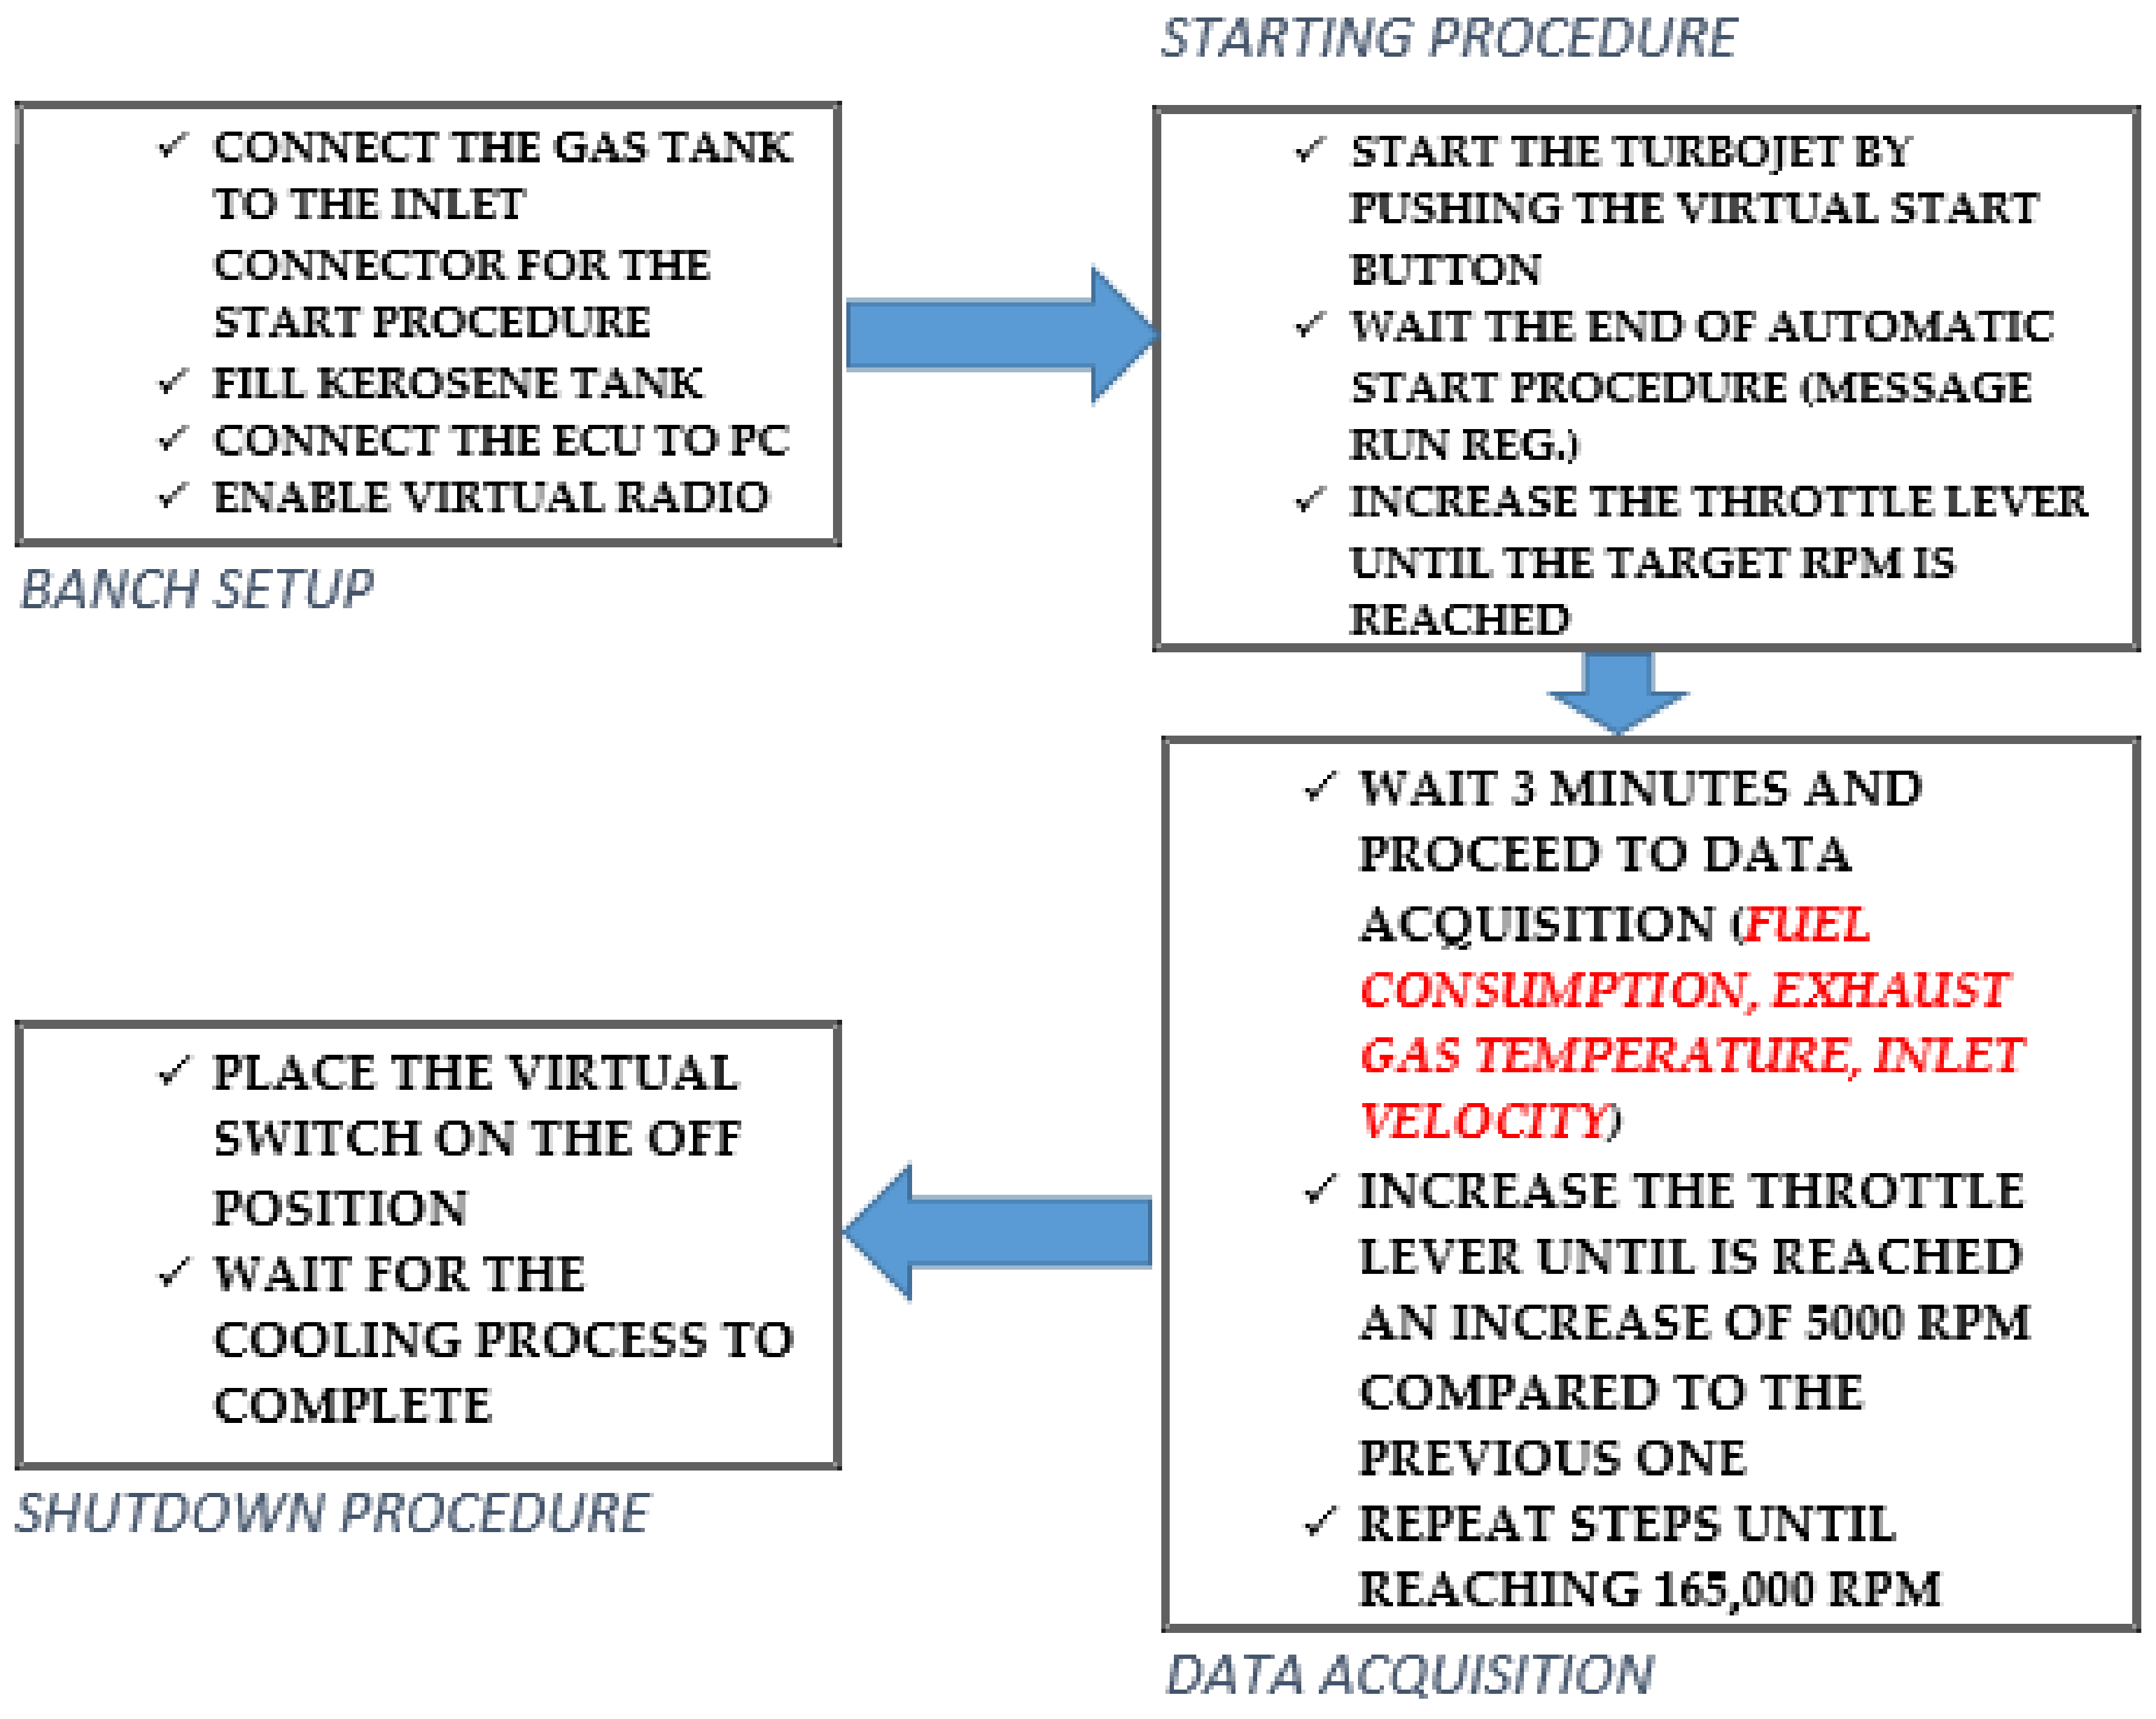
Test procedure is show in the
Figure 7, which summarizes, in a schematic way the actions performed to obtain the experimental data.
The waiting time of 3 min before acquiring the data ensures that the engine operates at constant speed, since no significant fluctuations (±1%) of the operating parameters have been recorded.
The experiment environmental conditions are:
The ambient temperature, albeit high, did not significantly affect the tests, from the feedback obtained on previous experimental campaigns, carried out at an ambient temperature of about 25 °C. This property of the turbojet is undoubtedly attributable to its destination for aeronautical use.
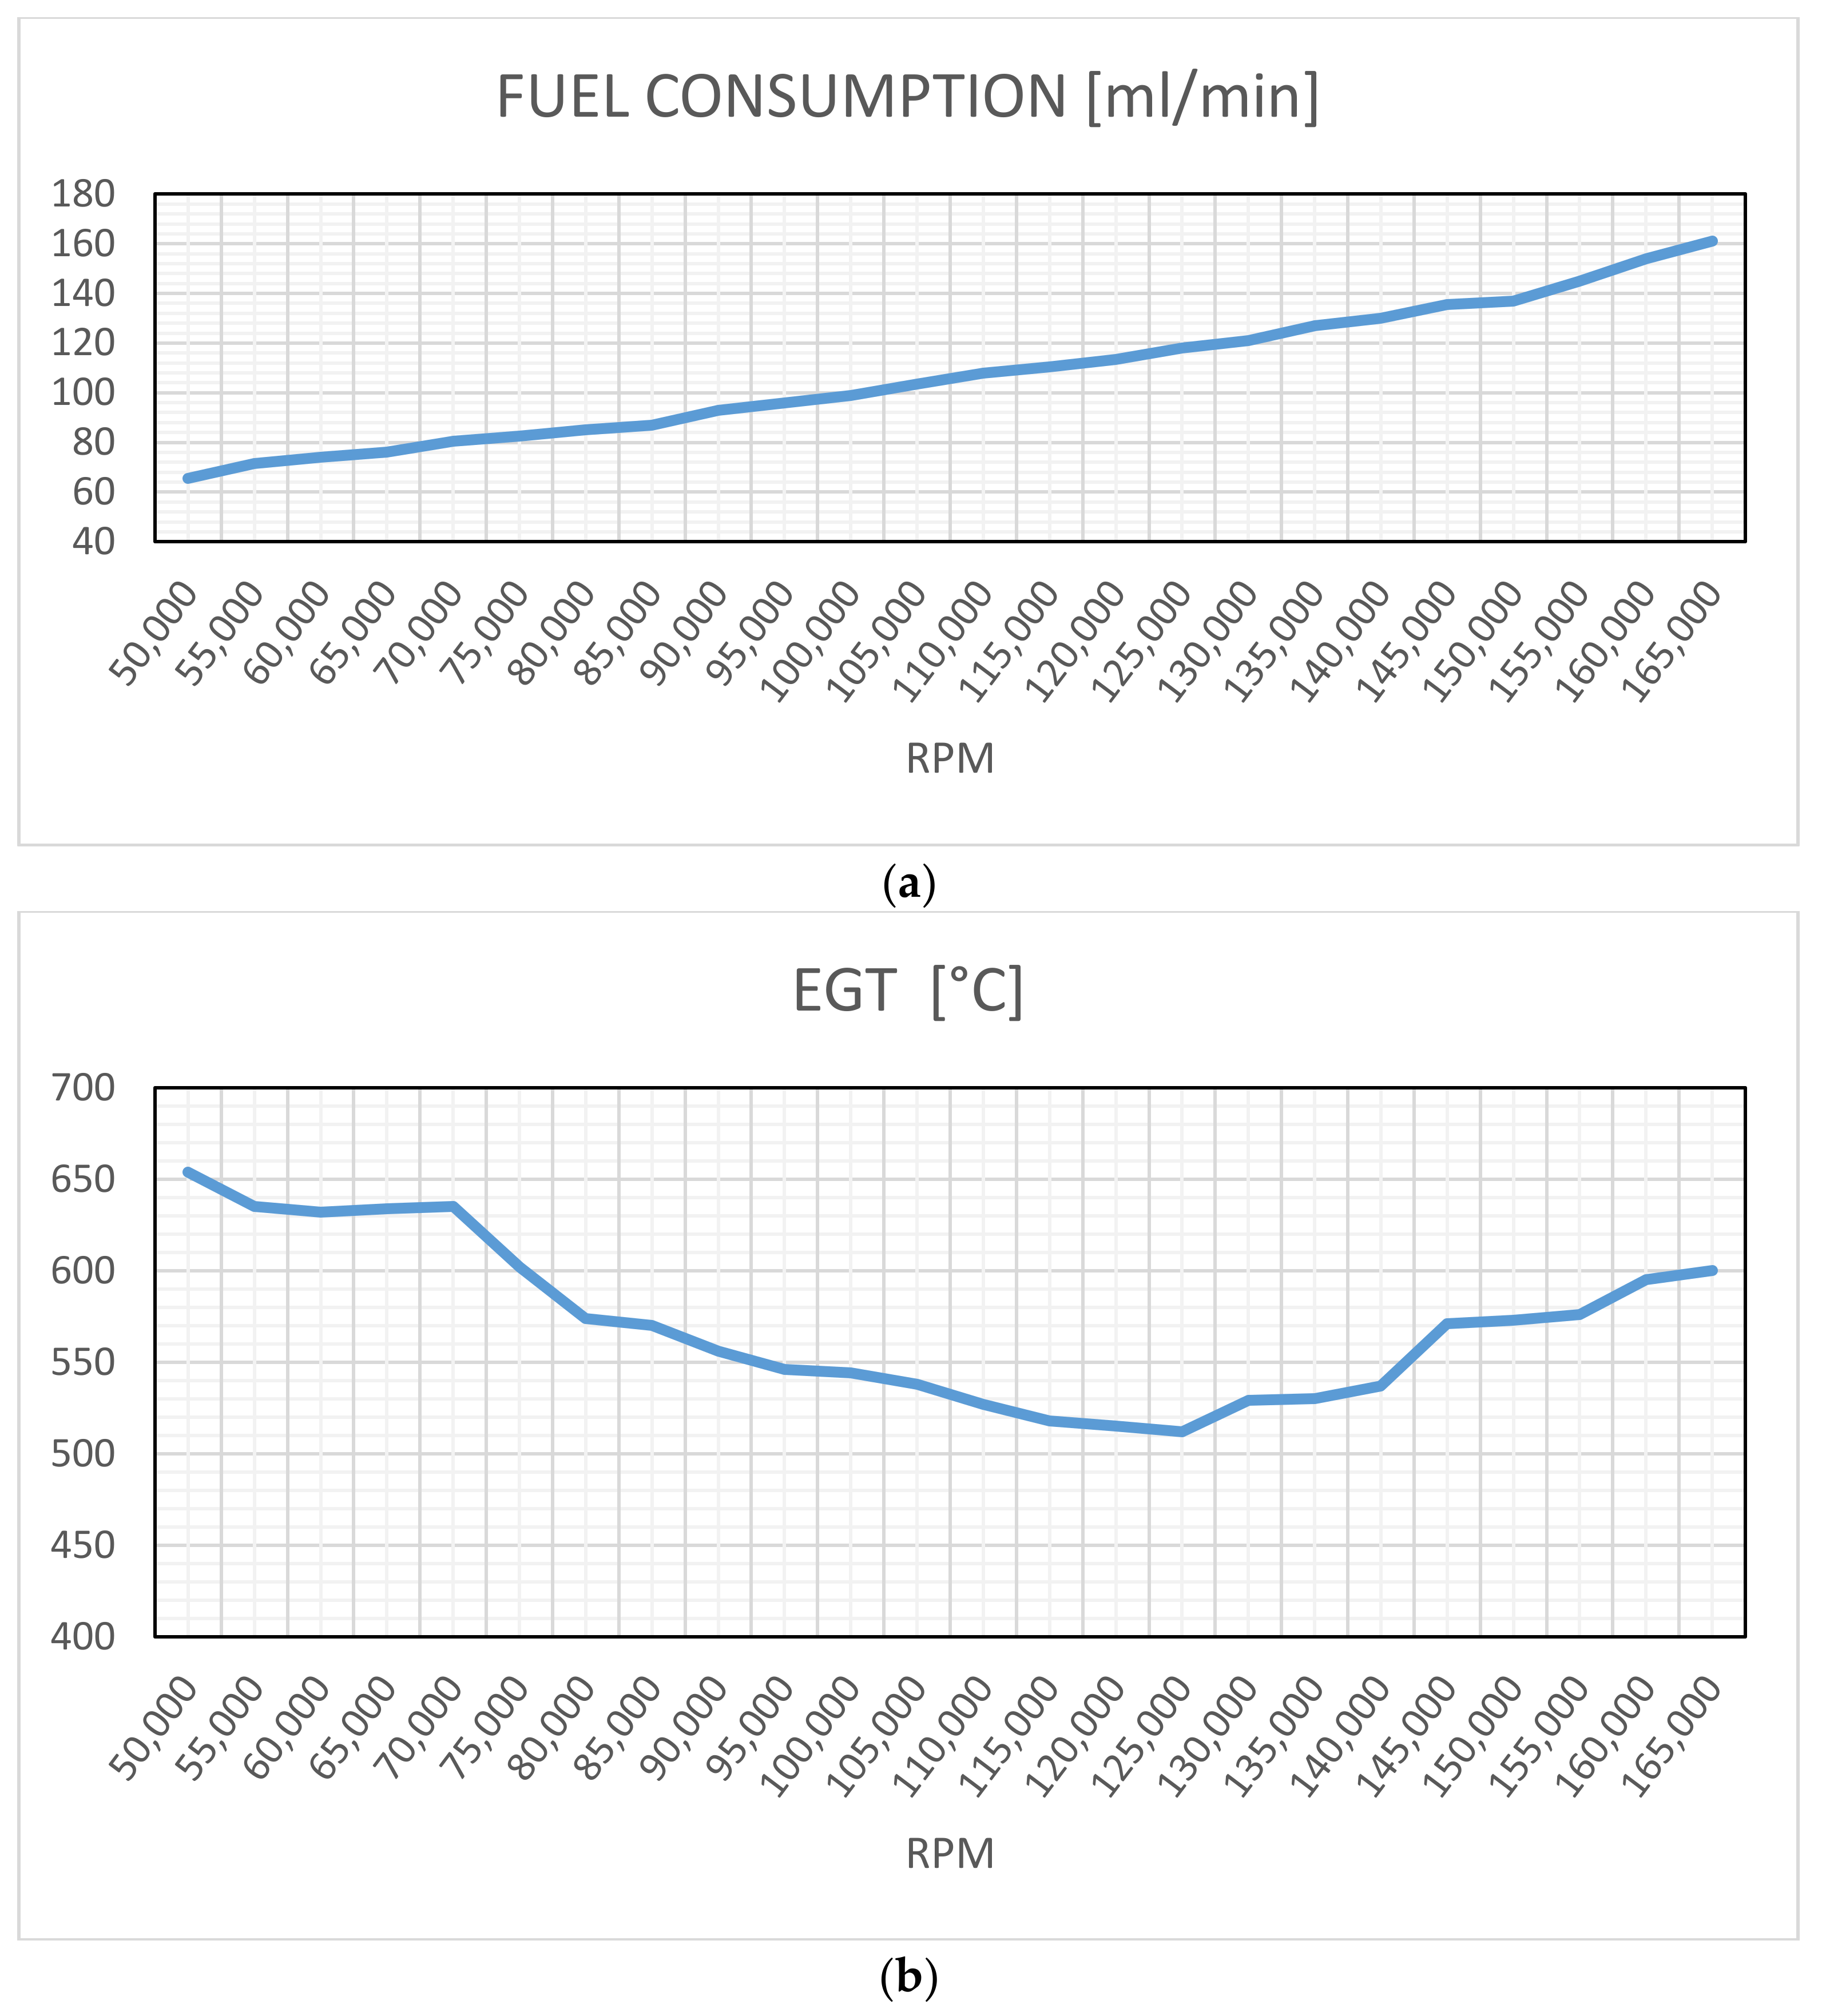
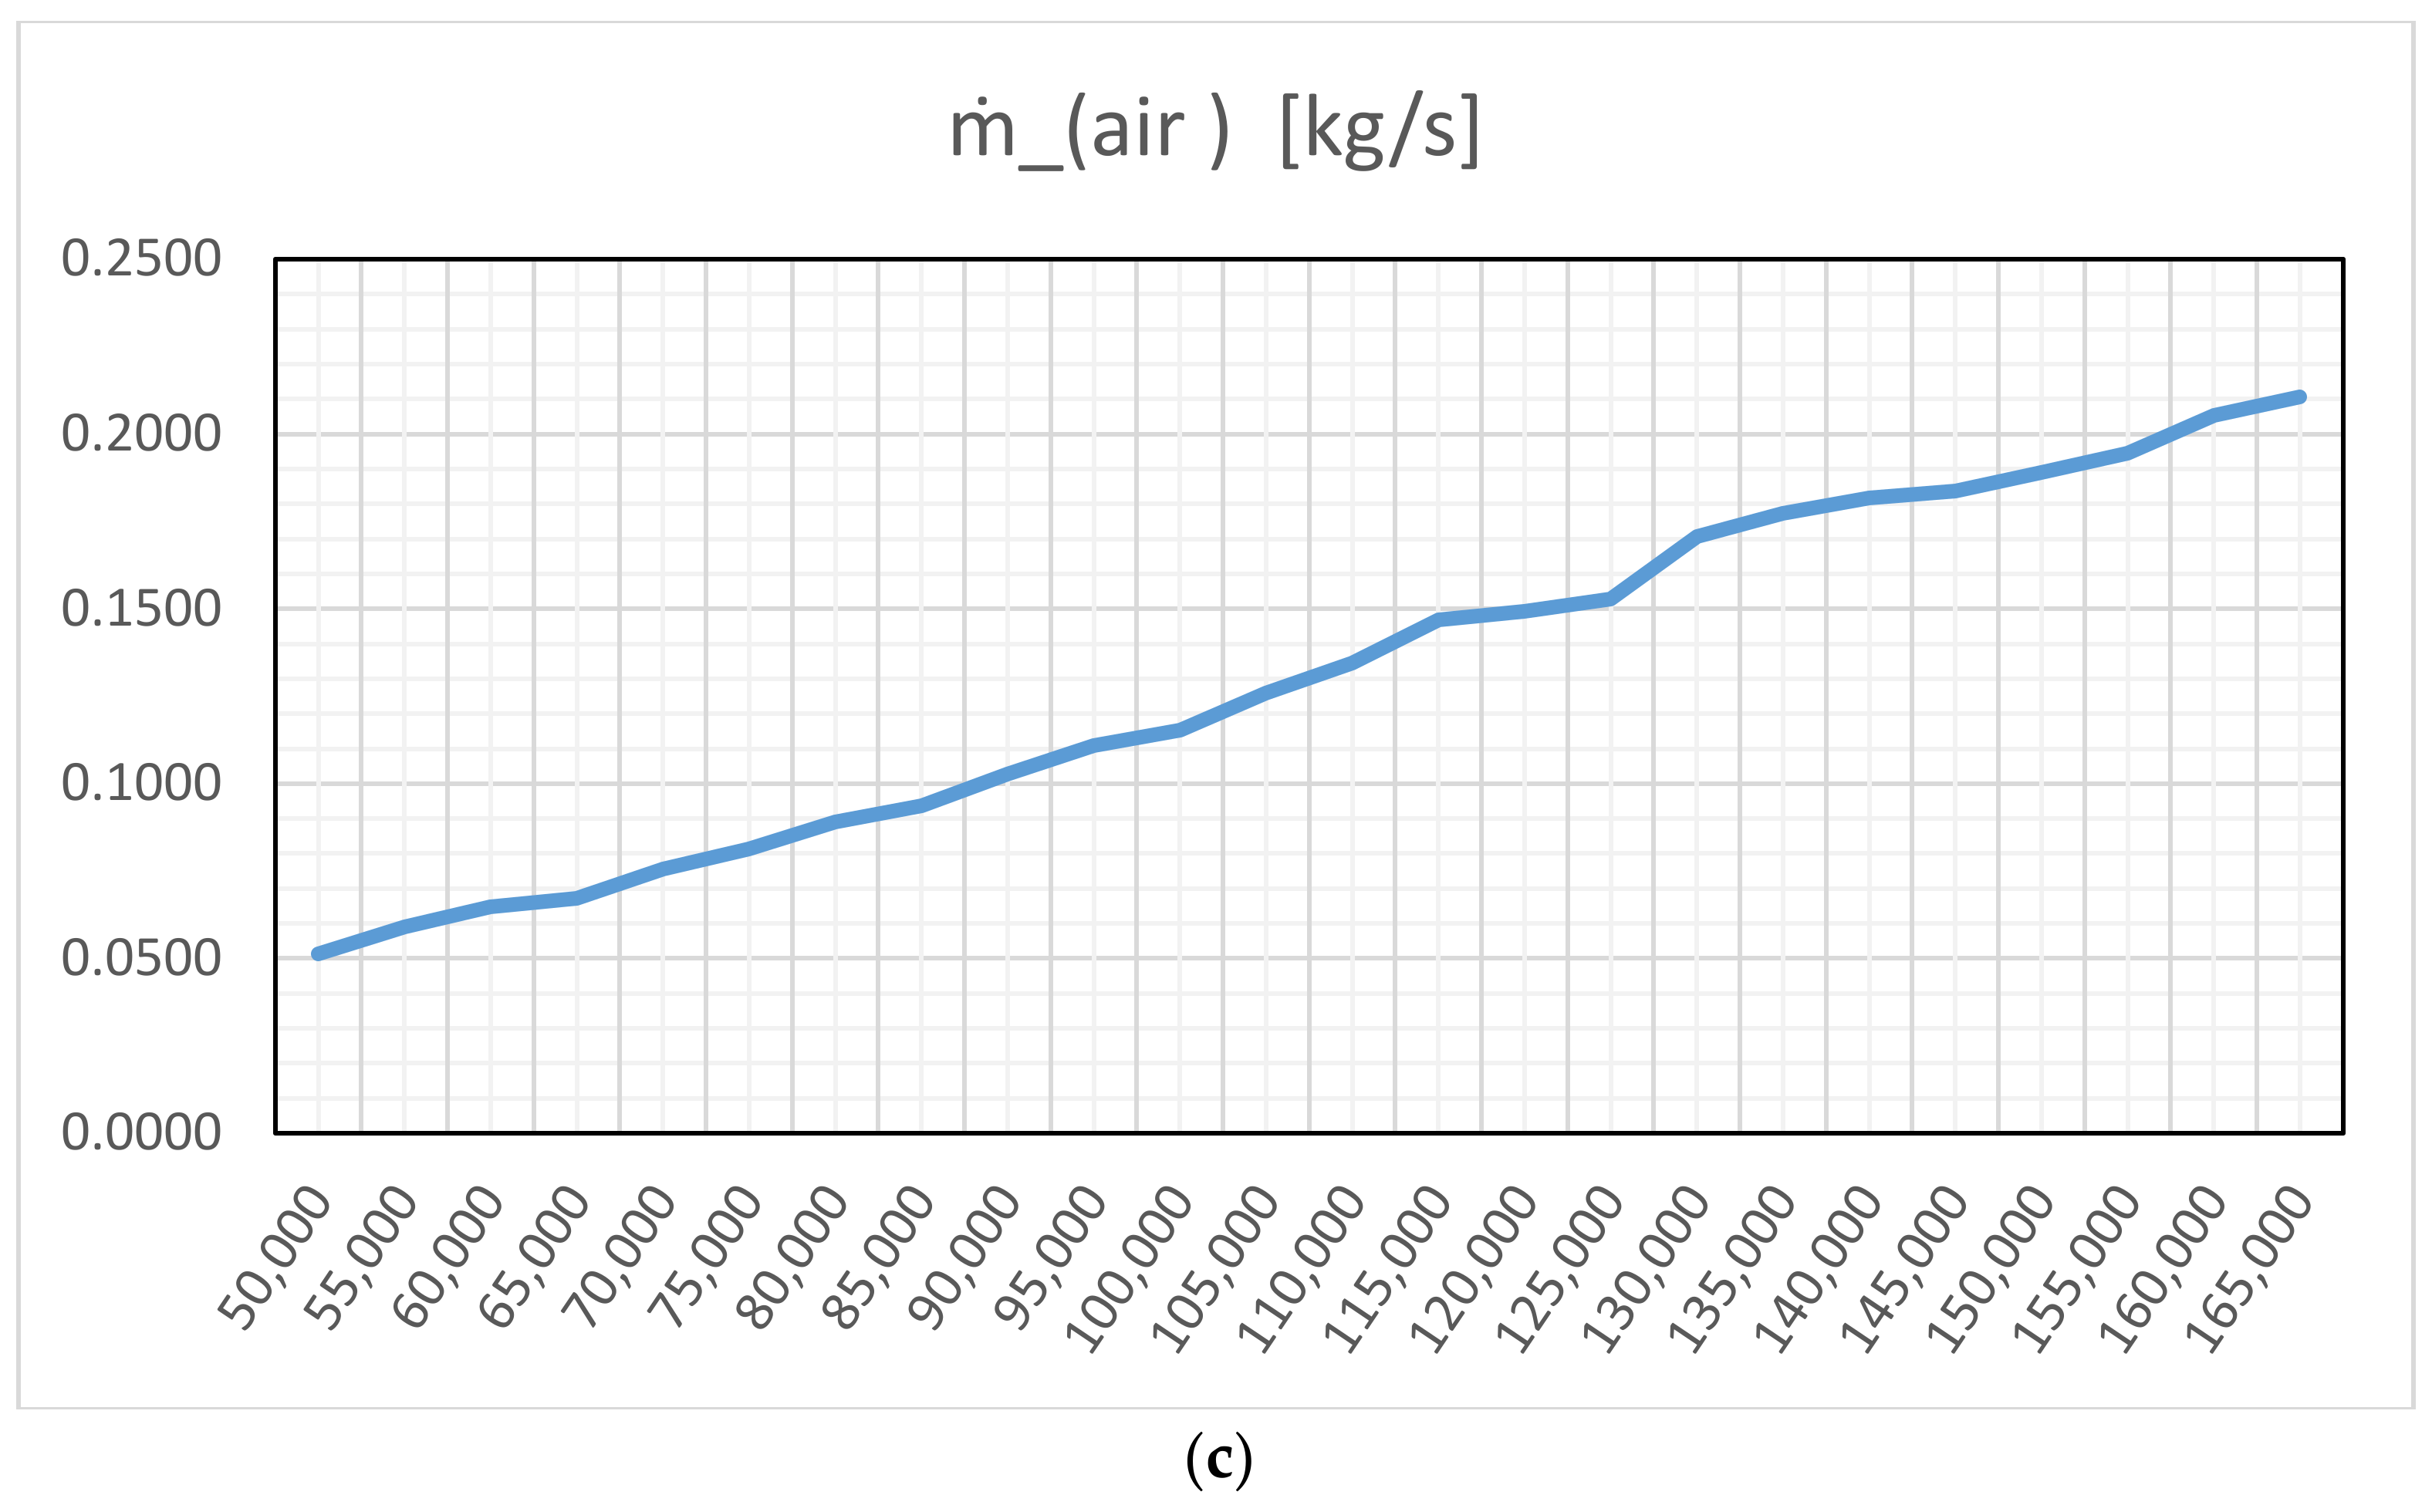
By analyzing fuel consumption, there is an increasing linear trend. The increase of turbine revolutions increases fuel consumption. In the maximum overall performance conditions (165,000 rpm) the fuel consumption value is 161 mL/min. By studying the trend of the inlet compressor mass flow rate, it can be notice that it is linear too, reaching the maximum value of 0.21 kg/s at 165,000 rpm.
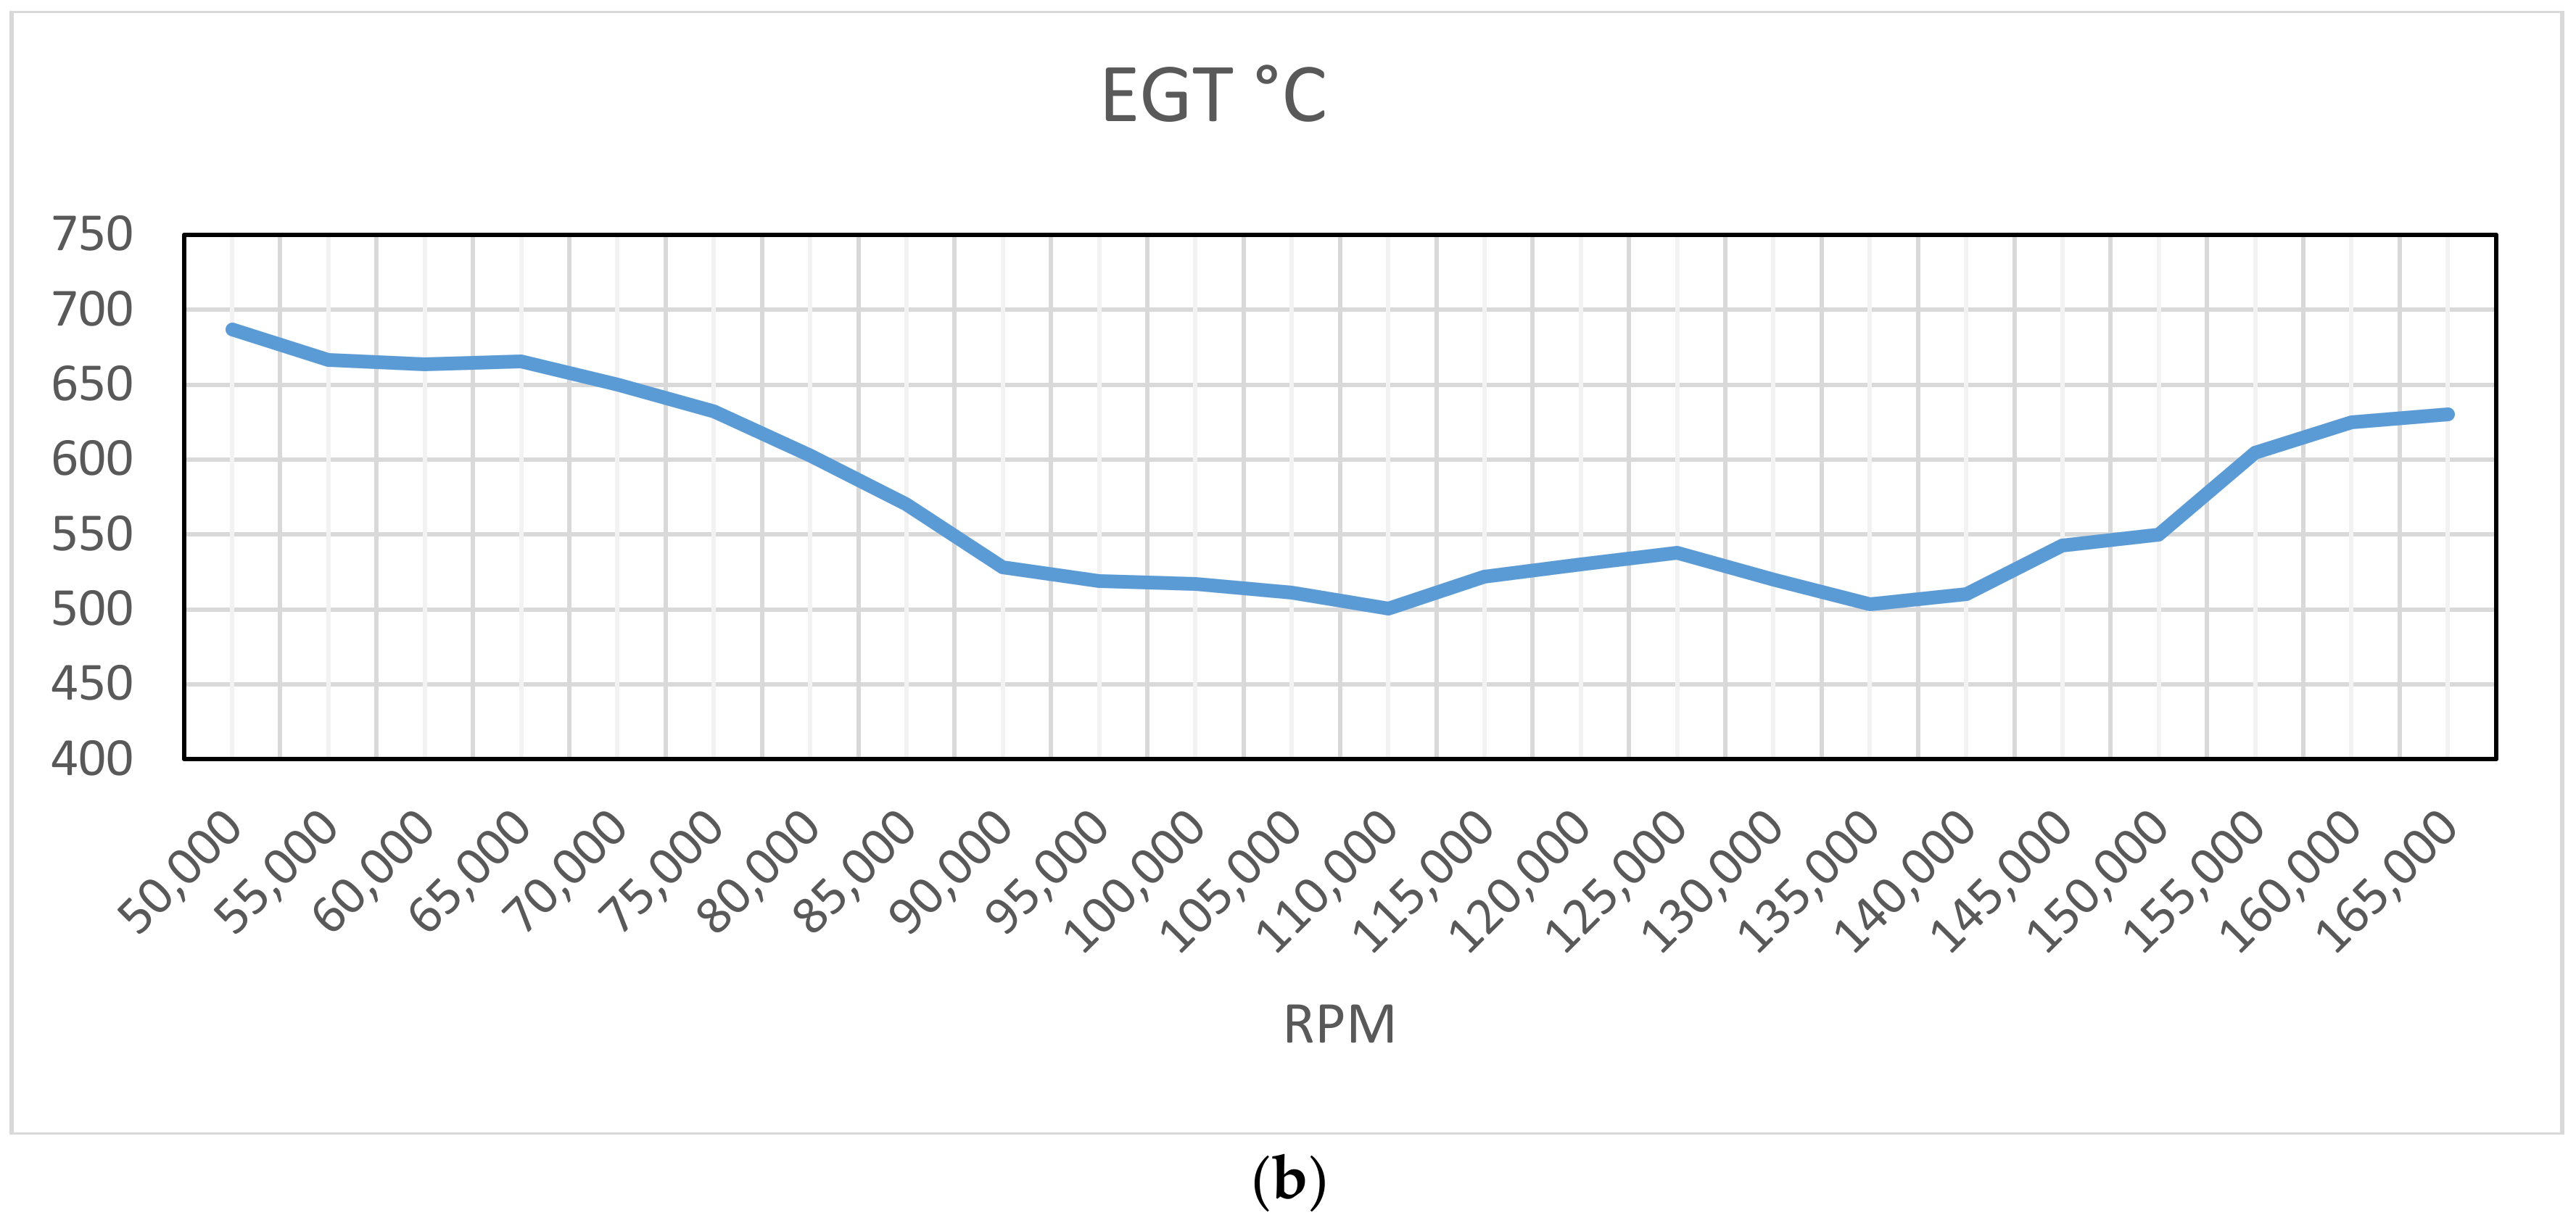
Finally, with regard to the exhausted gases temperature (EGT), it appears to have a variable trend. The trend of EGT is the result of the following conditions: during the ignition phase, the mixture introduced into the combustion chamber results to be in rich mixture conditions (more fuel). The amount of fuel in excess is necessary to establish and stabilize the combustion. This extra quantity (compared to the stoichiometric conditions) produces an initial increase in temperature. Once the combustions is stabilized and the self-sustaining speed has been reached (for this device 50,000 rpm), the control unit controls and reduces the entry of fuel, to bring it back almost to stoichiometric conditions. As a result, the temperature decreases (testified from the concave trend of EGT in diagram).
Finally, when the operator decides to increase the rotation speed, by acting on the controls (the throttle is adjusted on the software), there is a consequent increase of fuel in the combustion chamber, which produces a corresponding increase in temperature. This is the reason for the progress of the EGT that the software reports which is shown in the
Figure 8b.
5.2. Gas Experimental Campaign
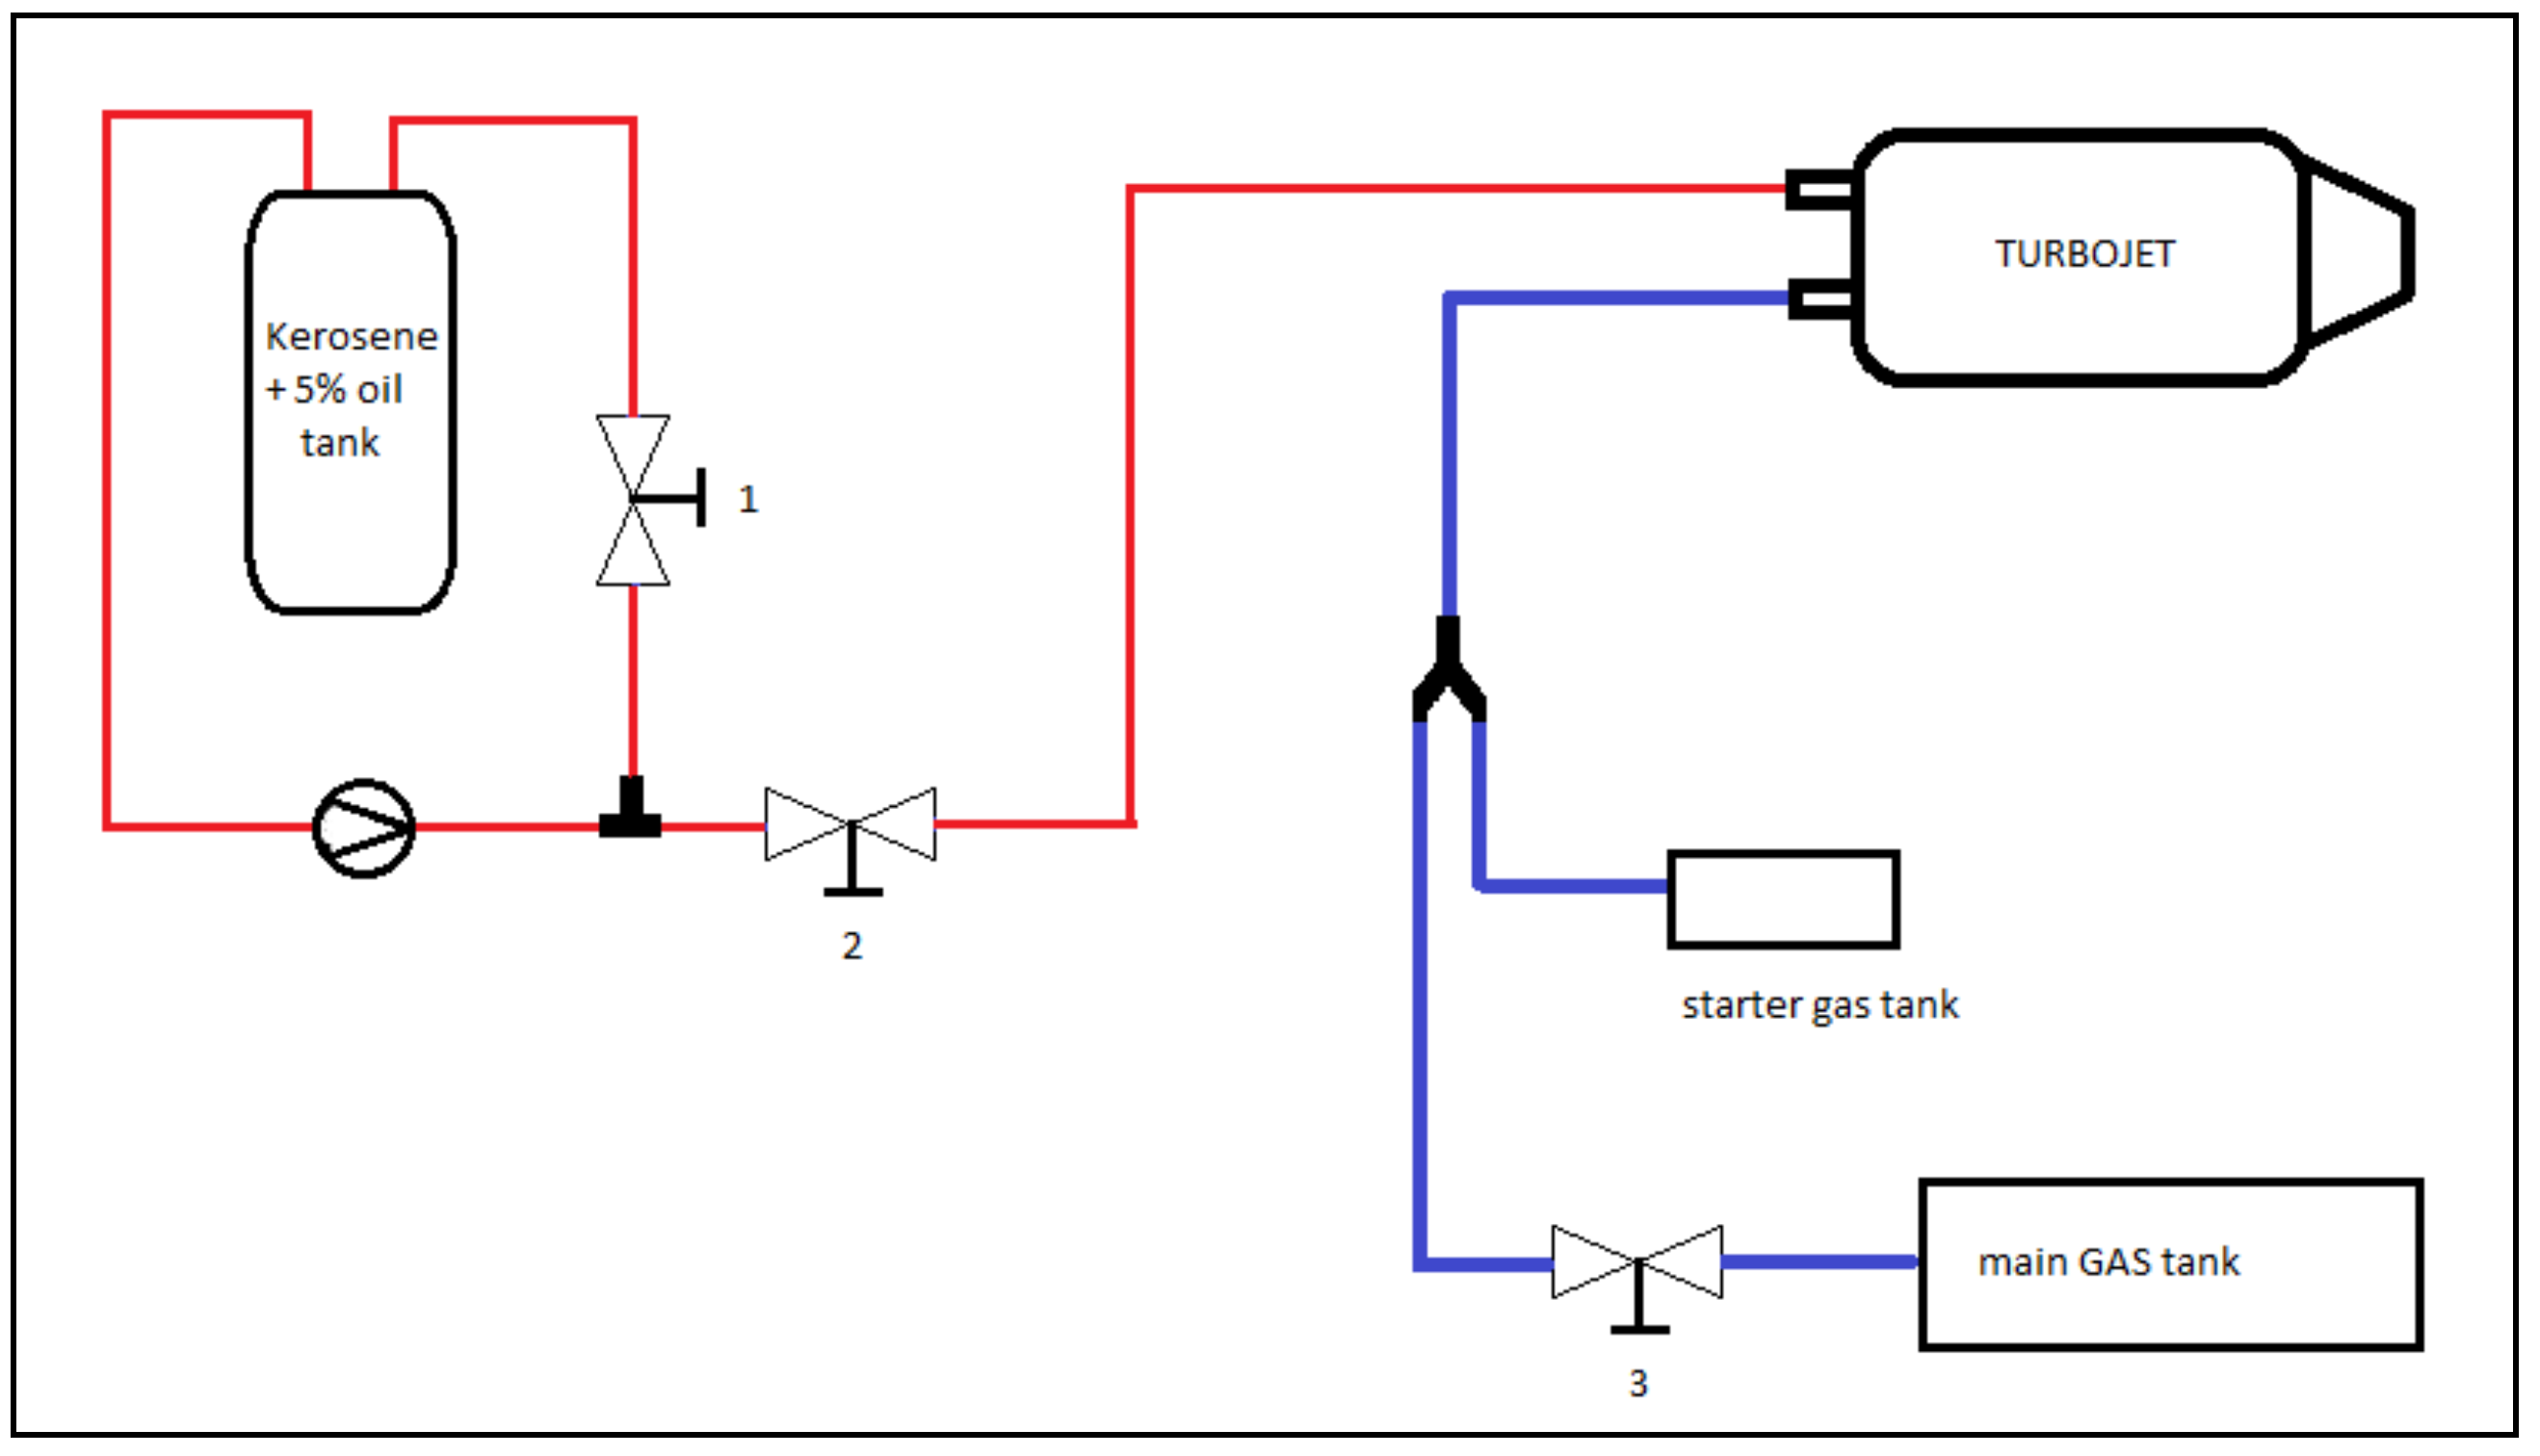
The second test campaign has been dictated by the need to check whether the device could only be powered by gas. For this goal, some changes were necessary. It is to be remembered that the gas circuit is used to start the engine. In order to achieve the constant use of gas as fuel, the following changes have been required:
- (1)
Modification of the electronics and layout of the system
- (2)
Any necessary adjustments
- (3)
Lubrication
Since the system was not designed for gas operation, it was necessary to remove the gas solenoid valve block. This valve is closed, once the boot procedure has finished. The ECU module was then reprogrammed, disabling the automatic closing of the solenoid valve. In addition, it was mounted an additional gas tank (6 L), necessary to withstand the combustion. The valve control has been manually obtained. The capacity valve shown in the figure has been used. By acting on it, the gas flow rate can be increased or decreased, in the combustion chamber, and thus, the rotational speed of the turbine. The problem of lubrication has been solved, for the studied prototype, using a bypass system. The system allows to alternatively operate with kerosene (+5% oil) and gas.
The procedure is as follows: by manually acting on the valves, it is possible to operate the gas turbine, for the necessary time, to obtain experimental data of interest. Then, by switching the valve and using kerosene as fuel, it was possible to lubricate the entire device. Iterating this procedure, operational maps have been obtained, compatible with those obtained using kerosene as fuel. An additional benefit that has been achieved: by acting in this way, the bearings have not been damaged. Two ball valves (marked with 1 and 2 in the figure) have been used for this system. The assembled system is shown in
Figure 9.
To perform gas tests, it was necessary change the bench configuration, because the turbojet is not predisposed to operation with only gas, for the following changes have been used:
2 × 4 mm ball valve for manage the flow of kerosene +5% oil to ensure lubrication
1 × 4 mm gas flow calibrated regulator, coupled with a mass flowmeter (±0.8% of reading value, default response time of 10 ms) to control the acceleration and fuel consumption
1 × 4 mm Y connector
1 × 4 mm T connector
The ECU has been reprogrammed, using the software LCU Pro, to disable valve safety locks. The test procedure is as follows:
- (1)
Connect the gas tank to the inlet connector for the start procedure
- (2)
Fill kerosene tank
- (3)
Connect the main gas tank
- (4)
Connect the ECU to PC
- (5)
Enable virtual radio control
- (6)
Start the turbojet by pushing the virtual start button
- (7)
Valve 2 is CLOSE and Valve1 is OPEN, act on Valve 3 until it reaches RPM target value
- (8)
Note the gas consumption after 3 min of operation at fixed RPM
- (9)
Close Valve 3, open Valve 2 and close Valve1, to let kerosene flow into the turbojet, lubricating the bearings for 3 min
- (10)
Repeat (7), (8) and (9) for each 5000 rpm step.
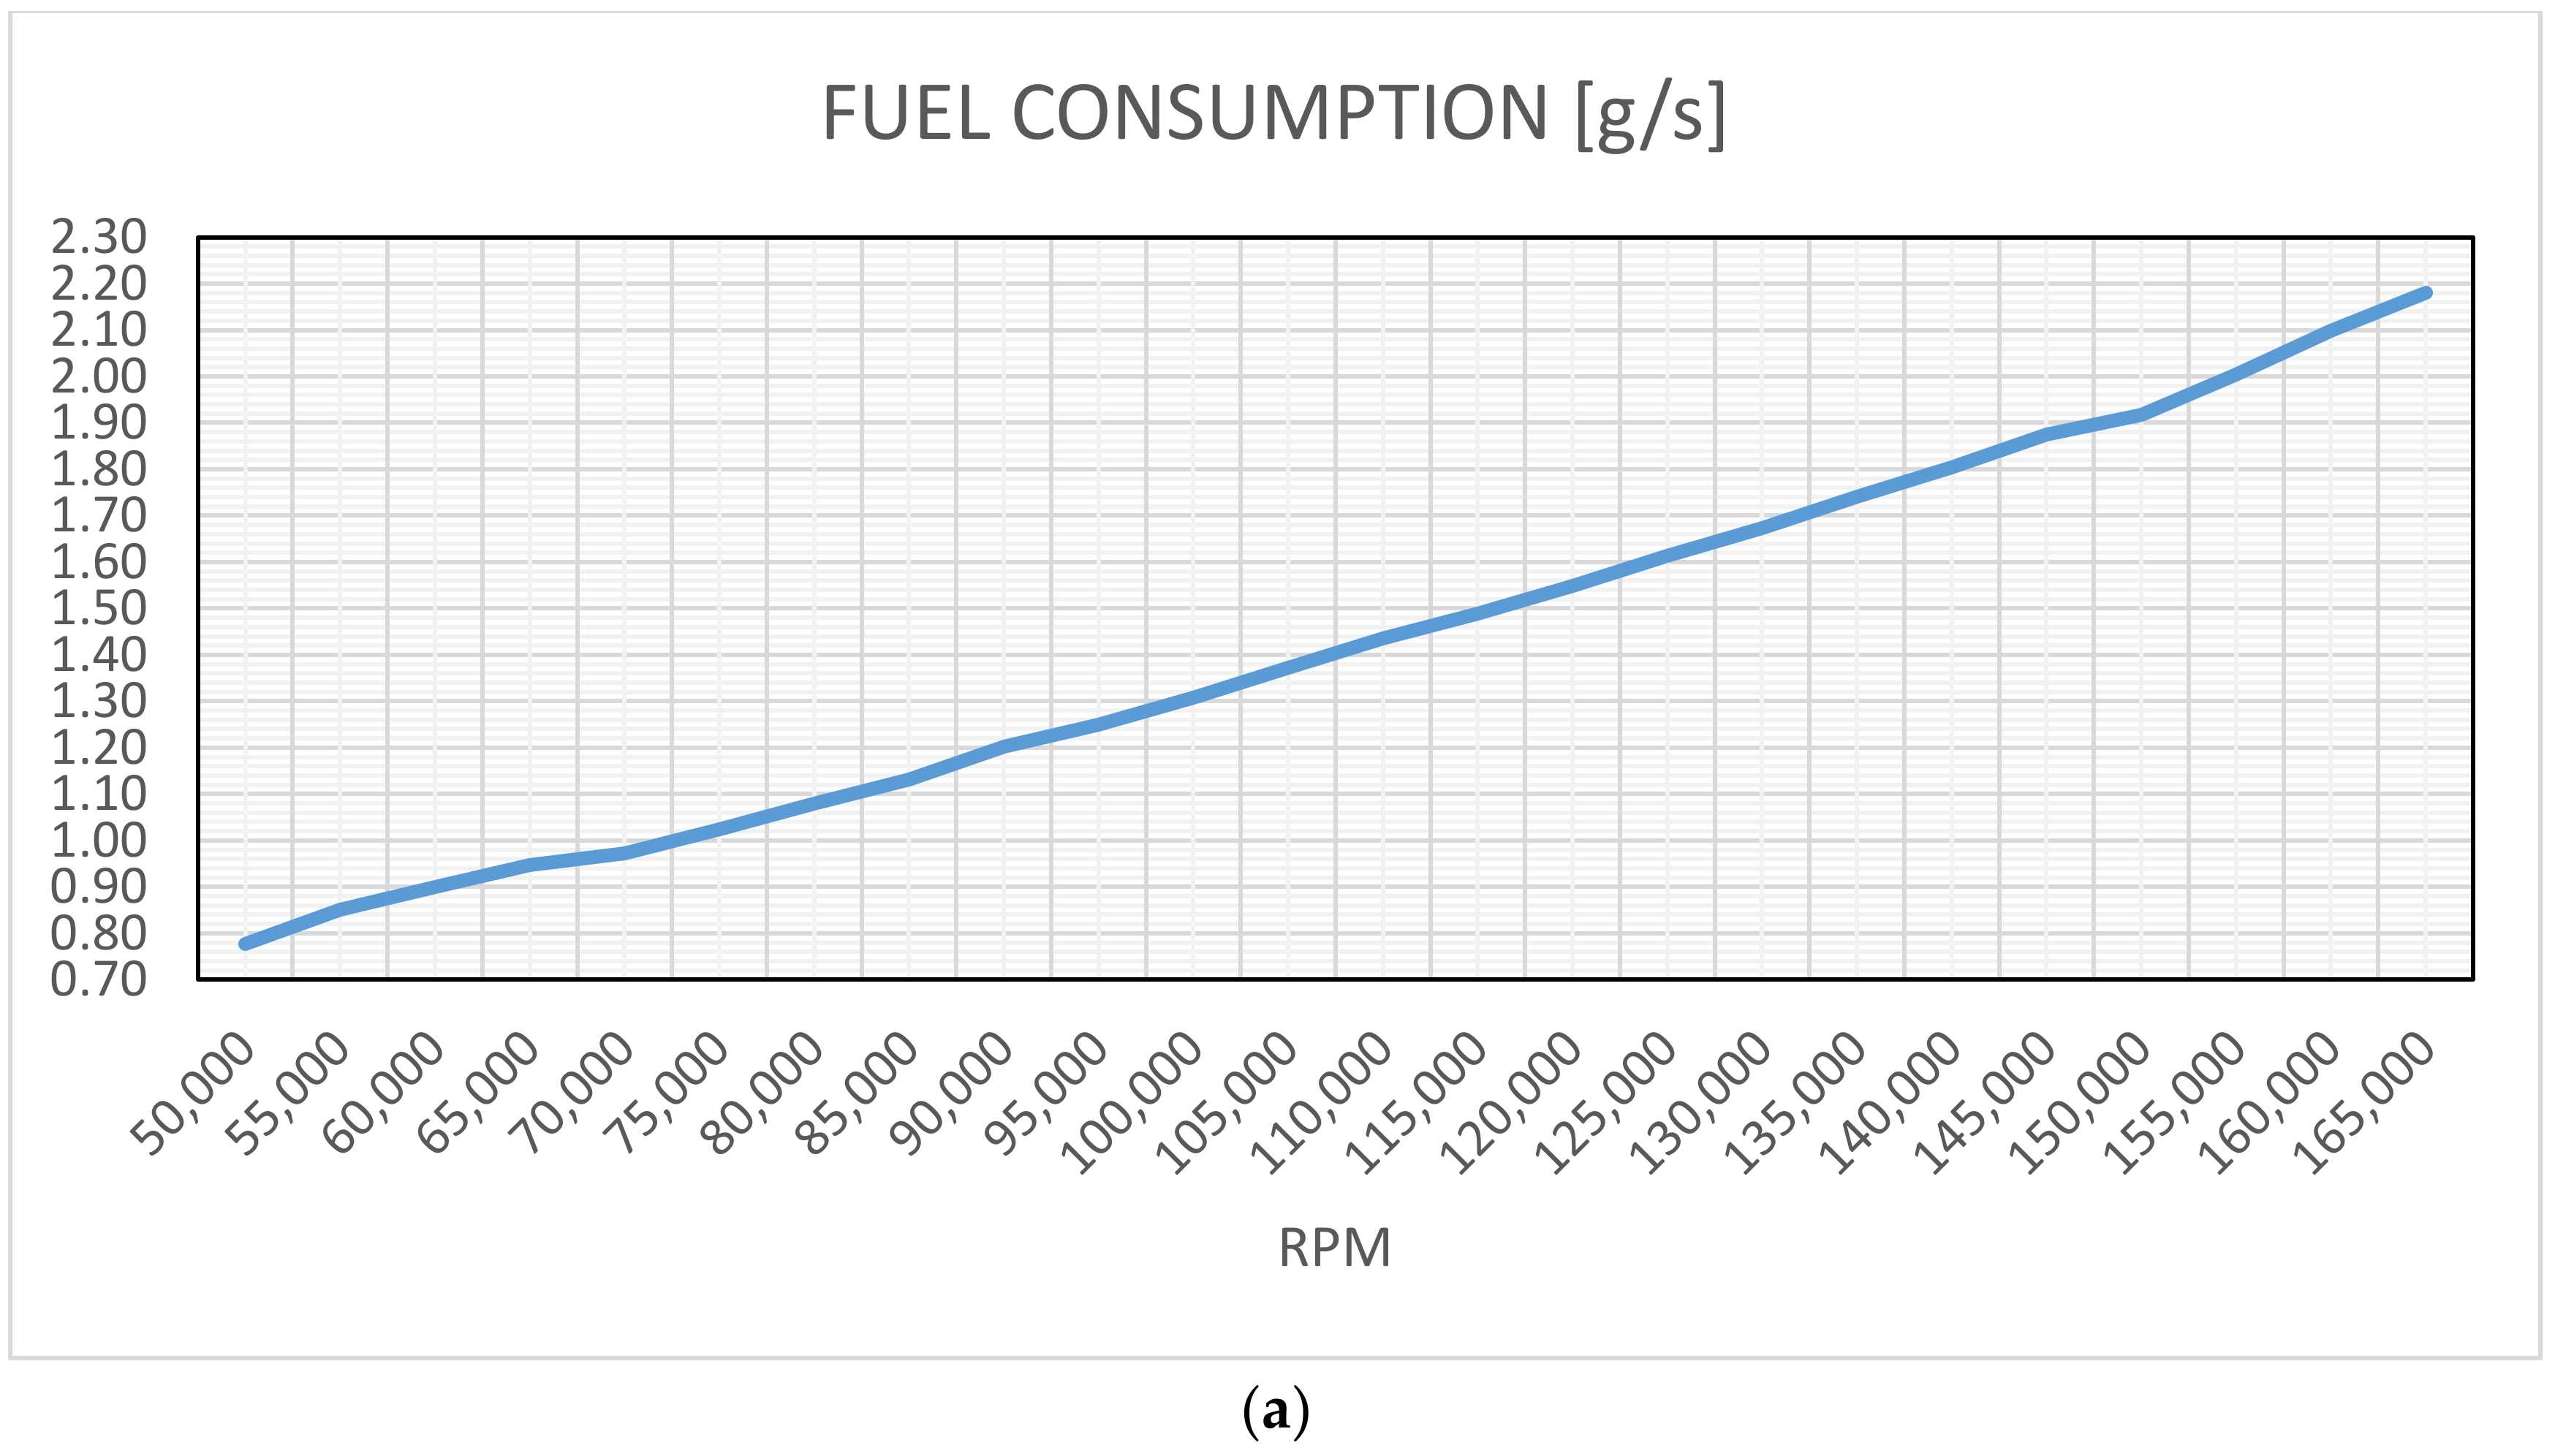
Given that the compressor air flow is the same as for kerosene operation, being the same compressor, the fuel consumption (the target of the research) has been reported (
Figure 10), with the EGT trend. Also in this case, for each step of 5000 rpm within 50,000–16,5000 rpm range. It appears to have an average linear ascending trend, from the minimum value of 0.78 g/s to 50,000 rpm up to a maximum of 2.18 g/s at 165,000 rpm.
6. Data Analysis and Thermodynamic Considerations
To completely understand the device operational design values (and to connect the results to a well-specific machine), a reverse design was carried out, comparing it with experimental data previously performed on similar devices [
18,
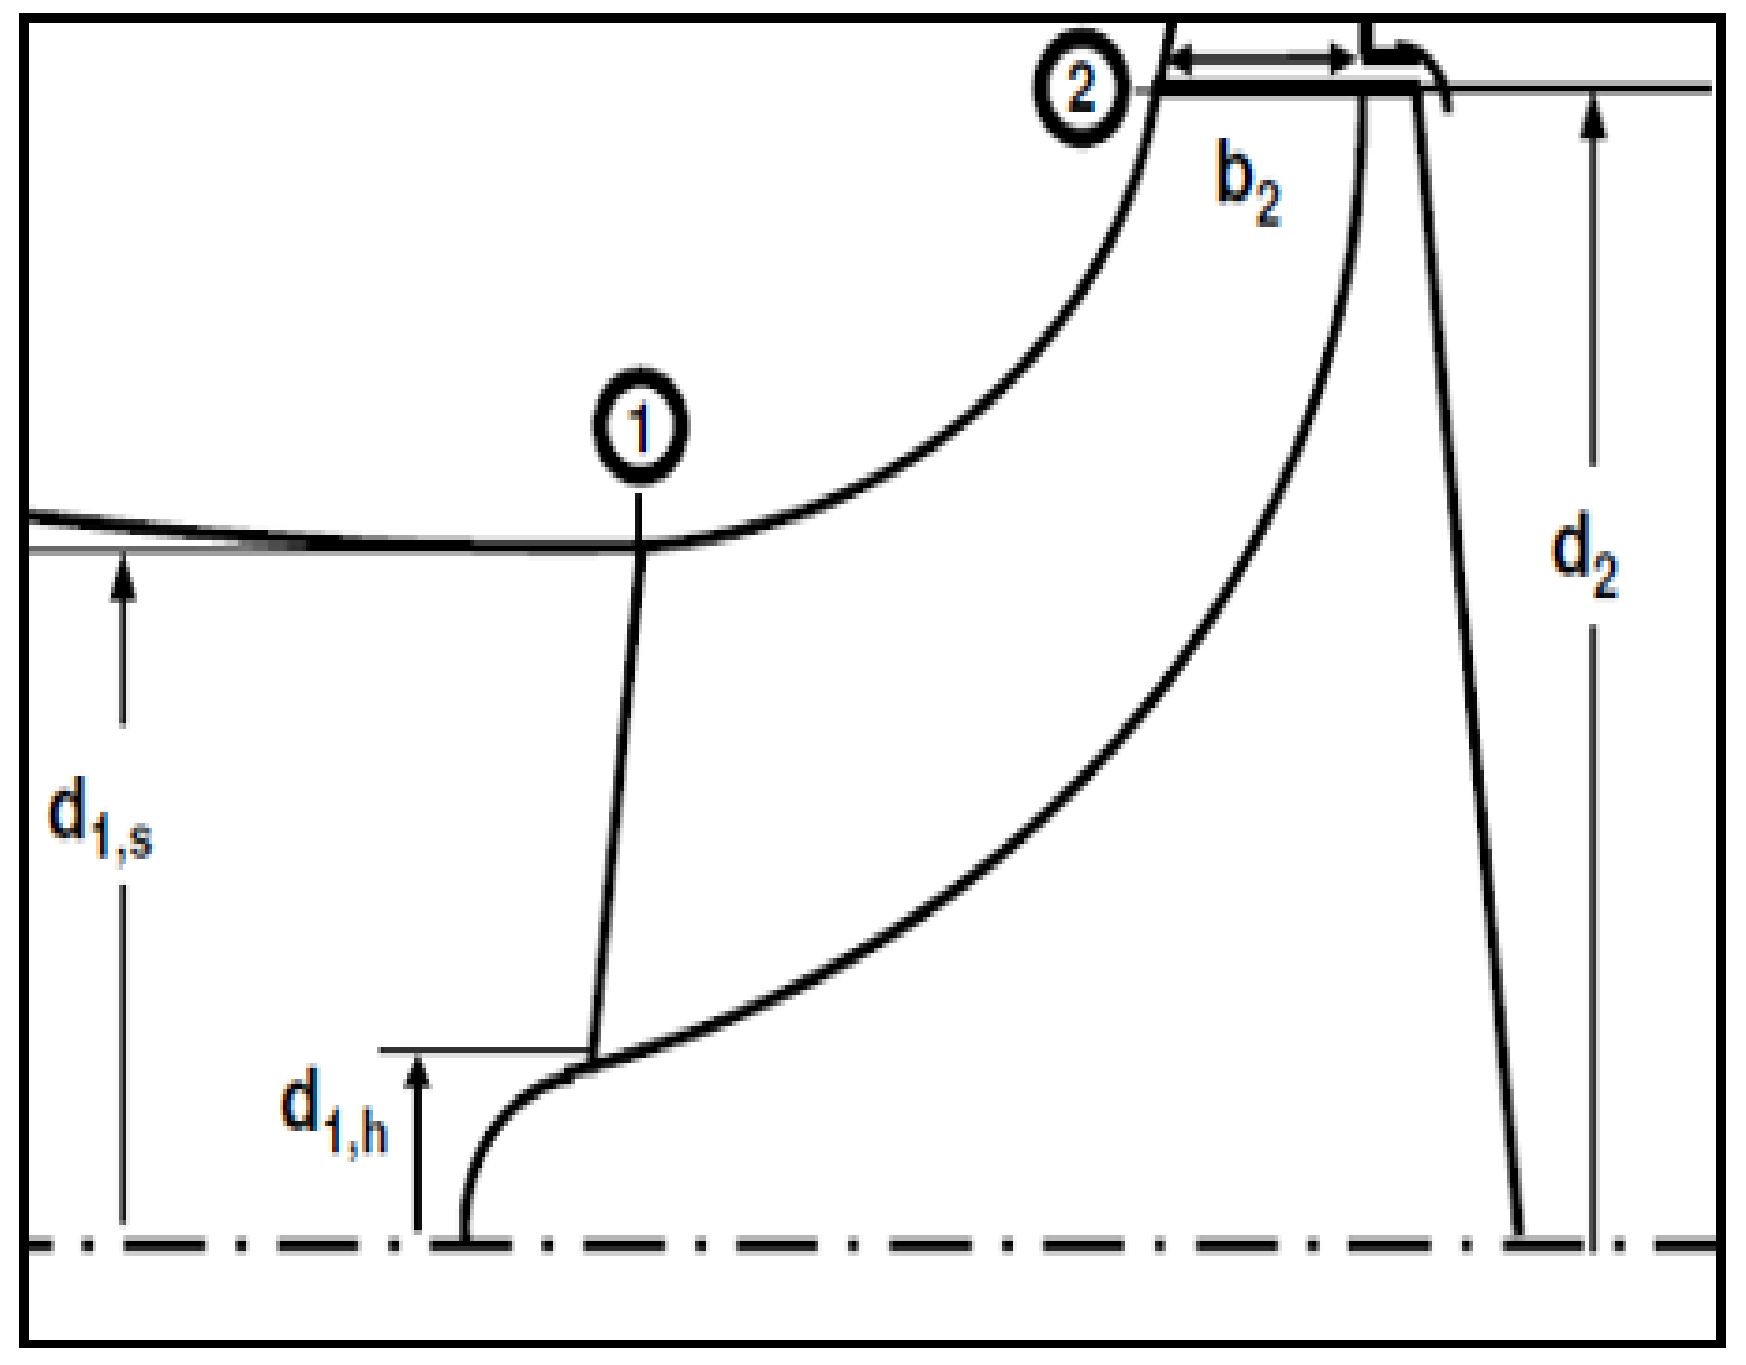
19] and with the data collected in this series of tests. The intent is to know all basic parameters and compare them with the experimental ones. Furthermore, the possibility of operating the device as an electrical generator has also been studied. The design procedure was as follows. Starting from the compressor analysis, the geometric parameters are shown in
Table 2 and
Figure 11.
With the available data, velocity triangles have been calculated for
Section 1 and
Section 2. For the inlet section:
and assuming
V1 =
V1,m:
Once
V1 and
U1 are known, the relative velocity
W1 is:
Assuming
V1 =
V1m =
V2m the flow coefficient and load coefficient are:
so, the velocity
V2 and
W2 are:
Note the velocity triangles, the rotor work (
L) has been calculated as:
and, in first approximation, knowing the
, the total compressor work
was calculated and used to find the compression ratio:
where the polytopical efficiency was calculated with: a modified Stodola formula [
15]. Finally the outlet compression temperature and pressure (
T3 and
p3) have been calculated:
Regarding the turbine, note the EGT has been calculated the starting expansion temperature (T
4) and the heat released by the combustion (Q):
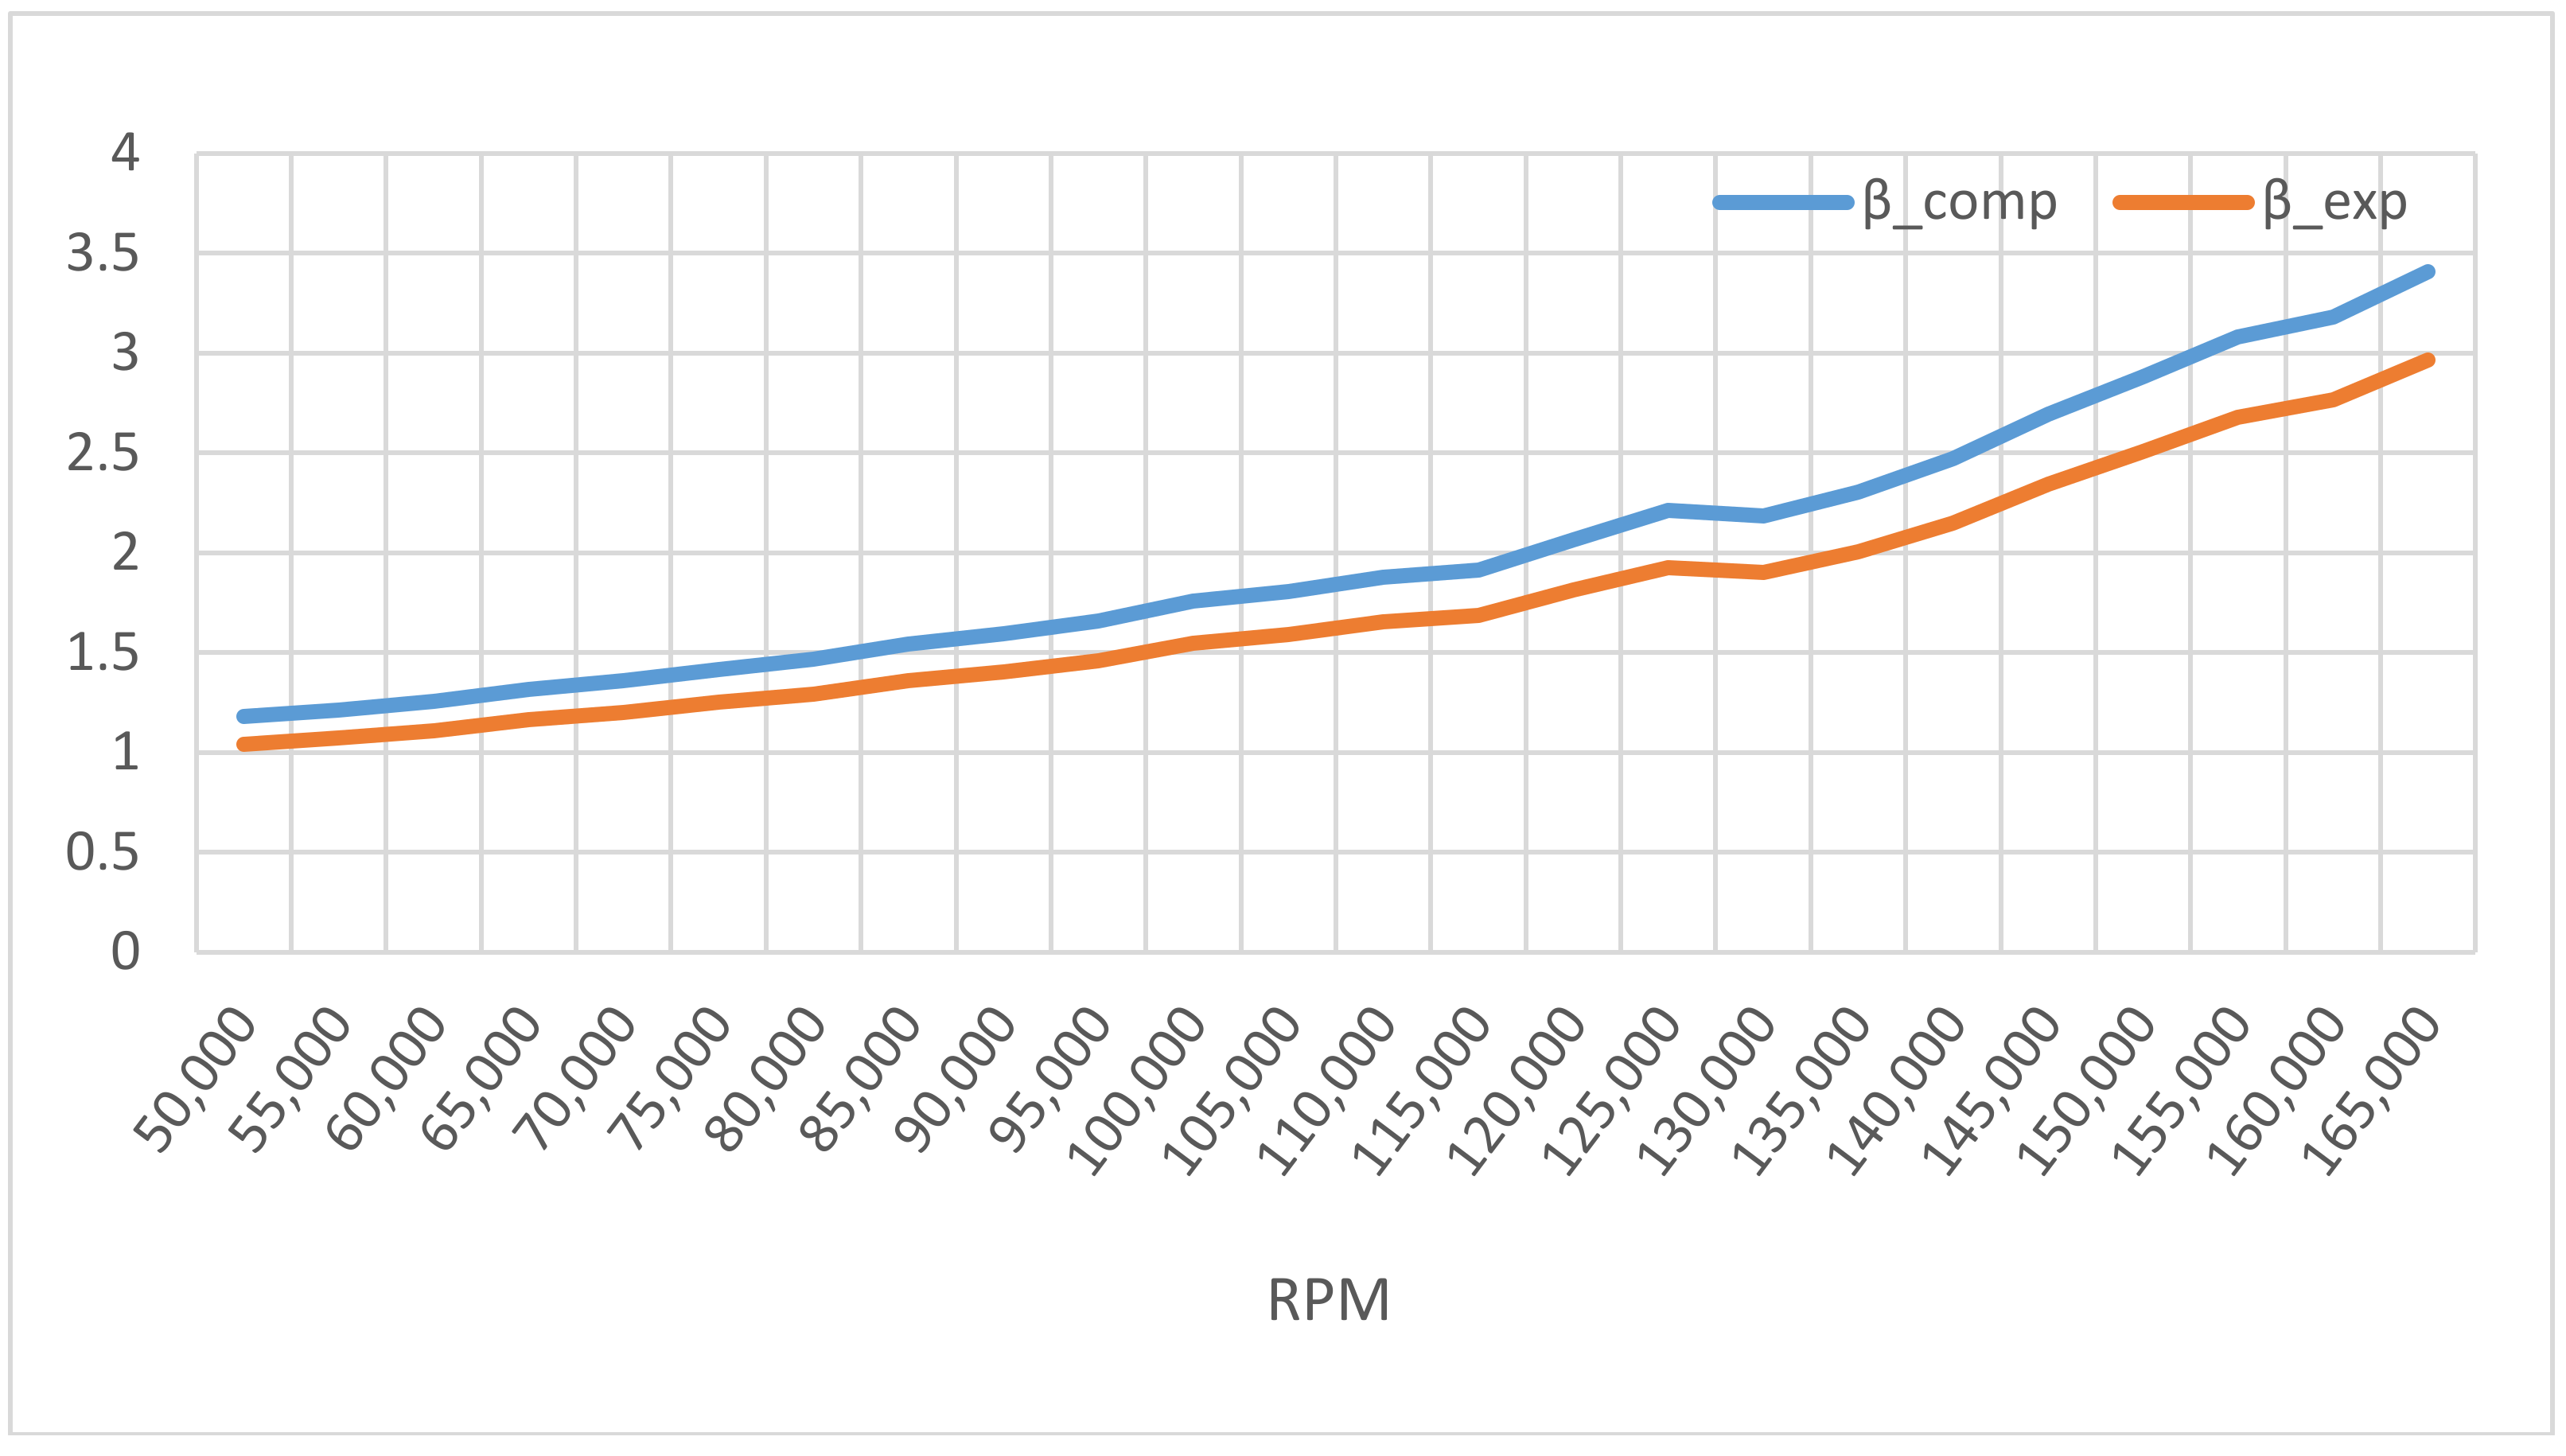
For the calculation of the β
exp it is preferred not to structurally change the turbojet architecture, therefore, no pressure gauges have been inserted into the combustion chamber. Instead, this has been done by estimating the load losses in the combustion chamber in “cold” configuration and then extending the data throughout the operating field, assuming an overall error of 4.7% [
20,
21]. This choice is preferred to safeguard the structural integrity of the turbojet, while still obtaining data suitable for calculating the net work (
Figure 12).
This has allowed us to find a , so the values of βexp and the p4.
It was, then, possible to calculate the work of turbine (
Lturb) as:
and finally the net work (
Lnet), net power and global efficiency have been calculated:
The global efficiency is little bit lower than 10%. This is a reasonable value for such a device.
7. Results Comparison
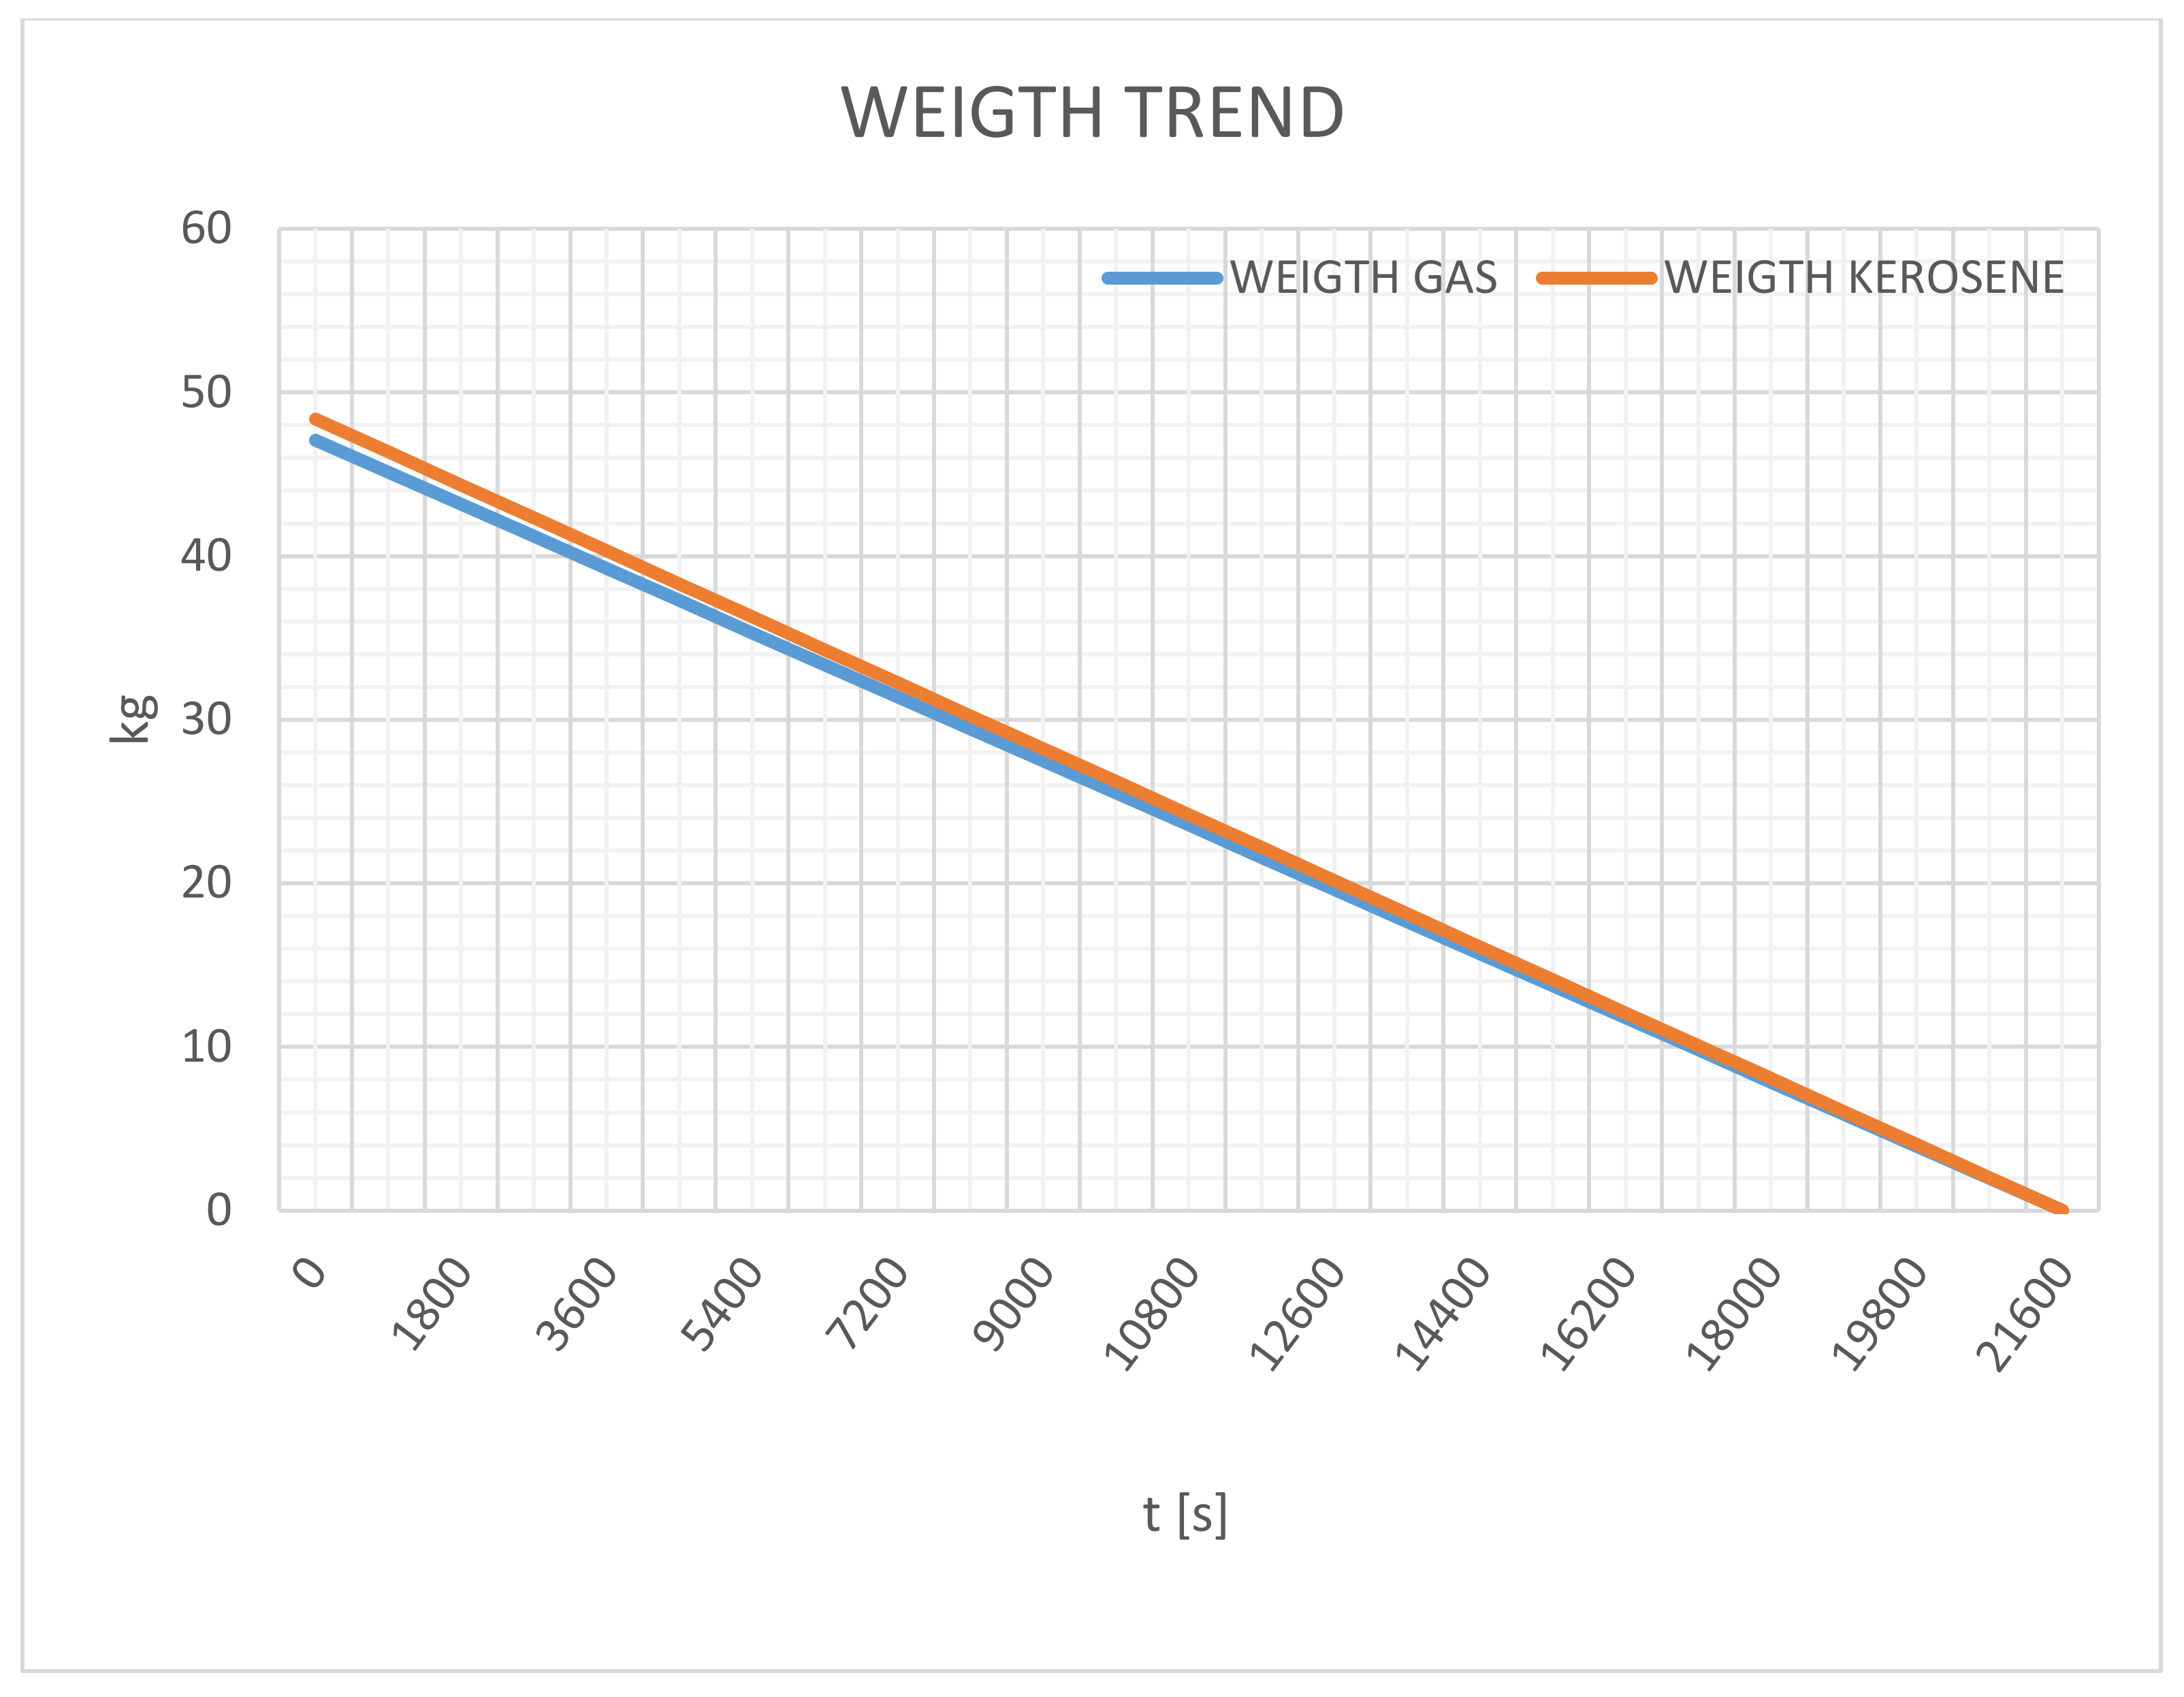
From the obtained experimental data it can be noticed that modification of the turbojet for gas operation can be advantageous. In fact, for applications where the weight is relevant and it is a constraint, such as a propulsion system for flying objects, gas fuel supply can be convenient. To expose this concept, an extra six-hour operation at 165,000 rpm has been suggested and the fuel weight trend was analyzed. With reference to the following
Table 3 and
Figure 13, it possible to confirm the positive aspect of the inserted modification.
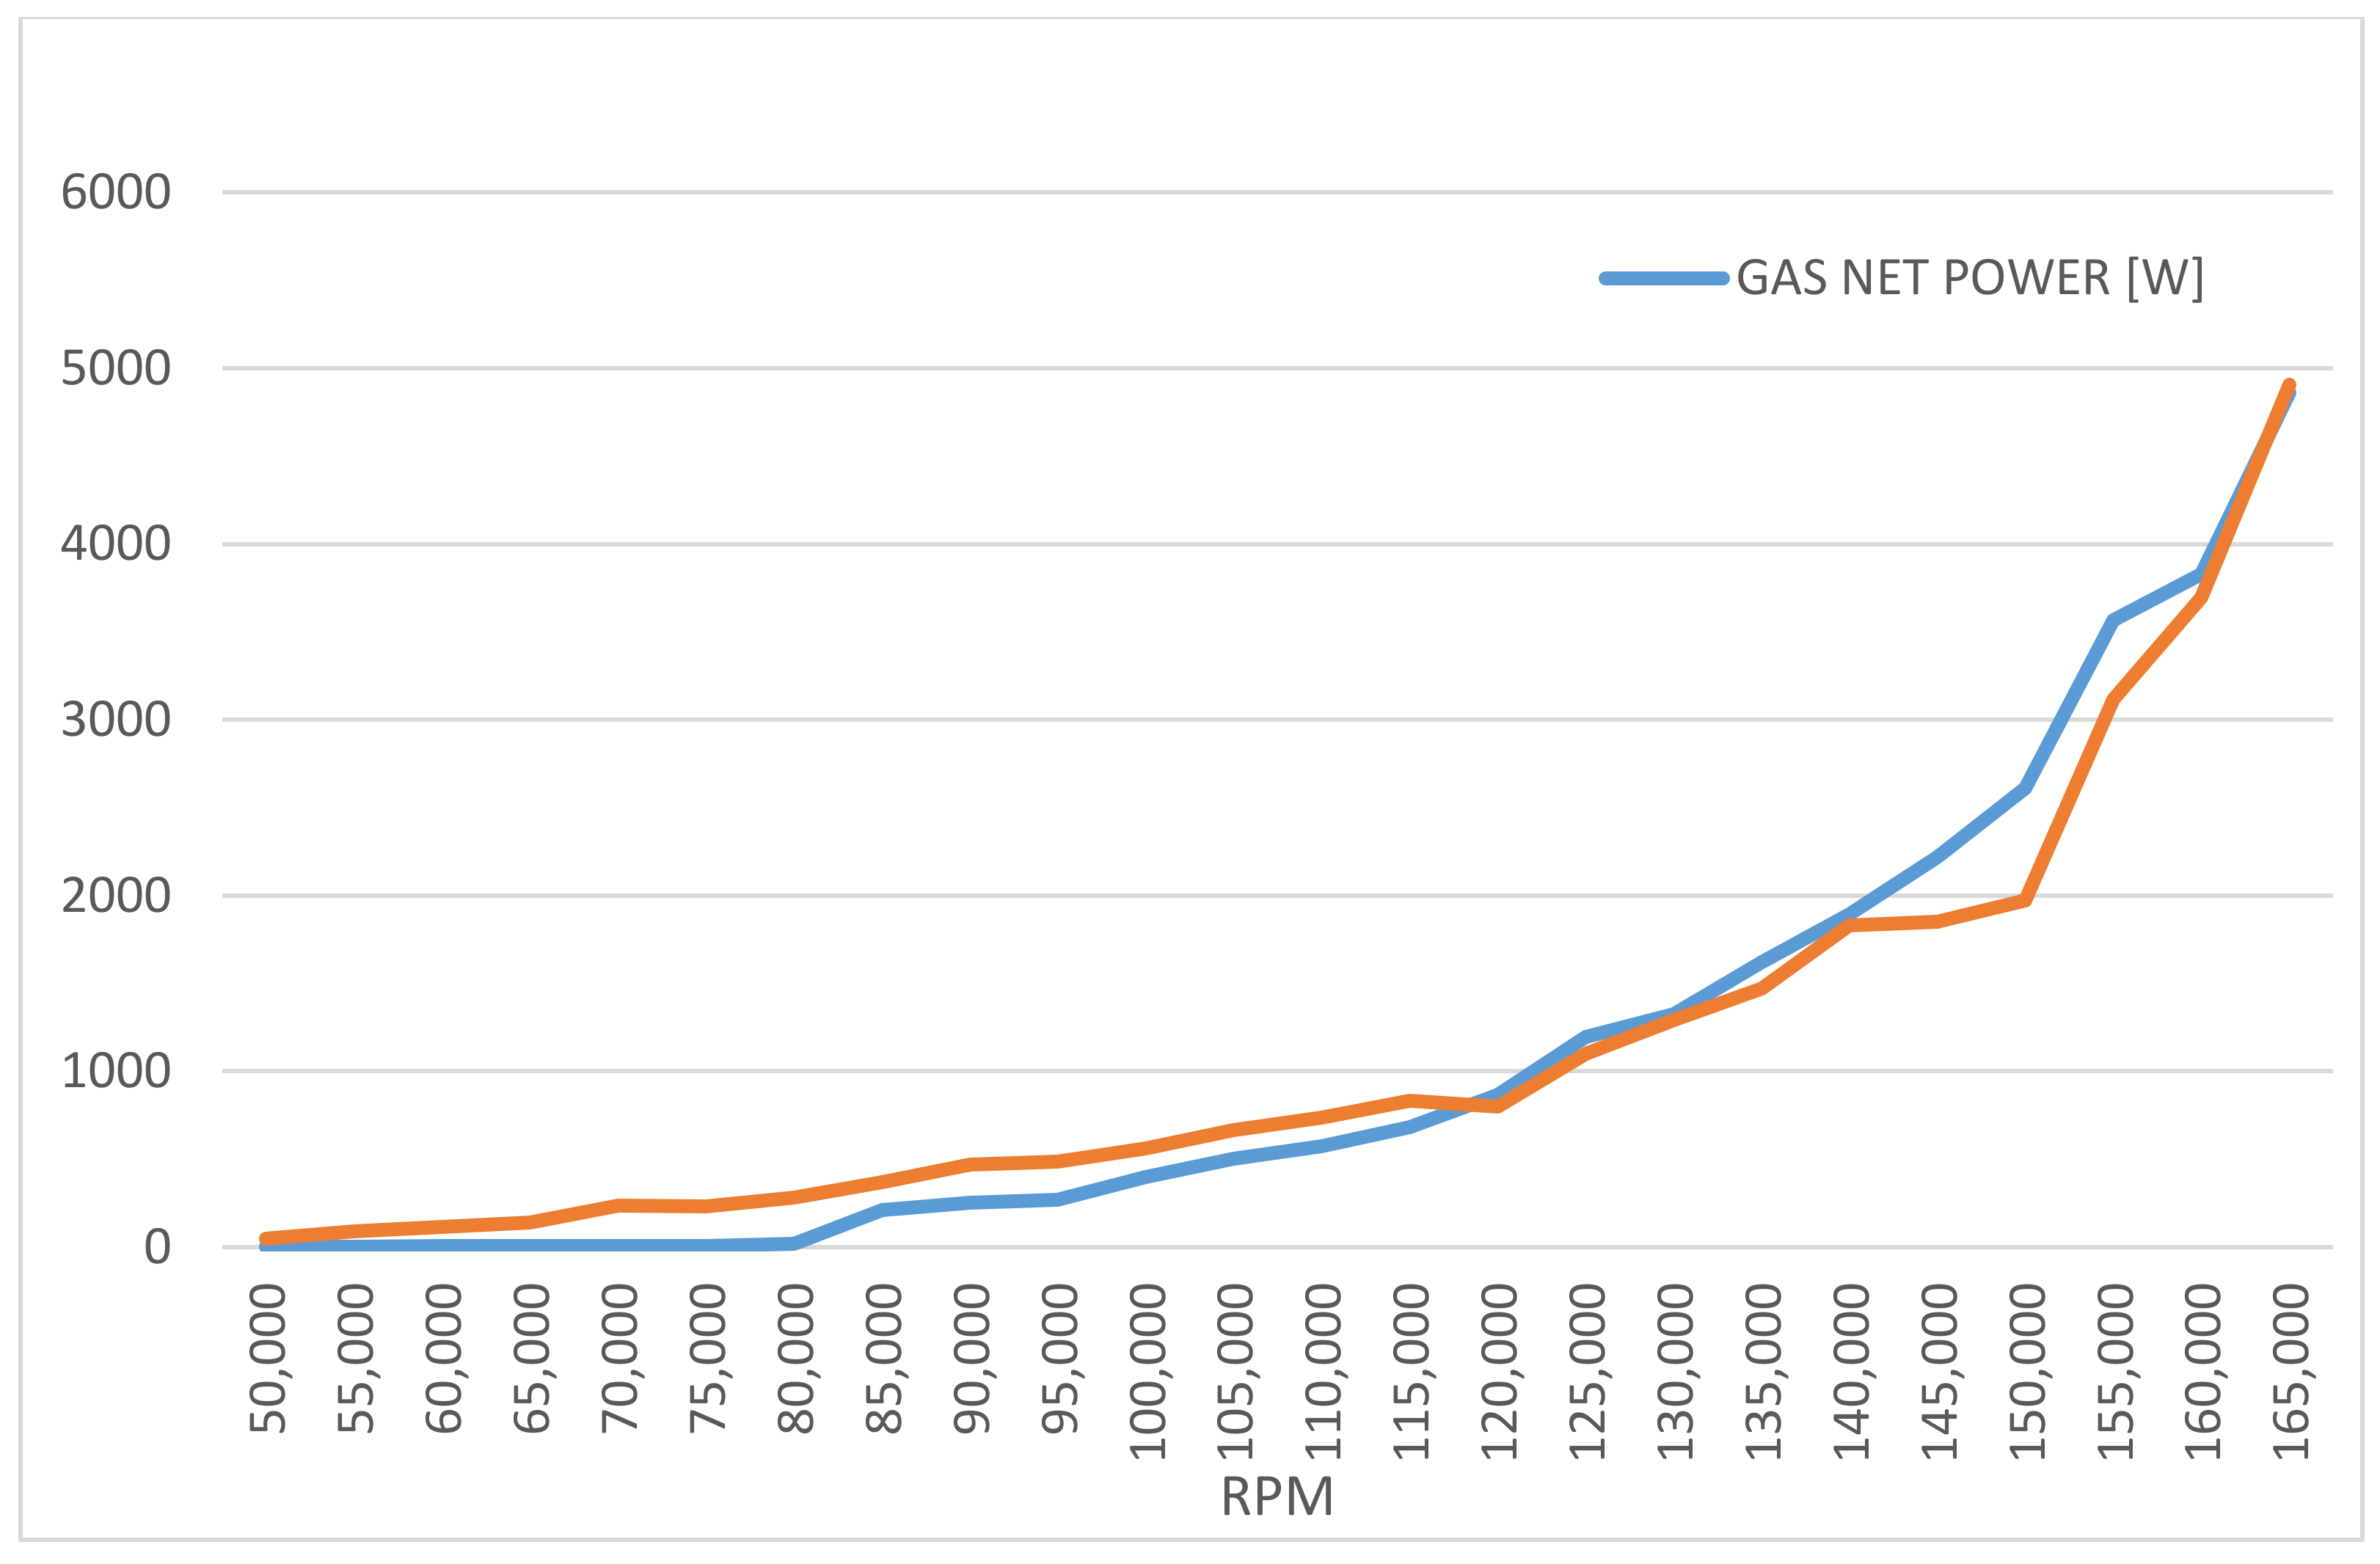
The analysis shows that gas is convenient, allowing for weight savings both in the fuel and in the tank, in fact, a gas cylinder is considerably more compact than a liquid fuel tank. However, there is a decrease in the maximum power of 0.8% (
Figure 14).
The net work obtained from the entire system could also be used for the electric power generation that can be required by small utilities. In the
Figure 15 there is an example of gear reducer, which makes it possible to pair with an electric generator.
In a first analysis, it is possible to calculate the corresponding electric power:
with
.
Assuming a kerosene cost is 1.8
and a gas (propane/butane) cost is 1.5
the cost of kWh was calculated at various RPM and exposed in the
Figure 16.
It can be noticed that the trend shown in the figure corresponds to the €/kWh ratio. This trend is correlated to the daily market fuel cost. The results show how the use of the LPG is already convenient at “low” rpm, to attest to the maximum efficiency zone (165,000 rpm) to €3.30 kWh, compared to the €4 kWh for the kerosene configuration. In addition, with reference to
Figure 12 and
Table 3, the weight saving of 1.3 kg, will certainly affect, positively, the payload and installation costs. The increase of fuel on board allows an increase in the autonomy of the vehicle itself.
8. Conclusions
The tests carried out on the device, in two different configurations, highlight some very significant aspects. The results obtained showed interesting developments for the application of GT as a power generation unit for on-board installations. In particular, the use of gas as fuel, positively affects two fundamental parameters such as weight and costs. The costs are primarily linked to the fuels cost trend. Therefore, it is advantageous to use propane/butane gas instead of kerosene (currently 0.78 €/L instead of 1.39 €/L, respectively). In this manner, it is able to exploit even greater availability on the gas market. Moreover, the weight saving also affects the installation costs, the construction materials, and allows an increase in autonomy in the case of on-board applications. Moreover, in the case of a hybrid bus, an increase of payload can be also achieved. On the other hand the experimental results campaign allows identifying the main goals of research. These goals can be achieved/implemented in a future prototype: the design of an integrated lubrication system and the design of a remote control system by dedicated software. Once all issues will be figure out, it is possible to proceed with the on-board installation of such a GT device. It is important to notice that is certainly possible, however, that ultra-micro GT sets may one day be competitive with conventional ICEs for what the installed kW cost is concerned. Even at much higher costs, they would have already no competitors as compact power sources for portable electronic equipment, or range extenders. As a final remark, with a view to a consumption reduction (due, in this case, to auxiliaries) and an optimisation of the “vehicle system”, the use of GT device could also allow a waste heat recovery process to be implemented (the EGT is higher than 500 °C) using an ORC device. Such a device would operate during the turbine operational period, providing an extra power to the auxiliaries, increasing the total efficiency.


