Article

Analysis of Energy Saving Potential in High-Performance Building Technologies under Korean Climatic Conditions

1
Department of Architecture, College of Engineering, Korea University, 145 Anam-Ro, Seongbuk-Gu, Seoul 02841, Korea
2
Building and Urban Research Institute, Korea Institute of Civil Engineering and Building Technology, 283 Goyangdae-Ro, Ilsanseo-Gu, Goyang-Si, Gyeonggi-Do 10223, Korea
*
Author to whom correspondence should be addressed.
Energies 2018, 11(4), 884; https://doi.org/10.3390/en11040884
Submission received: 14 March 2018 / Revised: 29 March 2018 / Accepted: 2 April 2018 / Published: 10 April 2018

Abstract

:
This study aims to suggest a basis for the selection of technologies for developing high-performance buildings to reduce energy consumption and greenhouse gas emissions. Energy-saving technologies comprising 15 cases were categorized into passive, active, and renewable energy systems. EnergyPlus v8.8.0 was used to analyze the contribution of each technology in reducing the primary energy consumptions and CO2 emissions in the Korean climate. The primary energy consumptions of the base model were 464.1 and 485.1 kWh/m²a in the Incheon and Jeju region, respectively, and the CO2 emissions were 83.4 and 87.4 kgCO2/m²a, respectively. Each technology (cases 1–15) provided different energy-saving contributions in the Korean climate depending on their characteristics. The heating, cooling, and other energy-saving contributions of each technology indicate that their saving rates can be used when selecting suitable technologies during the cooling and heating seasons. Case 15 (active chilled beam with dedicated outdoor air system + ground source heat pump) showed the highest energy saving rate. In case 15, the Incheon and Jeju models were reduced by 189.4 (59.2%) and 206.2 kWh/m²a (57.4%) compared to the base case, respectively, and the CO2 emissions were reduced by up to 32.7 (60.8%) and 35.6 kgCO2/m²a (59.3%), respectively.

Graphical Abstract

1. Introduction

1.1. Background and Purpose

Every year, global temperatures are becoming higher due to global warming, and extreme weather events are more frequent. The Intergovernmental Panel on Climate Change (IPCC) has predicted that Earth’s average temperature will rise by 1.4–5.8 °C from 1990 to 2100 [1,2]. In addition, the IPCC has predicted that the frequency and duration of hot and cold periods (heat waves and cold waves) in each region will increase [3,4,5,6,7,8,9]. Accordingly, the 2015 United Nations Climate Change Conference (December 2015) adopted the Paris agreement, which aims to respond to climate change by saving energy and reducing greenhouse gas emissions, and it launched a plan for a new climate regime post-2020 [10,11,12]. Energy use by buildings accounts for 25–40% of the world’s overall primary energy consumption and is therefore a major driver of greenhouse gas (GHG) emissions. As global awareness of the necessity to conserve energy grows, high-performance buildings have become a crucial agenda item for their role in saving energy [13,14,15,16,17].
In recent years, many developed countries have tried to develop high-performance buildings that consume almost zero energy, and rapid advances have been made to various technologies that improve the energy efficiency of buildings [13,14,15,16,17]. However, Korea has not caught up with advances in other developed countries. Crucially, energy consumption by buildings accounts for 24.8% of total energy consumption in Korea, and it has the potential to increase up to 40% when considering known trends for developed countries [18,19,20]. Thus, the potential to save energy in buildings is large. It is important to construct high-performance buildings based on various energy-saving technologies.
To do so, it is necessary to develop systematic energy-saving technologies and to analyze the contribution rate of energy and the GHG emissions reduction enabled by each technology. The purpose of this study is to suggest a basis to select the appropriate energy-saving systems to develop high-performance buildings with the goal of reducing energy consumption and GHG emissions in the Korean climate. Understanding the energy consumption of each technology and its energy reduction principles under specific climate conditions is crucial to ensure their contribution to high-performance buildings. This study evaluated significant high-performance buildings technologies in terms of their energy consumption and CO2 emission in the Korean climate as well as their contributions to energy savings in detail. We analyzed the characteristics of the energy consumption for each technology and reviewed the principles of energy savings.

1.2. Literature Review

Many studies have focused on energy-saving technologies in order to develop high-performance buildings that are closely related to their climate, building envelope, and heating, ventilating, and air conditioning (HVAC) systems.
Thornton et al. [13] studied energy conservation measures (ECM) savings of multiple types of buildings in various climates. A number of current technologies, including valuable air volume (VAV), dedicated outdoor air system (DOAS), and chilled beam, were studied using the U.S. Department of Energy (DOE) reference building to examine their applicability to various climatic conditions of the U.S. Their reported efficiency recommendations for each climate zone and energy simulation results, finding that energy-saving measures, including such as VAV and radiant heating and cooling with DOAS, could provide energy savings of more than 40%.
Li et al. [16] studied the energy performance and the main factors of energy usage in 51 high-performance office buildings in the U.S., Europe, China, and other parts of the Asia-pacific. They established a list of important energy-saving technologies used in each building, and compared their current primary energy consumption. Considering that energy consumption differs between buildings, even those applying similar certified technologies, the authors suggested that the region’s climate, building code, and building area influence the energy consumption.
Krarti and Deneuville [21] tried to explain a method to achieve optimal energy efficiency with energy-saving technologies using DOE medium office-based simulations. In their study, optimal systems for office buildings located in different climate regions, including major cities in the U.S. and Europe, were compared and examined on the basis of cost over their life cycles.
Boyano et al. [22] analyzed energy consumption in three different European climatic zones and classified energy-saving technologies into passive systems (window, insulation of external wall, and direction of building) and active systems (lighting and HVAC systems) to understand the influence of applying new technologies to office buildings in different climatic zones. Jiang et al. [23] adopted China’s climate-responsive architectural design theory and provided guidelines to select appropriate climate responsive architectural technologies for different climatic zones. The study identified common climate responsive building technologies based on the relevant literature and classified these technologies according to temperature, humidity, daylight, and wind. In this study, climatic zones were largely divided into five major regions, and responsive technologies for each climatic zone were evaluated. Hurtado et al. [24] investigated building design strategies in hot and cold climates (The Netherlands and the U.S.) from the viewpoint of energy consumption, thermal comfort, and focused on passive and active systems. They examined the influence of technology on energy performance according to the design of passive and active systems in a prototype office building.
Engelmann et al. [25] analyzed the potential of five different ventilation and cooling strategies in terms of their energy efficiency and thermal comfort in different climates (Stockholm, Stuttgart, Rome, and Seoul). The study set up a building simulation model that considered a typical office building. The results point out that the use of different comfort models has a significant influence on the comfort rating of the office building.
Salvalai et al. [26] outline a comprehensive analysis of an office building’s performance in terms of energy and thermal comfort related to different cooling concepts in six different European climate zones. The simulation study was accomplished for five cooling technologies: natural ventilation, mechanical night ventilation, fan coils, suspended ceiling panels, and concrete core conditioning applied in Stockholm, Hamburg, Stuttgart, Milan, Rome, and Palermo.
Pfafferott [27] studied passive cooling by night ventilation of an office building in Germany. Monitored data of room and ceiling temperatures in 12 office rooms, supply air flow rate, temperature, and energy consumption for each office room are evaluated by measurements and the building simulation. In this study, passive cooling by night ventilation in moderate climates is proved to reduce the energy demand for air conditioning without reducing comfort.
Lam et al. [28] performed energy simulations for office buildings located in five major climatic zones in China, ranging from Hong Kong with a hot summer and warm winter to Harbin with a severe cold climate. Sensitivity to energy-saving was analyzed in each climatic region, and design parameters, including wall and window conduction, lighting, and infiltration, were used in the analyses. Singh et al. [29] suggested best practice guidance and energy efficiency recommendations for design and operation of high-performance office buildings in India. Their suggestions illustrated energy saving strategies and technologies across office buildings. D’Agostino et al. [17] described renovation of nearly zero energy buildings (NZEB) before outlining a range of best practice policies and measures that have been, or could be, applied to retrofit non-residential buildings in Europe. The paper clearly outlines reasonable refurbishments for NZEBs from the last decade.
Other studies have been conducted for non-office buildings. For example, Im et al. [30] examined energy trends by analyzing the technological elements of high-performance schools in the U.S. and Europe. Rodriguez-Ubinas et al. [31] analyzed energy saving technological strategies and the energy performance of Europe residential buildings, including thermal performance of the envelope, ice thermal storage, evaporative cooling, and night ventilation strategies. The study examined the effects of these technologies on comfort and energy performance reduction.
Polly et al. [32] studied ECM packages of U.S. residential buildings and described a method to analyze potential energy efficiency retrofits in existing houses. The proposed method used an optimization scheme that considers the average energy use and equivalent annual costs to recommend optimal retrofit packages.
Several studies have been conducted to develop high-performance buildings across a range of climates. While many studies have been conducted in the U.S., Europe, China, and other parts of the world, few studies covering extensive technologies (passive, active, and renewable energy systems) have been performed that give consideration to Korean building characteristics and climate.
Although the findings in previous studies of many climate regions of the world can be indirectly applied to the situation in Korea, the direct applicability of foreign studies is limited.

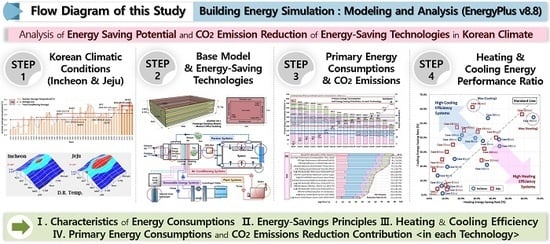
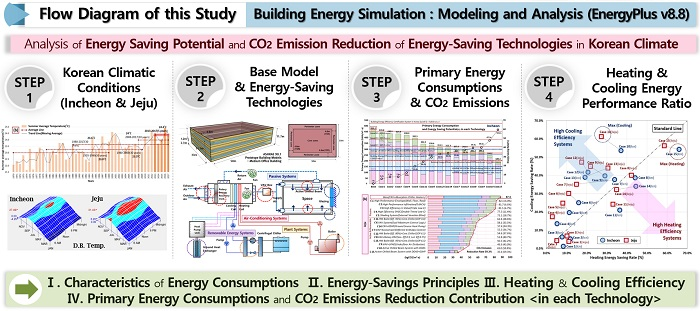
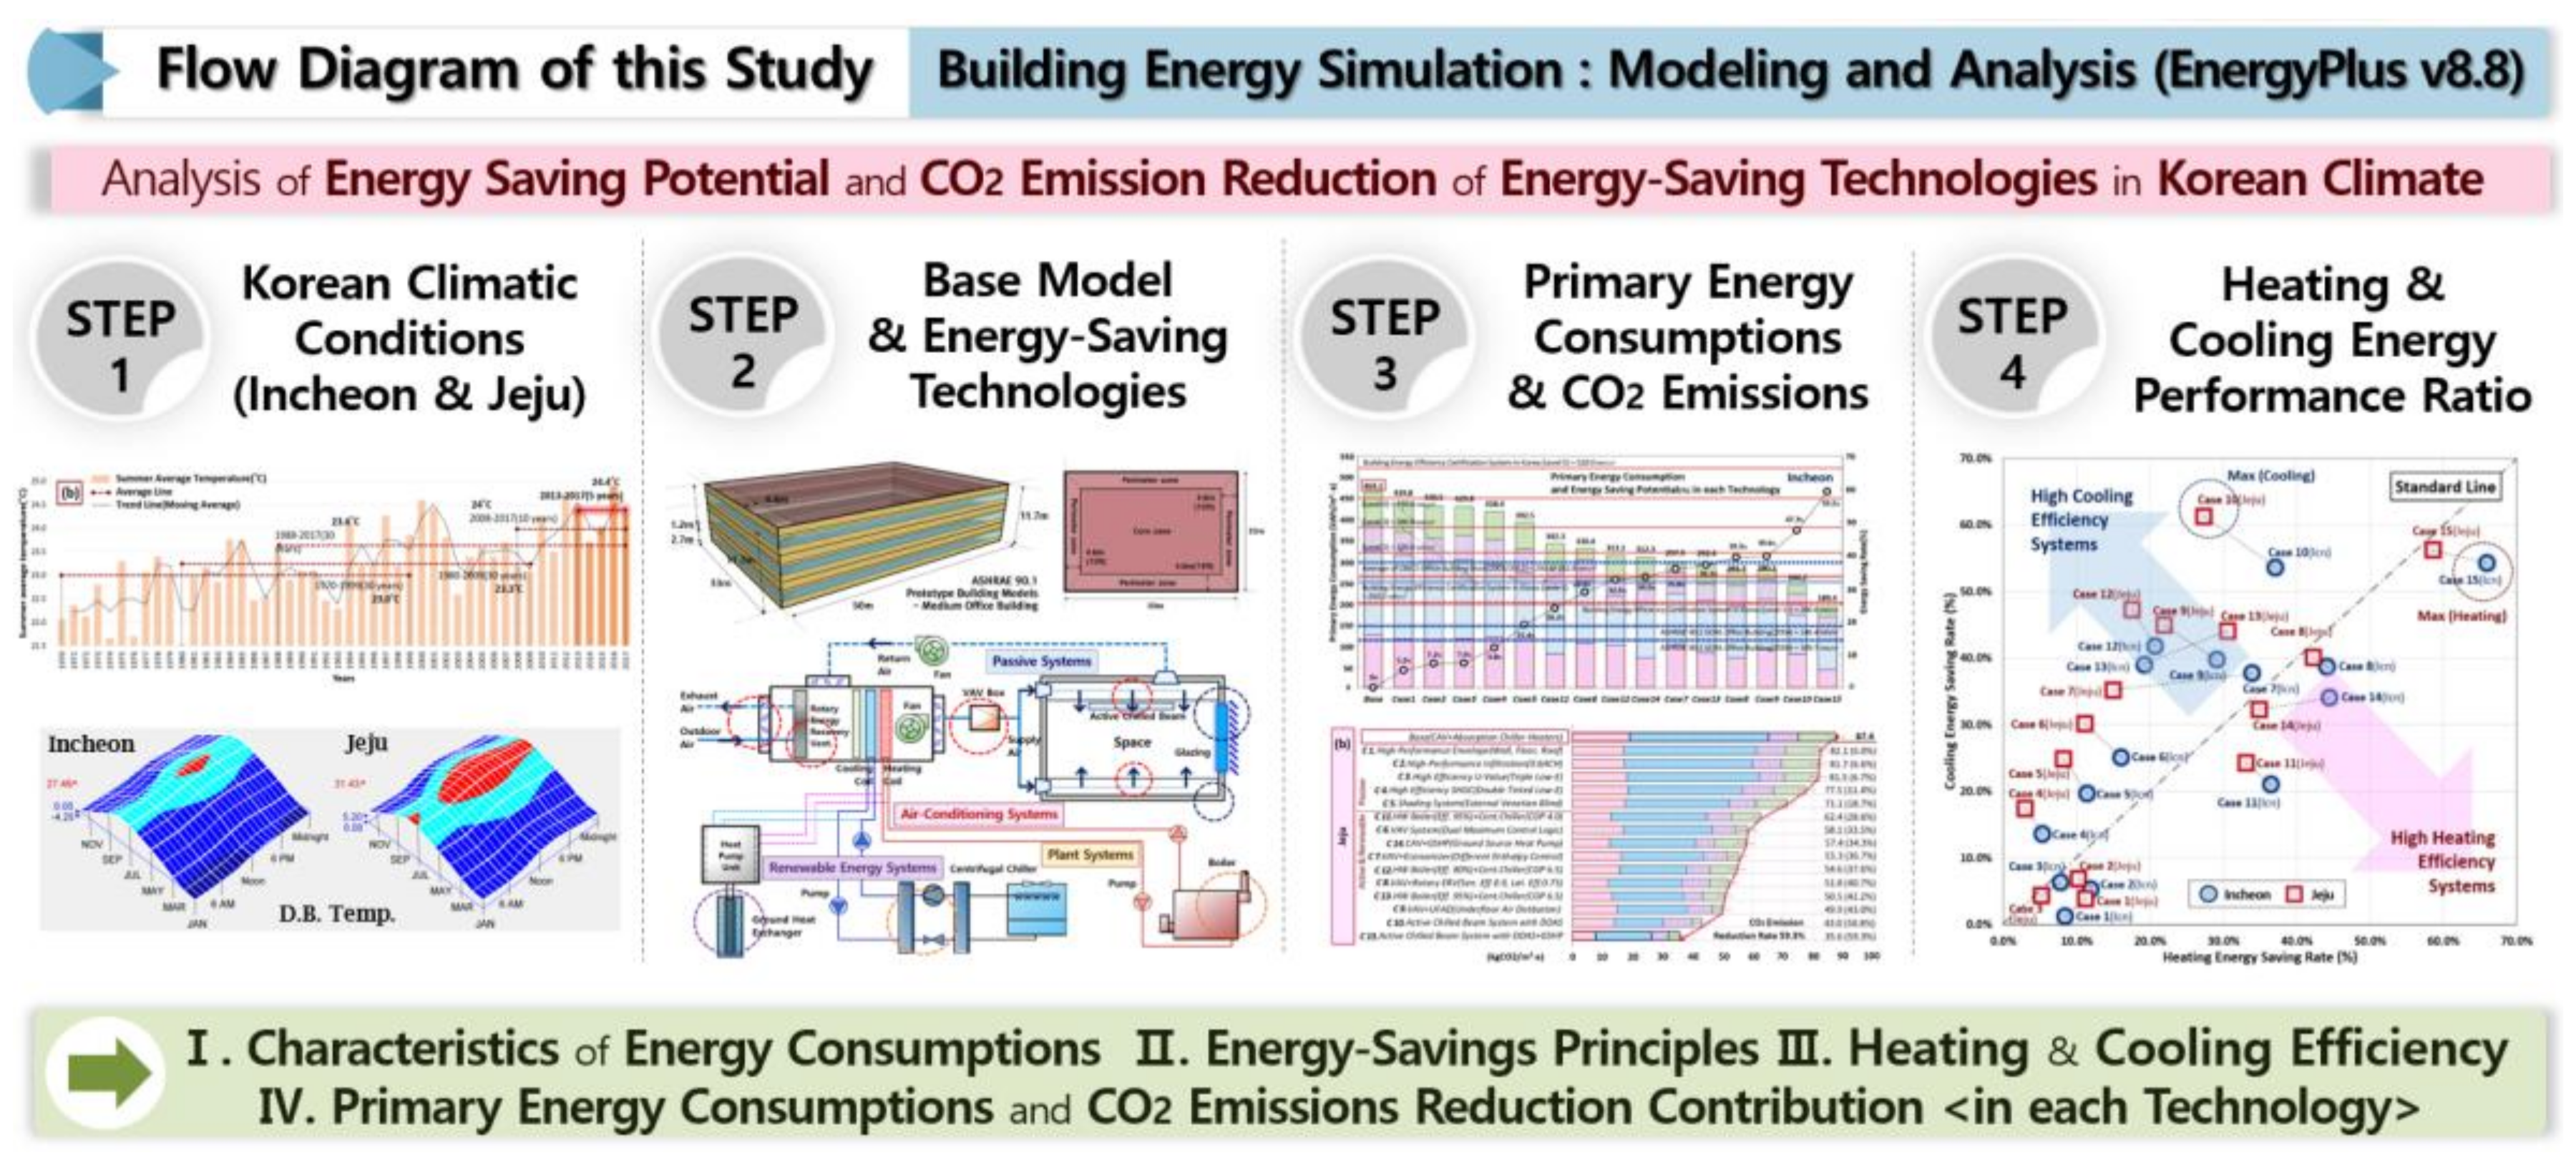
1.3. Method and Process

Figure 1 shows a flow chart of the study process. In this study, energy-saving technologies were selected based on the findings in previous studies [13,14,15,16,17,33,34,35] analyzing the trends of technologies applied to high-performance buildings. To analyze how energy-saving technologies contribute to the energy performance of buildings, simulations were conducted using DOE prototype models (medium office) based on the Korean climate and codes [36,37]. Select technologies were categorized into passive, active, and renewable energy systems. We used EnergyPlus v8.8 to analyze the primary energy consumptions and CO2 emissions. EnergyPlus calculates the building load using an energy balance algorithm. In addition, it can be linked to Google Sketch-up modeling and text-based input. Dynamic simulations are useful to analyze energy consumption and performance of various systems [38]. The results of the energy simulations were compared to Korean and international standards, such as the Commercial Buildings Energy Consumption Survey (CBECS) [39], American Society of Heating, Refrigerating, and Air-Conditioning Engineers (ASHRAE) 90.1 Standards 2004 and 2010 [40,41], and Building Energy Efficiency Certification System (BEESC) in Korea [42]. CBECS is a national sample survey that collects energy usage data and assesses building features related to energy in the U.S., and it has been conducted since 1979 to the present day.

2. Climate Changes and Conditions in Korea

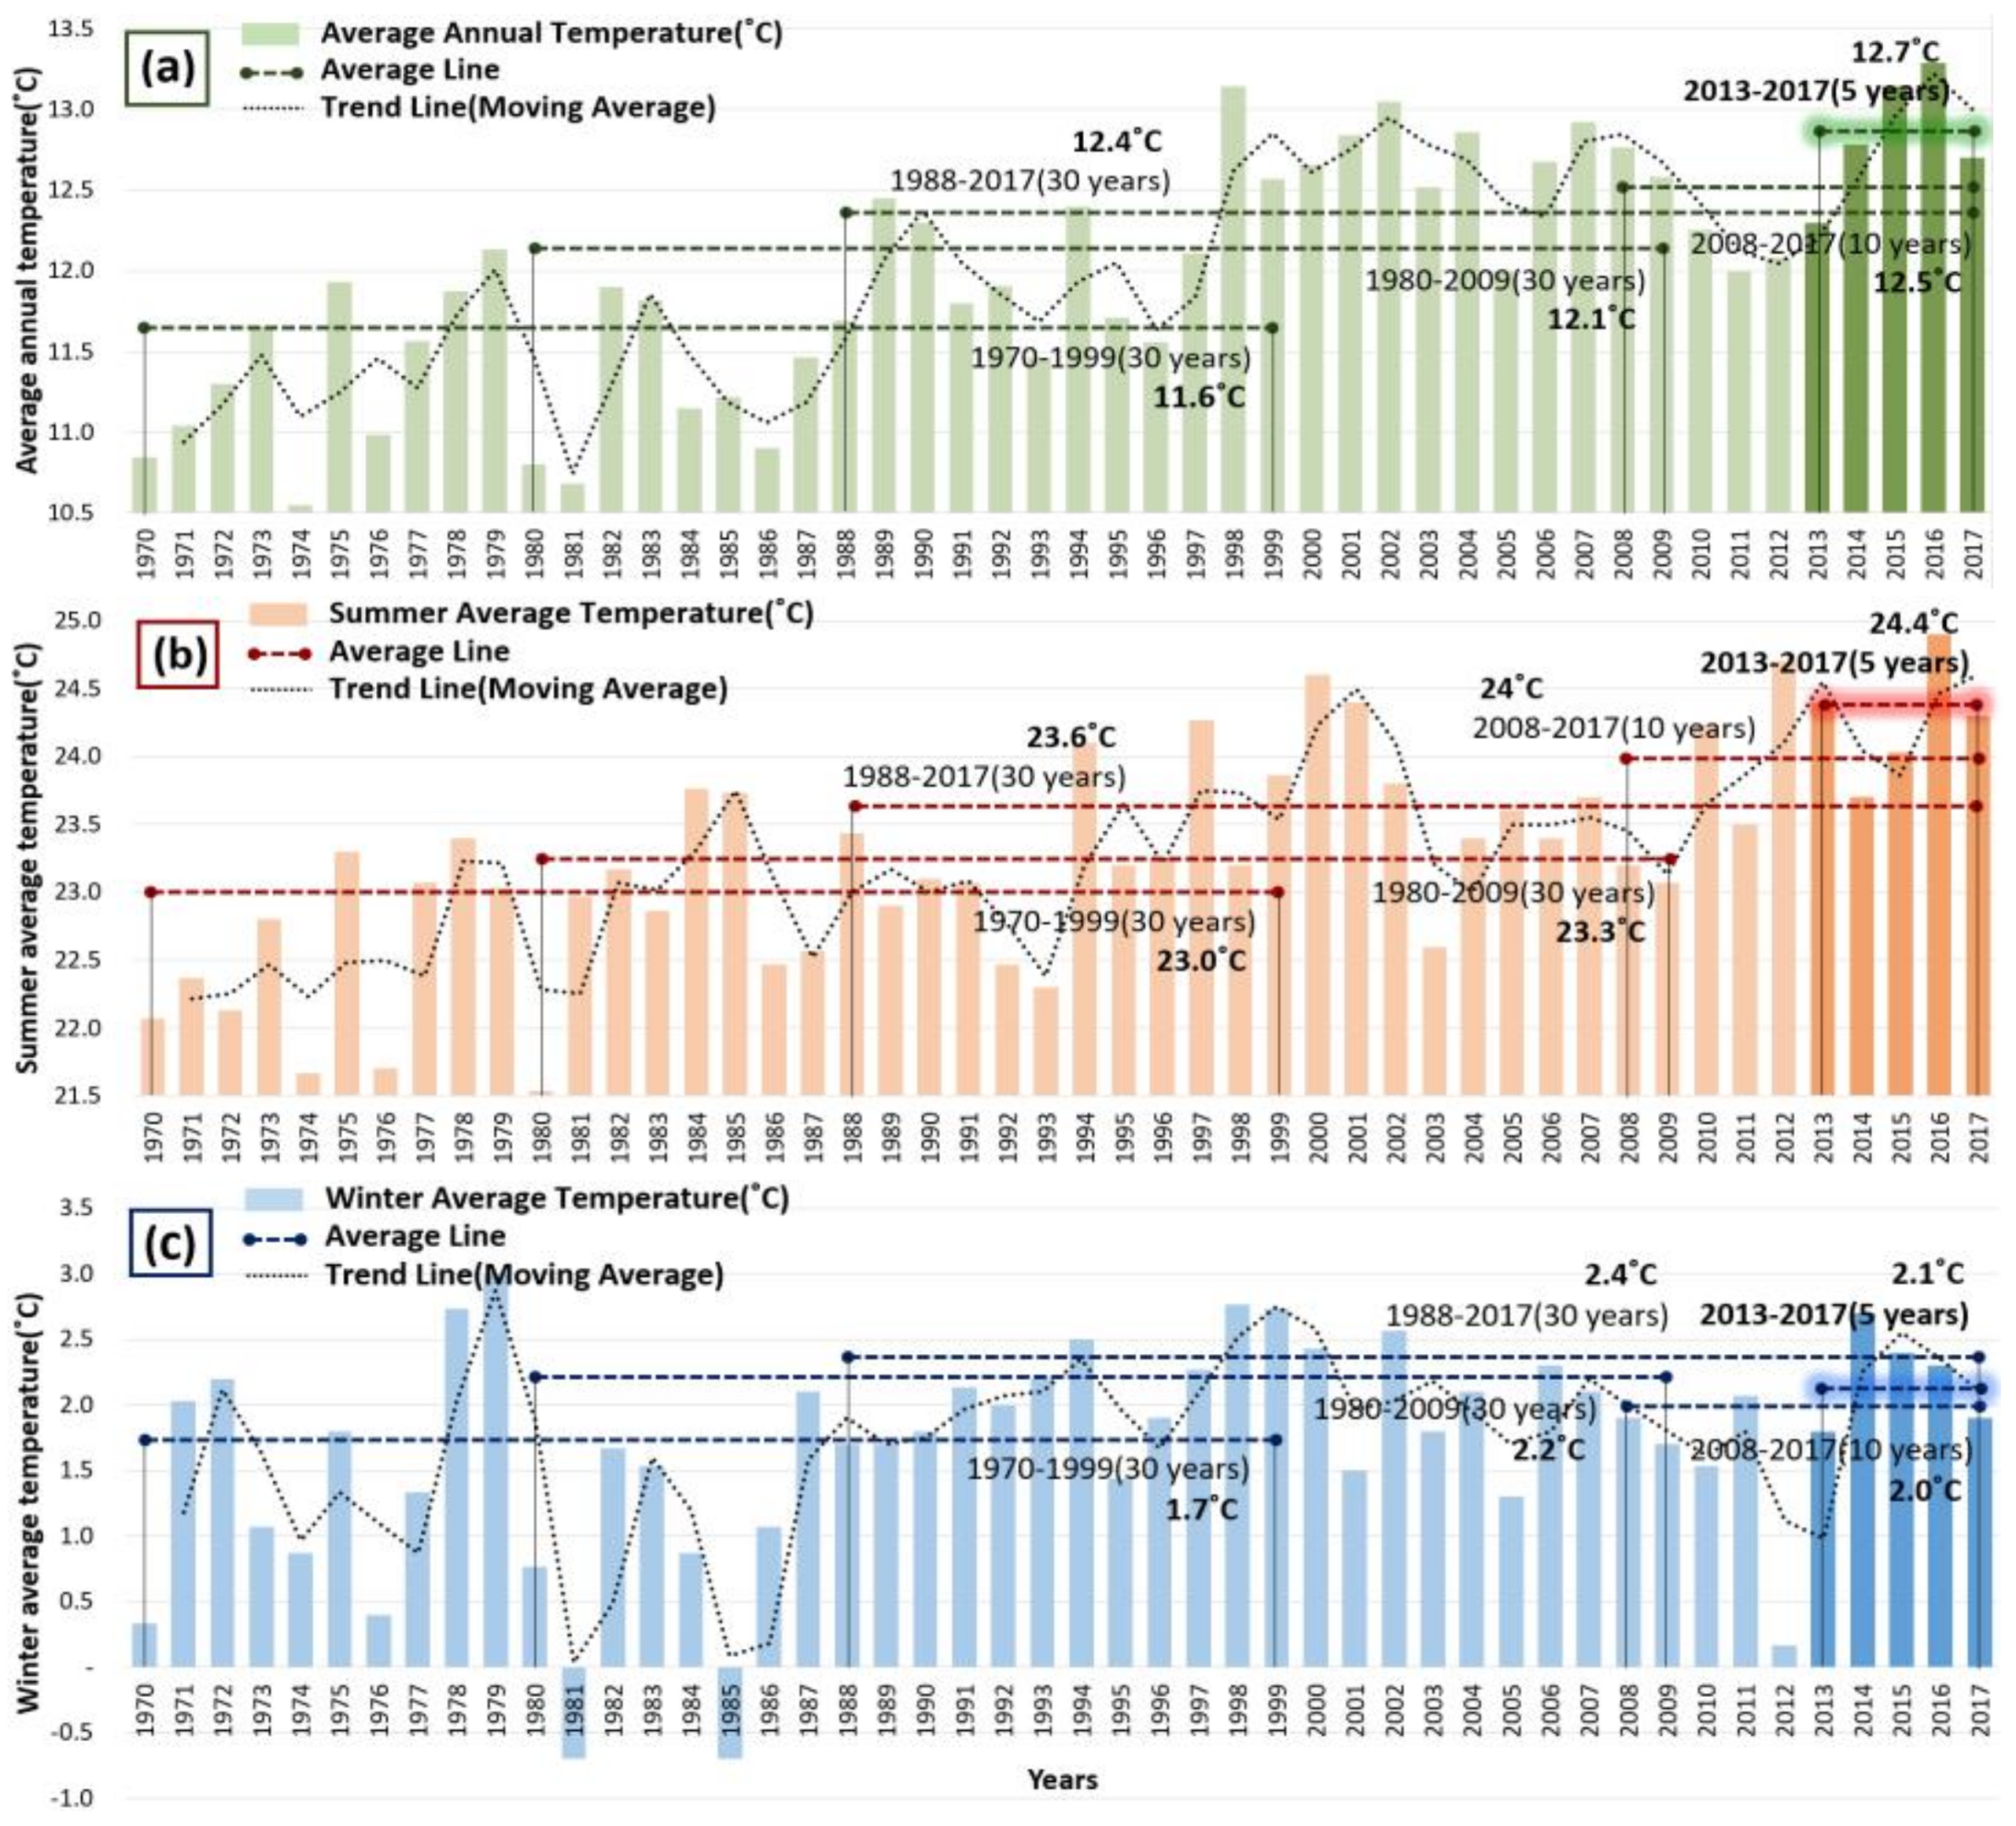
2.1. Incheon’s Area Average Annual Temperature Changes and Extreme Weather Events

The annual temperature change and extreme weather index (summer days and frost days) of Incheon (Seoul metropolitan area) were analyzed using weather data from 1970 to 2017 provided from the Korea Meteorological Administration (KMA) [43,44].
Figure 2a shows Incheon’s annual average temperature changes from 1970 to 2017. The average annual temperature from 1970 to 1999 was 11.6 °C, and this value increased to 12.1 °C between 1980 and 2009 and to 12.4 °C between 1988 and 2017. In addition, the annual temperature of the past decade (2008 to 2017) was 12.5 °C and that of the past 5 years (2013 to 2017) was 12.7 °C. This clearly shows that the average annual temperature has been rising continuously.
Figure 2b,c show the average temperatures of the summer season (June–August) and winter season (December–February). Figure 2b shows that the average summer temperature between 1970 and 1999 was 23.0 °C, and it increased to 23.3 °C between 1980 and 2009 and to 23.6 °C between 1988 and 2017. Furthermore, the average summer temperatures of the past decade and past 5 years (2013 to 2017) increased to 24.0 °C and 24.4 °C, respectively. Figure 2c shows that the average winter temperature was 1.7 °C between 1970 and 1999. The average winter temperatures of the past decade and past 5 years were 2.0 °C and 2.1 °C, respectively. This analysis shows that the average winter temperature increased and decreased repeatedly, and the increase is smaller than that of the average summer temperature, but the average winter temperature increased overall.
Figure 3 shows an analysis of the summer days and frost days in the Incheon area between 1970 and 2017. KMA defines summer and frost days according to criteria set by the World Meteorological Organization (WMO), i.e., summer days are defined as those with a highest temperature above 25 °C and frost days as those with a lowest temperature below 0 °C [45,46].
Figure 3a shows that the number of summer days has increased over the last few decades. In 1970, 55 summer days were recorded. The number increased during 1996 to 2002, and around 80 summer days were recorded annually between 2010 and 2017. The number of summer days shows a trend line corresponding to a quadratic equation (R2 = 0.4373) and with a fairly constant increase.
Figure 3b shows that over the same time period, although the number of frost days increased overall, the increase in the number of frost days is smaller than that of summer days. Paradoxically, the winter temperatures in Figure 2c increased overall, but the number of frost days, as shown in Figure 3b, increased rather recently (R2 = 0.1690). This is because the jet stream that blocks cold air from the Arctic weakened and stabled due to the rise in average temperatures caused by global warming. As a result, cold air from the Arctic is able to stream south and cause cold waves on the Korean Peninsula [8,9,43]. Extreme weather events, such as heat waves and cold waves, inevitably increase the energy consumption of buildings for heating and cooling and, consequently, contribute to increased GHG emissions.

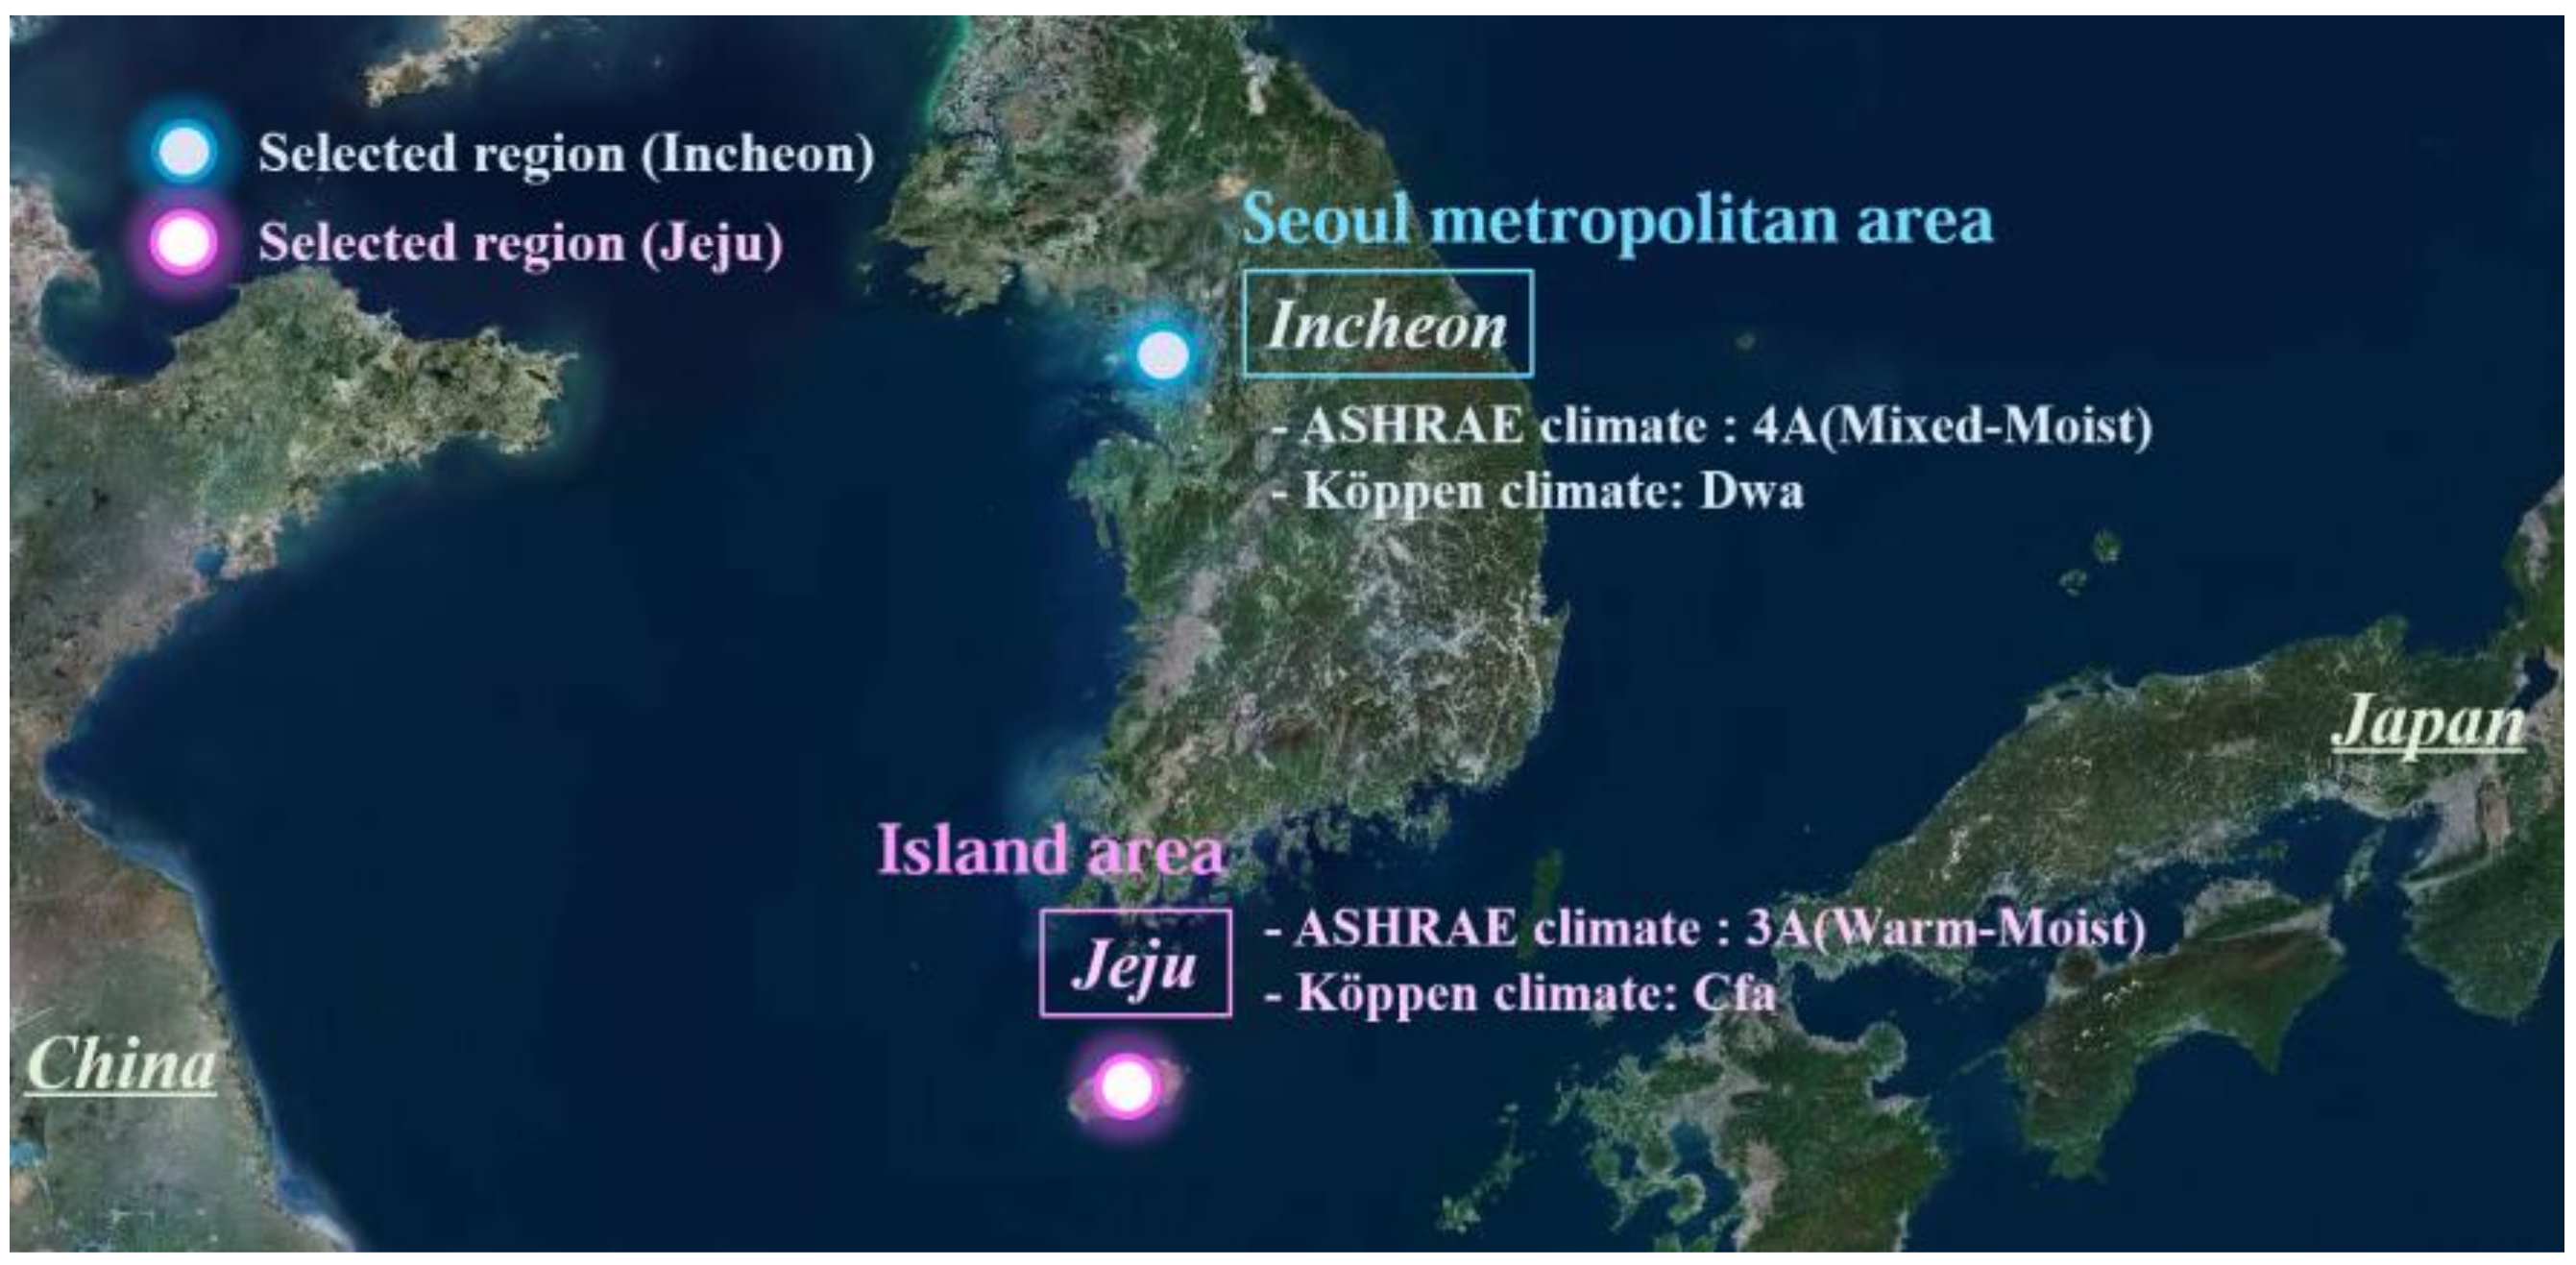
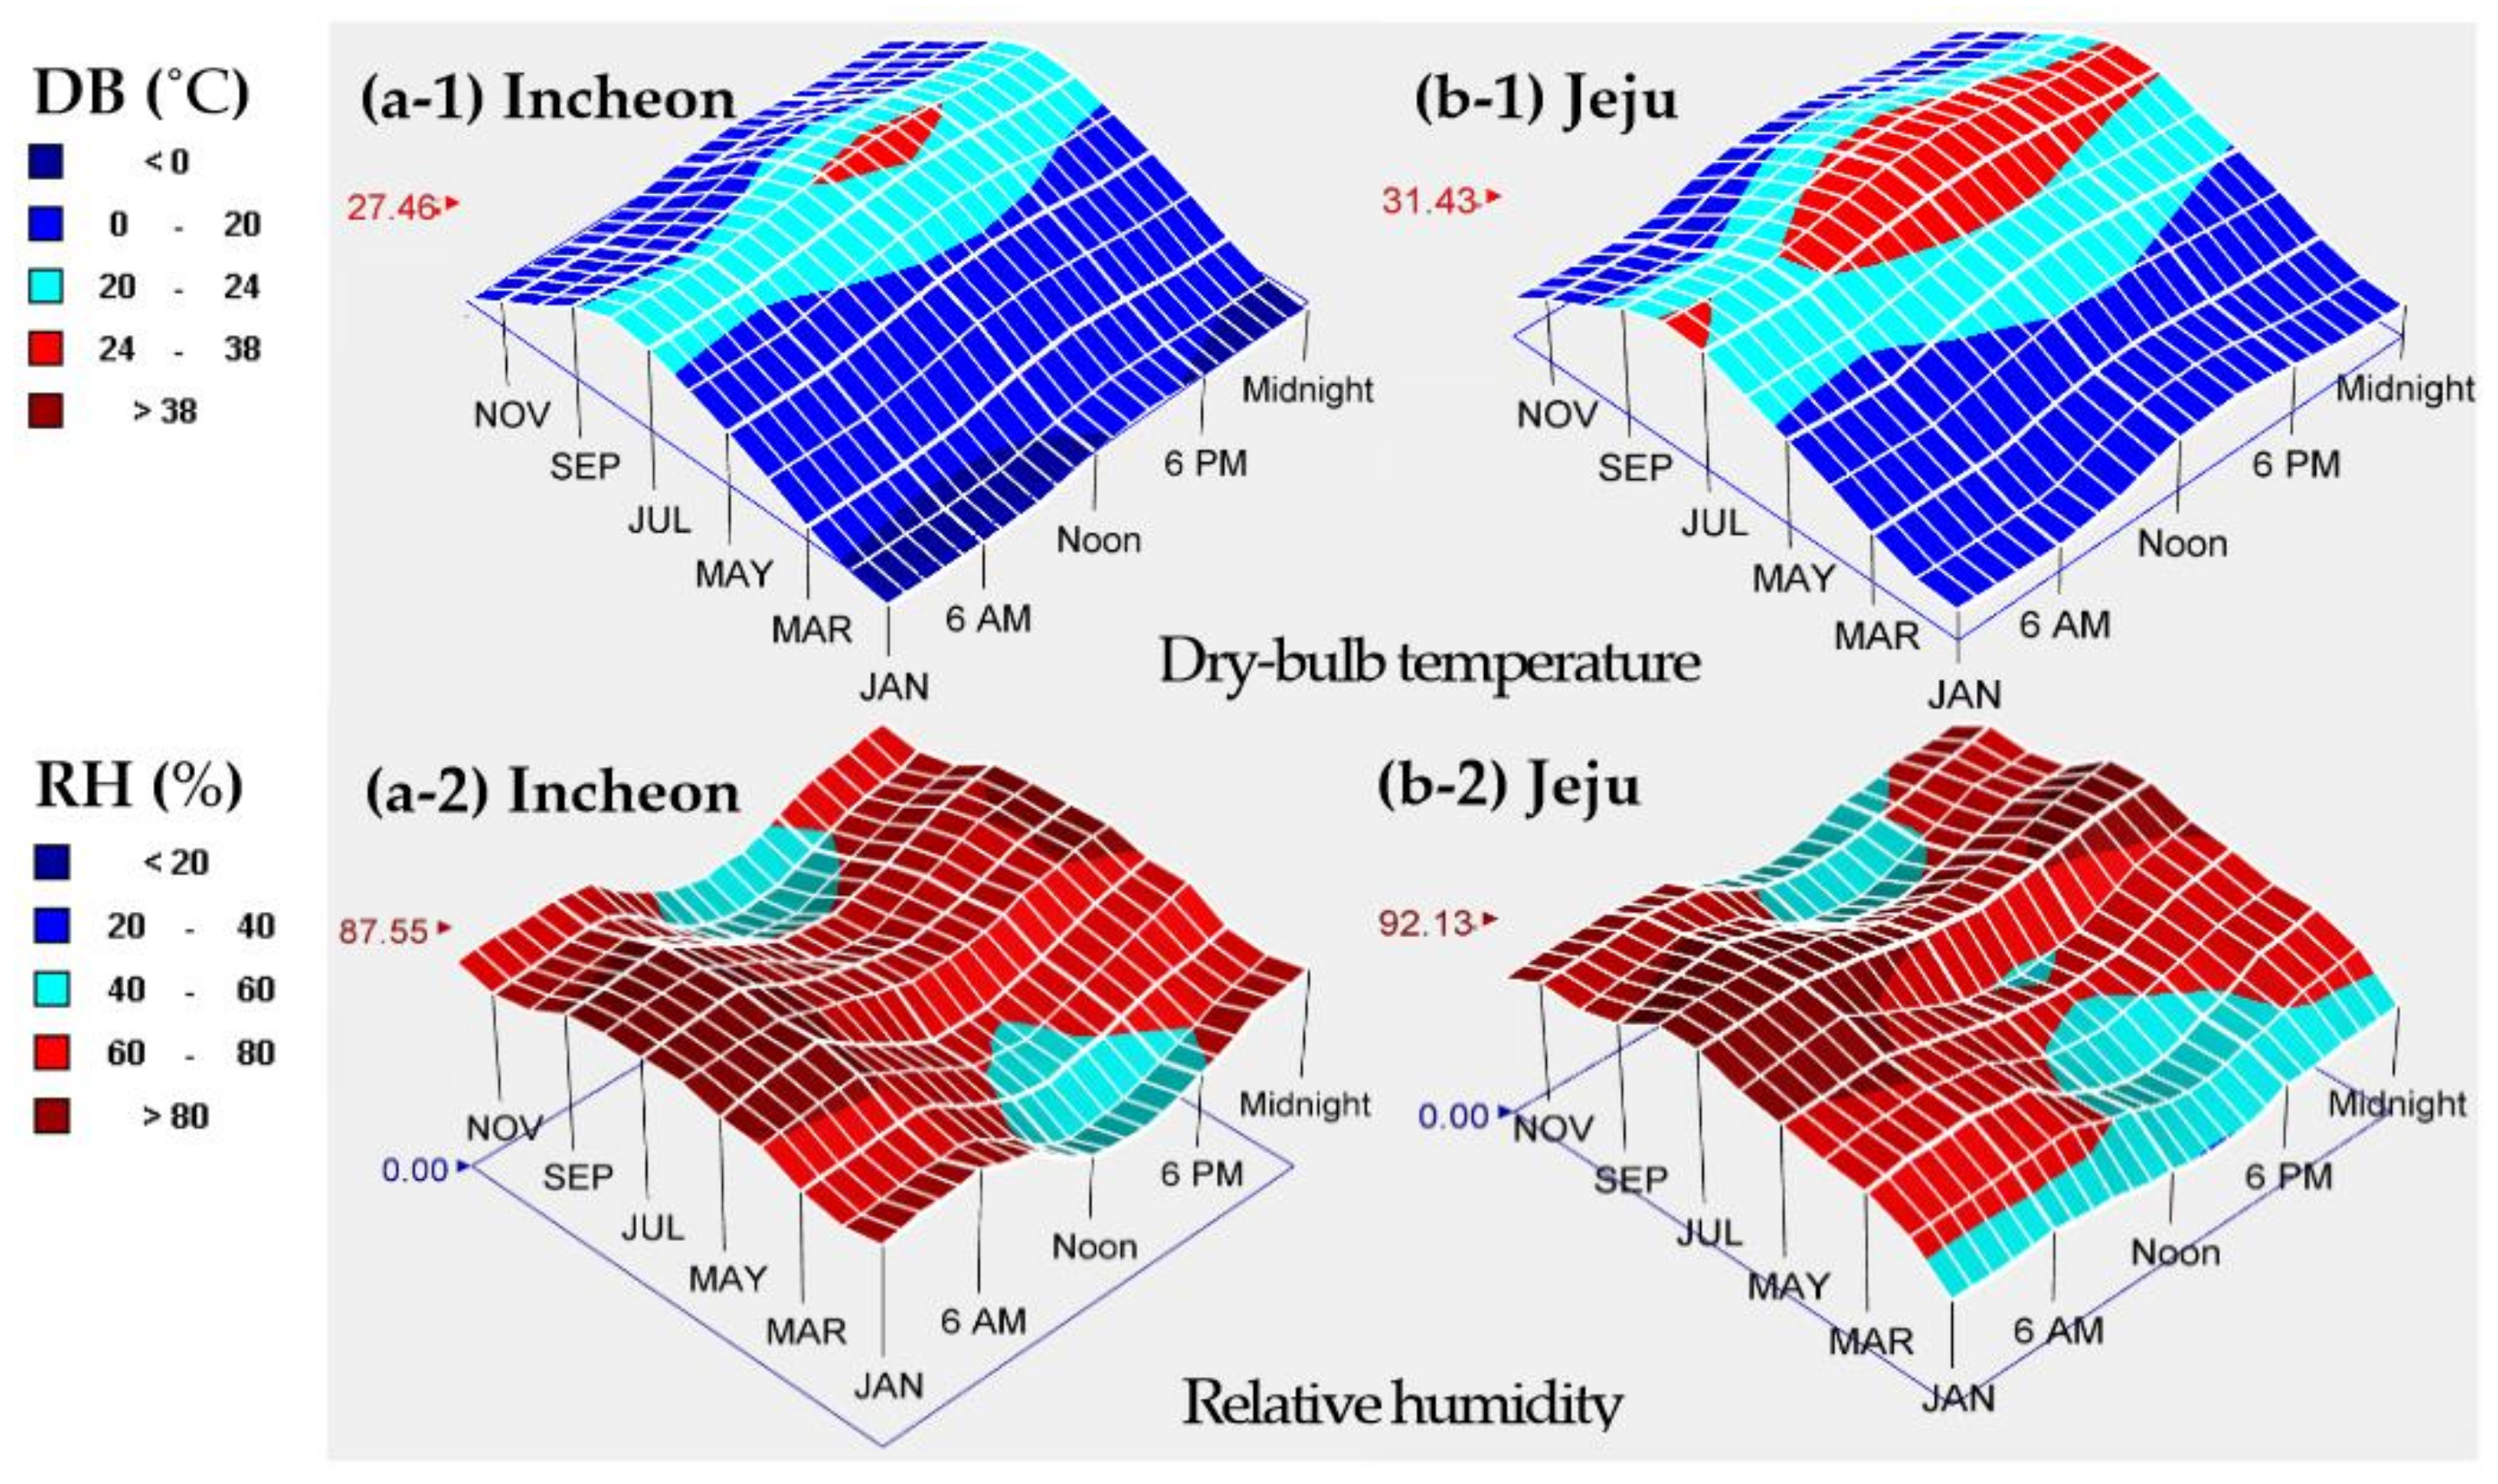
2.2. Comparison of Incheon’s and Jeju’s Climate Conditions

Korean climate is largely divided into central, southern, and Jeju climates, but the southern inland region (4A) shows a climate distribution similar to that of the central region (4A), and the southern coastal region (3A) shows a climate distribution similar to that of Jeju (3A) [47,48].
Therefore, in this study, the regions selected for simulation are Incheon (Seoul metropolitan area) for the central region and Jeju, as shown in Figure 4. The reason for this selection is that two regions cover the climate range for the central, southern, and Jeju regions, and therefore exhibit a whole range of climate conditions in the Korean Peninsula, which also show climate differences.
Figure 5 and Table 1 show Incheon’s and Jeju’s ASHRAE [47] and Köppen [49] climate, location information, average heating degree days (HDD), cooling degree days (CDD), dry bulb temperature, and relative humidity [44] for the time period between 2013 and 2017.
Incheon’s average HDD (18 °C) was 2749 and CDD (10 °C) was 2327 during the past five years. Incheon belongs to the 4A (Mixed–Moist) climate zone according to the ASHRAE classification and the Dwa (subarctic climate, cold and dry winter, and hot summer) climate zone according to the Köppen classification. Incheon has hot and humid summers; the maximum average monthly temperature is 27.5 °C and the maximum average monthly humidity is 87.6%. Incheon’s winters are cold and dry, the minimum average monthly temperature is −2.2 °C, and the minimum average monthly humidity is 46.5%. For Jeju, the value of CDD is higher than HDD, with an average HDD (18 °C) of 1621 and CDD (10 °C) of 2632. It belongs to the 3A (Warm–Moist) climate zone according to the ASHRAE classification and the Cfa (temperate region, humid year-round, and hot summer) climate zone according to the Köppen classification. Both Jeju’s summer–winter temperature and humidity are higher than the corresponding values recorded for Incheon.

3. Theoretical Framework

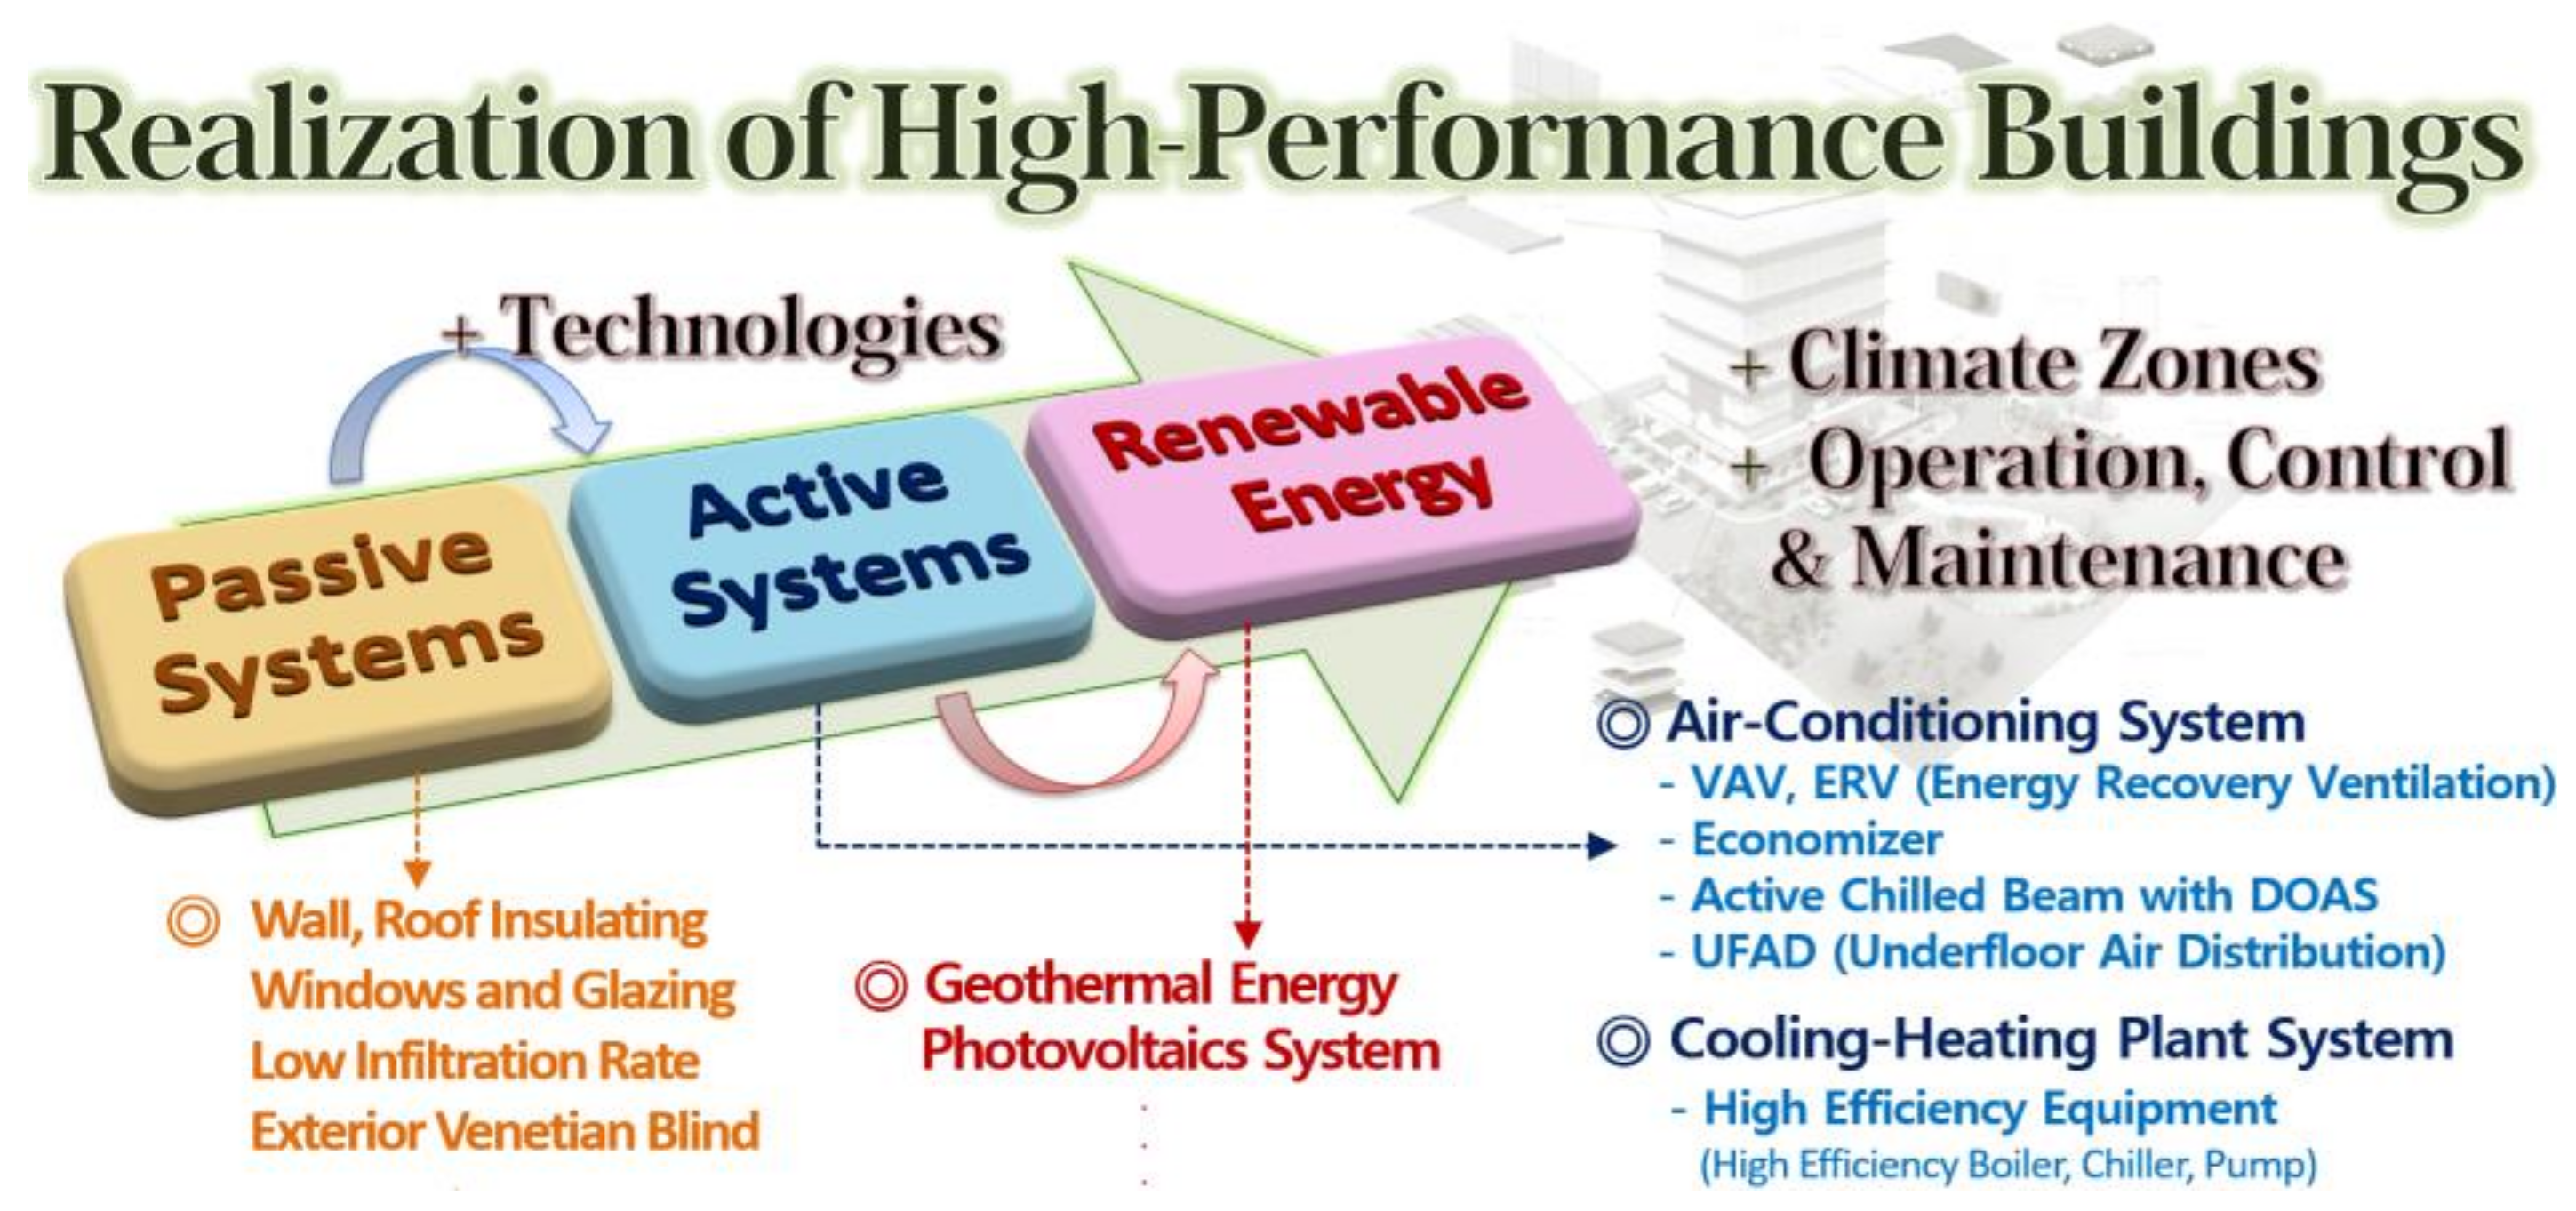
3.1. Definition of High-Performance Buildings

The Energy Policy Act and Energy Independence & Security Act in the U.S. [50,51] defines the term ‘high-performance building’ as one that integrates the application of high-tech elements, high energy efficiency, durability, and the productivity of the occupants.
The International Energy Agency (IEA) [52] dictates that the energy performance of buildings can be driven by the climate, passive systems (building envelopes), active systems (air-conditioning and plant systems), and renewable technologies, as shown in Figure 6. To develop high-performance buildings in response to climate change, we must maximize the correlations between passive, active, and renewable technologies.

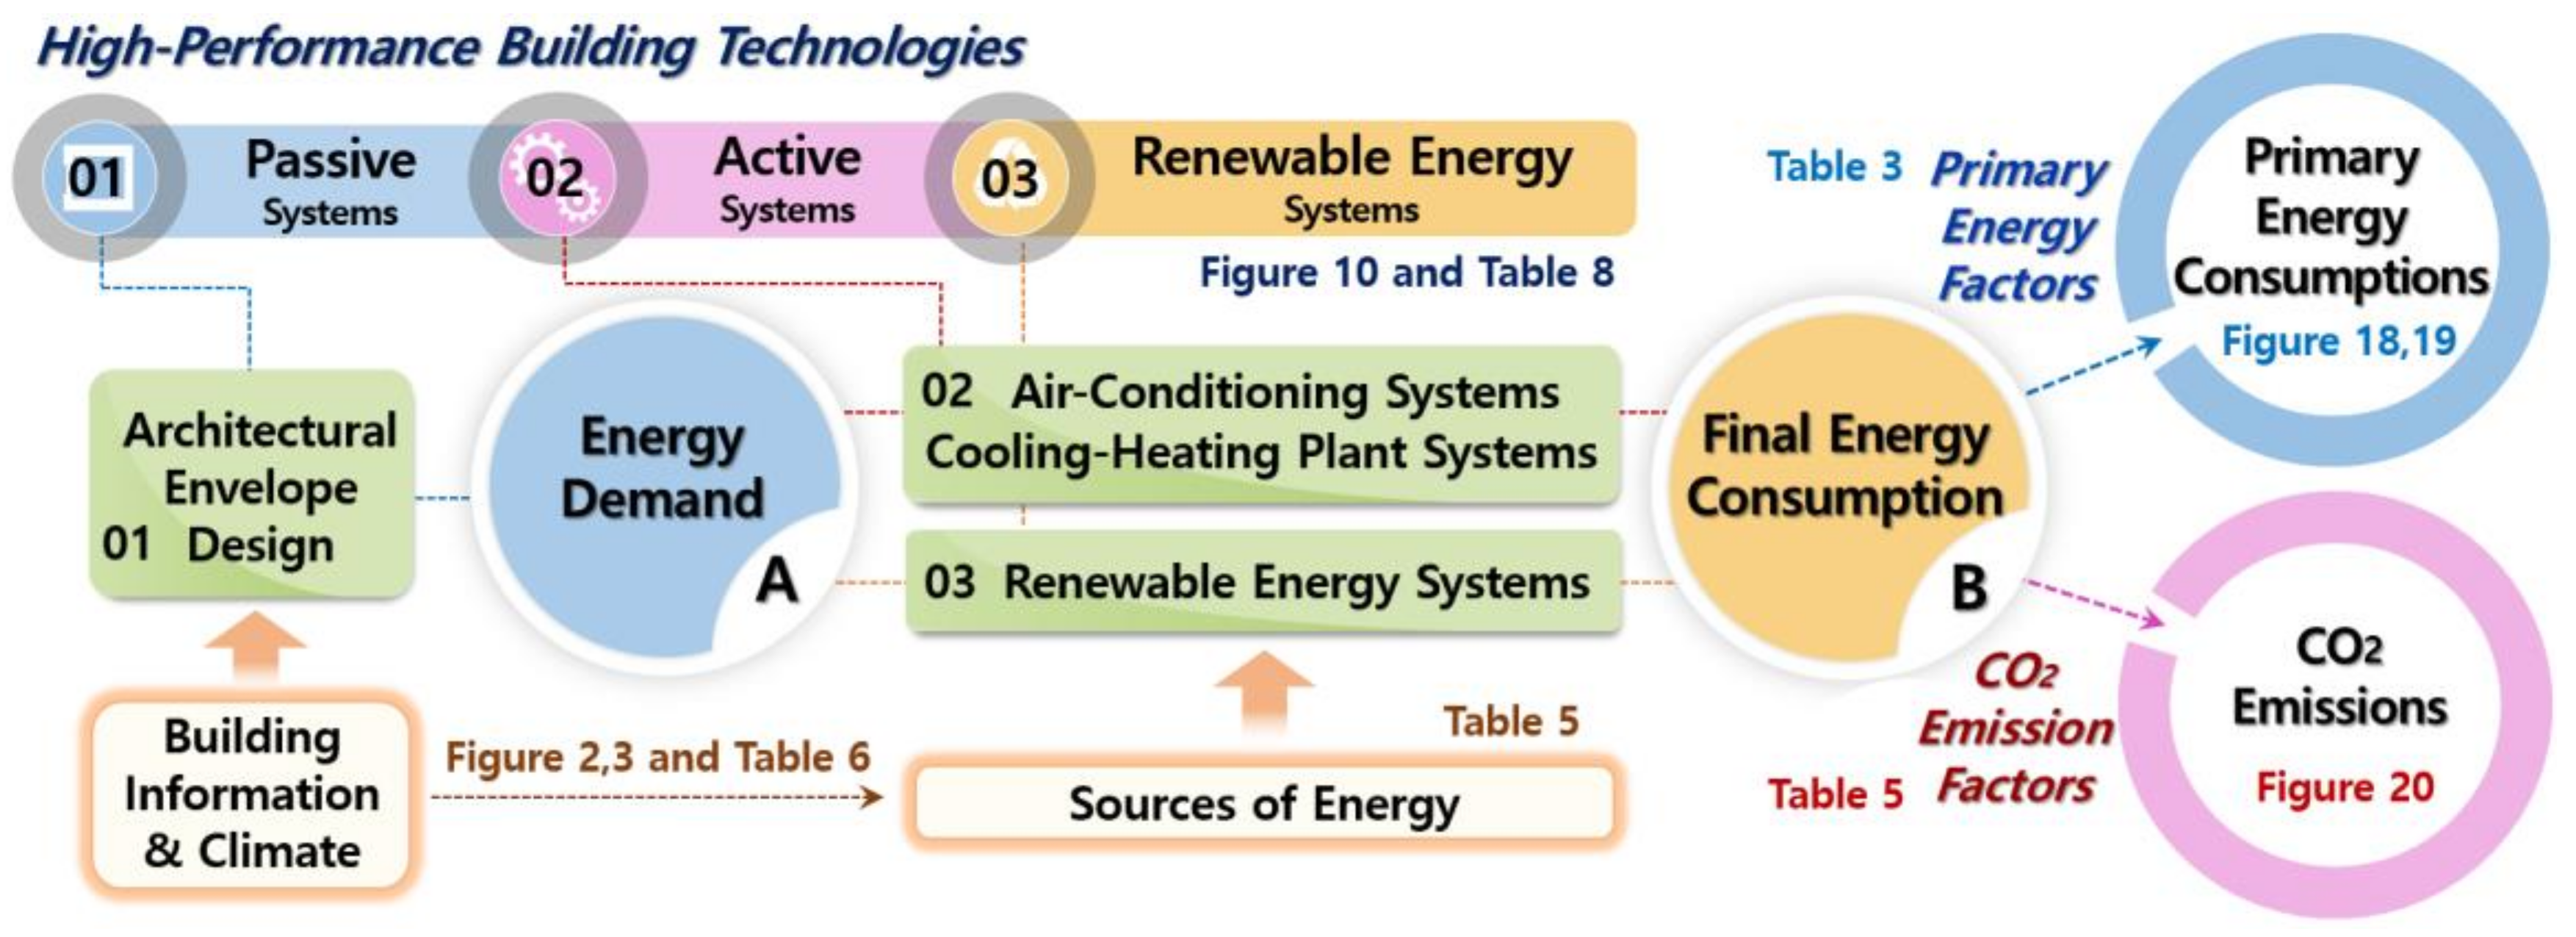
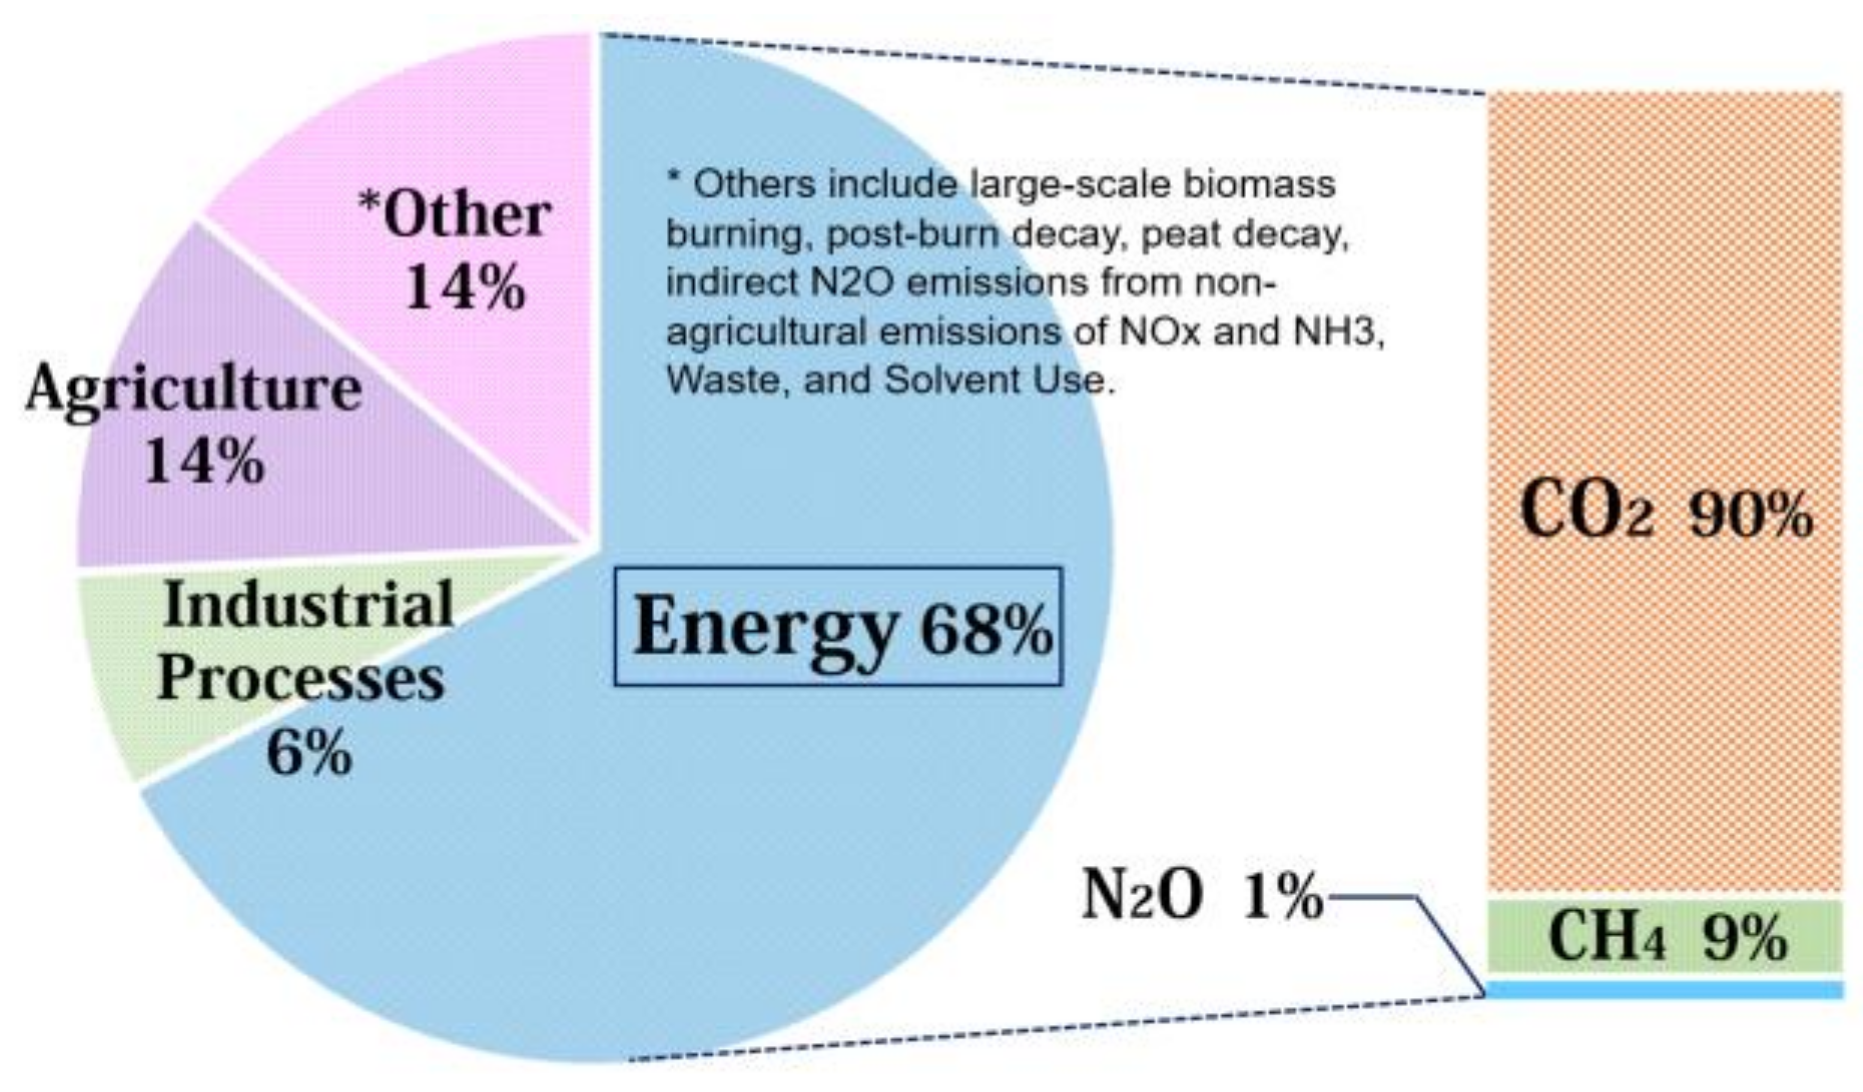
3.2. Primary Energy Consumptions and CO2 Emissions

The ‘building energy’ concept can be divided into two components: the energy demand (A) and the final energy consumption (B), as shown in Figure 7. The energy demand (A) is the amount of energy required by a building, based only on its architectural conditions, such as the building envelope, and it does not include its HVAC systems. In other words, the energy demand component is the energy performance of the building itself. The final energy consumption (B) is calculated by adding the energy losses from each of the building’s HVAC systems to the energy demand (A).
Accordingly, to save the final energy consumption (B), we must reduce the energy losses by adopting high-performance passive and HVAC systems. The primary energy consumption and CO2 emission can be calculated by multiplying the final energy consumption (B) by the primary energy factor and the CO2 emission factor, respectively [42].

3.2.1. Primary Energy Consumptions and Primary Energy Conversion Factors

The term ‘primary energy consumption’ was defined as the primary energy from fossil fuels that the country must provide to meet energy demand of a building. The primary energy consumption is determined by multiplying the final energy consumption by the primary energy factor, which includes energy losses due to electricity production and fuel transportation [42,53,54].
In Korea, the Building Energy Efficiency Certification System (BEECS) [42] was enacted in 2001 and is used as a policy tool to promote reduced consumption of building energy. Based on the Framework Act on Low Carbon, Green Growth, the Ministry of Land, Infrastructure and Transport (MOLIT) specifies 10 levels from 1+++ to 7 and evaluates buildings based on established requirements for non-residential buildings, as shown in Table 2. In this study, we evaluated the annual primary energy consumption level per area of the base model based on the BEECS.
The BEECS in Korea uses different primary energy conversion factors depending on the energy supply sector, as shown in Table 3 [42]. As such, in this study, we calculated the primary energy consumption by multiplying the electric power conversion factor of 2.75 and fuel (coal, gas, oil, etc.) conversion factor of 1.1 with the final energy consumptions.

3.2.2. CO2 Emissions and CO2 Emission Factors

As shown in Figure 8, the IEA 2017 [55] reported that energy production accounts for 68% of global anthropogenic GHG emissions, and 90% of GHG emissions are CO2. In addition, in this report, Korea’s CO2 emissions is ranked seventh worldwide and its CO2 emission growth is the highest of the OECD member states.
As shown in Table 4, Korea’s CO2 emissions increased sharply by 152.9% from 231.7 tCO2 in 1990 to 586.0 tCO2 in 2015. Compared to the CO2 emission growth of OECD member states on each continent during this period, Korea’s is much higher. Korea has announced that by 2030 it will reduce CO2 emissions by 37% from its current business as usual (BAU) rate.
Table 5 lists the Korean CO2 emission factor for each energy supply sector. CO2 emissions, the most important contributor to global warming, can be calculated by multiplying the final energy consumptions by the CO2 emission factor of each energy supply sector. In this study, we calculated the CO2 emissions and reduction rate by multiplying the final energy consumption by the electric power CO2 emission factor of 0.4663 kgCO2/kWh and natural gas (LNG) CO2 emission factor of 0.2031 kgCO2/kWh, as suggested by the Korea Energy Agency (KEA) [56] and IPCC Guidelines [57].

4. Selection of Simulation Analysis Model and Energy-Saving Technologies

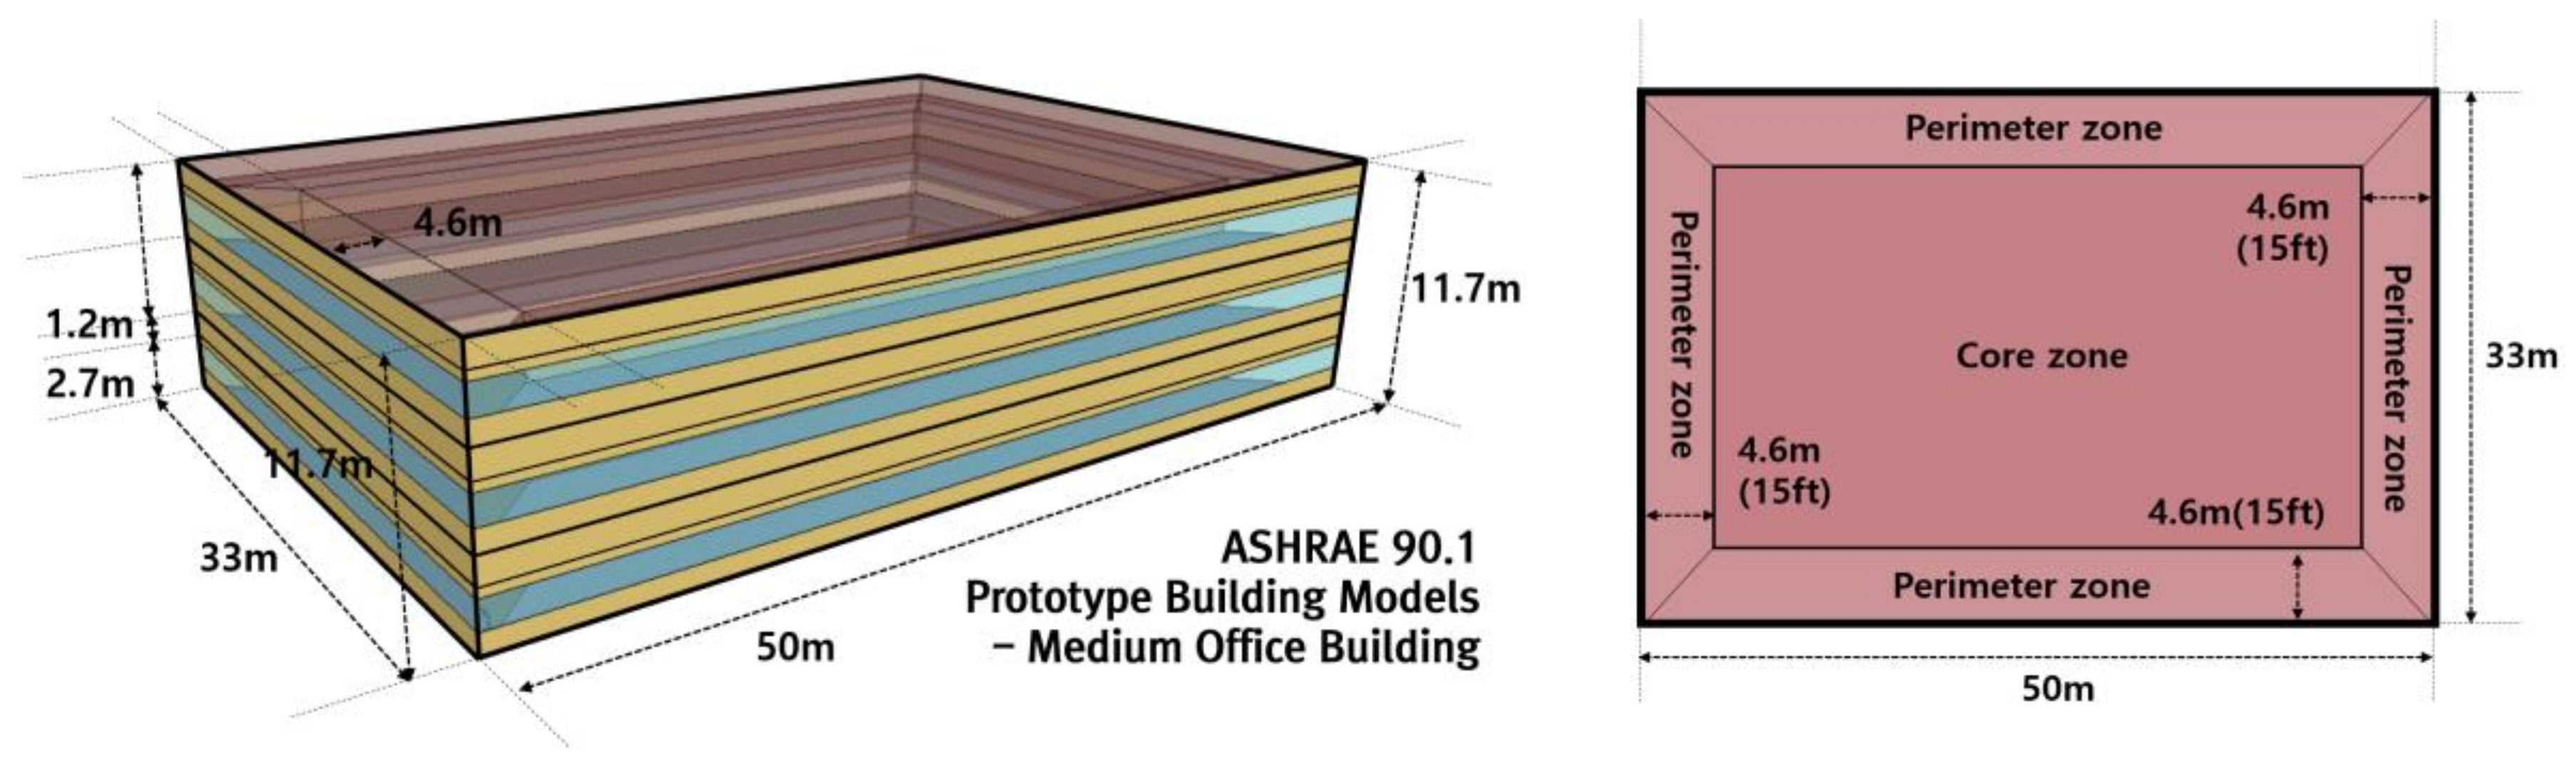
4.1. EnergyPlus Simulation Analysis Model and Input Conditions

To improve the reliability of the simulation, a reference building representing office buildings in Korea is necessary. Both the U.S. DOE and EU’s Energy Performance of Buildings Directive (EPBD) use a reference or prototype building concept for simulation purposes.
In other words, standard models are suggested so that users can flexibly apply factors such as different criteria and weather conditions for each country, building energy performance criteria, and efficiency of HVAC systems. The DOE developed a prototype building, and the DOE’s National Renewable Energy Laboratory reports [36] that these models serve as a baseline for comparing and improving the accuracy of energy simulation software.
Therefore, as a base model for this study, to reflect Korean building standards, codes, climate, etc., we used the DOE’s ASHRAE 90.1 prototype models (medium office) which offer simulation accuracy and convenience. Figure 9 shows information of the simulation base model.
Table 6 lists the building envelope performance conditions used in the base model for the EnergyPlus simulation and details of the air-conditioning and plant systems and input conditions. We applied the Korean energy-saving design standard (KESDS) [58] for the envelope conditions with respect to the walls, roof, and floor of the base model.
For the equipment, lighting load and occupancy density, we used a report from a survey of existing buildings in Korea conducted by the Ministry of Trade, Industry and Energy (MOTIE) and the Korea Institute of Civil Engineering and Building Technology (KICT) [59]. As the base air-conditioning system, we used a constant air volume (CAV) system commonly used in Korea and adopted an absorption chiller–heater (cooling coefficient of performance (COP) 1.0, heating COP 0.8) as the plant system [60]. To reflect the effect of global warming in Korea over the past five years, we applied EnergyPlus with the outdoor temperature and humidity, wind velocity, atmospheric pressure, solar radiation, cloud cover, and precipitation data provided by the KMA [44]. We converted these KMA data into an EPW format weather data file [48] for use in EnergyPlus.
Table 7 shows the primary energy consumption in Incheon and Jeju for the base model, which we analyzed using EnergyPlus. We evaluated the primary energy consumption of Incheon and Jeju to be 464.1 kWh/m²a and 485.1 kWh/m²a, respectively, both of which correspond to level 5 in BEECS [42]. We determined Incheon’s heating energy consumption to be greater than that of Jeju, and Jeju’s cooling energy consumption to be greater than that of Incheon. The KEA and Korea Appraisal Board (KAB) [61] database indicates that the average actual primary energy consumptions of general office buildings in Incheon and Jeju range between 457–489 kWh/m²a. Thus, the simulation results confirm that the base model’s primary energy consumption (464.1, 485 kWh/m²a) met the 457–489 kWh/m²a range requirement of the KEA and KAB database for primary energy consumption of general office buildings. In Section 4.2, we describe the selection of energy saving technologies based on this data.

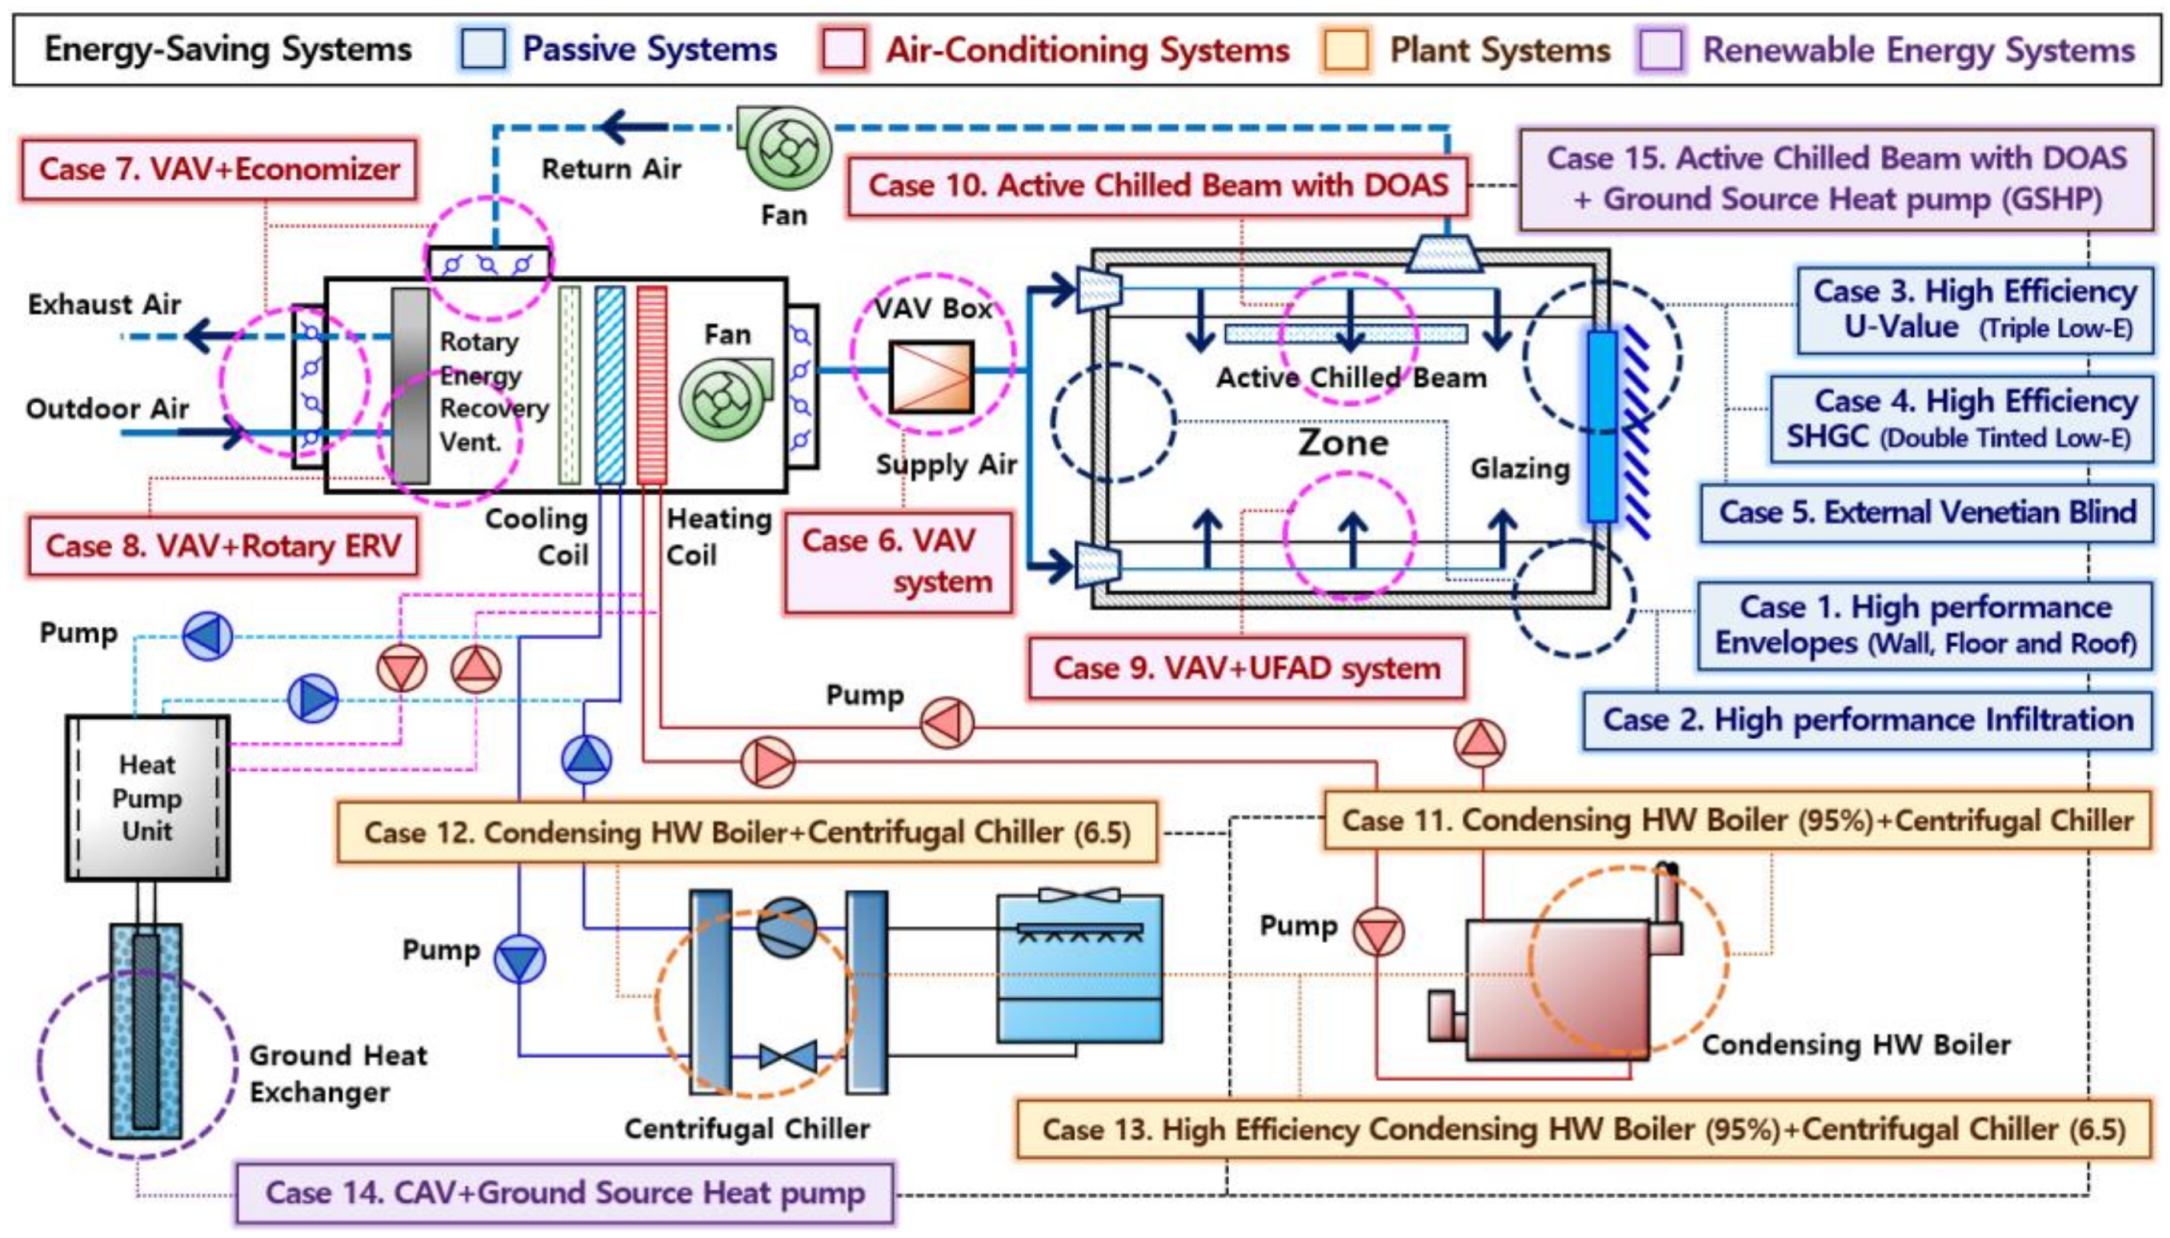
4.2. Selection of Energy-Saving Technologies for High-Performance Building

The energy-saving technologies for buildings can be divided into passive, active, and renewable energy systems. Passive systems control the flow of heat through the building itself via architectural elements such as walls, windows, doors, and window shades. The objective of these technologies is to create an indoor environment that optimizes the architectural functions rather than depending on HVAC systems. Active systems refer to HVAC systems that obtain the building energy required from an energy source that is then converted via building equipment.
For these systems, maximizing equipment efficiency, minimizing energy loss, and using appropriate control methods are important. Last, renewable energy systems minimize the energy requirements of buildings by utilizing renewable energy. Figure 10 and Table 8 show a diagram high-performance technologies and their specific input values.
In this study, we grouped energy-saving technologies into passive, active, and renewable energy systems with 15 case models. We selected energy-saving technologies based on previous research on high-performance buildings [13,14,15,16,17,33,34,35], and to ensure universality, we also considered the practicality of the system design. We input the performance of each technology based on the KESDS [58] and the passive-level building criteria [62] of developed countries.

4.2.1. Selection of Passive Systems (Cases 1–5)

Below, we describe the energy-saving technologies that we selected for classification into passive systems (cases 1–5). Case 1 is improvements in the thermal performance of the building envelope (wall, roof, and floor). The thermal transmittance (U-value) specified by the passive building certification criteria [62] is 0.15 W/m²·K or less. The U-value specified by the Korean energy-saving design standard (KESDS) [58] since 2016 for the central region (Incheon) is 0.26 W/m²·K or less for the side wall, 0.22 W/m²·K or less for the floor, and 0.15 W/m²·K or less for the roof. In addition, the U-value for Jeju is 0.43 W/m²·K or less for the side wall, 0.33 W/m²·K or less for the floor, and 0.25 W/m²·K or less for the roof. Therefore, we set the base model according to the current Korean standards for Incheon and Jeju. In the simulations, we improved the U-value by up to 0.15 W/m²·K.
Case 2 is reinforcement of the air-tightness of the building envelope. The air-tightness for passive-level buildings specified in the passive building certification criteria [62] is 0.6 ACH50 or less. The minimum air-tightness performance level according to the revised 2013 KESDS is 3.0 ACH50 [63]. Therefore, in the simulation, we set the base model to 3.0 ACH50 and then reinforced it to 0.6 ACH50, which is the standard for passive buildings.
Cases 3 and 4 are high-performance glazing systems. The thermal transmittance (U-value) for glazings specified by the passive building certification criteria is 0.8 W/m²·K or less. The thermal transmittance (U-value) specified by the KESDS (2016) [58] is 1.5 W/m²·K or less for the central region (Incheon) and 2.0 W/m²·K or less for Jeju. Therefore, we set double low-e glass as the base model, which has a thermal transmittance that satisfies the current criteria for both the central region (Incheon) and Jeju. We improved the glazing system to triple low-e in case 3 and double tinted low-e in case 4. Compared to ordinary glass, the low-e glass used in this study reduces the inflow of solar heat gain in summer days and reduces the indoor heat loss during winter.
The triple low-e glass of case 3 is low-e glass with enhanced thermal transmittance (U-value), and the double tinted low-e glass of case 4 is low-e glass with an enhanced solar heat gain coefficient (SHGC) [64].
Case 5 is an external venetian blind system in which the thermal and optical performance of the glazings can be controlled. The KESDS (2016) [58] specifies that the average solar heat gain per unit area of the envelope for a reduction in the cooling load should be less than 14 W/m2. Based on the results of a relevant preceding study [64], we applied a slat angle of 45° for the external venetian blinds and glazing type (double low-e) that satisfy the standards.

4.2.2. Selection of Active Systems (Cases 6–13)

To select specific technologies as improvement measures, we categorized air-conditioning and plant systems as active systems. When evaluating air-conditioning systems, the absorption chiller-heater (cooling COP 1.0, heating COP 0.8) was used as the base plant system. The CAV system, a base air-conditioning system, was then replaced with alternative air-conditioning systems for cases 6–10 to evaluate their energy saving contribution. Similarly, the CAV system was used as a base air-conditioning system when evaluating plant systems. The energy saving rate was evaluated after replacing a base absorption chiller-heater system to alternative plant systems for cases 11–13.
(1) Active Systems: Air-conditioning Systems (Cases 6–10)
Below, we describe the energy-saving technologies for air-conditioning systems (cases 6–10) in an active system. Case 6 is a variable air volume (VAV) system that controls the air flow rate according to the load variation in the room. Since there are both heating and cooling seasons in Korean climate, seasonal air-flow rate and control logic are critical factors for heating and cooling processes. The VAV dual maximum control logic selected for this study is capable of setting the minimum air-flow rates for cooling and heating to achieve energy savings [65,66]. We used the dual maximum control logic and air-flow rate recommended by previous researchers [65,66], and we set the minimum air-flow rate for the cooling season to 20% of the maximum heating air-flow rate and the minimum heating air-flow rate to 50% of the maximum cooling air-flow rate.
Case 7 is a combined VAV–economizer system. The economizer is a system that uses outdoor air cooling based on the relative difference between the temperatures or enthalpies of the zone’s return air and outdoor air. In this study, we applied differential enthalpy control, a method reported to be efficient for hot and humid regions like that of Korea [67,68], for the cooling season (June–August) and the intermediate season (March–May, September–November). This control logic is designed to operate the economizer when the outdoor air’s enthalpy is lower than that of the return air. With reference to preceding research [67,68], we did not apply outdoor air cooling during the heating season (December–February).
Case 8 is a combined VAV–rotary energy recovery ventilation (ERV) system. The ERV is a new air-to-air ventilation system that recovers heat energy from the outside at the time of cooling, heating, and ventilation. The ERV provides recovered energy to the indoors. The latent heat exchange efficiency of the ERV is specified to be 75% or above in the passive building certification criteria [62] and the Air-Conditioning, Heating, and Refrigeration Institute (AHRI) [69] certification criteria. In Korea’s high-efficiency energy equipment certification criteria [70], the maximum sensible and latent heat exchange efficiencies are specified to be at least 90% and at least 70%, respectively.
Based on the above, we set the sensible and latent heat exchange efficiencies of the ERV system to be 90% and 75%, respectively. We applied heat recovery control during the cooling season (June–August) and heating season (December–February). For the intermediate seasons, when there is no difference in the indoor and outdoor temperatures and humidities (April–May, September–November), so we applied by-pass control without heat recovery [71,72].
Case 9 is a combined VAV–under floor air distribution (UFAD) system. The UFAD systems are occupied-zone-based air conditioning systems that generally offer advantages over ceiling-based air distribution (CBAD) systems in terms of energy efficiency and thermal comfort [73]. Currently, office buildings in the UFAD systems of developed countries conduct cooling and heating of occupied zones by using access floors. This method has also been applied in some new office buildings in Korea and relevant studies were conducted. In this study, as a reference for our simulation, we used the results of previous studies [74,75,76] regarding the energy-saving effect of the UFAD systems in Korea’s climate conditions to set the air supply temperature and a pressurized air supply type diffuser (core zone: swirl type, perimeter zone: linear bar grille type).
Case 10 is an active chilled beam with dedicated outdoor air system (DOAS). The chilled beam is an air-conditioning system that utilizes the cooling and heating effects of convection by connecting a water pipe to a unit containing heat exchangers. Chilled beams are mainly installed and operated in developed countries in Europe and North America, but a number of these systems have been applied in new office buildings in Southeast Asia and Korea, too. The Federation of European Heating, Ventilation and Air Conditioning Associations (REHVA) sets design standards based on European climate [77]. However, there are not enough well-defined regulations specific to chilled beams in Korea. Thus, as a reference, we used the REHVA standard and the results of previous studies [78,79,80] that verified the energy-saving effect of chilled beams in Korean climate to set the entrance temperature for hot–cool water. We installed the most common two-way diffusion chilled beam, and we used the outdoor air pre-processed by the DOAS as a primary air for the chilled beam [77].
(2) Active Systems: Plant Systems (Cases 11–13)
Plant systems categorized as active technologies (cases 11–13) are the condensing HW boiler + high efficiency centrifugal chiller. The absorption chiller–heater we set as the base model is widely used in Korea since it can both cool and heat. However, it has a disadvantage of having a lower heat efficiency and higher energy consumption compared to other plant systems. Developed countries typically apply high-efficiency centrifugal chillers that are more energy efficient and have lower CO2 emissions, along with a condensing HW boiler [81,82,83,84]. Thus, we selected the condensing HW boiler + centrifugal chiller model as an alternative for the base-model absorption chiller–heater.
For case 11, we set the efficiency of the HW boiler in the condensing HW boiler + centrifugal chiller to 95%, which is an increase from the base level of 80%. We used this setting based on the fact that KESDS [58] specifies that the boiler efficiency should be 90% or above, and that the maximum efficiency of products currently on the market is 94.1% [85]. In case 12, the COP of the centrifugal chiller in the condensing HW boiler + centrifugal chiller increased from 4.0 to 6.5. We used this setting based on the fact that KESDS [58] specifies that the chiller COP should be 5.18 or above and that the maximum COP of the products currently on the market is 6.5 [86]. Case 13 enhanced both the condensing HW boiler efficiency (80→95%) and the centrifugal chiller COP (4.0→6.5).

4.2.3. Selection of Renewable Energy Systems (Cases 14–15)

The renewable energy element technology that we applied in cases 14–15 consists of a ground-source heat pump (GSHP) that utilizes geothermal energy. The use of a geothermal heat pump is becoming widespread in Korea. The Act on the Development, Utilization and Promotion of New Renewable Energy was established in 2004 (last amended in 2014) to promote the development and use of renewable energy technologies [87]. KS B ISO 13256-2 [88], the criteria for the evaluation of equipment according to the Act on the Development, Utilization and Promotion of New Renewable Energy, specifies cooling and heating COP values to be no less than 4.10 and 3.45, respectively. Hence, we applied water-to-water-type GSHP with a heating COP of 4.5 and cooling COP of 3.5 as an upgraded alternative. When using geothermal energy from a GSHP, the air-conditioning systems we applied were the CAV system in case 14 and the active chilled beam with DOAS in case 15.
In Section 5, we describe the energy consumption results of each of the above technologies (cases 1–15) and explain their energy-saving principles.

5. EnergyPlus Simulation Results

5.1. Analysis of the Primary Energy Consumptions in Passive Systems

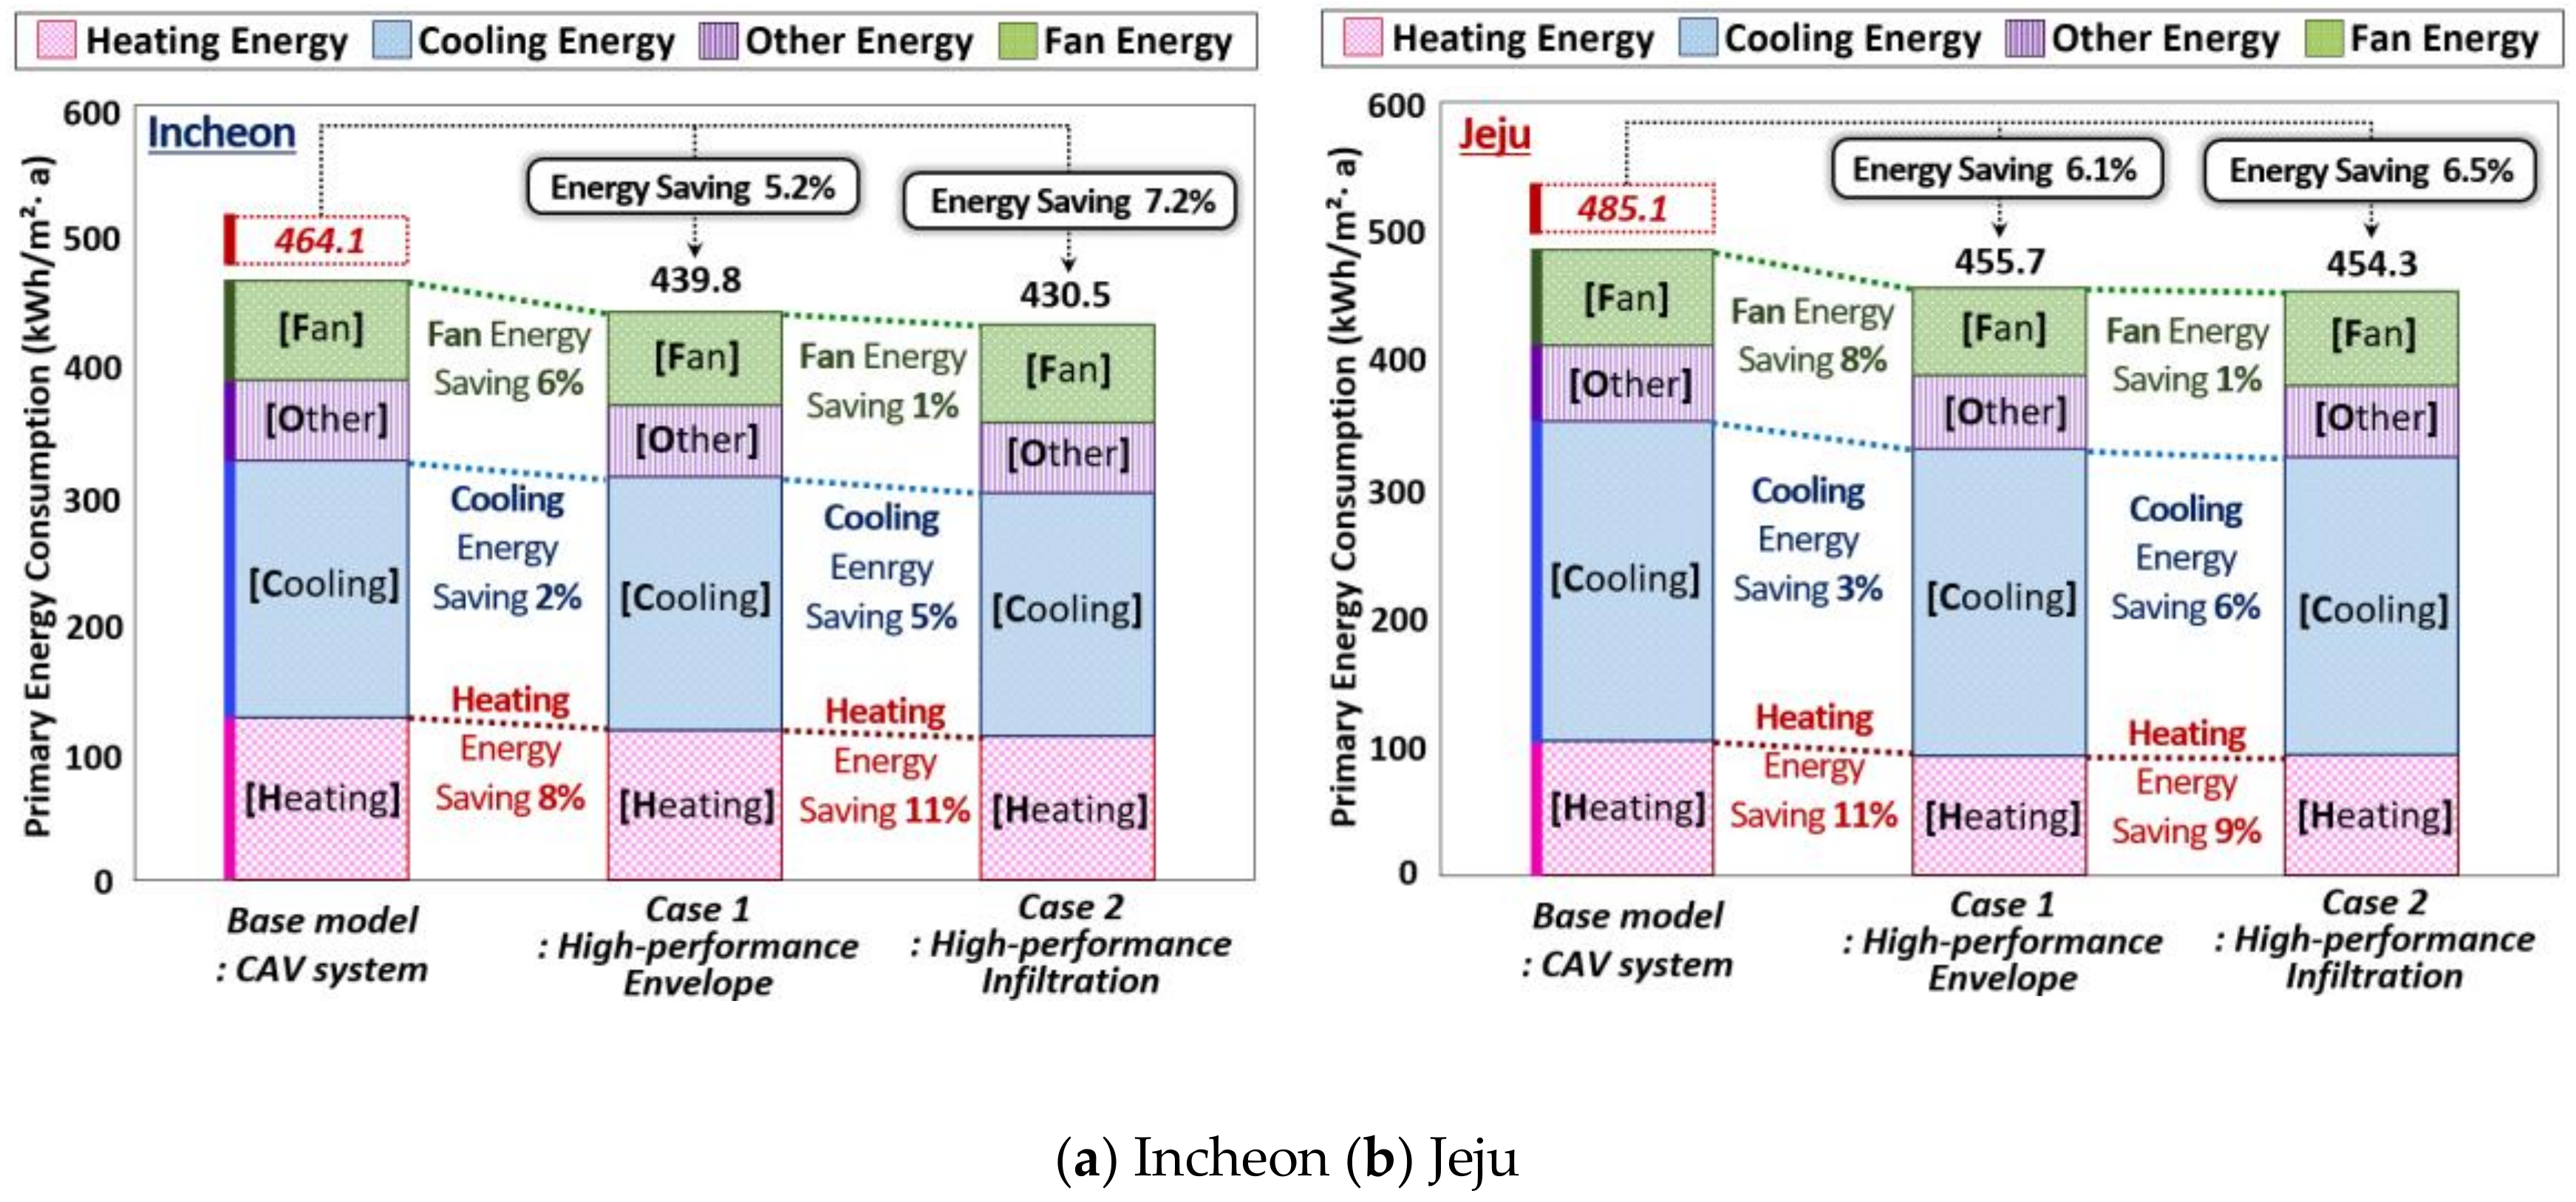
5.1.1. Simulation Results for Case 1 and Case 2 (High-Performance Envelopes and Infiltration)

Case 1, shown in Figure 11, demonstrates the results of reinforcing the building envelope’s thermal insulation performance, such as walls, floor, and roof.
In Incheon (a), the annual primary energy consumption per area was saved by 5.2% compared to the base model. The heating energy saving rate was 8% while the cooling energy rate was 2%. In Jeju (b), the primary energy consumption decreased by 6.1% compared to the base model. The heating energy and cooling energy decreased by 11% and 3%, respectively. Since reinforcing the building envelope’s thermal insulation performance prevents heat loss through conduction, it appears to be more efficient in reducing heating energy. Also, the heating energy reduction rate in Jeju was 3% higher than that of Incheon because the thermal transmittance of Jeju’s base model is lower than Incheon’s resulting in a larger increase in the envelope performance.
As can be seen from case 2 in Figure 11, increasing the envelope’s air-tight performance saved the primary energy consumption per area in Incheon (a) by 7.2% compared to the base model. The heating energy saving rate was 11%. In Jeju (b), the primary energy consumption decreased by 6.5%, and the heating energy decreased by 9%. Reinforcing the building envelope by reducing its air-tight performance to less than the passive building’s level of 0.6ACH50 prevented heat loss due to infiltration, which resulted in a reduction in the heating energy being greater than that in the cooling energy. Improving the air-tight performance improved the heating energy reduction in Incheon more than in Jeju and this appears to have been caused by Incheon’s larger HDD.

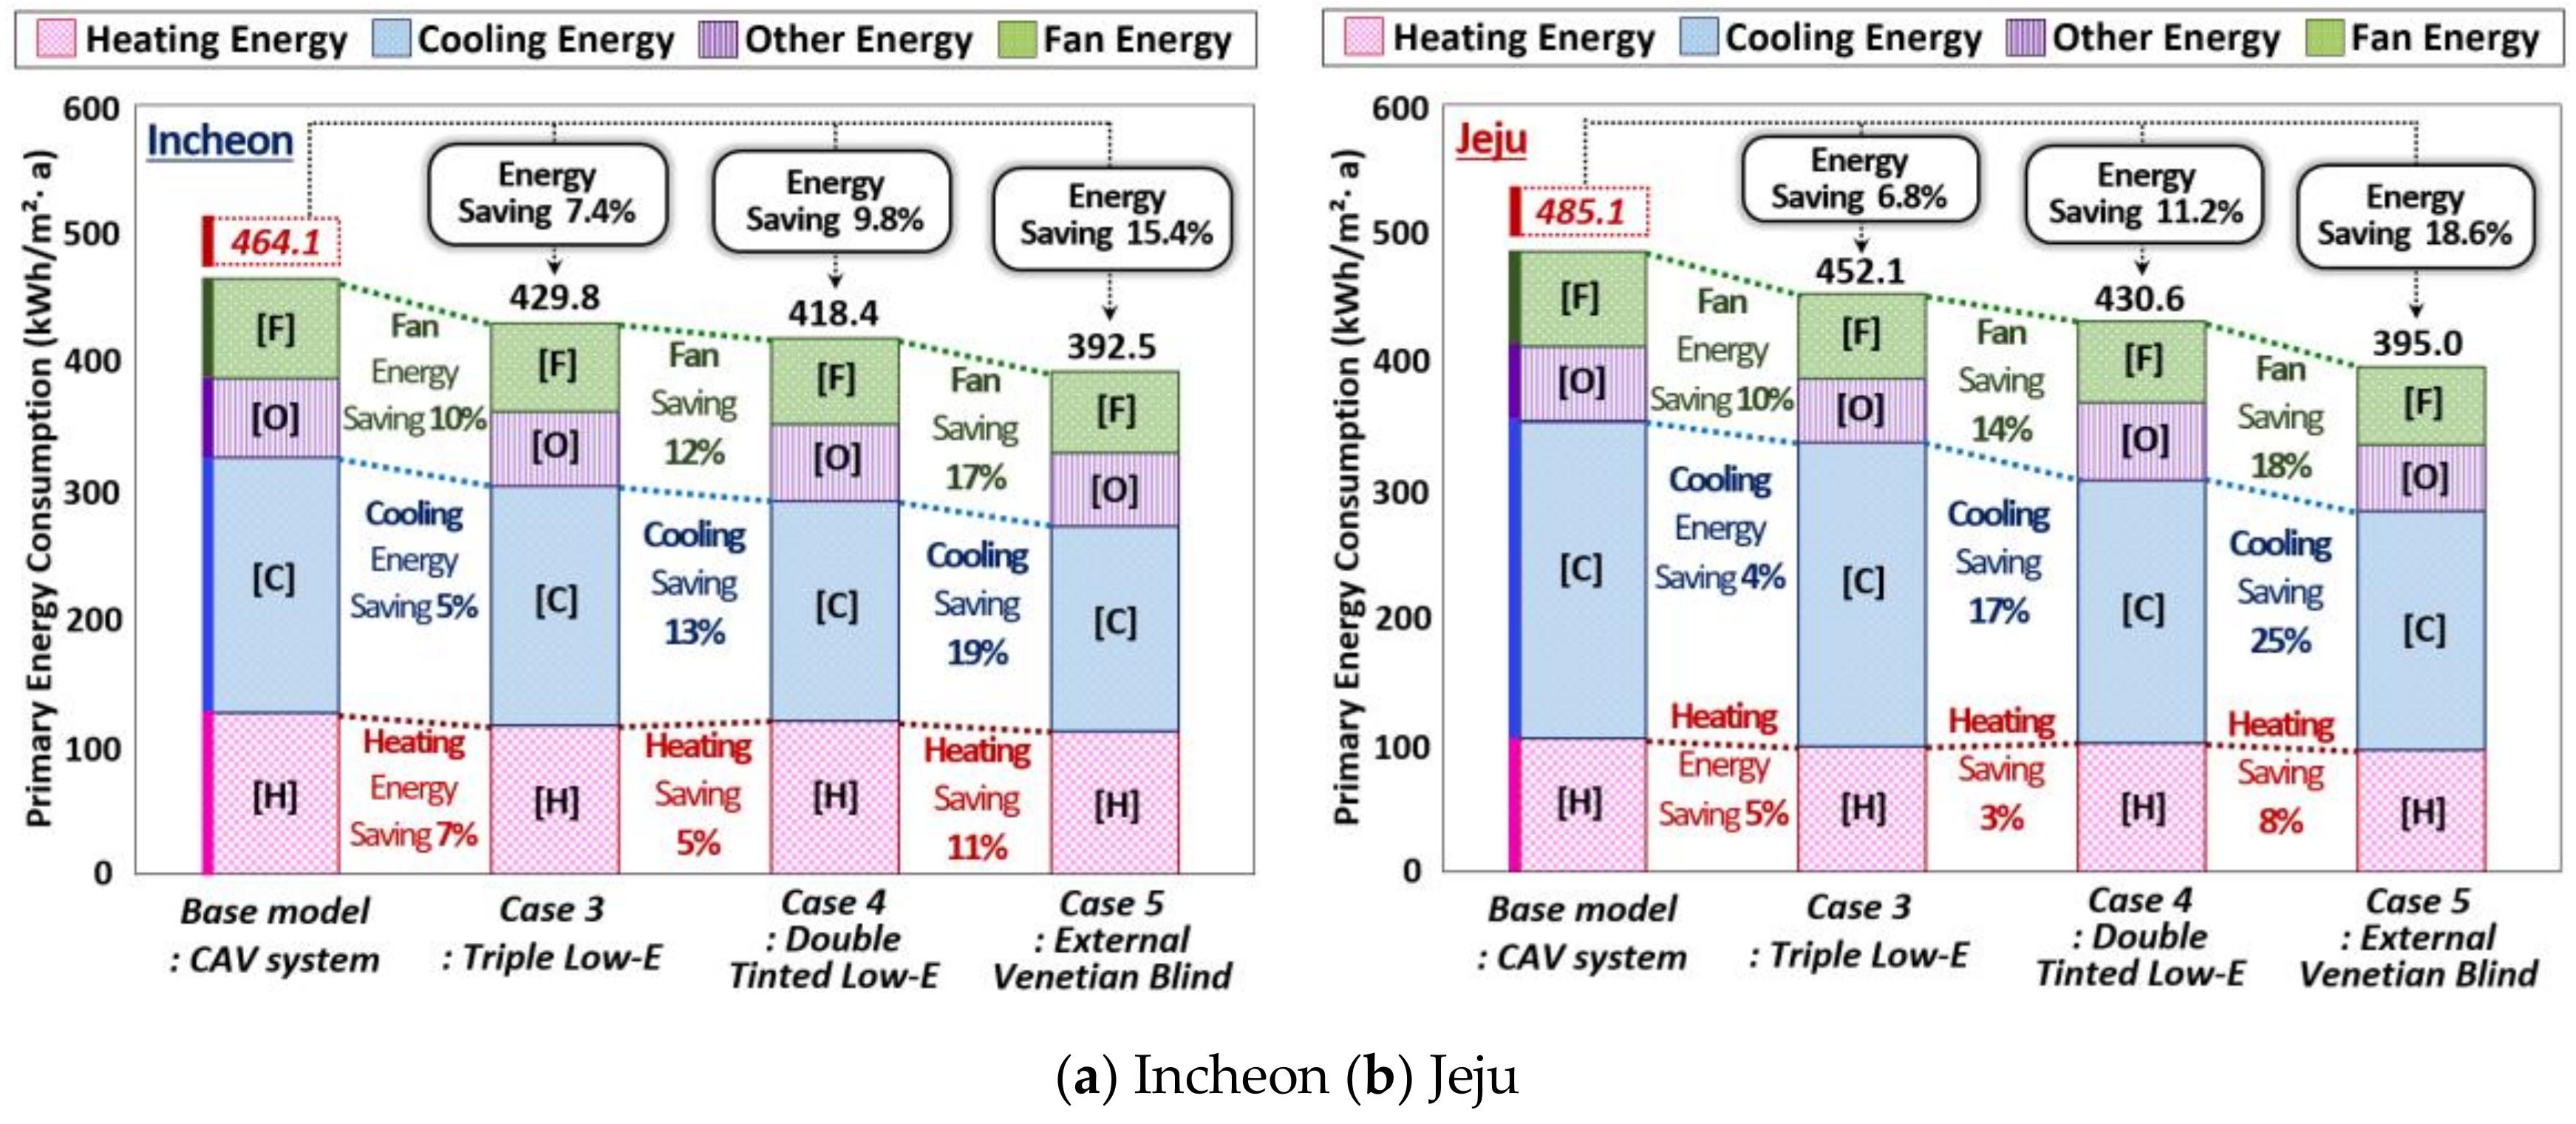
5.1.2. Simulation Results for Case 3, Case 4, and Case 5 (High-Efficiency Glazings and Shading Systems)

In Figure 12, the results from case 3 when the glazing’s thermal transmittance (U-value) improved by using the triple low-e are shown.
In Incheon (a), the primary energy consumption per area decreased by 7.4% compared to the base model. Case 4 shows that when the SHGC improved double tinted low-e was used, there was a saving of 9.8% in the primary energy consumed in Incheon and 11.2% in the same application in Jeju. In this way, case 3 showed better heating energy savings in Incheon (5%) due to the larger HDD. In case 4, the heating energy savings were greater in Jeju (17%), where the CDD is greater, than in Incheon (13%). When comparing the energy saving rate of each element, case 3 appears to be slightly better the for the heating energy savings, and case 4 is better when focusing on cooling energy saving during the cooling season. In climates like Korea where the four seasons are distinct, combining the two thermal performance appropriately is better than focusing on one method, since the U-value and SHGC performance are both important. Case 5, in Figure 12, demonstrates the results of installing external venetian blinds. The primary energy consumption per area in Incheon (a) decreased by 15.4%. The heating energy came down by 11%, while the cooling energy decreased by 19%. In Jeju (b), the primary energy consumption decreased by 18.6%. The heating energy saving rate was 8%, while the cooling energy saving rate was 25%. Solar control shading systems, such as external blinds, are effective in saving cooling energy by reducing the solar heat gain during the cooling seasons, and such systems were more effective in Jeju, with a higher HDD, than in Incheon. While venetian blinds can provide insulation effect during winter, its effectiveness in saving heating energy was less than that in saving cooling energy.

5.2. Analysis of the Primary Energy Consumptions in Active Systems

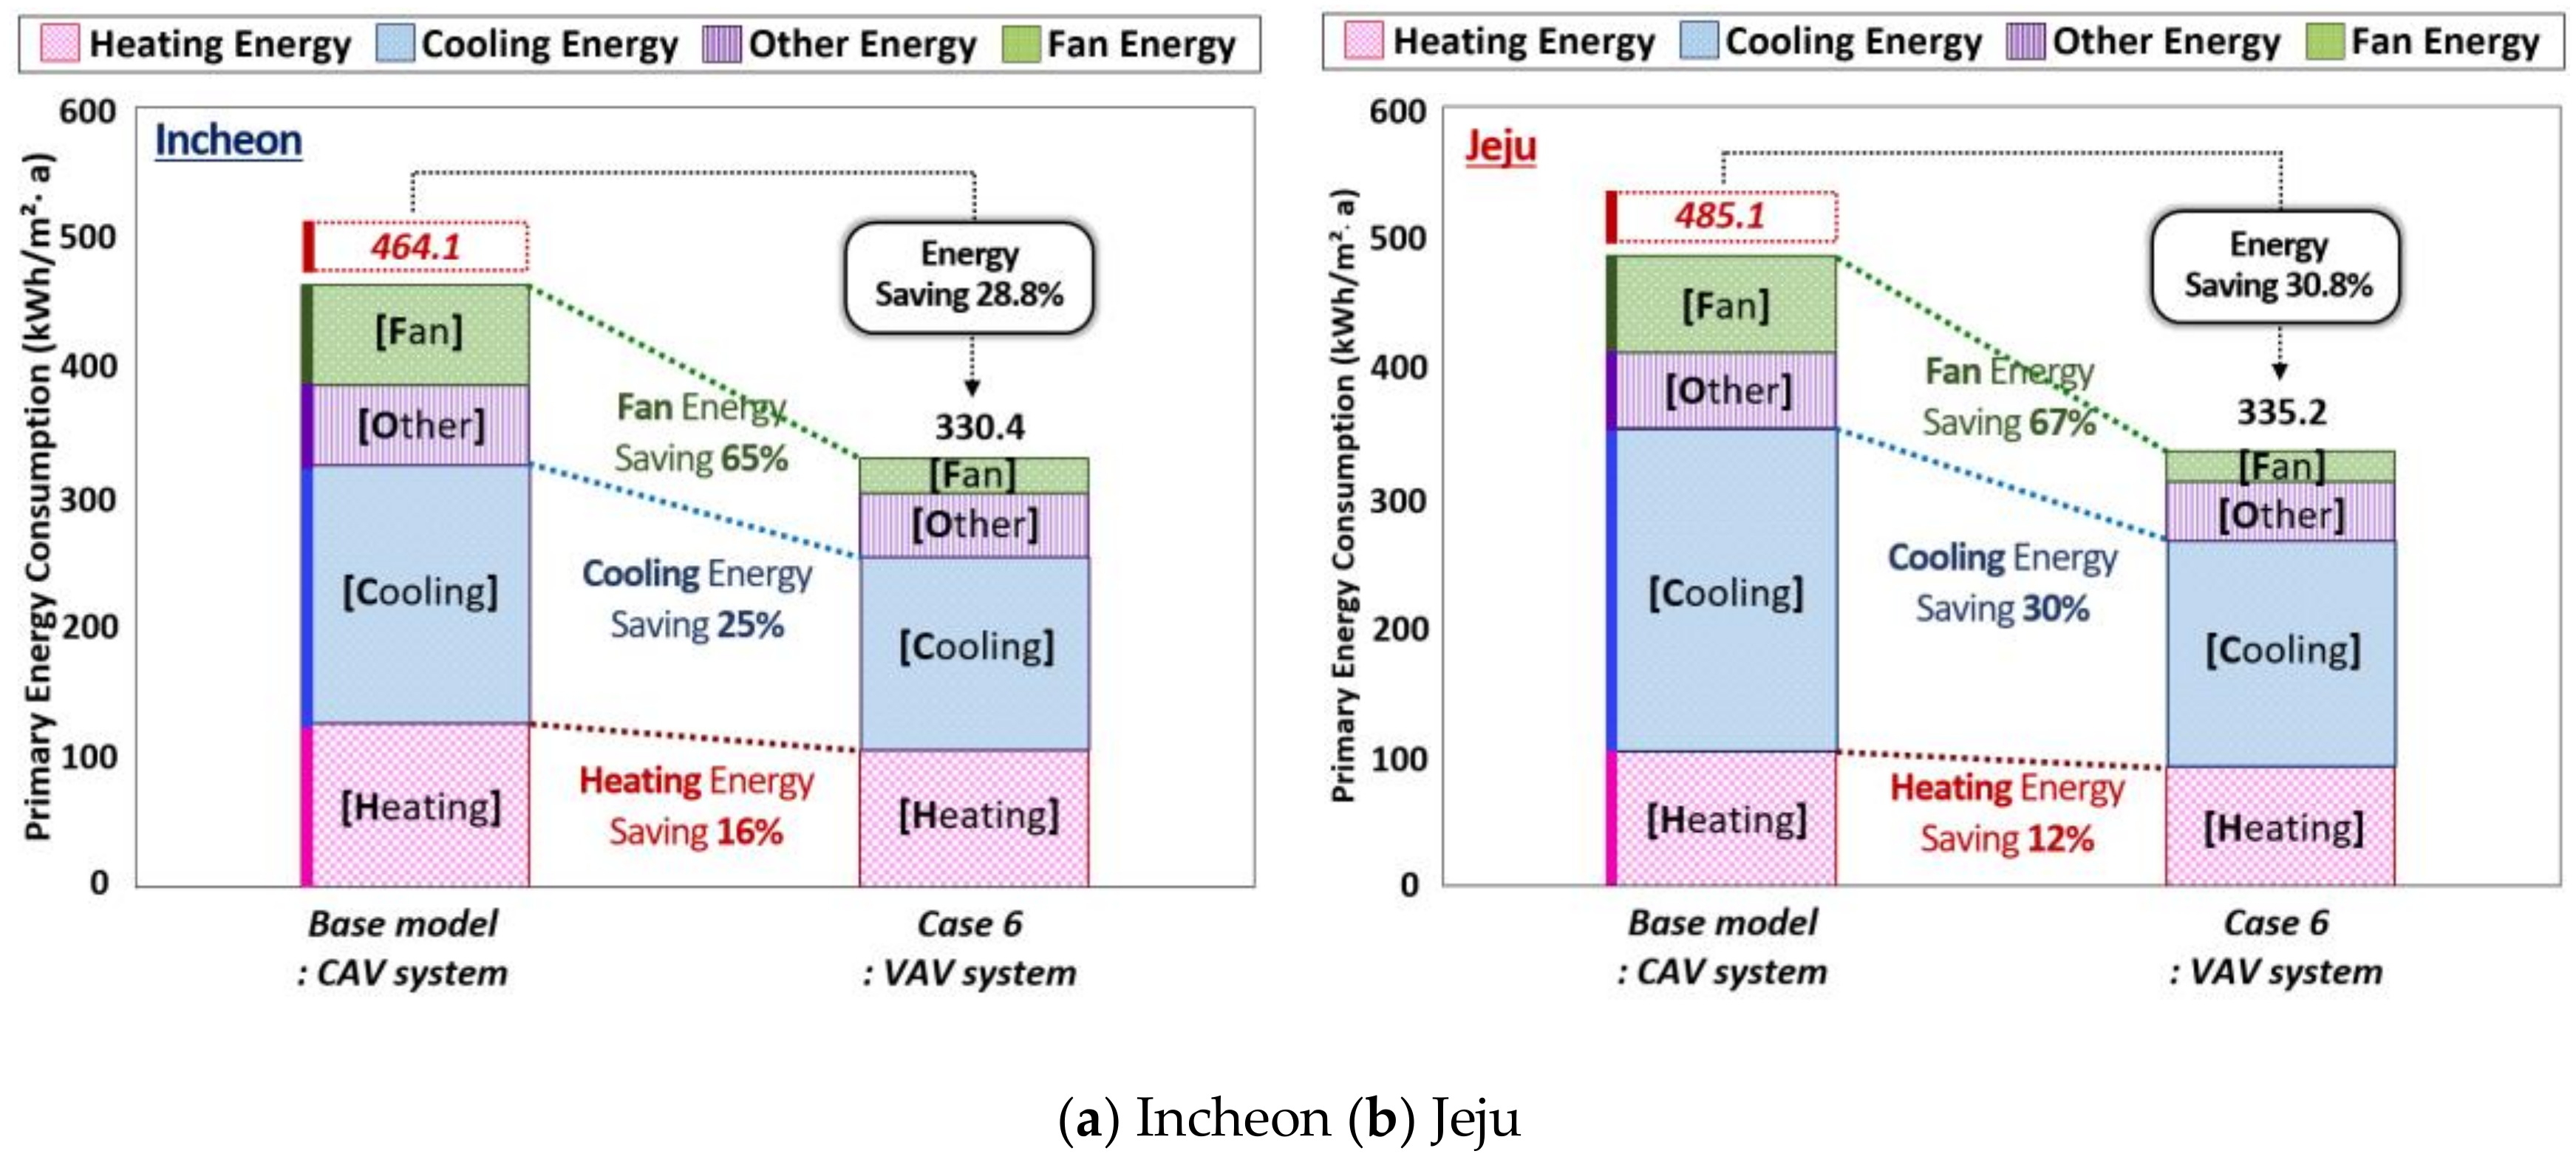
5.2.1. Simulation Result for Case 6 (VAV System with Dual Maximum Control Logic)

For case 6, Figure 13 shows the results of replacing the CAV system with the VAV system (dual maximum control logic). When the CAV system was replaced by the VAV system, the primary energy saving rate was 28.8% in Incheon and 30.8% in Jeju. The heating energy saving rate in Incheon was 16%, and 12% in Jeju. The cooling energy saving rate in Incheon was 25%, while it was 30% in Jeju. In particular, the fan energy saving rate was large such as 65% in Incheon and 67% in Jeju. Unlike the CAV systems, which supply a constant airflow at a variable temperature, the VAV systems vary the airflow at a constant temperature. In other words, a VAV system controls the indoor temperature by changing the air flow rate according to a part-load ratio. Hence, the fan is controlled by a static pressure sensor that detects the changes in pressure caused by the changes in the air flow rate.
The VAV system can conserve heating and cooling energy since the air flow rate is adjusted according to the thermal load. The energy saving rate is especially large for fan energy. Also, in the Korean climate, cooling energy savings were comparatively larger than the heating energy saving when a VAV system was installed. This is because the system is operated more frequently during the cooling season than in the heating season and the internal loads (equipment, lighting, and people loads) contribute to higher indoor temperatures. This also appears to be the reason why the cooling energy saving rate was higher in Jeju, where CDD is larger, than in Incheon.

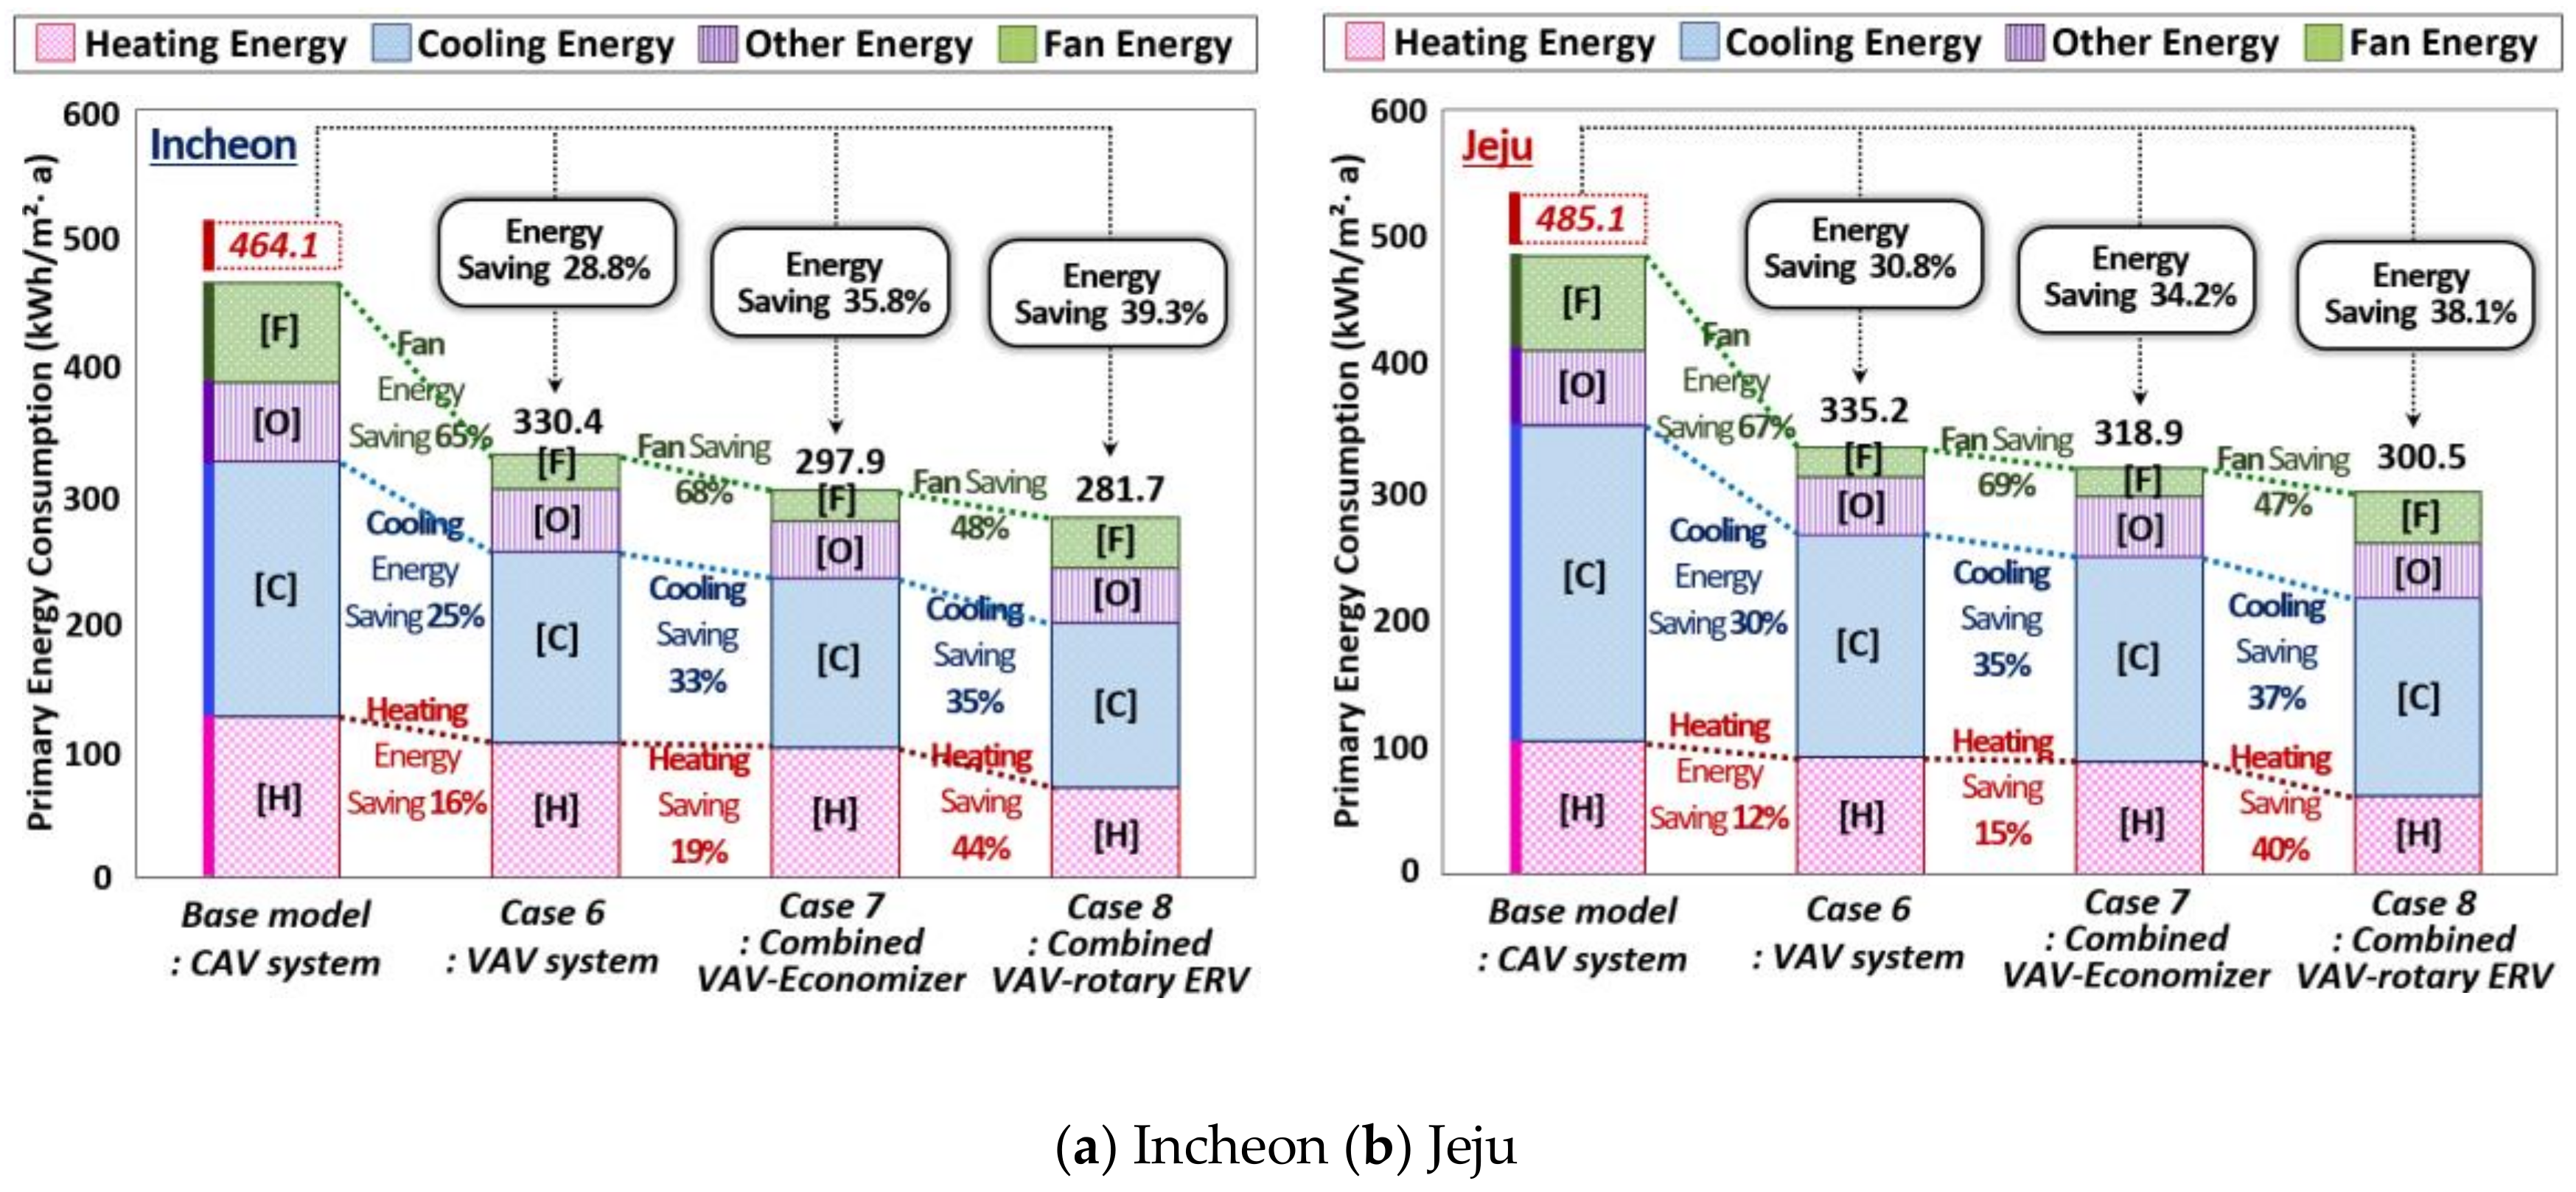
5.2.2. Simulation Results for Case 7 (Economizer Enthalpy Control) and Case 8 (Rotary ERV with VAV System)

In case 7, shown in Figure 14, the results of combining the economizer (different enthalpy control) with the VAV system can be seen. In Incheon (a), the primary energy per area was saved by 35.8% compared to the base model. The energy saving rate was 19%, 38%, and 68% for the heating, cooling and fan energy consumption, respectively.
In Jeju (b), the primary energy consumption decreased by 34.2%. The heating energy decreased by 15%, the cooling energy by 35%, and the fan energy by 69%. In both Incheon and Jeju, the cooling energy saving rate was higher than the heating energy saving rate.
Enthalpy control [67,68] used in the cooling (May–August) and intermediate (March–May, September–November) seasons can handle the latent heat of outdoor air since it controls the outdoor airflow rate through the damper based on both the outdoor air temperature and humidity. The use of such a control logic can also result in a decrease in the cooling energy by reducing the load on the air-conditioner’s cooling coil, which adjusts the air temperature by introducing outdoor air. The economizer’s enthalpy control can increase the energy efficiency by controlling the outdoor air flow rate when the outdoor air condition in Korea is suitable for cooling (during the intermediate season).
In Figure 14, case 8 shows the results of applying a rotary ERV to a VAV system. The primary energy consumption saving rate was 39.3% in Incheon and 38.1% in Jeju. While an ERV’s energy saving rate is high for both cooling and heating energy in Korean climate, it is comparatively better in heating due to the temperature difference between indoors and outdoors being greater in winter, as well as other factors such as the heat produced by the fans. The heating energy saving rate was higher in Incheon (44%) than in Jeju (40%) due to the larger HDD, and the cooling energy saving rate was higher in Jeju (37%) than in Incheon (35%) due to the larger CDD.
However, the fan energy saving rate was smaller than that seen in case 6 (VAV system) due to the ERV’s rotary wheel operation (65–48% (a), 67–47% (b)).
In a rotary ERV system, cold outdoor air in the heating season and warm indoor air are heat exchanged. The warm indoor air exchanges heat with the cold outdoor air and is subsequently expelled by the rotating wheel. This process reduces the energy used for heating and humidifying. On the other hand, the hot outdoor air in the cooling season and the cool indoor air are heat exchanged. The cool indoor air is expelled after exchanging heat with the hot outdoor air, which reduces the energy used for cooling and dehumidification. In the spring and fall, energy can be saved by utilizing outdoor air without heat exchange through the by-pass control [71,72] used in this study. The technology of recycling waste heat proved to be efficient in saving heating and cooling energies for climates like that of Korea where the heating and cooling seasons are distinct.

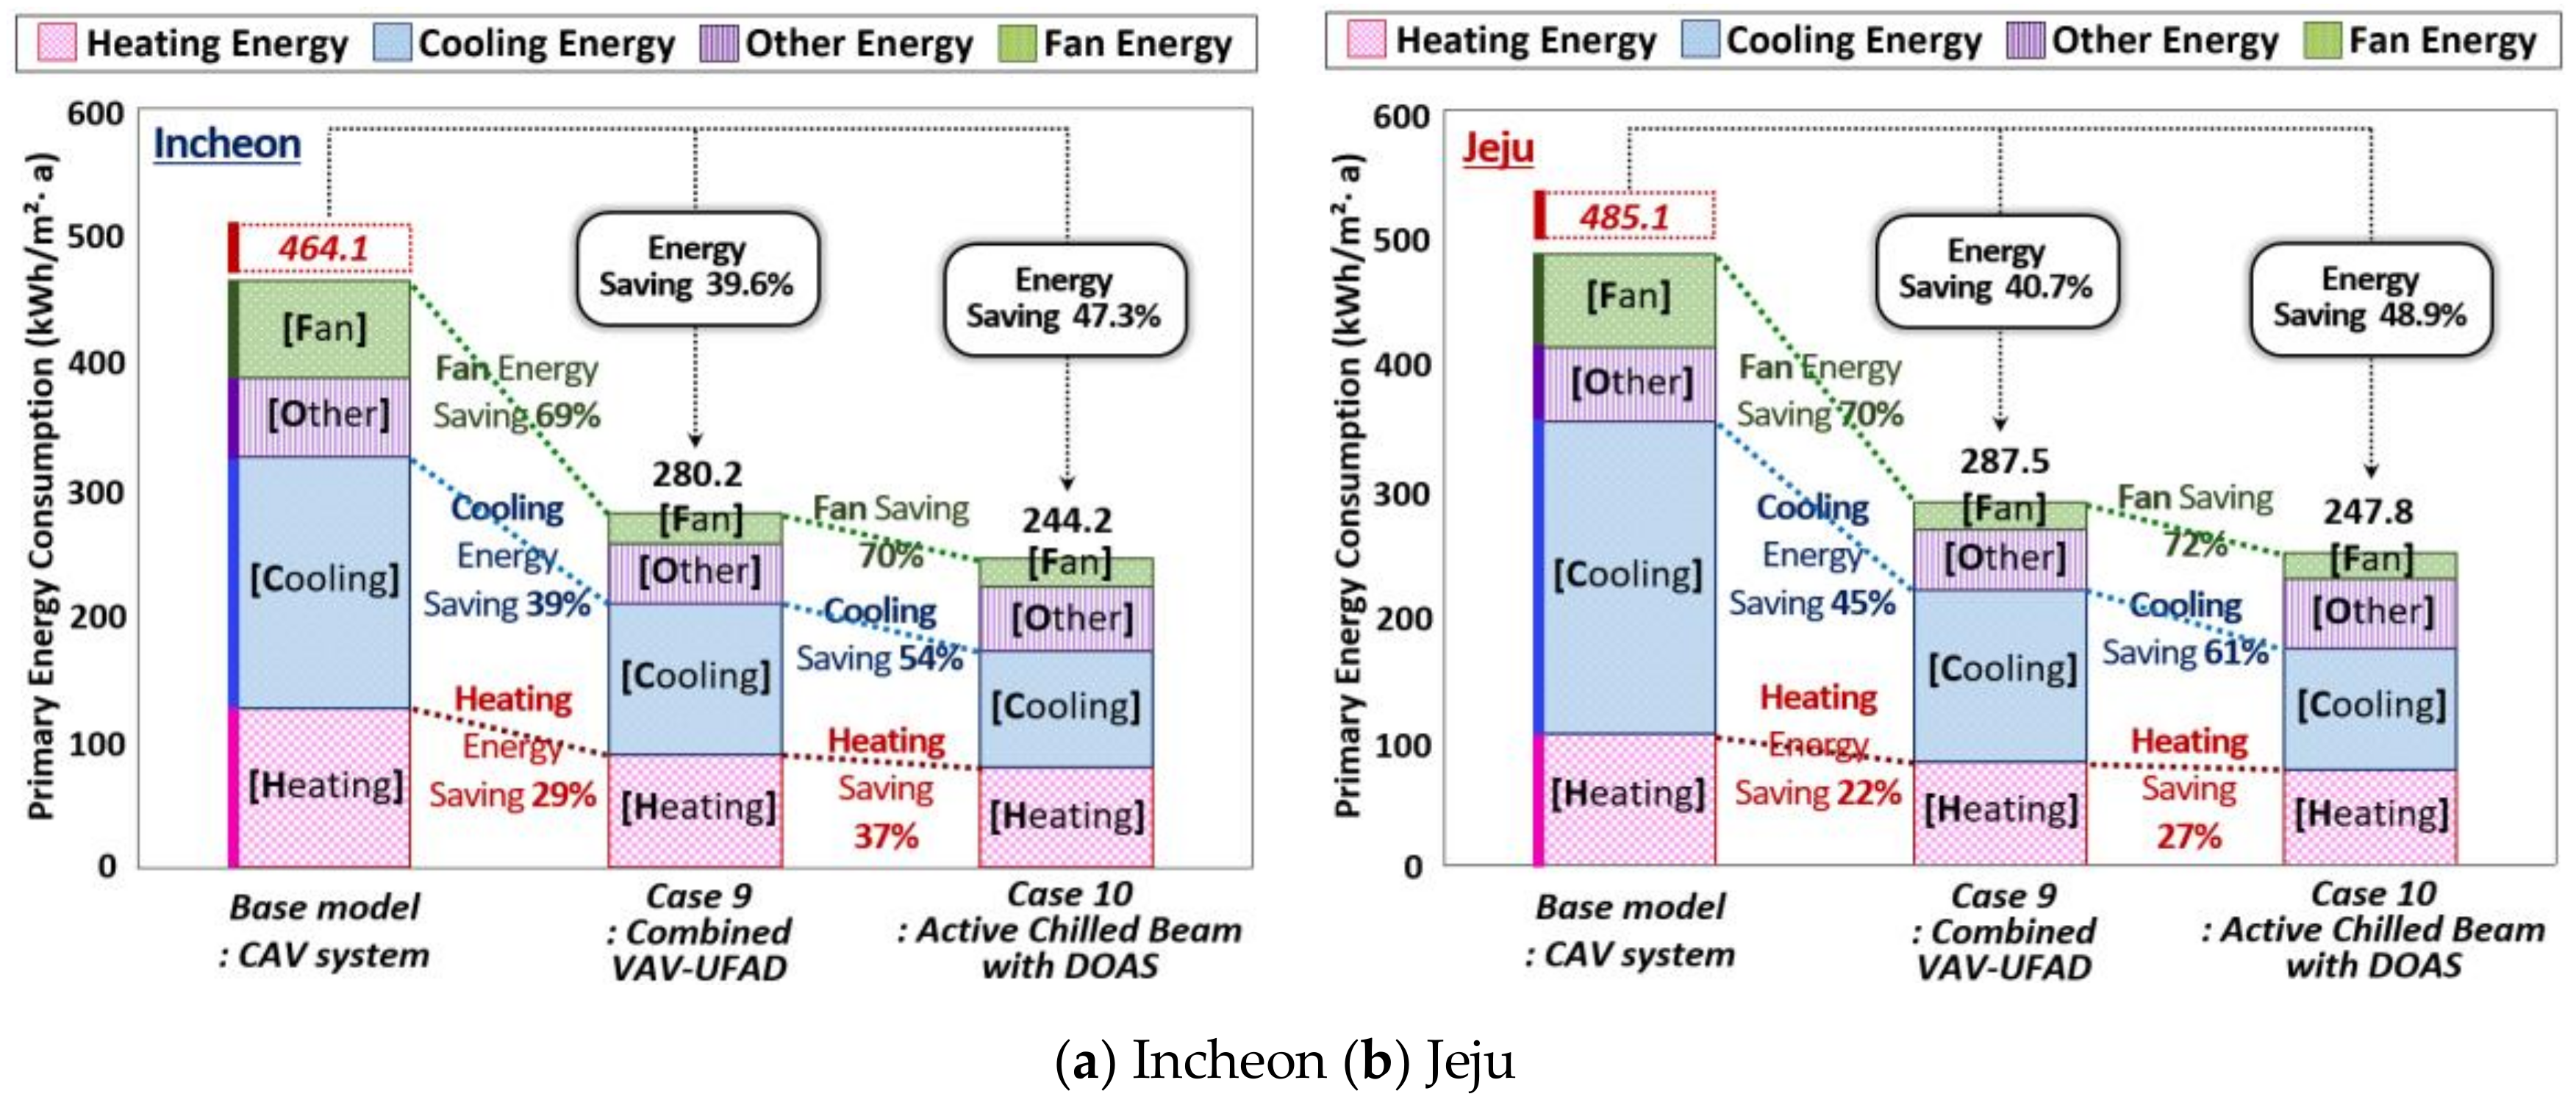
5.2.3. Simulation Results for Case 9 (UFAD with VAV System) and Case 10 (Active Chilled Beam with DOAS)

In Figure 15, case 9 shows the results of applying UFAD to a VAV system. The primary energy consumption saving rate was 39.6% in Incheon and 40.7% in Jeju. The fan energy saving rate in Incheon was 70% and 72% in Jeju. Due to the characteristics of the office conditions, the cooling energy savings were relatively greater than the heating energy savings. The heating energy reduction rate was larger in Incheon (29%) where the HDD is larger, than in Jeju (22%). The cooling energy saving rate was larger in Jeju (45%), where the CDD is larger, than in Incheon (39%).
Since UFAD is a task & ambient air-conditioning system, cooling and heating are only supplied to the occupied zone regardless of the ceiling height. Its supply temperature is 3–5 °C higher than that of the CAV system, which results in a higher operating efficiency of the heat source system. Compared to conventional air-conditioning systems, this system can save fan energy since it can operate with a lower static pressure, slower airflow, and comparatively lower air flow rate. However, its energy saving effect is influenced by factors such as the type and installation conditions of the lighting [77]. This factor should be taken into consideration when designing the system.
In Figure 15, case 10 shows the results of using an active chilled beam with DOAS. The primary energy saving rate was 47.3% in Incheon and 48.9% in Jeju. The heating energy saving rate in Incheon was 37%, and 27% in Jeju.
The cooling energy saving rate in Incheon was 54% and 61% in Jeju. The fan energy saving rate was especially large at 70% in Incheon and 72% in Jeju. Among all air-conditioning systems suggested by the study, the use of this system resulted in the most significant contribution to energy savings. The active chilled beam with DOAS is operated by decoupling the heating/cooling and ventilation. This system is used to introduce the minimum airflow rate required for ventilation through the DOAS. Within the chilled beam, the exchange of heat between the indoor air and water occurs. Consequently, the conveyance energy can be saved due to water’s higher thermal capacity. Such a mechanism is also more effective in reducing fan energy, as it can introduce 3–4 times the amount of indoor air compared to the introduced outdoor air. The lower air flow rate results in a smaller load on the heating/cooling coil, and therefore the heating/cooling energy is saved. However, a careful evaluation of the design and operation is required when using the system in a hot and humid climate to control the latent heat load and condensation.

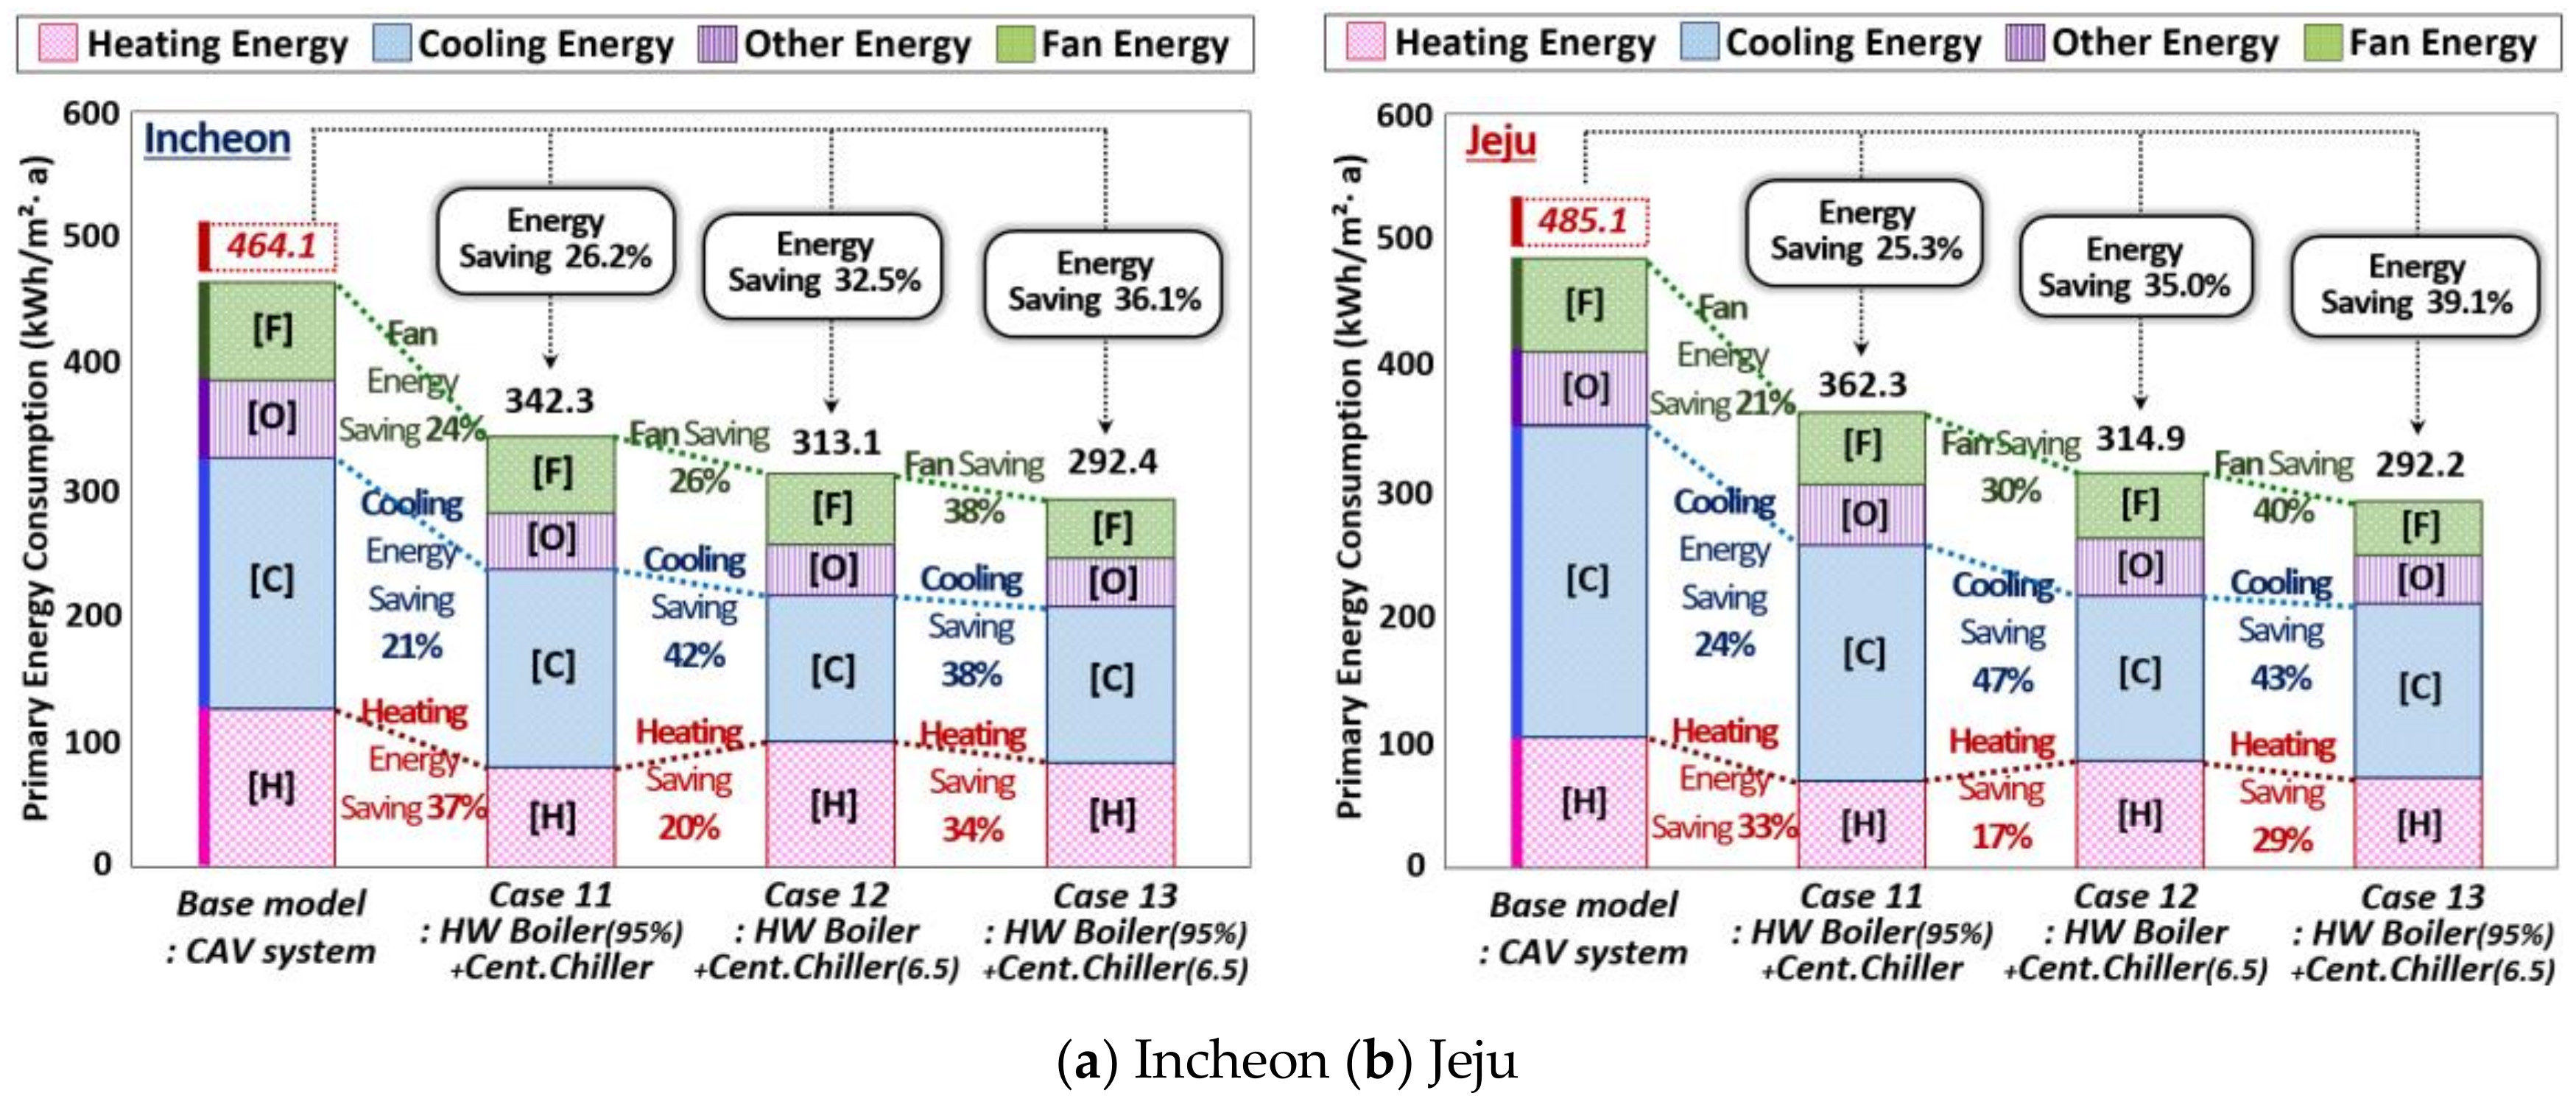
5.2.4. Simulation Results for Cases 11–13 (High Efficiency Condensing HW Boiler And Centrifugal Chiller)

In cases 11–13, as shown in Figure 16, the base model’s absorption chiller-heater was replaced with a highly efficient plant system comprised of a condensing HW boiler and a centrifugal chiller.
Case 11 shows the results of increasing the boiler’s efficiency (80→95%). In Incheon (a), the primary energy consumption was saved by 26.2%. The heating energy saving rate was 37%, and the cooling energy saving rate was 21%. In Jeju (b), the primary energy decreased by 25.3% compared to the base model. The heating energy decreased by 33%, and the cooling energy by 24%. While both regions showed large saving in the heating energy consumption, the reduction in Incheon was comparatively greater due to higher the HDD.
The water vapor contained in the boiler’s exhaust condenses when it comes in contact with the heat exchanger or the cool part of the exhaust vent. This causes condensation heat to be released. A condensing boiler reuses the condensation’s latent heat instead of releasing the exhaust, and this results in a reduction in heat loss, which in turn increases the heat energy saving.
In Figure 16, case 12 shows the results of improving (4.0→6.5) the COP of the centrifugal chiller containing a centrifugal compressor. In Incheon (a), the annual primary energy was reduced by 32.5%, the heating energy was reduced by 20%, and the cooling energy by 42%. In Jeju (b), the primary energy decreased by 35.0%, the heating energy decreased by 17%, and the cooling energy by 47%. Both regions showed a higher reduction in cooling energy. The cooling energy saving rate was higher in Jeju due to its larger the CDD. Increasing the chiller’s COP increases the efficiency of the cooling cycle, which in turn improves the cooling effect. This results in an increased cooling energy savings as well as conveyance energy saving from the improved cooling water circulation efficiency.
Case 13 shows the results of increasing both the boiler’s efficiency (80→95%) and the chiller’s COP (4.0→6.5). In Incheon and Jeju, the primary energy consumption decreased by 36.1% and 39.1%, respectively. The improvements for case 13 contribute to a greater reduction in both cooling and heating energies compared to cases 11 and 12, and significant energy reductions were observed in both regions. Increasing the efficiency of the cooling and heating plant system is an efficient method to reduce energy consumption in climates with four distinct seasons, such as that in Korea.

5.3. Analysis of the Primary Energy Consumptions in Renewable Energy Systems

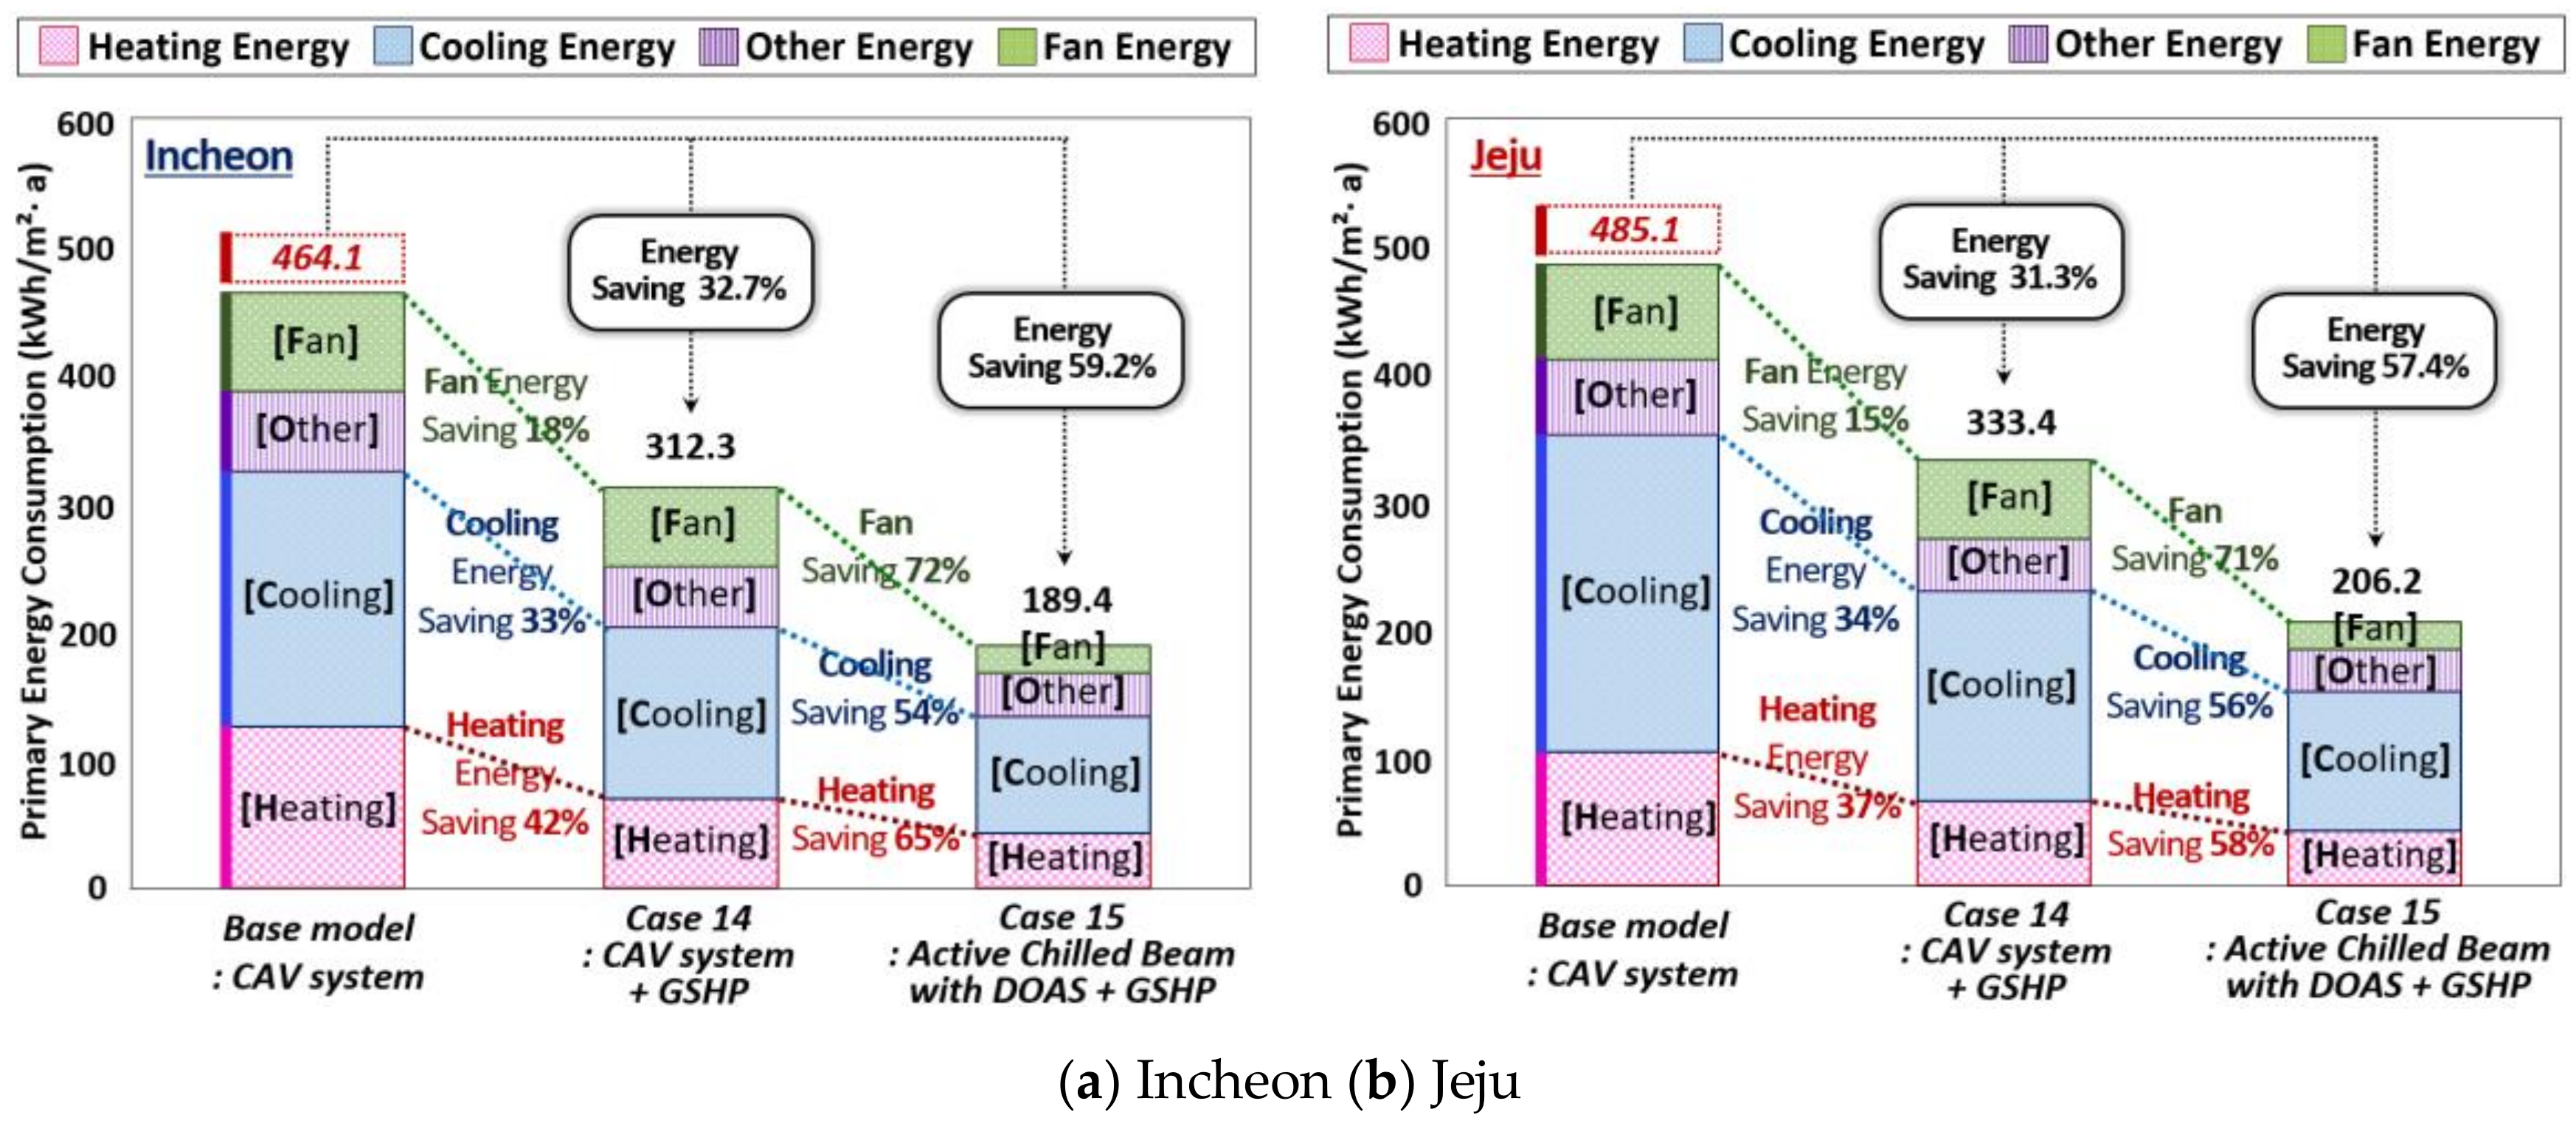
Simulation Result for Case 14 (CAV+GSHP) and Case 15 (Active Chilled Beam with DOAS+GSHP)

In cases 14 and 15, the base model’s absorption chiller-heater was replaced with GSHP. For the air-conditioning system, the CAV system (case 14) and the active chilled beam with DOAS (case 15) were used for the simulation. In Figure 17, case 14 shows that the primary energy consumption per area in Incheon decreased by 32.7% compared to the base model. The energy saving rate was 42%, 33%, and 18% for the heating, cooling and fan energy consumption, respectively.
In Jeju, the primary energy saving rate was 31.3%. The heating energy consumption decreased by 30% and the cooling energy by 44%. In case 15, a GSHP was connected to the most energy efficient air-conditioning system whereby the primary energy consumption in Incheon decreased by 59.2%. In Jeju, the annual primary energy saving rate was 57.4%. The heating energy consumption was saved by 58%, and the cooling energy consumption by 56%. The heating energy saving was greater in Incheon (65%), where HDD is higher, than in Jeju (58%).
A GSHP’s winter season heating cycle utilizes the underground heat exchanger and transmits the thermal energy recovered by the geothermal heat pump indoors. During the cooling season, the opposite process occurs, where the heat generated indoors is retrieved by the geothermal heat pump. The retrieved heat is then released into the ground through the underground heat exchanger. A GSHP does not use fossil fuel to operate its cooling/heating cycles, and energy can be conserved by utilizing a steady supply of geothermal energy. Furthermore, the geothermal energy is unaffected by the outdoor air temperature, and GSHP boasts a COP that is more than three times higher than that of an general air source heat pump (ASHP), which loses efficiency during winter due to low outdoor air temperature [89,90].

5.4. Comprehensive Analysis of the Simulations (Primary Energy Consumptions and CO2 Emissions)

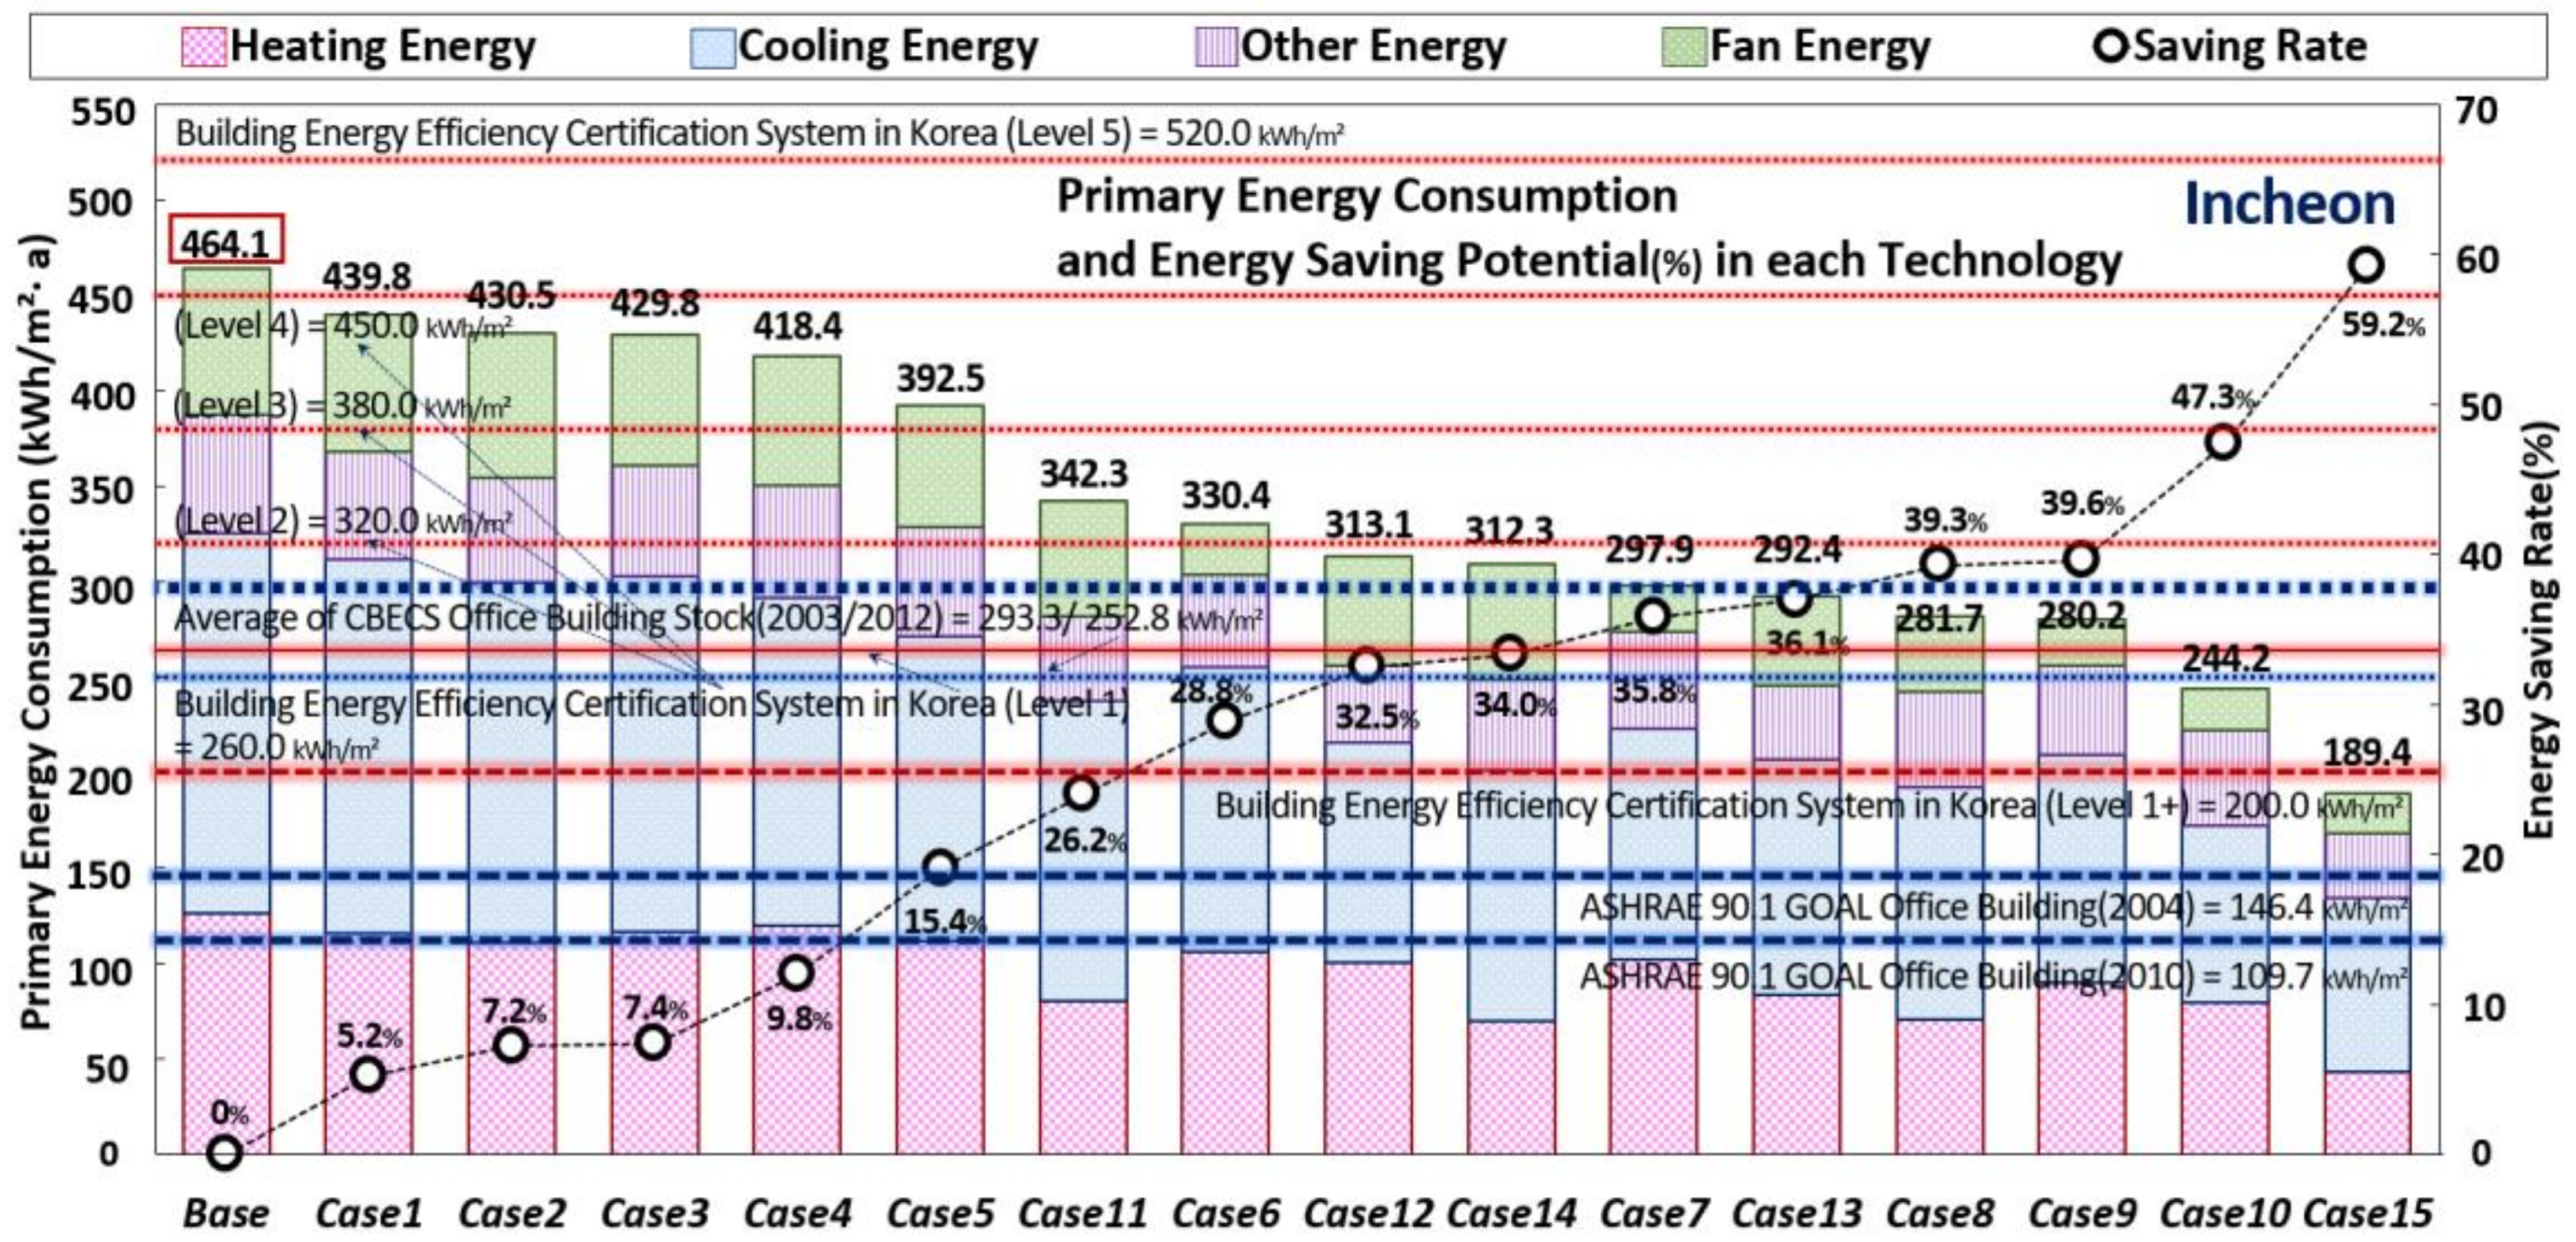
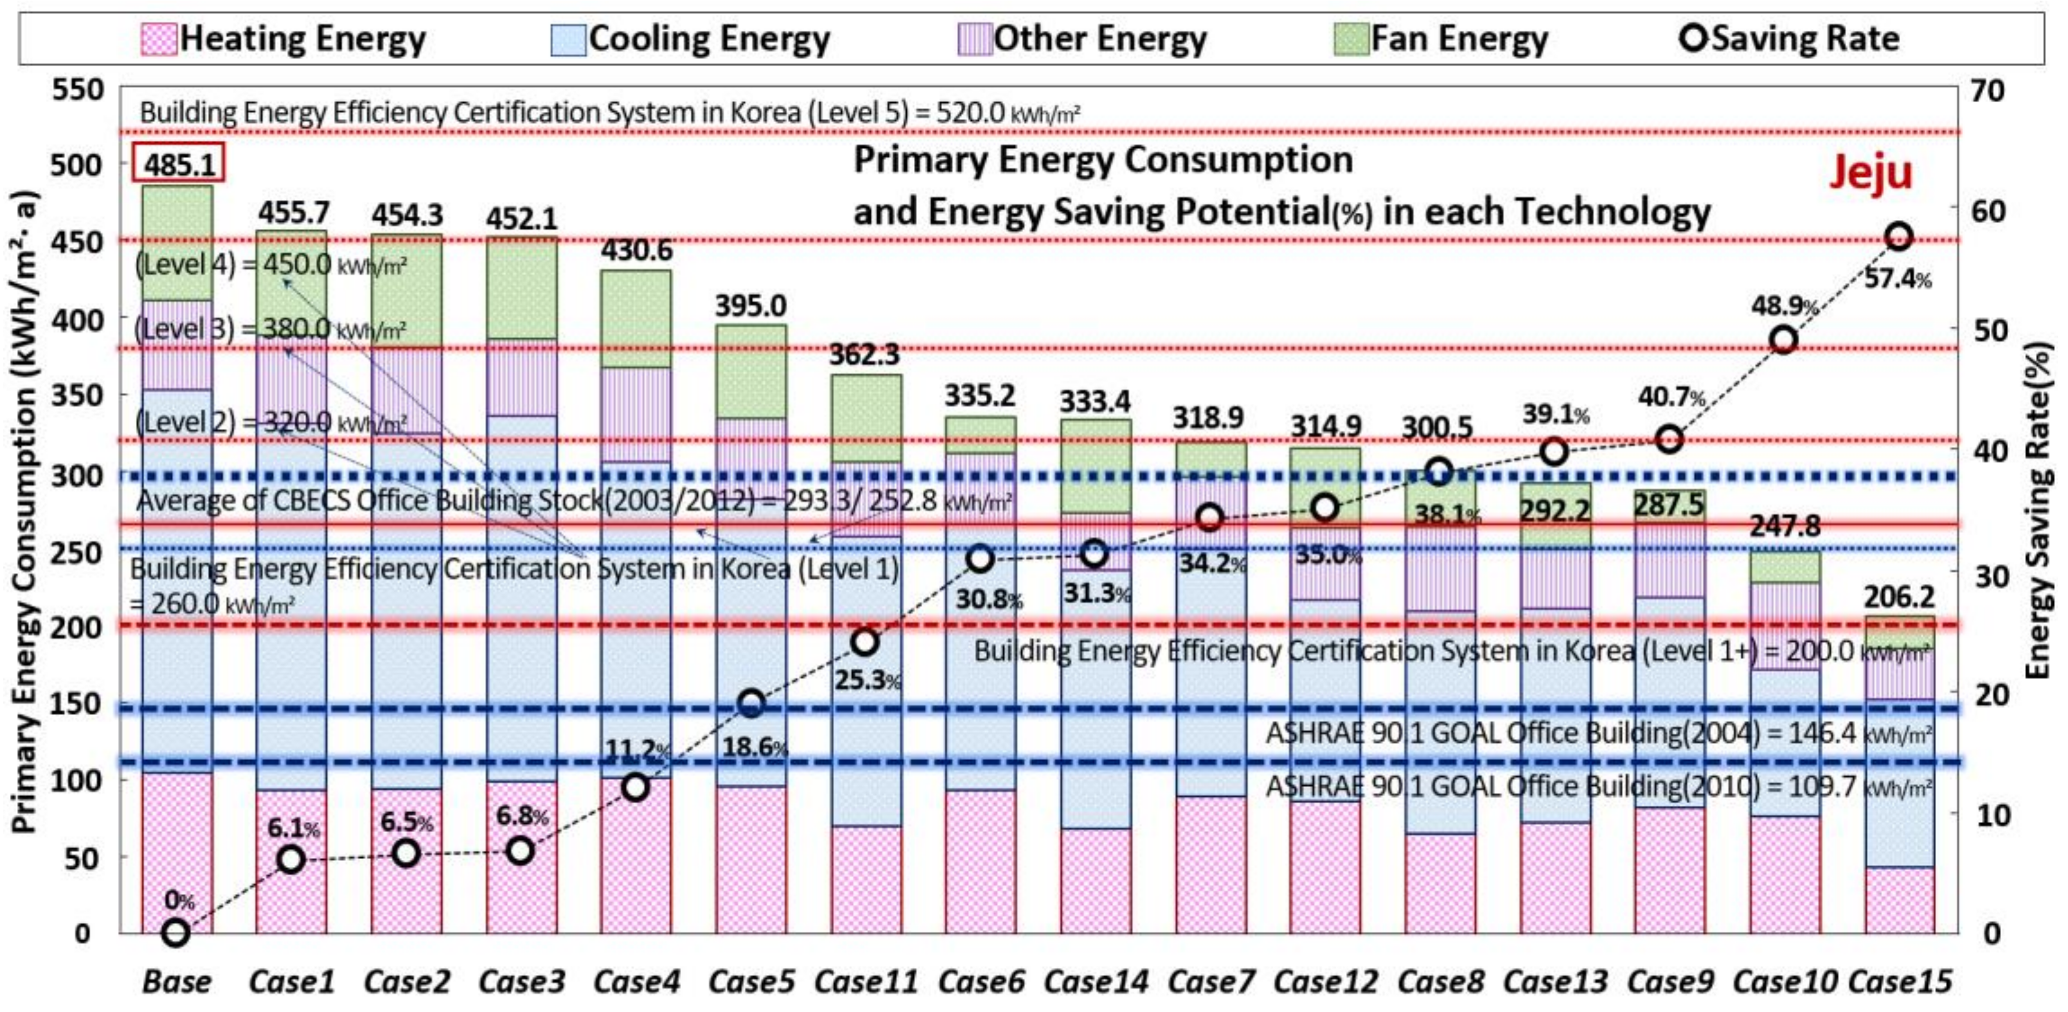
5.4.1. Overall Primary Energy Consumption and Comparisons with Benchmark Values

Figure 18 shows the primary energy consumptions and energy savings contributions when we applied the technologies of 15 cases to Incheon. These primary energy consumptions are compared with Korean and international benchmark values.
When we applied passive systems (cases 1–5), the primary energy consumption was reduced from 464.1 kWh/m2 of the base model to 392.5 kWh/m2 (case 5). In cases 1–5, the BEESC in Korea [27] improved from level 5 to level 4.
In the air-conditioning systems (cases 6–10), the primary energy consumption was reduced from the base model value of 464.1 kWh/m2 to as low as 244.2 kWh/m2 in case 10. When we applied case 6, the BEECS was improved to level 3, and it was improved to level 2 in cases 7–9. In case 10, the BEESC improved to level 1. The primary energy consumptions for cases 8–10 (244.2–281.7 kWh/m2) were less than that of the CBECS [39] office building stock (293.3 kWh/m2).
In the plant systems (cases 11–13), the primary energy was reduced up to 292.4 kWh/m2 (case 13). When we applied case 11, the BEECS was improved to level 3 from level 5. When we applied cases 12 and 13, the certification was improved to level 2. The energy consumption of case 13 was 292.4 kWh/m2, which meets that of the CBECS office building stock (293.3 kWh/m2) and also has lower primary energy consumption. The application of renewable energy systems (cases 14–15) resulted in energy reductions up to 189.4 kWh/m2 (case 15). In terms of the BEECS level, cases 14 and 15 improved their ratings to levels 2 and 1+, respectively.
The results of case 15 (189.4 kWh/m2) were close to the ASHRAE 90.1 goal for the office building standard [40] (146.4 kWh/m2) and showed an especially low primary energy consumption.
Figure 19 shows each technology’s primary energy consumption and contribution to energy conservation when applied to the Jeju climate, similar to that for Incheon in Figure 18.
When we applied passive systems (cases 1–5), the primary energy consumption was reduced to as low as 395.0 kWh/m2 (case 5) from the based model value of 485.1 kWh/m2.
Unlike the results for Incheon, the BEESC level improved only to level 4 from level 5 in cases 4 and 5. The results for cases 1–3 remained at level 5 despite the energy conservation total being similar to that in Incheon, as the base model’s primary energy was higher in Jeju (485.1 kWh/m2) than in Incheon (464.1 kWh/m2).
In air-conditioning systems (Cases 6–10), the primary energy was reduced to as low as 247.8 kWh/m2 (Case 10). When we applied Case 6, the BEESC improved to level 3. In cases 7–9, the rating improved to level 2. Furthermore, applying case 10 improved the rating to level 1. Cases 9 (287.5 kWh/m2) and 10 (247.8 kWh/m2) showed primary energy consumption values lower than that of the CBECS office building stock (293.3 kWh/m2).
In cases 11–13, the primary energy consumption was reduced up to as low as 292.2 kWh/m2 (case 13). When we applied case 11, the BEECS improved from level 5 to level 3. In cases 12 and 13, the rating improved to level 2. Case 13 (292.2 kWh/m2) showed a primary energy consumption similar to that of the CBECS office building stock (293.3 kWh/m2).
Applying renewable energy systems (cases 14–15) reduced the energy consumption to as low as 206.2 kWh/m2 (case 15). In terms of the BEECS, case 14 improved the rating to level 3 and case 15 to level 1. Case 15 showed the highest energy saving rate of all technologies applied to the Jeju climate, but it was only slightly lower than the saving rate in Incheon. Due to the different climate characteristics of Incheon and Jeju, different results were achieved in their BEECS evaluations. Tables S1 and S2 in the supplementary material provide detailed data for Figure 18 and Figure 19.

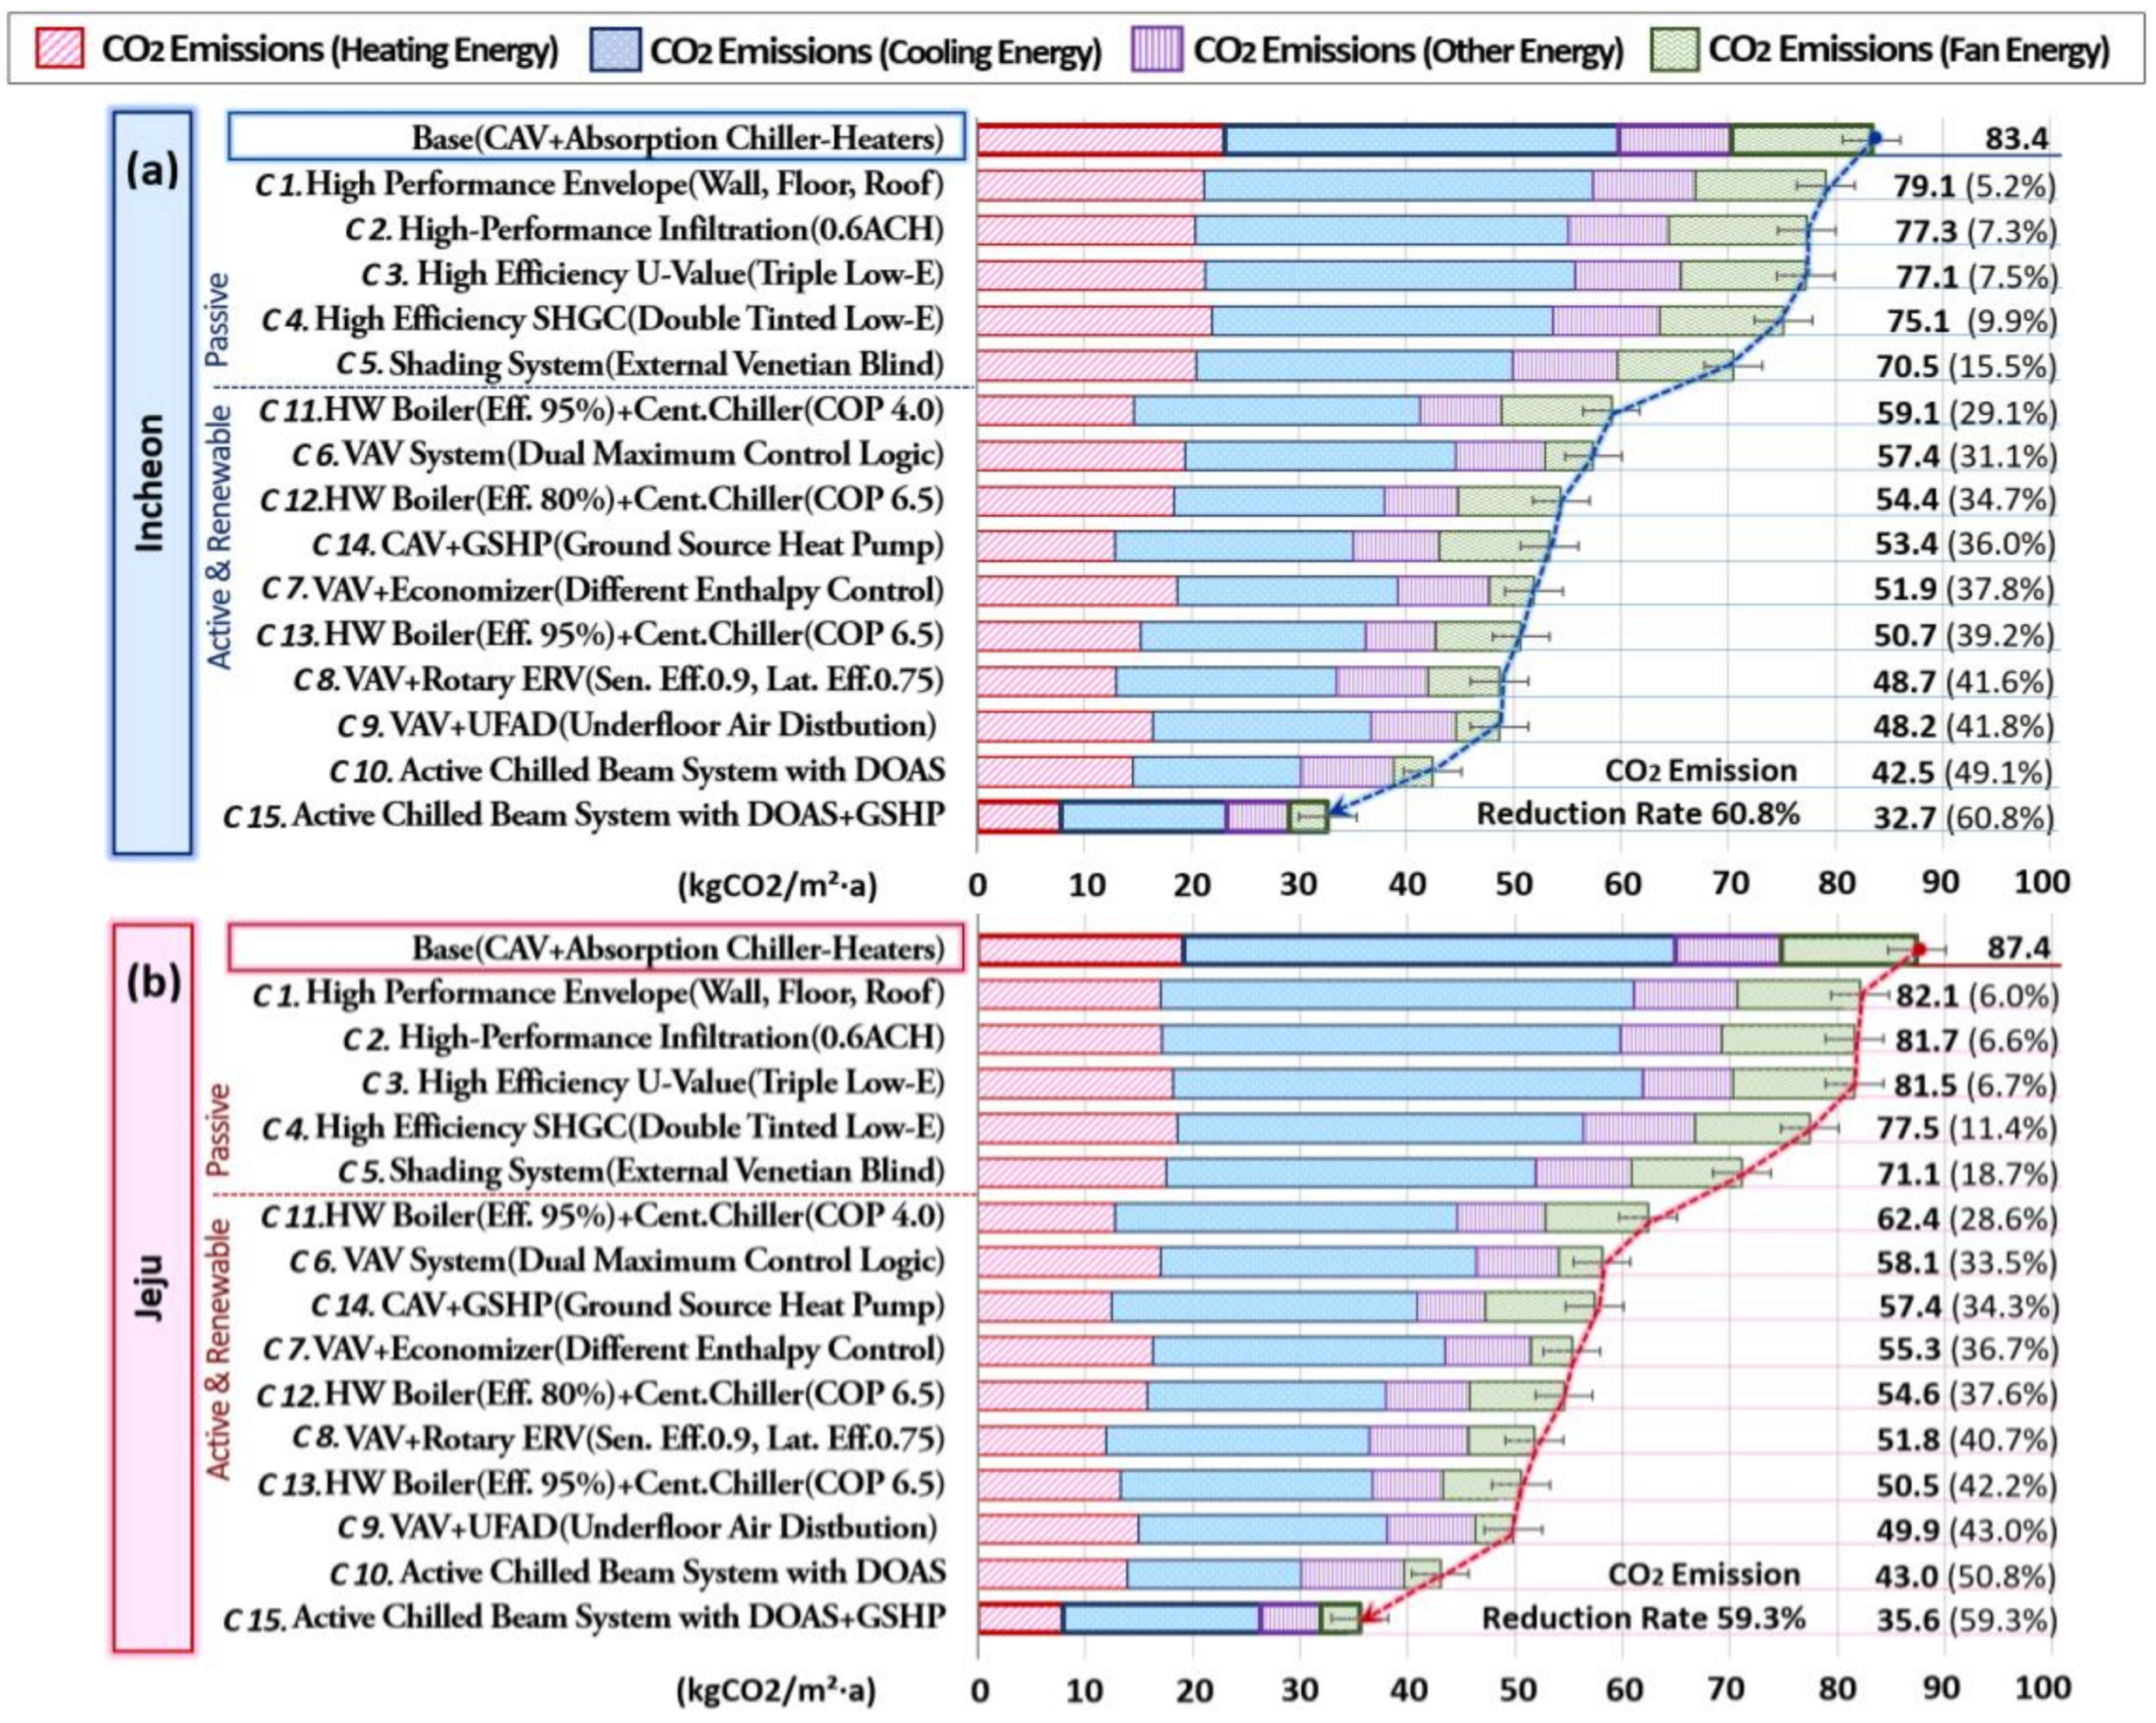
5.4.2. Each System’s CO2 Emissions and Reduction Rate Analysis

Figure 20 shows the changes in the annual CO2 emissions per unit area when we applied the technologies of the 15 cases and each technology’s contribution to the CO2 emissions reduction.
In Incheon (a), the base model’s CO2 emission value is 83.4 kgCO2/m2. In cases 1–5, CO2 emissions were reduced to as low as 79.1–70.5 kgCO2/m2, with corresponding reduction rates of 5.2–15.5%. In the passive technologies, case 5 showed the highest reduction rate of 15.5% (70.5 kgCO2/m2).
In the active systems, the application of air-conditioning systems (cases 6–10) decreased emissions in a range from 57.4–42.5 kgCO2/m2. The corresponding CO2 emissions reduction rate ranged from 31.1–49.1%. The active chilled beam with DOAS (case 10) showed the highest reduction rate of 49.1% (42.5 kgCO2/m2). When we applied plant systems (cases 11–13), the CO2 emissions decreased up to 50.7 kgCO2/m2.
In the plant systems, case 13 enhanced both the condensing efficiency of the HW boiler and the COP of the centrifugal chiller, thereby achieving the highest reduction rate of 39.2% (50.7 kgCO2/m2).
The application of renewable energy system (cases 14 and 15) reduced the CO2 emissions in a range from 53.4–32.7 kgCO2/m2. The reduction rate achieved by combining GSHP and CAV (case 14) was 36.0%. In case 15, the CO2 emission was 32.7 kgCO2/m2, which was 60.8%. Case 15 had the lowest CO2 emissions and thus was the most effective system in terms of GHG emissions.
The base model’s CO2 emissions in Jeju (b) totalled 87.4 kgCO2/m2, which is approximately 4 kgCO2/m2 higher than that in Incheon. In cases 1–5, the CO2 emissions were reduced by 82.1–71.1 kgCO2/m2, with corresponding emission reduction rates ranging from 6.0 (case 1)–18.7% (case 5).
In the active systems, reductions of 58.1–43.0 kgCO2/m2 were achieved by applying the air-conditioning systems (cases 6–10). Case 10 achieved the highest reduction at 43.0 kgCO2/m2 (50.8%). When we applied plant systems (cases 11–13), emissions were reduced in a range from 62.4–50.5 kgCO2/m2. Case 13, which reinforced both the HW boiler’s efficiency and centrifugal chiller’s COP, achieved the highest reduction rate of 42.2%. When we applied renewable energy system (cases 14 and 15), the CO2 emissions were reduced up to 35.6 kgCO2/m2. Case 14, showed a reduction of 34.3%. Case 15, which combined with the active chilled beam with DOAS, reduced the CO2 emissions by 59.3%, thus being the most effective system in reducing CO2 emissions, as it was in Incheon. Tables S3 and S4 in the supplementary material provide detailed data for Figure 20a,b.

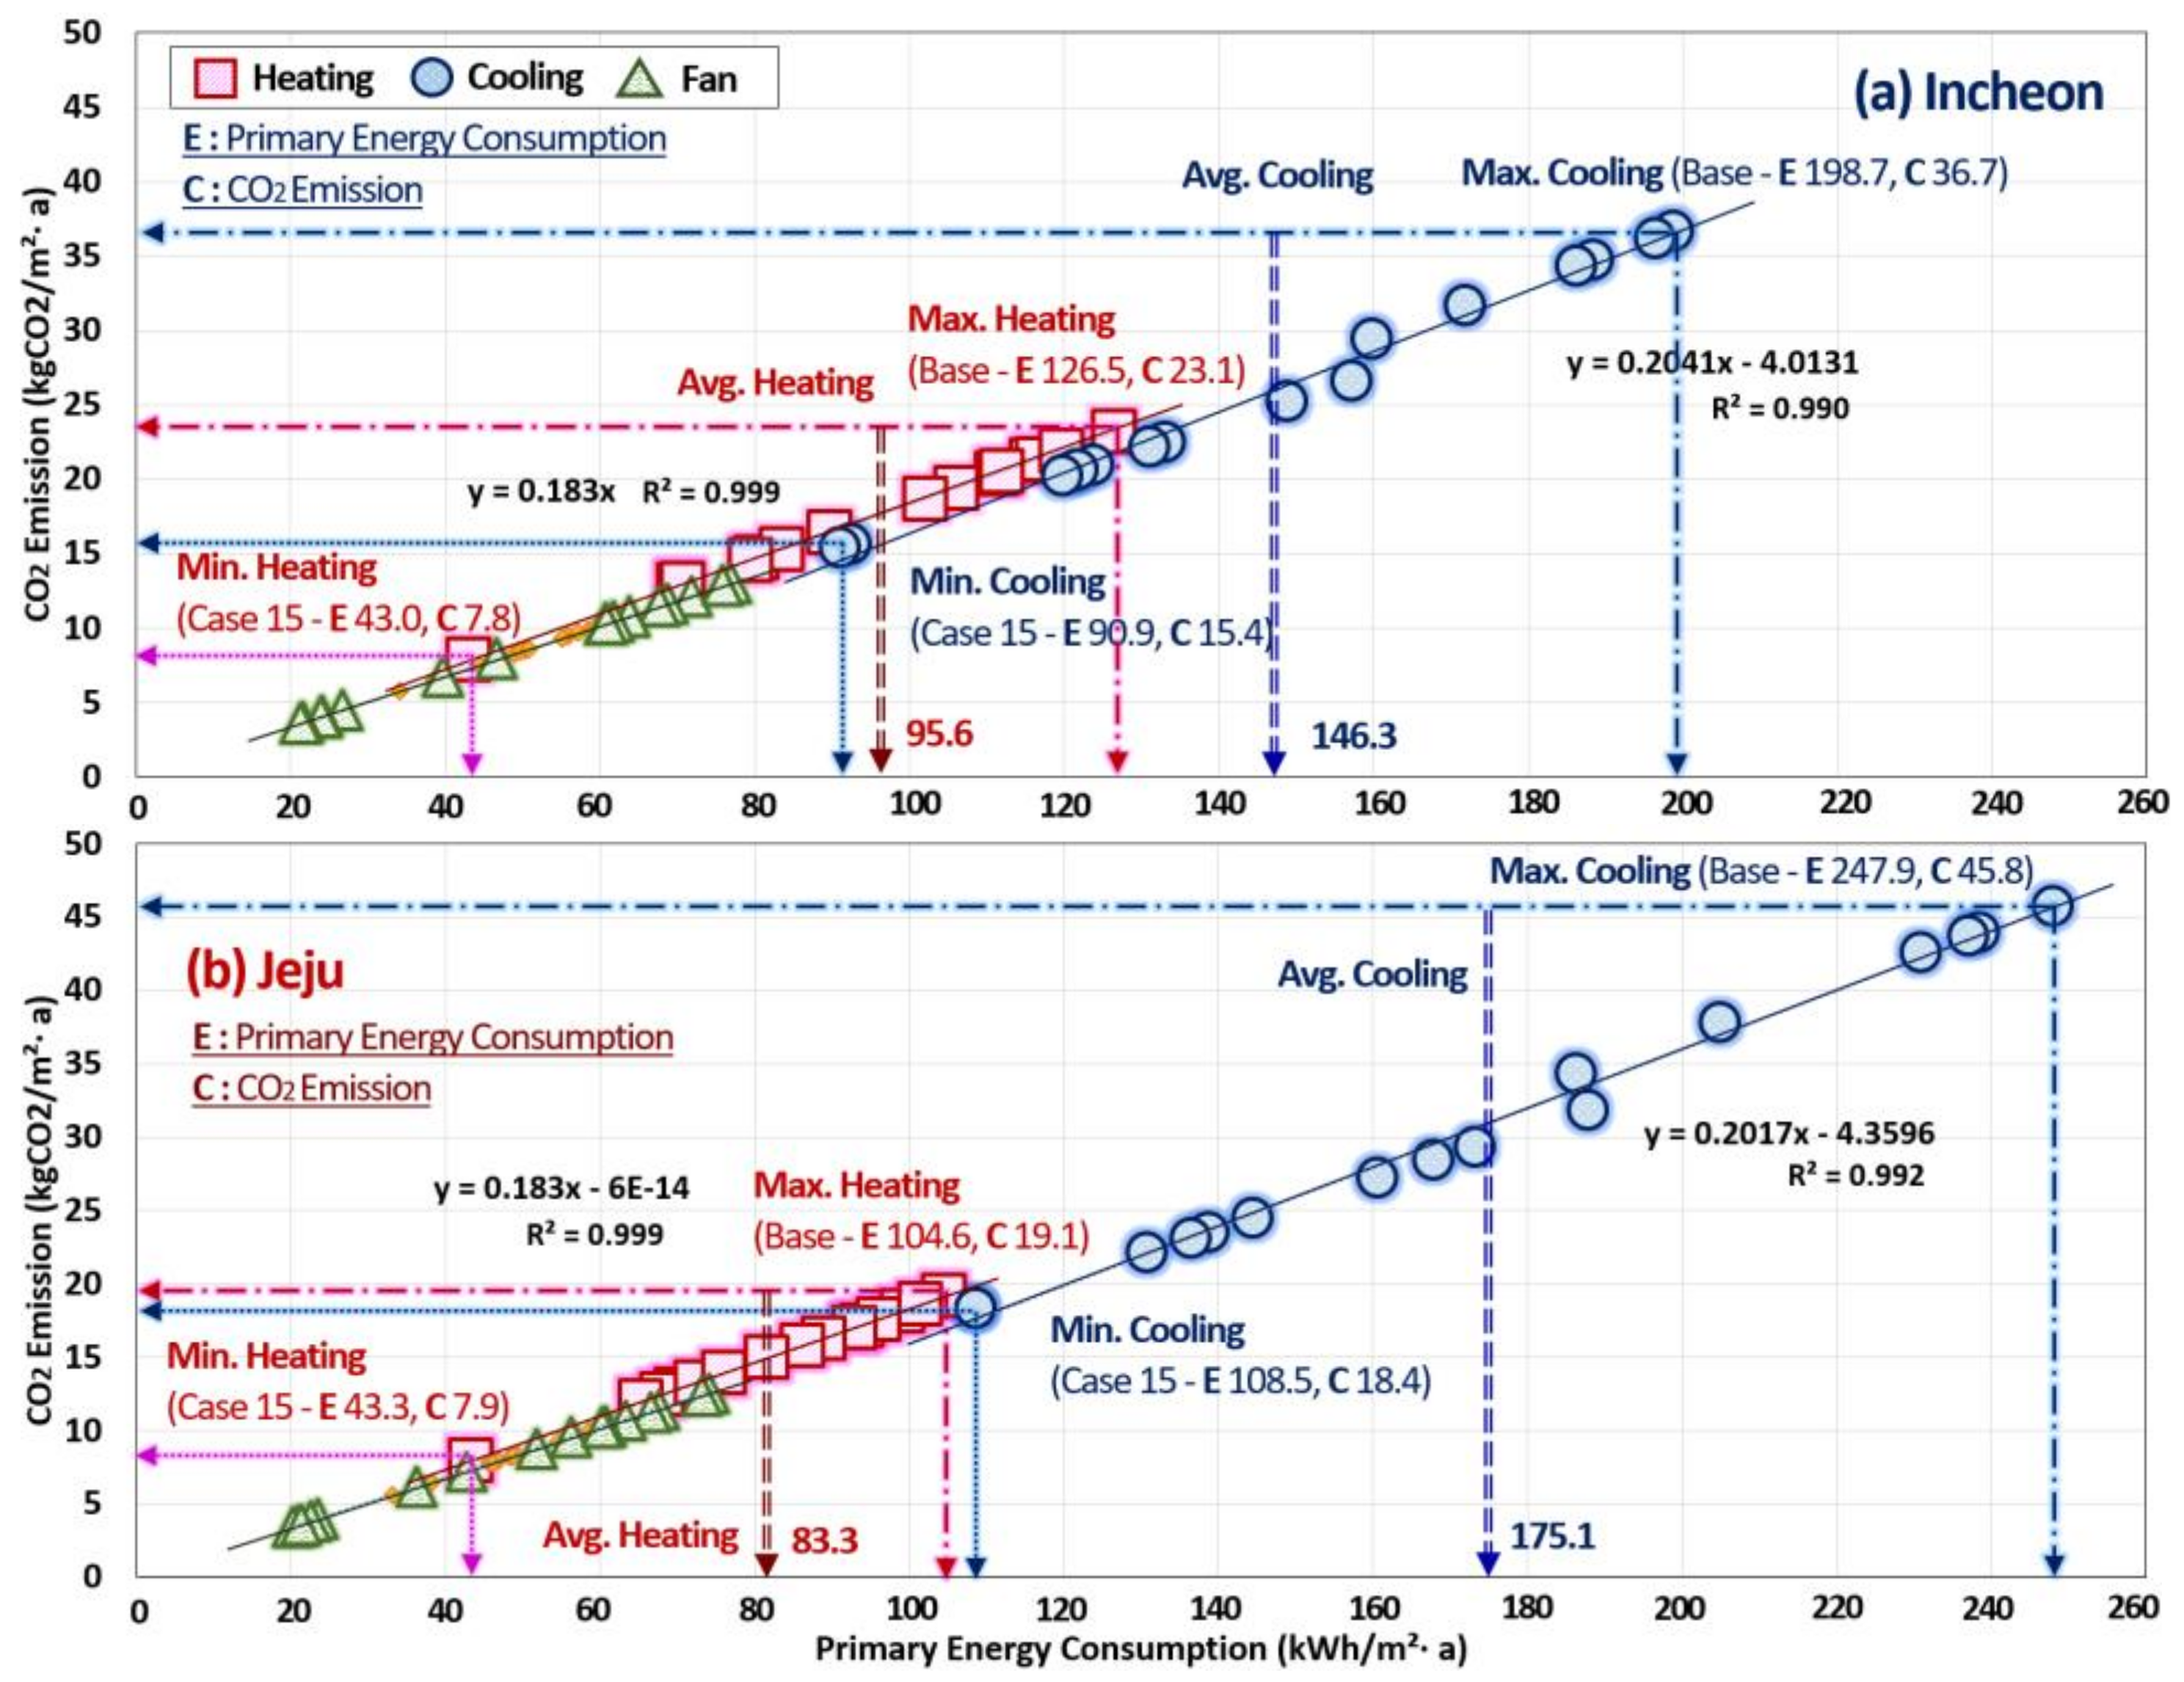
5.4.3. Analysis of the Correlation between the Primary Energy Consumptions and CO2 Emissions

Figure 21 shows the correlation between the annual primary energy consumption per area and the CO2 emissions when we applied technologies from 15 cases in Incheon and Jeju.
Due to the environment of Korean office buildings, the cooling energy consumption was higher than the heating energy consumption in both Incheon and Jeju. The cooling energy in Incheon was reduced from 198.7 to 90.9 kWh/m2. The average cooling energy consumption was 146.3 kWh/m2. The CO2 emissions were reduced from 36.7 to 15.4 kgCO2/m2. The correlation between cooling energy consumption and CO2 emissions is linear, and the R2 value is 0.990, which indicates that it is directly proportional. In Jeju, the cooling energy was reduced from 247.9 to 108.5 kWh/m2. The average cooling energy consumption value was 175.1 kWh/m2.
The CO2 emissions were reduced from 45.8 to 18.4 kgCO2/m2. Since Jeju has higher a CDD value than Incheon, Jeju’s proportion of cooling energy and the average cooling energy consumption are higher. Also, the correlation between the cooling energy consumption and CO2 emissions is linear, similar to that in Incheon. The R2 value was 0.992, which indicates that it is directly proportional.
The heating energy reduction in Incheon ranged from 126.5–43.0 kWh/m2, and the average heating energy consumption was 95.6 kWh/m2. The CO2 emissions were reduced from 23.1 to 7.8 kgCO2/m2. In Jeju, the heating energy reduction ranged from 104.6 to 43.3 kWh/m2. The average heating energy consumption was 83.3 kWh/m2. At the same time, the CO2 emissions were reduced from 19.1 to 7.9 kgCO2/m2. Since Incheon has a higher HDD value than Jeju, Incheon’s proportion of heating energy and its average heating energy consumption are higher. Also, the correlation between the heating energy consumption and CO2 emissions is linear for both Incheon and Jeju. The R2 value is 0.999, which indicates that it is directly proportional.

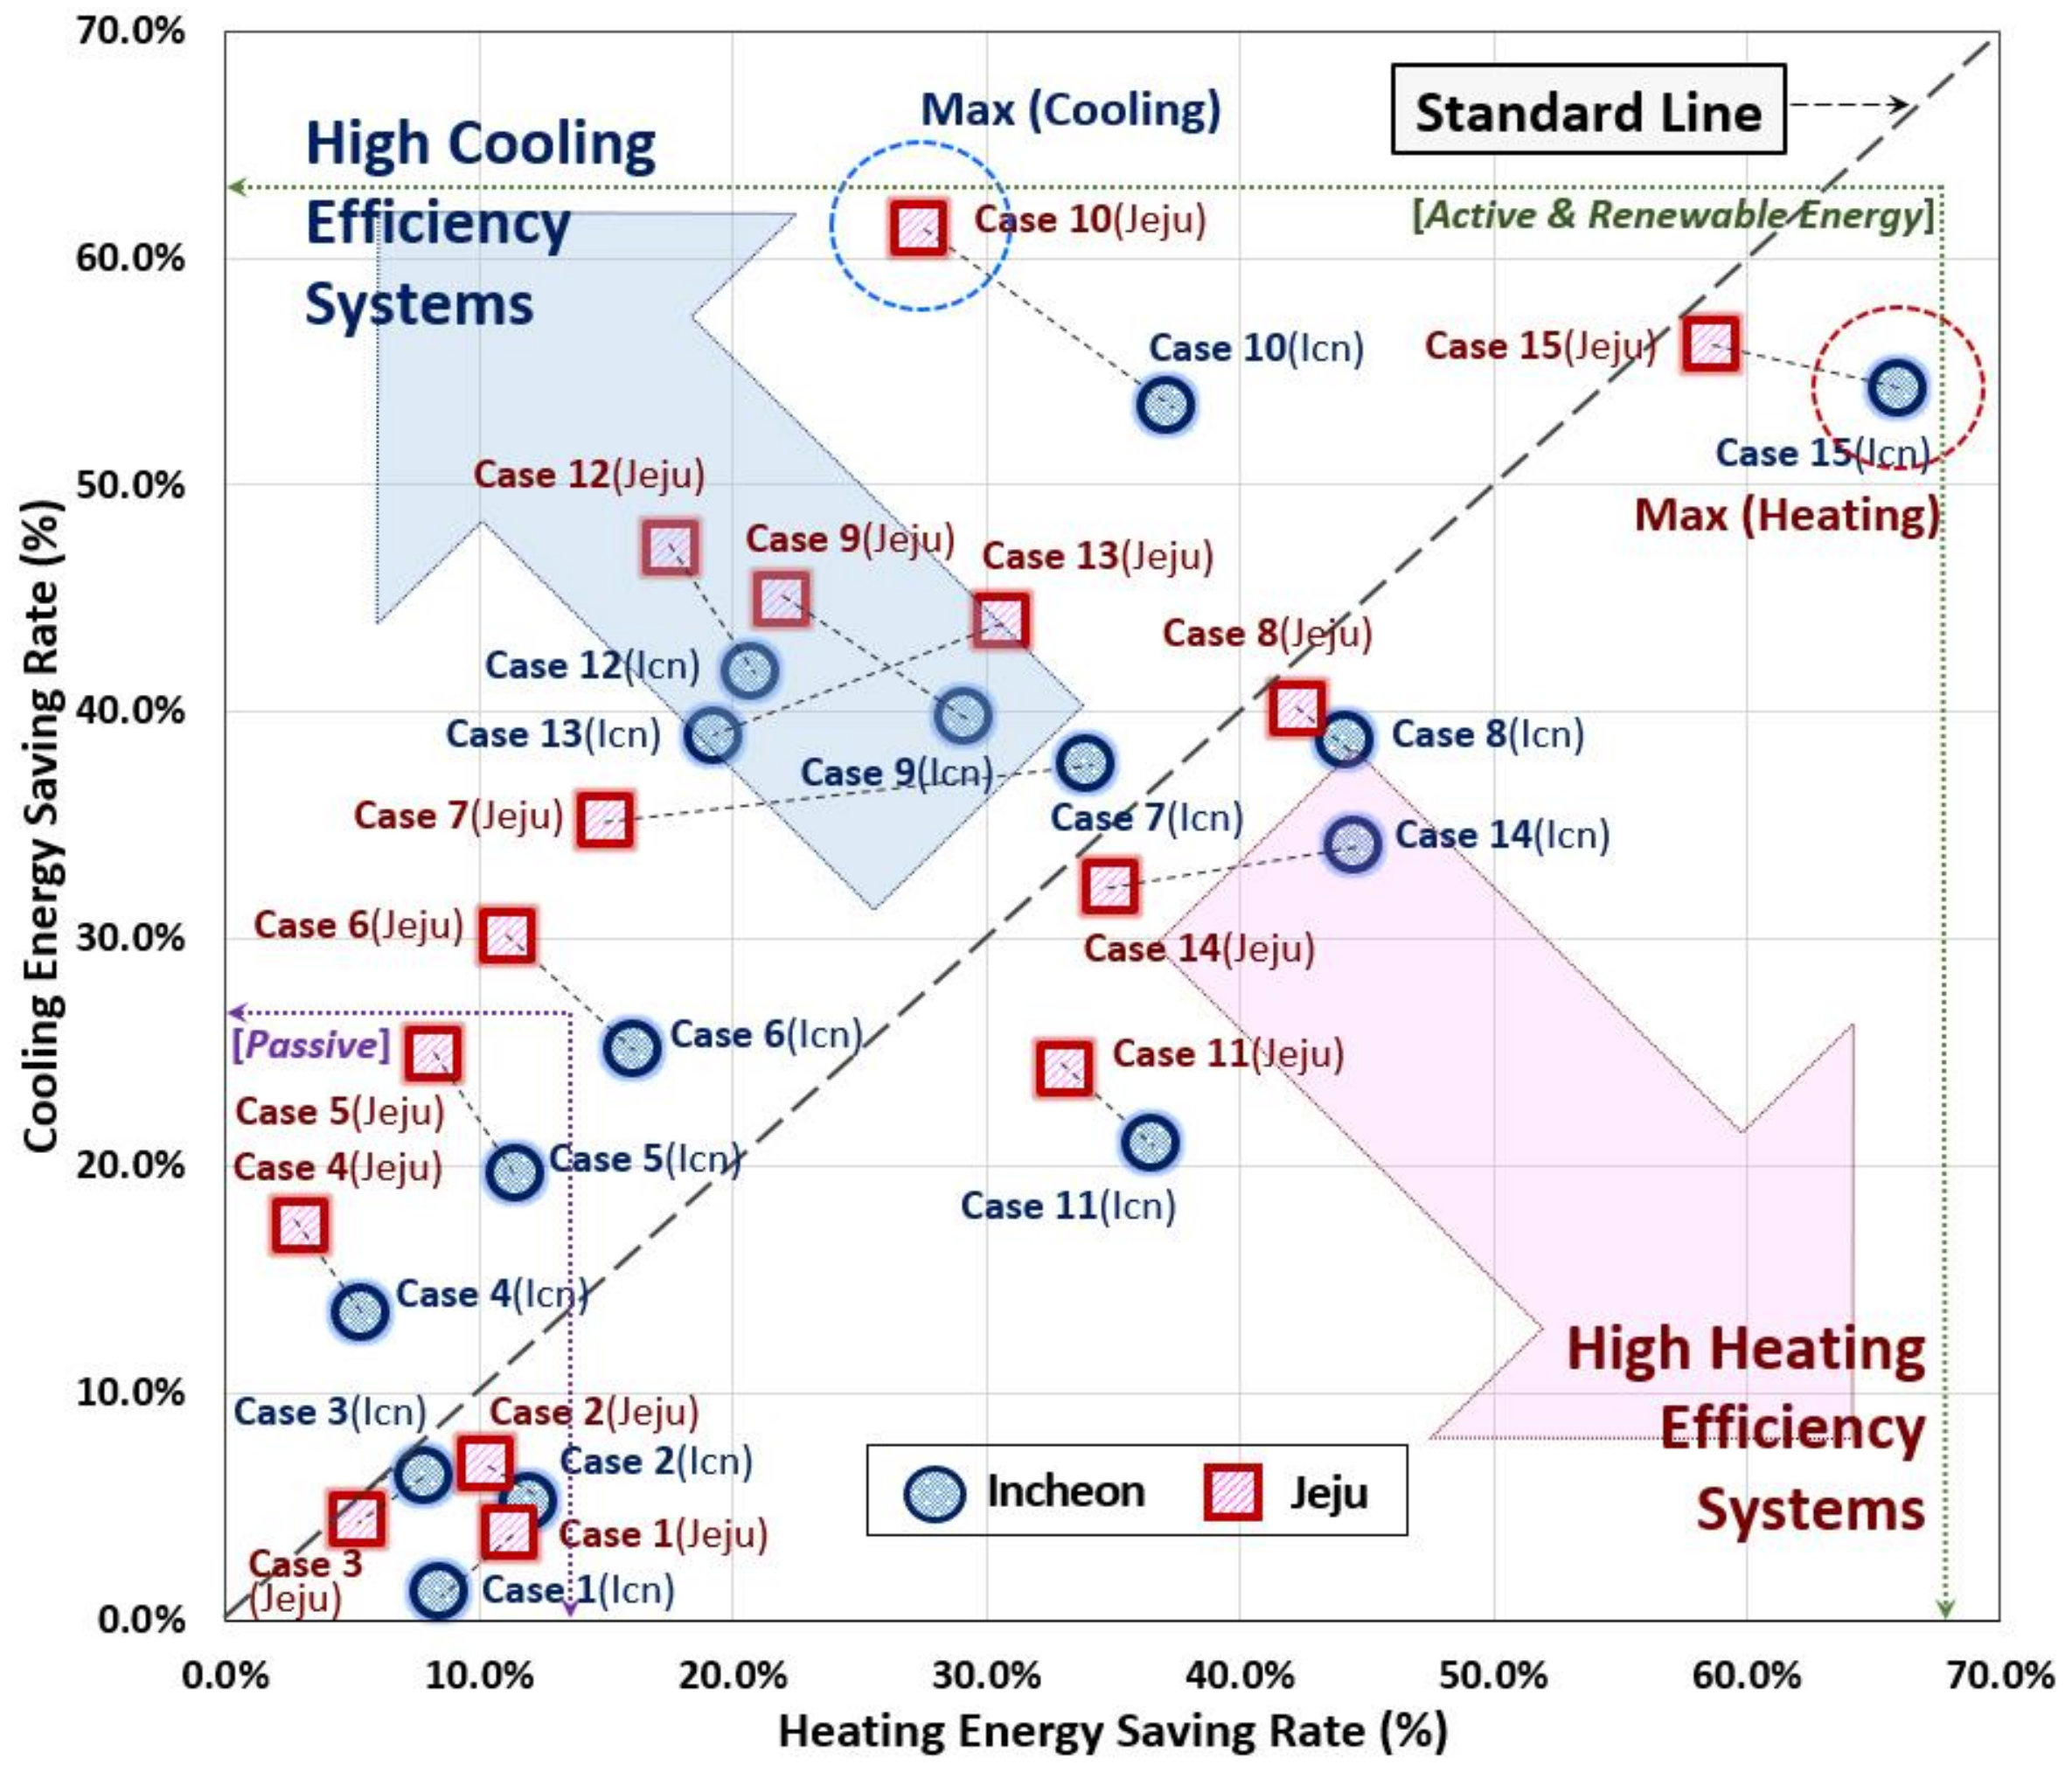
5.4.4. Analysis of Heating and Cooling Energy Performance Ratio of Each System

Figure 22 shows the cooling and heating energy-saving-rate ratios when we applied the technologies for the 15 cases in Incheon and Jeju. The systems distributed under the right side of the standard line (heating and cooling energy saving ratio 1:1) are more heating efficient, and systems distributed above the left side are more cooling efficient. The simulation results show that the primary cooling and heating energy-saving-rate ratios differ depending on the building’s passive systems, air-conditioning methods, and plant system types.
In the passive systems (cases 1–5), improving the building’s envelope performance (case 1), improving the envelope’s air-tight performance (case 2), and improving the glazing’s thermal transmittance (case 3) realized high heating energy-saving rates in both Incheon and Jeju. Improving the glazing’s SHGC (case 4) and installing external venetian blinds (case 5) showed higher cooling energy-saving rates. In the air-conditioning systems (cases 6–10) as active systems, applying a combined VAV and rotary ERV (case 8) achieved relatively high heating energy saving. The VAV system (case 6), applying an economizer to the VAV system (case 7), combining a VAV system with a UFAD (case 9), and applying an active chilled beam with a DOAS (case 10) showed higher cooling energy-saving rates. Case 10 showed the highest cooling energy-saving rate in Jeju. Due to the temperature increases in office buildings caused by internal loads, all air-conditioning systems, with the exception of the ERV, showed higher cooling than heating energy-saving rates.
However, an air-conditioning system’s cooling and heating energy-saving rates are subject to change from indoor temperatures setting. The results shown in Figure 22 are based on the indoor temperature we set in this study (Table 6) and the Korean outdoor air temperature (Table 1).
In plant systems (cases 11–13) as active systems, improving boiler efficiency (case 11) results in an increased heating energy-saving rate due to the boiler’s high efficiency. In contrast, improving centrifugal chiller COP (case 12) and improving both boiler efficiency and chiller COP (case 13) yield greater cooling energy-saving rates. This is due to the fact that the cooling system COP is better in Korean office buildings, where cooling energy consumption is higher.
Applying a combined GSHP and CAV system (case 14) with a combined GSHP (case 15) which was the air-conditioning system with highest energy-saving rate, showed high cooling and heating energy conservation rates in both Incheon and Jeju. Case 15 showed the highest heating energy-saving rate in Incheon because the GSHP is unaffected by the outdoor air temperature and instead utilizes consistent geothermal energy.
Understanding each technology’s energy consumption characteristics in specific climate conditions and energy conservation principles is critical to obtain strategic energy efficiency in high-performance buildings. Each technology (cases 1–15) provided different energy-saving contributions in the Korean climates depending on their characteristics, and these ratios can be used to effectively remove the cooling/heating loads in each system. The heating and cooling energy-saving rates with each technology indicate that they can be used when selecting suitable technologies to save energy in cooling and heating seasons.

6. Discussion

It is important to improve the energy performance of new or existing buildings to reduce their energy consumption [91,92,93]. In this study, we selected major technologies and carried out step-by-step simulations for new high-performance building constructions and retrofitting of existing buildings. This study focused on the energy consumption and CO2 reduction analysis. However, cost analysis for each technology application was not carried out and should be considered in further studies.
In the previous studies [94,95,96,97], no significant difference was found in the technical performance of energy-saving technologies for new buildings and retrofitting existing buildings, but energy and cost were affected by the space-using pattern, climate, and number of effective technologies.
Morofsky et al. state, “Many of the measures and results presented here would be applicable to existing buildings when major system upgrades, replacements or building retrofits are undertaken” [94], in their study of energy reduction for new building construction. Ferrara et al. also explain, “Both energy and cost point of view depend on many variables, such as climatic data, available technologies and materials, population lifestyle, the age of the building and its use (commercial buildings, residential, etc.)” [95]. Kneifel states, “The building type and local climate impact the financial benefits from energy efficiency improvements” [96]. The studies also reported on the need to address the issues of cost. Cho et al. state, “Because operating costs do not vary proportionally with energy source, there should be comprehensive follow-up studies that take economic efficiency into account” [97]. The common implication of studies on cost optimization and cost analysis [98,99,100,101,102,103] is that improving the energy efficiency of buildings inevitably incurs additional costs. Most buildings last for at least 30 years; hence improving the initial energy performance has double effects, such as reducing greenhouse gas emissions [98]. For high-performance buildings, although improving energy efficiency can contribute drastically to energy saving, the high investment costs and long payback period may not be financially viable [99]. Hamdy et al. say, “Finding cost-optimal solutions towards nearly-zero-energy buildings (nZEBs) in accordance with European energy performance of buildings directive (EPBD-recast 2010) is a challenging task” [100].
However, cost and energy optimization studies [101,102,103] imply that one can achieve cost efficiency for high-performance buildings by using new technologies. Kurnitski et al. state, “This study determined cost optimal and nearly zero energy building (nZEB) energy performance levels following the REHVA definition and energy calculation methodology for nZEB national implementation” [101]. Congedo et al. say, “This paper shows how the cost-optimal methodology is useful in searching for the most appropriate retrofit measures for the renovation of existing public buildings” [102]. Congedo et al. also state, “The paper shows the suitability of the methodology to support the design of cost-effective energy efficient solutions in new office buildings. Results show technical variants selection able to decrease primary energy consumption by 39% and CO2 emissions by 41% at the lowest cost” [103]. Also, in order to encourage the development of high-performance buildings, major countries of the world are offering various financial support systems appropriate for their specific situations. In the United States, the government is implementing various fiscal policies, such as tax reduction and the provision of subsidies, to improve the energy efficiency of buildings [104,105,106,107,108,109,110]. The Energy Star Program [104] provides tax deductions by giving certifications to buildings or houses that meet a certain energy-efficiency standard. The Home Energy Rating System [105] and Solar America Cities Program [106] also provide financial support for pursuit of energy efficiency improvements.
The German CO2-Gebaeude Sanierungs Program [107] provides long-term, low-cost loans and subsidies for reconstruction. The UK’s Low Carbon Buildings Program (LCBP) [108] and the Éco-Prêt à Taux Zéro (PTZ) [109] for zero-energy housing in France are also financial support programs provided at the national level. Japan’s New Energy and Industrial Technology Development Organization (NEDO) also subsidizes building owners who apply new technologies and renewable energy-saving systems [110].
Korea has also implemented various programs, including the previously described BEECS, to enforce energy optimization for new and existing public construction [42]. Yet, they may not work well, because of the high initial investment costs and long payback period. It is also necessary to increase the effectiveness of incentives, as is done in other countries, to secure economic efficiency [98,111,112]. Korea is hoping for a 30% energy reduction in 2017 and 60% in 2020 for non-office buildings. In addition, the goal is to design new zero-energy buildings by 2025. In order to reach these goals, it is necessary to adopt policies on technological development, public relations and education, and financial support from various perspectives [98,111]. It is also important to develop domestic production to promote new high-performance technologies. In order to improve the energy performance of existing buildings in addition to that of newly constructed buildings, it is necessary to understand energy consumption in terms of the usage and size of buildings and to develop policies and technologies applicable to existing buildings [98,111,112].

7. Summary and Conclusions

In this study, EnergyPlus simulations were performed on a base model reflecting the Korean building code to provide a basis to select energy-saving technologies suitable for Korean climate. The ultimate aim of this study is to realize high-performance buildings to cope with climate change and to reduce energy and GHG emissions. We analyzed the characteristics of the energy consumption for each technology (passive, active, and renewable systems), reviewed the principles of the energy savings, and assessed the primary energy consumption and CO2 emission reduction for each technology. Some of the conclusions that can be drawn from this study are listed below:
(1) In Korea, temperatures are rising gradually, and extreme weather events, such as heat and cold waves, are increasing. The primary energy consumptions of the base models in Incheon and Jeju were 464.1 and 485.1 kWh/m2, respectively, and were rated at level 5 according to Korean standard: BEECS. According to the HDD and CDD characteristics, Incheon was shown to use more heating energy than Jeju and Jeju uses more cooling energy than Incheon. The results of the simulation for the base model were considered to be within the actual primary energy consumption range (457–489 kWh/m2) of general office buildings located in the Incheon and Jeju areas.
(2) When passive systems (cases 1–5) were applied in the Incheon climate, the primary energy consumption was reduced up to 392.5 kWh/m2 (case 5) compared to the base model of 464.1 kWh/m2. With the air-conditioning systems (cases 6–10), the primary energy decreased up to 244.2 kWh/m2 (case 10). When plant systems (cases 11–13) were applied, energy was saved up to 292.4 kWh/m2 (case 13). When renewable energy systems (cases 14–15) were applied, the primary energy was reduced up to 189.4 kWh/m2 (case 15). In particular, case 15 (189.4 kWh/m2) is close to the goal of the ASHRAE 90.1 standard for office buildings (146.4 kWh/m2), and its primary energy is the smallest among case studies evaluated in this study. When using BEECS as an assessment, case 15 reached level 1+.
(3) In Incheon, the CO2 emissions of the base model were calculated to be 83.4 kgCO2/m2 and decreased up to 70.5 kgCO2/m2 (case 5) when passive technologies (cases 1–5) were applied. In active systems, the CO2 emission decreased up to 42.5 kgCO2/m2 in air-conditioning systems (cases 6–10) and decreased up to 50.7 kgCO2/m2 in plant systems (cases 11–13). When renewable energy system (cases 14–15) were applied, the emission was reduced up to 32.7 kgCO2/m2 (case 15).
(4) When applying passive systems (cases 1–5) in the climate of Jeju, the primary energy was reduced up to 395.0 kWh/m2 (case 5) compared to the base model of 485.1 kWh/m2. In the active systems, the primary energy was reduced up to 247.8 kWh/m2 (case 10) in air-conditioning systems (cases 6–10) and up to 292.2 kWh/m2 (case 13) in plant systems (cases 11–13). When a renewable energy system (cases 14–15) was applied, the energy was reduced up to 206.2 kWh/m2 (case 15). When using BEECS level as an assessment, case 15 was estimated to have reached level 1. Since the energy consumption characteristics of a system are different depending on the climate, the results of the evaluation using grades were slightly different in Incheon and Jeju.
(5) In Jeju, the CO2 emission of the base model was 87.4 kgCO2/m2, which is 4 kgCO2/m2 higher than that in Incheon. When applying passive systems (cases 1–5), the CO2 emission decreased up to 71.1 kgCO2/m2. In active systems, the CO2 emissions were reduced up to 43.0 kgCO2/m2 with air conditioning systems (cases 6–10) and up to 50.5 kgCO2/m2 with plant systems (cases 11–13). When a renewable energy system (cases 14–15) was applied, the CO2 emission decreased up to 35.6 kgCO2/m2. As in Incheon, the correlation between the primary energy consumption and the CO2 emissions showed an R2 value was over 0.9, indicating a very close proportional tendency.
(6) An analysis of the building energy consumption characteristics in Incheon and Jeju showed that the average heating energy (95.6 kWh/m2) and total heating energy savings (126.5–43.0 kWh/m2) were larger in Incheon where the HDD value is higher than in Jeju. In Jeju, where the CDD value is large, the average cooling energy (175.1 kWh/m2) and the total cooling energy savings (247.9–108.5 kWh/m2) were larger than they were in Incheon. Each technology (cases 1–15) provided different energy-saving contributions depending on their characteristics in Korean climates. The heating, cooling, and other energy-saving contributions by each technology indicate that they can be used when selecting suitable technologies to save energy in the cooling and heating seasons.
(7) It is critical to understand the energy consumption characteristics of each technology under specific climatic conditions and to consider the energy saving principles to analyze strategic energy efficiency when developing high-performance buildings. Even though the Korean reference model’s primary energy consumption and CO2 emissions was evaluated in this study, it is also necessary to study the comfort level related to the indoor temperature & humidity and the control logic for each system. In addition, it is necessary to further study the energy saving rates and related costs when combining several technologies.

Supplementary Materials

The following are available online at https://www.mdpi.com/1996-1073/11/4/884/s1, Table S1. Breakdown of the primary energy consumptions and saving rate (Passive systems), Table S2. Breakdown of the primary energy consumptions and saving rate (Active and Renewable systems), Table S3. Breakdown of the CO2 emissions and reduction rate (Passive systems), Table S4. Breakdown of the CO2 emissions and reduction rate (Active and Renewable energy systems).

Acknowledgments

This research was supported by a grant (18AUDP-B079104-05) from Architecture & Urban Development Research Program funded by Ministry of Land, Infrastructure and Transport of Korean government.

Author Contributions

Chul-Ho Kim performed the simulation and data analysis, and wrote this paper based on the obtained results with the help of Seung-Eon Lee. Kang-Soo Kim led and supervised this study. All of the authors have contributed for collecting ideas and concepts presented in the paper.

Conflicts of Interest

The authors declare no conflict of interest.

Abbreviations

The following abbreviations are used in this manuscript:
ACHAir Change per Hour
ASHRAEAmerican Society of Heating, Refrigerating and Air-Conditioning Engineers
CAVConstant Air Volume
CBECSCommercial Buildings Energy Consumption Survey
CDDCooling Degree Days
COPCoefficient of Performance
DBData Base
DOASDedicated Outdoor Air System
DOEU.S. Department of Energy
ECMEnergy Conservation measures
EIAEnergy Information Administration
ERVEnergy Recovery Ventilation
EPBDEnergy Performance of Buildings Directive
EPWEnergyPlus Weather File
GSHPGround Source Heat Pump
HDDHeating Degree Days
HVACHeating, Ventilation and Air Conditioning
HW BoilerHot Water Condensing Boiler
IEAInternational Energy Agency
LCBPLow Carbon Buildings Program
NEDONew Energy and Industrial Technology Development Organization
nZEBsNearly Zero Energy Buildings
PTZÉco-Prêt à Taux Zéro
REHVAFederation of European Heating, Ventilation and Air Conditioning Associations
SHCGSolar Heat Gain Coefficient
UFADUnderfloor Air Distribution
VAVVariable Air Volume
VLTVisible Light Transmittance
WMOWorld Meteorological Organization

References

  1. Edenhofer, O.R.; Pichs-Madruga, Y.; Sokona, E.; Farahani, S.; Kadner, K.; Seyboth, A.; Adler, I.; Baum, S.; Brunner, P.; Eickemeier, B.; et al. Climate Change 2014 Mitigation of Climate Change; Working Group III Contribution to the Fifth Assessment Report of IPCC; UNEP: Geneva, Switzerland, 2015; ISBN 978-92-9169-142-5. [Google Scholar]
  2. The Core Writing Team of IPCC; Pachauri, R.K.; Meyer, L. Synthesis Report IPCC Climate Change 2014 Synthesis Report; Intergovernmental Panel on Climate Change (IPCC): Geneva, Switzerland, 2015; ISBN 978-92-9169-143-2. [Google Scholar]
  3. Shen, Y.; Wei, R.; Xu, L. Energy consumption prediction of a greenhouse and optimization of daily average temperature. Energies 2018, 11, 65. [Google Scholar] [CrossRef]
  4. Oleson, K.W.; Anderson, G.B.; Jones, B.; McGinnis, S.A.; Sanderson, B. Avoided climate impacts of urban and rural heat and cold waves over the US using large climate model ensembles for RCP 8.5 and RCP 4.5. Clim. Chang. 2015, 1–16. [Google Scholar] [CrossRef]
  5. Lhotka, O.; Kyselý, J.; Farda, A. Climate change scenarios of heat waves in Central Europe and their uncertainties. Theor. Appl. Climatol. 2017, 1–12. [Google Scholar] [CrossRef]
  6. Mann, M.E.; Rahmstorf, S.; Kornhuber, K.; Steinman, B.A.; Miller, S.K.; Coumou, D. Influence of anthropogenic climate change on planetary wave resonance and extreme weather events. Sci. Rep. 2017, 7, 45242. [Google Scholar] [CrossRef] [PubMed]
  7. Ceccherini, G.; Russo, S.; Ameztoy, I.; Romero, C.P.; Carmona-Moreno, C. Magnitude and frequency of heat and cold waves in recent decades: The case of South America. Nat. Hazards Earth Syst. Sci. 2016, 16, 821–831. [Google Scholar] [CrossRef]
  8. Fan, S.; Yang, X. Arctic and East Asia winter climate variations associated with the eastern Atlantic pattern. J. Clim. 2017, 30, 573–583. [Google Scholar] [CrossRef]
  9. Luo, X.; Zhang, Y. The linkage between upper-level jet streams over East Asia and East Asian winter monsoon variability. J. Clim. 2015, 28, 9013–9028. [Google Scholar] [CrossRef]
  10. Briner, G.; Prag, A. Establishing and Understanding Post-2020 Climate Change Mitigation Commitments; OECD: Paris, France, 2013. [Google Scholar]
  11. Tavoni, M.; Kriegler, E.; Riahi, K.; Van Vuuren, D.P.; Aboumahboub, T.; Bowen, A.; Campiglio, E.; Kober, T.; Jewell, J.; Luderer, G.; et al. Post-2020 climate agreements in the major economies assessed in the light of global models. Nat. Clim. Chang. 2015, 5, 119. [Google Scholar] [CrossRef] [Green Version]
  12. Höhne, N.; Fekete, H.; den Elzen, M.G.; Hof, A.F.; Kuramochi, T. Assessing the ambition of post-2020 climate targets: A comprehensive framework. Clim. Policy 2017, 1–16. [Google Scholar] [CrossRef]
  13. Thornton, B.A.; Rosenberg, M.A.; Richman, E.E.; Wang, W.; Xie, Y.; Zhang, J.; Cho, H.; Mendon, V.V.; Athalye, R.A.; Liu, B. Achieving the 30% Goal: Energy and Cost Savings Analysis of ASHRAE Standard 90.1-2010; U.S. Department of Energy: Washington, DC, USA, 2011.
  14. New Building Institute (NBI). Getting to Zero 2012 Status Update: A First Look at the Costs and Features of Zero Energy Commercial Buildings; NBI: Portland, OR, USA, 2012. [Google Scholar]
  15. Dall’O, G.; Belli, V.; Brolis, M.; Mozzi, I.; Fasano, M. Nearly zero-energy buildings of the Lombardy region (Italy), a case study of high-energy performance buildings. Energies 2013, 6, 3506–3527. [Google Scholar] [CrossRef] [Green Version]
  16. Li, C.; Hong, T.; Yan, D. An insight into actual energy use and its drivers in high-performance buildings. Appl. Energy 2014, 131, 394–410. [Google Scholar] [CrossRef]
  17. D’Agostino, D.; Zangheri, P.; Castellazzi, L. Towards nearly zero energy buildings in Europe: A focus on retrofit in non-residential buildings. Energies 2017, 10, 117. [Google Scholar] [CrossRef]
  18. Pérez-Lombard, L.; Ortiz, J.; Pout, C. A review on buildings energy consumption information. Energy Build. 2008, 40, 394–398. [Google Scholar] [CrossRef]
  19. Zhao, H.X.; Magoulès, F. A review on the prediction of building energy consumption. Renew. Sustain. Energy Rev. 2012, 16, 3586–3592. [Google Scholar] [CrossRef]
  20. The International Energy Agency (IEA). Modernising Building Energy Codes to Secure Our Global Energy Future; IEA: Paris, France, 2013. [Google Scholar]
  21. Krarti, M.; Deneuville, A. Comparative evaluation of optimal energy efficiency designs for French and US office buildings. Energy Build. 2015, 93, 332–344. [Google Scholar] [CrossRef]
  22. Boyano, A.; Hernandez, P.; Wolf, O. Energy demands and potential savings in European office buildings: Case studies based on EnergyPlus simulations. Energy Build. 2015, 65, 19–28. [Google Scholar] [CrossRef]
  23. Jiang, B.; Mao, P.; Tan, Y.; Yao, X. A study of climate-responsive building technologies in different climate regions of China. In Proceedings of the 20th International Symposium on Advancement of Construction Management and Real Estate, Singapore, 9 June 2016; Springer: Singapore, 2016; pp. 1111–1121. [Google Scholar] [CrossRef]
  24. Hurtado, L.A.; Rhodes, J.D.; Nguyen, P.H.; Kamphuis, I.G.; Webber, M.E. Quantifying demand flexibility based on structural thermal storage and comfort management of non-residential buildings: A comparison between hot and cold climate zones. Appl. Energy 2017, 195, 1047–1054. [Google Scholar] [CrossRef]
  25. Engelmann, P.; Kalz, D.; Salvalai, G. Cooling concepts for non-residential buildings: A comparison of cooling concepts in different climate zones. Energy Build. 2014, 82, 447–456. [Google Scholar] [CrossRef]
  26. Salvalai, G.; Pfafferott, J.; Sesana, M.M. Assessing energy and thermal comfort of different low-energy cooling concepts for non-residential buildings. Energy Convers. Manag. 2013, 76, 332–341. [Google Scholar] [CrossRef]
  27. Pfafferott, J. Enhancing the Design and the Operation of Passive Cooling Concepts: Monitoring and Data Analysis in Four Low-energy Office Buildings with Night Ventilation; Fraunhofer-IRB-Verlag: Munich, Germany, 2004; ISBN 3816766269. [Google Scholar]
  28. Lam, J.C.; Wan, K.K.; Tsang, C.L.; Yang, L. Building energy efficiency in different climates. Energy Convers. Manag. 2008, 49, 2354–2366. [Google Scholar] [CrossRef]
  29. Singh, R.; Sartor, D.; Ghatikar, G. Best Practices Guide for High-Performance Indian Office Buildings; Lawrence Berkeley National Laboratory (LBNL): Berkeley, CA, USA, 2013. [Google Scholar]
  30. Im, P.; Haberl, J.S. A survey of high performance schools. In Proceedings of the Fifteenth Symposium on Improving Building Systems in Hot and Humid Climates, Orlando, FL, USA, 24–26 July 2006; Energy Systems Laboratory: Orlando, FL, USA, 26 July 2006. Available online: http://esl.tamu.edu (accessed on 2 April 2018).
  31. Rodriguez-Ubinas, E.; Montero, C.; Porteros, M.; Vega, S.; Navarro, I.; Castillo-Cagigal, M.; Matallanas, E.; Gutiérrez, A. Passive design strategies and performance of Net EnergyPlus Houses. Energy Build. 2014, 83, 10–22. [Google Scholar] [CrossRef]
  32. Polly, B.; Gestwick, M.; Bianchi, M.; Anderson, R.; Horowitz, S.; Christensen, C.; Judkoff, R. A Method for Determining Optimal Residential Energy Efficiency Retrofit Packages; U.S. Department of Energy: Washington, DC, USA, 2011.
  33. International Energy Agency (IEA). World Energy Balances 2017 Edition; IEA: Paris, France, 2017; ISBN 978-92-64-27809-7. [Google Scholar]
  34. National Renewable Energy Laboratory (NREL). Realizing High-Performance Buildings—How to Maintain Energy-Efficient Design Intent during Building Operation; NREL: Denver, CO, USA, 2015. [Google Scholar]
  35. Day, J.K.; Gunderson, D.E. Understanding high performance buildings: The link between occupant knowledge of passive design systems, corresponding behaviors, occupant comfort and environmental satisfaction. Build. Environ. 2015, 84, 114–124. [Google Scholar] [CrossRef]
  36. Deru, M.; Field, K.; Studer, D.; Benne, K.; Griffith, B.; Torcellini, P.; Liu, B.; Halverson, M.; Winiarski, D.; Rosenberg, M.; et al. U.S. Department of Energy Commercial Reference Building Models of the National Building Stock; National Renewable Energy Laboratory (NREL): Denver, CO, USA, 2011. [Google Scholar]
  37. U.S. Department of Energy (DOE). DOE Reference Commercial Buildings Report; Prototype Building Model Package. Available online: https://www.energycodes.gov/development/commercial/prototype_models (accessed on 14 March 2018).
  38. U.S. Department of Energy (DOE). EnergyPlus Engineering Reference (Version 8.8.0 Documentation; Building Technologies Program); U.S. Department of Energy: Washington, DC, USA, 2017.
  39. Energy Information Administration (EIA). Commercial Buildings Energy Consumption Survey (CBECS). 2012. Available online: https://www.eia.gov/consumption/commercial/ (accessed on 14 March 2018).
  40. American Society of Heating, Refrigerating and Air-Conditioning Engineers (ASHRAE). Energy Standard for Buildings Except Low-Rise Residential Buildings; ANSI/ASHRAE/IESNA Standard 90.1-2004; ASHRAE: Atlanta, GA, USA, 2004. [Google Scholar]
  41. American Society of Heating, Refrigerating and Air-Conditioning Engineers (ASHRAE). Energy Standard for Buildings Except Low-Rise Residential Buildings; ANSI/ASHRAE/IESNA Standard 90.1-2010; ASHRAE: Atlanta, GA, USA, 2012. [Google Scholar]
  42. Ministry of Land, Infrastructure and Transport. Building Energy Efficiency Certification System of Korea. 2017. Available online: http://www.molit.go.kr/USR/I0204/m_45/dtl.jsp?idx=14790 (accessed on 14 March 2018).
  43. Korea Meteorological Administration (KMA). 2017 Abnormal Climate Report; KMA: Seoul, Korea, 2017; ISBN 11-1360000-000705-01. Available online: http://www.climate.go.kr/home/bbs/list.php?code=93&bname=abnormal (accessed on 14 March 2018).
  44. Korea Meteorological Administration (KMA). National Climate Data Center, Weather Data Release Portal. Available online: https://data.kma.go.kr/cmmn/main.do (accessed on 14 March 2018).
  45. World Meteorological Organization (WMO). WMO Statement on the State of the Global Climate in 2016; WMO: Geneva, Switzerland, 2016; ISBN 978-92-63-11189-0. [Google Scholar]
  46. Korea Meteorological Administration (KMA). Climate Change Outlook Report on the Korean Peninsula; KMA: Seoul, Korea, 2017; ISBN 11-1360000-000861-01. [Google Scholar]
  47. American Society of Heating, Refrigerating and Air-Conditioning Engineers (ASHRAE). ASHRAE 90.1-2010 International Climate Zone Definitions; ASHRAE: Atlanta, GA, USA, 2012; Available online: http://www.built-environments.com/International_Climate_Zones.pdf (accessed on 2 April 2018).
  48. EnergyPlus. EnergyPlus Weather Data. Available online: https://energyplus.net/weather/ (accessed on 14 March 2018).
  49. Kottek, M.; Grieser, J.; Beck, C.; Rudolf, B.; Rubel, F. World Map of the Köppen-Geiger climate classification updated. Meteorol. Z. 2006, 15, 259–263. [Google Scholar] [CrossRef]
  50. United States Government Printing Office (GPO). Energy Policy Act of 2005, Public Law 109–58, Section 914. Building Standards; 109th Congress; GPO: Washington, DC, USA, 2011. [Google Scholar]
  51. United States Government Printing Office (GPO). Energy Independence and Security Act of 2007, Public Law 110–140, Title IV-Energy Savings in Buildings and Industry, Section 401. Definitions; 110th Congress; GPO: Washington, DC, USA, 2011. [Google Scholar]
  52. International Energy Agency (IEA); Energy in Buildings and Communities Programme (EBC). Total Energy Use in Buildings: Analysis and Evaluation Methods (Annex 53); AECOM: Croydon, UK, 2016. [Google Scholar]
  53. Schicktanz, M.D.; Wapler, J.; Henning, H.M. Primary energy and economic analysis of combined heating, cooling and power systems. Energy 2011, 36, 575–585. [Google Scholar] [CrossRef]
  54. Gustafsson, M.; Thygesen, R.; Karlsson, B.; Ödlund, L. Rev-Changes in Primary Energy Use and CO2 Emissions—An Impact Assessment for a Building with Focus on the Swedish Proposal for Nearly Zero Energy Buildings. Energies 2017, 10, 978. [Google Scholar] [CrossRef]
  55. International Energy Agency (IEA). CO2 Emissions from Fuel Combustion Highlights (2017 Edition); IEA: Paris, France, 2017; ISBN 978-92-64-27818-9. [Google Scholar]
  56. Korea Energy Agency (KEA). Carbon Neutral Program Guideline; KEA: Gyeonggi-Do, Korea, 2017. [Google Scholar]
  57. Intergovernmental Panel on Climate Change (IPCC). IPCC Guidelines for National Greenhouse Gas Inventories Volume 2 Energy; IPCC: Geneva, Switzerland, 2007. [Google Scholar]
  58. Ministry of Land, Infrastructure and Transport (MOLIT); Korea Energy Agency (KEA). Building Energy Saving Design Standards of Korea; KEA: Gyeonggi-Do, Korea, 2017. [Google Scholar]
  59. Ministry of Trade, Industry and Energy (MOTIE); Korea Institute of Civil Engineering and Building Technology (KICT). The Study of the Development of Energy Performance Assessment Method and Policy in Buildings; KICT: Gyeonggi-Do, Korea, 2017. [Google Scholar]
  60. Korea Energy Agency (KEA); Korea Institute of Civil Engineering and Building Technology (KICT). Establishing Data Base of Building Energy Design Situation and Developing High Efficiency Building Design Guideline; KEA: Gyeonggi-Do, Korea, 2017. [Google Scholar]
  61. Korea Energy Agency (KEA); Korea Appraisal Board (KAB). Development of Building Energy Integrated Support System for the Spread of Low-Energy Building Workshop; Korea Energy Agency and Korea Appraisal Board DB: Gyeonggi-Do, Korea, 2016. [Google Scholar]
  62. Passive House Institute (PHI). Criteria for the Passive House, ener PHit and PHI Low Energy Building Standard; PHI: Darmstadt, Germany, 2016. [Google Scholar]
  63. Korean Institute of Architectural Sustainable Environment and Building Systems (KIAEBS). Building Airtightness Criteria. 2013. Available online: http://www.kiaebs.org/html/sub08_1.jsp?ncode=a001&num=104 (accessed on 14 March 2018).
  64. Kim, C.H.; Kim, K.S. Evaluation of thermal and visual environment for the glazing and shading device in an office building with installed of venetian blind. Korea Inst. Ecol. Archit. Environ. 2015, 15, 101–109. [Google Scholar] [CrossRef]
  65. Taylor, S.T.; Stein, J.; Paliaga, G.; Cheng, H. Dual Maximum VAV Box Control Logic. ASHRAE J. 2012, 54, 16. [Google Scholar]
  66. Pang, X.; Piette, M.A.; Zhou, N. Characterizing variations in variable air volume system controls. Energy Build. 2017, 135, 166–175. [Google Scholar] [CrossRef]
  67. Son, J.E.; Lee, K.H. Cooling energy performance analysis depending on the economizercycle control methods in an office building. Energy Build. 2016, 120, 45–57. [Google Scholar] [CrossRef]
  68. Yao, Y.; Wang, L. Energy analysis on VAV system with different air-side economizers in China. Energy Build. 2010, 42, 1220–1230. [Google Scholar] [CrossRef]
  69. Air-Conditioning, Heating, and Refrigeration Institute (AHRI). AHRI Guideline V, Calculating the Efficiency of Energy Recovery Ventilation and Its Effect on Efficiency and Sizing of Building HVAC Systems; AHRI: Arlington, TX, USA, 2011. [Google Scholar]
  70. Ministry of Trade, Industry and Energy (MOTIE). Regulation on Promoting the Supply of High-Efficiency energy Equipment; MOTIE: Sejong-si, Korea, 2017. [Google Scholar]
  71. Zhang, J.; Fung, A.S.; Jhingan, S. Analysis and feasibility study of residential integrated heat and energy recovery ventilator with built-in economizer using an excel spreadsheet program. Energy Build. 2014, 75, 430–438. [Google Scholar] [CrossRef]
  72. Kim, C.H.; Lee, S.E.; Kim, K.S. Evaluation of energy conservation rate in a energy recovery ventilator according to by-pass control. In Proceedings of the KIAEBS 2015 Fall Annual Conference, Busan, Korea, 13 November 2015; Korean Institute of Architectural Sustainable Environment and Building Systems (KIAEBS): Seoul, Korea, 2015. [Google Scholar]
  73. Pasut, W.; Bauman, F.; De Carli, M. The use of ducts to improve the control of supply air temperature rise in UFAD systems: CFD and lab study. Appl. Energy 2014, 134, 490–498. [Google Scholar] [CrossRef]
  74. Yu, K.H. A Study of Optimal Design in Underfloor Air Distribution System with Plenum Chamber. Ph.D. Dissertation, Hanyang University, Seoul, Korea, 2016. [Google Scholar]
  75. Yu, K.H.; Yoon, S.H.; Jung, H.K.; Kim, K.H.; Song, K.D. Influence of lighting loads upon thermal comfort under CBAD and UFAD systems. Energies 2015, 8, 6079–6097. [Google Scholar] [CrossRef]
  76. Korea Hanmi Publishing Company. Monthly Journal of Equipment Technology; Korea Hanmi Publishing Company: Seoul, Korea, 2013; ISSN 1739-5836. [Google Scholar]
  77. Virta, M.; Butler, D.; Graslund, J.; Hogeling, J.; Kristiansen, E.L.; Reinikainen, M.; Svensson, G. Chilled Beam Application Guidebook; Federation of European Heating, Ventilation and Air-conditioning Associations (REHVA): Brussels, Belgium, 2006; ISBN 978-2960046830. [Google Scholar]
  78. Rhee, K.N.; Shin, M.S.; Choi, S.H. Thermal uniformity in an open plan room with an active chilled beam system and conventional air distribution systems. Energy Build. 2015, 93, 236–248. [Google Scholar] [CrossRef]
  79. Rhee, K.N.; Choi, S.H.; Kim, C.H. Comparative evaluation of the thermal uniformity in a space with active chilled beam and conventional air conditioning systems. J. Archit. Inst. Korea Plan. Des. 2014, 30, 199–206. [Google Scholar] [CrossRef]
  80. Kim, C.H.; Lee, S.E.; Yu, K.H.; Kim, K.S. An analysis of the energy performance and thermal comfort in an office building with active chilled beam system. In Proceedings of the SAREK 2016 Summer Annual Conference, Pyeongchang, Korea, 22–24 June 2016; The Society of Air-Conditioning and Refrigerating Engineers of Korea (SAREK): Seoul, Korea, 2016. [Google Scholar]
  81. Weiss, M.; Dittmar, L.; Junginger, M.; Patel, M.K.; Blok, K. Market diffusion, technological learning, and cost-benefit dynamics of condensing gas boilers in the Netherlands. Energy Policy 2009, 37, 2962–2976. [Google Scholar] [CrossRef]
  82. Satyavada, H.; Baldi, S. Monitoring energy efficiency of condensing boilers via hybrid first-principle modelling and estimation. Energy 2018, 142, 121–129. [Google Scholar] [CrossRef]
  83. Tran, D.A.T.; Chen, Y.; Chau, M.Q.; Ning, B. A robust online fault detection and diagnosis strategy of centrifugal chiller systems for building energy efficiency. Energy Build. 2015, 108, 441–453. [Google Scholar] [CrossRef]
  84. Wang, H. Empirical model for evaluating power consumption of centrifugal chillers. Energy Build. 2017, 140, 359–370. [Google Scholar] [CrossRef]
  85. Korea Energy Agency (KEA). Energy GHG Technology Information Platform Service, Saving Technology DB. Available online: http://tips.energy.or.kr/main/main.aspx (accessed on 14 March 2018).
  86. The Society of Air-Conditioning and Refrigerating Engineers of Korea (SAREK). Planning Technology Roadmap for Refrigeration Sector Final Report; SAREK: Seoul, Korea, 2008. [Google Scholar]
  87. Ministry of Trade, Industry and Energy (MOTIE). Act on the Development, Utilization and Promotion of New Renewable Energy; MOTIE: Sejong-si, Korea, 2017. [Google Scholar]
  88. Korean Standards Association (KSA). KS B ISO 13256-2 Part 2 Water-to-Water and Brine-to-Water Heat Pumps; KSA: Seoul, Korea, 2014. [Google Scholar]
  89. Gschwend, A.; Menzi, T.; Caskey, S.; Groll, E.A.; Bertsch, S.S. Energy consumption of cold climate heat pumps in different climates–Comparison of single-stage and two-stage systems. Int. J. Refrigeration 2016, 62, 193–206. [Google Scholar] [CrossRef]
  90. Miara, M.; Cunther, D.; Langner, R.; Helmling, S. Efficiency of Heat Pumps in Real Operating Conditions–Results of three Monitoring Campaigns in Germany; Federation of European Heating, Ventilation and Air-conditioning Associations (REHVA) Journal: Brussels, Belgium, 2014. [Google Scholar]
  91. Walter, T.; Sohn, M.D. A regression-based approach to estimating retrofit savings using the Building Performance Database. Appl. Energy 2016, 179, 996–1005. [Google Scholar] [CrossRef]
  92. Sandberg, N.H.; Sartori, I.; Heidrich, O.; Dawson, R.; Dascalaki, E.; Dimitriou, S.; Vimm-r, T.; Filippidou, F.; Stegnar, G.; Šijanec Zavrl, M.; et al. Dynamic building stock modelling: Application to 11 European countries to support the energy efficiency and retrofit ambitions of the EU. Energy Build. 2016, 132, 26–38. [Google Scholar] [CrossRef]
  93. Asadi, E.; Da Silva, M.G.; Antunes, C.H.; Dias, L. Multi-objective optimization for building retrofit strategies: A model and an application. Energy Build. 2012, 44, 81–87. [Google Scholar] [CrossRef]
  94. Morofsky, E.; Cane, D. Low-energy building design, economics and the role of energy storage. In Proceedings of the 9th International Conference on Thermal Storage, Warsaw, Poland, 1–4 September 2003; Warsaw University of Technology, Institute of Heat Engineering: Warsaw, Poland, 2013. [Google Scholar]
  95. Ferrara, M.; Fabrizio, E.; Virgone, J.; Filippi, M. A simulation-based optimization method for cost-optimal analysis of nearly Zero Energy Buildings. Energy Build. 2014, 84, 442–457. [Google Scholar] [CrossRef]
  96. Kneifel, J. Life-cycle carbon and cost analysis of energy efficiency measures in new commercial buildings. Energy Build. 2010, 42, 333–340. [Google Scholar] [CrossRef]
  97. Cho, J.K.; Shin, S.H.; Kim, J.H.; Hong, H.K. Development of an energy evaluation methodology to make multiple predictions of the HVAC&R system energy demand for office buildings. Energy Build. 2014, 80, 169–183. [Google Scholar] [CrossRef]
  98. National Assembly Research Service (NARS). Status of Zero Energy Buildings and Improvement Tasks; NARS: Seoul, Korea, 2017. [Google Scholar]
  99. Ministry of Land, Infrastructure and Transport (MOLIT); Korea Institute of Civil Engineering and Building Technology (KICT). A Study on the Improvement and Supporting System for the Activation of Zero Energy Building; KICT: Sejong-si, Korea, 2017. [Google Scholar]
  100. Hamdy, M.; Hasan, A.; Siren, K. A multi-stage optimization method for cost-optimal and nearly-zero-energy building solutions in line with the EPBD-recast 2010. Energy Build. 2013, 56, 189–203. [Google Scholar] [CrossRef]
  101. Kurnitski, J.; Saari, A.; Kalamees, T.; Vuolle, M.; Niemelä, J.; Tark, T. Cost optimal and nearly zero (nZEB) energy performance calculations for residential buildings with REHVA definition for nZEB national implementation. Energy Build. 2011, 43, 3279–3288. [Google Scholar] [CrossRef]
  102. Congedo, P.M.; D’Agostino, D.; Baglivo, C.; Tornese, G.; Zacà, I. Efficient solutions and cost-optimal analysis for existing school buildings. Energies 2016, 9, 851. [Google Scholar] [CrossRef]
  103. Congedo, P.M.; Baglivo, C.; D’Agostino, D.; Zacà, I. Cost-optimal design for nearly zero energy office buildings located in warm climates. Energy 2015, 91, 967–982. [Google Scholar] [CrossRef]
  104. Sanchez, M.C.; Brown, R.E.; Webber, C.; Homan, G.K. Savings estimates for the United States Environmental Protection Agency’s ENERGY STAR voluntary product labeling program. Energy Policy 2008, 36, 2098–2108. [Google Scholar] [CrossRef]
  105. Residential Energy Services Network (RESNET). Available online: http://www.hersindex.com/ (accessed on 25 March 2018).
  106. Solar America Cities Program. Available online: http://www.solarknoxville.org/program/ (accessed on 25 March 2018).
  107. Federal Ministry for Economic Affairs and Energy. Available online: https://www.bmwi.de/Redaktion/EN/Artikel/Energy/nape-neuerungen-im-ueberblick-01-03.html (accessed on 25 March 2018).
  108. Department of Energy & Climate Change. Evaluation of the Low Carbon Buildings Programme, Undertaken by Ipsos MORI and CAG consultants for the Department of Energy and Climate Change; Department of Energy & Climate Change: London, UK, 2011. [Google Scholar]
  109. Ministère de la Transition Écologique et Solidaire. Available online: https://www.ecologique-solidaire.gouv.fr/eco-pret-taux-zero-eco-ptz (accessed on 25 March 2018).
  110. Ayoub, N.; Yuji, N. Governmental intervention approaches to promote renewable energies—Special emphasis on Japanese feed-in tariff. Energy Policy 2012, 43, 191–201. [Google Scholar] [CrossRef]
  111. Korea Energy Economics Institute. Examples of Policy and Implications of Building Energy in Major Countries, Energy Focus; Korea Energy Economics Institute: Seoul, Korea, 2013. [Google Scholar]
  112. Ministry of Land, Infrastructure and Transport (MOLIT); Korea Institute of Civil Engineering and Building Technology (KICT). Study on Greenhouse Gas Reduction Plan for Climate Change Response Buildings; KICT: Gyeonggi-Do, Korea, 2009. [Google Scholar]
Figure 1. Flow diagram of this study.
Energies 11 00884 g001
Figure 2. (a) Incheon’s average annual temperature changes; (b) average summer temperature changes, and (c) average winter temperature changes.
Energies 11 00884 g002
Figure 3. Frequency analysis on the number of summer days and frost days in Incheon.
Energies 11 00884 g003
Figure 4. The two selected regions (Incheon and Jeju).
Energies 11 00884 g004
Figure 5. Comparison of the average monthly outdoor air temperature and relative humidity.
Energies 11 00884 g005
Figure 6. Method for realizing high-performance buildings.
Energies 11 00884 g006
Figure 7. Diagram of primary energy consumption and CO2 emissions of buildings.
Energies 11 00884 g007
Figure 8. Estimated shares of global anthropogenic GHGs, 2014 [55].
Energies 11 00884 g008
Figure 9. Simulation base model.
Energies 11 00884 g009
Figure 10. Simplified diagram of energy-saving technologies.
Energies 11 00884 g010
Figure 11. Primary energy consumptions and energy saving potential (%) of Case 1 and Case 2.
Energies 11 00884 g011
Figure 12. Primary energy consumptions and energy saving potential (%) of Case 3, Case 4, and Case 5.
Energies 11 00884 g012
Figure 13. Primary energy consumptions and energy saving potential (%) of Case 6.
Energies 11 00884 g013
Figure 14. Primary energy consumptions and energy saving potential (%) of Case 7 and Case 8.
Energies 11 00884 g014
Figure 15. Primary energy consumptions and energy saving potential (%) of Case 9 and Case 10.
Energies 11 00884 g015
Figure 16. Primary energy consumptions and energy saving potential (%) of Case 11, Case 12, and Case 13.
Energies 11 00884 g016
Figure 17. Primary energy consumptions and energy saving potential (%) of Case 14 and Case 15.
Energies 11 00884 g017
Figure 18. Primary energy consumptions and energy saving potential in each technology (Incheon).
Energies 11 00884 g018
Figure 19. Primary energy consumptions and energy saving potential in each technology (Jeju).
Energies 11 00884 g019
Figure 20. CO2 emissions and reduction potential (%) of each technology in (a) Incheon and (b) Jeju.
Energies 11 00884 g020
Figure 21. Correlation between primary energy consumptions and CO2 emissions in (a) Incheon and (b) Jeju.
Energies 11 00884 g021
Figure 22. Cooling and heating efficiency system distributions of 15 cases (Incheon and Jeju).
Energies 11 00884 g022
Table 1. Detailed climate characteristics of the two regions.
Regions ASHRAE ClimateKöppen ClimateLatitude N (°)
Longitude E (°)
Outdoor Air Temperature
(Monthly Average)
Min/Avg/Max (°C)
Relative Humidity
(Monthly Average)
Min/Avg/Max (%)
HDD (18 °C)CDD (10 °C)
Incheon4A
(Mixed-Moist)
Dwa37.45/126.70−2.2/12.7/27.546.5/68.8/87.627492327
Jeju3A
(Warm-Moist)
Cfa33.49/126.464.1/18.6/31.453.1/73.5/92.116212632
Table 2. The building energy efficiency certification system in Korea (for non-residential buildings).
LevelPrimary Energy Consumption
Per Unit Area (kWh/m²·a)
LevelPrimary Energy Consumption
Per Unit Area (kWh/m²·a)
1+++E < 803320 ≤ E < 380
1++80 ≤ E < 1404380 ≤ E < 450
1+140 ≤ E < 2005450 ≤ E < 520
1200 ≤ E < 2606520 ≤ E < 610
2260 ≤ E < 3207610 ≤ E < 700
Table 3. Primary energy factors in Korea [42].
Energy Supply SectorPrimary Energy Factors in Korea
Fuel (coal, oil, gas)1.1
Electric power2.75
District heating0.728
District cooling0.937
Table 4. CO2 emissions around the world/million tons of CO2.
World1990199520002005201020142015Growth Rate
1990–2015
Korea231.7357.1431.7457.5550.7567.8586.0152.9%
OECD Asia Oceania1588.01821.21991.52099.62150.62218.02201.938.7%
OECD Europe3924.13833.23899.44037.23801.63397.83447.6−12.1%
OECD Americas5508.35850.46567.06710.26384.46232.46060.710.2%
Table 5. CO2 emission factors according to energy supply sector.
Energy Supply SectorCO2 Emission Factors (kgCO2/TJ)CO2 Emission Factors (kgCO2/kWh)
Electric power129,6310.4663
LNG(Natural gas)56,4670.2031
Gas/Diesel oil72,6000.2612
Table 6. Properties of Base Simulation Model.
Energies 11 00884 i001
Table 7. Primary energy consumption in Incheon and Jeju (Base model).
Primary Energy Consumptions in Incheon and Jeju (kWh/m2a)
IncheonJeju
Heating energy126.5Heating energy104.6
Cooling energy198.7Cooling energy247.9
Fan & Other energy76.8, 62.0Fan & Other energy74.0, 58.5
Total energy464.1 (Level 5)Total energy485.1 (Level 5)
Table 8. Set of simulation variables (passive, active, and renewable energy systems for energy saving). (Grey: base, Blue: passive systems, Pink: air-conditioning systems, Yellow: plant systems, Purple: renewable systems).
Energies 11 00884 i002

