An Investigation on Flame Shape and Size for a High-Pressure Turbulent Non-Premixed Swirl Combustion


National Thermal Power Engineering & Technology Research Center, North China Electric Power University, Beijing 102206, China
*
Author to whom correspondence should be addressed.
Energies 2018, 11(4), 930; https://doi.org/10.3390/en11040930
Submission received: 13 March 2018
/
Revised: 9 April 2018
/
Accepted: 10 April 2018
/
Published: 13 April 2018
(This article belongs to the Section I: Energy Fundamentals and Conversion)
Abstract
:Flame shape and size for a high-pressure turbulent non-premixed swirl combustion were experimentally investigated over a wide range of varying parameters including fuel mass flow rate, combustor pressure, primary-air mass flow rate, and nozzle exit velocity. A CFD simulation was conducted to predict the flame profile. Meanwhile, a theoretical calculation was also performed to estimate flame length. It was observed that flame length increased linearly with increasing fuel mass flow rate but decreased with the increment of combustor pressure in the power function. The flame diminished at a larger primary-air mass flow rate but remained unaffected by the increasing nozzle exit velocity. Considering the global effect of all parameters at a particular pressure, the flame length generally decreased as the primary-air to fuel ratio increased. This was attributed to the reduced air entrainment required to dilute the fuel to stoichiometric proportions. The CFD simulation offered a good prediction of the variation trends of flame length, although some deviations from experimental values were observed. The theoretical calculation estimated the trends of flame length variation particularly well. Nevertheless the difference between the theoretical and experimental results was found to be due to the swirl influence. Hence, a swirl factor was proposed to be added to the original equation for swirl flames.
1. Introduction
Flame shape and size are crucial parameters, which have to be carefully considered when designing and operating a combustion device since they determine many combustion features, e.g., the temperature field, pollutant emission, combustion efficiency, and material safety.
Turbulent non-premixed flame geometric properties have been investigated extensively. Various geometrical characteristics considered in the present investigation include flame shape, flame length Lf [1], flame width w [2,3], flame center and flame center length Lc [4,5,6]. In particular, Lf is given primary consideration relative to other flame aspects. The flame dimensions are defined as shown in Figure 1. Classically, flame length Lf is determined as the distance between the burner exit and the axis point of the stoichiometric line. For an over-ventilated flame where more than a stoichiometric oxidizer is supplied in the surroundings to burn the fuel continuously, Lf can be described by Equation (1)
Flame width w is the stoichiometric width at its broadest section, i.e., maximum flame diameter. The flame center is applied to consider intensively the flame position as a point, which is calculated using the concept of gravity center. For calculating the gravity center, each pixel is considered as a local position, and the intensity of each pixel represents its mass. The same mathematical method is used to determine the flame center. The flame position is indicated by the flame center length Lc, which is defined as the distance between the flame center and the injection nozzle exit.
Interest in being able to interpret and estimate turbulent jet flame length has a long history. The earliest studies were derived from those of Hottel [7], Hawthorne et al. [8], and Wohl et al. [9] reported in the late 1940s and early 1950s. Major reviews of this topic were performed by Becker and Liang [10], Delichatsios [11], and Blake and McDonald [12].
In recent decades, Chen and Driscoll [13] studied flame length for swirl intensity; it was found that Lf has a different scaling in swirl flames than for simple jet flames. Swirl flame length shortens significantly in comparison to flame with no swirl, due to the enhanced fuel-air mixing rate caused by the addition of swirl. Peters and Göttgens [14] derived approximate solutions for large buoyant jet diffusion flames into still and horizontally co-flowing air. They obtained a closed form solution for the Lf of vertical flames as a function of the Froude number. It was concluded that, in the buoyancy-controlled regime, their expression yields asymptotically a Froude number dependence of Fr1/5, which is in good agreement with measurements. While for the momentum-controlled regime, Lf is independent of Froude number. Røkke et al. [15] experimentally investigated Lf of unconfined turbulent partially premixed propane/air flames; the results revealed that Lf has a strong dependence on the ratio of the nozzle outlet velocity to the outlet diameter, the Froude number, and the fuel mass fraction. Mei et al. [16] studied the effects of coflow velocity on flame shape and size by performing CFD calculation. Giorgi et al. [17] observed the flame structure for an inverse diffusion combustion with a chemiluminescence emission method. Wang et al. [18] examined the evolution of the flame length of a buoyant jet diffusion flame restricted by parallel sidewalls at reduced pressure; they pointed out that the flame length at decreased pressure is found to be slightly longer than that at normal pressure.
The main factors affecting turbulent flame length are (a) the flame Froude number, Frf, (b) the stoichiometric mixture fraction, fs, (c) the ratio of nozzle fluid to ambient gas density, ρe/ρ∞, (d) the initial jet diameter, dj. Based on the analysis presented by Delichatsios [11] and Bahadori et al. [19], a global flame Froude number can be expressed as Equation (2):
where ρe is the density of nozzle fluid, and ρ∞ is the ambient fluid density. Tf represents the flame temperature, which is approximately equal to the adiabatic flame temperature Tad while T∞ is the ambient fluid temperature. Moreover, g is the acceleration of gravity, dj is the nozzle exit diameter, and ve is the nozzle exit velocity, which is calculated by Equation (3)
where ṁe stands for the mass flow rate of nozzle fluid.
The stoichiometric mixture fraction, fs is calculated by Equation (4).
where ṁair stands for air mass flow rate, ṁfuel stands for fuel mass flow rate, and the subscript stoic represents stoichiometric.
The flame Froude number Frf is used to characterize the relative importance of the initial jet momentum flux and buoyant forces acting on the flame. For smaller values of Frf, the flame is controlled by buoyancy, which is caused by significant density differences produced during combustion. While for larger values, the initial jet momentum dominates the mixing as well as the velocity field within the flame.
The combined impact of the above four primary factors on flame length is given by Equations (5) and (6) corresponding to two regimes respectively [11].
For a buoyancy-controlled regime, Frf < 5
For a momentum- controlled regime, Frf ≥ 5
It should be noted that in Equation (6), i.e., for momentum-dominated flame, Lf does no longer vary with Frf, so Frf is not included in this equation.
Some analysis based on theoretical Equations (5) or/and (6) are presented as follows. Choudhuri and Gollahalli [20] performed an investigation on flame length for hydrogen–hydrocarbon composite fuel turbulent jet flames. They found that the numerically predicted flame length showed a similar trend to experimental ones, although the predicted values were higher than the measured values by a factor of approximately 1.4. Yang and Blasiak [21] numerically studied the influences of oxygen concentration, oxidizer temperature, fuel temperature, fuel flow rates, and fuel nozzle diameter on the flame volume and size. They derived a simple correlation of the flame length and volume relative to the flow parameters for the high-temperature air combustion condition. Kim et al. [22] proposed a modified correlation between dimensionless flame lengths and a flame Froude number to estimate Lf for the two kinds of oxy-fuel combustors. Hu et al. [23] measured flame length at a reduced atmospheric pressure for turbulent buoyant jet diffusion flames; it was reported that the normalized Lf was longer in the lower pressure atmosphere. The flame length data was successfully collapsed with theory, although a factor of 0.8 was required globally to include influences of decreased entrainment and increased fluctuation at lower pressure.
In our investigation, flame shape and size for a high-pressure turbulent swirl non-premixed flame were studied experimentally and numerically under various operating conditions. These varying conditions include fuel flow rate ṁF, combustor pressure P, primary air flow rate ṁpri, and nozzle exit velocity ve. Meanwhile, a theoretical calculation for Lf was also performed to obtain its prediction performance by comparing with measurements.
2. Experimental Setup
2.1. Experimental Apparatus
For this study, a 20 kW high-pressure combustion test facility was installed, which mainly consists of three sections, as displayed in Figure 2.
- (1)
- The supply section, where fuel (methane) is supplied with a gasholder. The fuel is controlled and measured with a mass flow controller VF-100-SONARtrac, with a maximum fuel mass flow rate of 36 g/min. Air is provided by an air compressor, which has a maximum total air mass flow rate of 2.5 kg/min. The air mass flow rate is regulated using an electric control valve EV-25PCUN40RPF and measured with an air flow meter LUGB-2405-P4.
- (2)
- The combustion chamber, which is an axisymmetric cylindrical chamber, has a diameter of 0.3 m and height of 1.35 m, as displayed in Figure 3. This combustion chamber is primarily composed of four components: swirl injector, wind distributing plate, annular cooling slot close to the inner wall, and combustor. The swirl injector is employed for improving mixing quality, as shown in Figure 4. A portion of air flows tangentially through a radical swirler to carry fuel supplied by a central fuel nozzle into the combustor where combustion occurs. This portion of air is called primary air. The methane and primary air mix with each other partially in the injector sector; this mixing degree is not complete as the distance where mixing can occur is relatively short. The rest of the air flows through small holes in the air distributing plate and annular slot close to the inner wall. This air cools the metal material, thus, avoiding heat damage and then blends with the combustion gas. There is an optically accessible window mounted on the combustor wall, which is employed to record the flame zone.
- (3)
- The exhaust section consists of two components: a pressure regulating valve and an induced draught system. The pressure regulating valve controls the combustor operating pressure. The induced draught system is applied to induce exhaust gas to the atmospheric environment.
2.2. Measurement Methods
To determine the location of flame zone, CO2* chemiluminescence was used [24,25,26], where the asterisk refers to electronically-excited molecules. As an indicator of the reaction zone, the formation of CO2* contains three elementary steps in Equation (7) [24].
The first step is a three-body reaction, which indicates the production of CO2*. Afterward, CO2* returns to the ground state through the second and third step. The second step reaction is responsible for the emission of light by CO2* and competes with the third step reaction which is a quenching step.
The flame shape was acquired by recording the CO2* chemiluminescence image through the optical window, using a high-speed camera (Olympus i speed 3) coupled to a band filter (BG 38) with a bandwidth of 340–600 nm, as shown in Figure 5. The recording frame rate was 400 frames per second, and a total of 800 consecutive frames were averaged to obtain an averaged flame image at each condition, which was then used to analyze the flame shape and size.
2.3. Experimental Conditions
For the convenience of analyzing, the primary air ṁpri (which is the air through the swirl burner) was calculated. As shown in Figure 6, a 3D CFD cold simulation (total air = 0.05 kg/s, not the test condition in the present work) revealed that the primary air ṁpri was 0.05 times of the total air by mass flow rate ṁA, and this relation remained unchanged for various operating conditions, i.e., ṁpri = 0.05 ṁA.
To investigate the influence of the operating conditions on flame shape and size, test cases were classified into three categories, as shown in Table 1. Case I was used to study: (i) the effect of fuel mass flow rate ṁF at a fixed ṁA under different combustor pressures P; and (ii) the effect of combustor pressure P (4–6 bar) at a fixed ṁF and ṁA. Case II was used to study the effect of the primary air mass flow rate ṁpri at a given ṁF. Case III was used to study the effect of the nozzle exit velocity ve at a nearly constant ṁpri/ṁF, where ve is calculated by Equation (3).
3. CFD Simulation Setup
A CFD steady calculation was conducted using the commercial software FLUENT 6.3 (ANSYS, Canonsburg, PA, USA). For detailed descriptions on the fundamental conservation equations of mass, momentum, and energy, please refer to the FLUENT 6.3 help documents [27]. As the actual 3D geometry of the combustor is very complicated, the numerical simulation was performed using a 2D axisymmetric model to reduce computational cost, as displayed in Figure 7. In this 2D model, some simplifications were employed for the ease of calculation. The holes in the distributing plate were omitted, as the air through them is minute. Air enters into the combustor from two annular inlets, air inlet 1 and air inlet 2, where the air through inlet 1 is the primary air. The swirler was also omitted. Instead, the swirl was simulated by defining the air flow direction of inlet 1 when setting the boundary conditions. The mesh consisted of 39,435 quadrilateral cells over the whole computational domain. Finer grids were generated particularly in the regions near the fuel nozzle, air inlet, and flame axis. Additionally, another refined mesh consisting of 72,863 quadrilateral cells was generated for verifying the grid-independency of the predicted results. The verification results are displayed in Figure 8; one can see that the temperature fields and CO2 mass fractions for Case 1 using two distinct cells are kept at high consistency, which means the simulation result no longer changes with the increasing mesh cells. Therefore the 39,435 cells mesh scheme was used for simulating the rest of the other cases.
The realizable k-ε turbulence model with standard wall function was used as a viscous model. The eddy dissipation model (EDM) [27,28] was considered as a combustion model. This model is based on the mixed-is-burned approximation, which is usually acceptable for non-premixed flames, where turbulence slowly mixes fuel and oxidizer into the reaction zones in which they burn quickly. This approximation assumes that combustion is mixing-limited, allowing neglection of the complicated chemical kinetic rates and assuming instantaneous ignition upon mixing. With EDM, the net rate of production of species i due to reaction r, Ri,r is determined by the smaller (that is, the limiting value) of the two Equations (8) and (9)
where YP stands for the mass fraction of any product species P, stand for the mass fraction of a particular reactant , A is an empirical constant equal to 4.0, and B is an empirical constant equal to 0.5.
To calculate the flame zone, the simple one-step methane–air global reaction was used. As a product of this reaction, the CO2 mass fraction field in the simulation result was considered as a numerical flame zone. The discrete ordinate radiation model (DO) with a weighted sum of the gray gas model (WSGGM) was employed as a radiation model.
As for the boundary conditions, the fuel inlet, air inlet 1, and air inlet 2 were set to mass flow inlets. The mass flow rate of air inlet 1 is ṁpri, as shown in Table 1. The mass flow rate of inlet 2 is the difference between ṁA and ṁpri, i.e., ṁA − ṁpri. A flow direction vector was defined to simulate the swirl of air inlet 1, where the axial-component, radial-component and tangential-component of the flow direction were 1, 0 and 0.7 respectively, according to the corresponding 3D CFD calculation results. The outlet was set to the pressure outlet; the wall was set to adiabatic boundary conditions, as negligible heat transfers to the surrounding due to its low temperature resulting from the cold air through air inlet 2. The pressure-velocity coupling was solved using the SIMPLE algorithm, and the convective terms in all governing equations were discretized using the second-order upwind scheme.
4. Results and Discussion
4.1. Theoretical Results of Flame Length
For the sake of convenience and simplicity of computation in the present situation, the mixture of fuel and primary air is regarded as a nozzle exit fuel mixture ṁe. This simplifies the calculation of fs with Equation (4) which is then used to estimate flame length with theoretical Equations (5) or (6) for all cases. Thus, with changing methane or primary air at different conditions, distinct fuel mixtures are produced which have different fs. It should be noted that the mixing degree of mixture fuel depends upon the level of mixing achieved within the nozzle convergent section. The density of nozzle exit mixture fuel ρe remained nearly equal to ambient air density ρ∞, i.e., ρe = ρ∞ = ρA since the percentage of primary air ṁpri in the nozzle fluid was more than 84% for all cases. The nozzle throat, as shown in Figure 4, is considered as the nozzle injection exit with a diameter of 0.01 m, i.e., dj = 0.01 m. Therefore, Lf is the distance between the flame tip and nozzle throat. The Tf for all measured flames is approximately 2300 K (obtained in CFD results), and T∞ is 288 K. ve is obtained by Equation (3), where ṁe = (ṁF + ṁpri)/60,000.
The results of Lf with theory calculation are shown in Table 2; one can see that the values of Frf for all cases are smaller than 5, which indicates that buoyancy dominates the flame. Therefore Equation (5) was used to estimate the flame length for all cases. The results of theoretical Lf are plotted to compare with the experimental and numerical Lf in the next sections to determine the theoretical prediction performance.
4.2. Effects of Fuel Mass Flow Rate
Figure 9 shows the experimental and CFD flame images for fuel mass flow rate ṁF under varying combustor pressures P in Case I (Case 1–9). Note that the experimental flame base is the nozzle divergent end, so the measured flame size shown in images (a), (c), and (e) needs to be summed up with the distance between the nozzle divergent end and the throat to obtain the experimental Lf since the throat is regarded as the nozzle injection exit. One can see that the experimental flame shape elongates and widens as ṁF increases at a fixed P, which is explained by the increase in axial and radial diffusion of the fuel at higher ṁF. The CFD results agreed well with the measurements in the variation trends of flame appearance.
In Figure 10a, Lf increased with the increment in ṁF at a fixed P for experimental, CFD, and theoretical results. All three had a linear relation with ṁF; this phenomenon was also observed in previous research for turbulent swirl flames [13]. The increasing trend of Lf can be primarily attributed to the enhanced axial diffusion of the fuel. Moreover, more ambient air needs to be entrained to reach stoichiometric proportions. Both numerical and theoretical solutions gave a good prediction of the variation trend of Lf although the values were overestimated to some extent. The enlargement of theoretical Lf is primarily due to the decreased fs of the fuel mixture, which is caused by growing methane, according to Equations (4) and (5). Theoretical Lf was almost double the measured Lf, this difference mainly resulted from the swirl influences, since the addition of swirl can shorten Lf significantly in comparison to the flame with no swirl, as mentioned earlier [13]. However, swirl effect is not contained in Equation (5). Consequently, the present result estimated with Equation (5) is greater than the experimental one by a factor of two.
To consider the swirl effects on flame length, a coefficient could be supplemented as a swirl factor Sf in Equations (5) and (6) to apply them for swirl flames, i.e., Equations (10) and (11)
For a swirl buoyancy-controlled regime, Frf < 5
For a swirl momentum- controlled regime, Frf ≥ 5
The value for swirl factor Sf depends upon the specific swirl flames and could be determined by particular approaches, e.g., measuring flame lengths with swirl and no swirl for a wide range of operating conditions, such as the method in reference [13], all which are beyond the scope of the present article. In the current experimental situation, this factor seems to be approximately 0.5, with which the theoretical estimations are in good agreement with the test data.
Figure 10b indicates that flame width increased with ṁF at a fixed P for both experimental and CFD results. Since fuel flows along the flame axis and diffuses radially outward, while the air diffuses radically inward, increasing the fuel enlarges the radial position where fs is achieved, and thus a wider flame is produced. The slope of the CFD results is smaller than the experimental ones, which may due to the simplicity of the one-step reaction mechanism in calculating flame width. Figure 10c shows the variation in flame position; as ṁF increased at a given P, the experimental flame center length also increased, this means that the flame moved further downstream, which corresponds to the variation of the flame length.
4.3. Effects of Combustor Pressure
It also can be seen in Figure 9, as the combustor pressure P increased at a given ṁF, the experimental flame shape became shorter and wider, this phenomenon was also observed in [23]. It could be associated with the declined axial diffusion, and enhanced radial diffusion of the fuel at higher P. The measured flame length diminished with the increment of P at a fixed ṁF, as displayed in Figure 11. This trend was also found in [29], where it was pointed out that Lf is proportional to P−2/3, i.e., Equation (12), obtained by introducing the perfect gas state relation Equation (13) in Equation (14).
where Q is the heat release rate, Cp∞ is the specific heat.
The curves in Figure 11 correspond to the fitting results under various fuel mass flow rates using power function y = axb. Values for exponent b for ṁF = 8 g/min, 10 g/min, 12 g/min are −0.7, −0.73, −0.5 respectively, which approaches the exponent −2/3 in Equation (12).
Figure 10 also shows that experimental flame width increased with the increment of P, and the flame position moved upstream at higher pressure. However, the numerical Lf and w remained consistent as P increased; CFD prediction did not capture the effect of P. Theoretical Lf showed a different varying trend with the increase of P for different ṁF.
4.4. Effects of Primary Air Mass Flow Rate
Figure 12 displays the influence of primary air ṁpri on flame shape. As mentioned before, ṁpri increases with the increase of total air, and ṁpri = 0.05 ṁA. It can be seen that the experimental flame zone decreased gradually with the increment in ṁpri and the flame volume became smaller. The CFD flame appearance had the same decreasing trend as the experimental result.
A shorter flame length was observed at higher primary air condition as shown in Figure 13a. Lf diminished with the increase in the primary air for measurement. This phenomenon is mainly attributed to the reduced air entrainment required for diluting the fuel to stoichiometric proportions. A similar result was stated in previous research [30], which measured the flame length for the fuel added with various quantities of air before combustion. Here, considering the primary air in the present experiment as the premixing air of [30], although the primary air does not mix with the fuel entirely as premixing air due to a short mixing distance, then from a qualitative level, the effect of both on flame length is analogous. CFD simulation predicted the diminishing trend of Lf correctly with a nearly equivalent slope, despite some discrepancies in values. The theoretical Lf also showed a consistent decreasing trend as the measured Lf, according to Formula (5). This decreasing Lf can be explained by increasing fs as the primary air becomes larger. However, the values for theoretical Lf were almost twice the measured Lf, this difference is due to the swirl effects, as mentioned above.
Figure 13b illustrates the relation between flame width w and primary air ṁpri. Simulation results agreed well with experimental data; both showed a decrease in w when ṁpri increased. Diminishing w results from the reduced radial entrained air required to produce the flame surface. In Figure 13c, the experimental flame center length Lc diminished with increasing ṁpri, which indicates that the flame position moved upstream for larger ṁpri.
4.5. Effects of Nozzle Exit Velocity
Figure 14 displays the variation in flame shape with an increase in nozzle exit velocity ve at a nearly fixed ṁpri/ṁF. Good agreement was observed in the trends of flame appearance versus ve between experimental images and the CFD solutions. Both illustrate that the flame zone remained unchanged with increasing ve, in other words, the flame volume did not obviously change. This can be attributed to the simultaneously increasing ṁF and ṁpri with ṁpri/ṁF = constant. On the one hand, increasing ṁF is conducive to the enlargement of the flame zone, as discussed in Section 4.2. However, on the other hand, increasing ṁpri is contributive to the reduction of flame volume, as stated in Section 4.4. Both effects seem to cancel each other out. As a result, flame shape and size remain nearly unchanged.
The result in Figure 15a indicates that flame length remained almost unchanged for the experimental data. Since fs was nearly unchanged as ve increased at a given ṁpri/ṁF, as displayed in Table 2, consequently, according to Equation (5), Lf remained unchanged. The numerical and theoretical methods gave good estimations of the variation trend of Lf; nevertheless, some deviations of values were observed. The difference between theoretical and experimental Lf is also attributed to swirl influence.
Figure 15b shows a rise and fall in flame width w with increasing ve for the experimental case; this could have resulted from the flame instabilities. CFD w showed a slight fluctuation as ve increased, a small deflection is found between the numerical value and experimental value. Experimental flame center length Lc in Figure 15c did not vary with an increase in ve basically, which implies that the flame position remained unchanged.
4.6. Flame Size for Primary Air to Fuel Ratio
In order to consider the effects of the diverse operating conditions collectively, including the influences of ṁF, ṁpri, and ve at the same combustion pressure, the results of Cases 4–6 and 10–20 are plotted in Figure 16, with a common abscissa ṁpri/ṁF.
It can be seen in Figure 16, that the measured Lf generally decreases with increment of ṁpri/ṁF, due to the reduced air entrainment required to dilute the fuel to stoichiometric proportions. The CFD results successfully captured the Lf variation trends, the difference between values for experiment and numerical simulation is reasonable. The theoretical equation also provided good estimation of the variation in Lf; theoretical Lf decreased with increase in ṁpri/ṁF since fs increased with the increment in ṁpri/ṁF, as shown in Table 2. However, the values for theoretical Lf were approximately twice the experimental Lf; this difference is attributed to swirl impacts which were not involved in the theoretical formula.
The measured flame width w also showed a decreasing tendency as ṁpri/ṁF increased, due to the decreased radial air entrainment required to produce the flame zone. The CFD prediction on w was in good agreement with experimental data. The flame center length Lc for the measured result diminished with an increment in ṁpri/ṁF, which indicates that the flame moved upstream; the flame position moved closer to the nozzle as ṁpri/ṁF increased.
5. Conclusions
The flame zone for a high-pressure turbulent non-premixed swirl flame was experimentally measured at various operating conditions. Meanwhile, a 2D CFD simulation was performed to predict the flame dimensions, and a theoretical calculation was carried out to estimate the flame length. This work attempts to provide measured information, numerical simulation, and theoretical calculation on flame shape and size for a high-pressure turbulent non-premixed swirl flame. It also helps in understanding flame geometric properties. The main findings of the present paper include:
- (1)
- As fuel mass flow rate ṁF increased, the flame shape became longer and wider, flame length increased and had a linear relation with ṁF. This is attributed to the enhancement in the axial diffusion of fuel and the increase in requirement of ambient air entrainment for diluting the fuel to stoichiometric proportions.
- (2)
- As combustor pressure P increased, the flame shape shortened and widened; flame length decreased and had a power relation with P. This probably resulted from declined axial diffusion and enhanced radial diffusion of the fuel at higher P.
- (3)
- As primary air mass flow rate ṁpri increased, the flame shape became shorter and narrower. The phenomenon is mainly caused by reduced air entrainment required to achieve stoichiometric proportions.
- (4)
- As the nozzle exit velocity ve increased, flame length and width remained unchanged basically. This is mainly due to the concurrently increasing ṁF and ṁpri, with ṁpri/ṁF nearly being constant, the two effects are opposite and seem to cancel each other out.
- (5)
- In order to consider the effects of different operating conditions at the same combustor pressure collectively, the influences of ṁF, ṁpri and ve were plotted together versus ṁpri/ṁF. As ṁpri/ṁF increased, flame length and width generally diminished, which is attributed to the reduction of air entrainment.
- (6)
- CFD provided decent prediction of the varying trends of flame shape and size, although some deviations were observed, which indicates that the present simulation is a reliable prediction tool for calculating the approximate flame shape and size.
- (7)
- The theoretical flame length also showed correct estimation of the varying trends. The difference between theoretical and experimental flame length is due to the influence of swirl; to consider swirl effects, a swirl factor is proposed to be added to the original equation.
Acknowledgments
This research was supported by Beijing Natural Science Foundation (Grant No. 3162030).
Author Contributions
Zhongya Xi and Zhongguang Fu conceived and designed the experiments; Zhongya Xi, Xiaotian Hu and Yibo Jiang performed the experiments; Zhongya Xi and Xiaotian Hu analyzed the data; Syed Waqas Sabir contributed reagents/materials/analysis tools; Zhongya Xi wrote the paper.
Conflicts of Interest
The authors declare no conflict of interest.
References
- Turns, S.R. Laminar diffusion flames. In An Introduction to Combustion: Concepts and Applications; McGraw-Hill: New York, NY, USA, 2000; p. 315. ISBN 0677026900. [Google Scholar]
- Sunderland, P.B.; Mendelson, B.J.; Yuan, Z.G.; Urban, D.L. Shapes of buoyant and nonbuoyant laminar jet diffusion flames. Combust. Flame 1999, 116, 376–386. [Google Scholar] [CrossRef]
- Lin, K.C.; Faeth, G.M.; Sunderland, P.B.; Urban, D.L.; Yuan, Z.G. Shapes of nonbuoyant round luminous hydrocarbon/air laminar jet diffusion flames. Combust. Flame 1999, 116, 415–431. [Google Scholar] [CrossRef]
- Joo, S.; Yoon, J.; Kim, J.; Lee, M.; Yoon, Y. NOx emissions characteristics of the partially premixed combustion of H2/CO/CH4 syngas using artificial neural networks. Appl. Therm. Eng. 2015, 80, 436–444. [Google Scholar] [CrossRef]
- Yoon, J.; Kim, M.K.; Hwang, J.; Lee, J.; Yoon, Y. Effect of fuel-air mixture velocity on combustion instability of a model gas turbine combustor. Appl. Therm. Eng. 2013, 54, 92–101. [Google Scholar] [CrossRef]
- Figura, L.; Lee, J.G.; Quay, B.D.; Santavicca, D.A. The Effects of Fuel Composition on Flame Structure and Combustion Dynamics in a Lean Premixed Combustor. In Proceedings of the ASME Turbo Expo 2007: Power for Land, Sea, and Air, Montreal, QC, Canada, 14–17 May 2007; pp. 181–187. [Google Scholar] [CrossRef]
- Hottel, H.C. Burning in laminar and turbulent fuel jets. Symp. Combust. 1953, 4, 97–113. [Google Scholar] [CrossRef]
- Hawthorne, W.R.; Weddell, D.S.; Hottel, H.C. Mixing and combustion in turbulent gas jets. In Symposium on Combustion and Flame and Explosion Phenomena; Elsevier: New York, NY, USA, 1949; Volume 3, pp. 266–288. [Google Scholar]
- Wohl, K.; Gazley, C.; Kapp, N. Diffusion flames. In Symposium on Combustion and Flame and Explosion Phenomena; Elsevier: New York, NY, USA, 1949; Volume 3, pp. 288–300. [Google Scholar]
- Becker, H.A.; Liang, D. Visible length of vertical free turbulent diffusion flames. Combust. Flame 1978, 32, 115–137. [Google Scholar] [CrossRef]
- Delichatsios, M.A. Transition from momentum to buoyancy-controlled turbulent jet diffusion flames and flame height relationships. Combust. Flame 1993, 92, 349–364. [Google Scholar] [CrossRef]
- Blake, T.R.; McDonald, M. An examination of flame length data from vertical turbulent diffusion flames. Combust. Flame 1993, 94, 426–432. [Google Scholar] [CrossRef]
- Chen, R.H.; Driscoll, J.F. The role of the recirculation vortex in improving fuel-air mixing within swirling flames. Symp. Combust. 1989, 22, 531–540. [Google Scholar] [CrossRef]
- Peters, N.; Göttgens, J. Scaling of buoyant turbulent jet diffusion flames. Combust. Flame 1991, 85, 206–214. [Google Scholar] [CrossRef]
- Røkke, N.A.; Hustad, J.E.; Sønju, O.K. A study of partially premixed unconfined propane flames. Combust. Flame 1994, 97, 88–106. [Google Scholar] [CrossRef]
- Mei, Z.; Mi, J.; Wang, F.; Zheng, C. Dimensions of CH4-Jet Flame in Hot O2/CO2 Coflow. Energy Fuel. 2012, 26, 3257–3266. [Google Scholar] [CrossRef]
- De Giorgi, M.G.; Sciolti, A.; Campilongo, S.; Ficarella, A. Flame structure and chemiluminescence emissions of inverse diffusion flames under sinusoidally driven plasma discharges. Energies 2017, 10, 334. [Google Scholar] [CrossRef]
- Wang, Q.; Tang, F.; Liu, H.; Zhou, Z.; Palacios, A. Experimental investigation on the effect of reduced pressure on the combustion characteristics and flame height of gaseous fuel jets in parallel sidewalls. Energy Fuel. 2017. [Google Scholar] [CrossRef]
- Bahadori, M.Y.; Stocker, D.P.; Vaughan, D.F.; Zhou, L.; Edelman, R.B. Effects of Buoyancy on Laminar, Transitional, and Turbulent Gas Jet Diffusion Flames. In Modern Developments in Energy Combustion & Spectroscopy; Pergamon Press: New York, NY, USA, 1993; pp. 49–66. [Google Scholar]
- Choudhuri, A.R.; Gollahalli, S.R. Characteristics of hydrogen-hydrocarbon composite fuel turbulent jet flames. Int. J. Hydrogen Energy 2003, 28, 445–454. [Google Scholar] [CrossRef]
- Yang, W.; Blasiak, W. Chemical flame length and volume in liquified propane gas combustion using high-temperature and low-oxygen-concentration oxidizer. Energy Fuel. 2004, 18, 1329–1335. [Google Scholar] [CrossRef]
- Kim, H.K.; Kim, Y.; Lee, S.M.; Ahn, K.Y. Studies on combustion characteristics and flame length of turbulent oxy-fuel flames. Energy Fuel. 2007, 21, 1459–1467. [Google Scholar] [CrossRef]
- Hu, L.; Wang, Q.; Delichatsios, M.; Tang, F.; Zhang, X.; Lu, S. Flame height and lift-off of turbulent buoyant jet diffusion flames in a reduced pressure atmosphere. Fuel 2013, 109, 234–240. [Google Scholar] [CrossRef]
- Samaniego, J.-M.; Egolfopoulos, F.N.; Bowman, C.T. CO2* Chemiluminescence in Premixed Flames. Combust. Sci. Technol. 1995, 109, 183–203. [Google Scholar] [CrossRef]
- Lee, J.G.; Santavicca, D.A. Experimental Diagnostics for the Study of Combustion Instabilities in Lean Premixed Combustors. J. Propuls. Power 2003, 19, 735–750. [Google Scholar] [CrossRef]
- Lee, J.; Kim, K.; Santavicca, D. A Study of the Role of Equivalence Ratio Fluctuations During Unstable Combustion in a Lean Premixed Combustor. In Proceedings of the 38th AIAA/ASME/SAE/ASEE Joint Propulsion Conference & Exhibit, Indianapolis, IN, USA, 7–10 July 2002. [Google Scholar]
- Fluent Inc. FLUENT 6.3 Theory Guide; Fluent Inc.: Lebanon, NH, USA, 2006. [Google Scholar]
- Magnussen, B.F.; Hjertager, B.H. On mathematical modeling of turbulent combustion with special emphasis on soot formation and combustion. Symp. Combust. 1977, 16, 719–729. [Google Scholar] [CrossRef]
- Most, J.M.; Mandin, P.; Chen, J.; Joulain, P.; Durox, D.; Carlos Fernande-Pello, A. Influence of gravity and pressure on pool fire-type diffusion flames. Symp. Combust. 1996, 26, 1311–1317. [Google Scholar] [CrossRef]
- Turns, S.R.; Myhr, F.H.; Bandaru, R.V.; Maund, E.R. Oxides of nitrogen emissions from turbulent jet flames: Part II-Fuel dilution and partial premixing effects. Combust. Flame 1993, 93, 255–269. [Google Scholar] [CrossRef]
Figure 1.
Flame size and position schematic diagram.
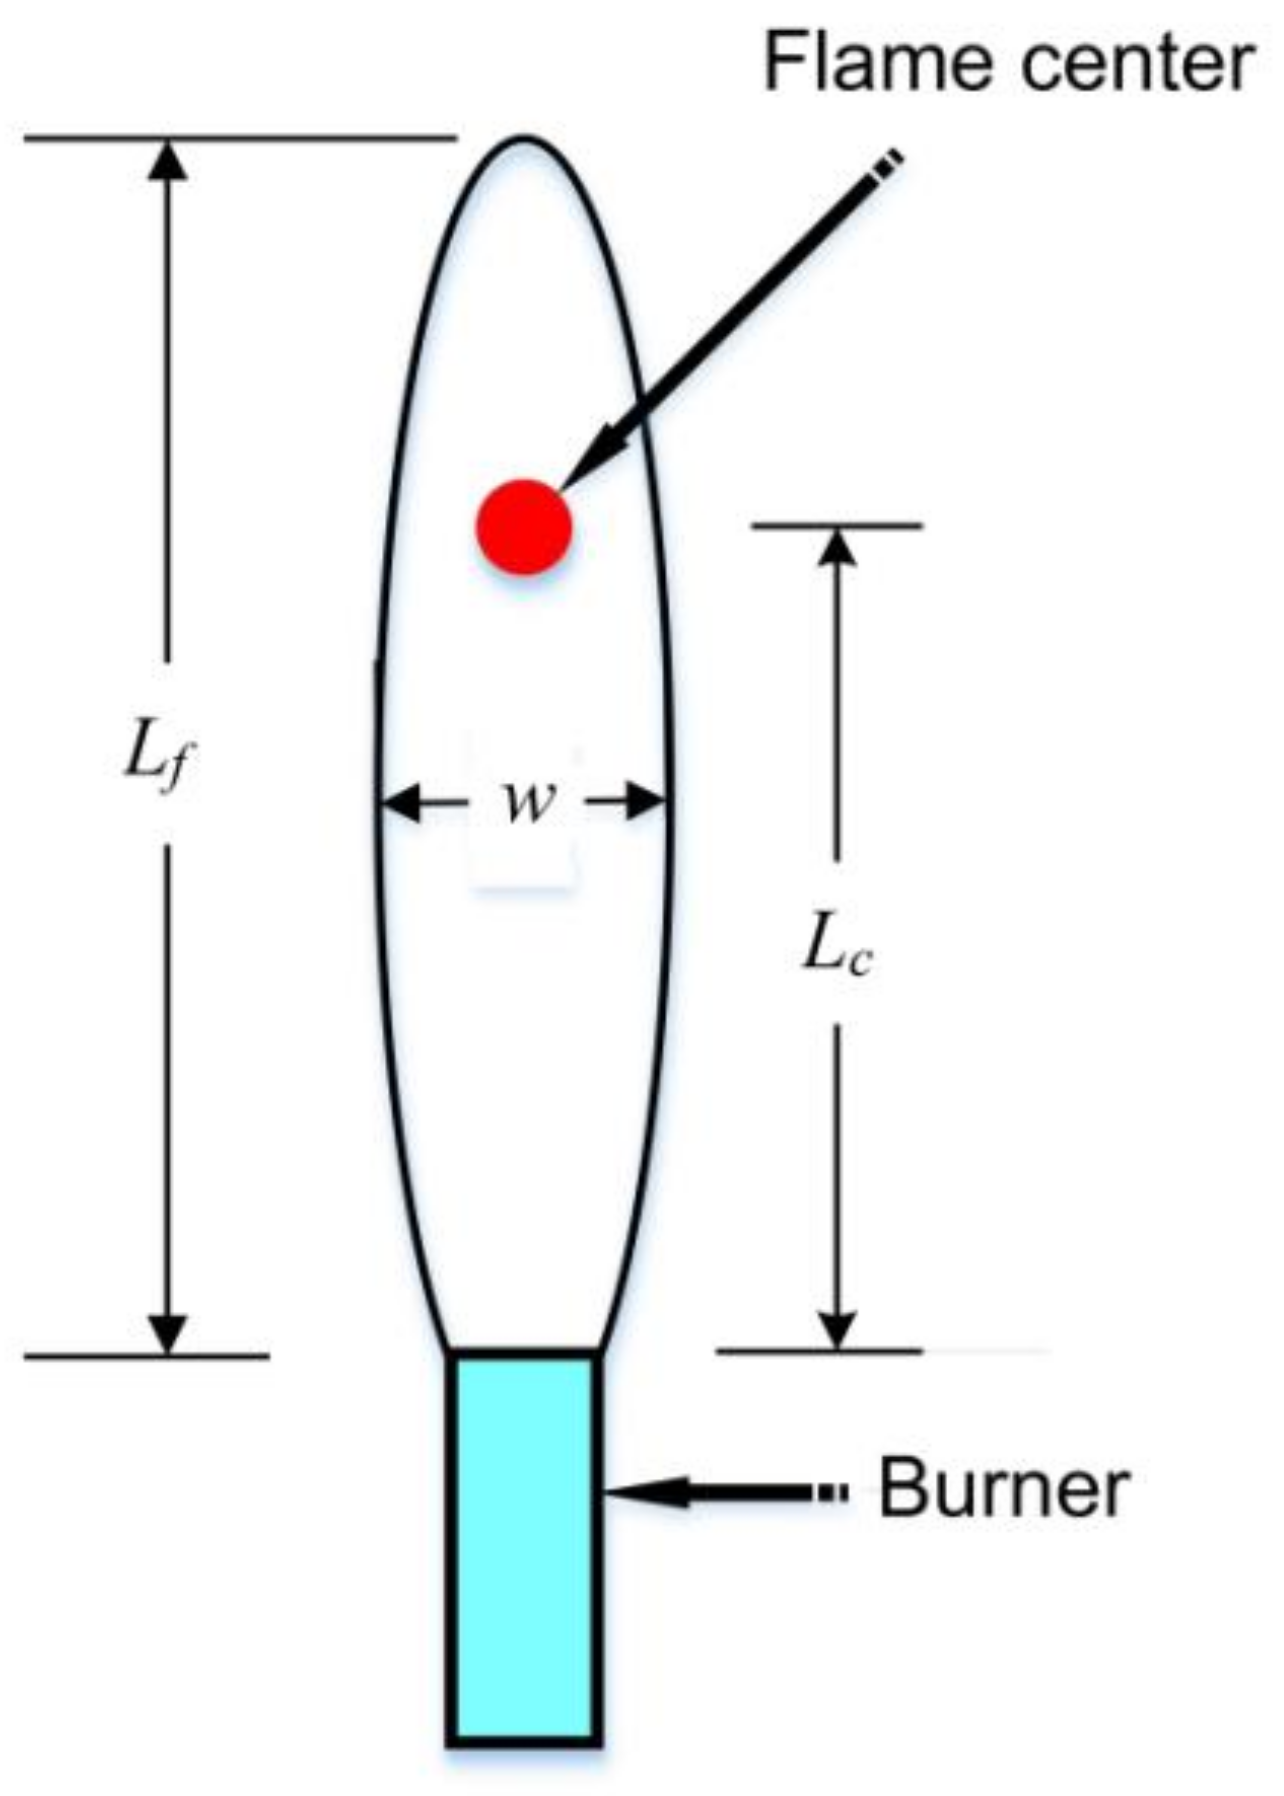
Figure 2.
High-pressure combustion test rig schematic diagram.

Figure 3.
The combustion chamber.
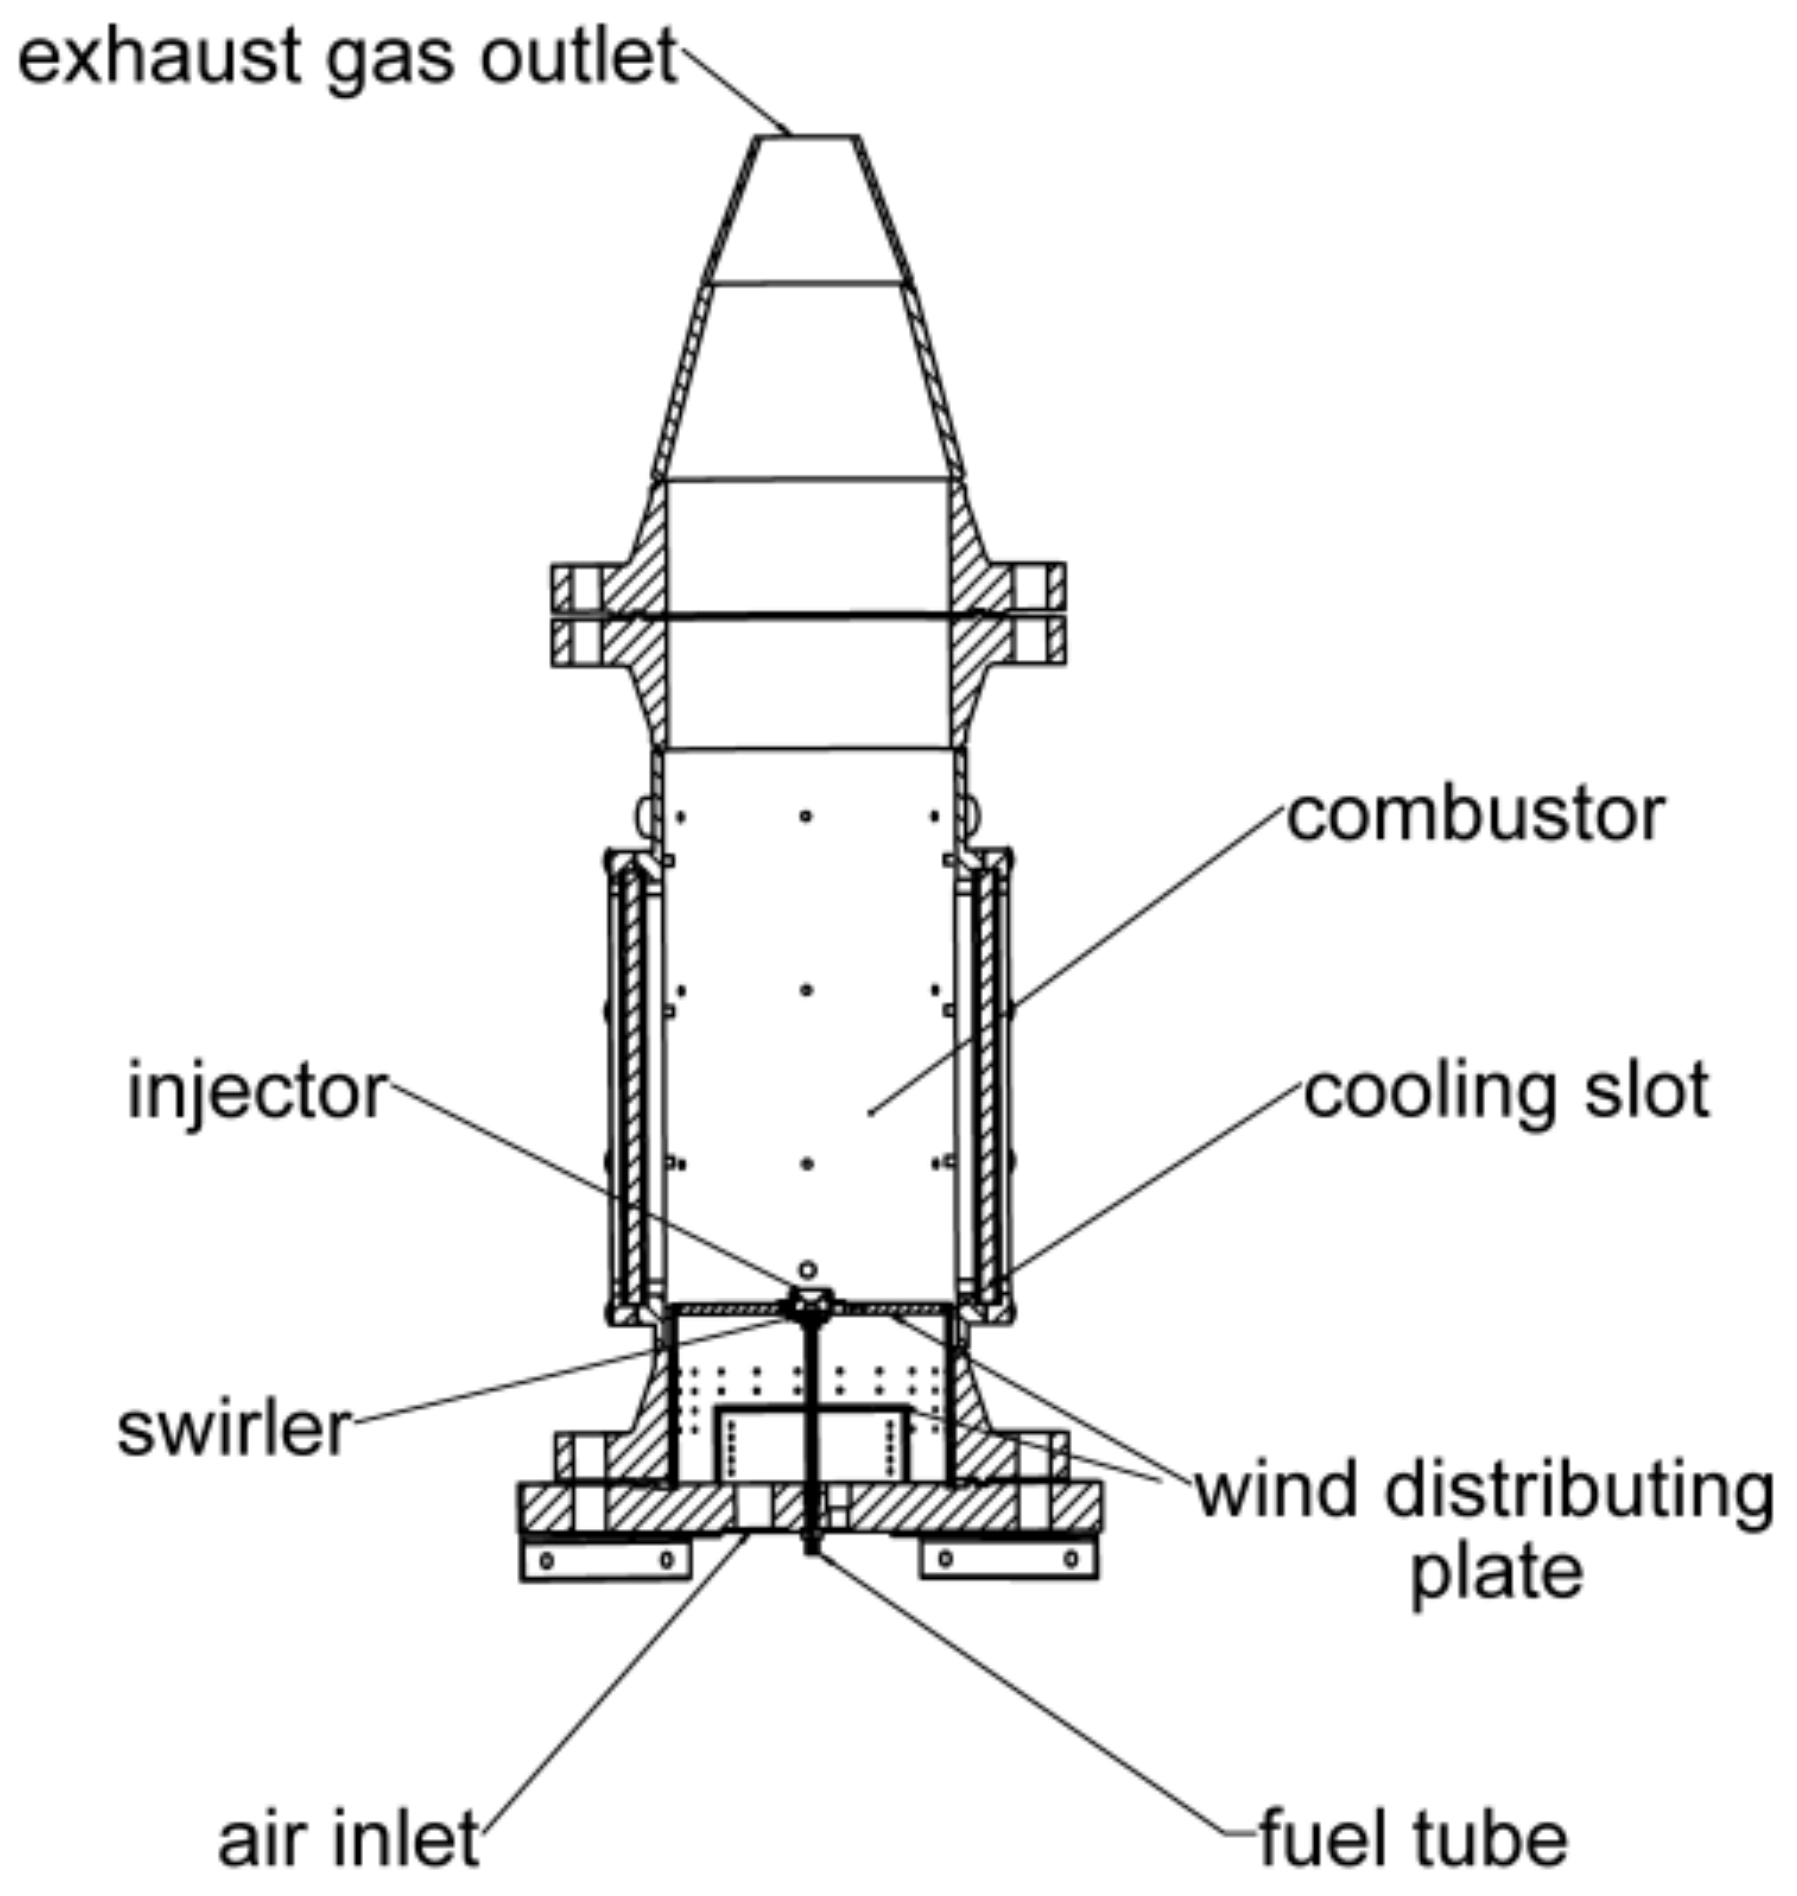
Figure 4.
Swirl injector.
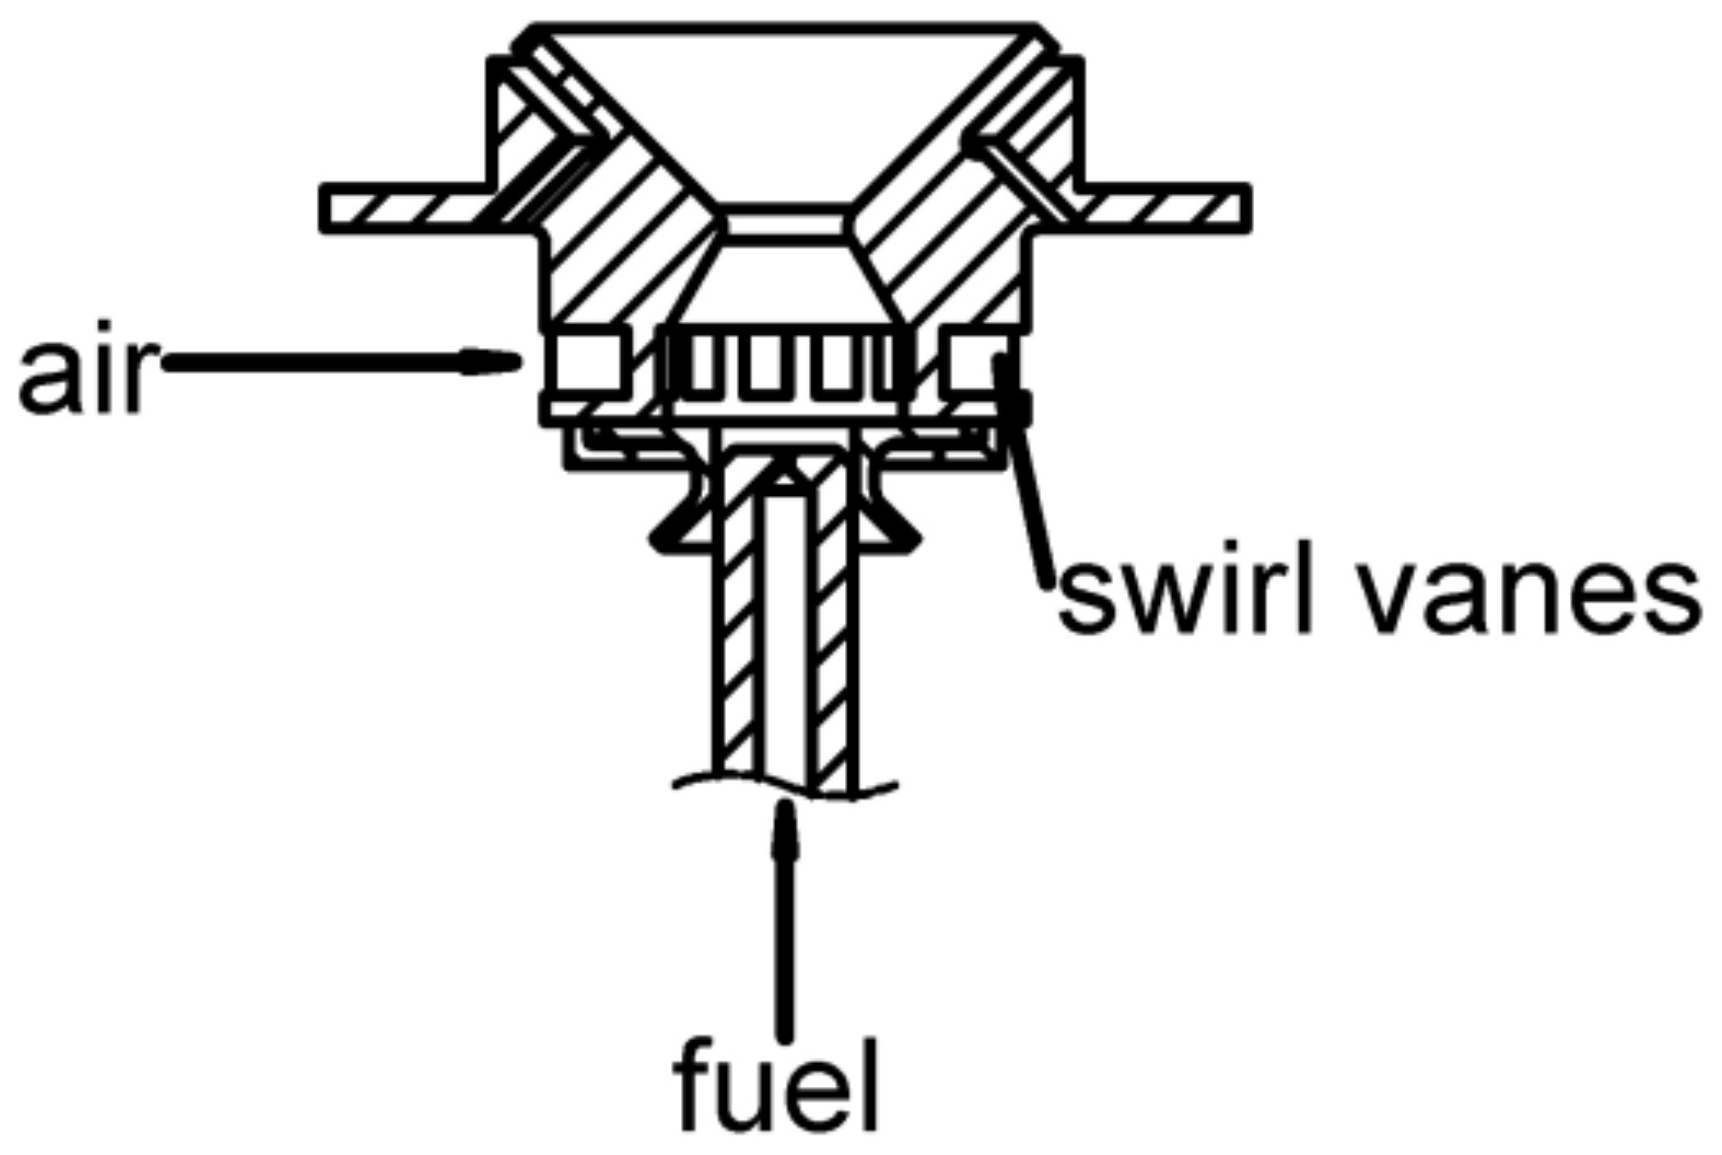
Figure 5.
Flame measuring instruments: (a) high-speed camera; (b) optical filter.
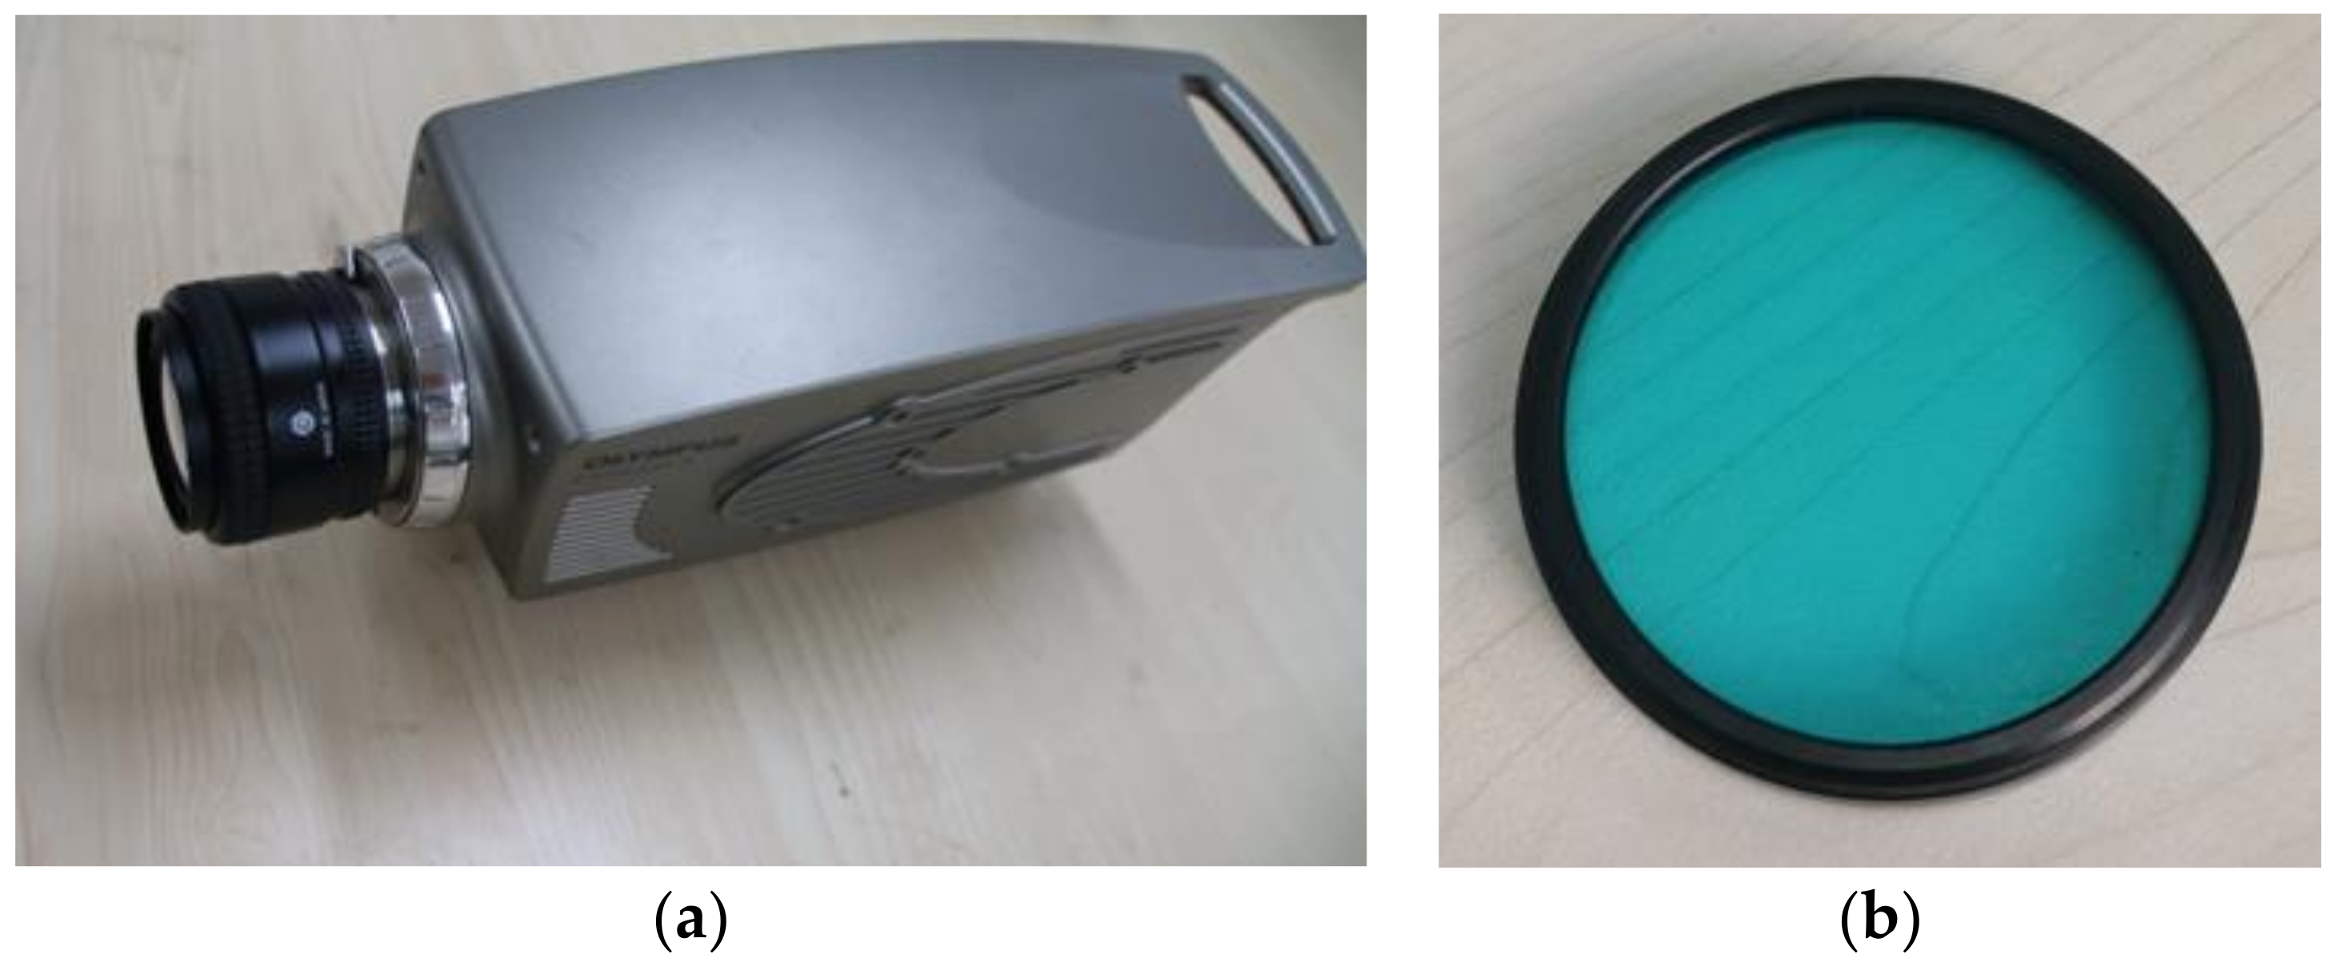
Figure 6.
Velocity magnitude at center plane from a 3D CFD result.

Figure 7.
CFD geometry and mesh.

Figure 8.
The verification of grid-independency: (a) flame temperature field; (b) CO2 mass fraction.
Figure 8.
The verification of grid-independency: (a) flame temperature field; (b) CO2 mass fraction.

Figure 9.
Flame shape for fuel mass flow rate under different combustor pressures: (a) experimental result at P = 4 bar; (b) CFD result at P = 4 bar; (c) experimental result at P = 5 bar; (d) CFD result at P = 5 bar; (e) experimental result at P = 6 bar; (f) CFD result at P = 6 bar.
Figure 9.
Flame shape for fuel mass flow rate under different combustor pressures: (a) experimental result at P = 4 bar; (b) CFD result at P = 4 bar; (c) experimental result at P = 5 bar; (d) CFD result at P = 5 bar; (e) experimental result at P = 6 bar; (f) CFD result at P = 6 bar.
Figure 10.
Flame size and position for fuel mass flow rate under different combustor pressures: (a) Flame length; (b) flame width; (c) flame position.
Figure 10.
Flame size and position for fuel mass flow rate under different combustor pressures: (a) Flame length; (b) flame width; (c) flame position.
Figure 11.
Measured flame length for combustor pressure under different fuel mass flow rates.
Figure 12.
Flame shape for primary air mass flow rate (a) experimental result; (b) CFD result.
Figure 13.
Flame size and position for primary air mass flow rate: (a) Flame length; (b) flame width; (c) flame position.
Figure 13.
Flame size and position for primary air mass flow rate: (a) Flame length; (b) flame width; (c) flame position.


Figure 14.
Flame shape for gas velocity: (a) Experimental result; (b) CFD result.
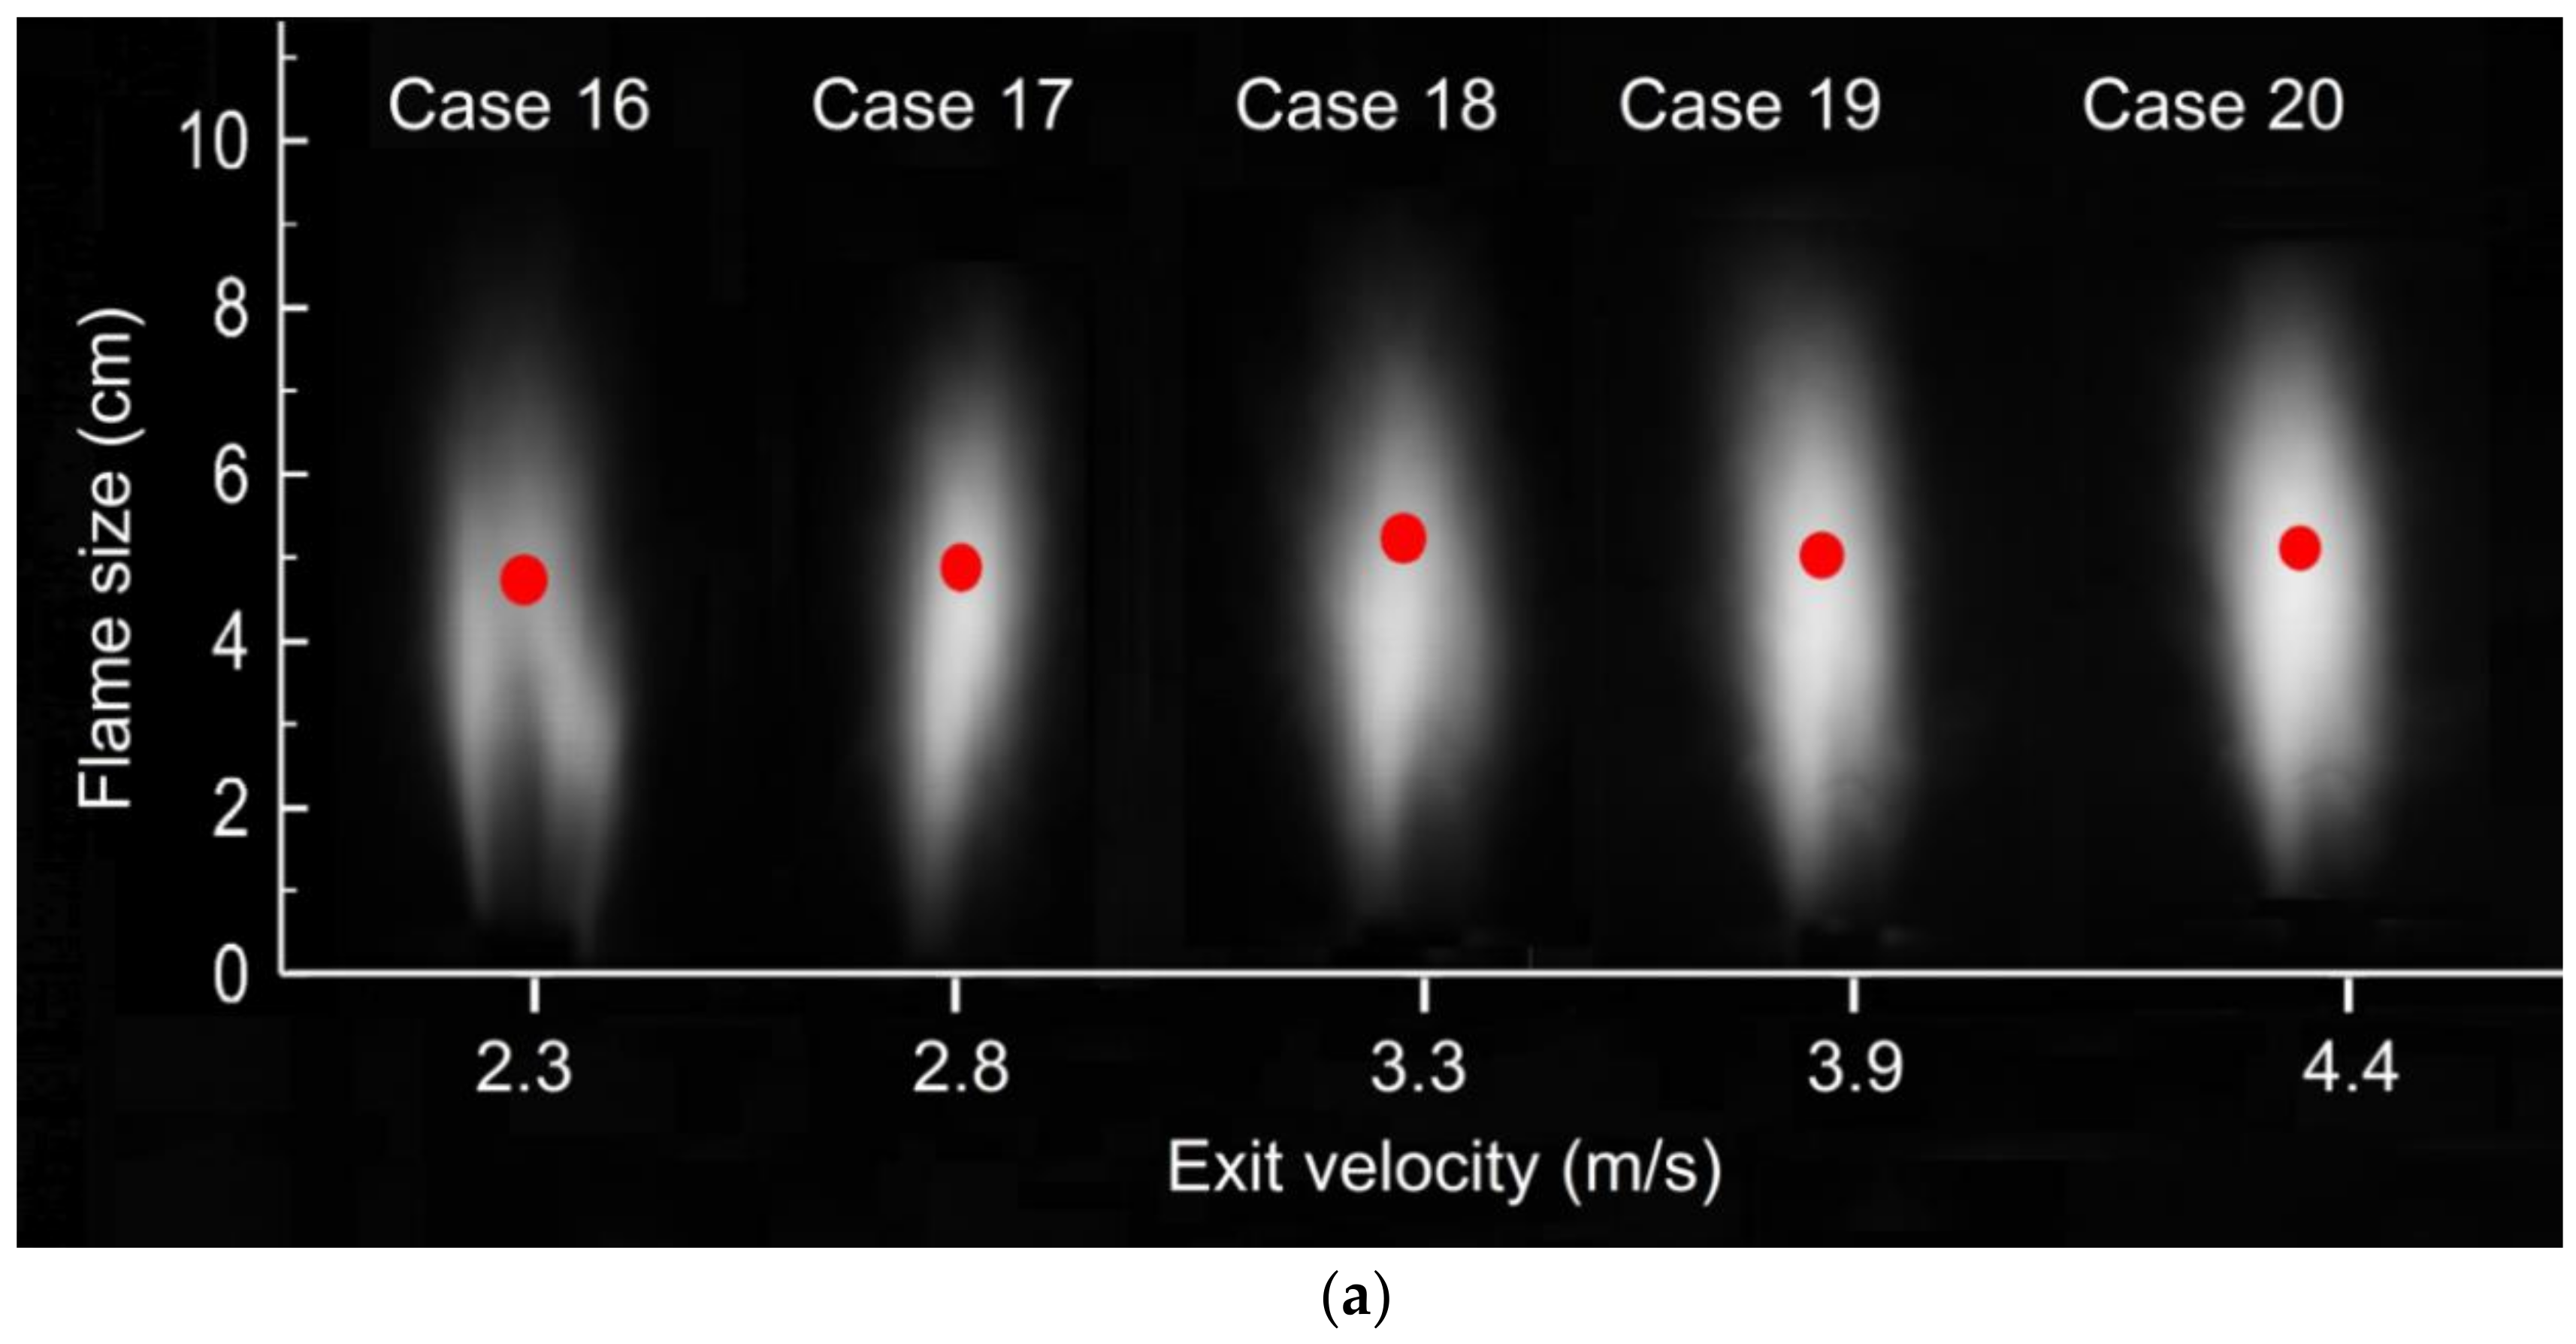
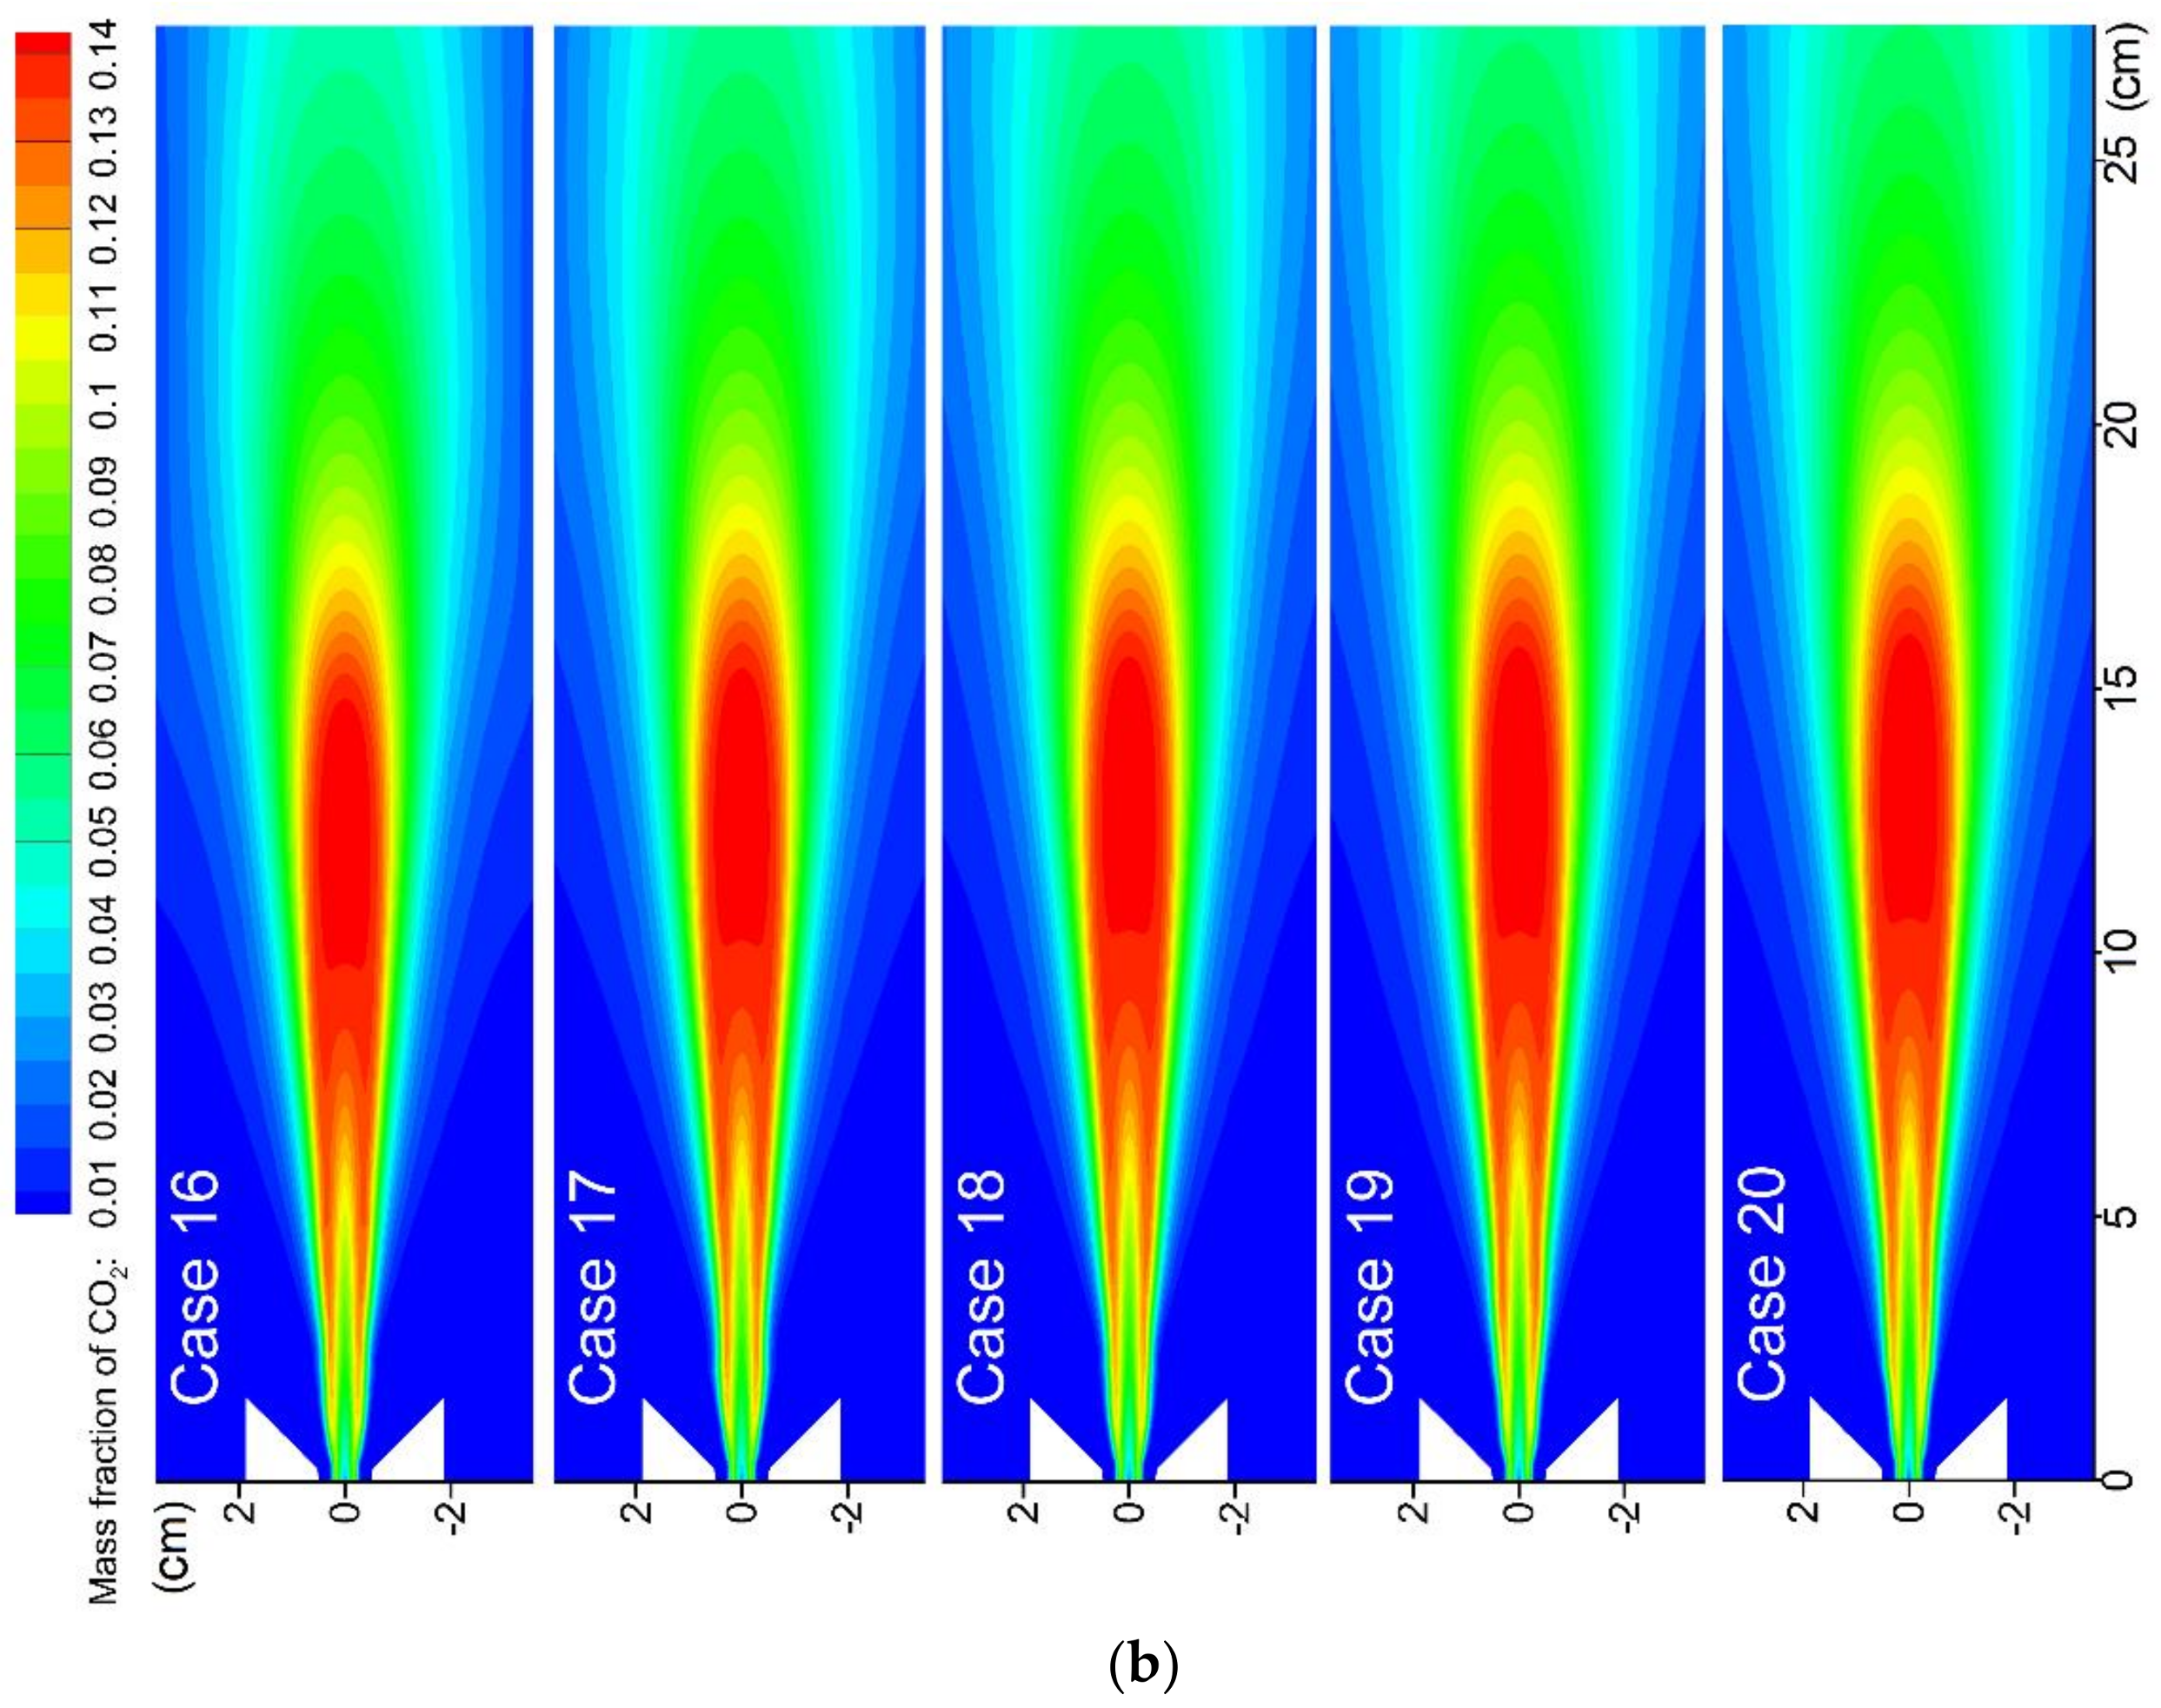
Figure 15.
Flame size and position for gas velocity: (a) Flame length; (b) flame width; (c) flame position.
Figure 15.
Flame size and position for gas velocity: (a) Flame length; (b) flame width; (c) flame position.
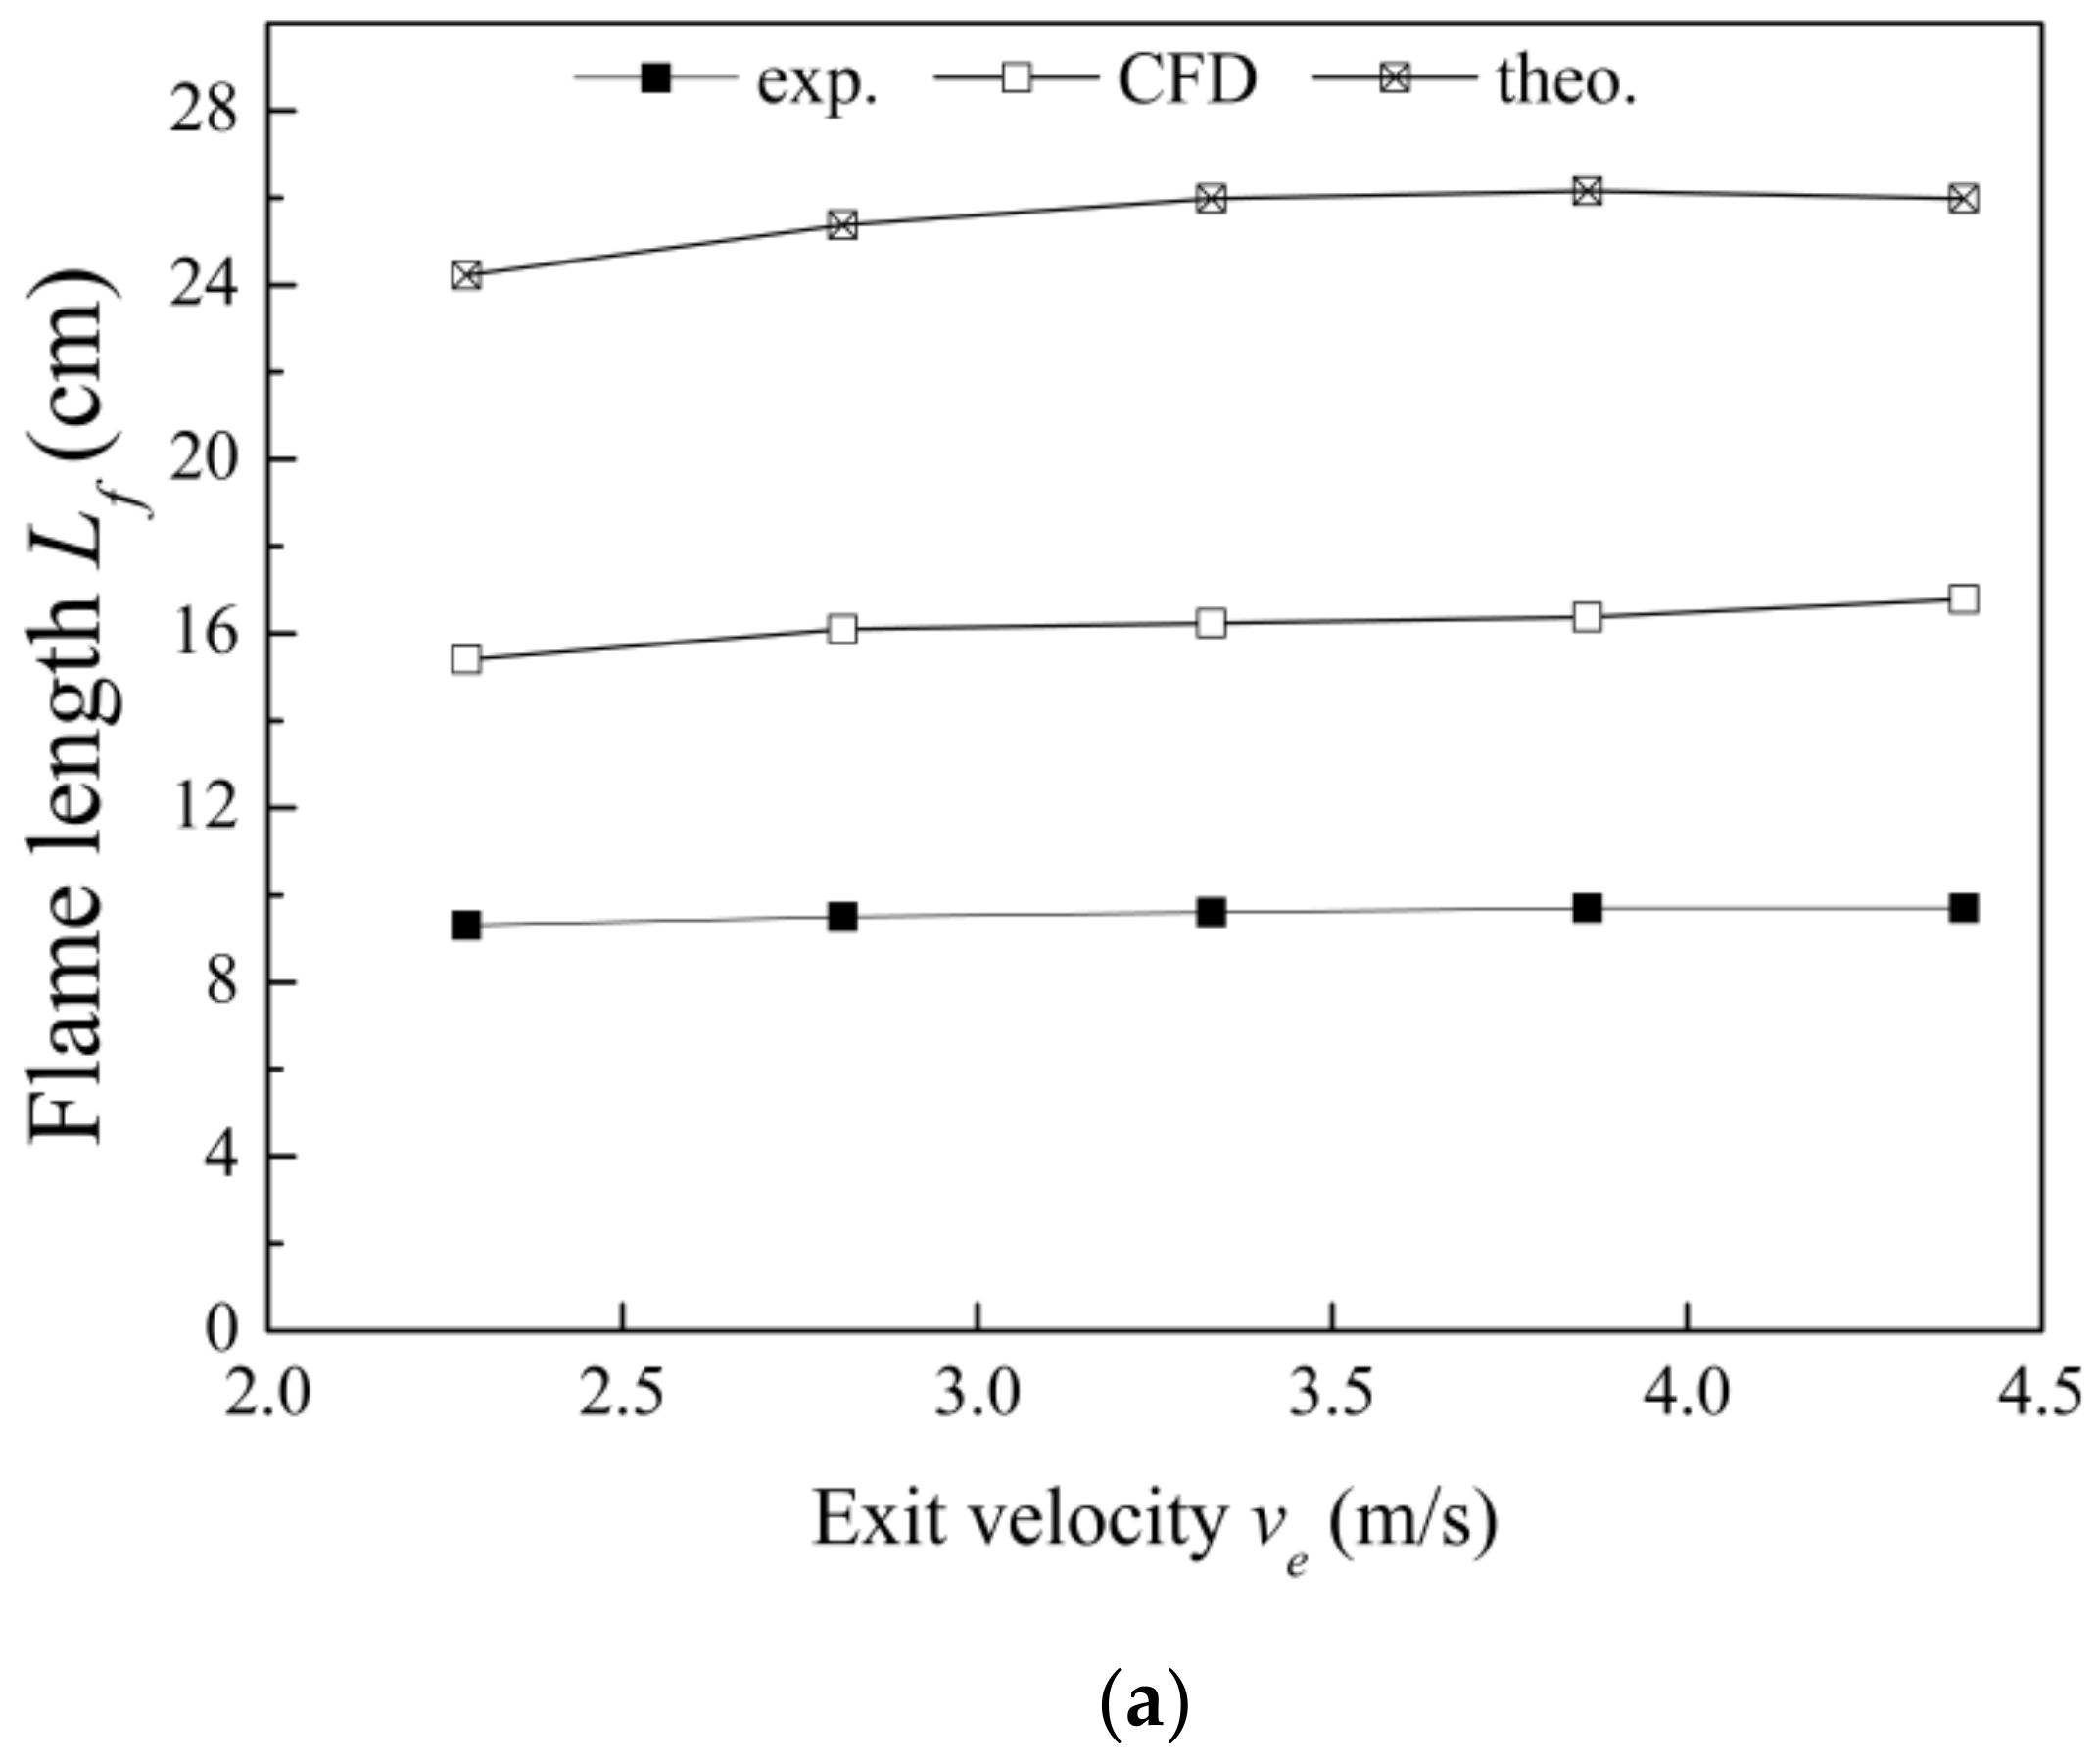
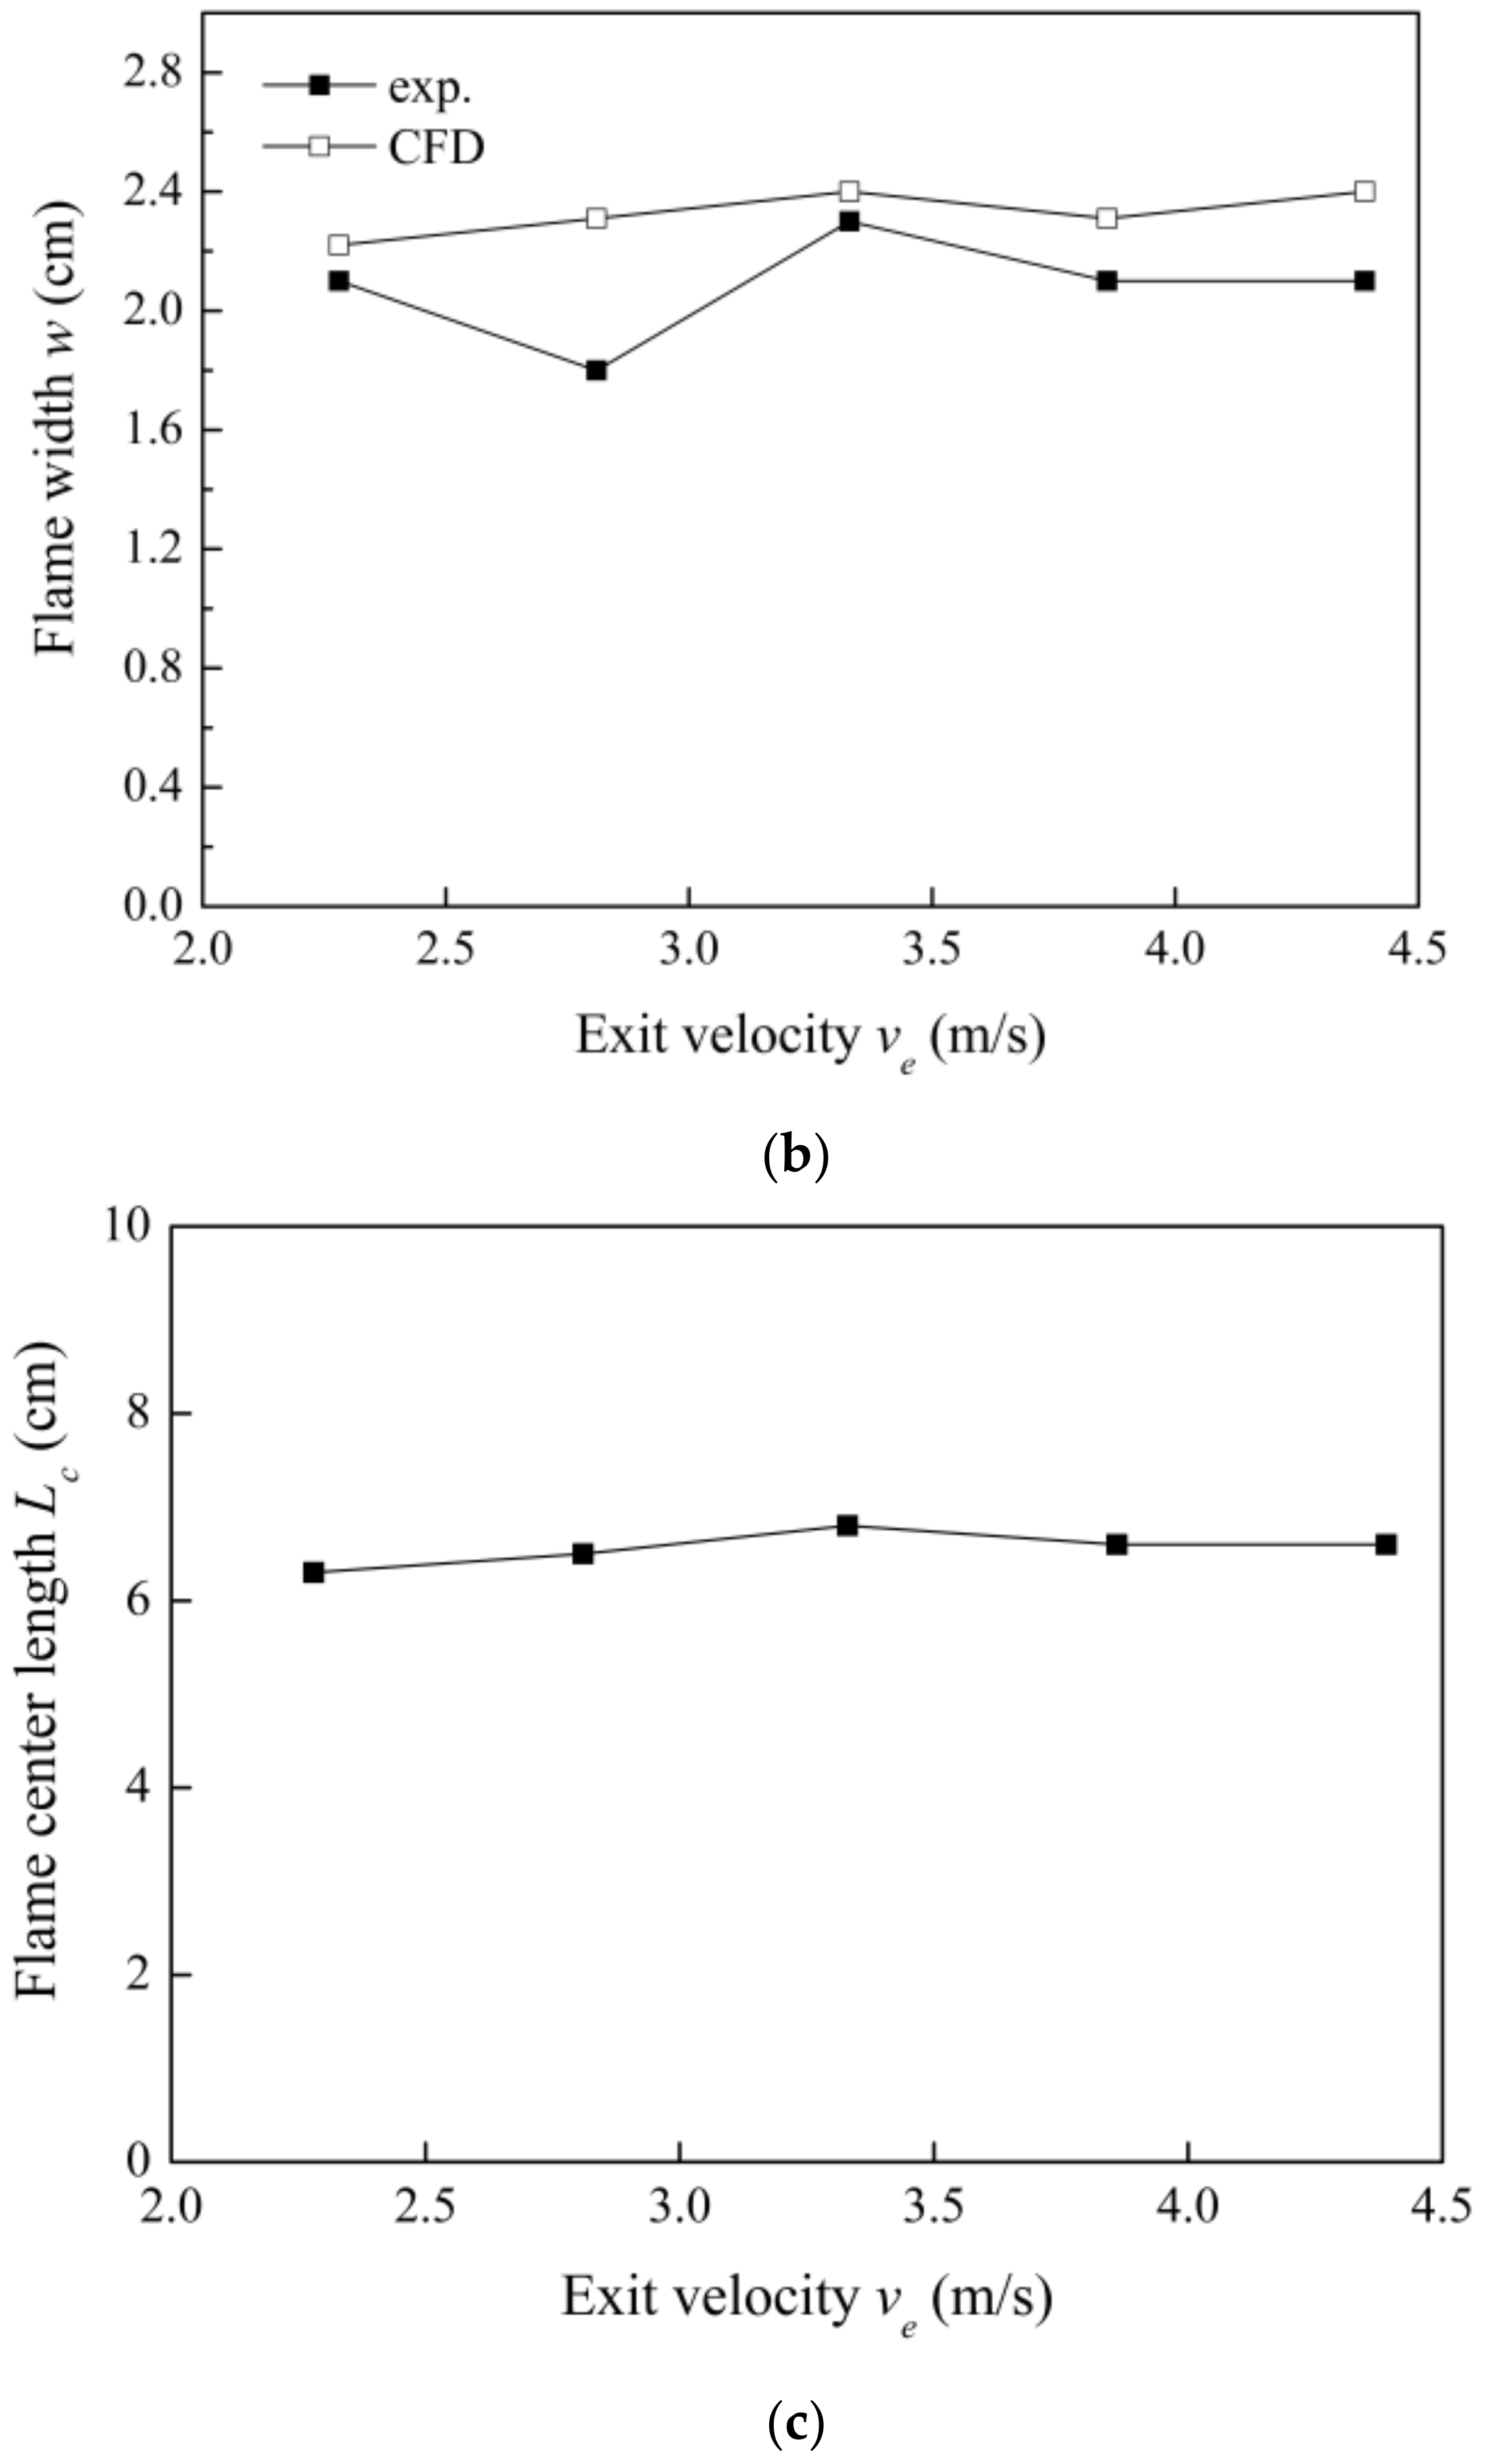
Figure 16.
Flame size for primary air to fuel mass flow rate ratio.


Table 1.
Test conditions.
| Case | Combustor Pressure, P (bar) | Fuel Mass Flow Rate, ṁF (g/min) | Air Mass Flow Rate, ṁA (kg/min) | Primary Air, ṁpri (g/min) | ṁpri/ṁF | Nozzle Exit Velocity, ve (m/s) | |
|---|---|---|---|---|---|---|---|
| I | 1 | 4 | 8 | 1.7 | 85 | 10.6 | 3.73 |
| 2 | 4 | 10 | 1.7 | 85 | 8.5 | 3.73 | |
| 3 | 4 | 12 | 1.7 | 85 | 7.1 | 3.73 | |
| 4 | 5 | 8 | 1.7 | 85 | 10.6 | 2.98 | |
| 5 | 5 | 10 | 1.7 | 85 | 8.5 | 2.98 | |
| 6 | 5 | 12 | 1.7 | 85 | 7.1 | 2.98 | |
| 7 | 6 | 8 | 1.7 | 85 | 10.6 | 2.49 | |
| 8 | 6 | 10 | 1.7 | 85 | 8.5 | 2.49 | |
| 9 | 6 | 12 | 1.7 | 85 | 7.1 | 2.49 | |
| II | 10 | 5 | 16 | 1.7 | 85 | 5.3 | 2.98 |
| 11 | 5 | 16 | 1.8 | 90 | 5.6 | 3.16 | |
| 12 | 5 | 16 | 1.9 | 95 | 5.9 | 3.33 | |
| 13 | 5 | 16 | 2.0 | 100 | 6.3 | 3.51 | |
| 14 | 5 | 16 | 2.1 | 105 | 6.6 | 3.69 | |
| 15 | 5 | 16 | 2.2 | 110 | 6.9 | 3.86 | |
| III | 16 | 5 | 8 | 1.3 | 65 | 8.1 | 2.28 |
| 17 | 5 | 10 | 1.6 | 80 | 8.0 | 2.81 | |
| 18 | 5 | 12 | 1.9 | 95 | 7.9 | 3.33 | |
| 19 | 5 | 14 | 2.2 | 110 | 7.9 | 3.86 | |
| 20 | 5 | 16 | 2.5 | 125 | 7.8 | 4.39 | |
Table 2.
The theoretical result of flame length.
| Case | P (bar) | ṁF (g/min) | ṁA (kg/min) | ṁpri (g/min) | ṁpri/ṁF | ve (m/s) | ρA (kg/m3) | fs | Frf | Lf (cm) |
| 1 | 4 | 8 | 1.7 | 85 | 10.6 | 3.73 | 4.84 | 0.639 | 2.303 | 18.4 |
| 2 | 4 | 10 | 1.7 | 85 | 8.5 | 3.73 | 4.84 | 0.522 | 1.702 | 24.3 |
| 3 | 4 | 12 | 1.7 | 85 | 7.1 | 3.73 | 4.84 | 0.444 | 1.336 | 28.6 |
| 4 | 5 | 8 | 1.7 | 85 | 10.6 | 2.98 | 6.05 | 0.639 | 1.843 | 19.6 |
| 5 | 5 | 10 | 1.7 | 85 | 8.5 | 2.98 | 6.05 | 0.522 | 1.361 | 24.4 |
| 6 | 5 | 12 | 1.7 | 85 | 7.1 | 2.98 | 6.05 | 0.444 | 1.068 | 27.8 |
| 7 | 6 | 8 | 1.7 | 85 | 10.6 | 2.49 | 7.26 | 0.639 | 1.536 | 20.0 |
| 8 | 6 | 10 | 1.7 | 85 | 8.5 | 2.49 | 7.26 | 0.522 | 1.134 | 23.9 |
| 9 | 6 | 12 | 1.7 | 85 | 7.1 | 2.49 | 7.26 | 0.444 | 0.890 | 26.8 |
| 10 | 5 | 16 | 1.7 | 85 | 5.3 | 2.98 | 6.05 | 0.347 | 0.737 | 32.6 |
| 11 | 5 | 16 | 1.8 | 90 | 5.6 | 3.16 | 6.05 | 0.364 | 0.839 | 32.2 |
| 12 | 5 | 16 | 1.9 | 95 | 5.9 | 3.33 | 6.05 | 0.381 | 0.949 | 31.6 |
| 13 | 5 | 16 | 2 | 100 | 6.3 | 3.51 | 6.05 | 0.398 | 1.068 | 31.0 |
| 14 | 5 | 16 | 2.1 | 105 | 6.6 | 3.69 | 6.05 | 0.416 | 1.194 | 30.2 |
| 15 | 5 | 16 | 2.2 | 110 | 6.9 | 3.86 | 6.05 | 0.433 | 1.330 | 29.4 |
| 16 | 5 | 8 | 1.3 | 65 | 8.1 | 2.28 | 6.05 | 0.501 | 0.980 | 24.2 |
| 17 | 5 | 10 | 1.6 | 80 | 8.0 | 2.81 | 6.05 | 0.495 | 1.181 | 25.4 |
| 18 | 5 | 12 | 1.9 | 95 | 7.9 | 3.33 | 6.05 | 0.490 | 1.384 | 26.0 |
| 19 | 5 | 14 | 2.2 | 110 | 7.9 | 3.86 | 6.05 | 0.487 | 1.586 | 26.2 |
| 20 | 5 | 16 | 2.5 | 125 | 7.8 | 4.39 | 6.05 | 0.484 | 1.789 | 26.0 |
© 2018 by the authors. Licensee MDPI, Basel, Switzerland. This article is an open access article distributed under the terms and conditions of the Creative Commons Attribution (CC BY) license (http://creativecommons.org/licenses/by/4.0/).
Share and Cite
MDPI and ACS Style
Xi, Z.; Fu, Z.; Hu, X.; Sabir, S.W.; Jiang, Y. An Investigation on Flame Shape and Size for a High-Pressure Turbulent Non-Premixed Swirl Combustion. Energies 2018, 11, 930. https://doi.org/10.3390/en11040930
AMA Style
Xi Z, Fu Z, Hu X, Sabir SW, Jiang Y. An Investigation on Flame Shape and Size for a High-Pressure Turbulent Non-Premixed Swirl Combustion. Energies. 2018; 11(4):930. https://doi.org/10.3390/en11040930
Chicago/Turabian StyleXi, Zhongya, Zhongguang Fu, Xiaotian Hu, Syed Waqas Sabir, and Yibo Jiang. 2018. "An Investigation on Flame Shape and Size for a High-Pressure Turbulent Non-Premixed Swirl Combustion" Energies 11, no. 4: 930. https://doi.org/10.3390/en11040930
Note that from the first issue of 2016, this journal uses article numbers instead of page numbers. See further details here.