Article

Digestion Performance and Microbial Metabolic Mechanism in Thermophilic and Mesophilic Anaerobic Digesters Exposed to Elevated Loadings of Organic Fraction of Municipal Solid Waste

1
College of Engineering, Northeast Agricultural University, Harbin 150030, China
2
Guangzhou Institute of Energy Conversion, Chinese Academy of Sciences, Guangzhou 510640, China
3
CAS Key Laboratory of Renewable Energy, Guangzhou 510640, China
4
Guangdong Provincial Key Laboratory of New and Renewable Energy Research and Development, Guangzhou 510640, China
5
University of Chinese Academy of Sciences, Beijing 100049, China
*
Authors to whom correspondence should be addressed.
Energies 2018, 11(4), 952; https://doi.org/10.3390/en11040952
Submission received: 8 February 2018 / Revised: 14 March 2018 / Accepted: 20 March 2018 / Published: 17 April 2018

Abstract

:
Mesophilic and thermophilic anaerobic digestion reactors (MR and TR) for the organic fraction of municipal solid waste (OFMSW) were tested to reveal the differential microbial responses to increasing organic loading rate (OLR). MR exhibited faster adaptation and better performance at an OLR range of 1.0–2.5 g VS·L−1·d−1, with average profiles of a biogas yield of 0.38 L/gVSadded*d at 0.5 g/L*d OLR and 0.69 L/gVSadded*d at 2.5 g/L*d OLR, whereas TR had a biogas yield of 0.07 L/gVSadded*d at 0.5 g/L*d OLR and 0.44 L/gVSadded*d at 2.5 g/L*d OLR. The pyrosequencing results of amplicons revealed the microbial mechanisms of OFMSW anaerobic digestion. Larger shifts in the bacteria composition were observed in the TR with OLR elevation. For methanogens in both reactors, Methanothrix dominated in the MR while Methanosarcina was favored in the TR. Moreover, analysis of the mode and efficiency of metabolism between the MR and TR demonstrated different performances with more efficiency related to the limiting hydrolytic acid step.

1. Introduction

The treatment and disposal of the organic fraction of municipal solid waste (OFMSW) represent major challenges worldwide owing to growing production levels [1]. Anaerobic digestion (AD) is an efficient and eco-friendly treatment to transform OFMSW into energy.
Mesophilic (30–40 °C) and thermophilic (50–60 °C) AD systems are the most commonly used AD processes [2,3]. Several methods for increasing biogas production have been proposed, including raw material pretreatment and optimizing the fermenting digester [4,5]. According to the Arrhenius equation, chemical reaction rates could be doubled with a 10 °C temperature increase. Therefore, thermophilic AD is a possible strategy to improve the process efficiency owing to a higher reaction rates. Thermophilic AD shows several advantages such as higher loading rates of organic feedstock and a smaller pathogen degree [6]. Nevertheless, mesophilic AD would have a lower volatile fatty acid (VFA) concentration (especially propionate) and could usually support a higher organic loading rate (OLR) [7,8]. In general, OFMSW has a mutable complicated composition in the form of proteins, lipids, carbohydrates, and cellulose [9]. However, it is more uncertain whether the AD of OFMSW would lead to failure or low biogas production.
AD includes four major steps of microbial processes—hydrolysis, fermentation, acetogenesis, and methanogenesis—which are completed collectively by syntrophic interactions of different microorganisms [10]. Malfunctioning of the microbial population or activity at any one step can affect the overall microbial community, resulting in AD inefficiency or failure [11]. One common speculation for the lower efficiency of thermophilic AD at a high OLR is that higher VFA accumulation results in an imbalance between acidogenesis and methanogenesis in the microbial community [12].
To better understand the microbiome in AD reactors, molecular methods have been applied to replace traditional culture-dependent techniques [13]. With the development of next-generation sequencing technologies such as 454 pyrosequencing, a much larger amount of data can now be analyzed in a shorter period and has been successfully applied for examining the microbial community in different conditions [14], including investigations of the microbial diversity in AD [15]. Indeed, there is a great difference in the microbial community between mesophilic and thermophilic AD. For example, Guo reported that the methanogens Methanosaeta dominated the archaeal community in a mesophilic reactor (MR), while Methanothermobacter and Methanoculleus were favored in a thermophilic reactor (TR) [16]. Although various sequencing data have been obtained, information on the microbial community in AD is still very limited.
The aim of the study was to compare the dynamics and structure of the microbial communities using high-throughput sequencing, to compare metabolism between two lab-scale temperature-state ADs (MR and TR) that were operated at a gradually increasing OLR, and to determine their respective performances. Due to the inoculum, thermophilic AD took a longer time to adapt.

2. Results and Discussion

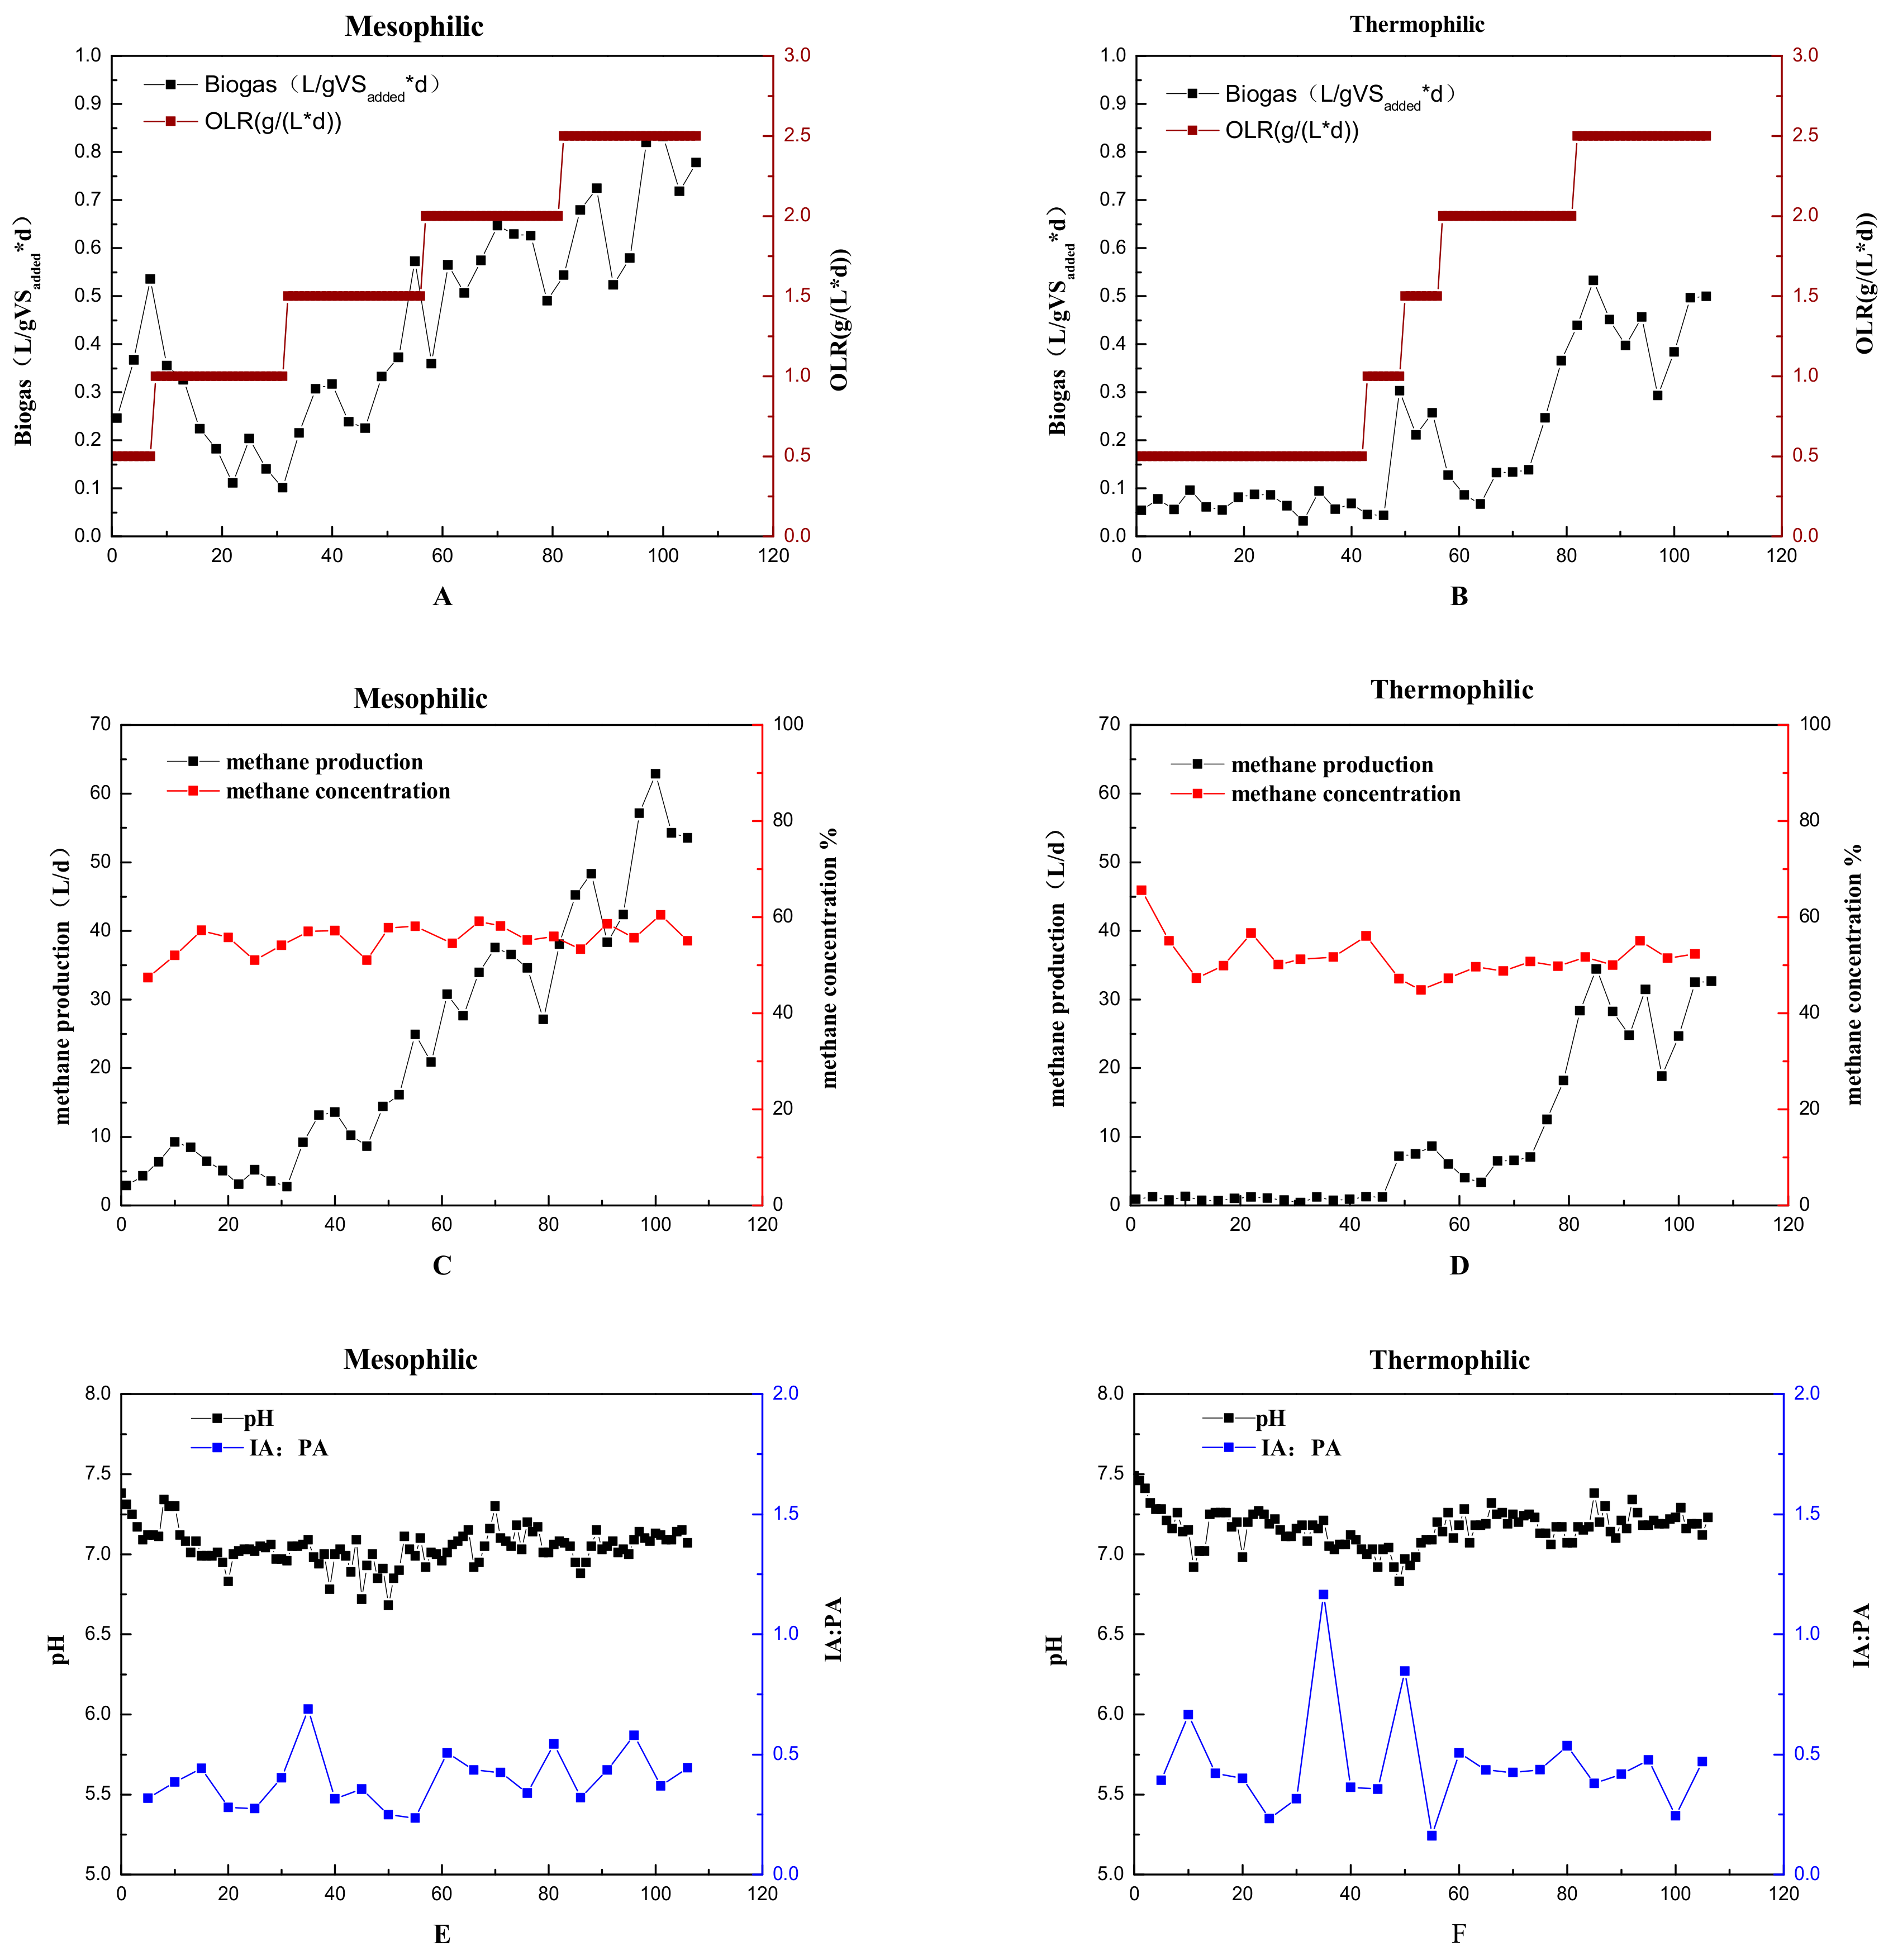
2.1. Performance of the Reactors

Initially, the OLR of the MR was gradually elevated with a gradient of 0.5 gVS·L−1·d−1 from an initial level of 0.5 gVS·L−1·d−1 over 7 days. The TR was acclimated with low concentrations of OFMSW for 43 days at an OLR of 0.5 gVS·L−1·d−1. Subsequently, the OLR of the MR was increased with a gradient of 0.5 gVS·L−1·d−1 every week over the next two weeks, and was increased by 0.5 gVS·L−1·d−1 every 25 days from Day 57 to Day 106.
Profiles of the biogas yield (SBY) of the added OLR, methane production and concentration, intermediate alkalinity to partial alkalinity ratio (IA:PA), and pH of the two reactors are shown in Figure 1. The two reactors showed different performances at the low OLR concentration, and the MR exhibited a much better ability for biogas and methane production, implying that a normal atmospheric temperature seed biomass allows for stronger adaptability of mesophilic AD. In the MR, the SBY increased in the first 7 days, peaking at 0.54 L/gVSadded*d, decreased over the next 25 days, and then showed an upward trend in the latter three stages. The SBY of the MR was 0.55 L/gVSadded*d at 2 g/L*d OLR and was 0.69 L/gVSadded*d at 2.5 g/L*d OLR. In the TR, the SBY remained steady in the first 43 days, increased to 0.26 L/gVSadded*d over the next week, and then showed an initial decrease, followed by an upward trend in the last 50 days. The SBY of the TR was 0.16 L/gVSadded*d at 2 g/L*d OLR and was 0.44 L/gVSadded*d at 2.5 g/L*d OLR. Thus, in this experiment, the MR showed greater biogas production, and had stronger adaptability and gas production efficiency than the TR for each OLR tested.
The pH of the two digesters ranged from 7.0 to 7.5 and remained in a stable state, as the suggested condition of anaerobic fermentation [17]. The IA:PA of alkalinity remained below 1 essentially the whole time for both reactors, implying the stability of the reactors [18]. However, at Day 35 of the TR, the IA:PA value was 1.16, suggesting that the microbial community showed preliminary adaptation to the production of organic acids. There was no accumulation of VFAs, as no VFAs could be detected. In addition, the NH3–N concentration in both reactors was below 500 mg/L from start to finish, indicating that the effect of ammonia on the methane yield was negligible in both reactors [19,20]. Therefore, there were minimal inhibition effects in both reactors throughout the operation.

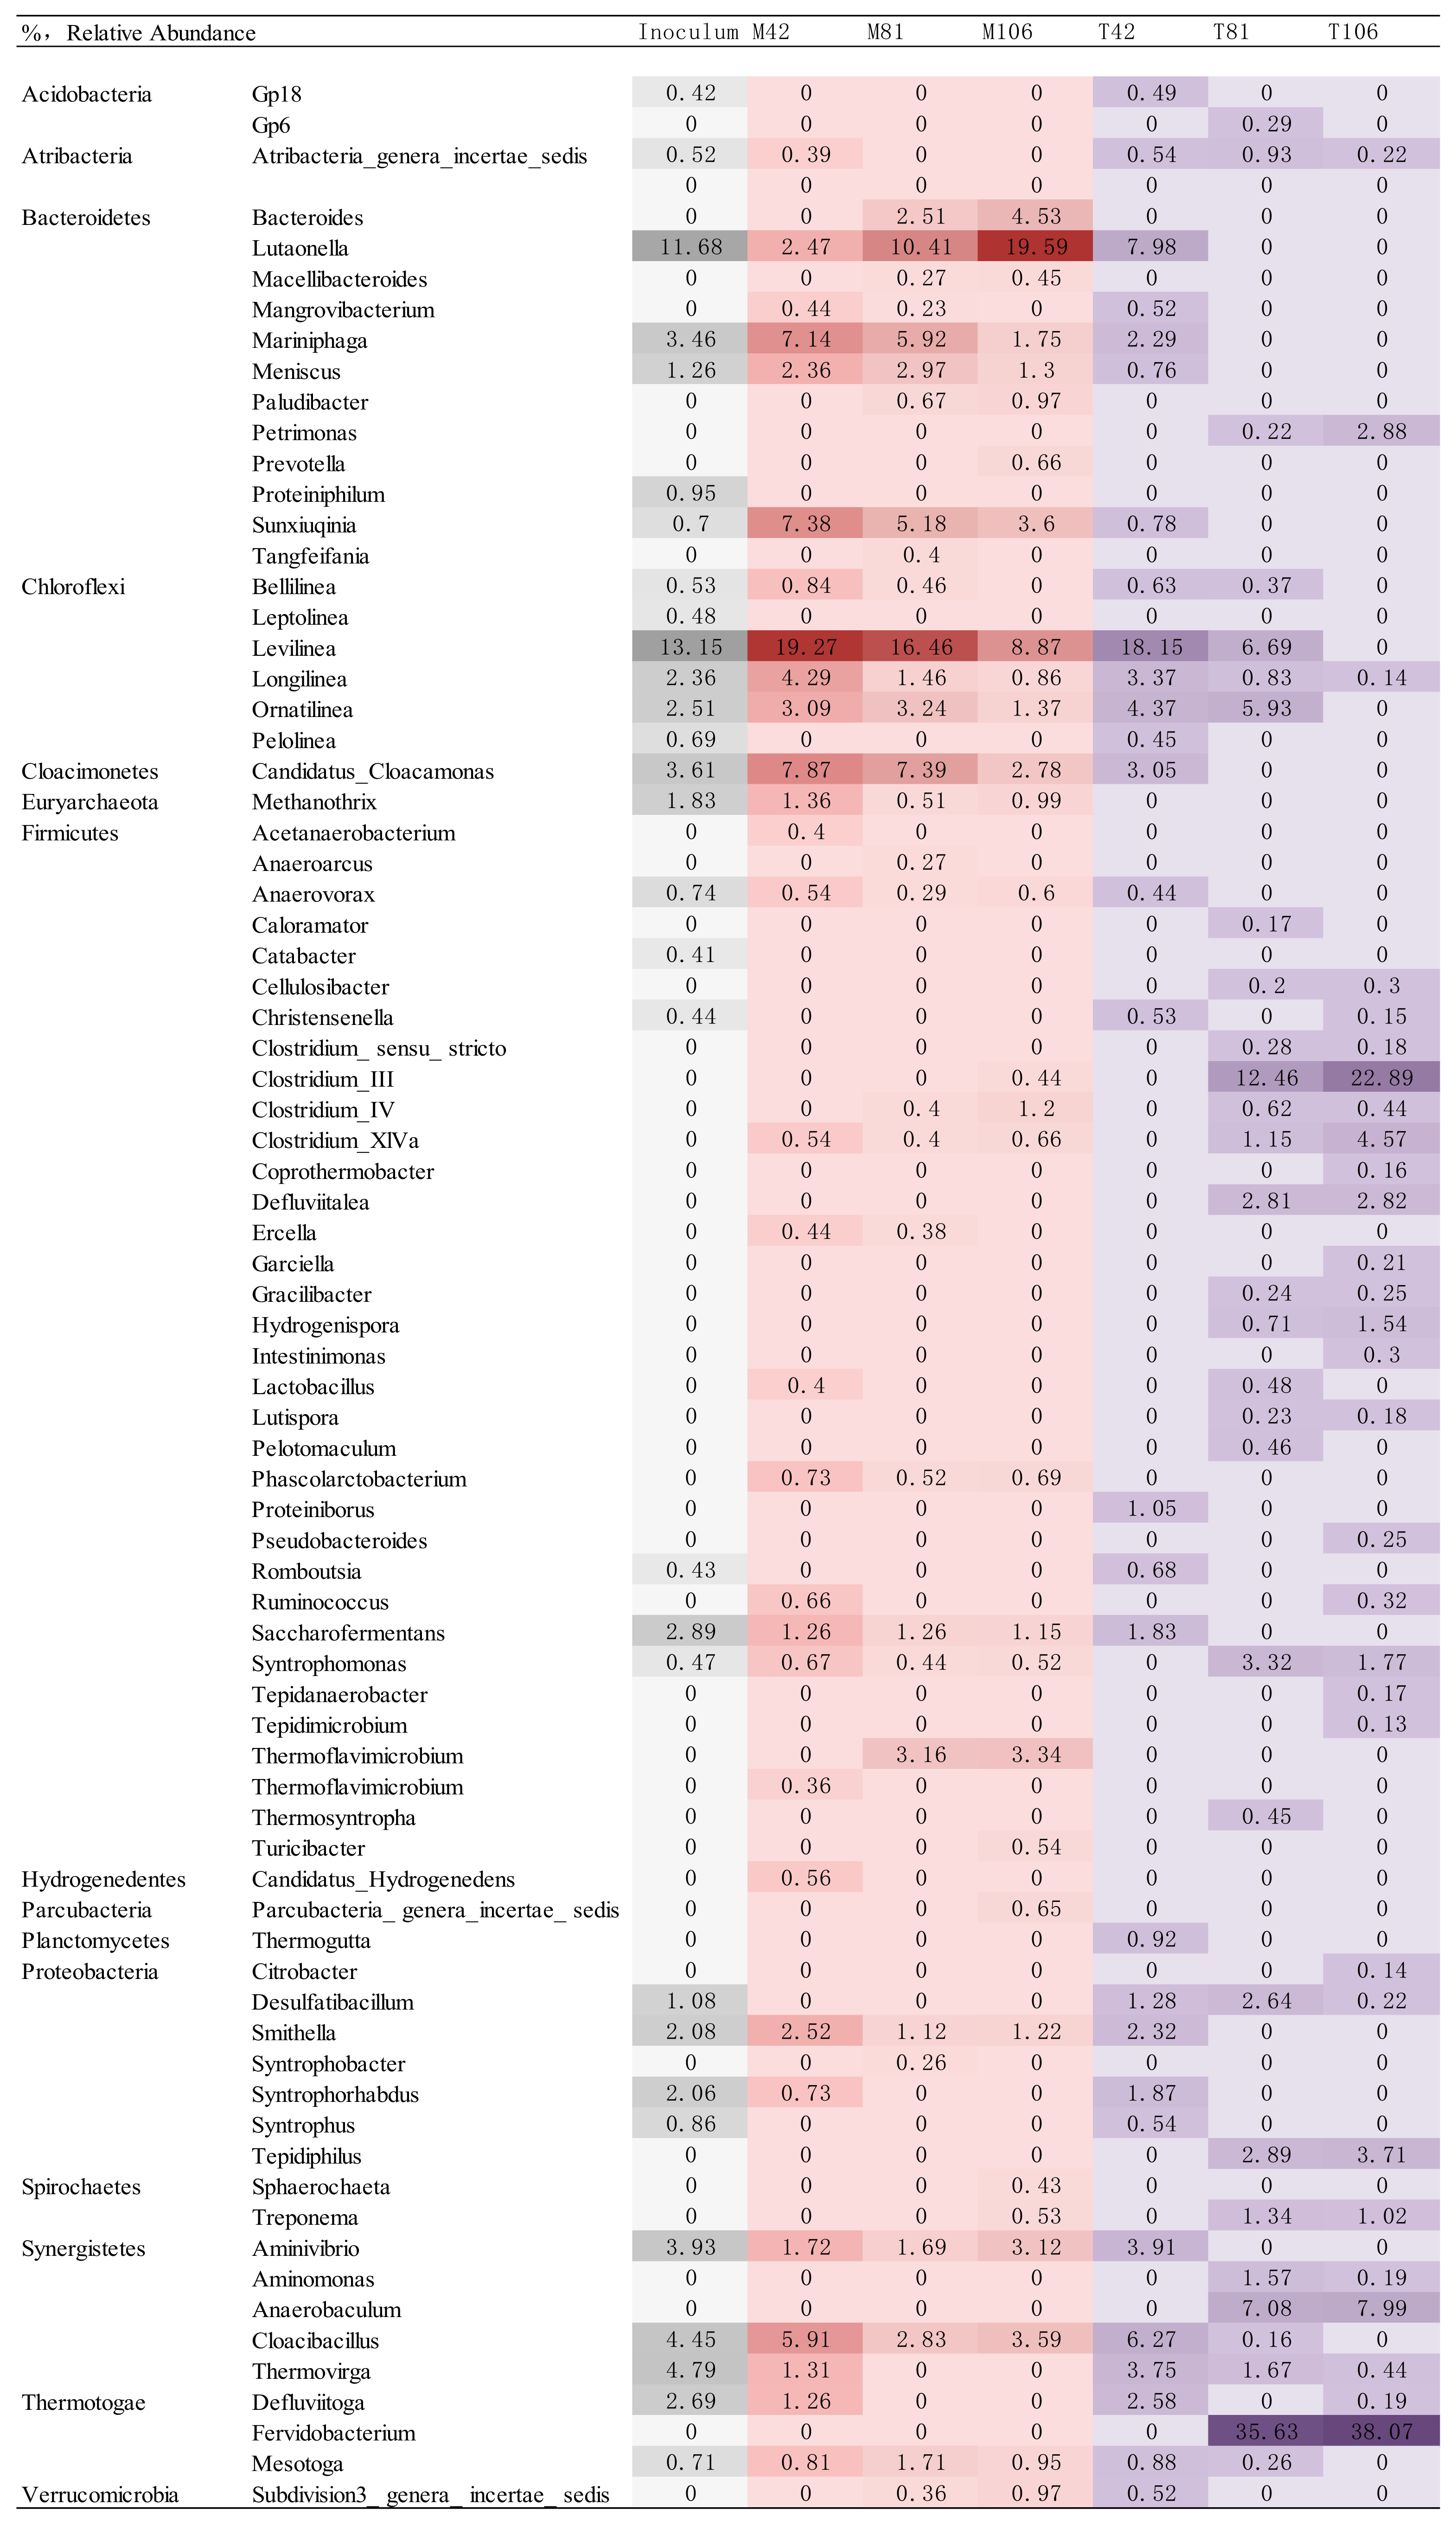
2.2. Bacterial Communities Revealed by Pyrosequencing

Comparison of the sequencing data with the database and taxonomic analysis at the species level were carried out using a high-throughput pyrosequencing technique to investigate the microbial community structures and dynamics. The samples were collected at Days 0 (inoculum), 42, 81, and 106 from the MR and TR. Table 1 shows the sequence number (Seq num) and the alpha diversity estimators of three indices (Shannon, ACE, Chao1) for each sample. The Shannon index reflects the community diversity, and the ACE and Chao 1 indices are used to estimate the total number of species. The higher Shannon, ACE, and Chao 1 index values of the MR mutually implied the higher diversity of the bacterial community in this reactor. Nevertheless, Sample T42 had higher values of the diversity estimators than the inoculum, implying adaptation and an intense change of the bacterial community in the TR. For the TR, the values of the diversity estimators increased throughout most of the operation, and a subsequent decline in diversity indicated that the dominant bacterial community had a greater advantage in the end (Table 2). For the archaeal community, the diversity showed a different trend between the MR and TR, in which the diversity of the archaeal community increased from Day 0 to Day 106, indicating that more archaea were involved in the process of methane production than in the inoculum. The TR showed the highest diversity of the archaeal community at Day 42, and then decreased in the latter days. At Day 106, the TR had the lowest diversity of the archaeal community, implying that fewer archaea were involved in the process of methane production than in the MR. Overall, the MR and TR showed decreasing trends in the diversity of the bacterial community during the running time; the diversity of the archaeal community increased in the MR and decreased in the TR. The diversity of the MR was greater than that of the TR for both bacteria and archaea.
The phylum-level distribution of sequences is shown in Figure 2. For the bacteria, seven phyla existed in both digests with a relative abundance higher than 1%. Chloroflexi was the major phylum at the early stage for both digests. Bacteroidetes was the dominant phylum in the MR while Thermotogae was dominant in the TR for almost the entire process. Firmicutes appeared in both reactors throughout the whole period and its relative abundance was much higher in the TR than in the MR. Synergistetes and Proteobacteria existed throughout the operation period, indicating that these phyla might play important roles in both reactors even though their proportions were relatively low.
Moreover, the phyla distributions in the two digesters showed different patterns of change during the operation time. In the MR, the relative abundance of Chloroflexi decreased gradually after an initial increase. The proportion of the phylum Bacteroidetes increased obviously to 49.49% while those of Synergistete and Proteobacteria decreased to 7.11% and 2.47%, respectively. Firmicutes remained steady from Day 0 to Day 106. Cloacimonetes appeared at every stage in the MR, but only appeared initially in the TR. In the TR, the proportions of both Chloroflexi and Bacteroidetes showed a distinct downward trend and reached a very low level (0.25% and 3.41%, respectively) at Day 106. Firmicutes increased significantly and was the most abundant phylum (42.36%) at Day 106. Figure 2 shows that Thermotogae remained stable at the first and last stages (from Day 0 to Day 42 and from Day 81 to Day 106) but increased by up to 32.43% from Day 42 to 81, whereas the abundance of Proteobacteria declined slightly. After 106 days of operation, the two ADs showed a big difference in bacterial communities with Bacteroidetes dominant in the MR while Thermotogae and Firmicutes were dominant in the TR. Analysis of sequencing data provides a better approach to explaining the bacterial communities at the subdivision level. Hence, the relative abundance at the genus level was computed in every sample. In total, 39 genera were detected with a proportion higher than 0.1% in at least one sample screened as the abundant genera. The distributions at the genus level of each sample are shown in Figure 3.
As mentioned above, Chloroflexi was present in large proportions and then decreased in both reactors. The distributions also showed a downward trend in this phylum at the genus level. The major genus classified to the phylum Chloroflexi was Levilinea, which represented the greatest proportion in the inoculum as well as in samples M42, M81, T42, and then decreased dramatically from 19.27% to 8.87% in the MR and from 18.15% to 0 in the TR during operation. Levilinea can convert several carbohydrates to acetate and hydrogen under conditions of a high sodium concentration [21]. The genera Longilinea and Ornatilinea also decreased in both reactors, which might indicate their potential ability for organic matter degradation under hydrolysis acidification conditions [22].
For the MR, the genera in the dominant phylum Bacteroidetes showed obvious changes over the operation time. Lutaonella decreased initially and then increased significantly to 19.59% in M106, as this genus can use many organic acids and amino acids [23]. Mariniphaga and Sunxiuqinia showed an obvious decline in abundance. The former takes advantage of lipids and the latter ferments sugars with many kinds of acids as major fermentation products [24,25].
In the TR, the major genus assigned to the dominant phylum Thermotogae was Fervidobacterium, reaching very high levels of 35.63% at Day 81 and 38.07% at Day 106, which suggested its activities in acetate oxidation [26]. The relative abundance of Clostridium_III classified to the phylum Firmicutes also increased dramatically to 22.89% at Day 106; Clostridium_III converts complex macromolecules into alcohols, hydrogen, carbon dioxide, and volatile fatty acids [27].

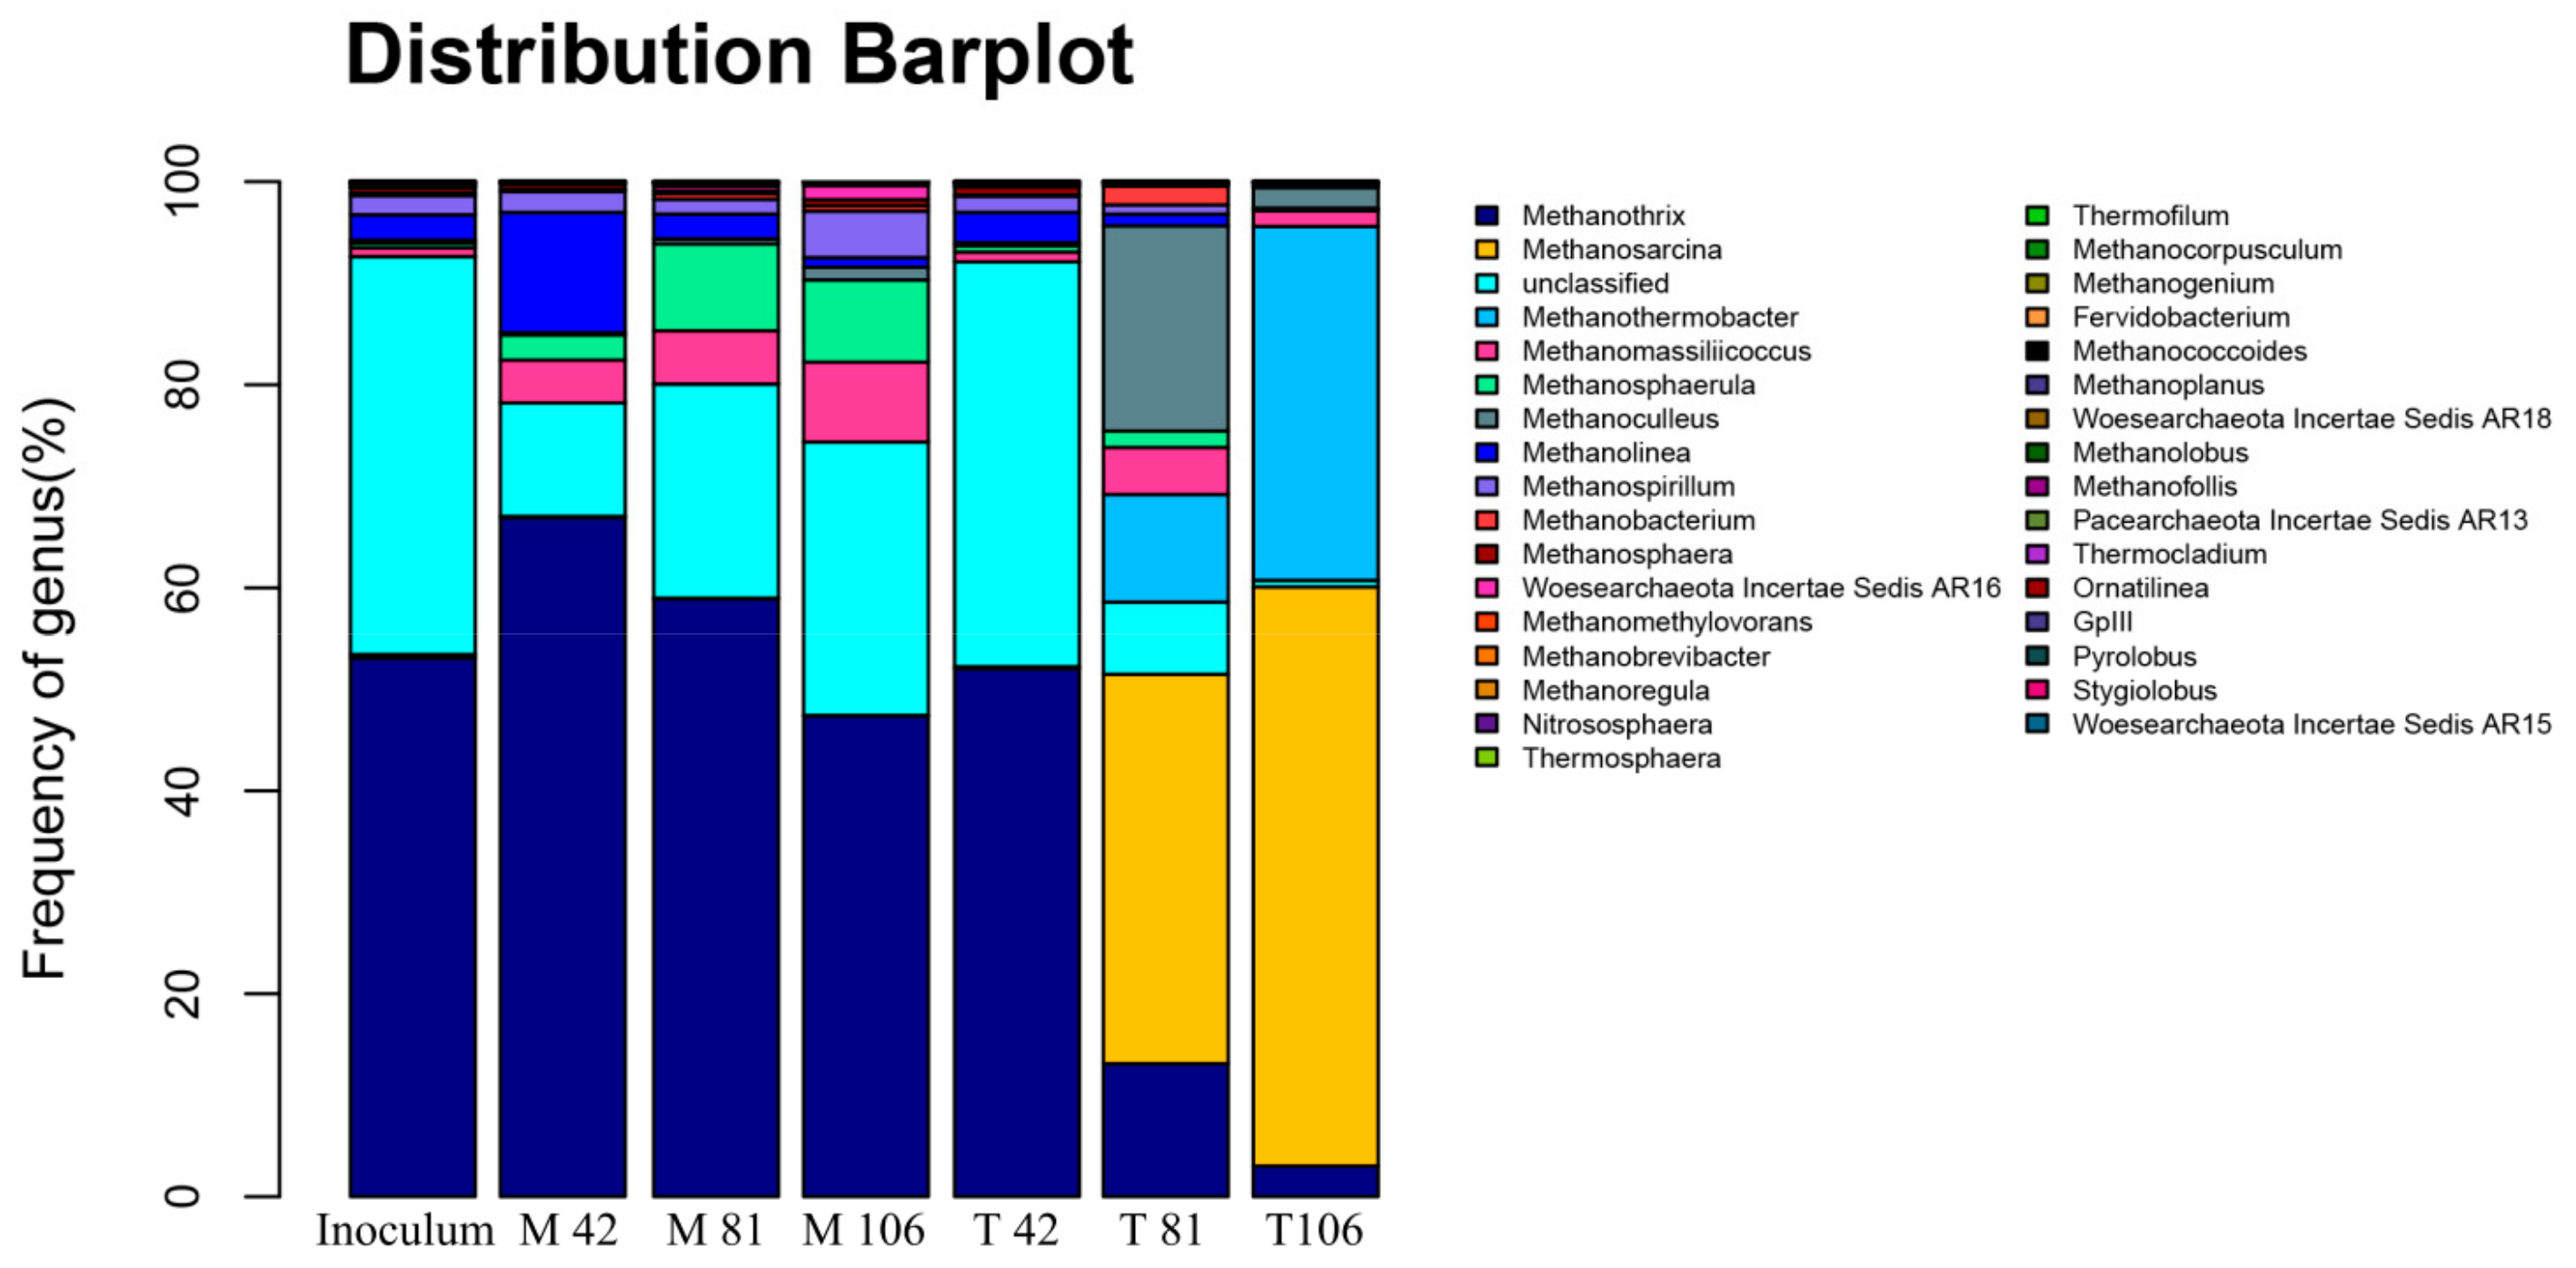
2.3. Dynamics of Methanogen Communities

The archaeal community dynamics were also revealed by high-throughput pyrosequencing targeting 16S rRNA gene segments. The patterns of relative abundance at the genus level of archaea are shown in Figure 4. Overall, methanogens had lower diversity than the bacterial community partly because of the intrinsically low phylogenetic diversity of methanogens.
Methanothrix was the most abundant methanogen in the MR throughout the operation and at Day 42 of the TR, and is considered to be the main methanogen involved in anaerobic fermentation [28]. Moreover, Methanothrix accounted for the majority of the sequence reads in the MR, while Methanosarcina was most abundant for the TR at Day 81 and Day 106 at the genus level, which is commonly observed in thermophilic digesters. Methanothermobacter ranked second in relative abundance in the TR at Days 81 and 106, which also implied a relation to hydrogenotrophic methanogens. In general, hydrogenotrophic methanogen species are more commonly detected in thermophilic digesters [28].
The genus Methanothrix was dominant in the MR throughout the running time with a relative abundance of 66.89% at Day 42, 58.94% at Day 81, and 47.39% at Day 106, representing an acetoclastic microorganism [29]. Comparatively, Methanothrix was only the most abundant genus (52.05%) in the TR at Day 42, and then Methanosarcina became the most abundant of the TR methanogens at 38.37% by Day 81 and at 57.07% by Day 106; Methanosarcina can produce methane by using H2/CO2, acetate, and methanol [30]. Methanothermobacter also played an important role in the TR, accounting for 10.62% at Day 81 and 34.86% at Day 106, indicating important effects of hydrogenotrophic methanogens [30]. Remarkably, Methanoculleus had a relative abundance of 20.20% with an ability for hydrogenotrophic activity [31]. In consideration of the rapid change in the OLR from Day 42 to Day 81, the microbial community might also go through a dramatic change in the TR. Overall, acetoclastic methanogens were dominant in the MR, while hydrogenotrophic methanogens were dominant in the TR, implying hydrogenotrophic and acetoclastic metabolism processes as the main pathways to methane production in the TR and MR, respectively.

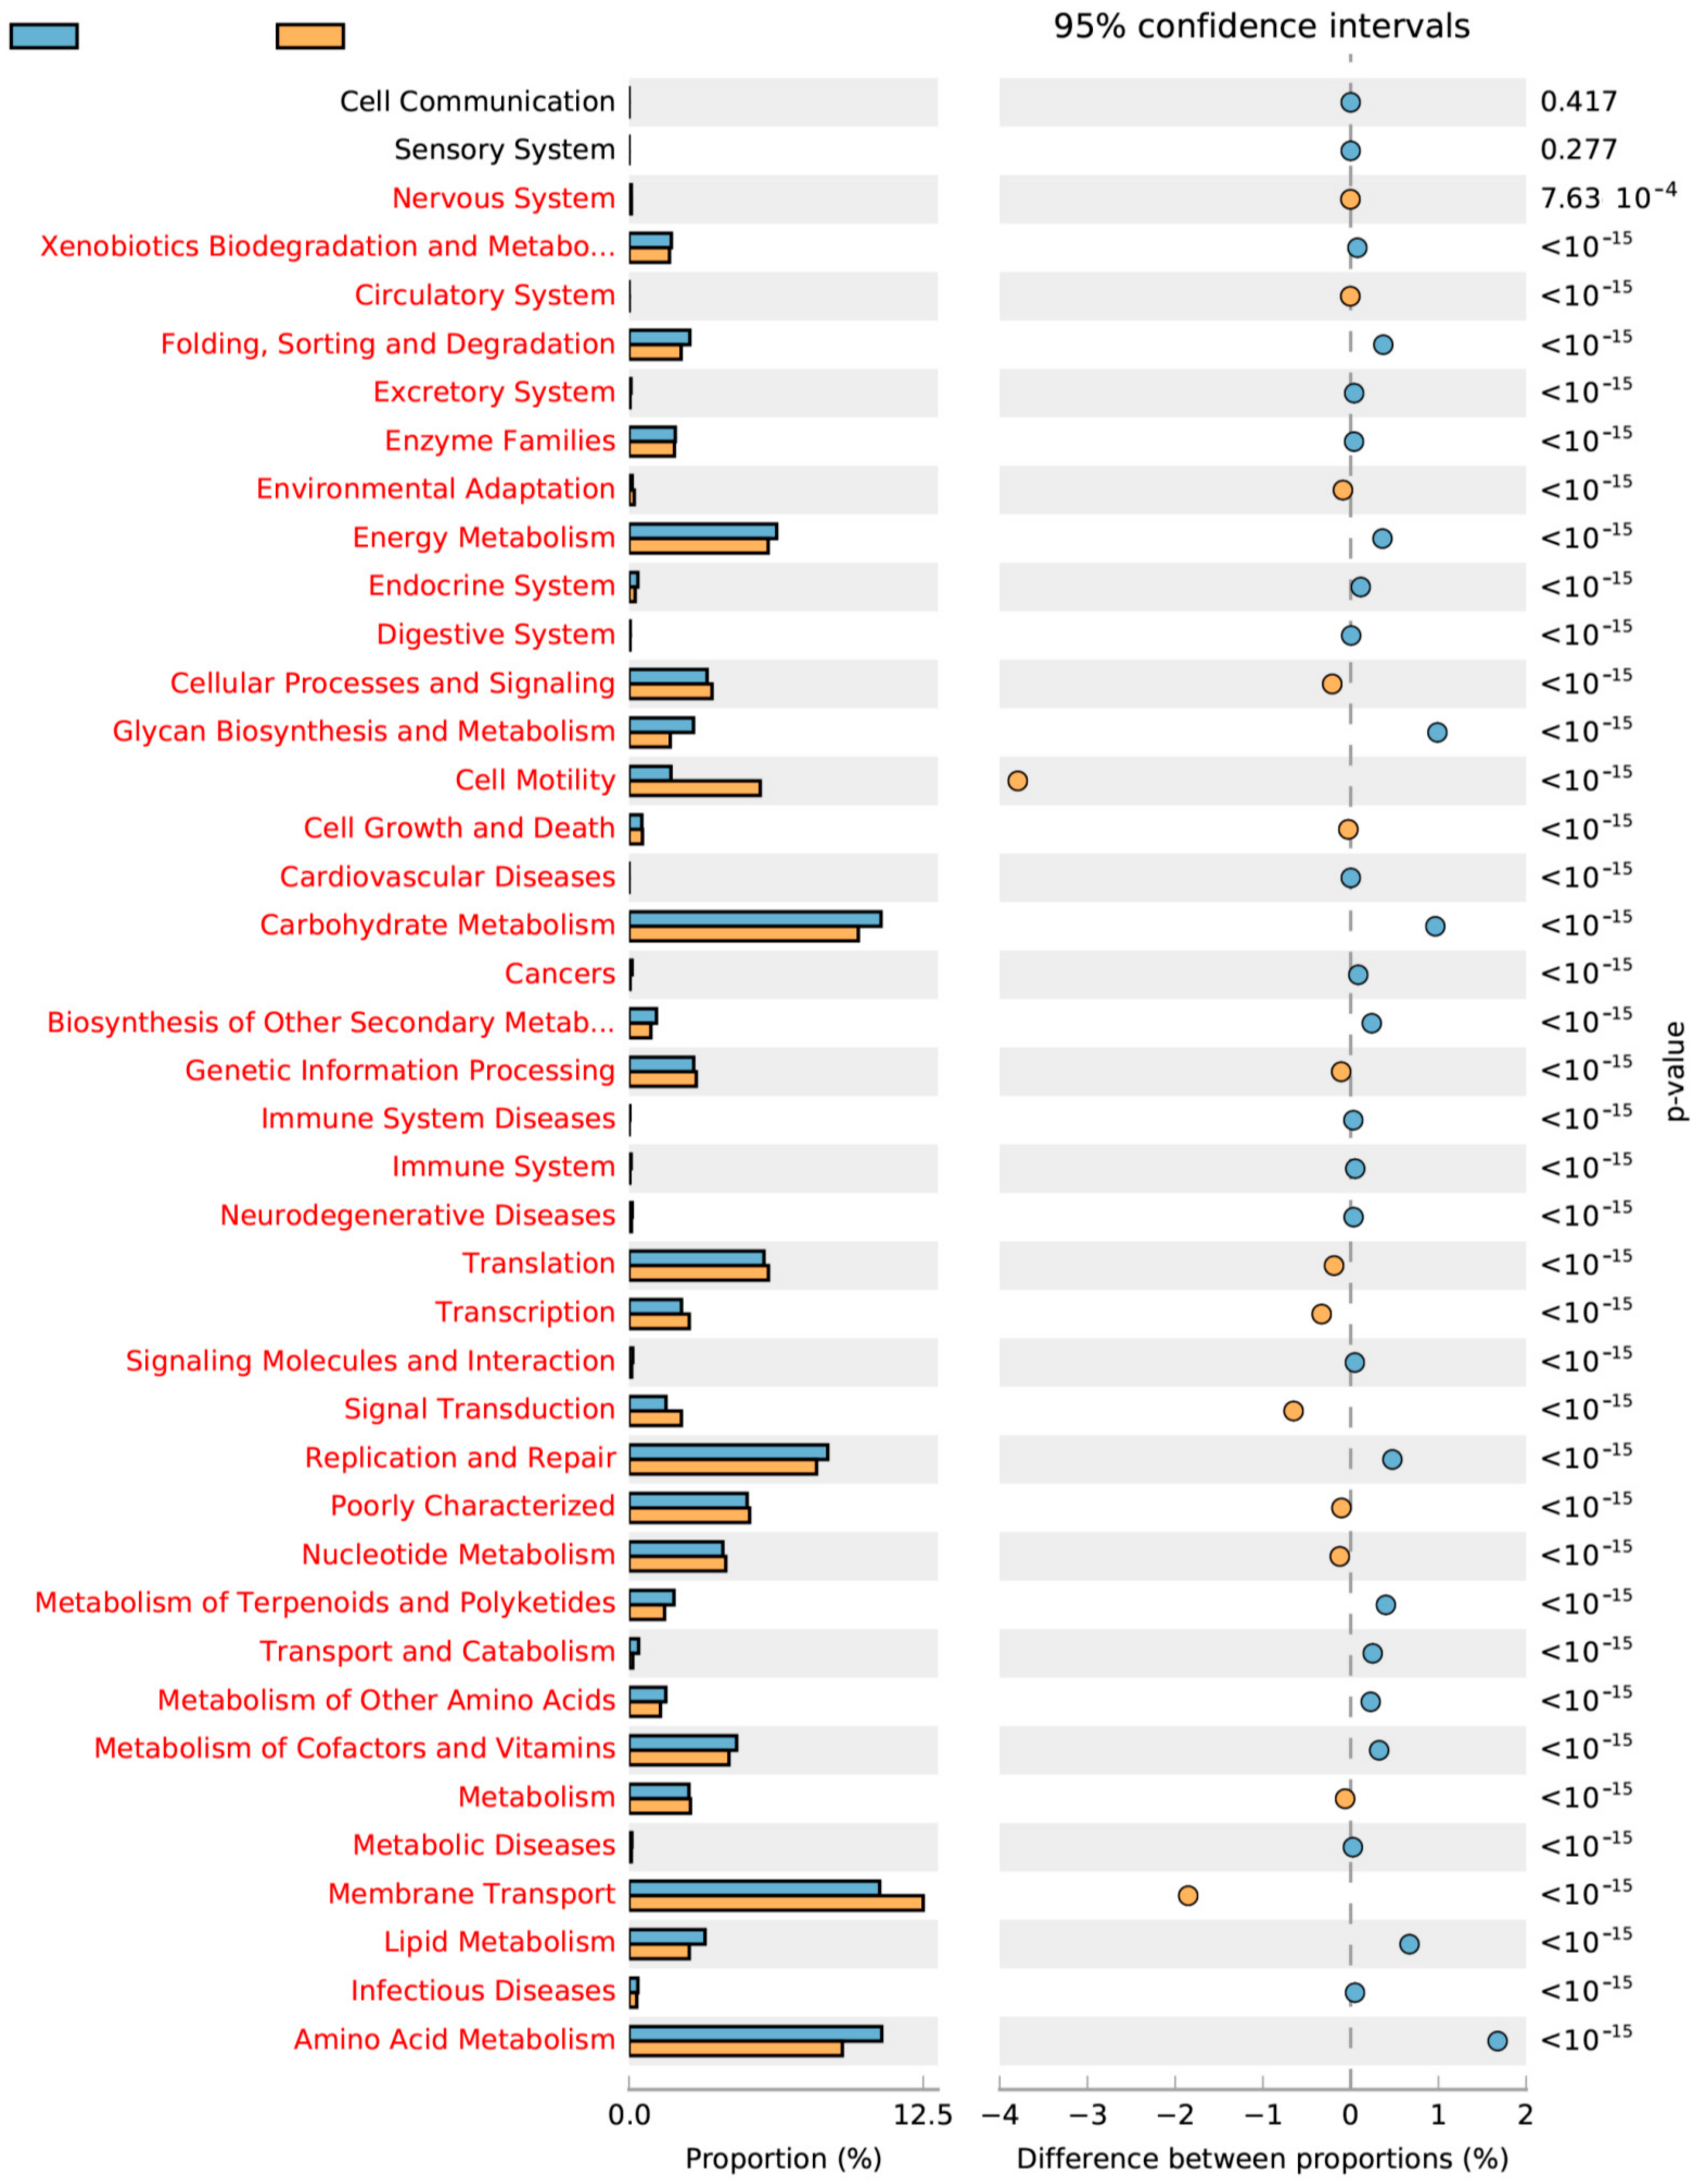
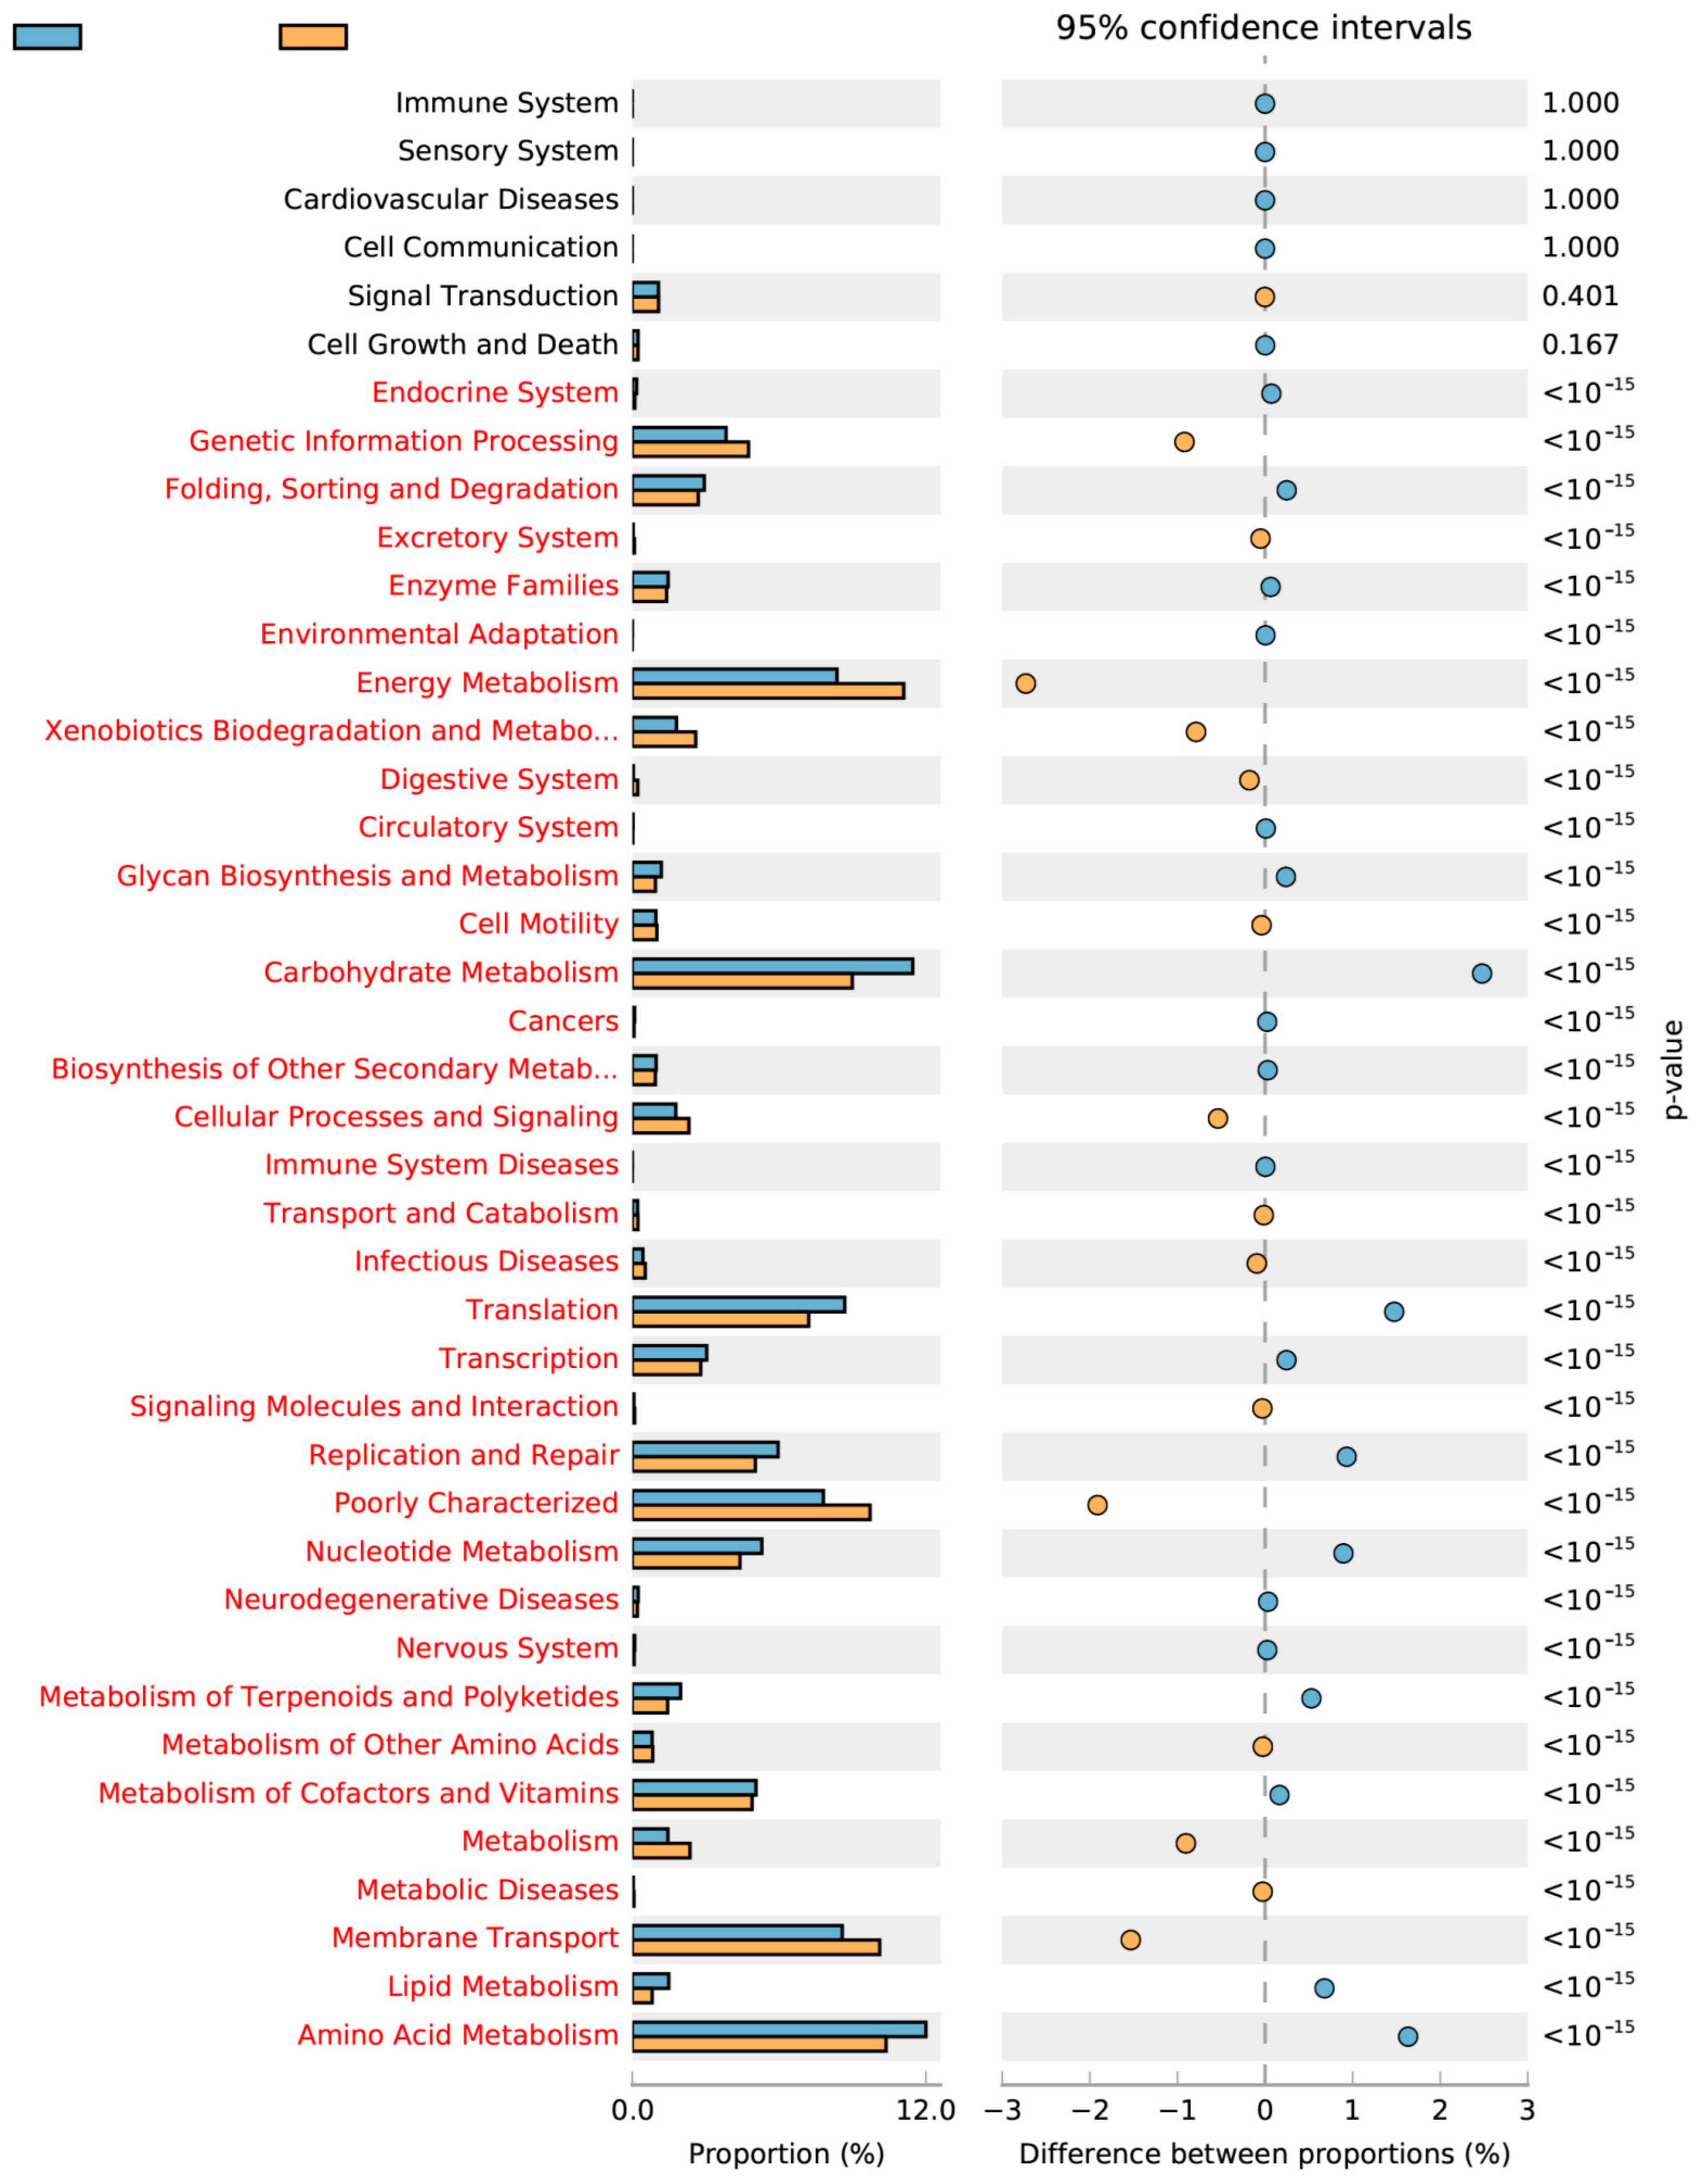
2.4. Linkage between Metabolism and Reactor Performances

To further understand the impact of OLR and temperature on microbial communities, analysis of metabolic pathways was conducted. Based on the results of the two-level classification of the PICRUSt function, the differences of sample or intergroup abundance were compared, and the function of the significant differences between the samples or the abundance of the group was evaluated. Bacteria metabolism was compared between samples M106 and T106 to reveal the effect of the operation condition in both reactors. For bacteria, all of the metabolic functions are shown in Figure 5. Compared with that of the TR, the metabolism of the MR showed more active trends in amino acid metabolism, lipid metabolism, metabolism of cofactors and vitamins, carbohydrate metabolism, and energy metabolism, which contributed to the acid production step in anaerobic fermentation. Due to the complex substrate of the OFMSW and no accumulation of VFAs, the rate-limiting step was considered to be hydrolytic acid production. Amino acid metabolism, lipid metabolism, and carbohydrate metabolism refer to the degradation of amino acids, lipids, and carbohydrates, respectively. To a certain extent, the problem of a slow acid production rate has been solved because of the improvement of these metabolic pathways in the MR. By contrast, in the TR, cell motility, translation, and membrane transport were more active than in the MR, showing greater potential to adapt to environmental changes.
For archaea, energy metabolism is considered as the primary methane production process in anaerobic fermentation [32]. The sequence patterns for metabolism are shown in Figure 6, demonstrating a proportion in the TR of 11.12%, which is much greater than the 8.39% in the MR. Thus, the TR might have more potential for methane production in the presence of a more acidic substrate in AD. Meanwhile, amino acid metabolism and lipid metabolism in the MR were more active than in the TR, which might be the main cause of the difference in AD performance.

3. Materials and Methods

3.1. Anaerobic Digesters

Two identical 60 L cylindrical anaerobic reactors with 50 L working volume and a heating apparatus were used to maintain internal temperatures at 55 ± 1 °C and 35 ± 1 °C for the TR and MR, respectively. The inoculum was taken from a normal atmospheric-temperature AD used for treating dairy farm wastewater (Kaiping, Guangzhou Province, China). Before feeding the reactors, the inoculum was filtered through a 1 mm sieve and starved for one week. The seed biomass was diluted with double-distilled water to 9.7 ± 0.7 gVS/L in reactors. The MSW was periodically obtained from a waste yard (Shaoguan, Guangdong province, China). The inorganic portions of the MSW such as glass and plastics were removed manually. The selected MSW was subpackaged in several sealing bags and stored at −18 °C after being ground and homogenized. The basic characteristics of the MSW are shown in Table S1 of the Supplementary Materials. The hydraulic retention time was 20 days, and the reactors were fed once a day. A stirrer was set at a speed of 60 rpm and ran constantly during the discharging and feeding time; at other time, it operated for 3 min every 15 min. The biogas was measured using a wet gas meter (Haide, Dalian, China).

3.2. Chemical Analysis

The total and volatile solid contents were measured by standard analytical methods for the examination of water and wastewater [33]. The C, H, and N contents were measured using a Vario EL element analyzer (VarioEL cube, Elementar, Langenselbold, Germany). The concentrations of NH3-N and COD were analyzed using a commercially available kit (DR2800, Hach, Loveland, CO, USA). The pH was measured using a pH meter (pHS-3C, Rex, Shanghai, China). The contents of formate and VFAs—mainly acetate, propionate, and butyrate—were analyzed by high-performance liquid chromatography (e2695, Waters, Boston, MA, USA) using a refractive index detector and HPX-87 column. The mobile phase was 0.005 N H2SO4 with a flow rate of 0.5 mL/min, and the temperature of the column was 50 °C. Alkalinity was measured with 0.25 N H2SO4 to points of pH 5.7 and 4.3, to obtain data on IA, PA, and total alkalinity using a Titroline 5000 titrator (Julabo, Seelbach, Germany).

3.3. DNA Extraction and Amplification

DNA extraction was performed with an E.Z.N.ATM Mag-Bind Soil DNA Kit (Omega Bio-tek, Inc., Norcross, GA, USA) according to the manufacturer’s specifications. The integrity of DNA was detected by agarose gel electrophoresis (UVP, Upland, CA, USA) and the Qubit2.0 DNA detection kit (Life Tech, Shanghai, China). Polymerase chain reaction (PCR) amplification was performed on a PCR instrument (T100TM Thermal Cycler, BIO-RAD, Hercules, CA, USA). The 16S rRNA genes were amplified by three rounds of PCR for archaea. The primers were 340F (5′-CCCTAYGGGGYGCASCAG-3′) and 1000R (5′-GGCCATGCACYWCYTCTC-3′) in the first round, and were 349F (5′-CCCTACACGACGCTCTTCCGATCTN(barcode)GYGCASCAGKCGMGAAW-3′) and 806R (5′-GACTGGAGTTCCTTGGCACCCGAGAATTCCAGGACTACVSGGGTATCTAAT-3′) in the second round. The genes were then PCR-amplified with Illumina nested primers in the third round. For bacteria, there were two rounds of PCR amplification, using the primers 341F (5′-CCCTACACGACGCTCTTCCGATCTG(barcode)CCTACGGGNGGCWGCAG-3′) and 805R (5′-GACTGGAGTTCCTTGGCACCCGAGAATTCCAGACTACHVGGGTATCTAATCC3′) in the first round, and then Illumina nested primers in the second round.

3.4. High-Throughput Pyrosequencing Analysis

The PCR products were sequenced through Illumina Miseq™, and the raw data were then transformed to sequenced reads through CASAVA Base Calling and deposited under accession number SRP131631 in the NCBI SRA database. The raw sequences were wiped off the primer sequences using cutadapt and clustered into operational taxonomic units using Usearch. A total of 295,925 and 282,765 effective 16S rRNA sequences were retrieved with average lengths of 452.91 bp and 417.18 bp for bacteria and archaea, respectively. Richness and diversity estimators (Shannon, ACE, and Chao1 indices) were calculated using MOTHUR. The microbial community structures were classified by blastn in Blast (coverage > 90%), and the comparison of metabolism was conducted using PICRUSt and STAMP.

4. Conclusions

The results of the present study suggest that that mesophilic AD of OFMSW showed better performance than thermophilic AD during both the adaptive phase and the OLR increasing phase. Larger shifts in the bacterial community were observed in the TR along with OLR elevation. With respect to methanogens, Methanothrix dominated in the MR while Methanosarcina was favored in the TR. Variations in the mode and efficiency of metabolism between the MR and TR resulted in different performances with efficiency mainly related to the limiting hydrolytic acid step.

Supplementary Materials

The following are available online at https://www.mdpi.com/1996-1073/11/4/952/s1. Table S1: Basic characteristics of the food waste used in this study.

Acknowledgments

This work was funded by Guangdong Application Achievement Project (2017B020238005), Guangzhou science and technology project (201803030007) and Guangdong Technology Program of Industrial High Technology (2013B010204053).

Author Contributions

Xiaoying Kong, Tao Xing, Yi Zhang, and Yong Sun conceived and designed the experiments; Yiming Gao and Xingjian Luo performed the experiments; Yiming Gao analyzed the data; Yongming Sun contributed reagents/materials/analysis tools; Yiming Gao wrote the paper.

Conflicts of Interest

The authors declare no conflict of interest.

References

  1. Murphy, J.D.; McKeogh, E. Technical, economic and environmental analysis of energy production from municipal solid waste. Renew. Energy 2004, 29, 1043–1057. [Google Scholar] [CrossRef]
  2. Griffin, M.E.; McMahon, K.D.; Mackie, R.I.; Raskin, L. Methanogenic population dynamics during start-up of anaerobic digesters treating municipal solid waste and biosolids. Biotechnol. Bioeng. 1998, 57, 342–355. [Google Scholar] [CrossRef]
  3. Song, Y.C.; Kwon, S.J.; Woo, J.H. Mesophilic and thermophilic temperature co-phase anaerobic digestion compared with single-stage mesophilic- and thermophilic digestion of sewage sludge. Water Res. 2004, 38, 1653–1662. [Google Scholar] [CrossRef] [PubMed]
  4. Kang, X.; Sun, Y.; Li, L.; Kong, X.; Yuan, Z. Improving methane production from anaerobic digestion of Pennisetum Hybrid by alkaline pretreatment. Bioresour. Technol. 2018, 255, 205–212. [Google Scholar] [CrossRef] [PubMed]
  5. Panepinto, D.; Genon, G. Analysis of the extrusion as a pretreatment for the anaerobic digestion process. Ind. Crop. Prod. 2016, 83, 206–212. [Google Scholar] [CrossRef]
  6. Ahring, B.K. Perspectives for anaerobic digestion. In Biomethanation I; Ahring, B.K., Ed.; Springer: Berlin/Heidelberg, Germany, 2003; Volume 81, pp. 1–30. [Google Scholar]
  7. Bayr, S.; Rantanen, M.; Kaparaju, P.; Rintala, J. Mesophilic and thermophilic anaerobic co-digestion of rendering plant and slaughterhouse wastes. Bioresour. Technol. 2012, 104, 28–36. [Google Scholar] [CrossRef] [PubMed]
  8. Kim, M.; Ahn, Y.H.; Speece, R.E. Comparative process stability and efficiency of anaerobic digestion; mesophilic vs. thermophilic. Water Res. 2002, 36, 4369–4385. [Google Scholar] [CrossRef]
  9. Ma, Q.; Shen, F.; Yuan, H.R.; Zou, D.X.; Liu, Y.P.; Zhu, B.N.; Li, X.J. Investigation on anaerobic digestion of the organic fraction of municipal solid waste (OFMSW) after pretreatment of fast aerobic fermentation. Fresenius Environ. Bull. 2015, 24, 1039–1046. [Google Scholar]
  10. Muha, I.; Zielonka, S.; Lemmer, A.; Schonberg, M.; Linke, B.; Grillo, A.; Wittum, G. Do two-phase biogas plants separate anaerobic digestion phases?—A mathematical model for the distribution of anaerobic digestion phases among reactor stages. Bioresour. Technol. 2013, 132, 414–418. [Google Scholar] [CrossRef] [PubMed]
  11. Gujer, W.; Zehnder, A.J.B. Conversion processes in anaerobic-digestion. Water Sci. Technol. 1983, 15, 127–167. [Google Scholar]
  12. Schievano, A.; D’Imporzano, G.; Malagutti, L.; Fragali, E.; Ruboni, G.; Adani, F. Evaluating inhibition conditions in high-solids anaerobic digestion of organic fraction of municipal solid waste. Bioresour. Technol. 2010, 101, 5728–5732. [Google Scholar] [CrossRef] [PubMed]
  13. Nelson, M.C.; Morrison, M.; Yu, Z.T. A meta-analysis of the microbial diversity observed in anaerobic digesters. Bioresour. Technol. 2011, 102, 3730–3739. [Google Scholar] [CrossRef] [PubMed]
  14. Ye, L.; Zhang, T. Bacterial communities in different sections of a municipal wastewater treatment plant revealed by 16S rDNA 454 pyrosequencing. Appl. Microbiol. Biotechnol. 2013, 97, 2681–2690. [Google Scholar] [CrossRef] [PubMed]
  15. Riviere, D.; Desvignes, V.; Pelletier, E.; Chaussonnerie, S.; Guermazi, S.; Weissenbach, J.; Li, T.; Camacho, P.; Sghir, A. Towards the definition of a core of microorganisms involved in anaerobic digestion of sludge. ISME J. 2009, 3, 700–714. [Google Scholar] [CrossRef] [PubMed]
  16. Guo, X.H.; Wang, C.; Sun, F.Q.; Zhu, W.J.; Wu, W.X. A comparison of microbial characteristics between the thermophilic and mesophilic anaerobic digesters exposed to elevated food waste loadings. Bioresour. Technol. 2014, 152, 420–428. [Google Scholar] [CrossRef] [PubMed]
  17. Oleszkiewicz, J.A.; Marstaller, T.; McCartney, D.M. Effects of ph on sulfide toxicity to anaerobic processes. Environ. Technol. Lett. 1989, 10, 815–822. [Google Scholar] [CrossRef]
  18. Ripley, L.E.; Boyle, W.C.; Converse, J.C. Improved alkalimetric monitoring for anaerobic-digestion of high-strength wastes. J. Water Pollut. Control Fed. 1986, 58, 406–411. [Google Scholar]
  19. Poggivaraldo, H.M.; Tingley, J.; Oleszkiewicz, J.A. Inhibition of growth and acetate uptake by ammonia in batch anaerobic-digestion. J. Chem. Technol. Biotechnol. 1991, 52, 135–143. [Google Scholar] [CrossRef]
  20. Hansen, K.H.; Angelidaki, I.; Ahring, B.K. Anaerobic digestion of swine manure: Inhibition by ammonia. Water Res. 1998, 32, 5–12. [Google Scholar] [CrossRef]
  21. Yamada, T.; Sekiguchi, Y.; Hanada, S.; Imachi, H.; Ohashi, A.; Harada, H.; Kamagata, Y. Anaerolinea thermolimosa sp. nov., Levilinea saccharolytica gen. nov., sp. nov and Leptolinea tardivitalis gen. nov., so. nov., novel filamentous anaerobes, and description of the new classes anaerolineae classis nov and Caldilineae classis nov in the bacterial phylum Chloroflexi. Int. J. Syst. Evol. Microbiol. 2006, 56, 1331–1340. [Google Scholar] [PubMed]
  22. Yamada, T.; Imachi, H.; Ohashi, A.; Harada, H.; Hanada, S.; Kamagata, Y.; Sekiguchi, Y. Bellilinea caldifistulae gen. nov., sp. nov and Longilinea arvoryzae gen. nov., sp. nov., strictly anaerobic, filamentous bacteria of the phylum Chloroflexi isolated from methanogenic propionate-degrading consortia. Int. J. Syst. Evol. Microbiol. 2007, 57, 2299–2306. [Google Scholar] [CrossRef] [PubMed]
  23. Arun, A.B.; Chen, W.M.; Lai, W.A.; Chou, J.H.; Shen, F.T.; Rekha, P.D.; Young, C.C. Lutaonella thermophila gen. nov., sp. nov., a moderately thermophilic member of the family Flavobacteriaceae isolated from a coastal hot spring. Int. J. Syst. Evol. Microbiol. 2009, 59, 2069–2073. [Google Scholar] [CrossRef] [PubMed]
  24. Wang, F.Q.; Shen, Q.Y.; Chen, G.J.; Du, Z.J. Mariniphaga sediminis sp. nov., isolated from coastal sediment. Int. J. Syst. Evol. Microbiol. 2015, 65, 2908–2912. [Google Scholar] [CrossRef] [PubMed]
  25. Irgens, R.L. Meniscus, a new genus of aerotolerant, gas-vacuolated bacteria. Int. J. Syst. Bacteriol. 1977, 27, 38–43. [Google Scholar] [CrossRef]
  26. Patel, B.; Morgan, H. A Combination of Stable Isotope Probing, Illumina Sequencing, and Co-occurrence Network to Investigate Thermophilic Acetate- and Lactate-Utilizing Bacteria. Microb. Ecol. 2018, 75, 113–122. [Google Scholar]
  27. Zhang, Y.; Alam, M.A.; Kong, X.; Wang, Z.; Li, L.; Sun, Y.; Yuan, Z. Effect of salinity on the microbial community and performance on anaerobic digestion of marine macroalgae. J. Chem. Technol. Biotechnol. 2017, 92, 2392–2399. [Google Scholar] [CrossRef]
  28. Demirel, B.; Scherer, P. The roles of acetotrophic and hydrogenotrophic methanogens during anaerobic conversion of biomass to methane: A review. Rev. Environ. Sci. Biotechnol. 2008, 7, 173–190. [Google Scholar] [CrossRef]
  29. Kendall, M.M.; Boone, D.R. The Order Methanosarcinales. In The Prokaryotes: Volume 3: Archaea. Bacteria: Firmicutes, Actinomycetes; Dworkin, M., Falkow, S., Rosenberg, E., Schleifer, K.-H., Stackebrandt, E., Eds.; Springer: New York, NY, USA, 2006; pp. 244–256. [Google Scholar]
  30. Garcia, J.L.; Patel, B.K.C.; Ollivier, B. Taxonomic phylogenetic and ecological diversity of methanogenic Archaea. Anaerobe 2000, 6, 205–226. [Google Scholar] [CrossRef] [PubMed]
  31. Garcia, J.-L.; Ollivier, B.; Whitman, W.B. The Order Methanomicrobiales. In The Prokaryotes: Volume 3: Archaea. Bacteria: Firmicutes, Actinomycetes; Dworkin, M., Falkow, S., Rosenberg, E., Schleifer, K.-H., Stackebrandt, E., Eds.; Springer: New York, NY, USA, 2006; pp. 208–230. [Google Scholar]
  32. Zhang, J.X.; Mao, L.W.; Zhang, L.; Loh, K.C.; Dai, Y.J.; Tong, Y.W. Metagenomic insight into the microbial networks and metabolic mechanism in anaerobic digesters for food waste by incorporating activated carbon. Sci. Rep. 2017, 7, 10. [Google Scholar] [CrossRef] [PubMed]
  33. Cleceri, L.S.; Greenberg, A.E.; Eaton, A.D. Standard Methods for the Examination of Water and Waste Water; American Public Health Association: Washington, DC, USA, 1998; p. 113. [Google Scholar]
Figure 1. Evolution of biogas/methane yield (A,B), methane production and percentage (C,D), pH, and intermediate alkalinity to partial alkalinity (IA:PA) ratio (E,F) in both reactors.
Energies 11 00952 g001
Figure 2. Taxonomic compositions of bacterial communities at the phylum level in each sample retrieved from pyrosequencing. The number in the sample names represents the day when sampling occurred. T: thermophilic reactor; M: mesophilic reactor.
Energies 11 00952 g002
Figure 3. Taxonomic compositions of bacterial communities at the genus level for the sequences retrieved from each sample. Grey, inoculum; red, mesophilic reactor (MR); purple, thermophilic reactor (TR) (higher relative abundances are shown in deeper colors).
Energies 11 00952 g003
Figure 4. Taxonomic compositions of methanogens at the genus level in each sample retrieved from pyrosequencing. The sample names are the same as those described in Figure 2.
Energies 11 00952 g004
Figure 5. Different proportions of bacteria metabolic function at 95% confidence intervals between the MR and TR at Day 106.
Energies 11 00952 g005
Figure 6. Different proportions of archaeal metabolic function at 95% confidence intervals between the MR and TR at Day 106.
Energies 11 00952 g006
Table 1. Diversity indices of bacterial 16S rRNA gene libraries obtained from pyrosequencing. All values were calculated at the 0.03 distance limit.
Sample IDSeq numShannonACEChao1
Inoculum36,9684.832085.722003.94
M4250,7214.351993.821993.82
M8134,8813.941482.311196.27
M10643,4953.871333.541290.58
T4248,2684.842107.762010.29
T8124,6403.53819.58740.92
T10639,5213.28812.26754.70
Table 2. Diversity indices of archaeal 16S rRNA gene libraries obtained from pyrosequencing. All values were calculated at the 0.03 distance limit.
Sample IDSeq numShannonACEChao1
Inoculum37,3491.81400.96358.27
M4235,7261.91479.86395.59
M8138,4862.14597.13458.31
M10638,7032.33622.17497.01
T4238,4942.64608.64552.93
T8138,0952.12476.57330.21
T10639,4251.13175.41158

