Article

Current Signature and Vibration Analyses to Diagnose an In-Service Wind Turbine Drive Train

by
Estefania Artigao
1,*,
Sofia Koukoura
2,
Andrés Honrubia-Escribano
1,
James Carroll
2,
Alasdair McDonald
2 and
Emilio Gómez-Lázaro
1
1
Renewable Energy Research Institute (IIER) and DIEEAC-EDII-AB, University of Castilla—La Mancha, 02071 Albacete, Spain
2
Department of Electric & Electronic Engineering, University of Strathclyde, Glasgow G11XV, UK
*
Author to whom correspondence should be addressed.
Energies 2018, 11(4), 960; https://doi.org/10.3390/en11040960
Submission received: 26 March 2018 / Revised: 12 April 2018 / Accepted: 12 April 2018 / Published: 17 April 2018
(This article belongs to the Section A: Sustainable Energy)

Abstract

:
The goal of the present paper is to achieve the diagnosis of an in-service 1.5 MW wind turbine equipped with a doubly-fed induction generator through current signature and vibration analyses. Real data from operating machines have rarely been analysed in the scientific literature through current signature analysis supported by vibrations. The wind turbine under study was originally misdiagnosed by the operator, where a healthy component was replaced and the actual failure continued progressing. The chronological evolution of both the electrical current and vibration spectra is presented to conduct an in-depth tracking of the fault. The diagnosis is achieved through spectral analysis of the stator currents, where fault frequency components related to rotor mechanical unbalance are identified. This is confirmed by the vibration analysis, which provides insightful information on the health of the drive train. These results can be implemented in condition monitoring strategies, which is of great interest to optimise operation and maintenance costs of wind farms.

1. Introduction

The increment in size of modern wind turbines (WT) and the new growth in offshore developments represent a challenge with regards to the economic viability of wind energy in terms of reliability and availability and, hence, the operation and maintenance (O&M) activities they involve [1,2]. Traditionally, a combination of preventive and corrective maintenance strategies has been implemented [3]. Preventive maintenance refers to scheduled actions that are implemented whether or not there is a fault, and hence unnecessary resources might be employed. Corrective maintenance, in contrast, is carried out once a critical failure has occurred, causing further downtime periods. The new trends are moving towards predictive actions [4], where the optimum downtime and use of the resources can be achieved through condition monitoring. As well as reducing O&M costs, condition monitoring improves reliability and availability of WTs [5].
Condition monitoring involves data gathering of various signals (such as vibrations or electrical signals), the analysis of which is intended to reveal the health of the assembly being monitored [6] and ultimately the remaining useful life (RUL) of a specific component or components [7]. However, neither the data gathering nor its analysis is straightforward. Many signal processing techniques and feature extraction methods can be found in the literature, but the vast majority have only been proven at laboratory scale and are health-state knowledge dependent. The current need for data gathering and analysis is highlighted in [8] proposing “new conceptual expert systems that automate data processing and provide analysis to enhance decision-making”. Efforts have been made with such goal by implementing SCADA-data-driven methods [9] that also look into optimizing the number of sensors while reducing the detection time [10,11].
Another factor motivating the importance of condition monitoring is in the field of lifetime extension of WTs, since the European wind fleet is aging [8]. Currently, lifetime extension is mainly performed on WTs with a power rating of less than 1 MW. However, in the next few years, 20-year-old WTs will increase in power rating, which will enhance lifetime extension appeal based on monitored data [12]. In this regard, several approaches for lifetime extension can be undertaken, based on analytical simulations, practical inspections, or gathered data. Data-driven approaches have been identified as the most cost effective as the number of assets increases per wind farm [13]. In this scenario, the use of SCADA data is gaining importance [14]. SCADA-data based methods can also be implemented in real-time condition monitoring of WTs [15,16].
At the present time, there is a lack of publicly available in-service WT data-based analysis. The literature includes very few current signature analyses from operating doubly-fed induction generators, and none that combine both current and vibration data allowing the validation of the diagnosis. Furthermore, it is common practice for the faults to be known to the authors before the analysis is carried out, or even for a baseline of the healthy-stage to be available so that the differences after a fault has occurred are easily identified. Further research to validate the models developed in the lab is therefore required, especially for machines with unknown health status. In the present paper, current signature analysis is combined with vibrations in order to diagnose an operating WT drive train that was misdiagnosed by the operator. The work herein presented uses data from an in-service 1.5 MW WT equipped with a doubly-fed induction generator (DFIG). The variables used for feature extraction and analysis show their effectiveness for condition monitoring.
Further to this introduction, the paper is structured as follows: Section 2 provides the state-of-the-art on condition-based diagnosis techniques of wind turbine drive trains. Section 3 describes the methodology used in the present work, which is based on current signature and vibrations analyses. The signal processing and the formulae involved are presented. Section 4 describes the database available and the case study development over time. In Section 5, the current and vibration analyses are presented (Section 5.1 and Section 5.2 respectively) and the results discussed (Section 5.3). The conclusions drawn from the study and the main ideas for future work are finally summarised in Section 6.

2. Fault Diagnosis Techniques for Drive Trains and Induction Generators

The drive train, including gearbox and bearings, is among the top three contributors to failure rates and downtime of WTs, together with induction generators [17]. Early detection of gear, bearing and generator faults is therefore crucial if predictive maintenance is to be implemented in order to lower corrective and preventive actions [18]. The main challenge in implementing condition-based maintenance and calculating the remaining useful life (RUL) of critical components is to establish the threshold between healthy and faulty states, for every fault mode for each critical component, especially if the lack of available historical data is taken into account.
A table with the latest real-time diagnosis techniques through current signature and vibration analyses, either alone or in combination, is provided by [19]. Generator bearing and eccentricity, as well as pinion gear faults, can automatically be detected through stator current analysis using information entropy [20], through an adaptive neuro-fuzzy inference system and particle filtering [21] or computing the energy from the fault-related frequencies [22,23]. The results are validated at laboratory benches for the studies in [20,21,22,23] and using simulated data in [24,25]. The main drawback of these approaches is the need for a healthy current baseline. A method improving the signal-to-noise ratio in the electrical signature enhancing fault detection of pinion-gear and bearing related fault frequency components is proposed in [26], which the authors subsequently validated with actual WT data in [27]. Once again, a baseline of healthy data is required.
Spectral line analysis methods in the frequency or order domain are most commonly used in vibration diagnostics. Different vibration analysis methods for WT gearboxes are evaluated and presented in [28]. A comparative study extending these results is given in [29]. Apart from classical frequency domain analysis, other methods used in gear diagnostics are cepstrum analysis [30] and time synchronous averaging [31]. Regarding bearing diagnostics, envelope analysis is widely used in the literature and a comprehensive tutorial is given in [32].
The most common approach for current signature analysis is to analyse the frequency-domain of the current signal through the content spectra, which relies on the signal being stationary [33]. Several efforts have been made to overcome this limitation, such as the novel developments in [34] where non-stationary measurements are used to detect rotor eccentricity, or in [35] where harmonic wavelet transform is applied on transient signals. In [36], an adaptive signal re-sampling algorithm is proposed to use current signals under speed-varying conditions to detect gear related faults. Other factors that may influence the electrically-based analysis are wind turbulence and converter switching of WT DFIGs. A novel electromechanical model is proposed in [37] to analyse how these may mask mechanical defects.
The vast majority of the publications in the field of current-based condition monitoring for gearboxes and generators have been implemented on laboratory test rigs or using computer-simulations only, with known and/or artificially induced faults in controlled environments. In fact, only one work published by [27] and another by the authors of the present paper [38] have been performed on in-service WT DFIGs. This highlights the lack of historical electrical signals to be able to compare healthy and faulty states for actual operating induction generators and, hence, the need for further research in this field. Furthermore, the information provided by different types of sensors—such as current and vibrations—can provide useful insight into the detection of incipient faults and provide a greater certainty for maintenance decisions. This information fusion has yet to be explored and is discussed in the present paper.

3. Methods

Both current signature and vibration analyses are used to perform this experimental study. The stator currents are processed and the spectral components are identified using the formulae presented in Section 3.1. The vibrations gathered in the generator and gearbox drive-end bearings are used for the vibration analysis, Section 3.2.

3.1. Current Signature Analysis

The diagnosis of induction machines through current signature analysis is based on the frequency signature of each type of fault. By analysing the current spectra, several types of faults can be identified and a diagnosis can be achieved. Fault frequency components are machine and grid dependent, and hence they must be recalculated for each rotational speed and loading condition. The formulae used in the present work to calculate the mentioned frequency components are described below.
In the presence of rotor mechanical asymmetries (such as broken rotor bars, defected end rings, etc.), a set of new components at frequencies given by Equation (1) appear in the stator current spectrum [39,40,41]:
f R F S = f s 1 ± 2 κ s ,
where f s is the supply frequency, s is the slip of the machine and κ is the harmonic order of the faulty component ( κ = 1 , 2 , 3 ).
Rotor electrical unbalance can be identified through the fault harmonics given by Equation (2) [42,43,44]:
f F R U = f s κ p ( 1 s ) ± j ,
where p is the number of pole pairs and j is the order of the grid supply induced current harmonic component [45].
However, since a minimal degree of asymmetry always exists in an induction machine, the presence of the first pair of f R F S and/or f F R U is not sufficient to diagnose such fault(s). It is the increment in the visible number of these faults’ harmonics ( κ > 1 ) that will determine the presence of such fault(s).
There are other fault types, such as gearbox-related faults, whose frequency components will only be seen in the presence of a fault. Gearbox faults can originate from a gearbox shaft, bearing, gear, pinion, or a combination of these, generating characteristic rotor eccentricity components [46]. For this reason, several frequencies related to a faulty gearbox can appear in the current spectrum. According to [47], frequency components related to damaged teeth, scoring and debris can be calculated by Equation (3):
f G B X = f s 1 ± κ G r p ,
where G r is the gearbox ratio.
Nevertheless, the most common approach for diagnosing a faulty gearbox is to calculate the frequency components that each shaft and gear would produce in the presence of a fault [21,22,26,46,48,49], which is given by Equation (4a) for shaft-related faults and Equation (4b) for gear-mesh-related faults:
f F S h a f t i = f s ± κ f S h a f t i ,
f F M e s h j = f s ± κ f M e s h j ,
where f S h a f t i are the rotating frequencies (in Hz) of each gearbox shaft (denoted with i = 1 , 2 , 3 ), and f M e s h i refer to each gear-mesh frequency (in Hz, denoted with j = 1 , 2 , 3 , , i 1 ). Mesh frequencies, however, are not easily measured due to their weak influence on the current spectra [22]. Previous studies show that a faulty gear may not have an influence on the amplitude of the gear mesh [22].
Furthermore, bearing faults cause mechanical displacement that induces stator currents at frequencies given by [50]:
f b e = | f s ± κ f o , i | ,
where f o , i refers to bearing outer and inner race faults, respectively. In order to calculate f o , i , details about the dimensions of the bearing must be available. However, the following simplifications have been proposed by several authors [51,52], suitable for bearings between eight and twelve balls, which is the case for the WT under analysis:
f o = 0.4 N b f s ( 1 s ) p ,
f i = 0.6 N b f s ( 1 s ) p ,
where N b is the number of bearing balls.

3.2. Vibration Analysis

With regards to vibration analysis of gearboxes, three main components are taken into account: gears, bearings and shafts. Vibration analysis in mainly conducted in the frequency domain.
When gears go in and out of mesh, they create some cyclic vibrations, which occur at the gear-mesh frequency:
f M e s h j = N t e e t h j f S h a f t i ,
where N t e e t h j is the number of teeth of the gears in gear-mesh j and f S h a f t i is the rotational speed of the shaft i.
When a local gear tooth is present, sidebands appear around f M e s h j as a result of modulation, which occurs at spacings of the f S h a f t i [53].
During the spin of a bearing, any irregularity in the surface of the raceway or the rolling elements will excite periodic frequencies. These characteristic bearing fault frequencies are determined according to Equations (8a)–(8d):
f BPFI = f S h a f t i N b 2 1 + B P cos ( θ ) ,
f BPFO = f S h a f t i 1 B P cos ( θ ) ,
f FTF = f S h a f t i 2 1 B P cos ( θ ) ,
f BSF = f S h a f t i P 2 B 1 B P cos ( θ ) 2 ,
where f BPFI and f BPFO are the inner and outer ball passing frequencies, respectively, f FTF is the fundamental train frequency (cage speed) and f BSF is the ball spin frequency (the frequency with which the fault strikes the same race—inner or outer). These frequencies depend on the shaft frequency f S h a f t i and certain parameters regarding the bearing dimensions. These are N b the number of balls, B the ball diameter, P the pitch diameter and θ the contact angle.
It should be taken into account that in reality the above-mentioned frequencies have some slip, due to the variation of the angle θ with the position of each rolling element in the bearing, because the ratio of local radial to axial load changes. This slip is considered to be around 1–2% [32].
Shaft unbalance or misalignment shows up at the rotational speed of the shaft and its harmonics. Phase measurements are commonly used in order to distinguish between various types of misalignment or unbalance. As a rule of thumb, when the vibration amplitude of the second harmonic of the rotational speed is more than 50% of the first harmonic, coupling damage has probably occurred [54]. For pure unbalance, a higher than normal amplitude at the frequency of the rotational speed appears in the frequency domain.

4. Data Base Description of In-Service Wind Turbine

The data used for the present study come from an in-service 1.5 MW WT equipped with a DFIG, operating in an European wind farm. It presented anomalous RMS (root mean square) vibration levels in the drive-end generator bearing. Based on this information only, it was replaced by the wind farm operator. Immediately after replacement, the RMS vibrations decreased. However, only ten days later, the RMS vibrations rose to values similar to those prior to the replacement. Visual inspection of the apparently defective bearing showed no fault in the replaced component, i.e., the generator bearing had been misdiagnosed. In fact, no improvement after bearing replacement compared to before replacement could be observed either in the current or the vibration spectra. The chronological development of these events is presented in Figure 1. The hypothesis that there was a potential defect external to the generator bearing arose, and it was mistaken for a generator bearing fault.
The database provided to analyse this case study contained between 300 and 900 acquisitions per month, with each acquisition comprising six generator current measurements and eight gearbox and generator bearing vibration measurements, from various sensors located in different parts of the WT. The measurements shown in Table 1 are used for the present study. In Figure 2, the location of the current sensors and accelerometers is depicted using the terminology as per Table 1.
These data have been provided by Ingeteam Power Technology S.A. UP Service (Albacete, Spain), a Spanish company specialising in WT power converters, controllers and generators, as well as Condition Monitoring and SCADA Systems. They have equipped 30 GW of wind power worldwide, providing both O&M and installation services.

5. Spectral Analysis through Currents and Vibrations

Unlike previous studies where the fault is known or even artificially induced in laboratory test rigs or through computer simulations, as mentioned in Section 2, in the present work, a generator bearing fault had been misdiagnosed on an in-service WT. Hence, the actual health status of the drive train under study was to be determined. For this purpose, the spectral analysis of both vibration and current signals was performed on a monthly basis from January 2016 to January 2017. The signals used for the present work meet steady-state conditions, and thus the spectral analysis is undertaken accurately (both for currents and vibrations). In this sense, two parameters are used to classify the measurements as stationary for the analysis: a difference lower than 5% in the current’s amplitude and constant speed of the high-speed shaft.
All potential frequency-related faults were calculated in order to identify the peaks found in the spectrum, both for current and vibration signals. Below, a selection of six months (as per Figure 1) with one measurement per month is presented to illustrate the study. The results are shown in two loading conditions for each month, these being nominal load (DFIG operating at super-synchronous speed) and low load (DFIG operating at sub-synchronous speed), referred to here on in as Loading Condition A and Loading Condition B, respectively. Table 2 summarises the main operating conditions for each measurement used for the analysis.

5.1. Current Signature Analysis

Following the methodology described in Section 3.1, a set of potential fault frequencies was calculated for each selected measurement and a peak search was carried out in order to either discriminate or associate such a fault with the DFIG under analysis.

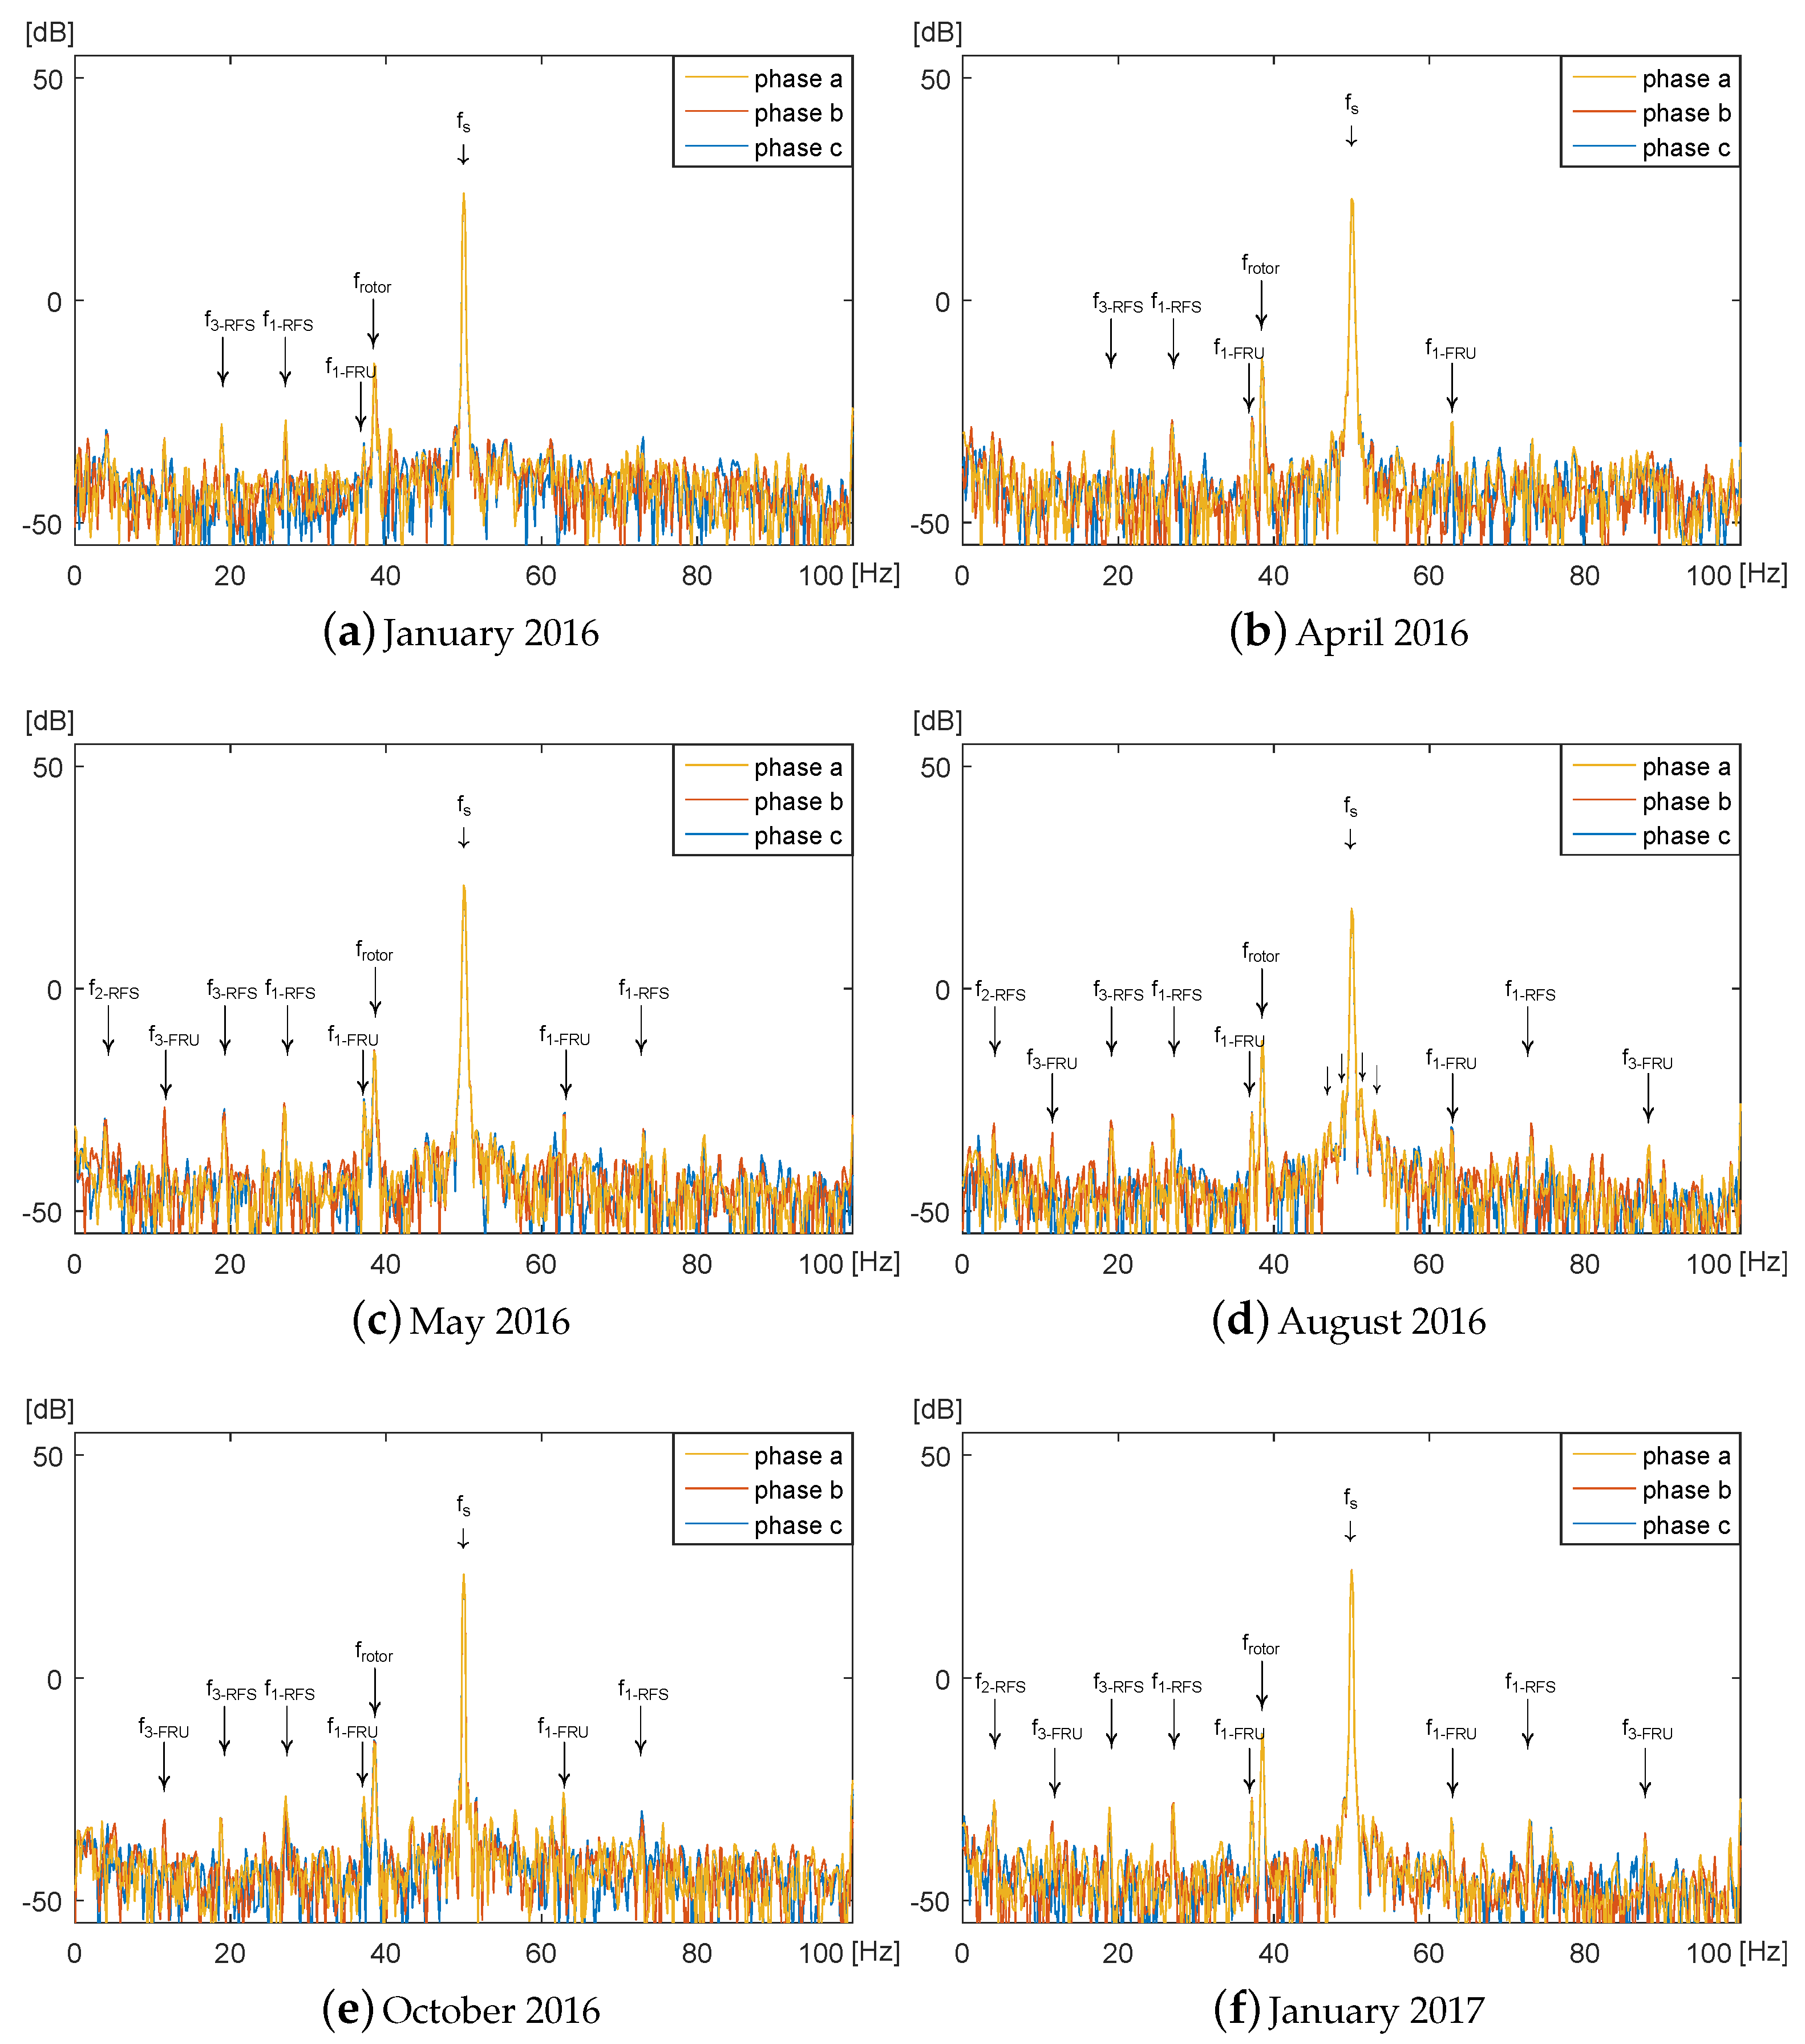
5.1.1. Loading Condition A

In Figure 3, six test cases are shown for nominal load, i.e., super-synchronous speed operation of the DFIG. The harmonics present in the spectra are shown in Table 3 for each type of fault.
The supply frequency ( f s ) corresponds to the highest peak amplitude (at 50 Hz), as expected. Its odd harmonics are also found (150 Hz, 250 Hz, 350 Hz, … although not shown in Figure 3). Another peak naturally present in the spectrum (not a fault indicator) is f r o t o r , which corresponds to the sum of the main frequency of the stator and the main frequency of the rotor. It appears to the right side of the supply frequency under super-synchronous operation (Loading Condition A) and to the left side under sub-synchronous operation (Loading Condition B).
With regards to fault-frequency-related components:
  • No peaks related to gear-shaft or gear-mesh components were found in the current spectra ( f S h a f t i , Equation (4a) and f M e s h j , Equation (4b) respectively), nor bearing-related faults ( f b e , Equation (5)).
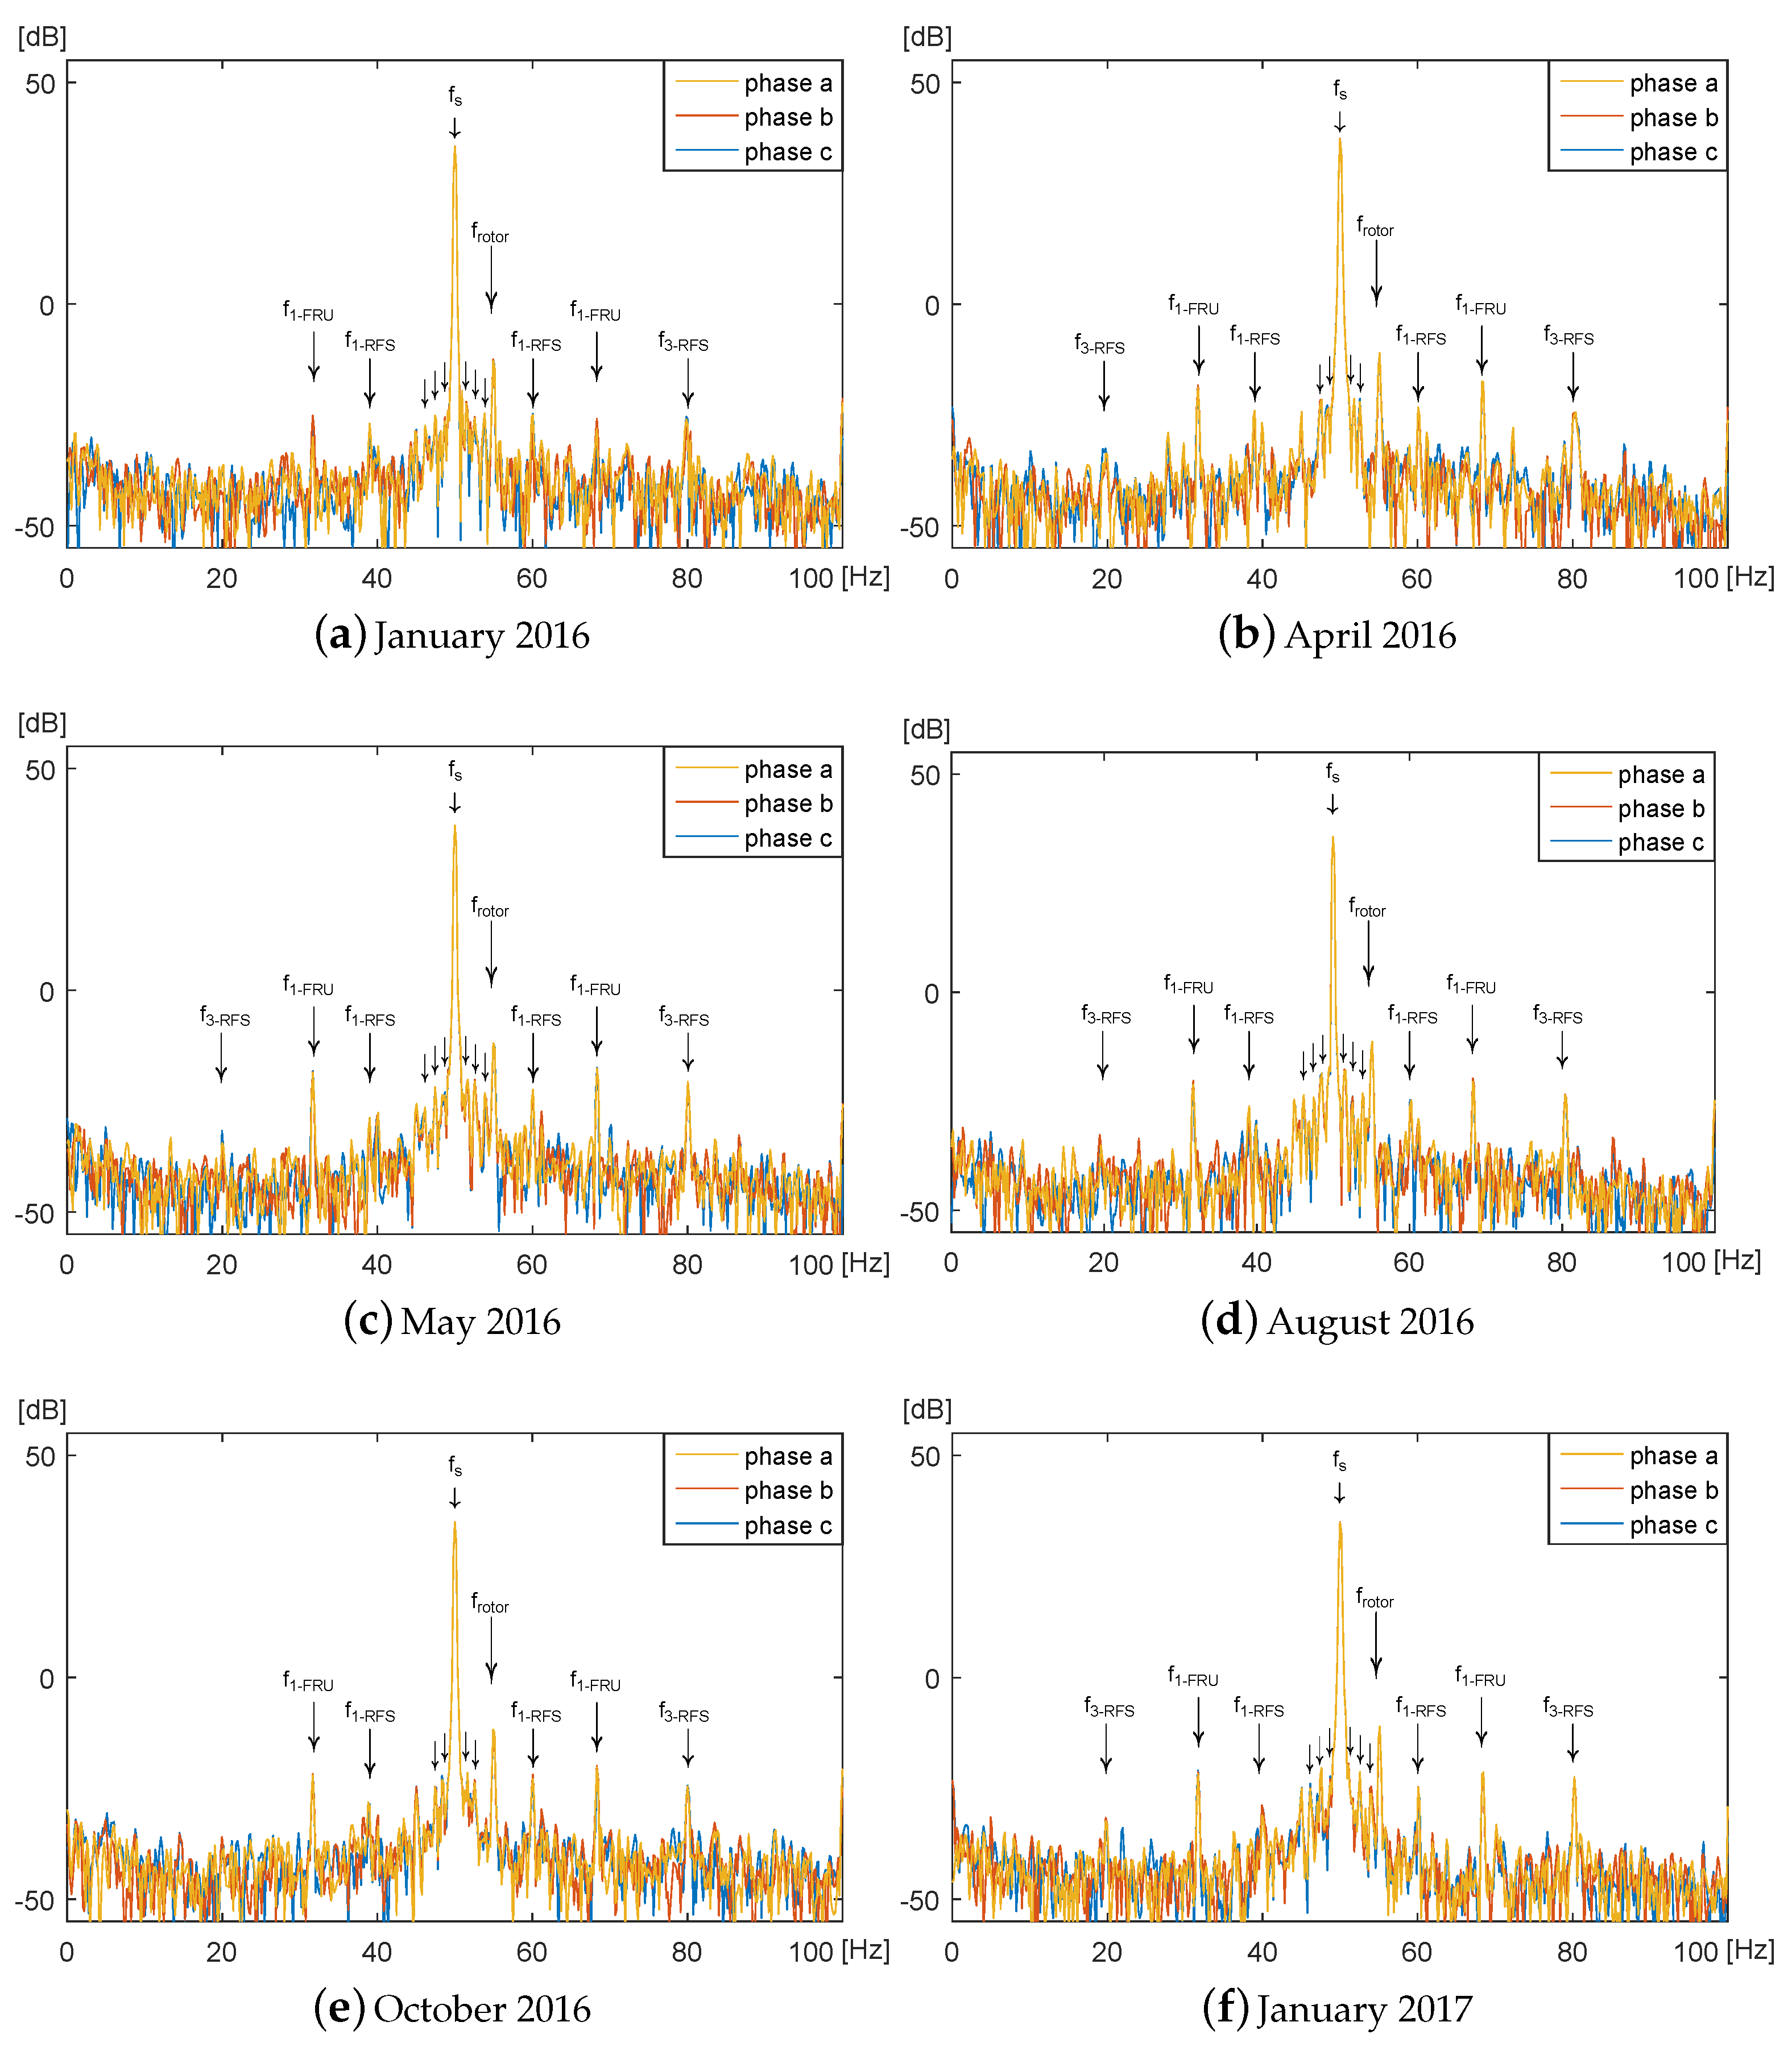
  • Certain harmonics that might be related to damaged teeth, scoring or debris ( f G B X , Equation (3)), appear around the supply frequency. These seem to increase until August 2016, both in number of harmonic pairs found as well as in their amplitude levels, which then improve (the number of harmonic pairs decreases) but not completely in September and October 2016, increasing again up to January 2017. Gearbox lubrication during scheduled maintenance would explain this.
  • With regards to rotor electrical unbalance ( f F R U , Equation (2)), only the first pair can be identified in the spectrum. Since no more harmonics ( k = 2 , 3 , ) can be identified, as previously explained, rotor electrical unbalance cannot be diagnosed.
  • For rotor mechanical asymmetries ( f R F S , Equation (1)) more than one (the first) pair is present in the spectra. In January 2016, apart from the first harmonic pair ( κ = ± 1 ), the right side of the third harmonic pair ( κ = + 3 ) can be seen in the spectra. Later, from April 2016 to August 2016, the full third pair is seen ( κ = ± 1 and κ = ± 3 ). In September and October 2016, again only the right side of the third harmonic pair ( κ = + 3 ) is found besides the first pair ( κ = ± 1 ). Later, in January 2017, again κ = ± 1 and κ = ± 3 harmonics are identified. According to the literature [21,55], the presence of this third harmonic pair confirms rotor unbalance of mechanical nature.
It can be appreciated that the number of f R F S and f G B X peaks evolves in parallel, which might be due to the fact that f R F S peaks appear in the case of mechanical asymmetries and scoring or debris (related to f G B X components), are purely mechanical faults. However, since f s / G r p component in Equation (3) is of the order of 0.25 Hz and the spectrum precision is 0.18 Hz, it is hard to confirm this diagnosis and, hence, the presence of f R F S could arise from mechanical unbalance introduced through the high-speed shaft coupling. Vibration analysis is performed in Section 5.2 to clarify this diagnosis.

5.1.2. Loading Condition B

Figure 4 shows test cases for the six months selected under low loading condition, with the DFIG operating at sub-synchronous speed. Similarly, Table 4 collects the harmonic pairs found in the spectra.
As in the previous case (Section 5.1.1), the supply frequency ( f s ) presents the highest amplitude followed by f r o t o r , now located to its left as previously explained. Once again, no f S h a f t i , f M e s h j or f b e components are observed. For the rest of the fault-related frequency components, different harmonics are found compared to the previous WT loading condition:
  • Around the supply frequency, only two harmonic pairs are found for f G B X in August 2016. This month is therefore the most affected according to both loading conditions.
  • The presence of rotor electrical unbalance components ( f F R U ) is also different. In this case, more than the first pair is seen from May 2016 onwards. However, this further pair ( κ = ± 3 , or the left side of this pair in some cases) does not appear in each of the three current phases, being present in only one or two of them. This is explained by the fact that mechanical unbalances induce differences in the magnetic field, and hence also in the electrical currents through each phase, but not evenly, with these being more evident at lower loads [22,46]. Therefore, rotor electrical unbalance cannot be determined.
  • With regards to rotor mechanical asymmetries ( f R F S ), although the pairs found, apart from the first one ( κ = ± 1 ), differ from those found at full load, their evolution is alike: they seem to evolve until August 2016, then improve (less harmonic pairs found) immediately afterwards, and then worsen (again more harmonics) until January 2017.

5.2. Vibration Analysis

Vibration analysis is performed at several moments in time for the two loading conditions. The analysis is performed in the frequency domain, using Fast Fourier Transforms (FFT) or envelope analysis for bearings. The vibration signals provided have a fixed number of data points so they are available in either high sampling frequency and low period of data acquisition or vice versa. For the FFT, the combination of a sampling frequency at 1500 Hz and time window at 5.4 s is chosen. For the envelope spectra, the highest sampling frequency provided at 48 kHz is chosen because bearings are expected to excite resonances at high frequency bands. The 1500 Hz would not be sufficient and would not provide useful results for bearing envelope analysis, since, at these frequencies, the influence of gears would still be present. However, the time window is less than 1 s, which makes diagnosis—especially at low speed stages—highly challenging. Both axial and radial sensors are available in various gearbox stages, as shown in Figure 2. All sensors in proximity to the components and potential sources of fault are analysed and a selection of explanatory graphs are provided in the following paragraphs. The signals are examined for potential gear, bearing or shaft related faults for two loading conditions.

5.2.1. Loading Condition A

The gear-mesh frequencies ( f M e s h j ) corresponding to the intermediate and high speed parallel stages are shown in Figure 5, for different time periods. No indications of sideband modulation are shown around the centre mesh frequencies, as discussed further in Section 3.2. This confirms the current signature analysis of no gear-related fault.
Bearings are usually more challenging to diagnose than gears because their signals are stochastic and because their signatures are often masked by other components in the gearbox. The generator bearing was replaced because there were high RMS values noticed in the drive-end of the generator bearing. The validation of the bearing replacement showed that the bearing did not actually have a fault. This coincides with the envelope analysis shown in Figure 6, where no bearing fault frequencies can be distinguished. Nevertheless, it should be taken into account that the resonances excited by bearings are usually located at high frequency bands and that is where the envelope analysis helps in band-pass filtering and amplitude demodulating the signal to reveal fault frequencies. The resolution in low frequencies is quite poor, since the signal is sampled at high frequency for a short period of time. In addition, there are no acceleration sensors in the parallel stages of the gearbox, as shown in Figure 2, which makes it even harder to diagnose incipient bearing faults.
Shaft unbalance or misalignment shows up at the rotational speed of the shaft and its harmonics. Phase measurements are usually used in order to distinguish between various types of misalignment or unbalance. As explained in Section 3.2, the vibration amplitude of the second harmonic of the rotational speed must be higher than 50% of the first harmonic in order to diagnose coupling damage.
For pure unbalance, a higher than normal amplitude at the frequency of the rotational speed appears in the frequency domain.
The high-speed shaft frequency harmonics can be observed in the radial direction in Figure 7. Some of these present an amplitude higher than 50% of the first harmonic. This could be an indication that there is a some parallel shaft misalignment that can be attributed to the coupling on the high speed shaft (Figure 2).

5.2.2. Loading Condition B

The same graphs on Loading Condition B are shown in Figure 8, Figure 9 and Figure 10. As expected, the vibration amplitudes are lower.
According to the vibration analysis of both loading conditions, the state of the gears seems healthy, since all gear mesh frequencies and their harmonics seem clear of sidebands. As far as the input and output gearbox bearings are concerned, no faults seem to be present in the spectra. There is potentially some parallel shaft misalignment that might be due to the coupling on the high speed shaft, which can be diagnosed due to high amplitudes of the harmonics of the shaft frequency on the radial direction. Alignment of flexible couplings does not always have defined standards within companies and relies on technician’s expertise. Even if a realignment occurred with the replacement of the bearing, it is possible that the coupling is still not properly aligned.

5.3. Results and Discussion

The spectral analysis of the stator currents indicated rotor asymmetry of a mechanical nature (not electrical). Frequency components related to gearbox damage were studied, however, the small order of the calculated components (0.25 Hz) and the accuracy of the available data (0.18 Hz) around the supply frequency makes it challenging to confirm gearbox damage, and no gear-mesh- or gear-shaft-related frequencies appear. Furthermore, the gearbox vibration analysis is consistent with this diagnosis. Another source of mechanical rotor asymmetry found in the current spectra might arise from the high-speed shaft (coupling misalignment or unbalance). Vibration analysis further confirmed this hypothesis due to high observed harmonics of the high-speed shaft rotational speed. No faulty bearing-related components have been found before (or after) bearing replacement in either the current or vibration spectra. The replacement of the misdiagnosed bearing and the fact that the suspected underlying coupling misalignment existed before and after the replacement make it more challenging to establish a healthy baseline.

6. Conclusions

The state-of-the-art on condition monitoring on WT drive trains is presented in this work, with a focus on current signature and vibration analyses, motivated by the increasing need to reduce O&M costs in the Wind Energy sector.
Very rarely has WT analysis on in-field operating machines been presented in the literature, and, to the best of the authors’ knowledge, no studies include both current signature and vibration analyses. Furthermore, it is usually the case that the faults are known and/or artificially introduced by the authors on test benches or through computer simulations. In most of the cases, both the fault-free and faulty conditions are available and hence the diagnosis is achieved by comparison. Taking into account the lack of public field-data in the wind energy sector, being able to obtain a diagnosis in the absence of historic data is of great interest.
In the present paper, current signature and vibration analyses are implemented to diagnose an in-service WT drive train that was previously misdiagnosed with a generator bearing fault. All potential fault-related frequency components described in Section 3.1 and Section 3.2 were calculated in order to identify the peaks found on both the current and vibration spectra, respectively. The presence of frequency components related to mechanical asymmetries in the current spectra points towards unbalance of the high-speed shaft, which is confirmed by the vibration analysis, with a probable origin in the coupling of the high-speed shaft. Such fault-related frequency components evolve smoothly over months and are detected early enough to allow for predictive maintenance actions to be implemented, which is the ultimate goal of condition monitoring.
Future work will include analysis of further case studies and comparison of current and vibration signals. A framework for information fusion of these two different sensors will be created, which will enhance the condition monitoring actions of operating WTs.

Acknowledgments

This project has received funding from the European Union Horizon 2020 research and innovation programme under the Marie Sklodowska-Curie grant agreement No. 642108, AWESOME Project. Special acknowledgement goes to Vicente Requena Montejano from Ingeteam Power Technology S.A. UP Service (part of the AWESOME Project Consortium providing the wind turbine data).

Author Contributions

Estefania Artigao and Sofia Koukoura conceived this paper, prepared the manuscript and analysed the results, current signature and vibrations respectively. Andrés Honrubia-Escibano contributed with the electrical analysis of the DFIG and James Carroll and Alasdair McDonald contributed with the vibration analysis of the drive train. Emilio Gómez-Lázaro supervised the research.

Conflicts of Interest

The authors declare no conflict of interest.

Abbreviations

θ Bearing ball contact angle
BBearing ball diameter
f b e Bearing fault frequency
f B P F O Outer-ball passing frequency
f B S F Bearing ball spin frequency
f F M e s h j Gearbox mesh j fault frequency
f F R U Rotor electrical unbalance fault frequency
f F S h a f t i Gearbox shaft i fault frequency
f F T F Fundamental train frequency
f G B X Gearbox fault frequency
f i Bearing inner-race fault frequency
f M e s h j Gearbox mesh j rotating frequency
f o Bearing outer-race fault frequency
f R F S Rotor mechanical asymmetry fault frequency
f S h a f t i Gearbox shaft i rotating frequency
f s Supply frequency
G r Gearbox ratio
N B P F I Inner-ball passing frequency
N b Number of bearing balls
N t e e t h j Number of teeth in mesh j
PBearing ball pitch diameter
pNumber of pole pairs
sSlip

References

  1. Honrubia-Escribano, A.; Gomez-Lazaro, E.; Fortmann, J.; Sorensen, P.; Martin-Martinez, S. Generic dynamic wind turbine models for power system stability analysis: A comprehensive review. Renew. Sustain. Energy Rev. 2017, 81, 1939–1952. [Google Scholar] [CrossRef]
  2. Tchakoua, P.; Wamkeue, R.; Ouhrouche, M.; Slaoui-Hasnaoui, F.; Tameghe, T.A.; Ekemb, G. Wind turbine condition monitoring: State-of-the-art review, new trends, and future challenges. Energies 2014, 7, 2595–2630. [Google Scholar] [CrossRef]
  3. Sinha, Y.; Steel, J. A progressive study into offshore wind farm maintenance optimisation using risk based failure analysis. Renew. Sustain. Energy Rev. 2015, 42, 735–742. [Google Scholar] [CrossRef]
  4. Kabir, M.J.; Oo, A.M.; Rabbani, N. A brief review on offshore wind turbine fault detection and recent development in condition monitoring based maintenance system. In Proceedings of the IEEE Power Engineering Conference AUPEC, Wollongong, Australia, 27–30 September 2015; pp. 1–7. [Google Scholar]
  5. Pérez, J.M.P.; Márquez, F.P.G.; Tobias, A.; Papaelias, M. Wind turbine reliability analysis. Renew. Sustain. Energy Rev. 2013, 23, 463–472. [Google Scholar] [CrossRef]
  6. Márquez, F.P.G.; Tobias, A.M.; Pérez, J.M.P.; Papaelias, M. Condition monitoring of wind turbines: Techniques and methods. Renew. Energy 2012, 46, 169–178. [Google Scholar] [CrossRef]
  7. Jardine, A.K.S.; Lin, D.; Banjevic, D. A review on machinery diagnostics and prognostics implementing condition-based maintenance. Mech. Syst. Signal Process. 2006, 20, 1483–1510. [Google Scholar] [CrossRef]
  8. Warner, E. Global Wind Report. Annual Market Update; Technical Report; Global Wind Energy Council: Brussels, Belgium, 2015. [Google Scholar]
  9. Pozo, F.; Vidal, Y. Wind turbine fault detection through principal component analysis and statistical hypothesis testing. Energies 2016, 9, 3. [Google Scholar] [CrossRef] [Green Version]
  10. Pozo, F.; Vidal, Y.; Serrahima, J.M. On real-time fault detection in wind turbines: Sensor selection algorithm and detection time reduction analysis. Energies 2016, 9, 520. [Google Scholar] [CrossRef]
  11. Zhang, W.; Ma, X. Simultaneous fault detection and sensor selection for condition monitoring of wind turbines. Energies 2016, 9, 280. [Google Scholar] [CrossRef] [Green Version]
  12. Rubert, T.; McMillan, D.; Niewczas, P. A decision support tool to assist with lifetime extension of wind turbines. Renew. Energy 2017, 120, 423–433. [Google Scholar] [CrossRef]
  13. Ziegler, L.; Gonzalez, E.; Rubert, T.; Smolka, U.; Melero, J.J. Lifetime extension of onshore wind turbines: A review covering Germany, Spain, Denmark, and the UK. Renew. Sustain. Energy Rev. 2017, 82, 1261–1271. [Google Scholar] [CrossRef]
  14. Tautz-Weinert, J.; Watson, S.J. Using SCADA data for wind turbine condition monitoring—A review. IET Renew. Power Gener. 2016, 11, 382–394. [Google Scholar] [CrossRef]
  15. Pozo, F.; Vidal, Y.; Salgado, O. Wind Turbine Condition Monitoring Strategy through Multiway PCA and Multivariate Inference. Energies 2018, 11, 749. [Google Scholar] [CrossRef]
  16. Pei, Y.; Qian, Z.; Jing, B.; Kang, D.; Zhang, L. Data-Driven Method for Wind Turbine Yaw Angle Sensor Zero-Point Shifting Fault Detection. Energies 2018, 11, 553. [Google Scholar] [CrossRef]
  17. Carroll, J.; McDonald, A.; McMillan, D. Failure rate, repair time and unscheduled O&M cost analysis of offshore wind turbines. Wind Energy 2015, 19, 1107–1119. [Google Scholar] [Green Version]
  18. Márquez, F.P.G.; Pérez, J.M.P.; Marugán, A.P.; Papaelias, M. Identification of critical components of wind turbines using FTA over the time. Renew. Energy 2016, 87, 869–883. [Google Scholar] [CrossRef]
  19. Kia, S.H.; Henao, H.; Capolino, G.A. Survey of real-time fault diagnosis techniques for electromechanical systems. In Proceedings of the IEEE Workshop on Electrical Machines Design, Control and Diagnosis (WEMDCD), Nottingham, UK, 20–21 April 2017; pp. 290–297. [Google Scholar]
  20. Romero-Troncoso, R.J.; Saucedo-Gallaga, R.; Cabal-Yepez, E.; Garcia-Perez, A.; Osornio-Rios, R.A.; Alvarez-Salas, R.; Miranda-Vidales, H.; Huber, N. FPGA-based online detection of multiple combined faults in induction motors through information entropy and fuzzy inference. IEEE Trans. Ind. Electron. 2011, 58, 5263–5270. [Google Scholar] [CrossRef]
  21. Cheng, F.; Qu, L.; Qiao, W. Fault Prognosis and Remaining Useful Life Prediction of Wind Turbine Gearboxes Using Current Signal Analysis. IEEE Trans. Sustain. Energy 2017, 9. [Google Scholar] [CrossRef]
  22. Kia, S.H.; Henao, H.; Capolino, G.A. Gear tooth surface damage fault detection using induction machine electrical signature analysis. In Proceedings of the 9th IEEE International Symposium on Diagnostics for Electric Machines, Power Electronics and Drives (SDEMPED), Valencia, Spain, 27–30 August 2013; pp. 358–364. [Google Scholar]
  23. Kia, S.H.; Henao, H.; Capolino, G.A. Fault index statistical study for gear fault detection using stator current space vector analysis. IEEE Trans. Ind. Appl. 2016, 52, 4781–4788. [Google Scholar] [CrossRef]
  24. Choi, S.; Akin, B.; Rahimian, M.M.; Toliyat, H.A. Implementation of a fault-diagnosis algorithm for induction machines based on advanced digital-signal-processing techniques. IEEE Trans. Ind. Electron. 2011, 58, 937–948. [Google Scholar] [CrossRef]
  25. Choi, S.; Akin, B.; Rahimian, M.M.; Toliyat, H.A. Performance-oriented electric motors diagnostics in modern energy conversion systems. IEEE Trans. Ind. Electron. 2012, 59, 1266–1277. [Google Scholar] [CrossRef]
  26. Neti, P.; Zhang, P.; Shah, M.; Younsi, K. Electrical signature analysis based online monitoring of drive-trains for doubly-fed wind generators. In Proceedings of the 38th Annual Conference on IEEE Industrial Electronics Society (IECON), Montreal, QC, Canada, 25–28 October 2012. [Google Scholar]
  27. Zhang, P.; Neti, P. Detection of gearbox bearing defects using electrical signature analysis for Doubly-fed wind generators. In Proceedings of the Energy Conversion Congress and Exposition (ECCE), Denver, CO, USA, 15–19 September 2013; pp. 4438–4444. [Google Scholar]
  28. Sheng, S. Wind Turbine Gearbox Condition Monitoring Round Robin Study-Vibration Analysis; Technical Report; National Renewable Energy Lab. (NREL): Golden, CO, USA, 2012.
  29. Siegel, D.; Zhao, W.; Lapira, E.; AbuAli, M.; Lee, J. A comparative study on vibration-based condition monitoring algorithms for wind turbine drive trains. Wind Energy 2014, 17, 695–714. [Google Scholar] [CrossRef]
  30. Randall, R. Cepstrum analysis and gearbox fault-diagnosis. Maint. Manag. Int. 1982, 3, 183–208. [Google Scholar]
  31. Bechhoefer, E.; Kingsley, M. A review of time synchronous average algorithms. In Proceedings of the Annual Conference of the Prognostics and Health Management Society, San Diego, CA, USA, 27 September 2009; pp. 24–33. [Google Scholar]
  32. Randall, R.B.; Antoni, J. Rolling element bearing diagnostics:a tutorial. Mech. Syst. Signal Process. 2011, 25, 485–520. [Google Scholar] [CrossRef]
  33. Xu, B.; Sun, L.; Xu, L.; Xu, G. Improvement of the Hilbert method via ESPRIT for detecting rotor fault in induction motors at low slip. IEEE Trans. Energy Convers. 2013, 28, 225–233. [Google Scholar] [CrossRef]
  34. Dahiya, R.; Himani. Condition monitoring of wind turbine for rotor fault detection under non stationary conditions. Ain Shams Eng. J. 2017. [Google Scholar] [CrossRef]
  35. Sapena-Baño, A.; Pineda-Sanchez, M.; Puche-Panadero, R.; Martinez-Roman, J.; Matic, D. Fault diagnosis of rotating electrical machines in transient regime using a single stator current’s FFT. IEEE Trans. Instrum. Meas. 2015, 64, 3137–3146. [Google Scholar] [CrossRef]
  36. Lu, D.; Qiao, W.; Gong, X. Current-Based Gear Fault Detection for Wind Turbine Gearboxes. IEEE Trans. Sustain. Energy 2017. [Google Scholar] [CrossRef]
  37. Shahriar, M.R.; Borghesani, P.; Ledwich, G.; Tan, A.C. Performance analysis of electrical signature analysis-based diagnostics using an electromechanical model of wind turbine. Renew. Energy 2018, 116, 15–41. [Google Scholar] [CrossRef]
  38. Artigao, E.; Honrubia-Escribano, A.; Gomez-Lazaro, E. Current signature analysis to monitor DFIG wind turbine generators: A case study. Renew. Energy 2018, 116, 5–14. [Google Scholar] [CrossRef]
  39. Gritli, Y.; Stefani, A.; Rossi, C.; Filippetti, F.; Chatti, A. Experimental validation of doubly fed induction machine electrical faults diagnosis under time-varying conditions. Elect. Power Syst. Res. 2011, 81, 751–766. [Google Scholar] [CrossRef]
  40. Gritli, Y.; Zarri, L.; Rossi, C.; Filippetti, F.; Capolino, G.A.; Casadei, D. Advanced diagnosis of electrical faults in wound-rotor induction machines. IEEE Trans. Ind. Electron. 2013, 60, 4012–4024. [Google Scholar] [CrossRef]
  41. Bellini, A.; Filippetti, F.; Tassoni, C.; Capolino, G.A. Advances in diagnostic techniques for induction machines. IEEE Trans. Ind. Electron. 2008, 12, 4109–4126. [Google Scholar] [CrossRef]
  42. Williamson, S.; Djurovic, S. Origins of Stator Current Spectra in DFIGs with Winding Faults and Excitation Asymmetries. In Proceedings of the IEEE International Electric Machines and Drives Conference, IEMDC’09, Miami, FL, USA, 3–6 May 2009; Volume 9, pp. 563–570. [Google Scholar]
  43. Crabtree, C.J.; Djurovic, S.; Tavner, P.J.; Smith, A. Condition monitoring of a wind turbine DFIG by current or power analysis. In Proceedings of the 5th IET International Conference on Power Electronics, Machines and Drives (PEMD), Brighton, UK, 19–21 April 2010; pp. 1–6. [Google Scholar]
  44. Crabtree, C.; Djurovic, S.; Tavner, P.; Smith, A. Fault frequency tracking during transient operation of wind turbine generators. In Proceedings of the 2010 XIX International Conference on IEEE Electrical Machines (ICEM), Rome, Italy, 6–8 September 2010; pp. 1–5. [Google Scholar]
  45. Djurovic, S.; Crabtree, C.J.; Tavner, P.J.; Smith, A. Condition monitoring of wind turbine induction generators with rotor electrical asymmetry. IET Renew. Power Gener. 2012, 6, 207–216. [Google Scholar] [CrossRef]
  46. Mohanty, A.; Kar, C. Fault detection in a multistage gearbox by demodulation of motor current waveform. IEEE Trans. Ind. Electron. 2006, 53, 1285–1297. [Google Scholar] [CrossRef]
  47. Rajagopalan, S.; Habetler, T.G.; Harley, R.G.; Sebastian, T.; Lequesne, B. Current/voltage-based detection of faults in gears coupled to electric motors. IEEE Trans. Ind. Appl. 2006, 42, 1412–1420. [Google Scholar] [CrossRef]
  48. Kia, S.H.; Henao, H.; Capolino, G.A. Gearbox monitoring using induction machine stator current analysis. In Proceedings of the IEEE International Symposium on Diagnostics for Electric Machines, Power Electronics and Drives (SDEMPED), Cracow, Poland, 6–8 September 2007; pp. 149–154. [Google Scholar]
  49. Kar, C.; Mohanty, A.R. Monitoring gear vibrations through motor current signature analysis and wavelet transform. Mech. Syst. Signal Process. 2006, 20, 158–187. [Google Scholar] [CrossRef]
  50. Benbouzid, M.E.H. A review of induction motors signature analysis as a medium for faults detection. IEEE Trans. Ind. Electron. 2000, 47, 984–993. [Google Scholar] [CrossRef]
  51. Benbouzid, M.E.H.; Kliman, G.B. What stator current processing-based technique to use for induction motor rotor faults diagnosis? IEEE Trans. Energy Convers. 2003, 18, 238–244. [Google Scholar] [CrossRef]
  52. Thomson, W.T.; Fenger, M. Current signature analysis to detect induction motor faults. IEEE Ind. Appl. Mag. 2001, 7, 26–34. [Google Scholar] [CrossRef]
  53. McFadden, P. Detecting fatigue cracks in gears by amplitude and phase demodulation of the meshing vibration. J. Vib. Acoust. Stress Reliab. Des. 1986, 108, 165–170. [Google Scholar] [CrossRef]
  54. Sudhakar, G.; Sekhar, A. Coupling misalignment in rotating machines: modelling, effects and monitoring. Noise Vib. Worldw. 2009, 40, 17–39. [Google Scholar] [CrossRef]
  55. Casadei, D.; Filippetti, F.; Rossi, C.; Stefani, A.; Yazidi, A.; Capolino, G.A. Diagnostic Technique based on Rotor Modulating Signals Signature Analysis for Doubly Fed Induction Machines in Wind Generator Systems. IEEE Ind. Appl. 2006, 44, 1525–1532. [Google Scholar]
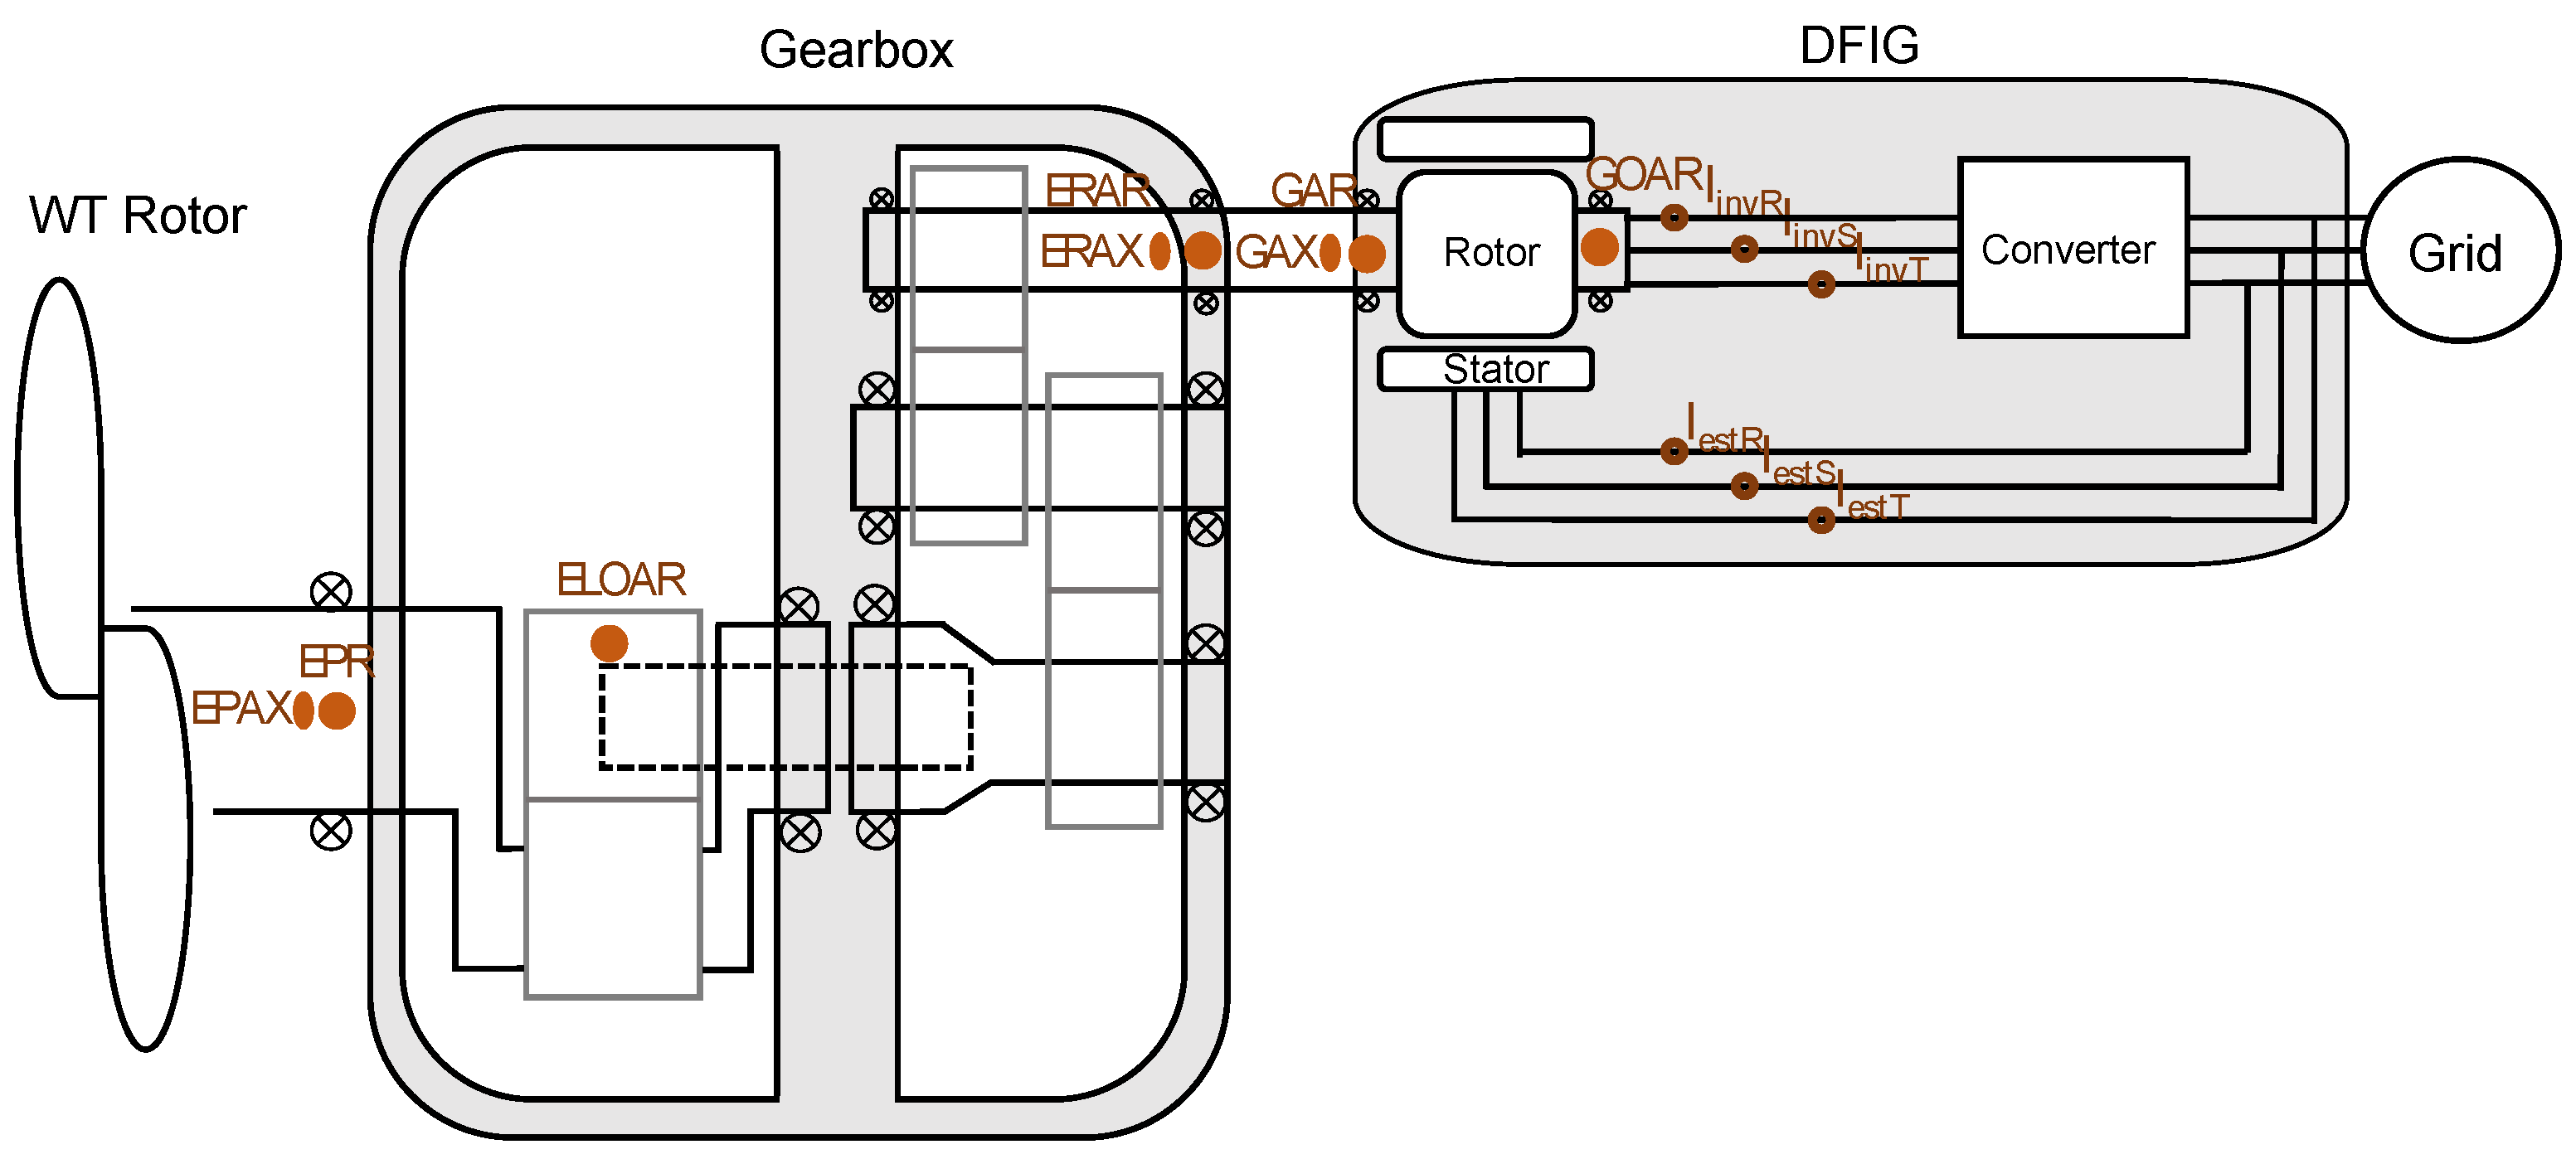
Figure 1. Chronological diagram of the case study.
Energies 11 00960 g001
Figure 2. Location of sensors on in-service wind turbine drive trains.
Energies 11 00960 g002
Figure 3. January 2016–January 2017. Evolution of current spectra at super-synchronous speed.
Energies 11 00960 g003
Figure 4. January 2016–January 2017. Evolution of current spectra at sub-synchronous speed.
Energies 11 00960 g004
Figure 5. January 2016–January 2017. Evolution of gear-mesh frequencies at super-synchronous speed.
Energies 11 00960 g005
Figure 6. January 2016–January 2017. Evolution of envelope spectra at super-synchronous speed.
Energies 11 00960 g006
Figure 7. January 2016–January 2017. Evolution of shaft-frequencies at super-synchronous speed.
Energies 11 00960 g007
Figure 8. January 2016–January 2017. Evolution of gear-mesh frequencies at sub-synchronous speed.
Energies 11 00960 g008
Figure 9. January 2016–January 2017. Evolution of envelope spectra at sub-synchronous speed.
Energies 11 00960 g009
Figure 10. January 2016–January 2017. Evolution of shaft-frequencies at sub-synchronous speed.
Energies 11 00960 g010
Table 1. Measurements used for the analysis.
LabelSensor LocationSensor TypeSampling Parameters
ELOARgearbox planetary stage radial
EPAXmain shaft axialAccelerometers
EPRmain shaft radialIEPE1.5 kHz
ERARgearbox high speed shaft drive end radial 5.4 s
ERAXgearbox high speed shaft non drive end axial±50 g
GARgenerator drive end radial0.5 Hz–10 kHz48 kHz
GAXgenerator drive end axial 0.17 s
GOARgenerator non drive end radial
IestRstator current phase aCurrent
IestSstator current phase bTransducers
IestTstator current phase c 1.5 kHz
IinvRrotor-side converter current phase aHOP 2000-SB/SP15.4 s
IinvSrotor-side converter current phase b±3000 A
IinvTrotor-side converter current phase c
Table 2. WT operating conditions for each measurement of the spectral analysis.
Loading Condition A
January 2016April 2016May 2016August 2016October 2016January 2017
Power (kW)106113261300106610121046
Speed shaft (rpm)109811021098110210981098
Slip 10 % 10 % 10 % 10 % 10 % 10 %
Loading Condition B
January 2016April 2016May 2016August 2016October 2016January 2017
Power (kW)280278276148259294
Speed shaft (rpm)769769769769769769
Slip 23 % 23 % 23 % 23 % 23 % 23 %
Table 3. Fault-related frequency harmonics found on the current spectra from January 2016 to January 2017 with DFIG at super-synchronous speed.
MonthJanuary 2016April 2016May 2016August 2016October 2016January 17
f G B X ± 4 , ± 6 , ± 10 ± 7 , ± 10 ± 4 , ± 6 , ± 10 ± 4 , ± 6 , ± 10 , ± 12 ± 6 , ± 10 ± 6 , ± 10 , ± 12
f R F S ± 1 , + 3 ± 1 , ± 3 ± 1 , ± 3 ± 1 , ± 3 ± 1 , + 3 ± 1 , ± 3
f F R U ± 1 ± 1 ± 1 ± 1 ± 1 ± 1
Table 4. Fault-related frequency harmonics found on the current spectra from January 2016 to January 2017 with DFIG at sub-synchronous speed.
MonthJanuary 2016April 2016May 2016August 2016October 2016January 2017
f G B X --- ± 6 , ± 10 --
f R F S 1 , 3 1 , 3 ± 1 , 2 , 3 ± 1 , 2 , 3 ± 1 , 3 ± 1 , 2 , 3
f F R U 1 ± 1 ± 1 , 3 ± 1 , ± 3 ± 1 , 3 ± 1 , ± 3

