X-Pinch Plasma Generation Testing for Neutron Source Development and Nuclear Fusion

 ,
,  ,
,
Abstract
:1. Introduction
2. Engineering Design and Theory
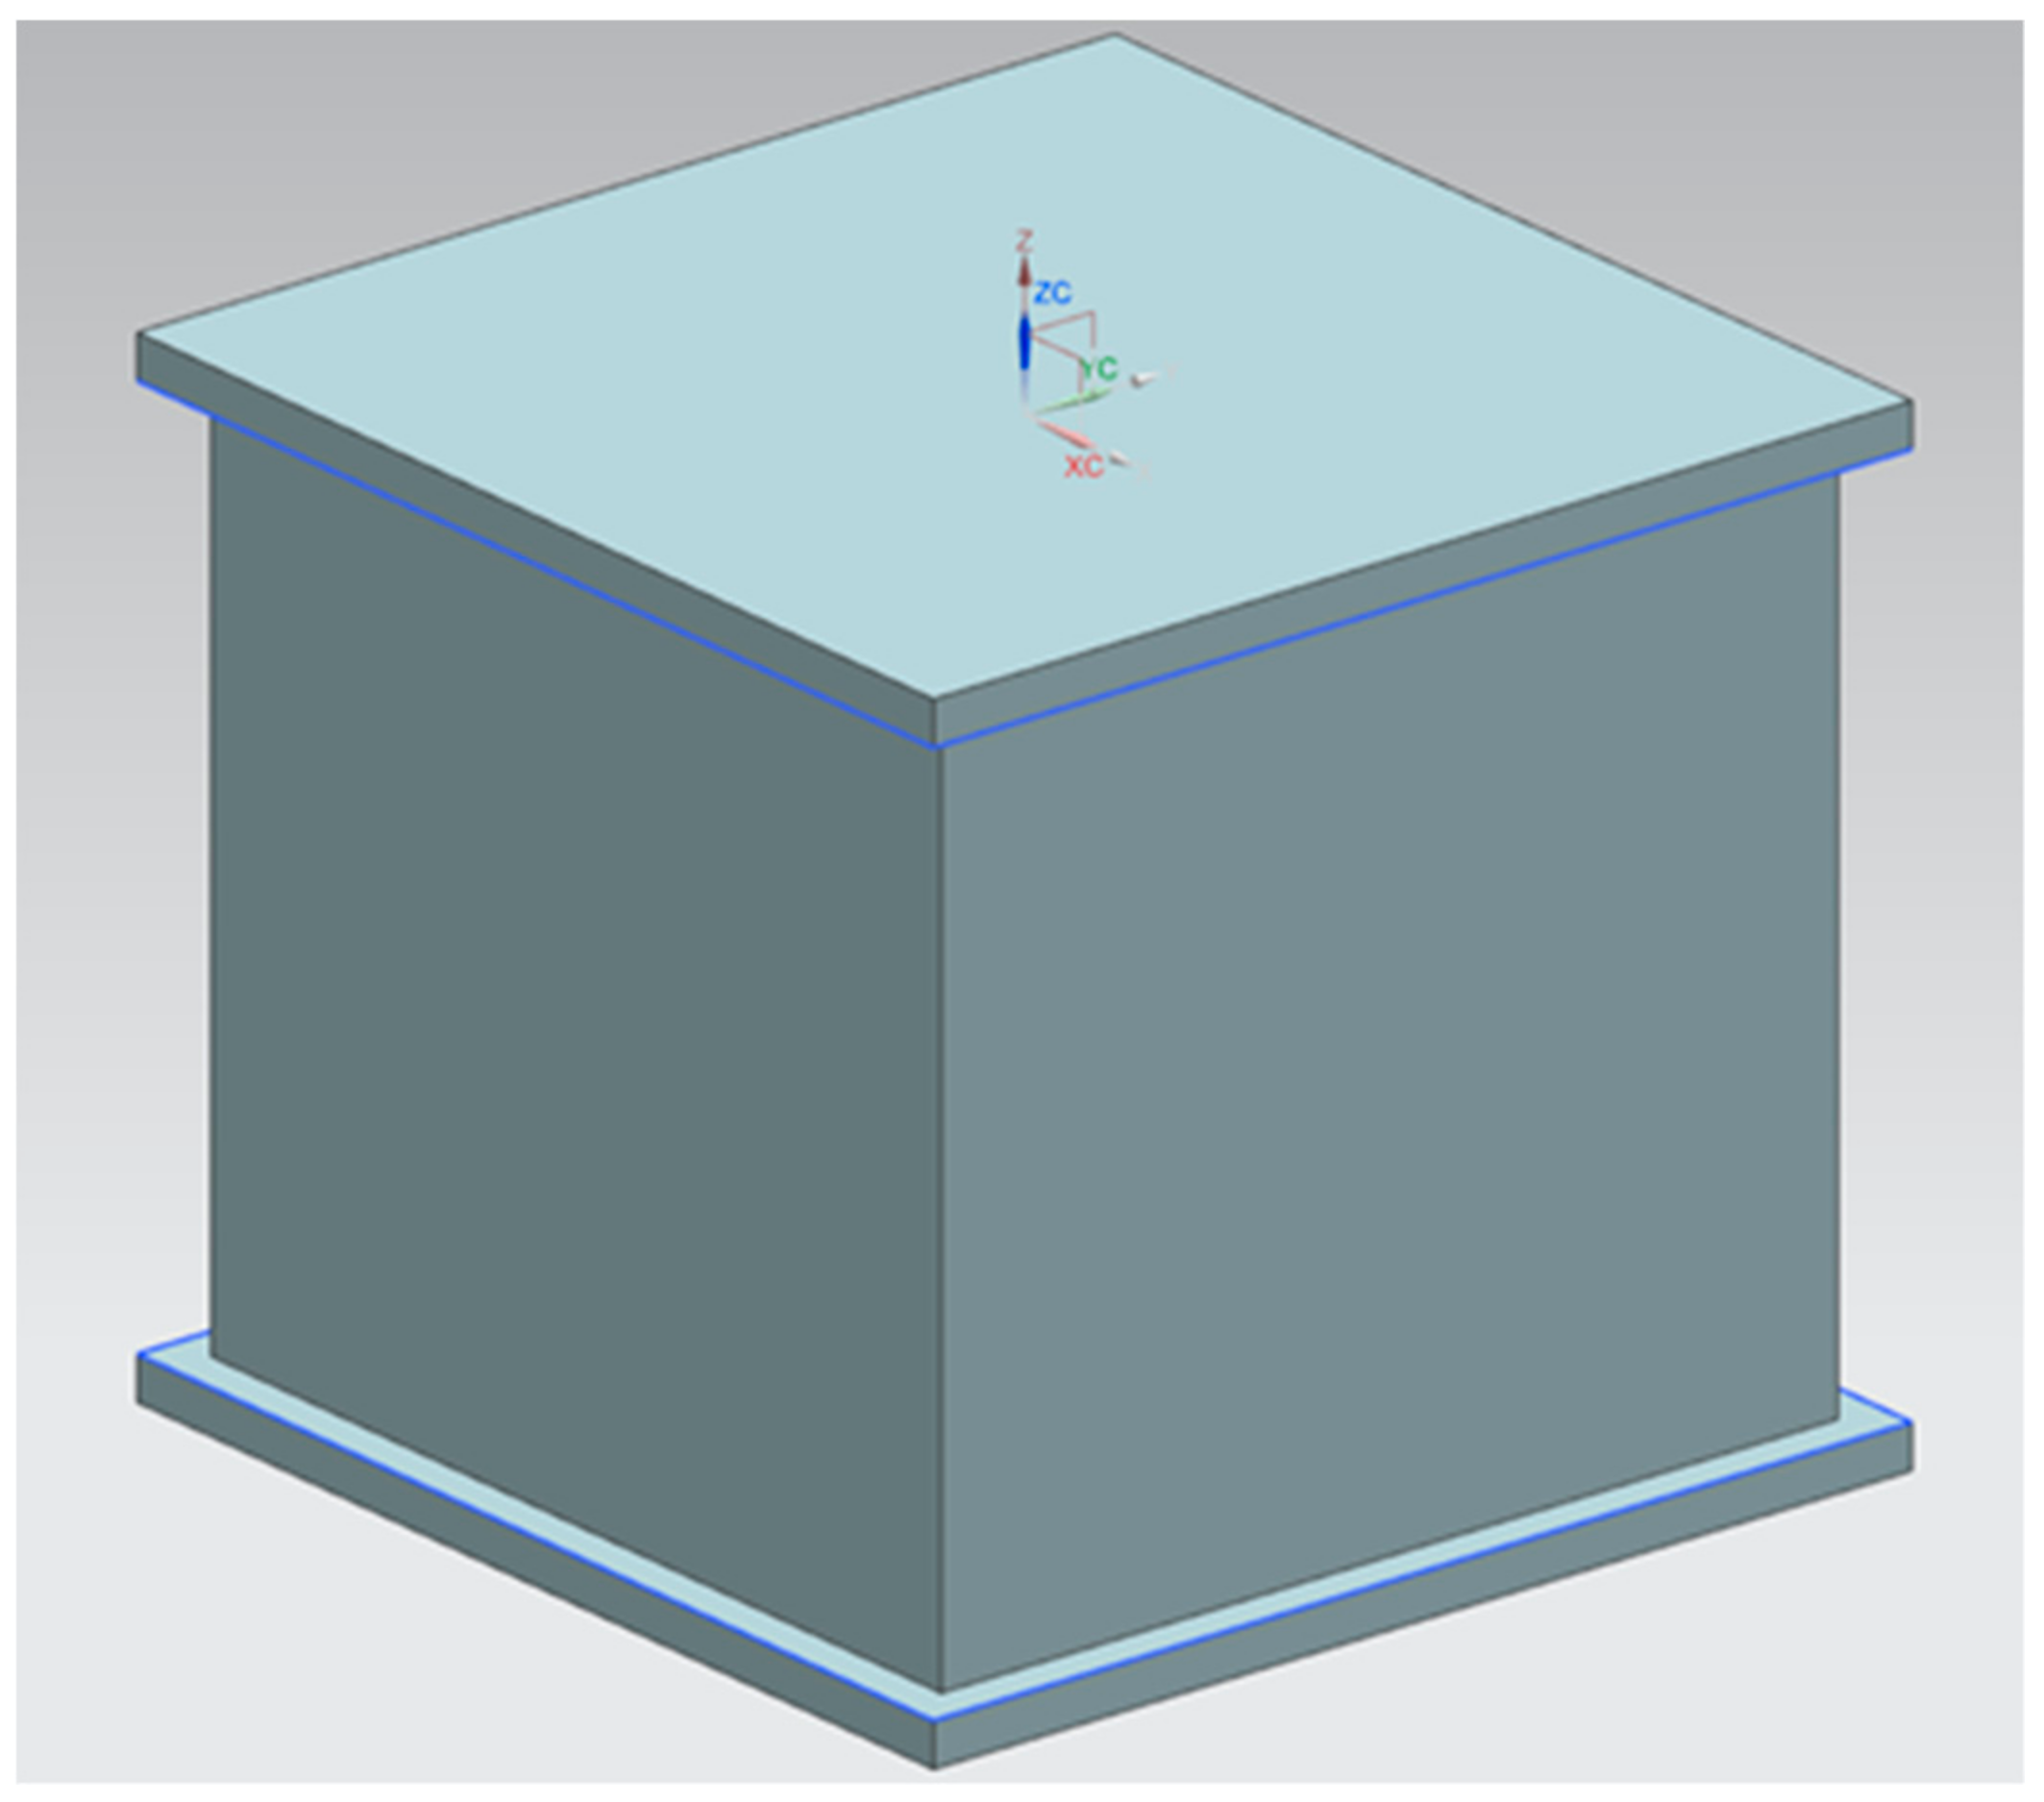
2.1. Chamber
2.1.1. Geometry and Dimensions
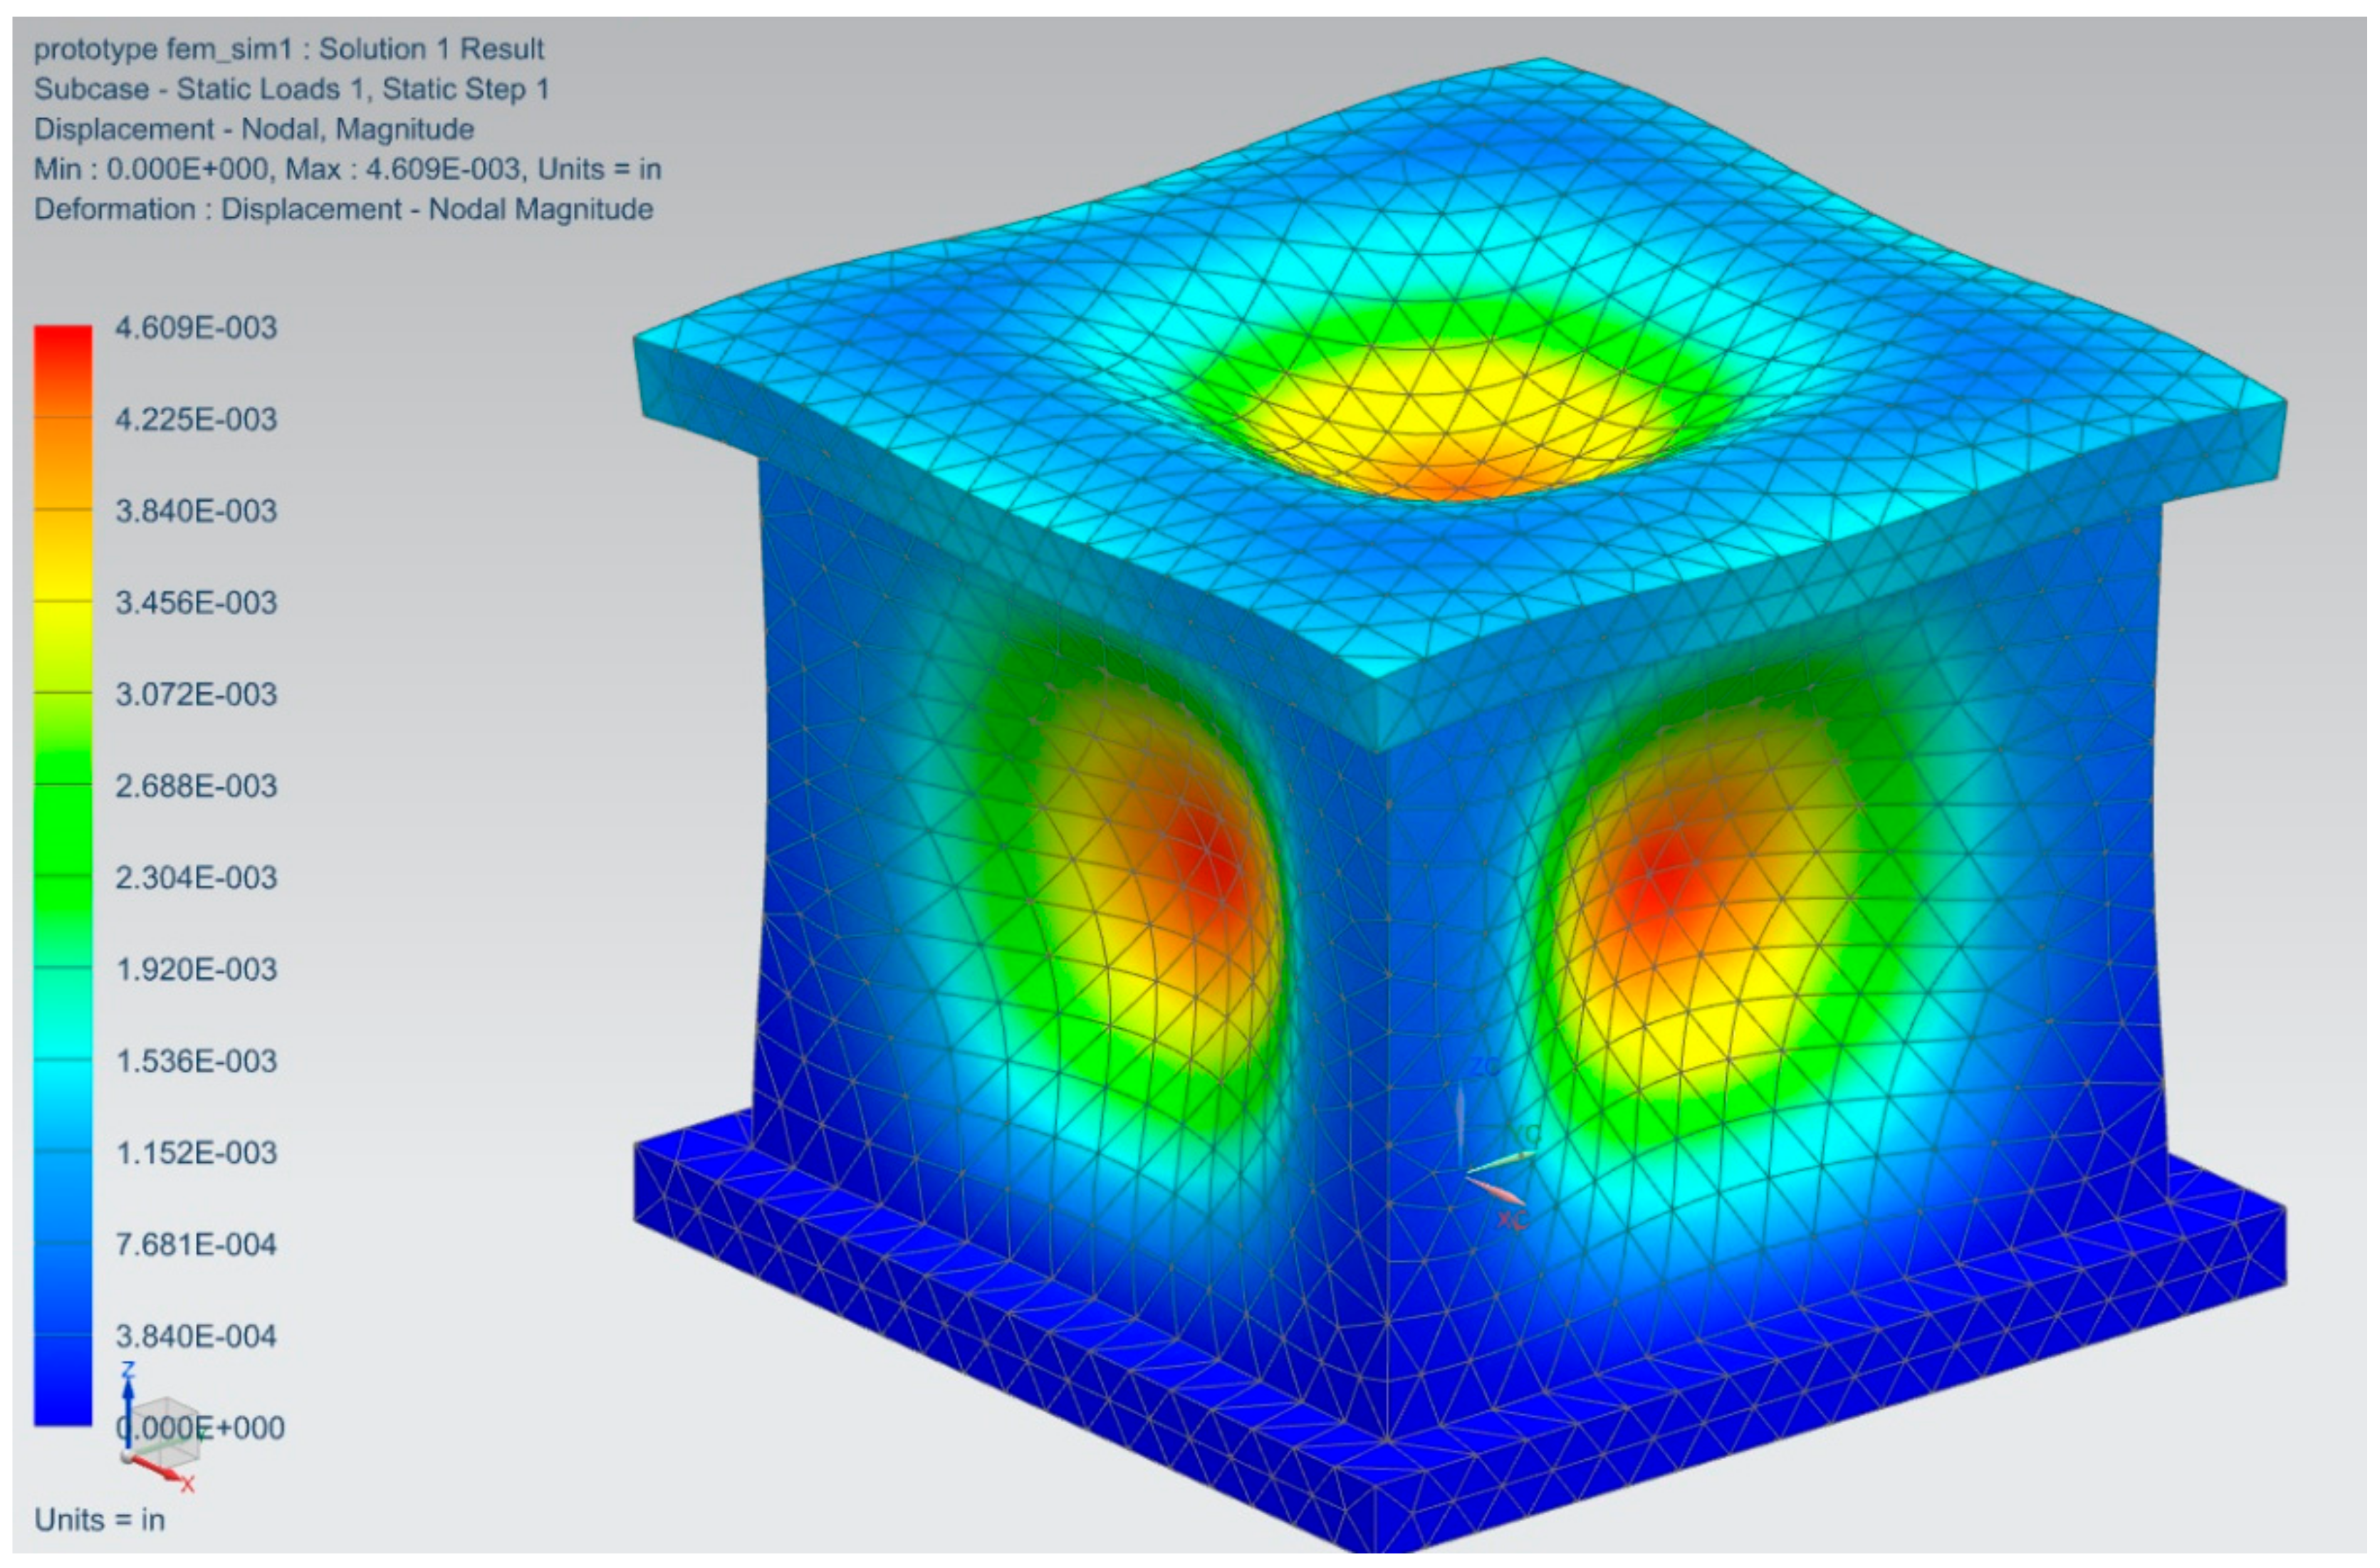
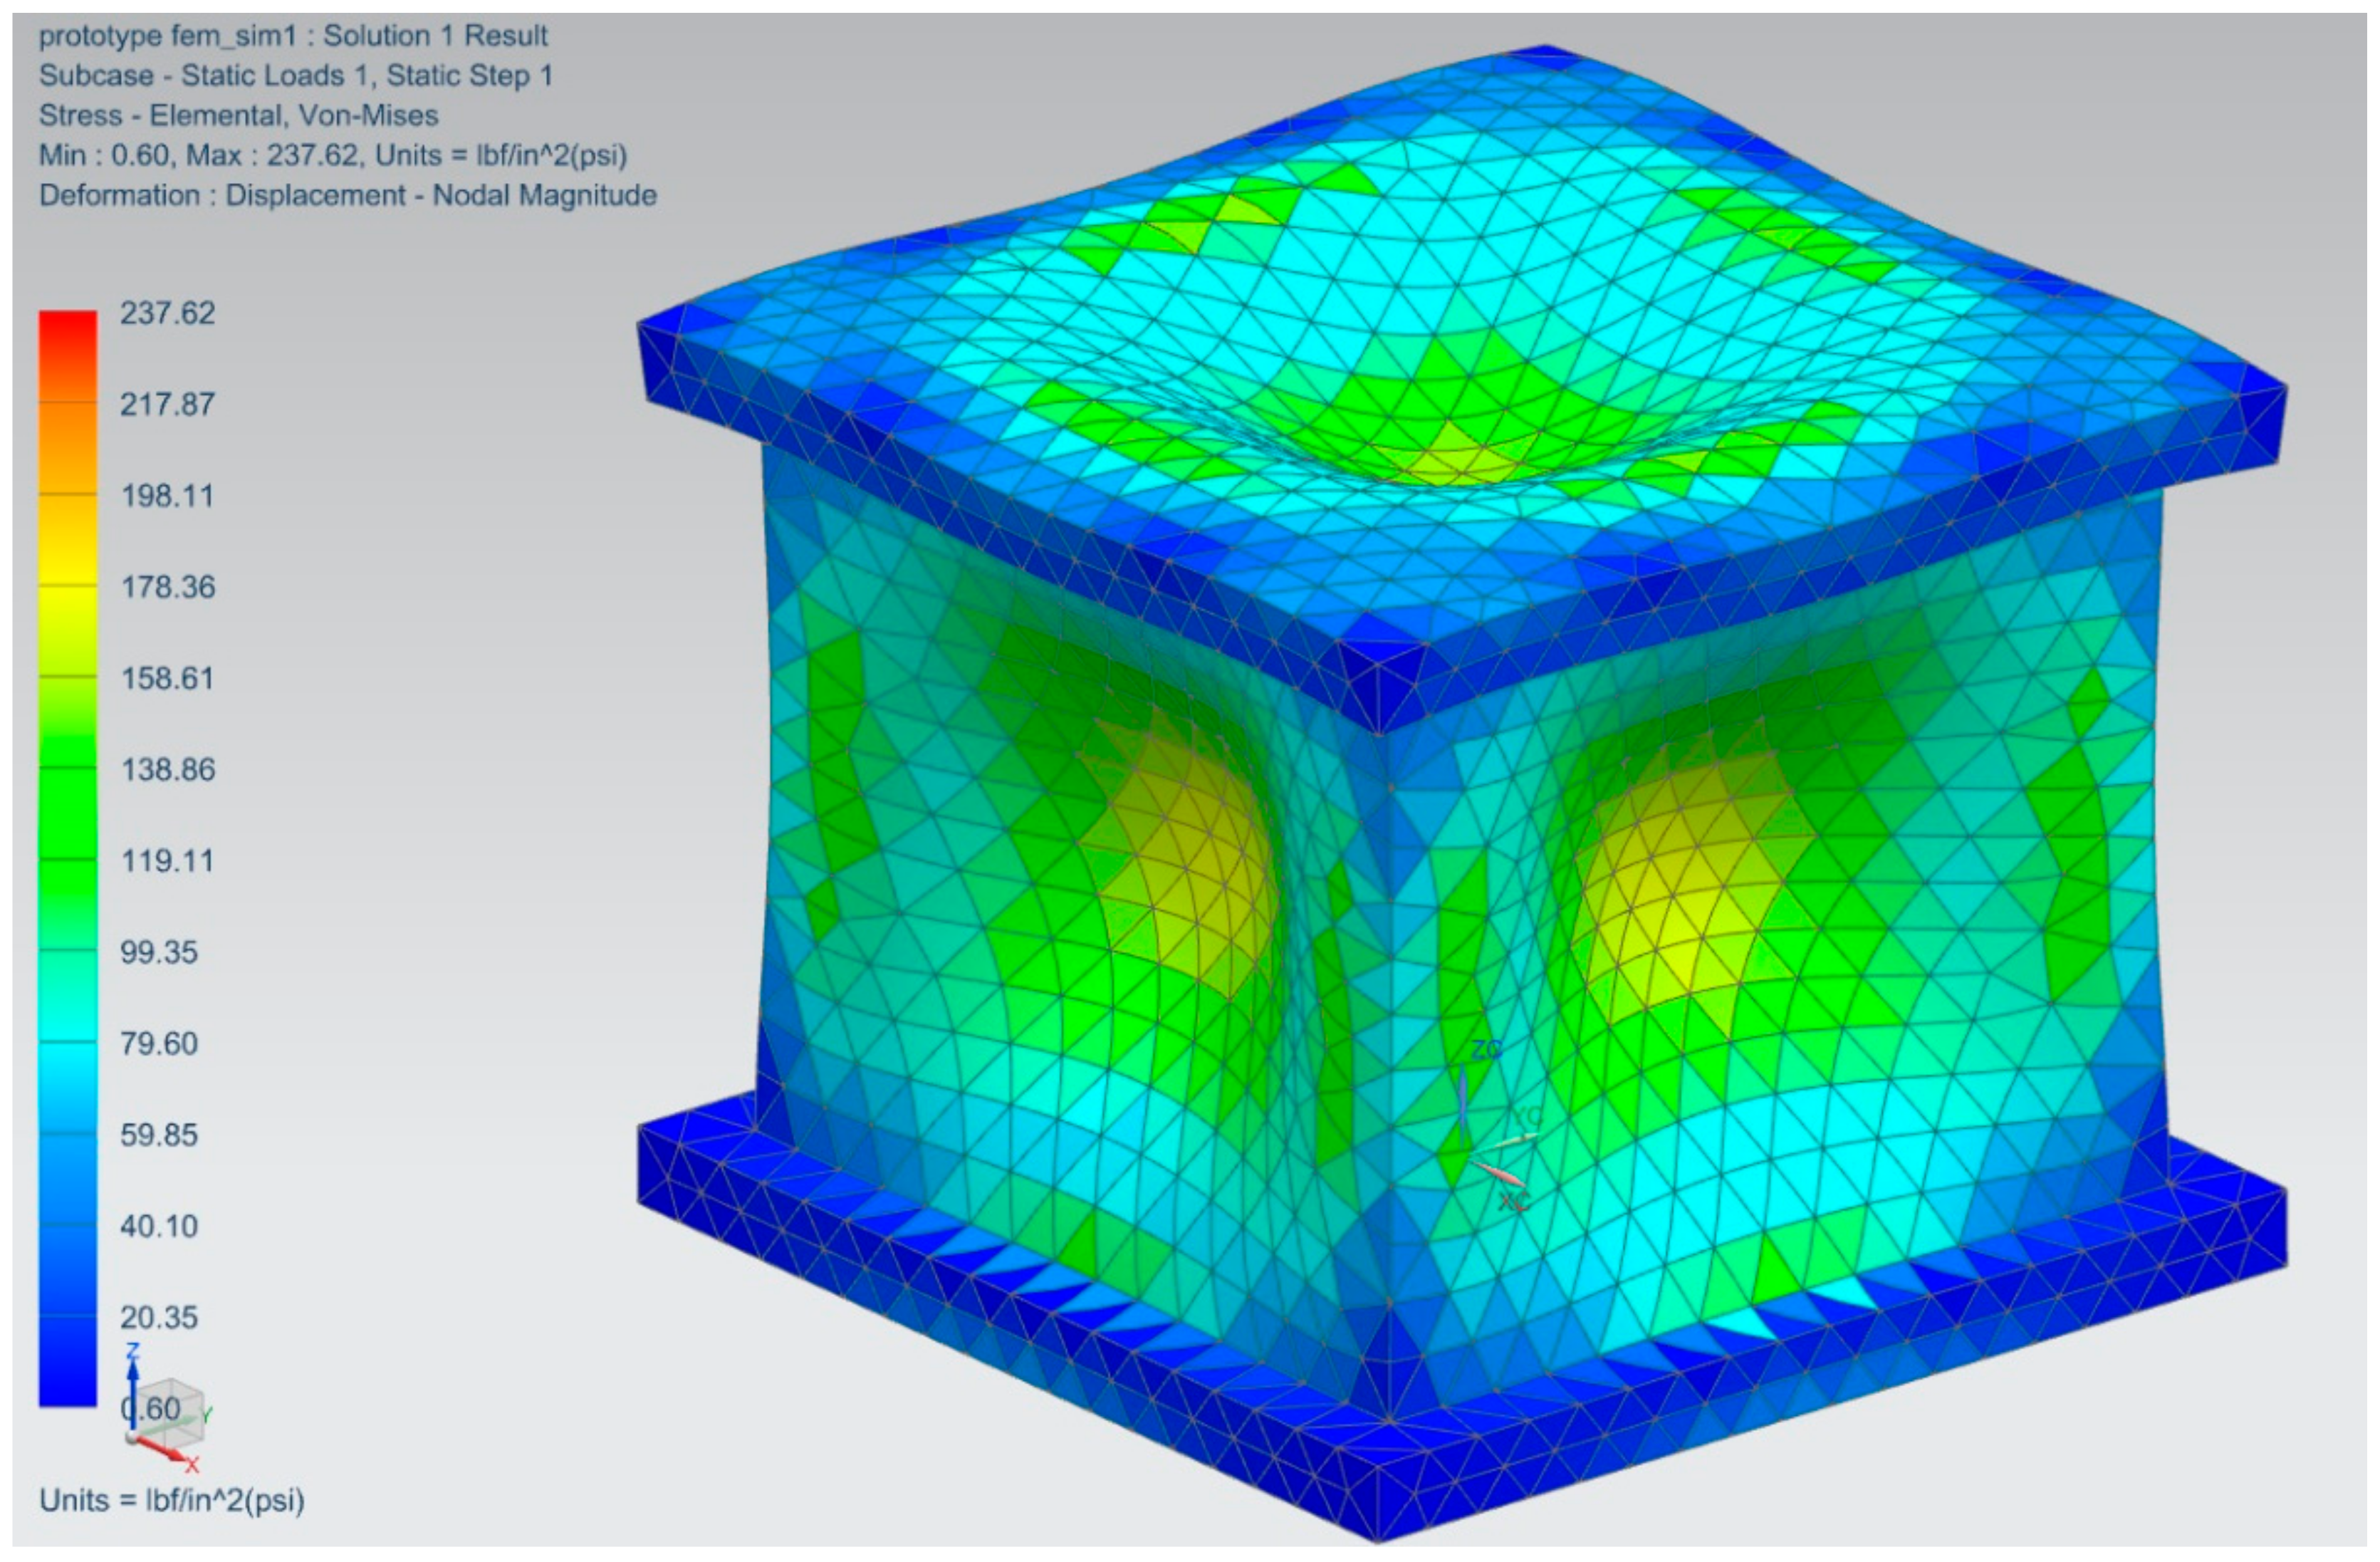
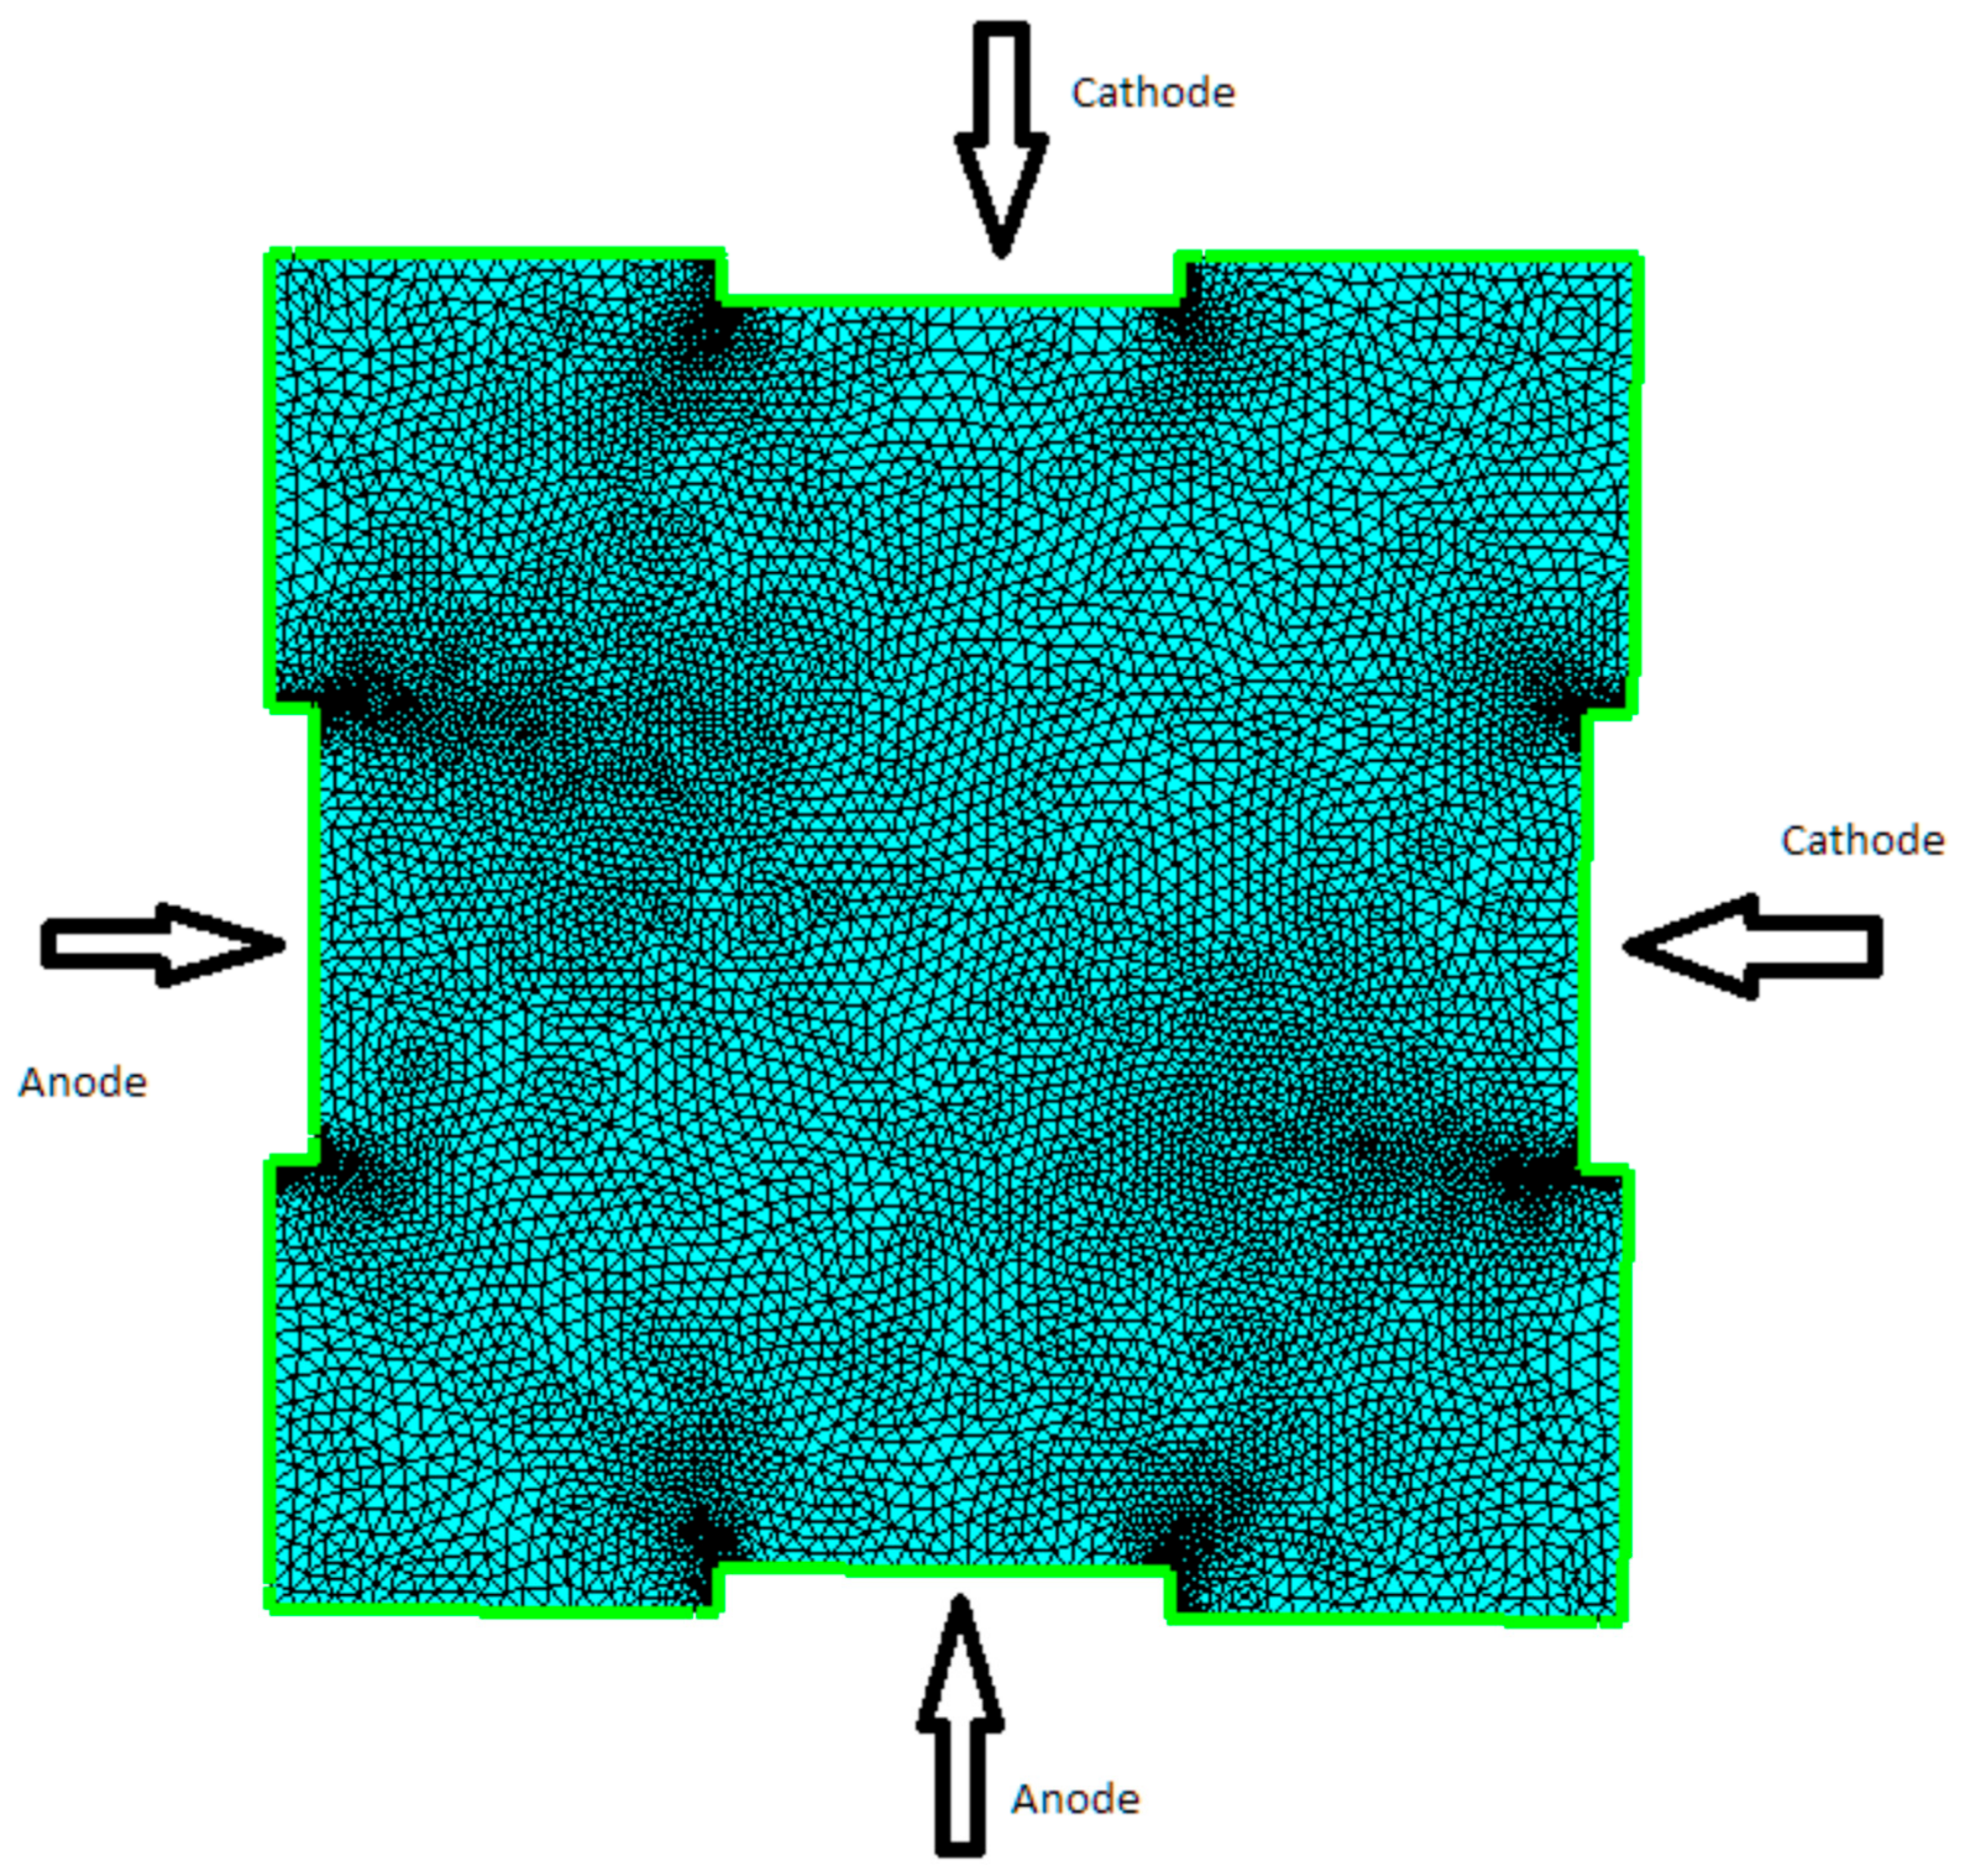
2.1.2. Finite Element Analysis
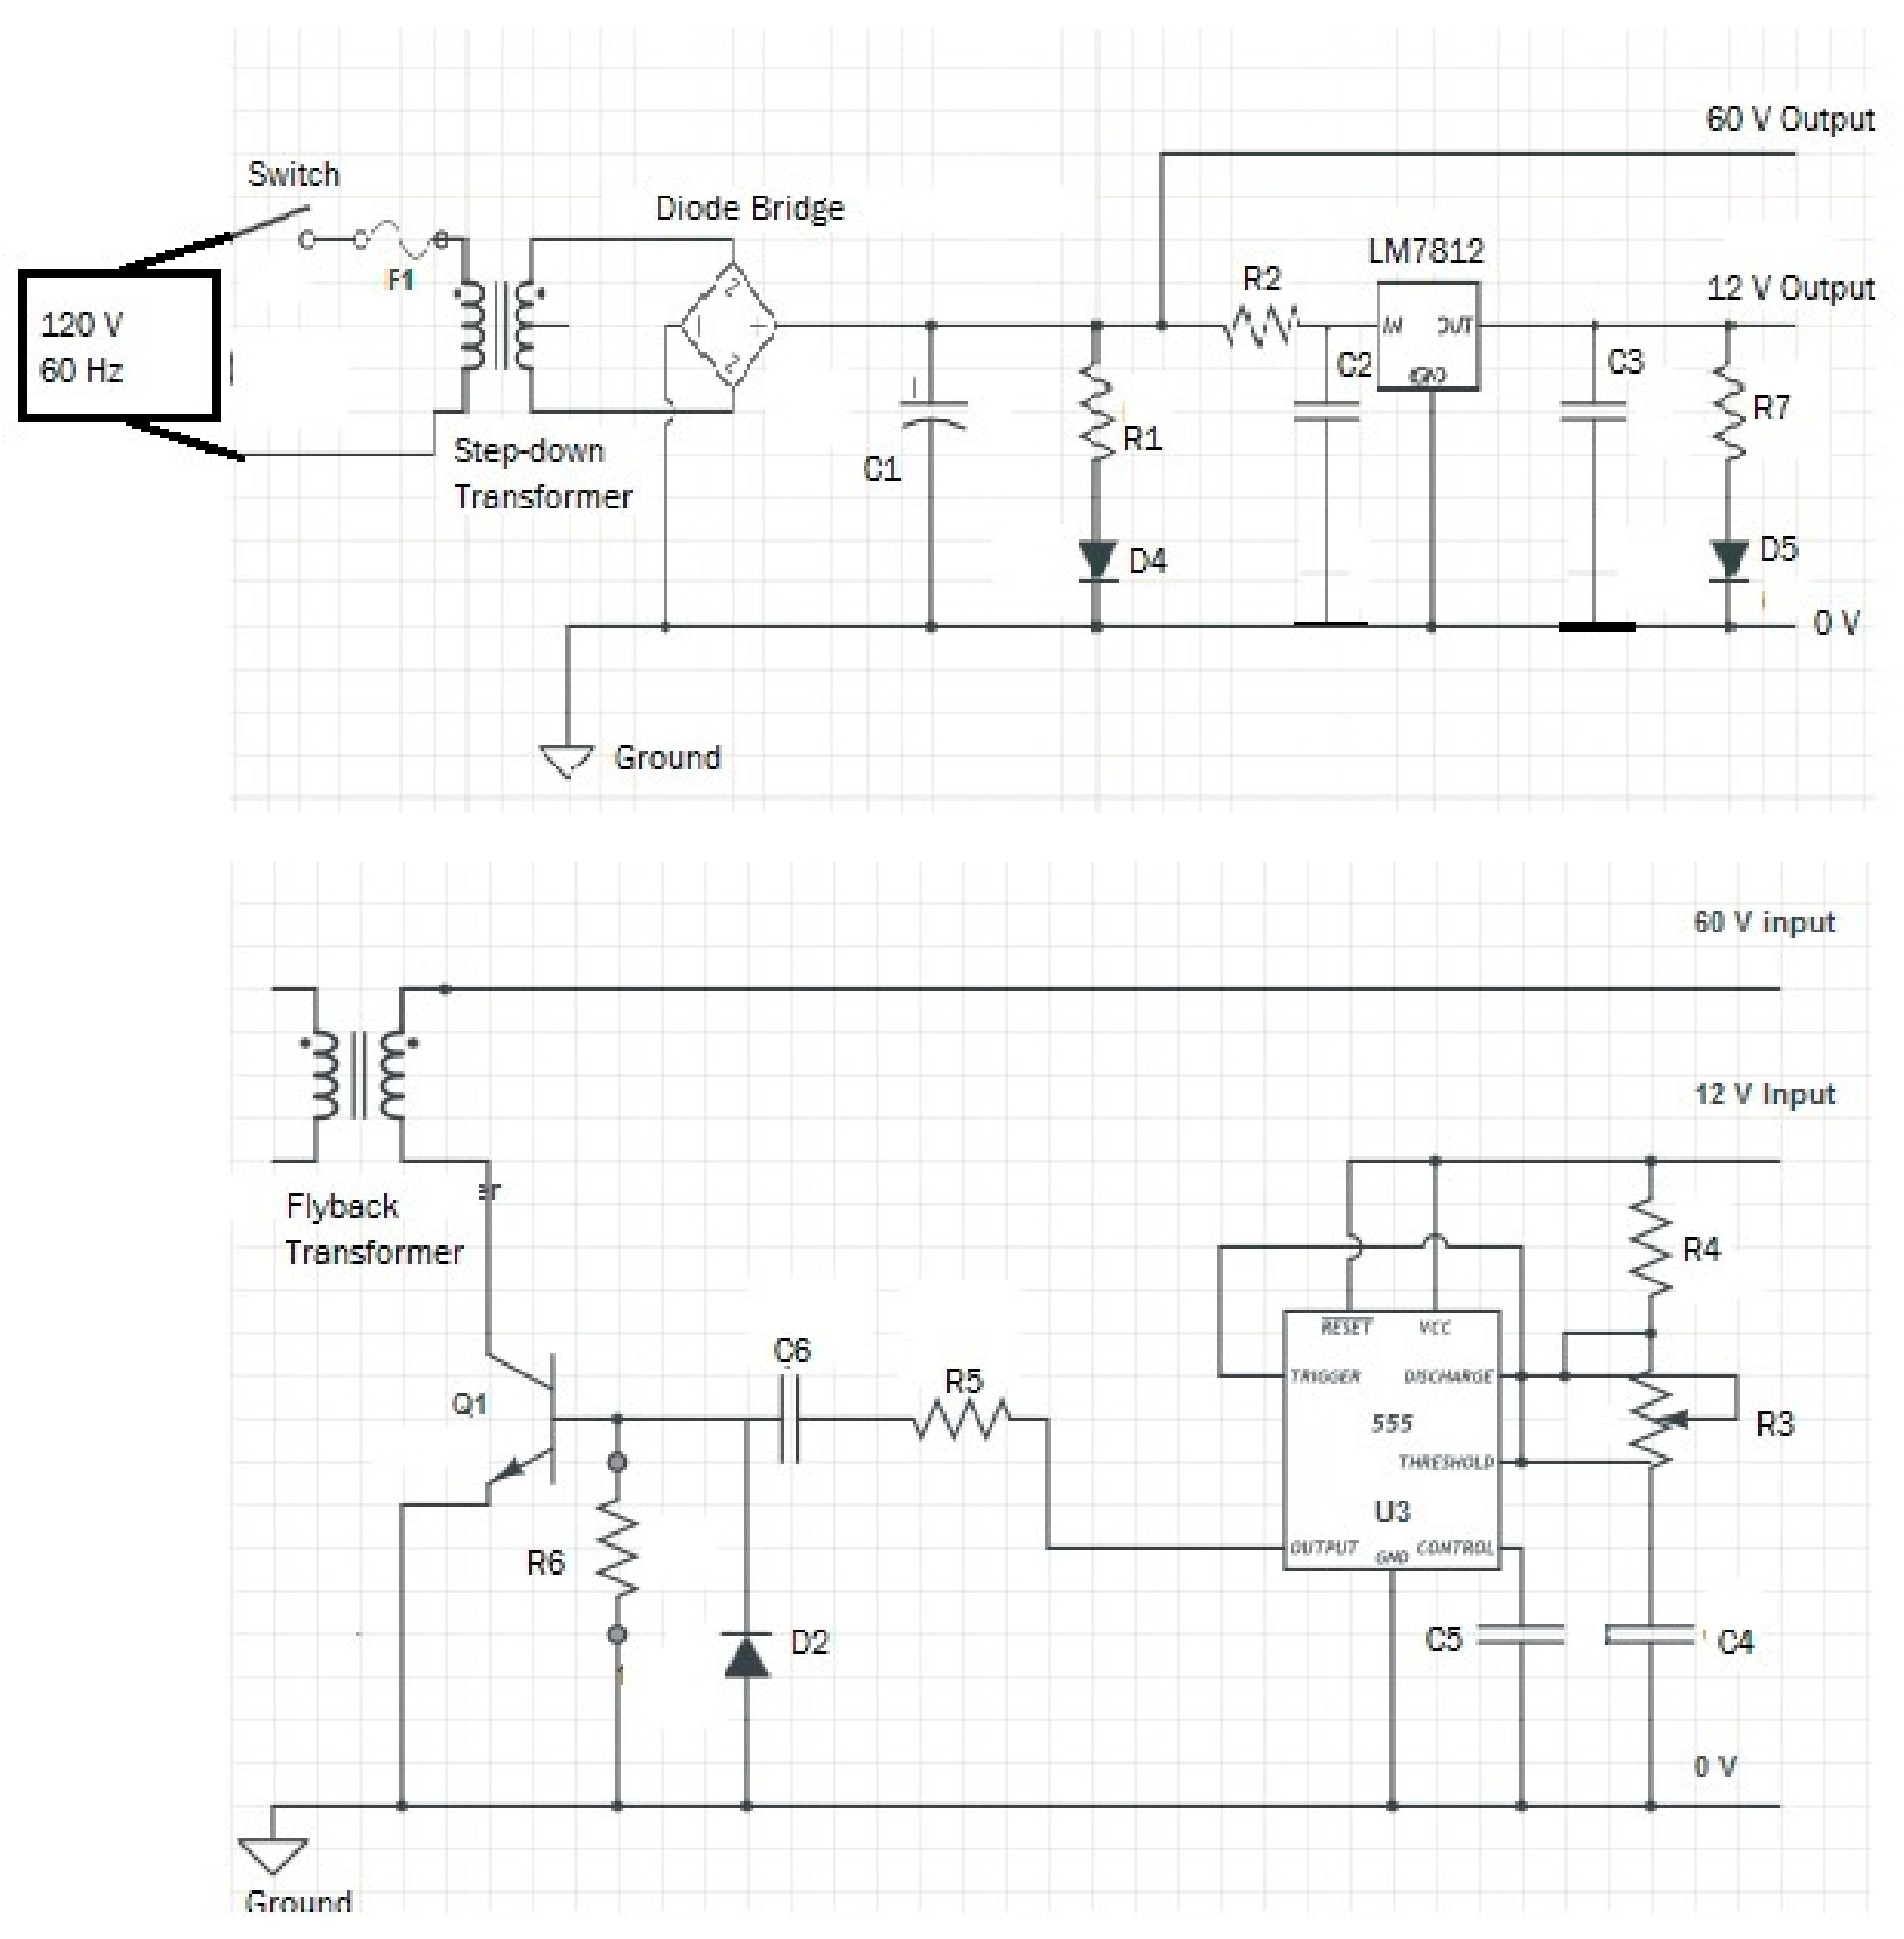
2.2. Electronics
- The circuit must be able to discharge at 1200 V and 5 mA so that the lower end of the high voltage plasma experiments can be operated and conducted. The ideal discharge voltage is 9000 V and 30 mA.
- The circuit must operate in such a manner that the user can control the rate of discharge, including frequencies at least in the 20 kHz range.
- The user must have the capacity to trigger an event manually using a button and a mechanical switch to turn off the whole experiment in case of an emergency. It must be mechanical because the chances of digital failure are mitigated.
- Discharge circuit must be entirely isolated from the manual trigger and control circuit using relays. The switch, in particular, will be designed so that its activation will allow for the relays to convey the necessary signal to initiate the power supply dumping its energy into the discharge circuit.
- The circuit must be able to modify the pulsed discharge parameters such as pulse width, amplitude, waveform, and frequency, using a set of 555 timer circuits which work in harmony.
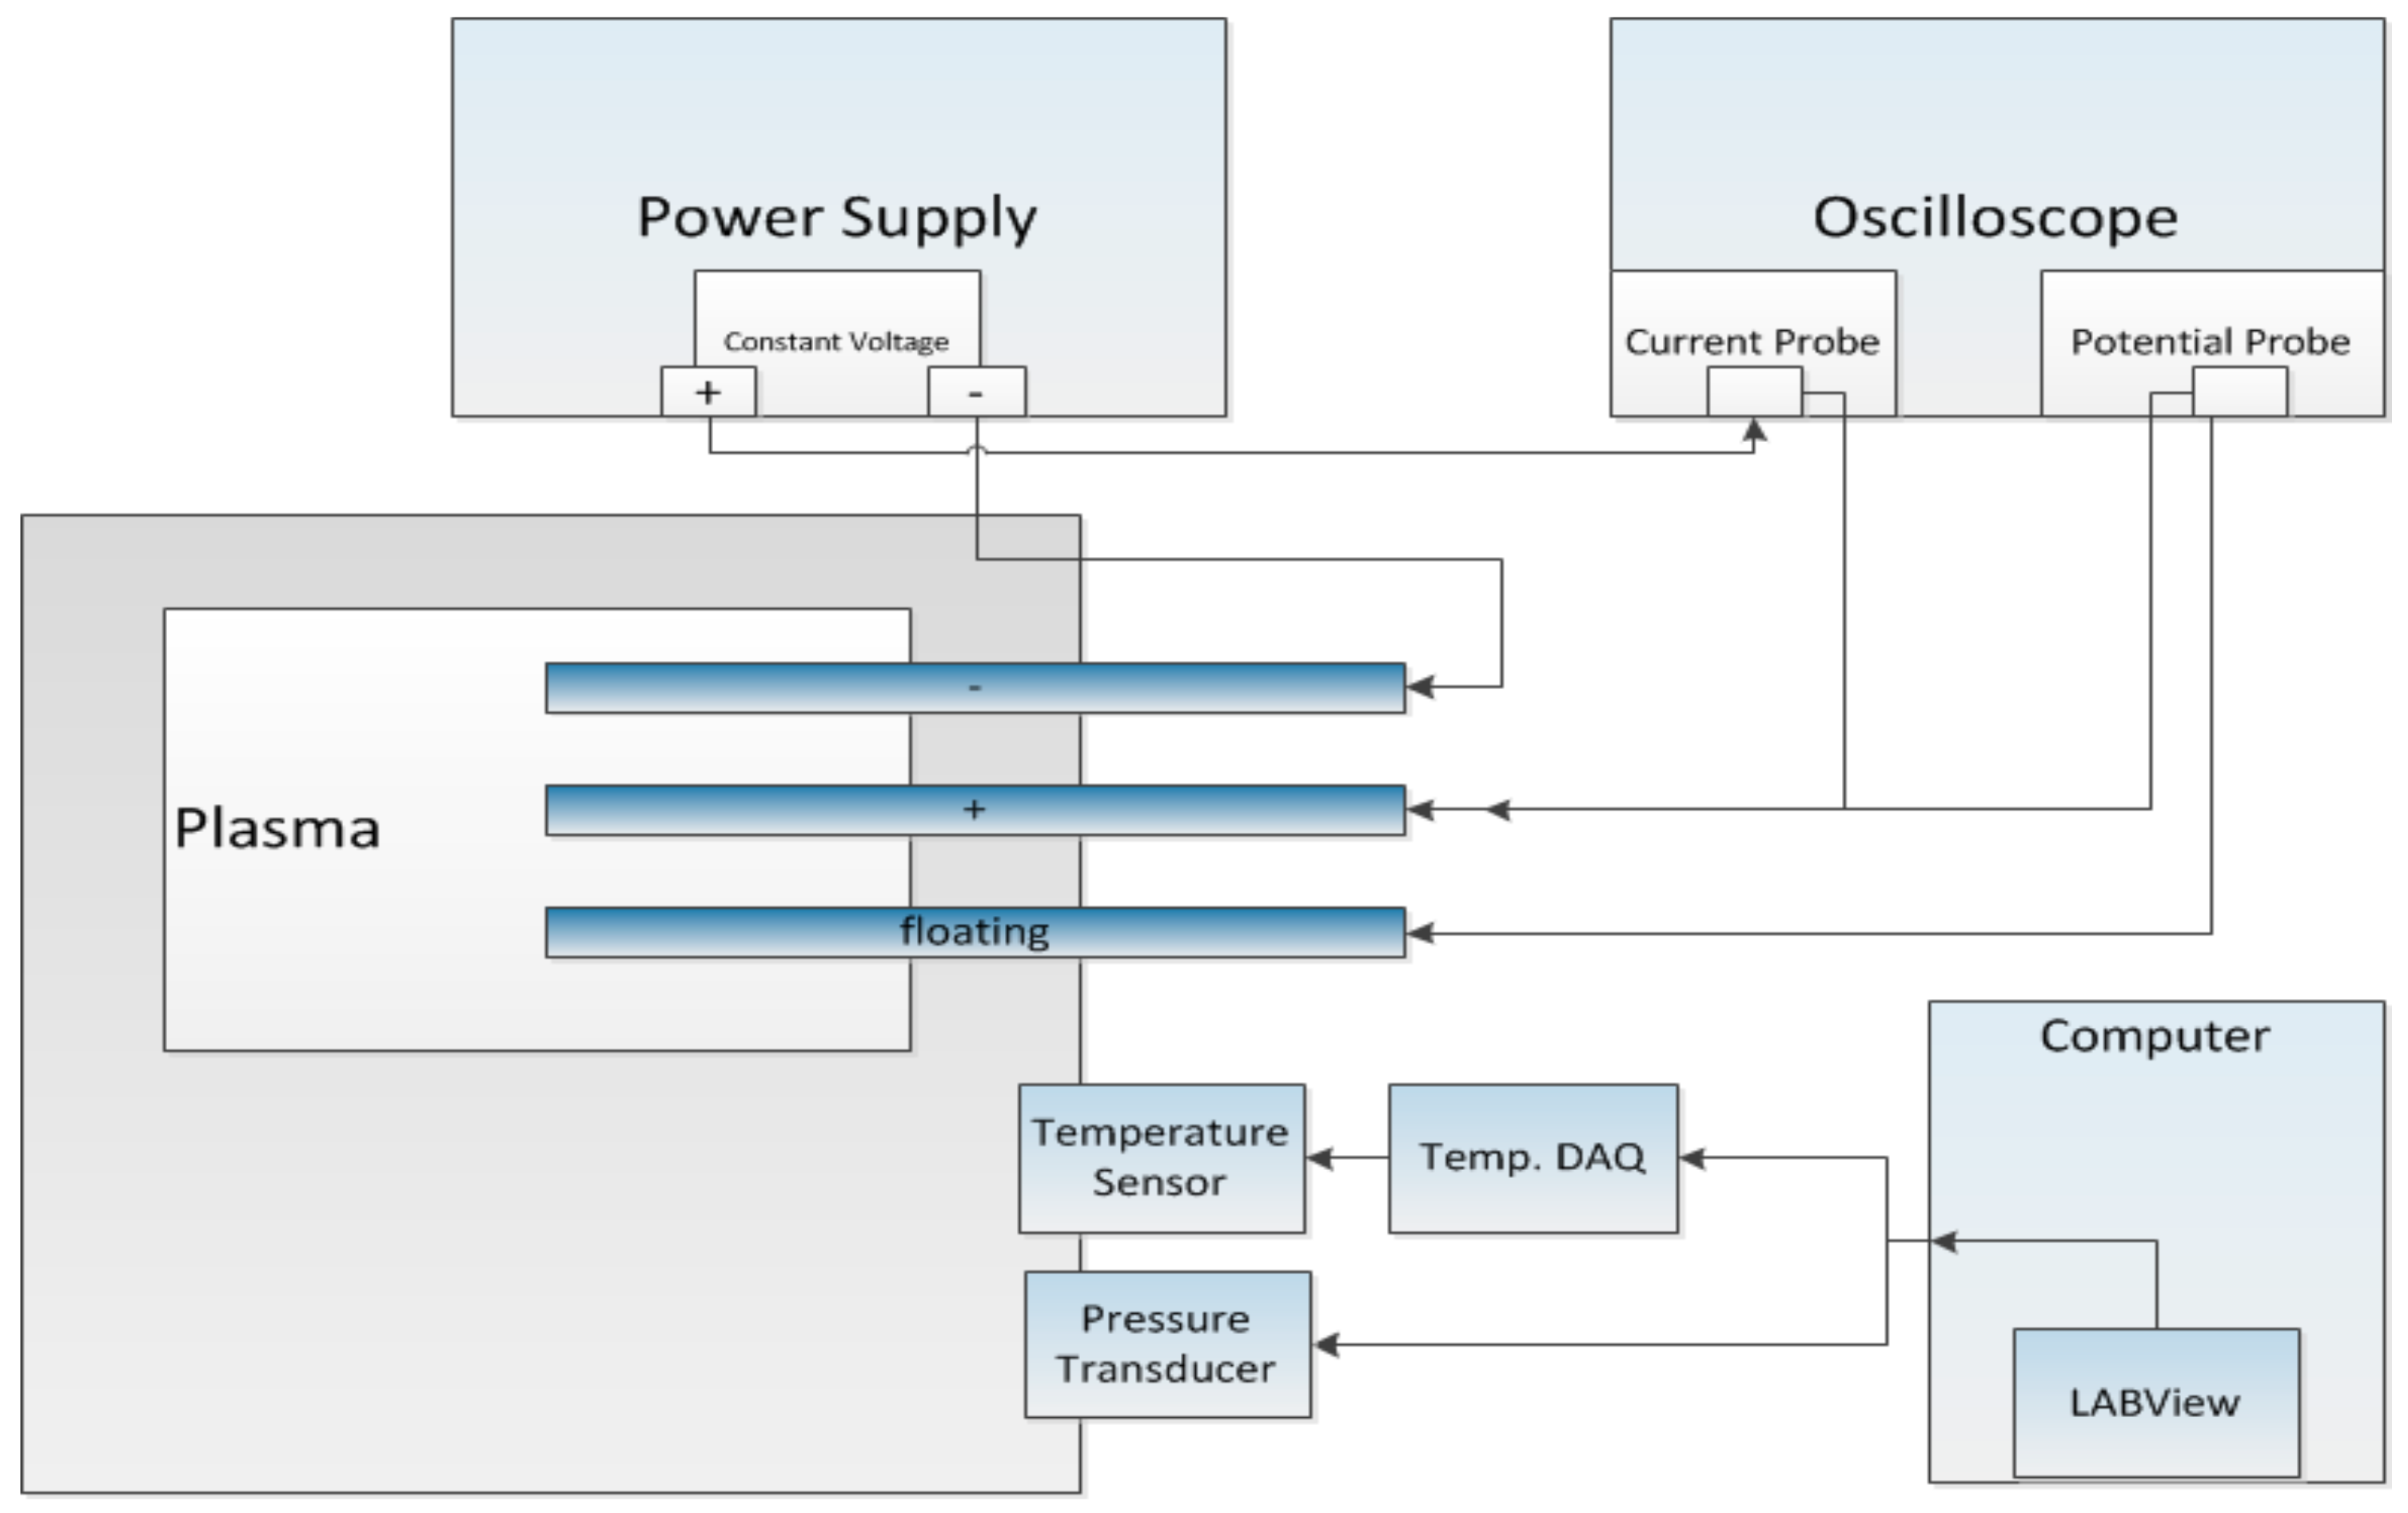
2.3. Instruments
2.4. Energy Harvesting
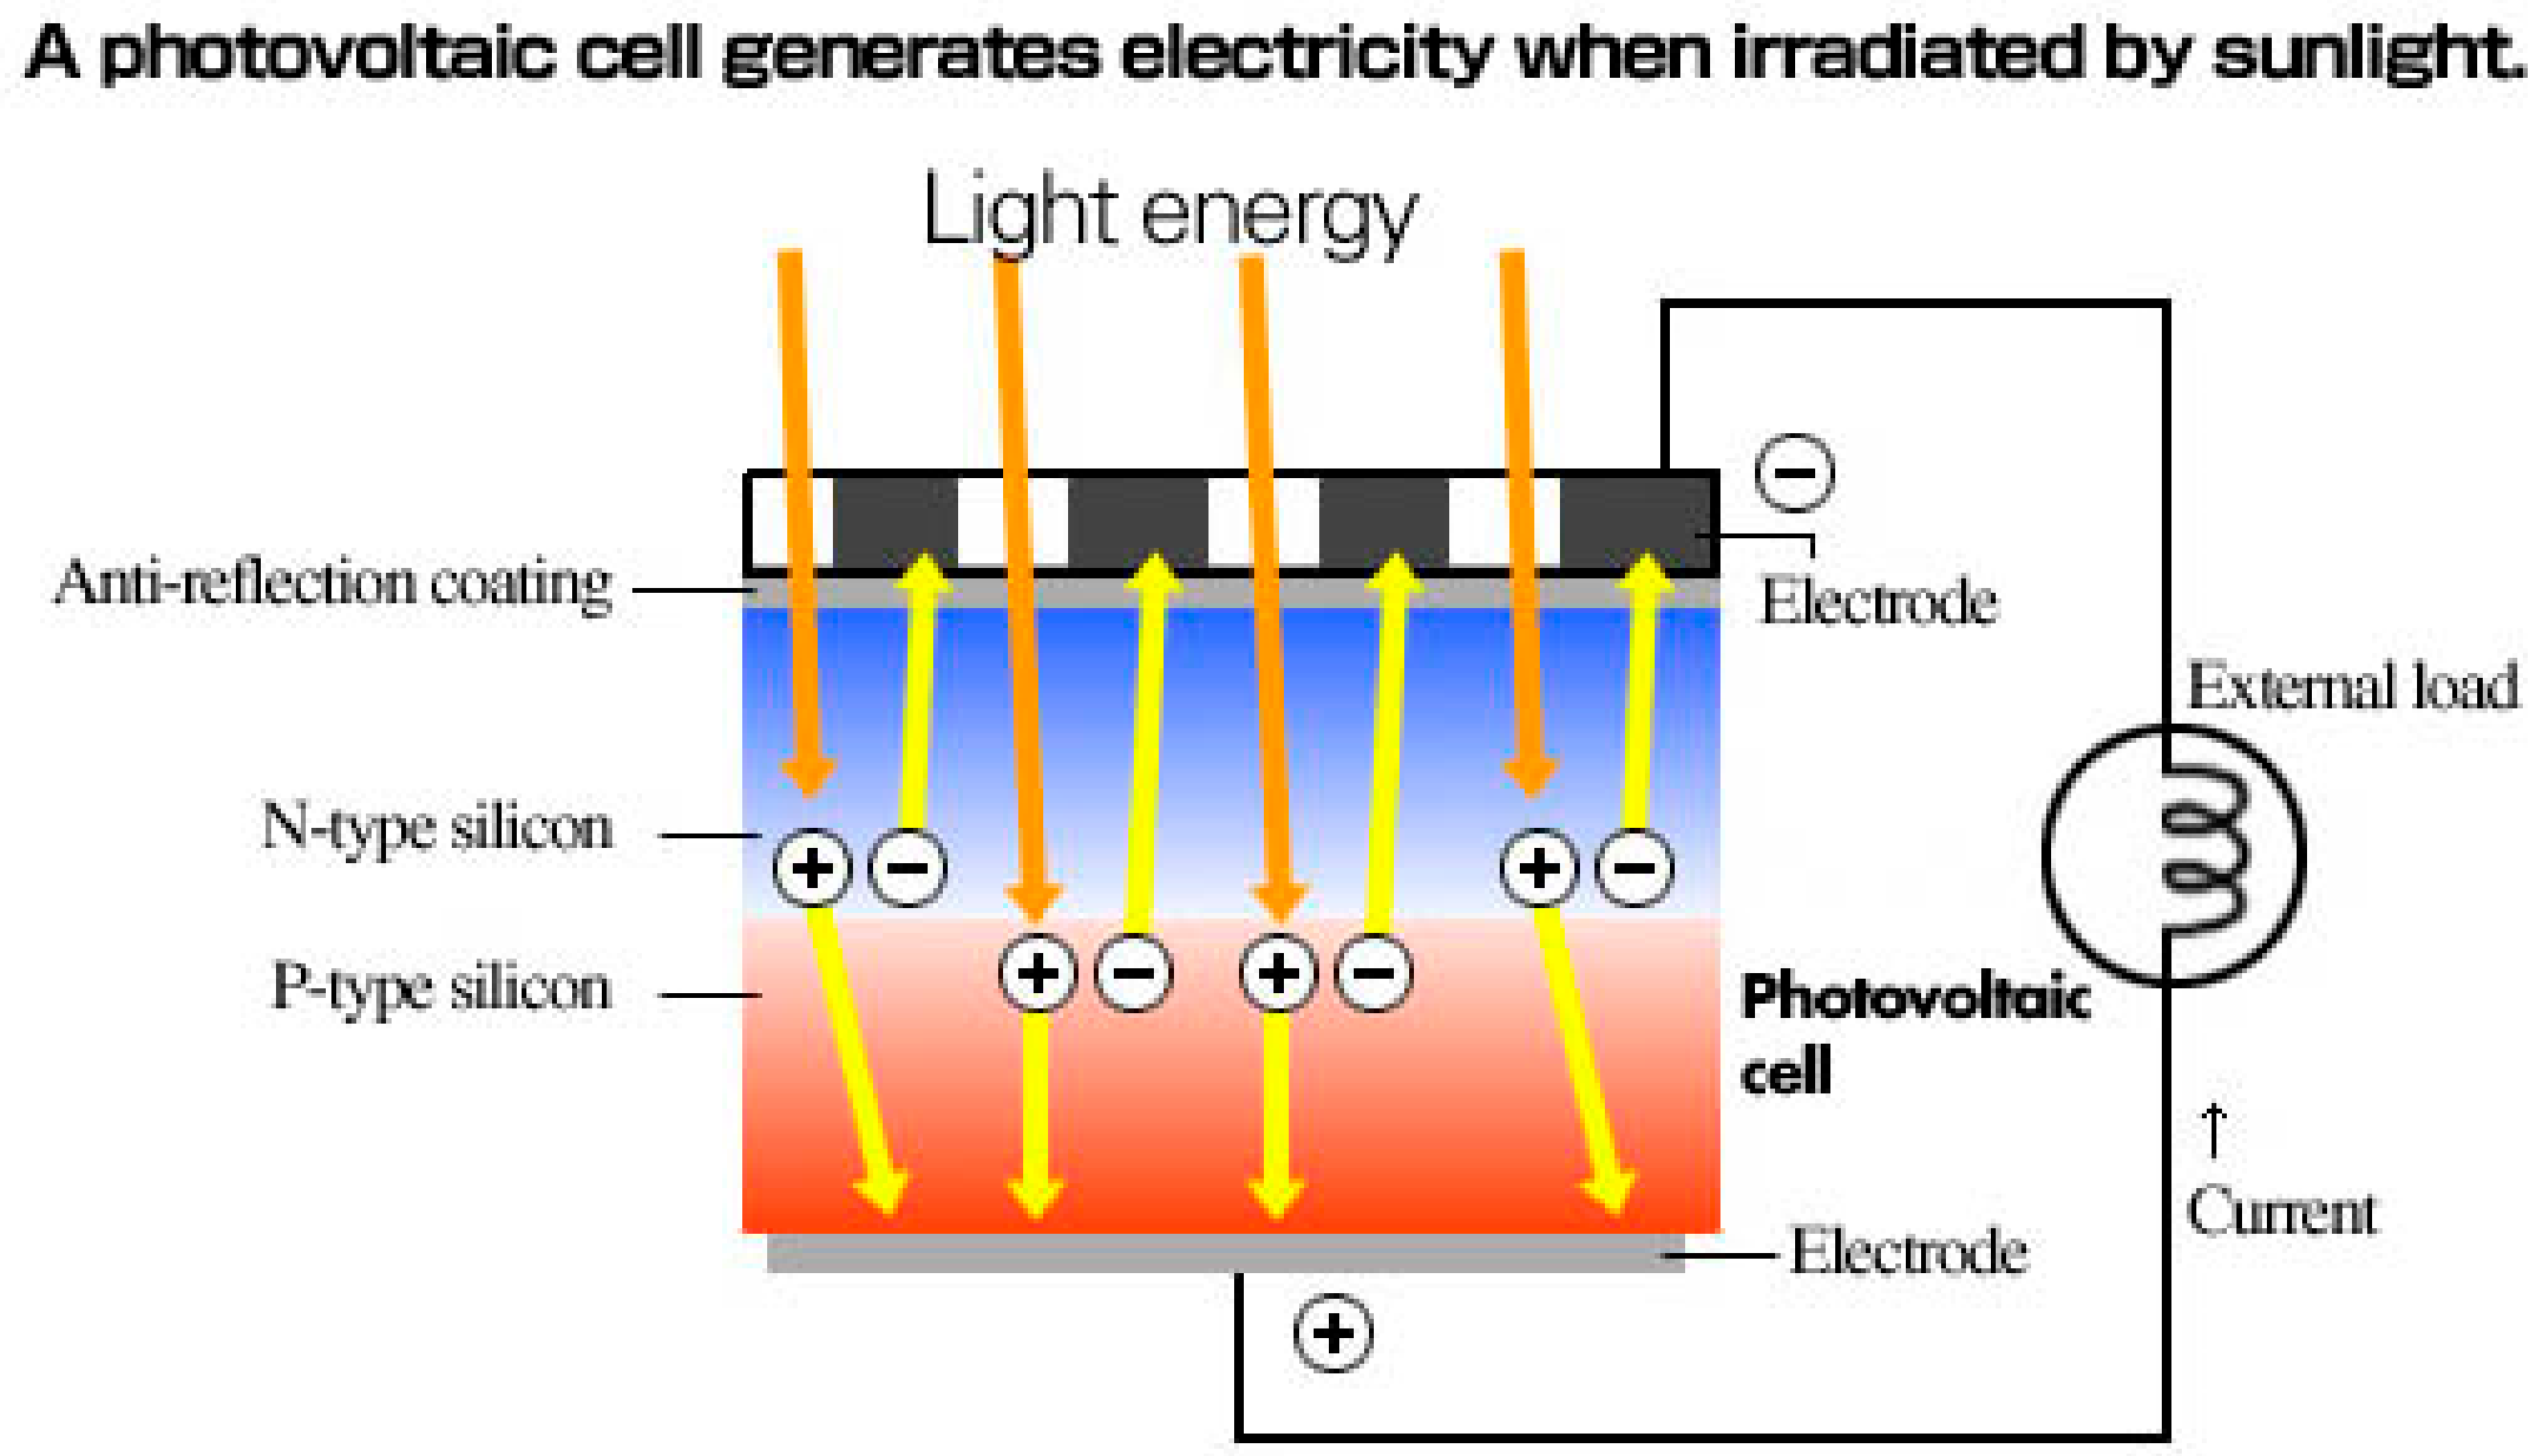
2.4.1. Photovoltaics
2.4.2. Thermoelectric Generation
3. Methodology
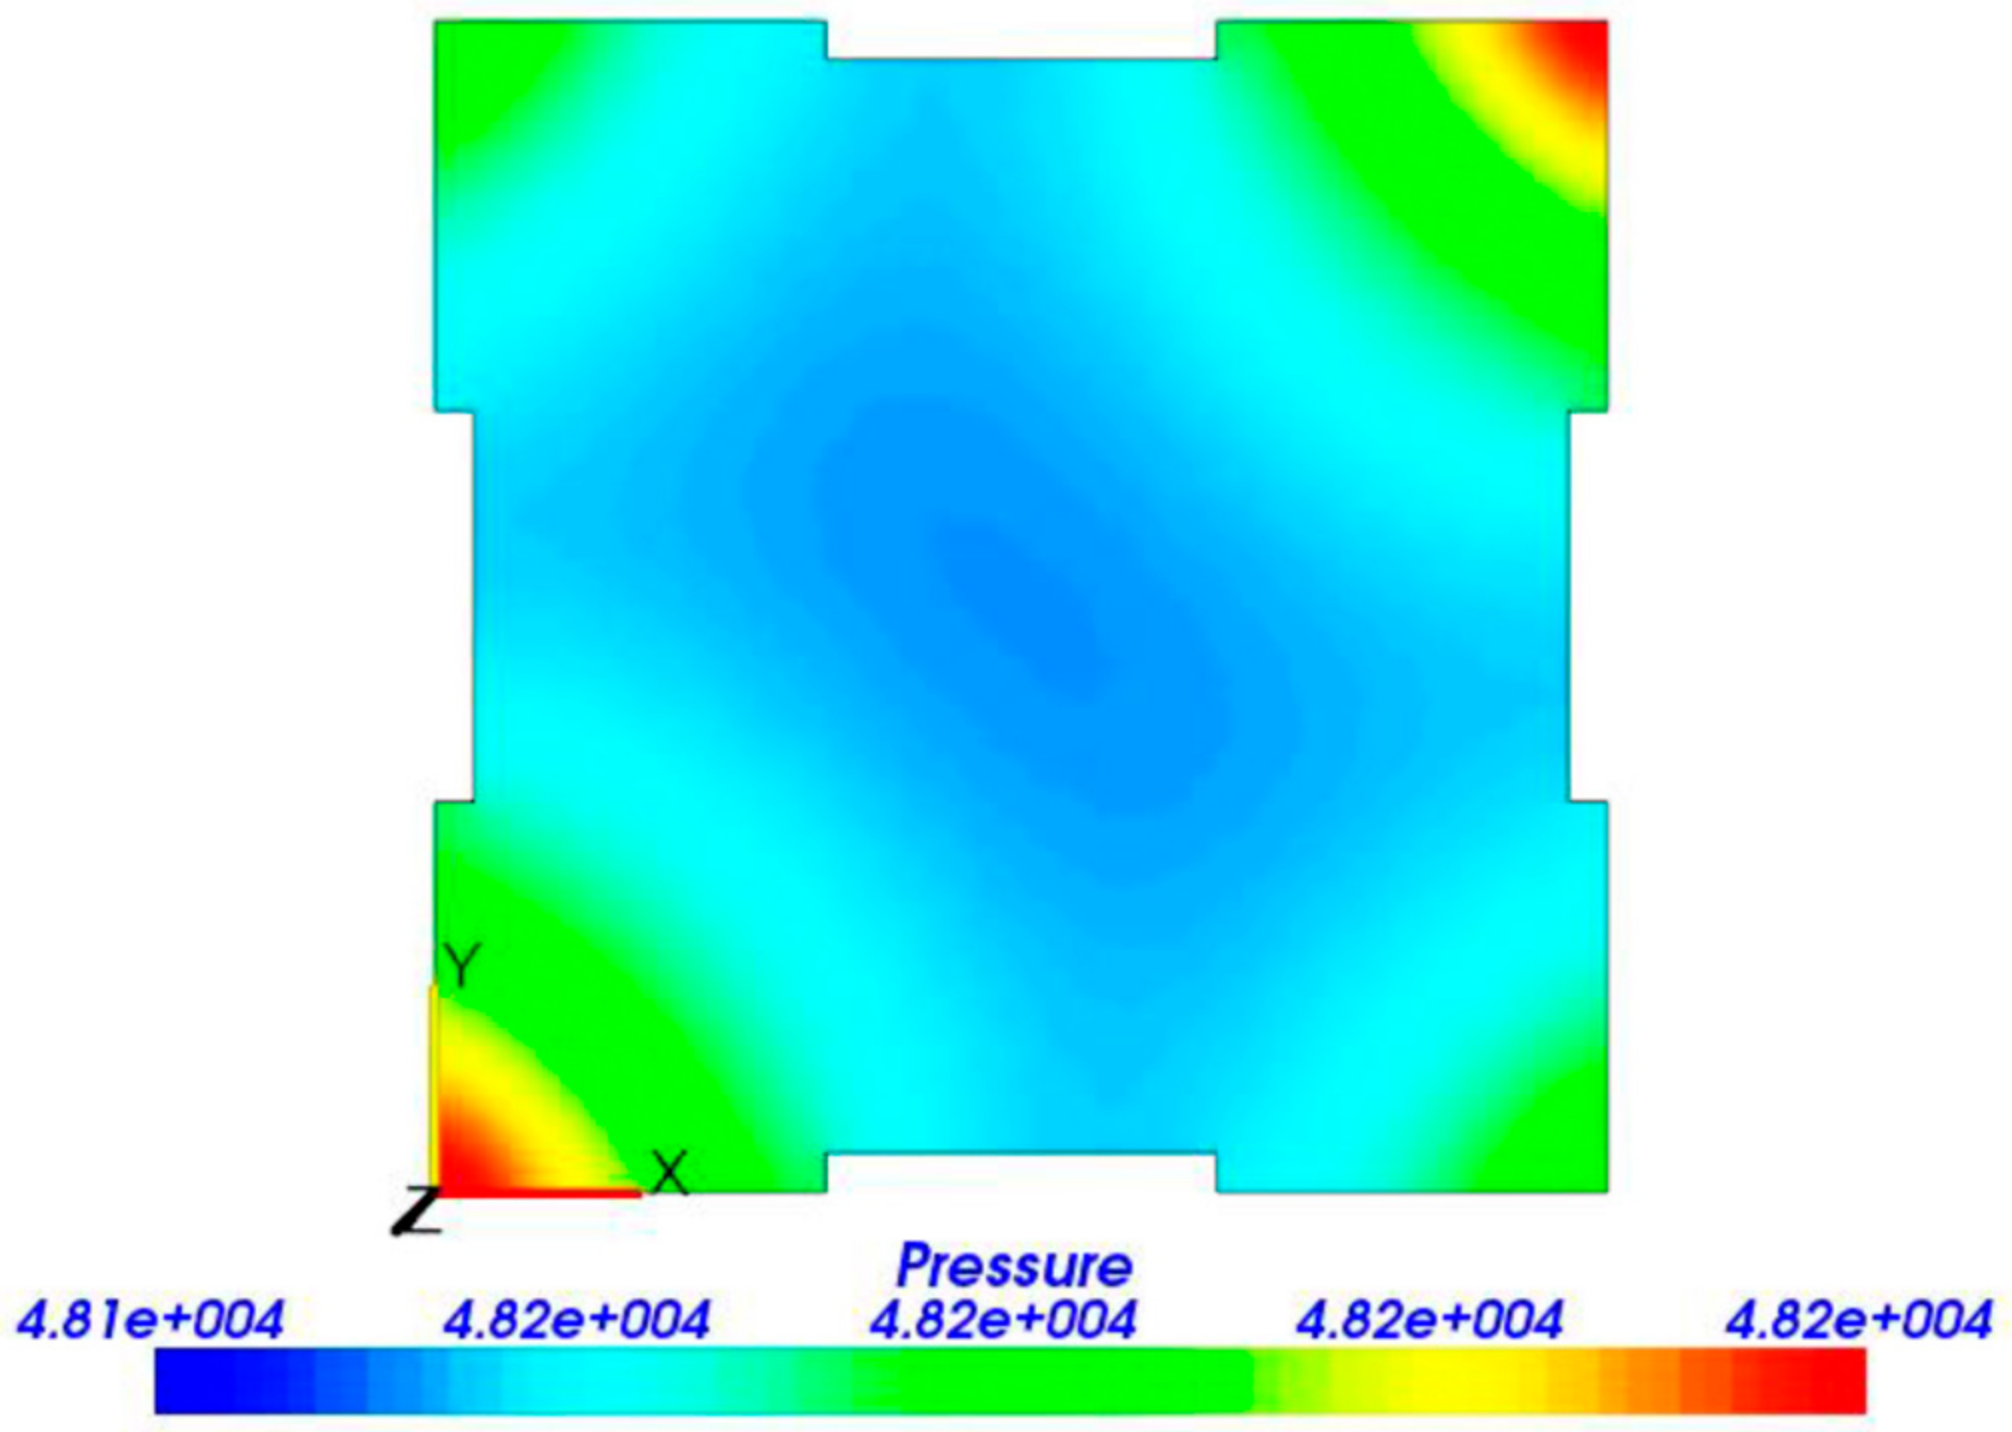
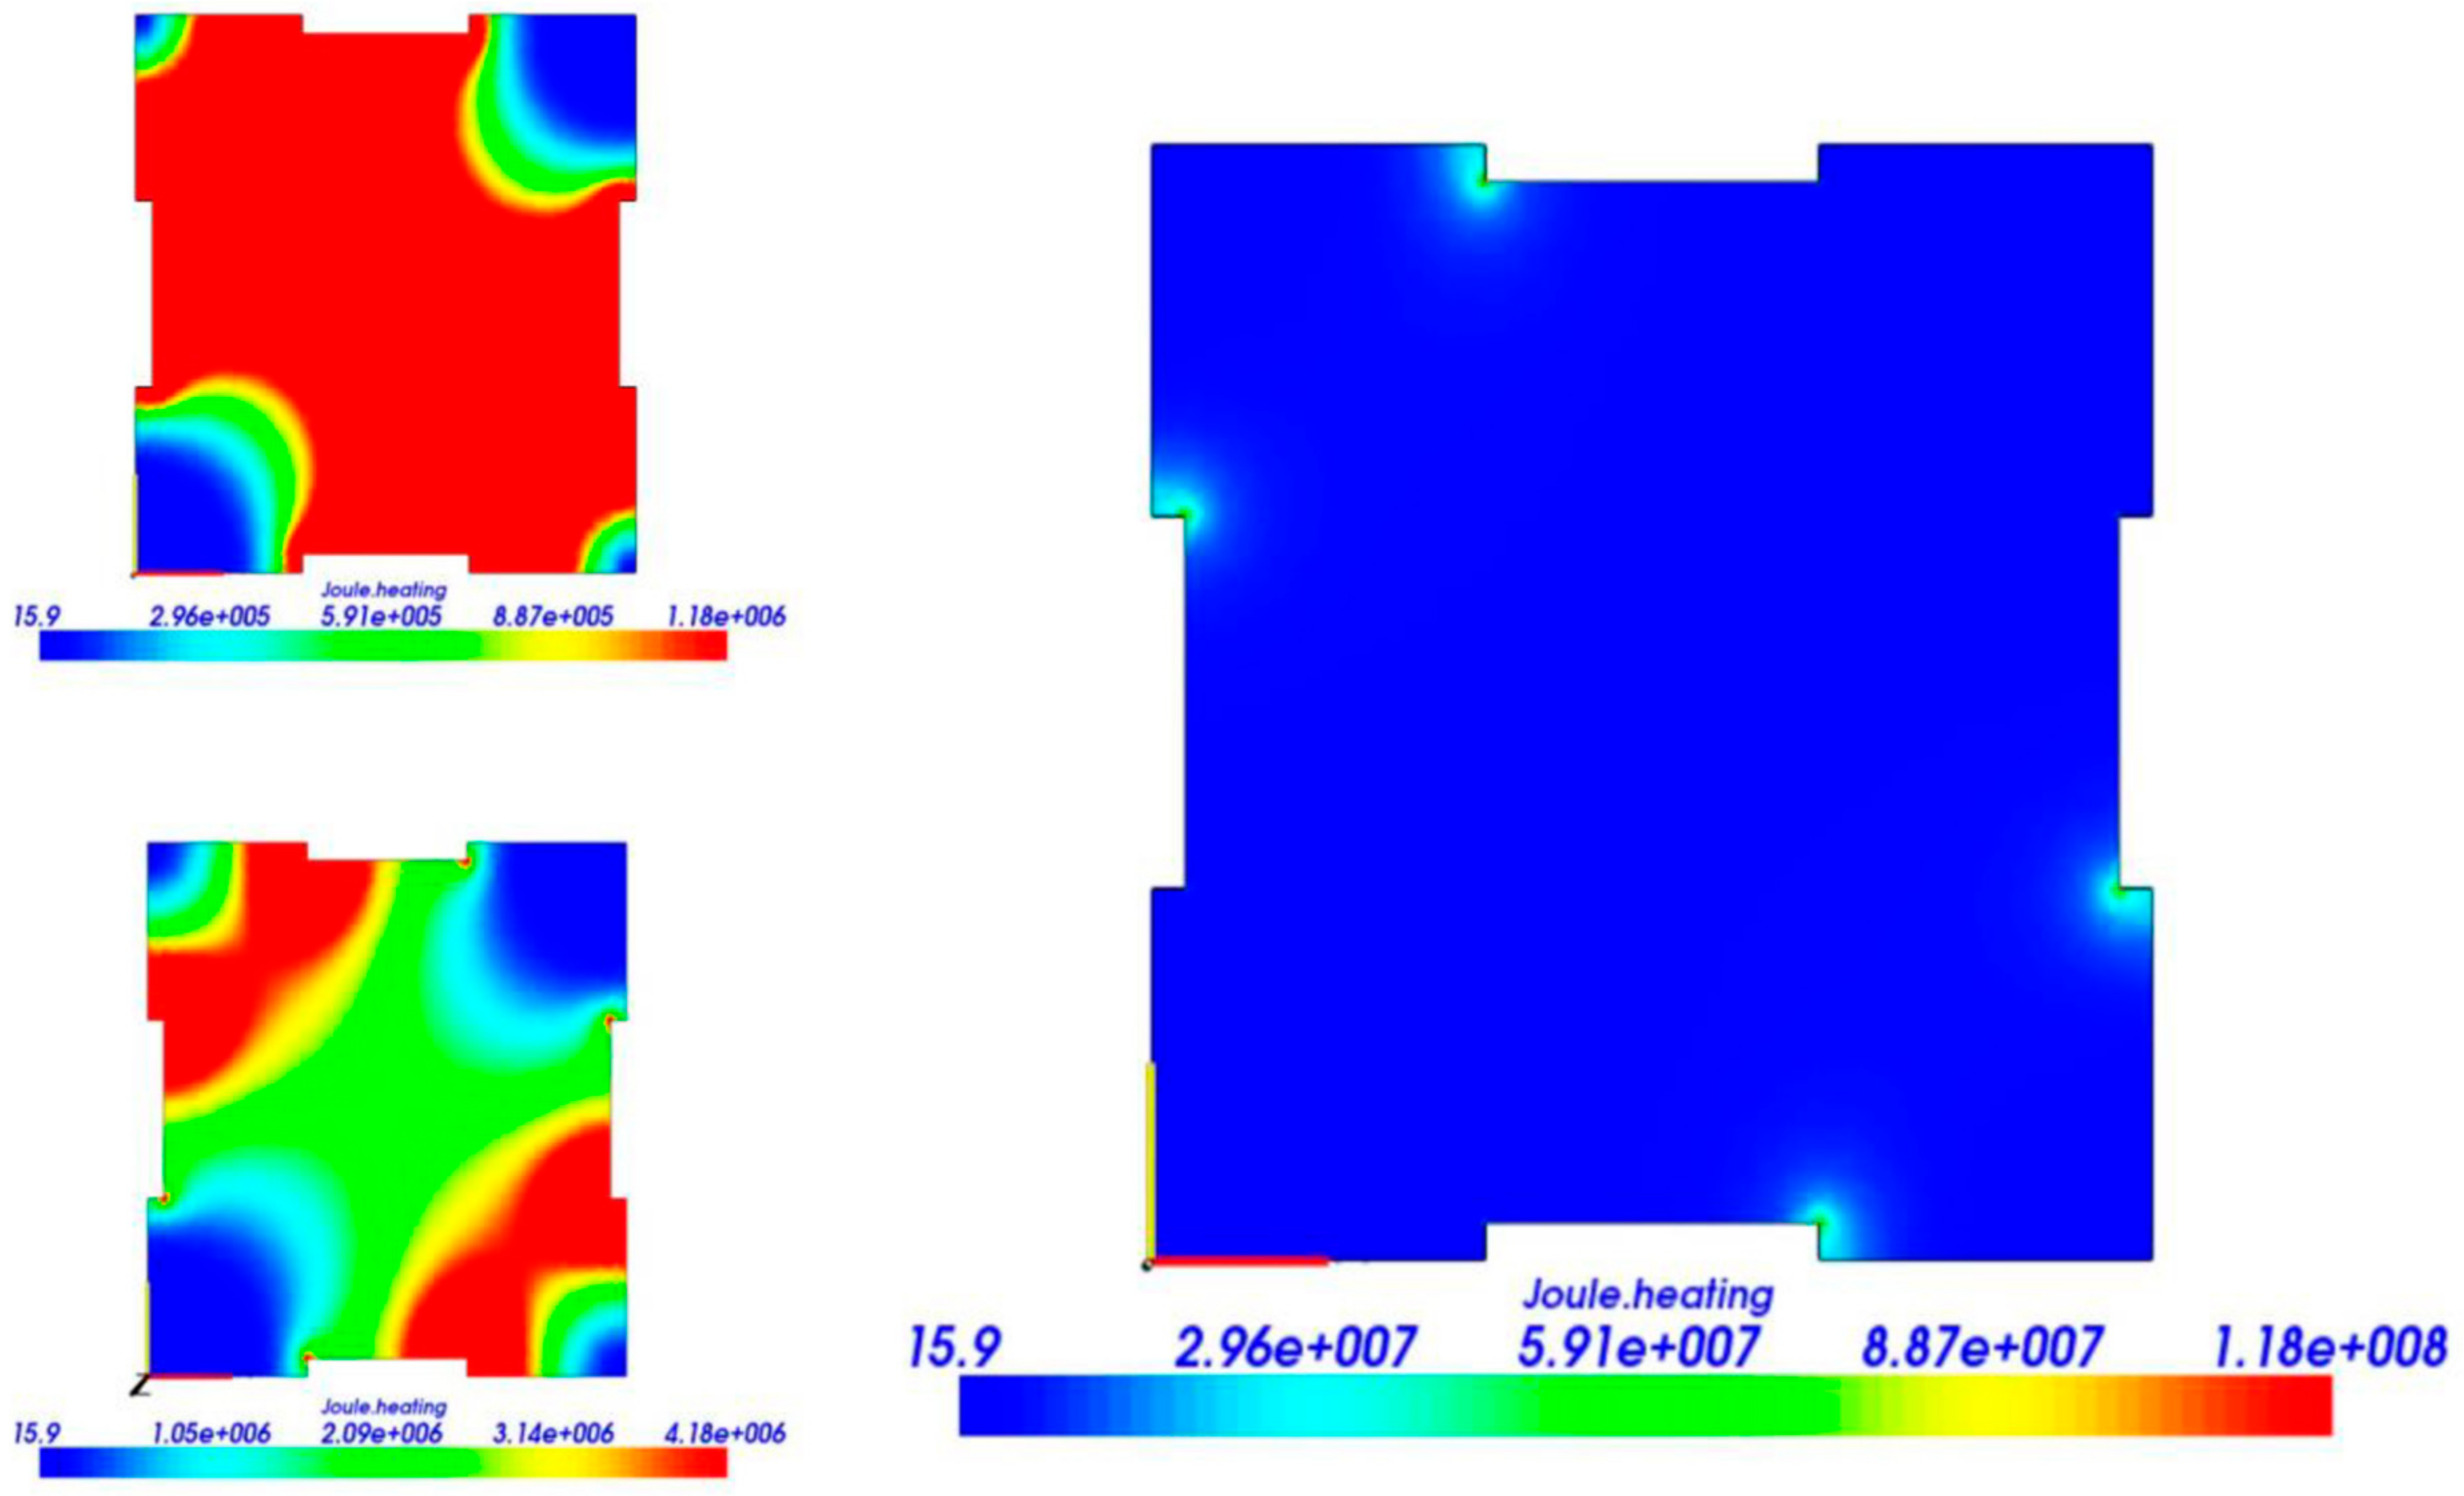
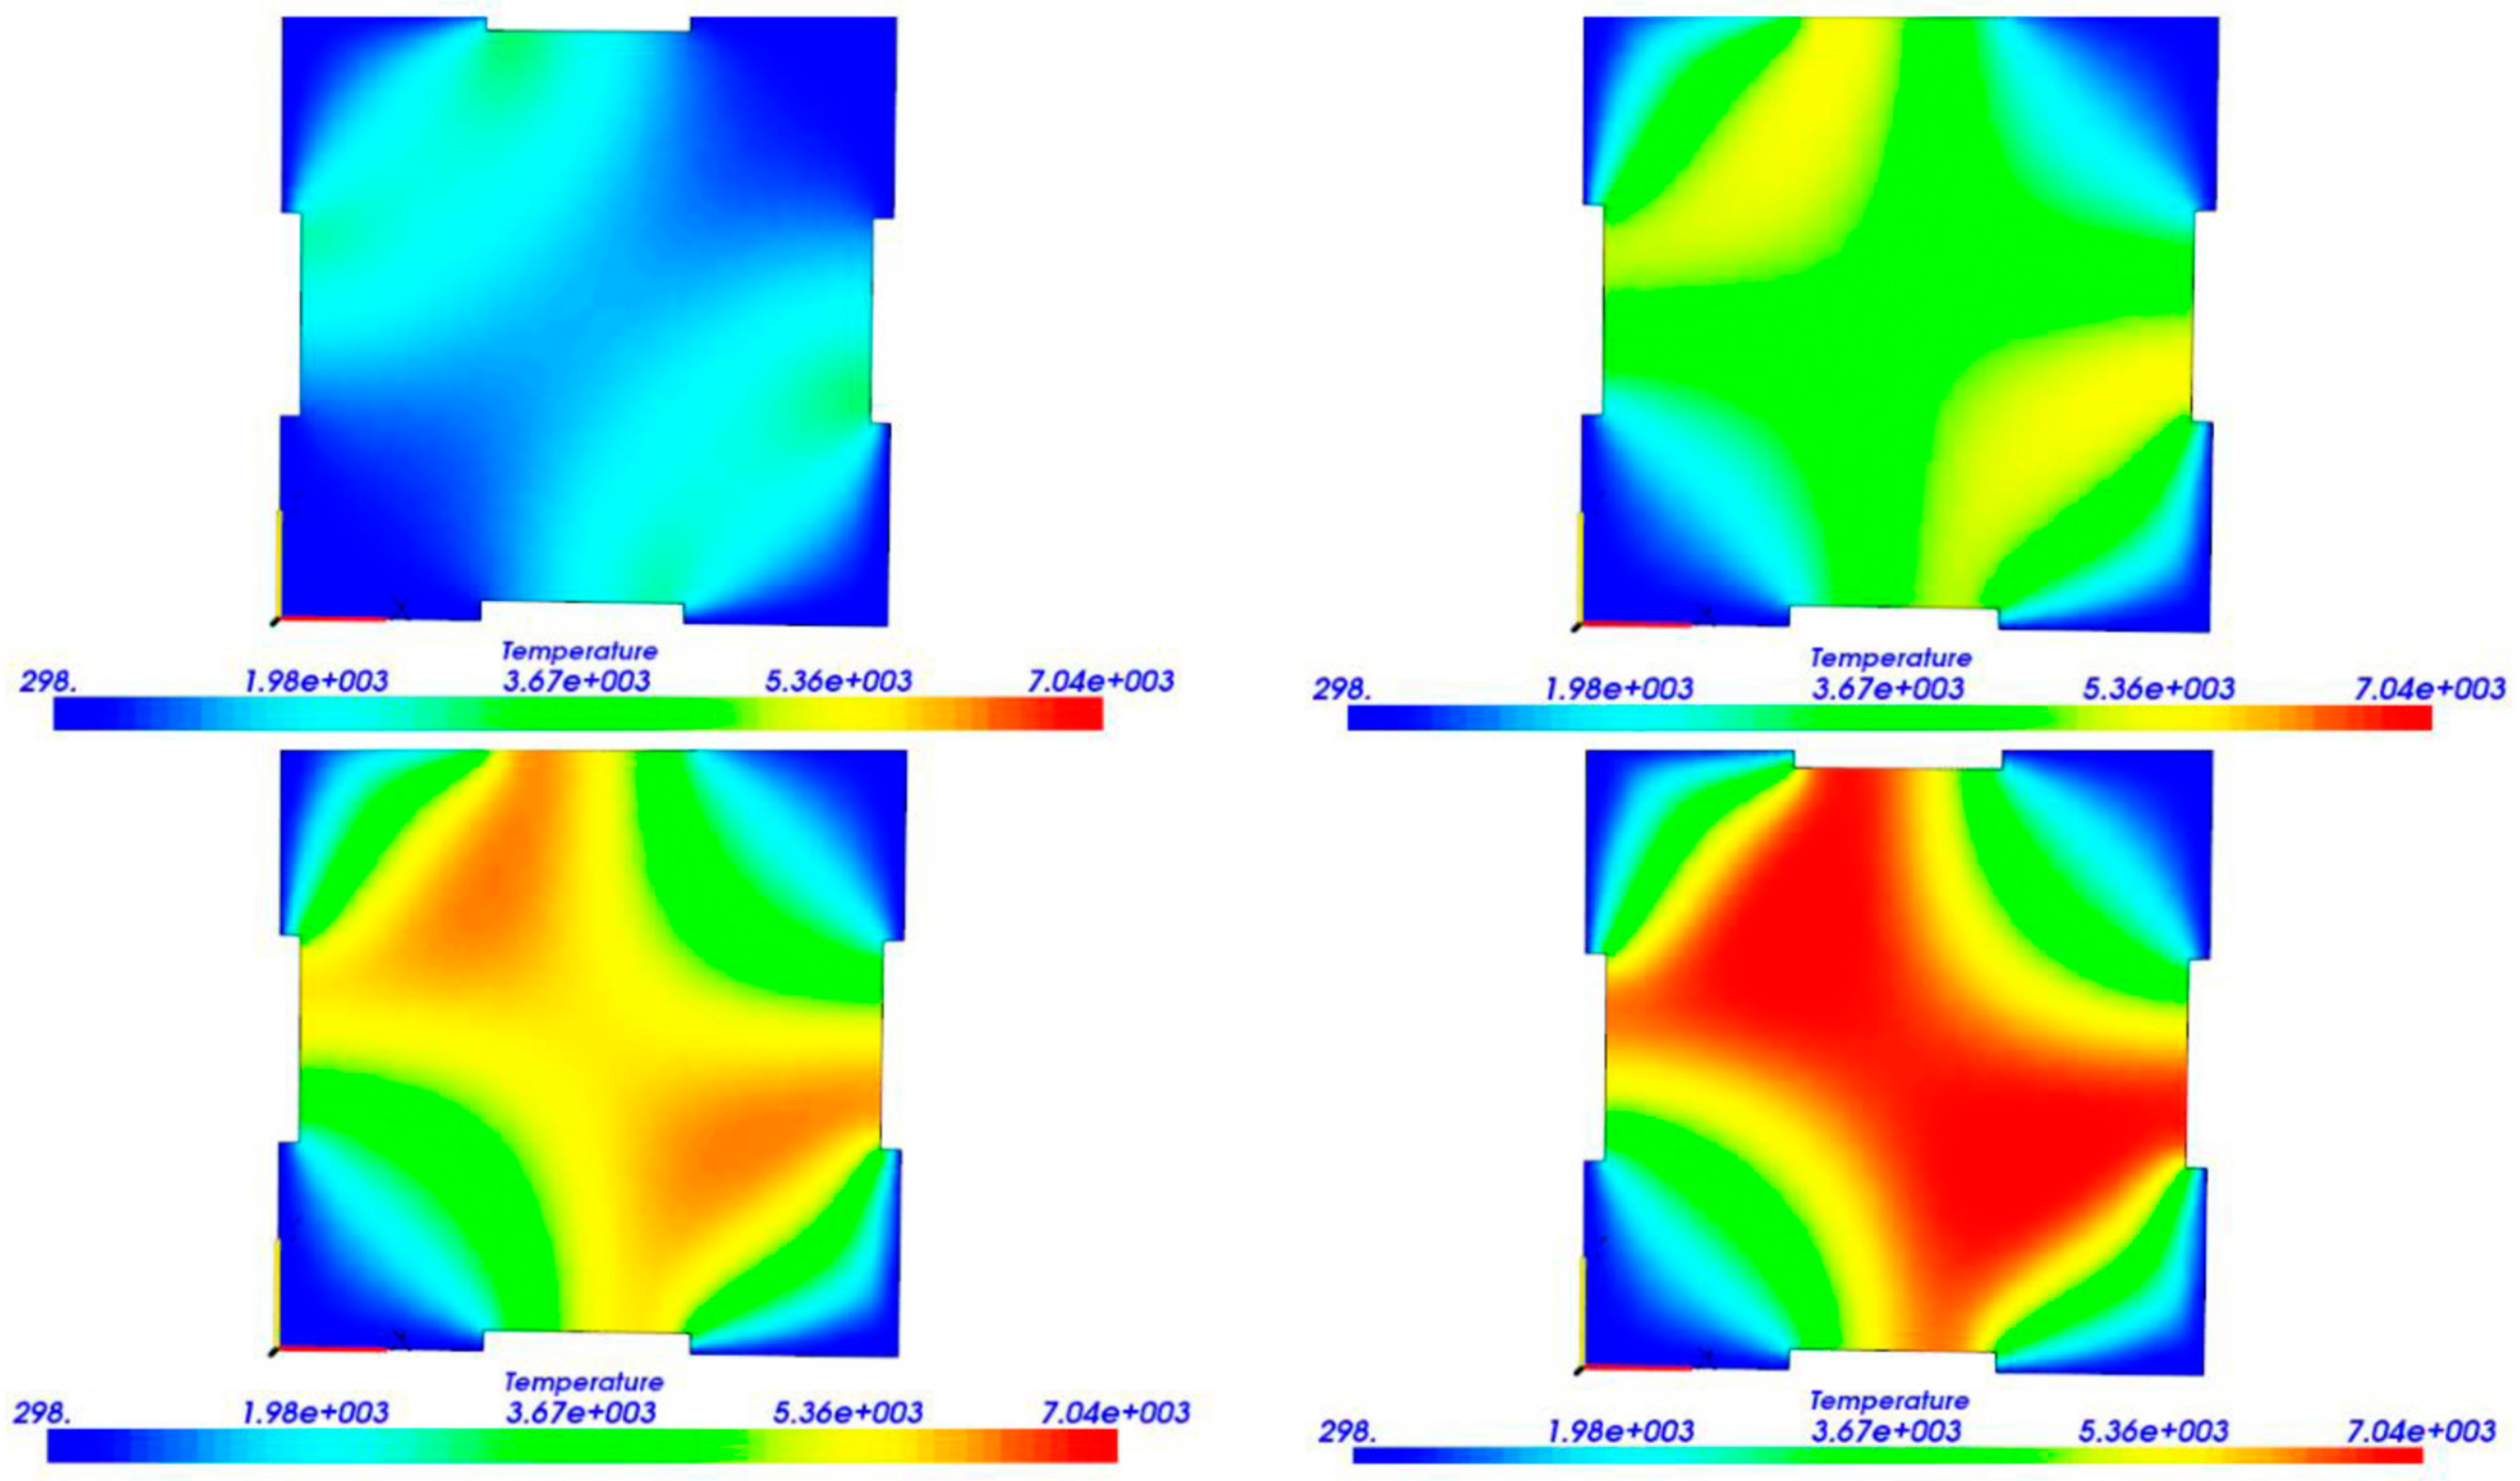
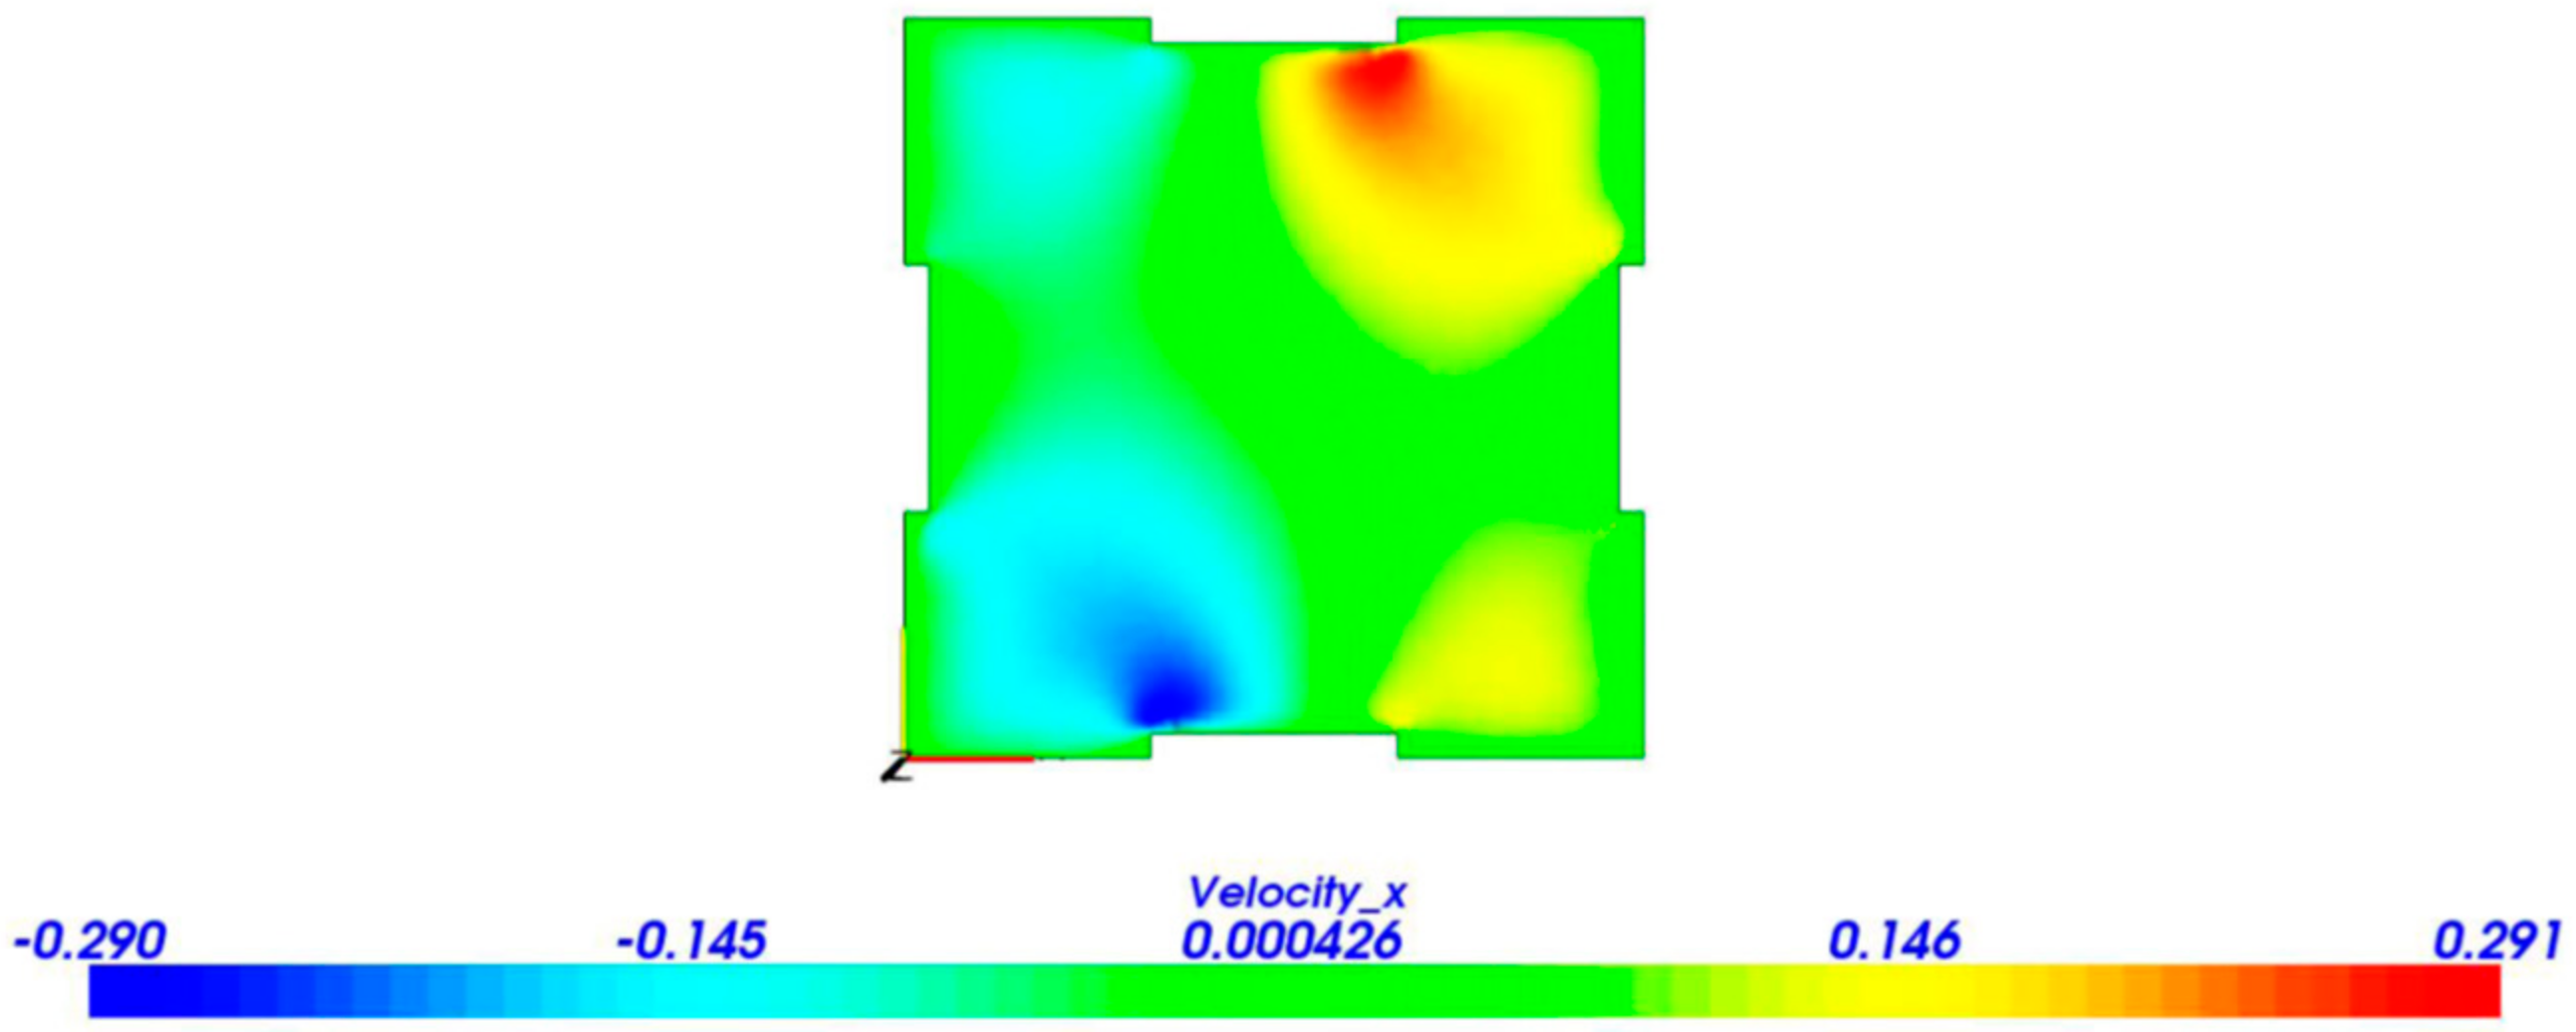
3.1. Simulation
- The terminal and ground are assigned opposite to the electrodes.
- ○
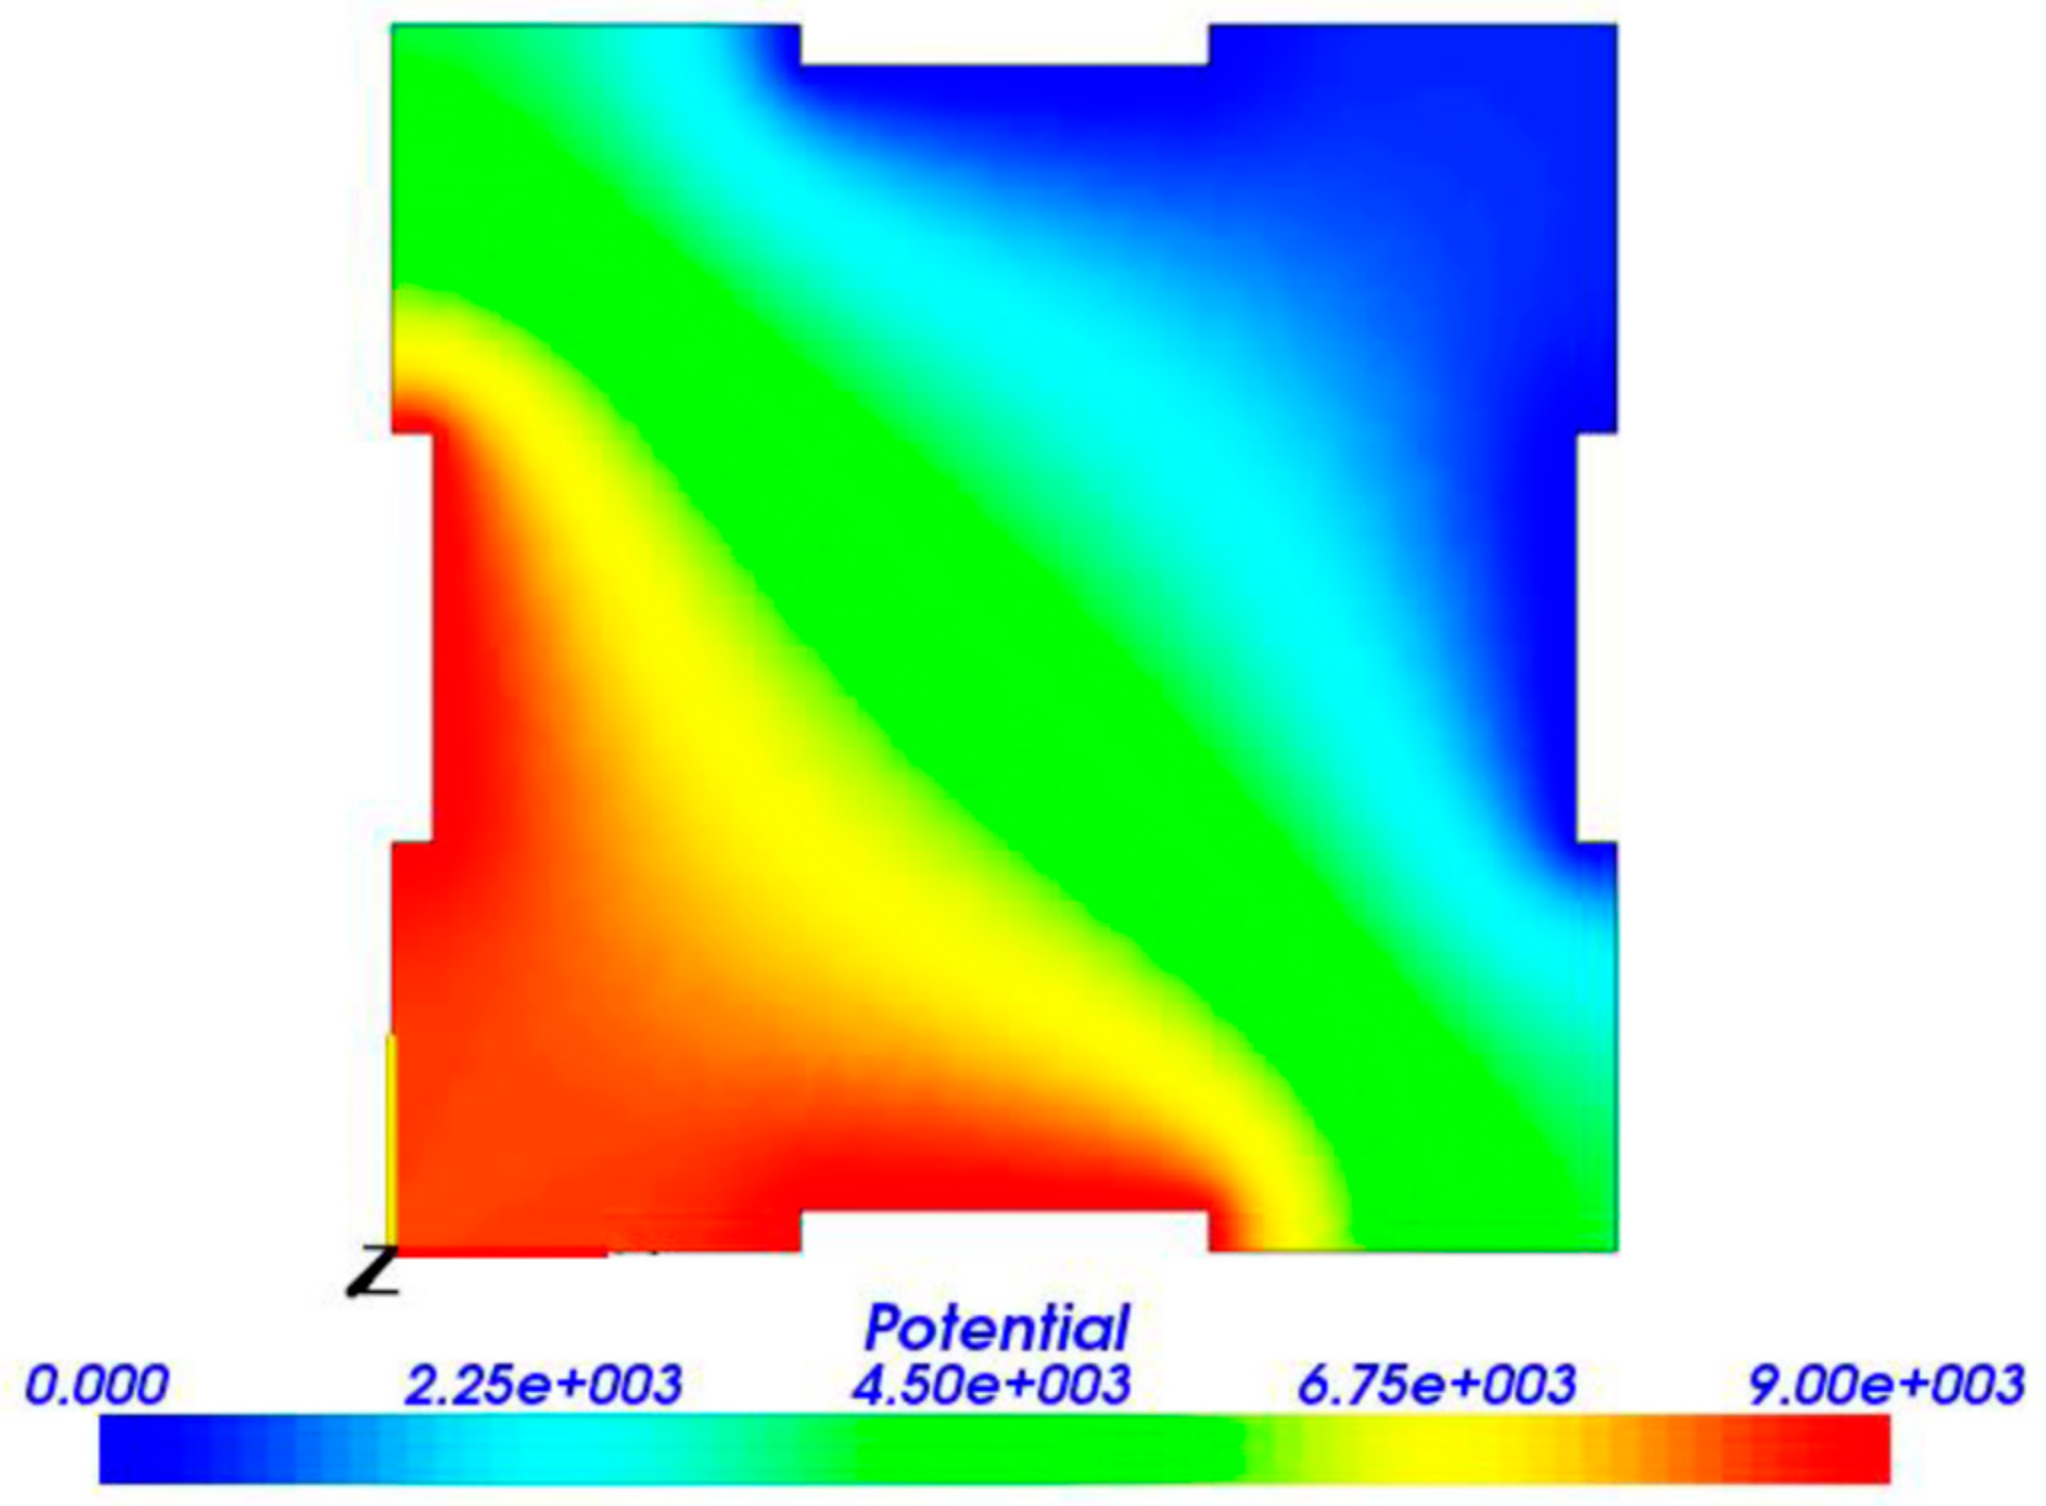
- The electrodes potential difference is 9000 V (+9000 V–0 V).
- The middle is an open gap in which the MHD equations are acted upon.
- No-slip boundary conditions are set for the entire geometry.
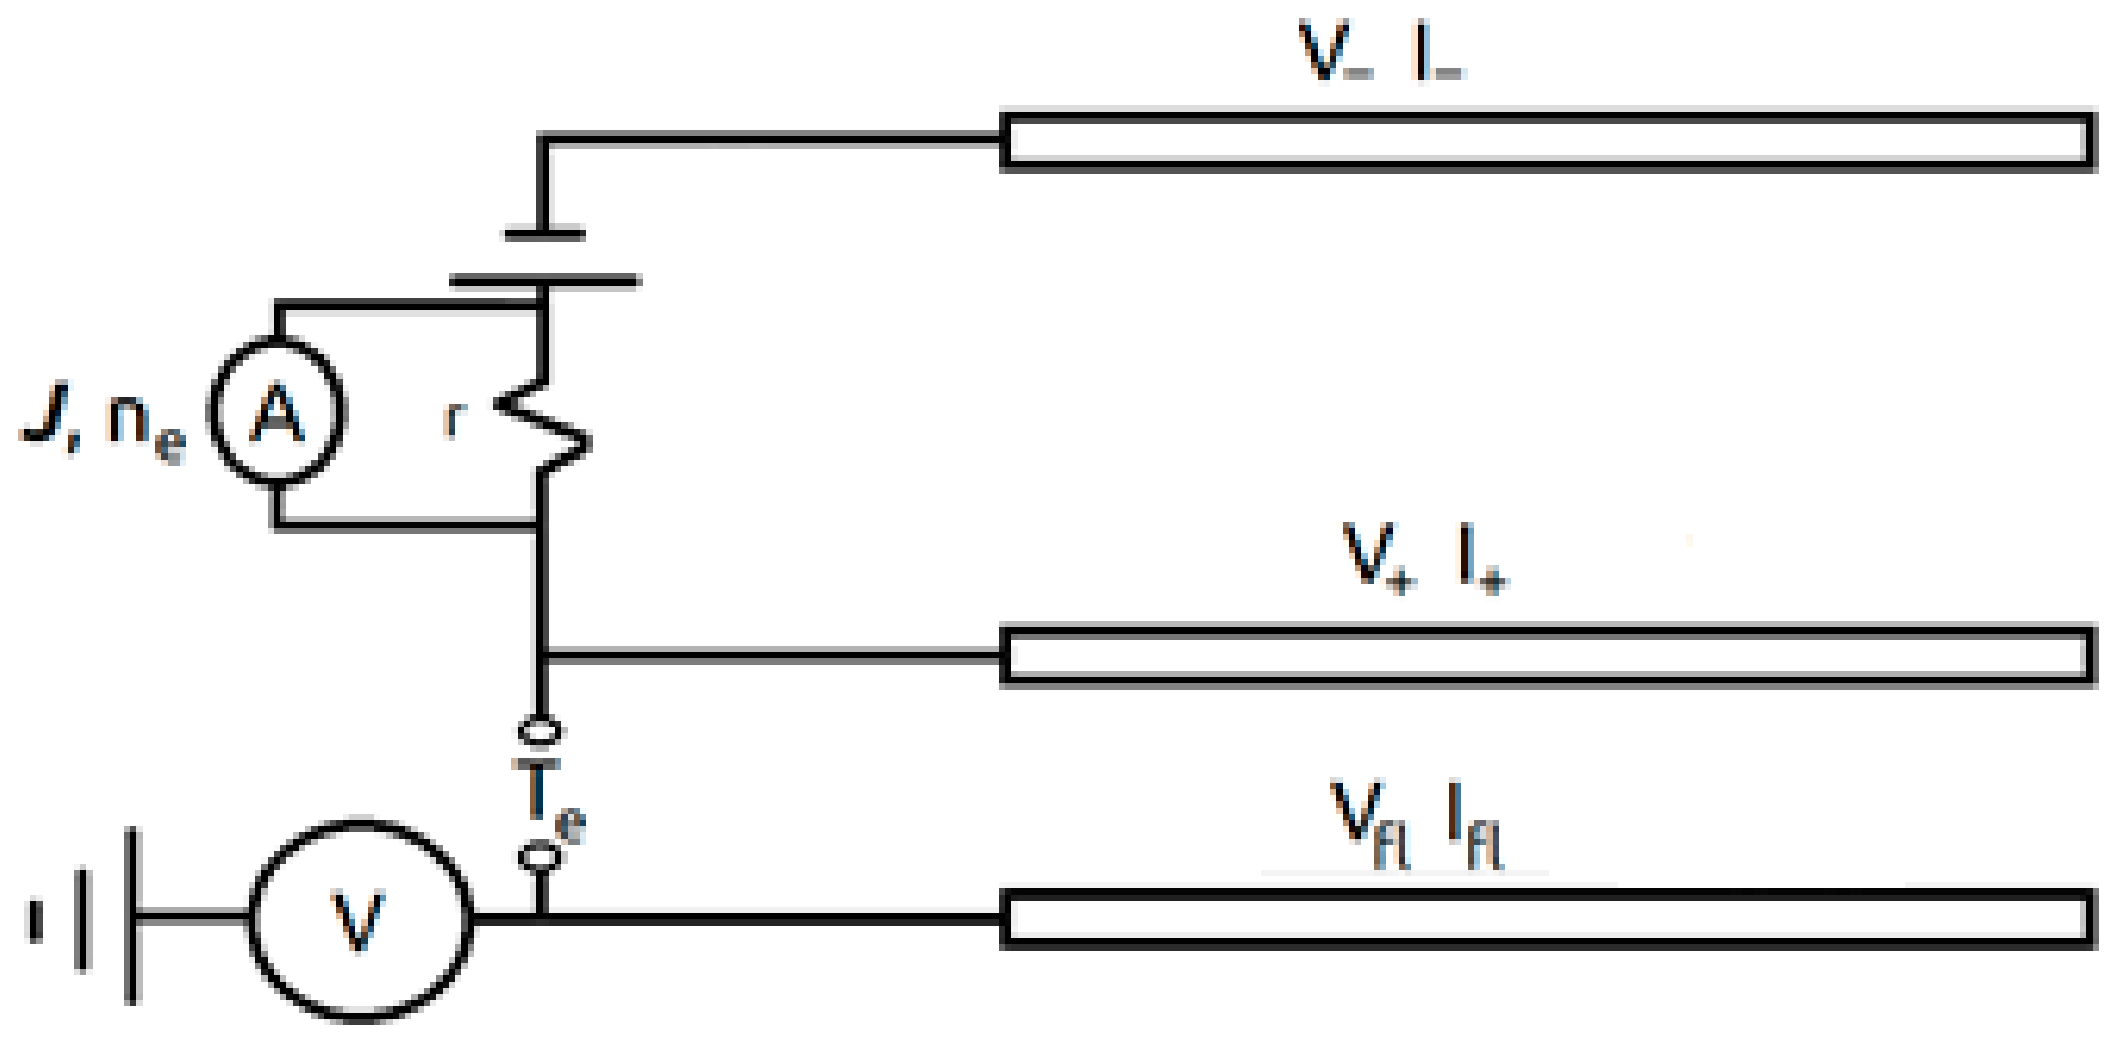
3.2. Diagnostics
3.3. Energy Harvesting
4. Results
4.1. Simulation
4.2. Plasma Diagnostics
4.3. Energy Harvesting
5. Discussion
5.1. Plasma Characteristics
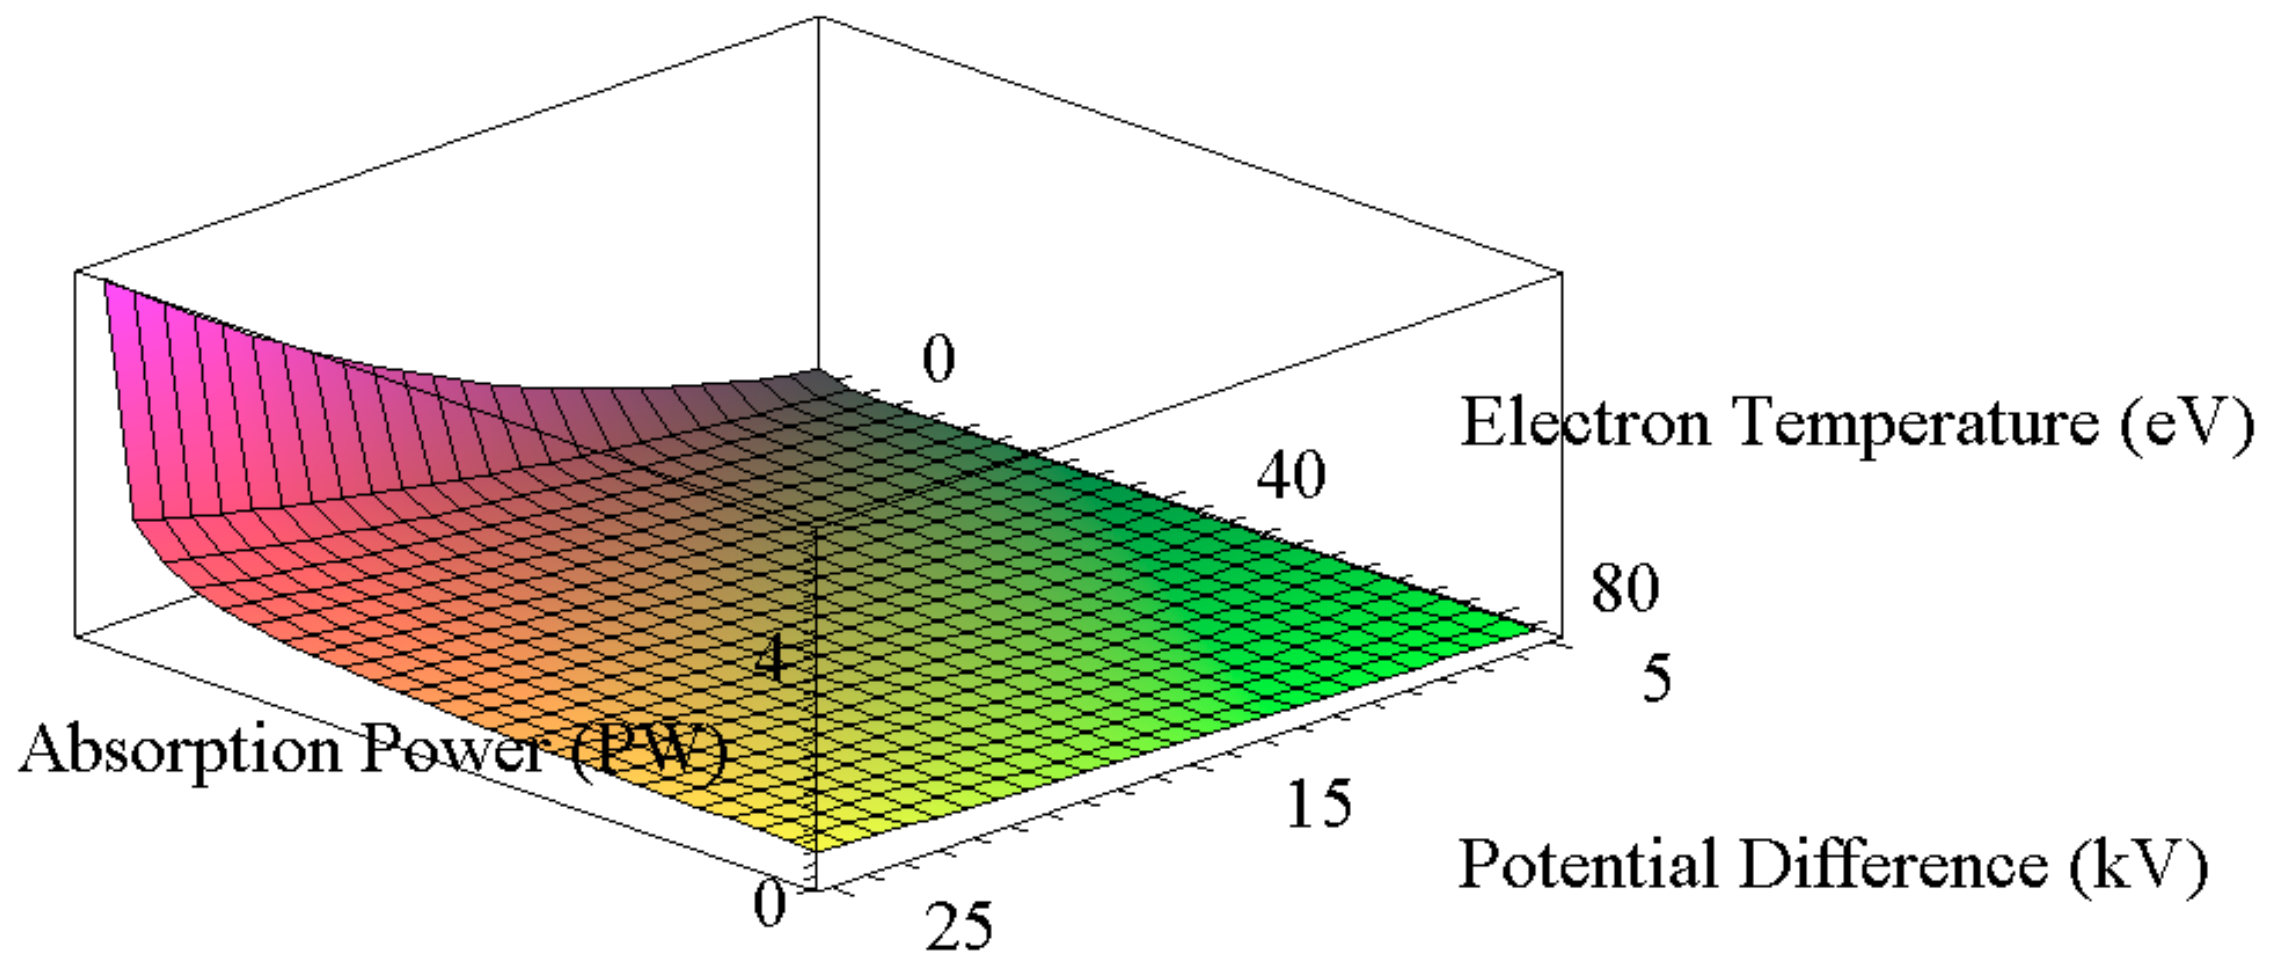
5.2. Extrapolation of the Data
6. Conclusions
Acknowledgments
Author Contributions
Conflicts of Interest
References
- Scarfò, D.; Caiffi, B.; Chersola, D.; Lomonaco, G. A Preliminary Assessment of the Transmutation Potentialities for an ITER-like FW Sector Loaded with MA. Glob. J. Energy Technol. Res. Updates 2015, 2, 56–64. [Google Scholar]
- Panza, F.; Firpo, G.; Lomonaco, G.; Osipenko, M.; Ricco, G.; Ripani, M.; Saracco, P.; Viberti, C.M. A low power ADS for transmutation studies in fast systems. EPJ Nucl. Sci. Technol. 2017, 3, 8. [Google Scholar] [CrossRef]
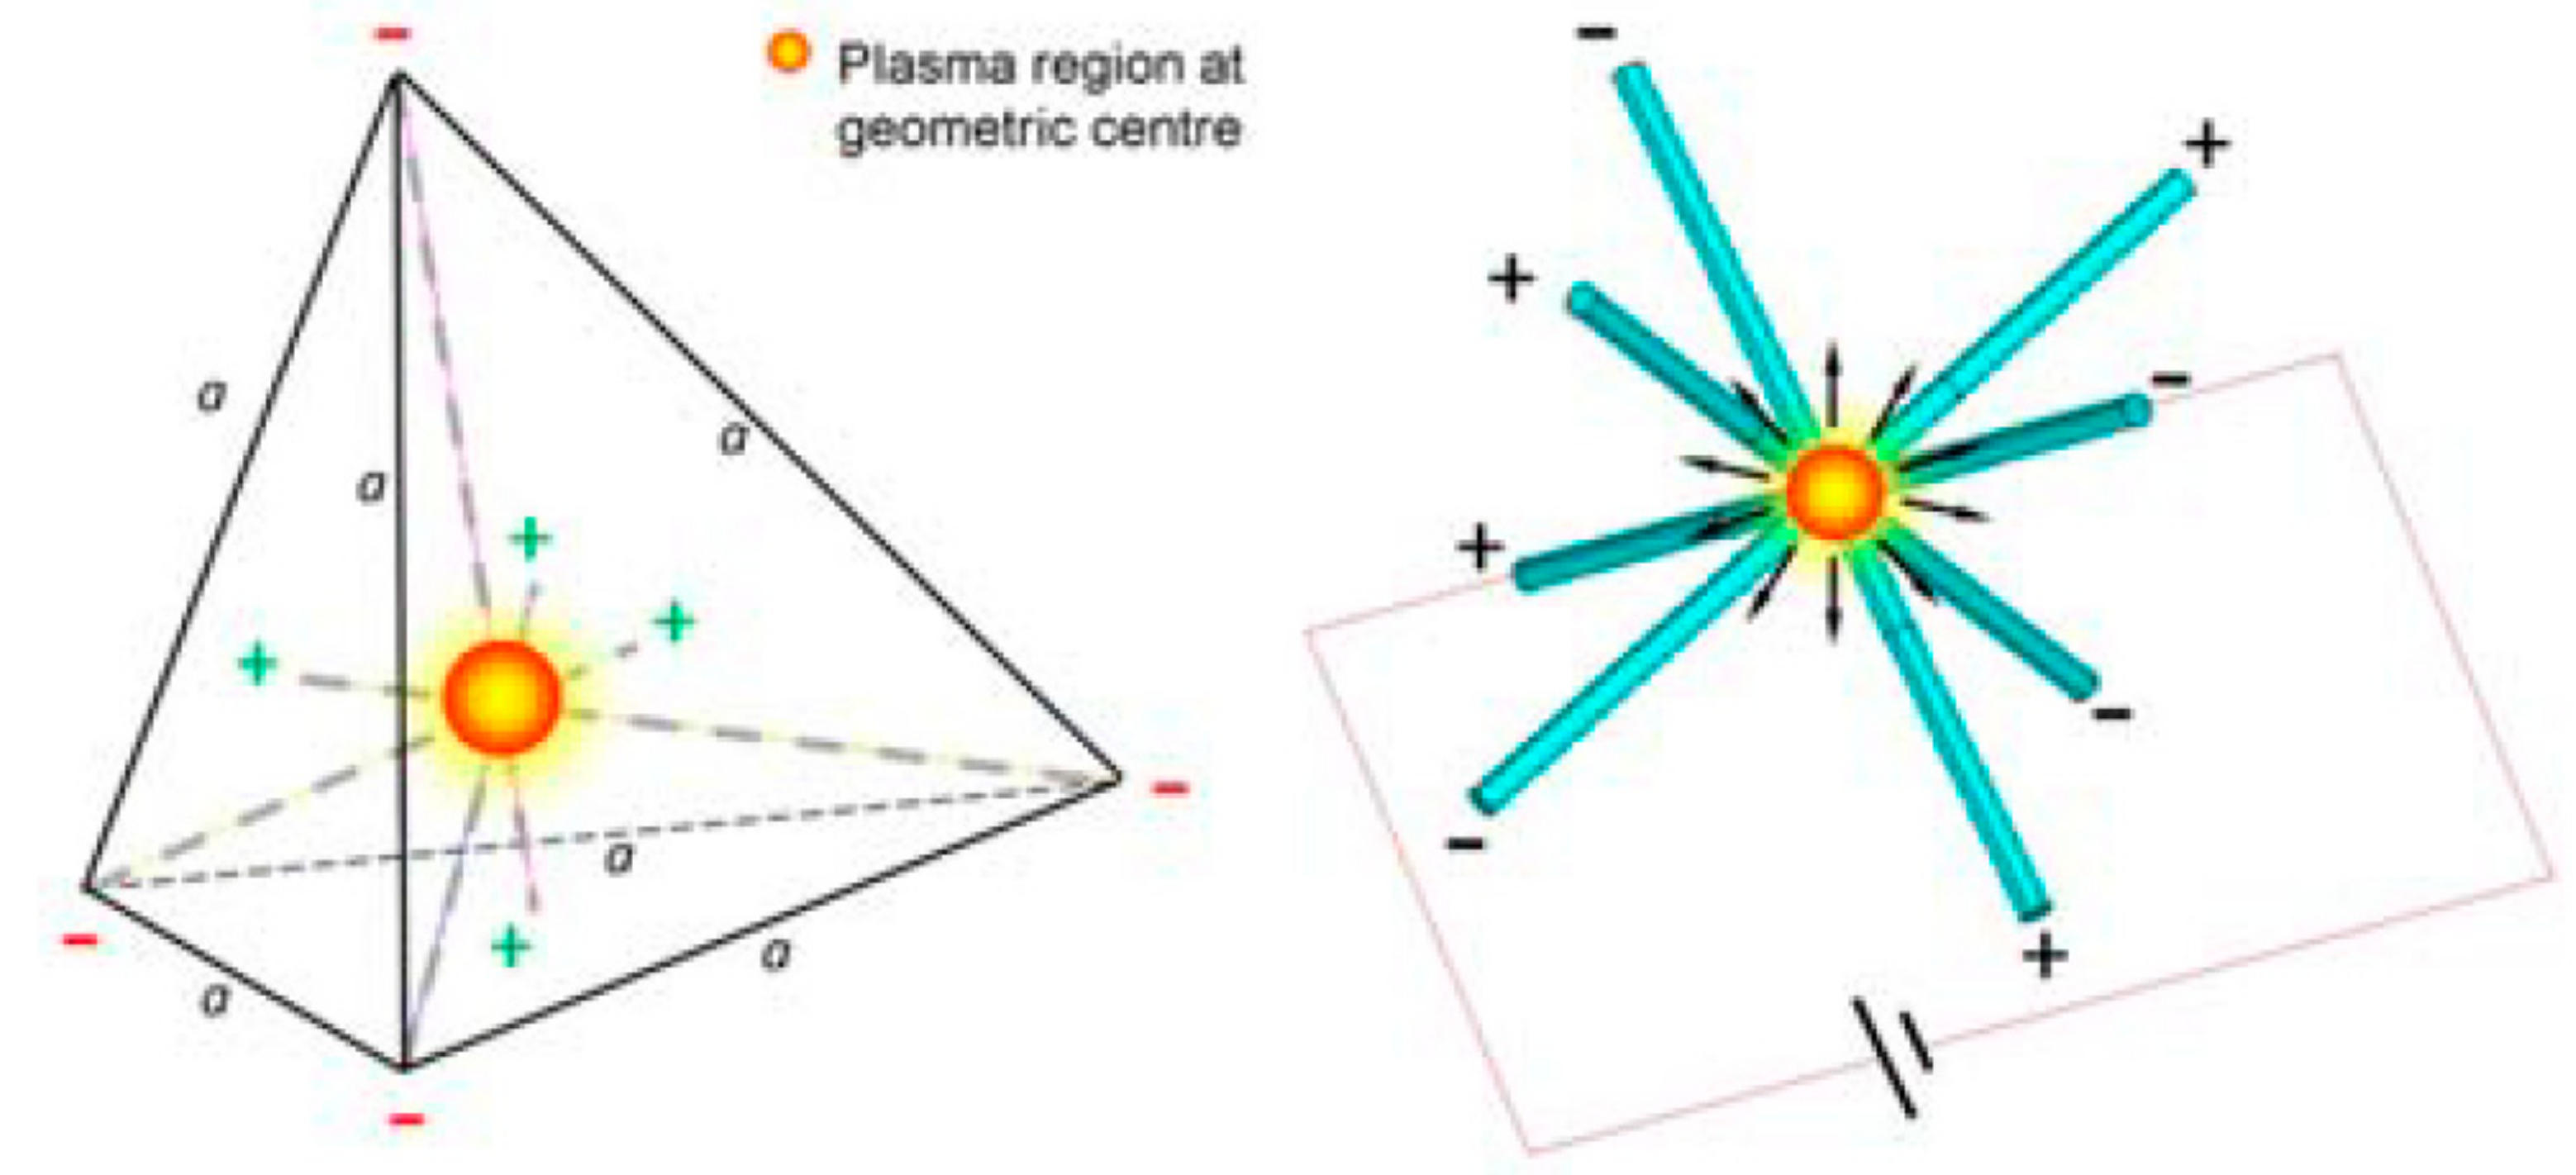
- Zheng, X. Stable Collapse of Plasma Sphere in a Four Beam Configuration; Alcon Canada Inc.: Mississauga, ON, Canada, 2015. [Google Scholar]
- Miao, F.; Zheng, X.; Deng, B. Fusion of Multi-Pinched Plasma Beams Converging with Spatial Symmetry. Plasma Sci. Technol. 2015, 17, 552–559. [Google Scholar] [CrossRef]
- Miao, F.; Zheng, X.; Deng, B. Nuclear Fusion within Extremely Dense Plasma Enhanced by Quantum Particle Waves. Plasma Sci. Technol. 2015, 17, 336–371. [Google Scholar] [CrossRef]
- Miyamoto, K. Fundamentals of Plasma Physics and Controlled Fusion; University of Tokyo: Tokyo, Japan, 2000. [Google Scholar]
- Horowitz, P.; Hill, W. The Art of Electronics; The Press Syndicate of the University of Cambridge: Cambridge, UK, 2001. [Google Scholar]
- Zdzislaw, B. Modern Control Theory; Springer: Berlin, Germany, 2005. [Google Scholar]
- Analytical Methods Committee. Evaluation of analytical instrumentation. Part XVII. Instrumentation for inductively coupled plasma emission spectrometry. Accredit. Qual. Assur. 2005, 10, 155–159. [Google Scholar]
- Baerny, J.K.; Woodruff, S.; Smith, C. Diagnostics for Lab and Astrophysical Plasmas. J. Fusion Energy 2010, 29, 510–516. [Google Scholar] [CrossRef]
- Eckman, R.; Lawrence, B.; Gatsonis, N.A.; Pencil, E.J. Triple Langmuir Probe Measurements in the Plume of a Pulsed Plasma Thruster. J. Power Propuls. 2001, 17, 762–771. [Google Scholar] [CrossRef]
- Principle of Electricity Generation by Photovoltaic Cells. 2007. Available online: http://www.apec-vc.or.jp/e/modules/tinyd00/?id=74 (accessed on 18 June 2016).
- University of Waterloo. “Thermoelectric Introduction”. Available online: http://www.mhtl.uwaterloo.ca/TEC_master.html (accessed on 2 March 2016).
- Dinklage, A.; Klinger, T.; Marx, G.; Schweikhard, L. Plasma Physics; Springer: Berlin/Heidelberg, Germany, 2008. [Google Scholar]
- Langmuir Probe Diagnostics. Available online: http://www.seas.ucla.edu/~ffchen/Publs/Chen210R.pdf (accessed on 5 June 2003).
- Callen, J. Fundamentals of Plasma Physics; Draft: Madison, WI, USA, 2006. [Google Scholar]


| Test Run | Position from Plasma Center (inches) | Orientation |
|---|---|---|
| 1 | 2.5 | Horizontal |
| 2 | 1.5 | Horizontal |
| 3 | 2.5 | Vertical |
| 4 | 1.9 | Vertical |
| Orientation–Position (inches) | Pinch Type | Voltage (mV) | Current (µA) | Power (µW) | Efficiency (%) |
|---|---|---|---|---|---|
| Horizontal–2.50 | Z | 53 | 6 | 0.318 | 1.17 × 10⁻⁷ |
| Horizontal–2.50 | X | 80 | 10 | 0.800 | 2.96 × 10⁻⁷ |
| Horizontal–1.25 | Z | 120 | 20 | 2.400 | 8.88 × 10⁻⁷ |
| Horizontal–1.25 | X | 131 | 30 | 3.930 | 1.45 × 10⁻⁷ |
| Vertical–2.50 | Z | 43 | 8 | 0.344 | 1.27 × 10⁻⁷ |
| Vertical–2.50 | X | 65 | 14 | 0.910 | 3.37 × 10⁻⁷ |
| Vertical–1.90 | Z | 80 | 11 | 0.880 | 3.25 × 10⁻⁷ |
| Vertical–1.90 | X | 100 | 16.5 | 1.650 | 6.11 × 10⁻⁷ |
| Beam Type | Voltage (mV) | Current (µA) | Power (mW) | Efficiency (%) |
|---|---|---|---|---|
| Single Beam–Z-Pinch | 215 | 156 | 33.54 | 0.0124 |
| Double Beam–X-Pinch | 209 | 64.1 | 13.38 | 0.0049 |
© 2018 by the authors. Licensee MDPI, Basel, Switzerland. This article is an open access article distributed under the terms and conditions of the Creative Commons Attribution (CC BY) license (http://creativecommons.org/licenses/by/4.0/).
Share and Cite
A.Gabbar, H.; Stoute, C.A.B.; Bondarenko, D.; Tarsitano, N.; Abdel Rihem, A.; Sirakov, S.; Jani, S.; Menashi, S. X-Pinch Plasma Generation Testing for Neutron Source Development and Nuclear Fusion. Energies 2018, 11, 988. https://doi.org/10.3390/en11040988
A.Gabbar H, Stoute CAB, Bondarenko D, Tarsitano N, Abdel Rihem A, Sirakov S, Jani S, Menashi S. X-Pinch Plasma Generation Testing for Neutron Source Development and Nuclear Fusion. Energies. 2018; 11(4):988. https://doi.org/10.3390/en11040988
Chicago/Turabian StyleA.Gabbar, Hossam, C. A. Barry Stoute, Daniel Bondarenko, Nicholas Tarsitano, Anas Abdel Rihem, Stefan Sirakov, Shraddhey Jani, and Samskruthi Menashi. 2018. "X-Pinch Plasma Generation Testing for Neutron Source Development and Nuclear Fusion" Energies 11, no. 4: 988. https://doi.org/10.3390/en11040988
APA StyleA.Gabbar, H., Stoute, C. A. B., Bondarenko, D., Tarsitano, N., Abdel Rihem, A., Sirakov, S., Jani, S., & Menashi, S. (2018). X-Pinch Plasma Generation Testing for Neutron Source Development and Nuclear Fusion. Energies, 11(4), 988. https://doi.org/10.3390/en11040988