1. Introduction
Cardiovascular diseases have become the cause of the highest percentage of deaths among non-communicable diseases. The death percentage reached 46.2% according to report from the World Health Organization (WHO) in its Global Status Report on Non-communicable Diseases 2014 [
1]. The chances of cardiovascular disease are enhanced by a high heart rate [
2], and are preventable by periodic monitoring [
1].
One of the methods for measuring heart rate is PPG. PPG itself is a simple and non-invasive optical technique that can be used to measure blood volume pulse (BVP) through variations in transmitted or reflected light on the skin surface [
3]. Through BVP, physiological signals such as HR, heart rate variability (HRV), and cardiorespiratory synchrony (CSR) are attainable [
4]. PPG, conventionally, requires physical contact between the subject to be measured and the sensors, and these kinds of contact-based methods may cause undesirable skin irritation, discomfort and soreness to the subject [
5,
6].
Non-contact PPG have recently been developed in order to overcome the drawbacks of conventional methods. Some advanced technologies have been developed for non-contact methods such as microwave Doppler radar, laser Doppler, ultra-wideband radar, etc. [
7,
8,
9,
10]. Those technologies are relatively expensive because they require special hardware. As an alternative, a technology, which is low-cost and convenient, has been developed, i.e., non-contact PPG through digital cameras [
11,
12,
13,
14,
15]. Many methods have been developed to filter the noise from non-contact PPG through cameras. Among of those technologies, one of the arguably most popular methods is based on ICA [
16,
17,
18,
19]. The ICA-based method does not have accurate criteria for determining which component is BVP. The ICA-based method also has computational complexity. Thus, we have developed a method for non-contact PPG by using SVD which can give criteria based on power in singular values and a simple computational system. Moreover, we improve the frequency estimation by implementing Burg’s algorithm. In order to test the robustness of our method, we conducted experiments under various distance and light conditions.
2. BVP Extraction and HR Quantification
To extract BVP signals, first, we adopted a technique from Poh [
18] for detecting face using the Viola-Jones method [
20], separating signals into red, green, and blue (RGB) signals, de-trending signals using a procedure based on a smoothness priors [
21], and normalizing using a standard score. The region of interest (ROI) of our system is the centre 75% width and 90% height of the whole face image. After those preliminary filters, we applied our method using SVD and Burg. We applied SVD for doing blind signal separation (BSS) and select components for the next process based on the strength of energy in singular values [
22]. We selected components which have eigenvectors that correspond with middle level of strength of singular values that has been decomposed by SVD when doing BSS. The overall process on our system can be seen in
Figure 1.
To do the BSS using SVD, first, we calculated the “scrambled” covariance matrix of the normalized RGB signals as follows:
where
C is the covariance matrix of mixed RGB signals,
is the mean vector of mixed RGB signals, and
are the normalized blue, green, and red signals, respectively. The covariance matrix will be 3 × 3. Eigenvalues of this “scrambled” covariance matrix match the eigenvalues of the true covariance matrix. The “true” eigenvectors can be easily calculated from the eigenvectors in order to get the desired principal component (PC) [
23]. Then, we performed SVD toward the covariance matrix so that we got matrix of singular value
S, right
U and left
UT singular vector of the covariance matrix
C as follows:
In this case matrix of right singular vector from SVD is the same as the transposed matrix of the left singular vector due to the fact the covariance matrix is symmetric and positive definite (if the covariance matrix is full rank) or semi-definite if it is rank deficient. Next, we have to select an eigenvector from a columns of
U that has middle level of energy in
S as PC basis. The selected eigenvector
uk is used for dimensionality reduction so that the BVP
s(
t) could be retrieved. That dimensionality reduction equation can be seen in (3):
To improve the frequency estimation for heart rate measurements, we used the Burg algorithm [
24]. The main advantages of the Burg algorithm is in resolving closely spaced sinusoids in signals with low noise levels, and estimating short data records, in which case the power spectral density estimates are very close to the true values. Moreover, the Burg method ensures a stable autoregressive model and is computationally efficient. Using the Burg algorithm for signal model coefficients, we forward extrapolated
s(
t) to get the next signal data
sf(
t + 1). We reiterated the extrapolation until we have gotten
sf(
t + T
f). We also backward extrapolated
s(
t) to retrieve the backward signal data
sb(T
b). This step was reiterated too until the signal data
sb(1) is achieved. The extrapolated data are added to the signal
s(
t) thus we got the extrapolated signal as follows:
where time
t = 1, 2, …T
b + T + T
f is sequence of time in second after extrapolation; T
b is maximum time of backward extrapolation; T
f is maximum time of forward extrapolation.
To quantize the power density and the HR, we used a fast Fourier transformation (FFT). We set the bandwidth between 0.75 and 4 Hz. The highest power spectra
fPSpeak in that frequency range corresponds to the HR measurements. The calculation of the HR is as in (5):
4. Results
A typical example of extraction from all of the PCs can be seen on
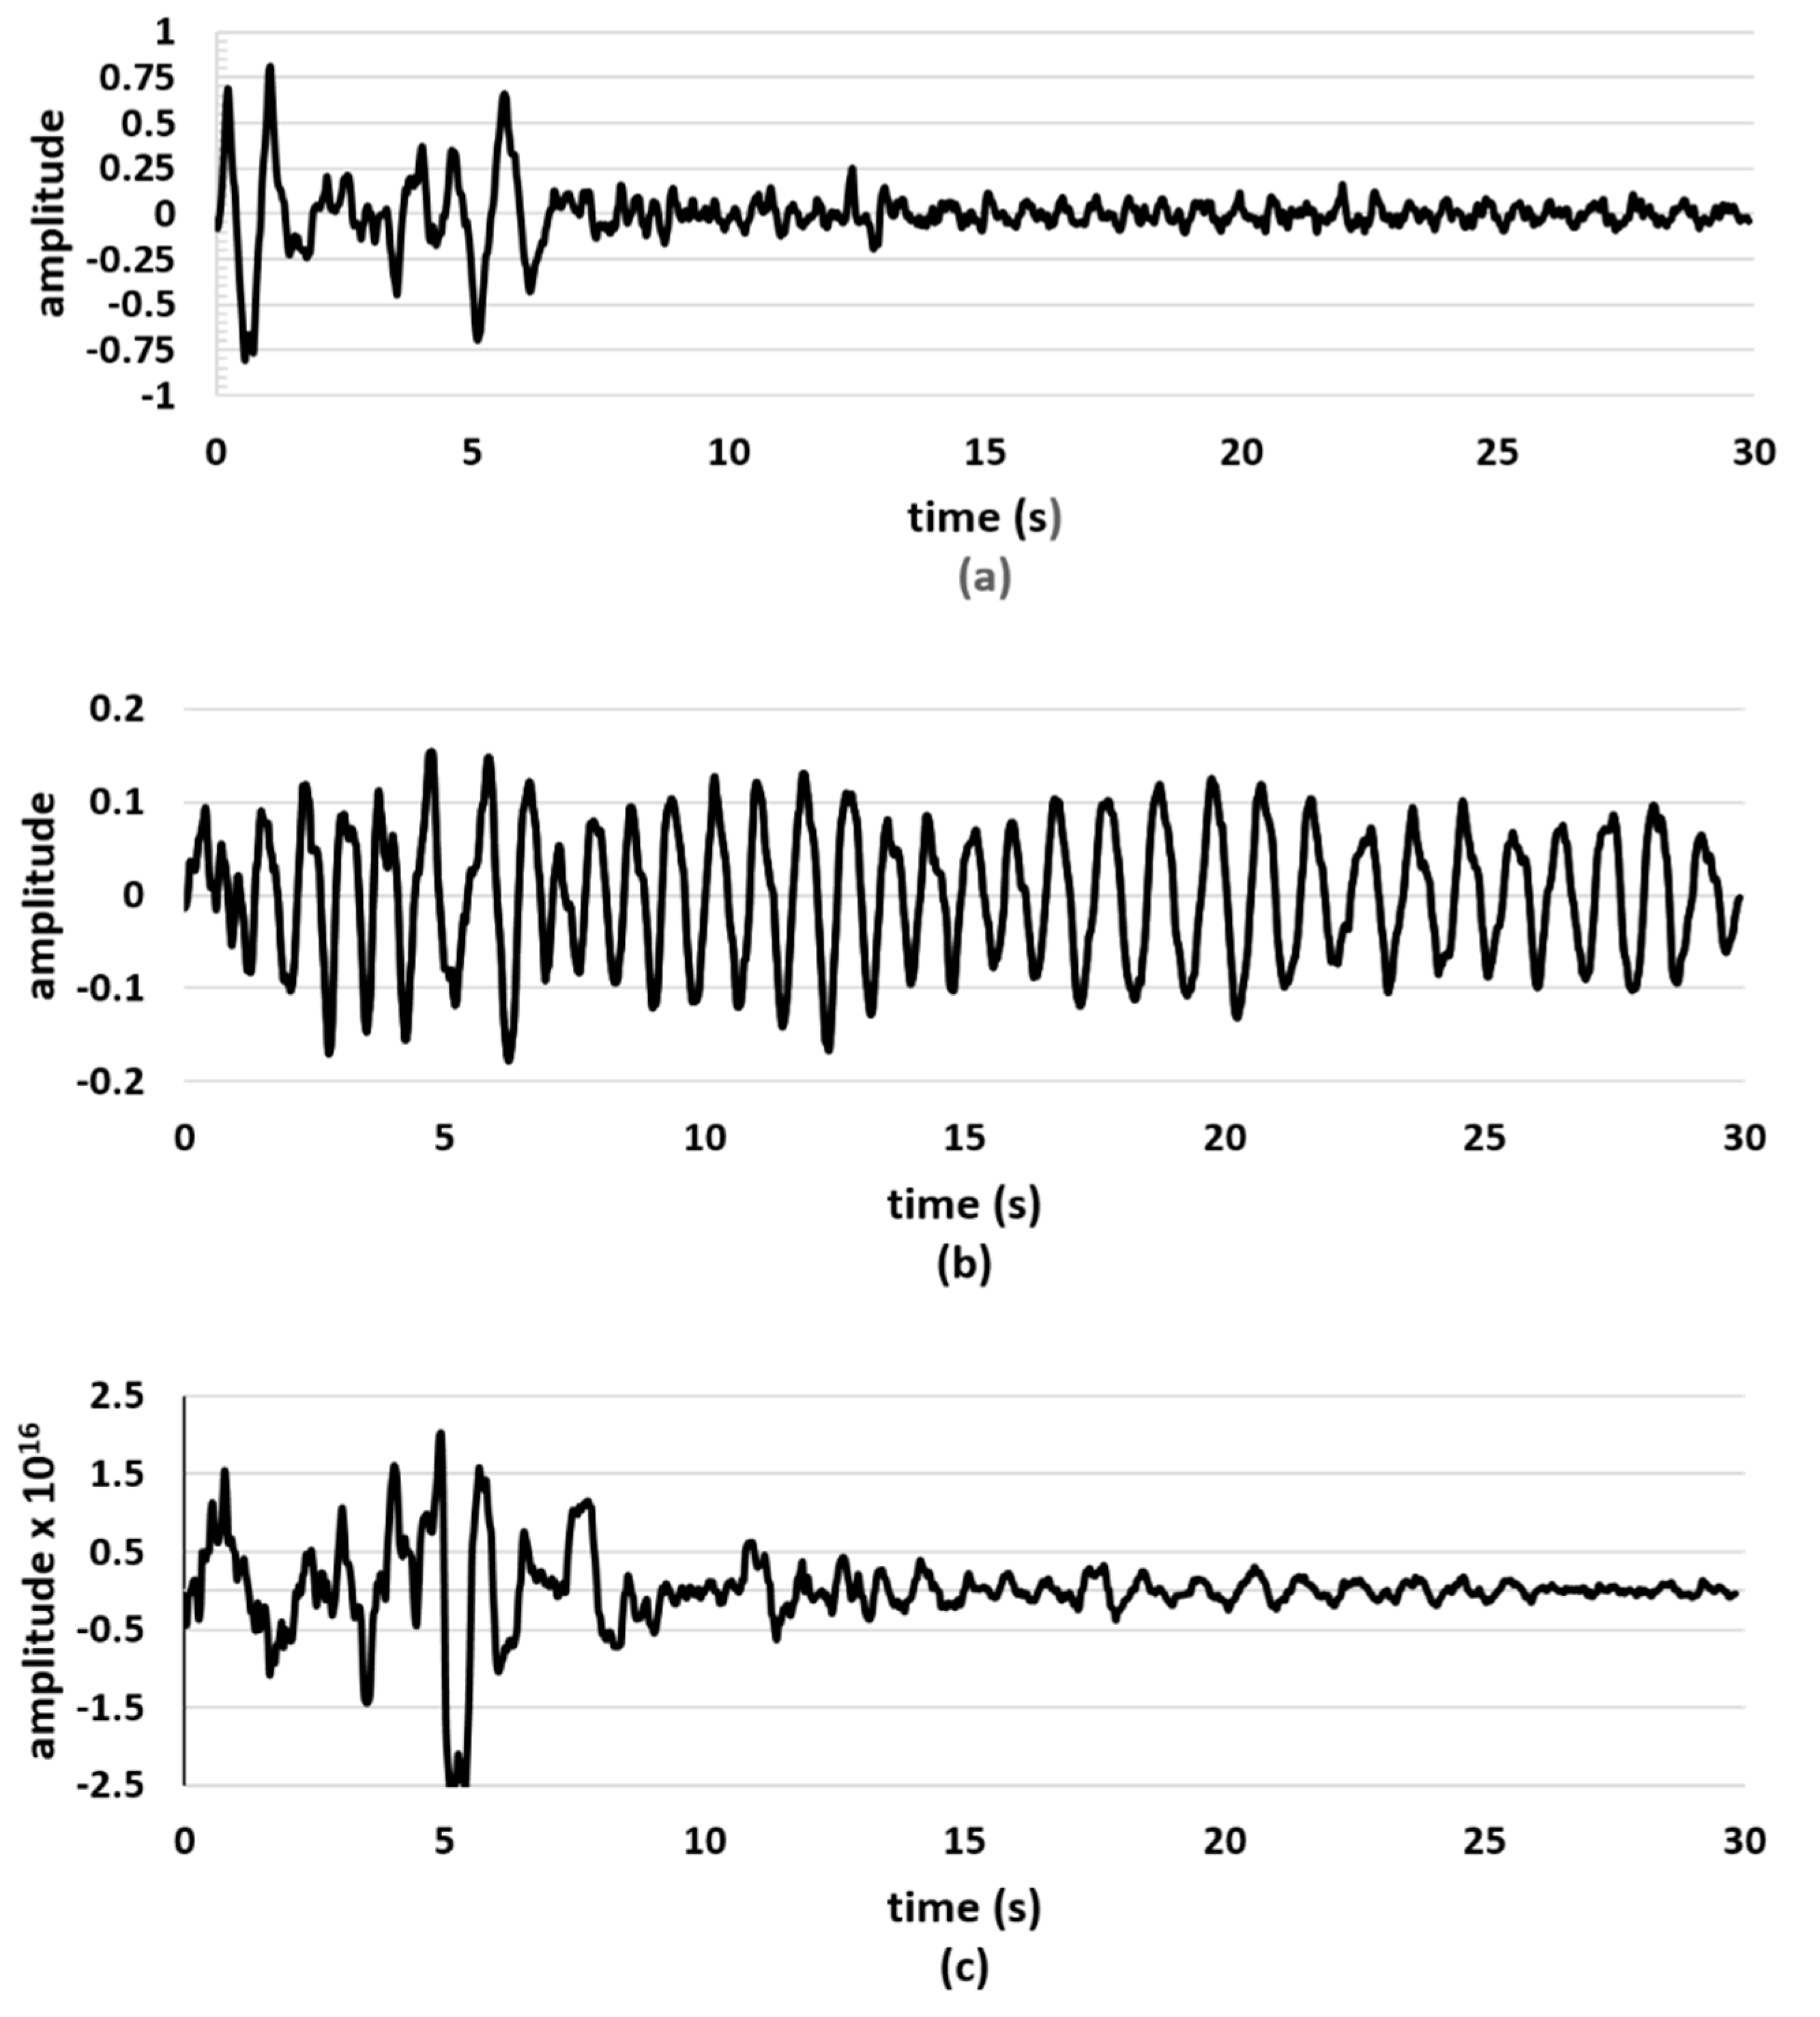
Figure 3. The typical signal resulting from the first PC shows its graph had the highest amplitude among the others.
The first PC had high variance data. The graph of a typical second PC, showed a smooth wave form and had a wave form closer to a conventional PPG wave form. It was also the most rippleless among the others. The last typical PC graph had an appearance that contains high variance and many ripples in its signal. It also had feeble amplitude so that we needed to rescale its signal. These typical third PCs were scaled 1016 times bigger so that the signal was visible. It was evident that only one component is suitable for further processing and analysis in our system. The suitable component was none other than the second component.
From
Figure 4, the measurement accuracy under light intensity around 5, 50, 550, 1000, 2000 lux (from underexposure to overexposure) with various distances between 30 until 110 cm can be observed. Most of the graphic shapes resulting from both the proposed method and previous works showed congruent shapes to each other but with different levels of accuracy and/or phase.
Error measurement in light intensity around 5 lux has the lowest error level at a distance around 50 cm for our proposed method and 70 cm for the ICA method. The error peak under this light condition was at a distance around 70 cm for our method and 90 cm for the ICA method. After the error peak had been reached, the error level started to decline for both methods. Mean error under this light condition is 2.48 bpm for the proposed method and 3.34 bpm for the previous method.
A unique case happened in the measurement with light intensity around 50 lux. Both of the methods show the lowest error at a distance of 90 cm. The highest error occurred at a distance around 30 cm for the ICA method, and 70 cm for our proposed method. The average error in this light condition is approximately 1.97 bpm for the proposed and 3 bpm for the previous method.
Errors of our proposed method at a light intensity around 550 lux are lower than the ICA method for all distances. The lowest error for both methods occurred at distance around 50 cm. The highest error occurred at distance around 90 cm for the proposed method. For the ICA method has highest error was at a distance around 70 cm and after that the error level declined first and then rose again after exceeding a distance around 90 cm. The error rate at a light intensity of 550 lux for our proposed method is 1.63 bpm and for the previous method it is 3.34 bpm.
After increasing the light intensity almost two-fold more than before (around 1000 lux), the error rate greatly increased in the previous method at distances around 70~90 cm while the results of our proposed method were relatively the same regardless of the changes. The lowest error in this light intensity is found at a distance 50 cm again. Our proposed method has an average error around 1.71 bpm and the other has an average error around 3.68 bpm at a light intensity around 1000 lux.
For the last experiment, we used high intensity of light around 2000 lux. At this light intensity, the results showed the highest error rate among all other light intensities. The previous method’s results show the highest peak error at a distance around 90 cm with an error rate of 5.31 bpm. The peak error for our proposed method at this light intensity occurred at the same distance and the error rate increased as well but not significant. The error rate of our proposed method is 2.94 bpm for a light intensity of 2000 lux. At this light intensity both methods have lowest error at the same distance, 70 cm.
Table 1 summarizes the results.
5. Discussion
In our proposed method, we applied SVD for doing analysis of PC and denoising the selected PC with an adaptive filter. We got three PCs by applying SVD for the PCA process due to fact the number of input signals (the RGB signals) from the digital camera was three. The covariance matrix size of the input signals was 3 × 3, and by applying SVD toward it we got three singular values, which mean we got three PCs.
The singular value indicates the strength of energy of each PC. A sequence of singular values appears in the diagonal of its matrix produced based on its strength value, from high to low. We selected only one PC for further processing and analysis based on the strength of the PC. We did not select the last weakest PC, due to a well-known fact that noise is produced in the last singular values [
25]. It also was proved by our typical PC extraction result in
Figure 4c. Usually, the desired underlying PC is the PC with the strongest singular value but, in our case it was different. The first PC, the strongest, did not represent the PPG wave form, as the wave form was still similar to noise but with higher amplitudes (see
Figure 4a). This possibly happened due to motion artifacts in the facial video images such as eye blinks, lip movements, small head tilts, that have a stronger influence than cardiac circulation, which was affecting the RGB discoloration on the skin. Thus, the only choice for us was selecting the PC with a middle level of strength. It was proved by our typical results that the second PC is the one that has a typical PPG wave form (see
Figure 4b).
In most of the cases, our proposed method based on SVD outperformed the previous method based on ICA. It can be seen on the
Figure 4 that most of the error lines of proposed method under various conditions are below the error lines of the previous method. It can be seen also in
Table 1, that the statistical parameter errors of our proposed method is lower than that of the previous method.
There are several explanations for this circumstance. First, the selection of components in the previous method, ICA, was not effective. By applying ICA, the extracted components will be in random order [
26]. The criterion used in the selection was based on the highest power of the spectrum within an operational frequency band (45–240 bpm) [
17].
To our knowledge, that criterion was not suitable since the component which has the highest power spectrum does not always represent the BVP. Meanwhile our method has a criterion based on the strength of a singular value that decomposed by SVD can be an indicator of BVP, noises, and other artifacts, which have different levels of influence on the recorded signals. The other reason that makes our proposed method have lower error was that our proposed method contains an adaptive SVD filter for noise cancelation structure, so if there is still noise attached to the BVP, it can be reduced. This was proved on
Figure 4d,e, which correspond to a light intensity under overexposure conditions, where the error in our proposed method fluctuated slightly while the previous work has a relatively big alteration.
By applying the Burg algorithm, the accuracy of heart rate estimation increased. This is possible because using the Burg algorithm has advantages for resolving closed spaced sinusoids in signals with low noise level, in which the SVD and the preliminary filters had made the noise level of PPG signal lower. The Burg algorithm has another advantage for estimating short data records, in which case the power spectral density estimates are very close to the true values. Not only does it increase the precision of frequency estimation but the Burg algorithm also reduces the noise, especially white Gaussian noise [
24].
Measurements under various distance and light intensity generated nonlinear errors. It happened to both our proposed and the previous method. The nonlinearity of error in various conditions can be seen in
Figure 4. This possibly happened because of the absorbance relation of human hemoglobin toward the wavelength of light is nonlinear according to the Beer-Lambert law. Thus, measurements with different distances and light intensity could affected the fluctuance of the accuracy, which results in a nonlinear error waveform.
In performance observations based on light intensity, we found the top error under the highest and lowest light intensity setup. The highest error rates for both methods were found under high intensity of light, 2000 lux. Normally the performances should increase in accordance to the increase of the light intensity, however, a light intensity which is too bright (overexposure) might reduce the quality of the picture that is taken from the camera. Thus, the noise caused by the light might increase. The next highest error rate could be found in low light intensity, 5 lux. This phenomenon likely happened due to the measurements occurred under conditions which made the discoloration of RGB feebler, so the extraction of BVP has lower quality.
Our performance observations based on the distances, found that the lowest performance occurred in the setup which camera was the closest space to the user. Statistically, the mode that has lowest error for both methods is at distance around 50 cm. This most likely happened due to the fact the digital camera could take clearer images along with the RGB discoloration, thus making the error lower. However, logically if the distance between the camera and the user is too far, it might decrease the performance level because the quality of the images might be reduced.
6. Conclusions
In the measurements under various conditions, we determined the most effective distance and light intensity for measurement. Based on the error of our result, the effective distance of measurement was at around 50 cm. Light with medium intensity, around 550 lux, showed the smallest error rates. In a real application, the exact value of light intensity and distance for measurement can be different. The main point is our system can work better under ambient light illumination (not too bright or dark) and under fair distance where the face of the user is attainable by the camera or sensor.
Our proposed method using SVD and the Burg algorithm generally was able to surpass the previous method based on ICA for BVP extraction. The error rates of our method were lower than the previous method for various distances and light intensities. The Pearson correlation coefficient of our proposed method in overall measurements was higher than that of the previous method. While our method provided encouraging results, we expect in the future to improve the system and test it under challenging situation (e.g., dynamic physical movement, some more various skin color of the participants, and dynamic change of illumination). We are also planning to develop an adaptive filter to reduce error rates under various challenging conditions. Thus, the error rates on various conditions could be reduced, and cleaner BVP can be achieved.


