Assessment of the Potential of Energy Extracted from Waves and Wind to Supply Offshore Oil Platforms Operating in the Gulf of Mexico

1
Environmental Engineering Department, Texas A&M University-Kingsville, Kingsville, TX 78363, USA
2
Mechanical and Industrial Engineering Department, Texas A&M University-Kingsville, Kingsville, TX 78363, USA
*
Author to whom correspondence should be addressed.
Energies 2018, 11(5), 1084; https://doi.org/10.3390/en11051084
Submission received: 19 March 2018
/
Revised: 10 April 2018
/
Accepted: 24 April 2018
/
Published: 27 April 2018
(This article belongs to the Special Issue Wave Energy Potential, Behavior and Extraction)
Abstract
:Offshore oil platforms operate with independent electrical systems using gas turbines to generate their own electricity. However, gas turbines operate very inefficiently under the variable offshore conditions, increasing fuel costs and air pollutant emissions. This paper focused on investigating the feasibility of implementing a hybrid electricity supply system for offshore oil platforms in the Gulf of Mexico, both for the United States and Mexico Exclusive Economic Zones. Geographic Information Systems methodologies were used to analyze the data from various sources. Three different scenarios were studied, including wind power only, wave power only, and wind and wave power combined. The results showed that all the offshore locations were within accepted feasible distance to the coast for connecting to the onshore grid. Most of the locations had acceptable power levels of either wind or wave energy while the combination of both resources can improve the overall energy harvesting efficiency and reduce the variability in a significant number of locations. The proposed methodology can be applied for specific locations with finer spatial and time resolution, which will allow stakeholders to improve the decision making process, generate important savings on the normal operation, reduce pollution, and potentially increase income by selling surplus energy from renewable sources.
1. Introduction
Production and ancillary activities on offshore oil platforms require electric power that ranges from 10 MW up to hundreds of MW, depending on the sizes of oil platforms [1,2]. Most of these platforms function with independent electrical systems, generating energy using gas turbines, which are expensive to operate [1]. The nature of the offshore production operations generates a variable system, with periods of low energy consumption followed by higher load requirements [1]. Gas turbine fuel efficiency is affected under variable operation conditions, considering that the energy consumption during idling conditions can be about 20% of what they would consume at full power [1,3]. Gas turbines in offshore oil platforms normally operate under 30% efficiency ranges, when the normal average efficiency should be about 55% considering a combined cycle gas power plant [3,4,5,6,7,8]. Furthermore, gas turbines increase emissions of NOx, SO2, Volatile Organic Compounds (VOC), Particulate Matter 10 micrometers or less (PM10), Particulate Matter 2.5 micrometers or less (PM2.5), CO, and CH4 under these inefficient operation cycles [1,2,7,9,10]. Studies on offshore oil platforms in Texas and Norway indicated that gas turbines are the main contributors of several criteria air pollutants on the offshore areas [4,6,7,9,10].
Several approaches have been taken to ameliorate this problem [11,12]. Norway has required that new or major modifications on offshore oil and gas platforms must consider the use of onshore energy since 2007 [5,7,13,14,15]. In fact, several fields in that region use onshore power [5,7], such as Ormen Lange, Snøhvit, Gjøa, Valhall, and Goliat. Another alternative involves the use of offshore renewable energy, such as wind and wave energies [3,7,14,15]. Simulation and modeling studies have indicated that important savings and reduction on pollutant emissions can be obtained when developing isolated offshore systems with wind turbines and oil platforms. Simulation for the year 2009, performed by Korpås et al. [1] in the North Sea for the inclusion of wind energy on oil platform operation, resulted in 53,790 tons of CO2 and 367 tons of NOx reductions, with yearly savings of €5.73 Million assuming €64/MWh for wind energy generated [1].
Furthermore, it has been ascertained that the combination of the two alternatives, using offshore renewable energy and connecting to the onshore grid, could create important synergies for both oil and renewable energy industries [6,8,16,17,18,19,20,21]. Supplying offshore oil platforms with renewable energy reduces the load for the gas turbines, with the variability issue tackled by the use of coupled energy storage systems [3,17,22]. Including a connection to the onshore electric grid increases the reliability of the system by supplementing the electricity supply for longer than expected renewable energy interruptions without ramping up gas turbines, and allows for the excess energy generated from renewable sources to be sold to the grid [4,6,8]. Therefore, it is able to balance energy generation and consumption in a safe and efficient manner while generating important savings and synergies, potentially even generating profit for the facility [4,6,14,23].
Although offshore oil and ocean renewable energy industries have coexisted independently over the last two decades, it is becoming increasingly clear that they can benefit from each other in many ways [15]. Besides the previous stated yearly savings for the oil industry (€5.73 Million assuming €64/MWh for wind energy generated), there are many other short and long term advantages [1]. The reduction or elimination of heavy and bulky gas turbines will reduce the design and construction cost of offshore oil platforms, free spaces for other activities, and reduce the risk associated with gas turbine operations [24]. With continuous technological improvements, offshore wind energy has become a mature industry, which is competitive with traditional energy resources. Meanwhile, wave energy is considered as one of the biggest untapped renewable energy resource in the world with predicted potentials enough to provide ten percent of the world energy in the following decades [25,26,27,28]. It is desirable to introduce wave energy to the electrical systems of installations in oceanic environments, specially isolated systems such as islands, to reduce costs and pollution caused by fossil fuels [29,30,31]. Ocean renewable energy industry, especially wave energy, will also benefit from the oil industry and accelerate its development by applying all the knowhow from the offshore oil sector, accumulated through more than 50 years in the offshore environment [32]. In the long term, the possibility of cost sharing on offshore electrification will be beneficial for both industries. Electrification on the offshore environment is expensive and complex, and the proposed scheme will make the distribution of the installation and maintenance costs more efficient if the infrastructure can be shared by both offshore oil and renewable energy installations, providing each with important advantages [2,3,13,14,16,33,34]. The oil industry will not only be able to sell excess renewable energy to the grid, potentially generating extra income, but it can transform aging offshore infrastructures into wind installations. This could reduce decommissioning costs and allow the oil industry to continue investing on the renewable energy sector [35,36].
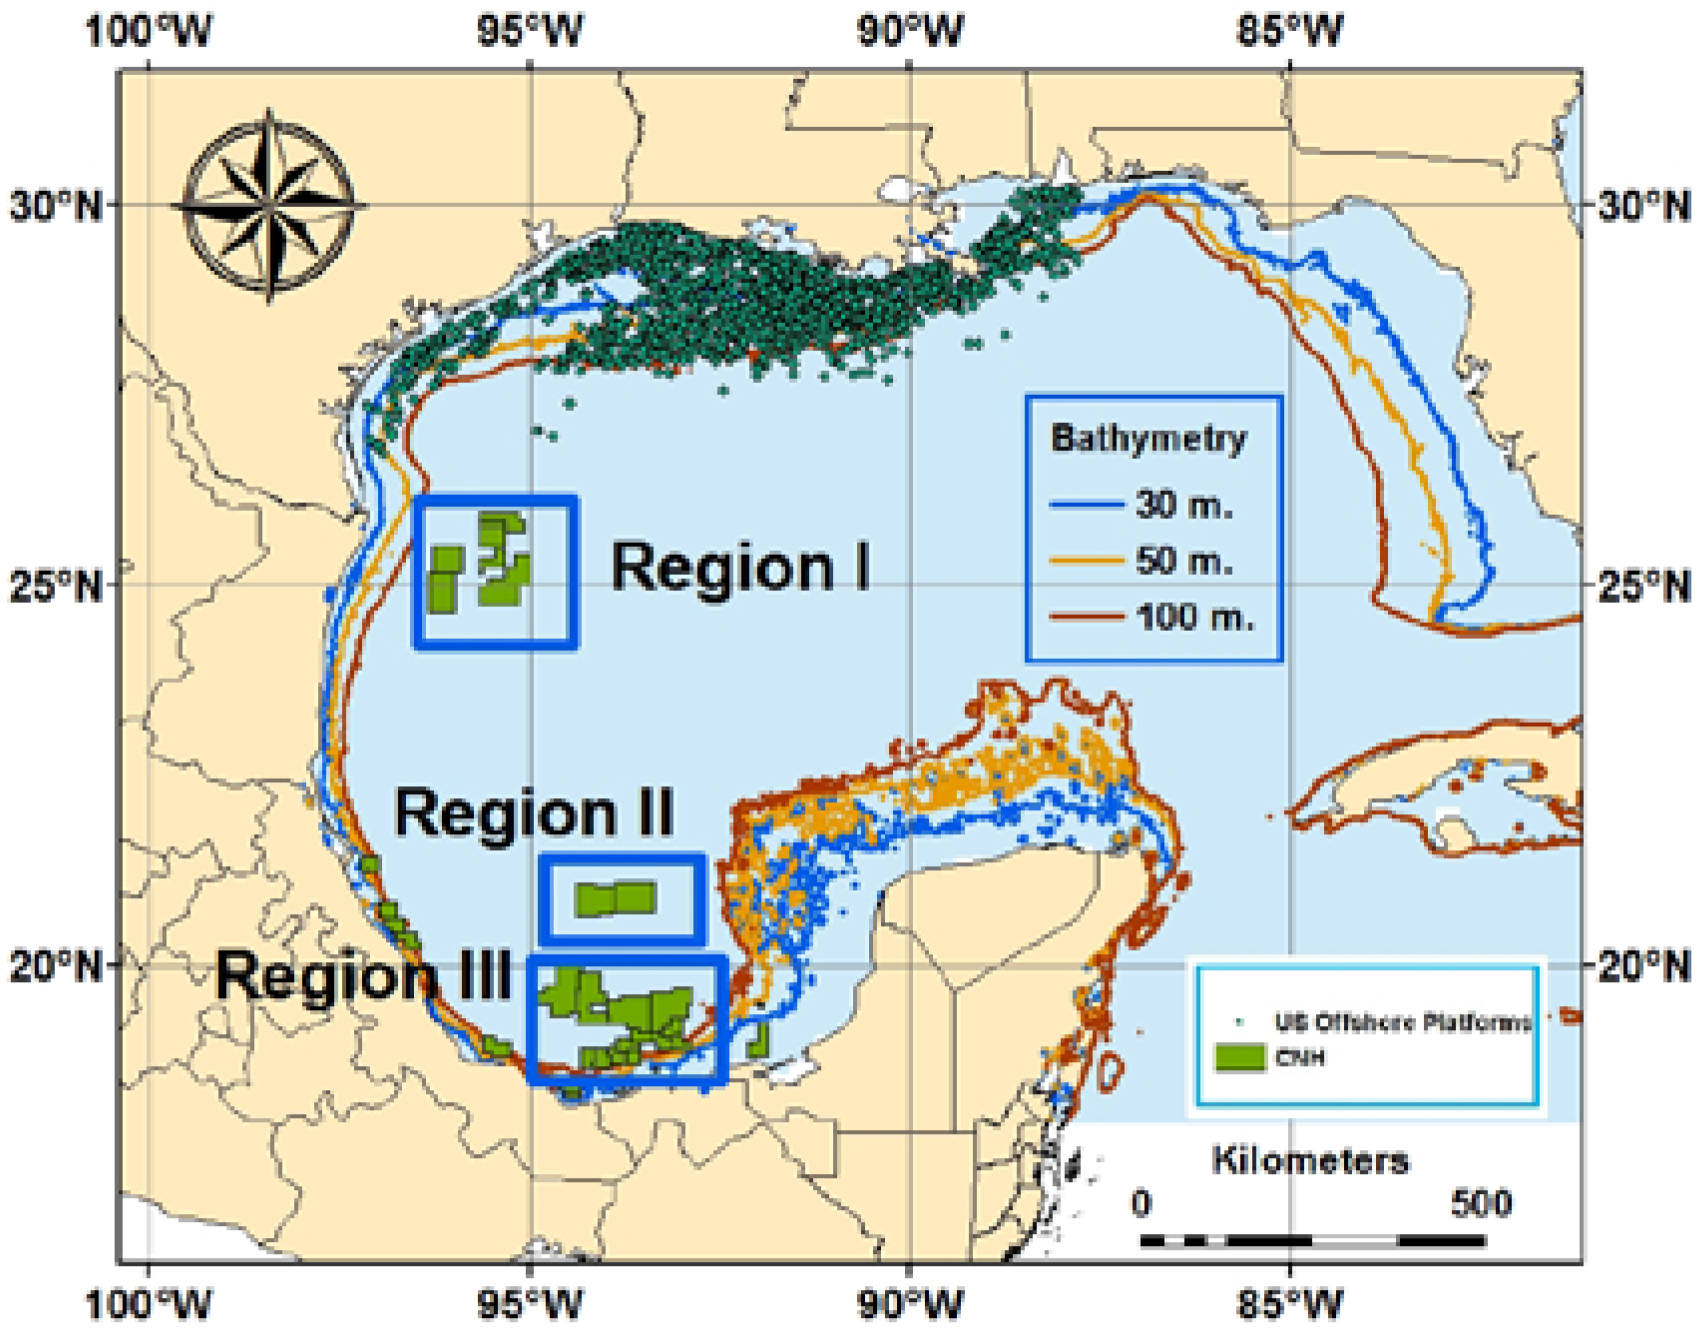
Motivated by these considerations, this paper focused on investigating the feasibility of using wind and wave energy to supply electricity to the U.S. offshore oil platforms and potential Mexico Exclusive Economic Zones (EEZ) in the Gulf of Mexico using Geographical Information Systems (GIS) methods. The locations of the areas for hydrocarbon exploration and extraction on Mexican EEZ were named as Comisión Nacional de Hidrocarburos (CNH) areas in this paper. Figure 1 shows the entire study area with small green dots representing offshore oil platforms and green rectangles representing CNH areas. In order to investigate and compare the wind and wave energy behaviors within the CNH areas, three major CNH regions (labeled as Regions I, II, and III in Figure 1) were grouped to conduct a detailed analysis.
Bathymetry data was obtained from [37], and included in Figure 1 to provide additional information for the decision making process on the selection and deployment of the energy harvesting equipment. Depending on the sea depth, three wind turbine foundations systems are available: monopole (up to 30 m), jacket-tripod (up to 50 m) and floating (deeper than 50 m) [38]. The average depth of existing offshore wind turbines is 22 m, and the largest depth for a jacket-tripod foundation is 44 m (EnBV Baltic 2 Wind Farm in Germany) [36,38]. The floating wind turbine concept was originally proposed in 1970, and Blue H technologies conducted a test on the Italian coast in 2008 followed by the Poseidon 37 project in 2009 [38]. Statoil also connected a floating wind turbine to the grid in 2009, while Repsol installed a floating 2 MW Vestas wind turbine on the Portuguese coast in 2011 [38]. Hywind offshore floating wind farm started operations in October 2017 in Scotland with five wind turbines [36]. The inclusion of bathymetry data in the GIS analysis will help selecting the most adequate foundation system for the wind turbine model to ensure the best fit for the meteorological and geographical conditions of each location. Both the jacked-tripod foundation [39] and the floating wind turbine system [26] might incorporate a hybrid wind-wave system that would bring a number of synergistic benefits to the project, including cost sharing to reduce operational and management expenditures [39,40].
2. Materials and Methods
This paper assessed the wind and wave energy potentials in the Gulf of Mexico for application in the oil and gas industry for both the United States and Mexico. GIS analysis was performed to ascertain the possibility of connecting offshore oil and gas facilities with the onshore electric grid, and to analyze the available wind and wave energy resources in each particular area considering historical data provided by the National Oceanic and Atmospheric Administration (NOAA) WaveWatch III system [41,42]. Big Data analysis was integrated into GIS to investigate the feasibility of supplying electricity to offshore oil facilities in the Gulf of Mexico with wave and wind energy. The locations of more than four thousand oil and gas platforms in the northern region of the Gulf of Mexico (U.S. oil platforms) were obtained from data published by the U.S. Geological Survey, Coastal and Marine Geology Program from information provided by the Minerals Management Service [43]. The locations of the areas for hydrocarbon exploration and extraction on Mexican EEZ were obtained from the National Commission for Hydrocarbons (CNH) of the Mexican Federal Government (CNH areas) [44]. The CNH areas are in the process of being assigned, through public bidding, for hydrocarbon exploration and extraction by Mexican and International companies, individually or in join projects with Petroleos Mexicanos (PEMEX), in accordance to legal changes to the Mexican Constitution of December 2013 [44].
This paper focused on developing a general methodology to evaluate the feasibility of using renewable energy to supply offshore oil platforms. The use of actual extracted electric power, rather that energy density values, was considered a more effective indicator to understand the energy capabilities of the region. Since two energy resources, wave and wind, were being simultaneously analyzed, the output data was used with the same measuring unit rather than wave density in kW/m and wind density in kW/m2. Therefore, it was necessary to select equipment for the harvesting of wind and wave energy to develop and validate the methodology.
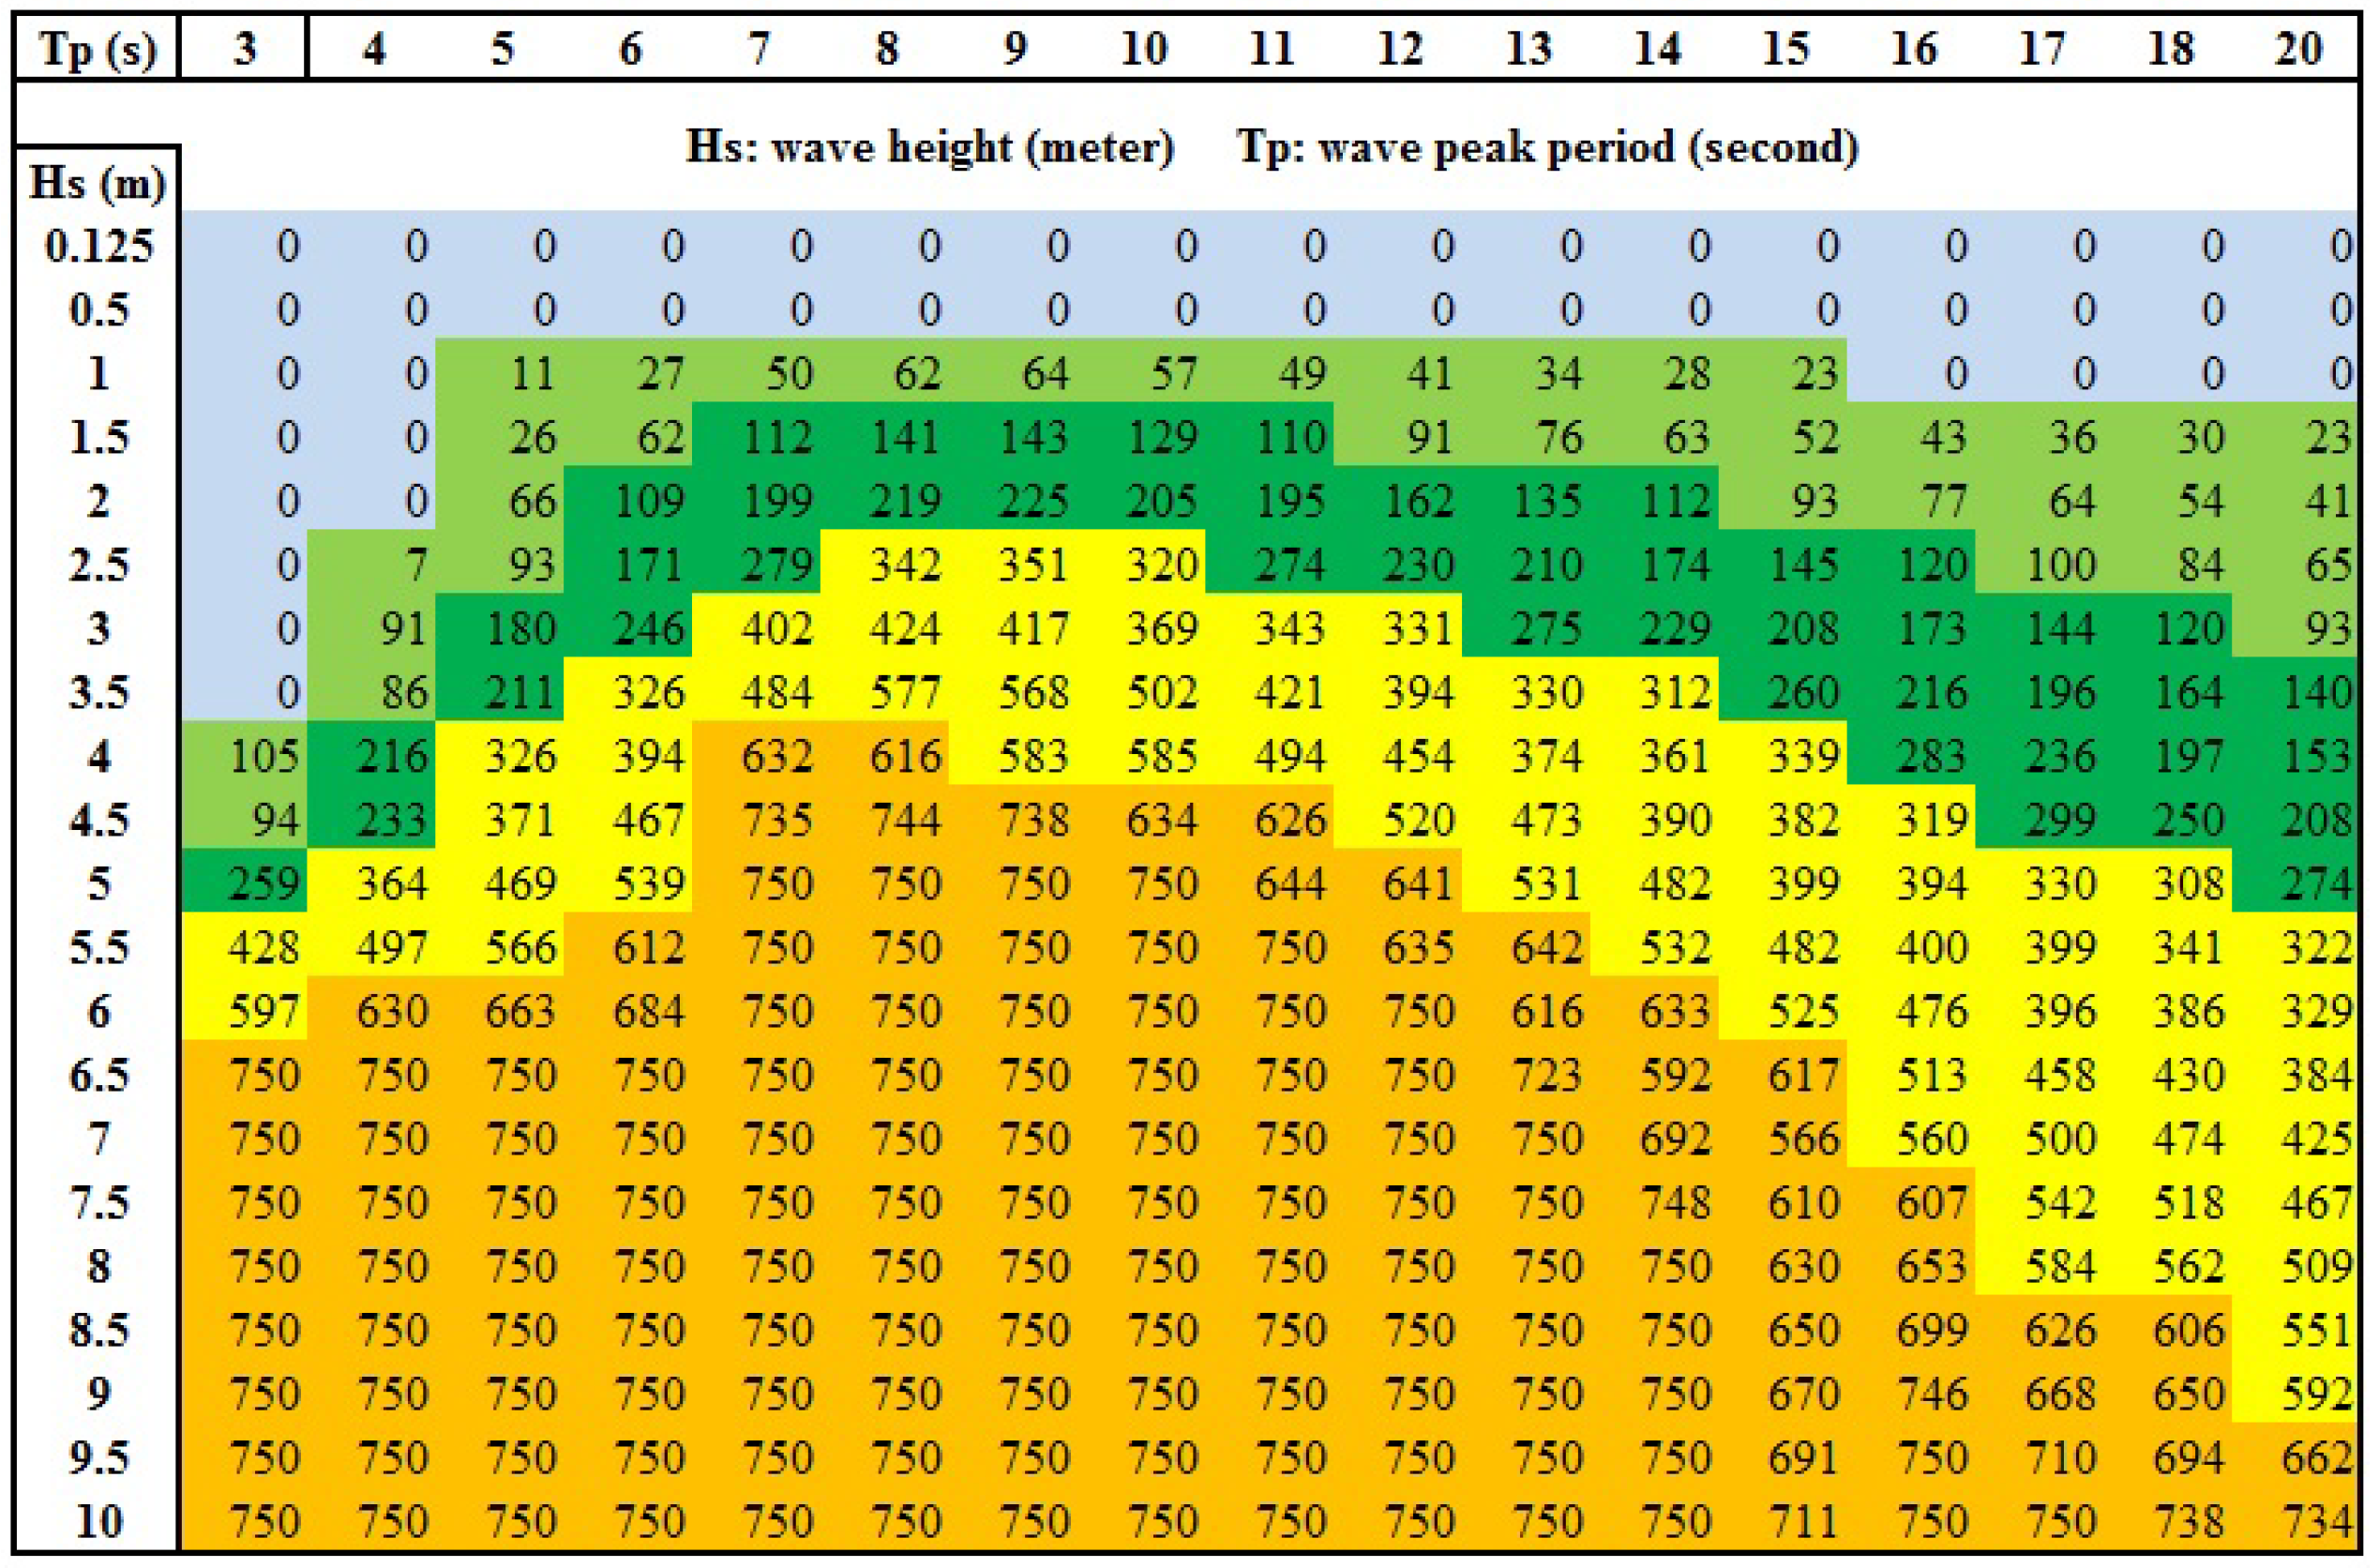
Wave energy was assumed to be extracted by one Pelamis P2 750 kW Wave Energy Converter (WEC). There is no WEC being commercially operated in large scale nowadays, and the developer of the Pelamis WEC went into administration with Wave Energy Scotland now owning their intellectual property and assets [45]. However, the Pelamis WEC was considered a good option because of several important reasons. First of all, it has been extensively used in previous researches [25,27,46,47,48], and its power curve was provided by previous research and the manufacturer (Figure 2) [49,50,51,52]. Secondly, the Pelamis P1 750 kW was the first WEC to operate commercially on a wave farm in Aguçadoura, Portugal that was connected to the grid [53]. The closing of this wave farm was mostly due to the financial collapse of the main shareholder of that project, Babcock & Brown infrastructure group from Australia [53]. At last, the second generation Pelamis P2 750 kW was successfully tested for 3 years in the Billia Croo wave test site [45,53].
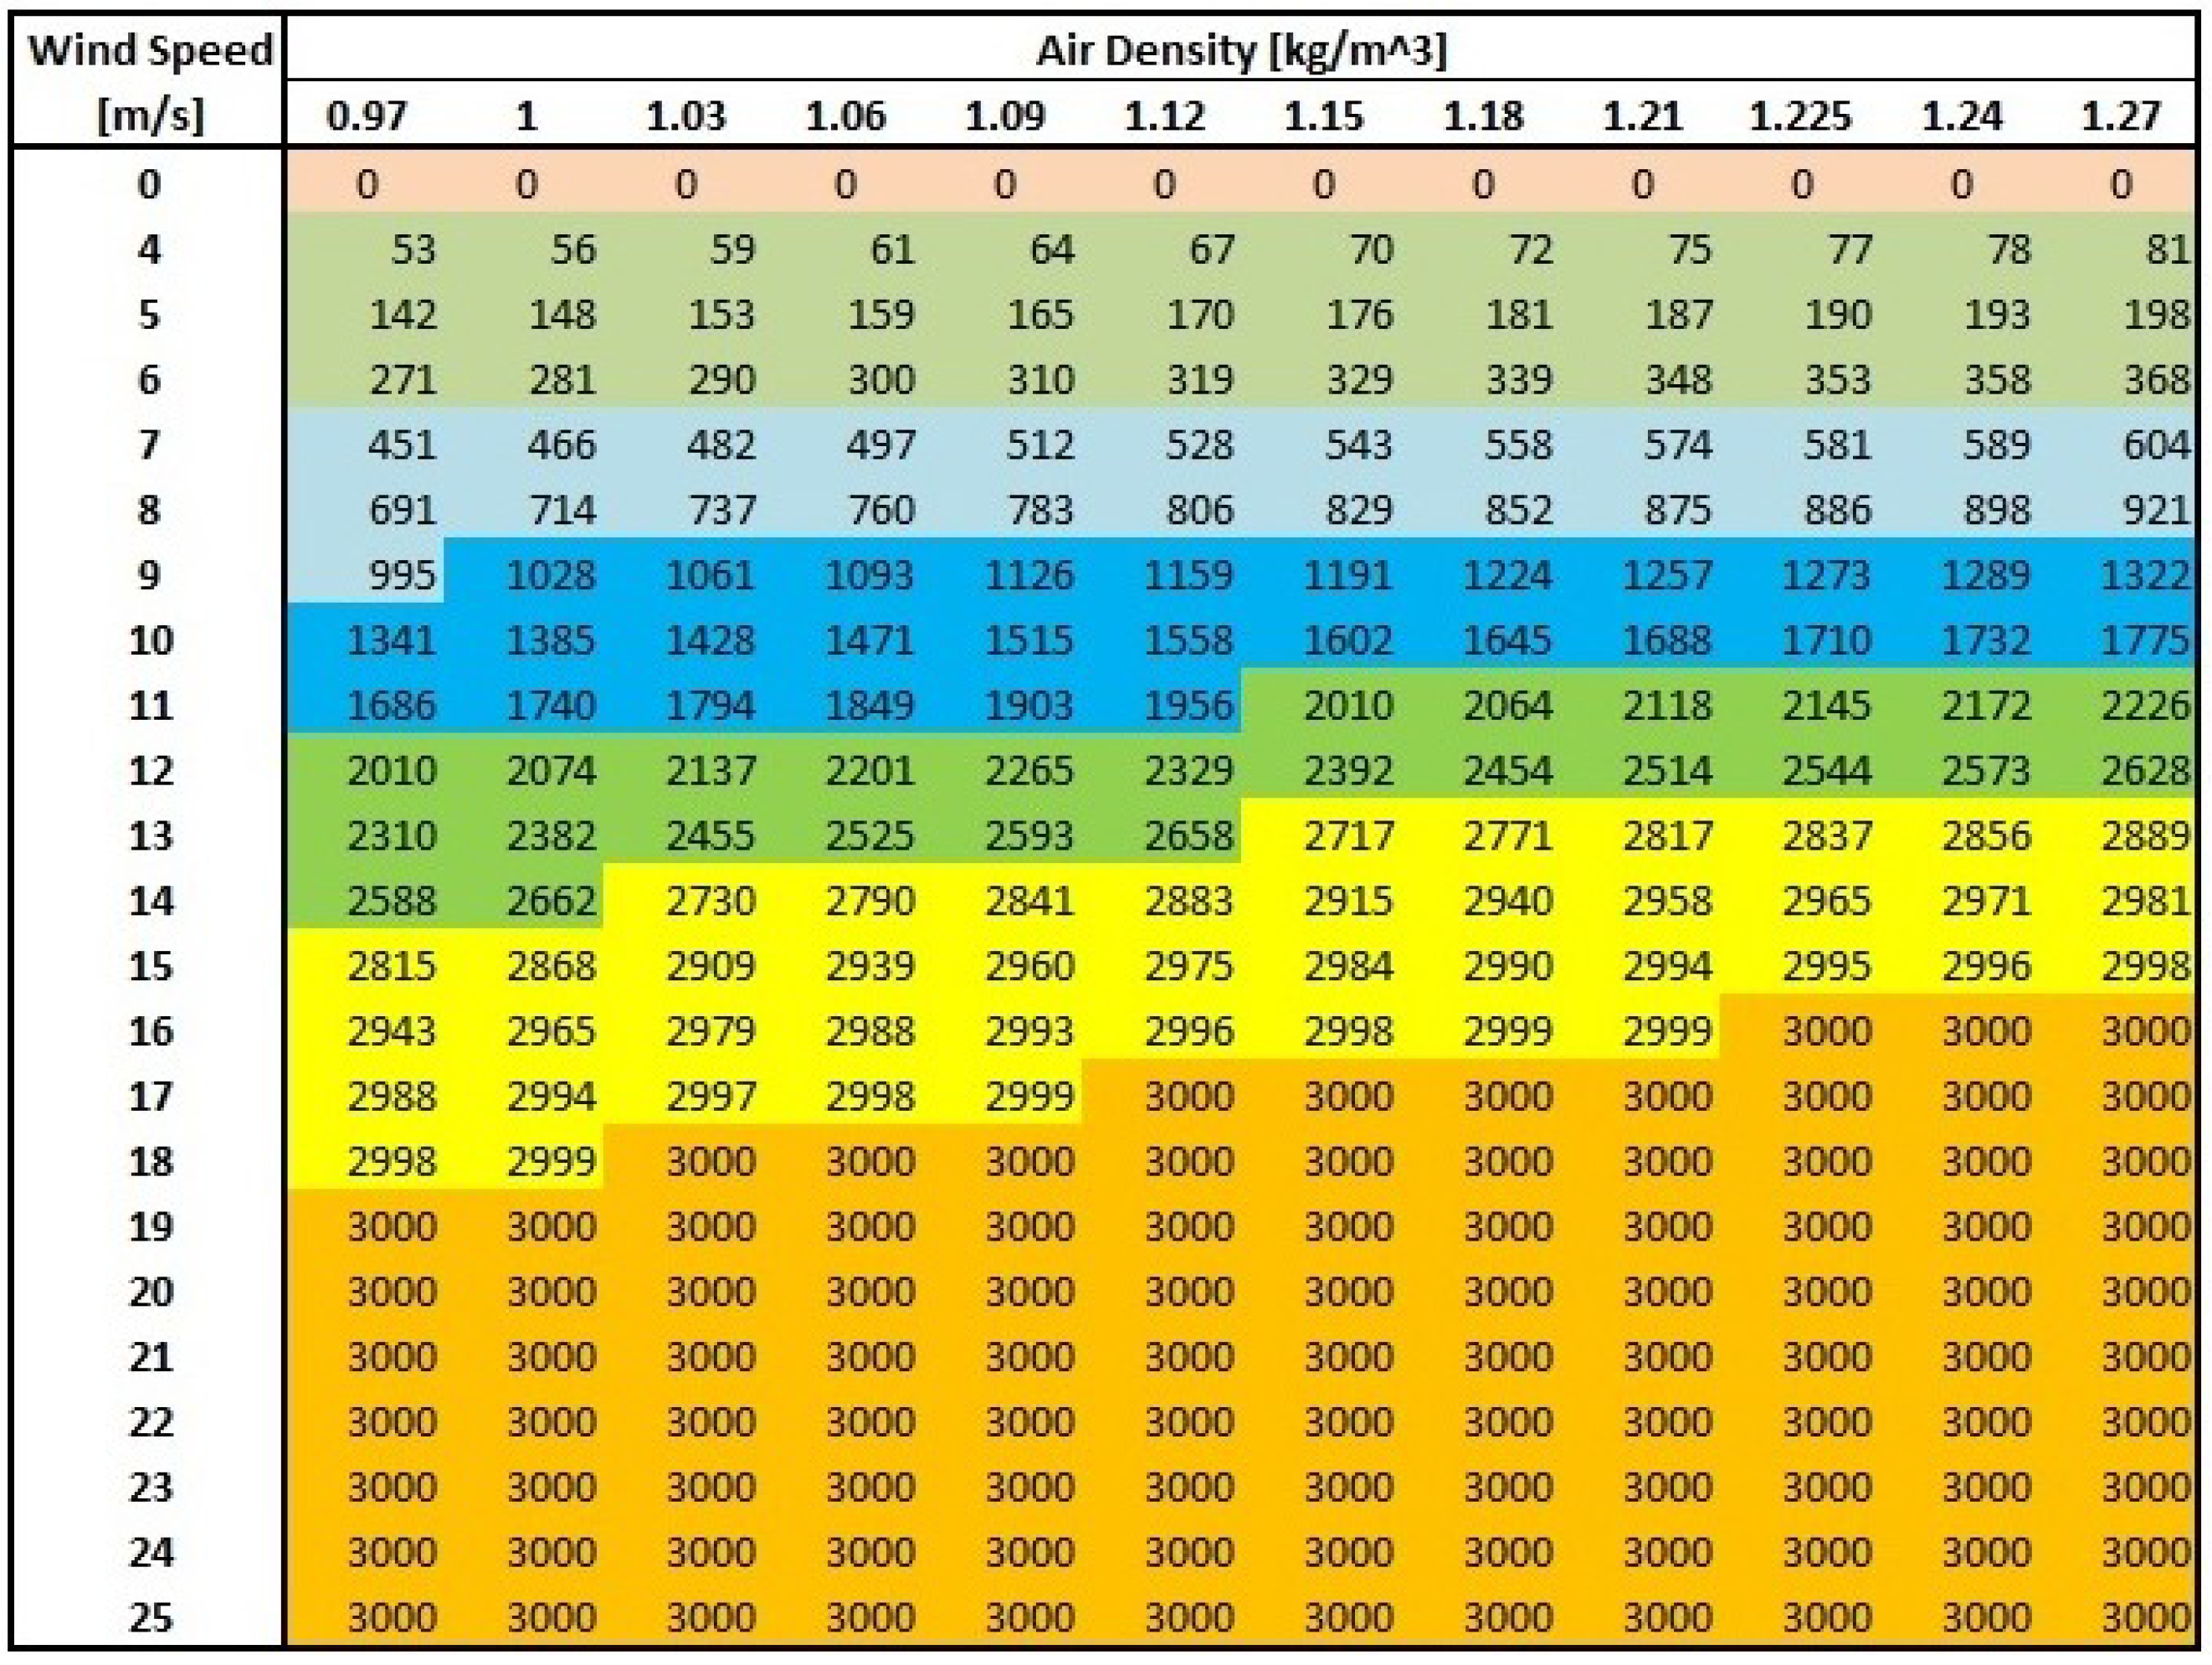
Wind energy was assumed to be extracted by one Vestas V90 3 MW wind turbine. It is one of the most widely used offshore wind turbines in the world, and its power curve has been provided by the manufacturer (Figure 3) [33,34]. The Vestas V90 3 MW has a hub height of 80 m, diameter of 90 m, cut-in wind speed of 4 m/s, rated wind speed of 16 m/s, cut-out wind speed of 25 m/s, and restart (cut-back-in) wind speed of 20 m/s [54]. It is also possible to modify existing offshore wind turbines by changing their current foundation systems to floating system [55]. Manufacturers such as Vestas [56], Siemens [38] and General Electric [57] are installing its current offshore wind turbine models on floating foundations [38,58,59].
Meteorological data over 36 years (1979–2015) in the Gulf of Mexico region generated by the NOAA’s WaveWatch III system was used to first calculate wave and wind power output by considering one device in each geographical location. The resolution of NOAA data is one sixth longitude by one sixth latitude, which is also the dimension of each geographical location considered in this paper.
The electric power output generated on each location was calculated by applying meteorological data with the power curves (Figure 2 and Figure 3). The significant wave height-Hs (in meters) and the dominant wave period-Tp (in seconds) were applied to the Pelamis electric power curve (Figure 2) to estimate its power output. Dominant wave period (Tp) was calculated from the energy wave period provided by NOAA’s WaveWatch III by multiplying factor α. The value of α approaches to one as the spectral width decreases, and it has been considered as 0.86 for a fully developed ocean [60,61]. In this paper, 0.9 was selected as α value as indicated by previous research [60,61,62,63,64], which is also the equivalent of assuming a standard JONSWAP (Joint North Sea Wave Observation Project) spectrum (Deutsches Hydrographisches Institut—Hamburg—1973 Hasselmann et al.) [35,37,61,65,66,67,68].
Electric power generated by the Vestas V90 3MW was calculated based on wind speeds provided by the NOAA from the WaveWatch III system at the same locations and time periods as for wave. The provided wind speed vectors were at a height of 10 m above sea level, which was converted to wind speeds at wind turbine hub height (80 m for Vestas V90 3MW) applying the wind profile power law formula Equation (1), considering near-neutral stability conditions at locations in the Gulf of Mexico [69,70]:
where, U2 is the wind speed at height Z2, U1 is the wind speed at height Z1, and P = 0.10 for offshore wind turbine [70].
The maps created in this paper to analyze wave power and wind power generated by the Pelamis 750 kW and the Vestas V90 3 MW are represented by a color scale applying Jenks Natural Breaks classification method. This method classifies values by minimizing each category average deviation from the category mean, and simultaneously maximizes each category deviation from the means of the other categories in the same array aiming to minimize variance on each category while maximizing variance between categories. It is a very good fit to evaluate geospatial data that has high variation on temporal and spatial criteria, such as wave energy and wind energy. It is a good analysis tool for arrays with relatively big differences on the data values [71,72,73,74]. The color bars presented on each of the maps in this paper ensured a good contrast between the diverse electric power extracted to perform geospatial analysis and gain better understanding on their temporal and spatial behavior and variability. These different classification classes allow finding the best fit for every particular location and time period. Maps in this paper were designed to provide additional information on the behavior of electric power from wind and wave in addition to the results presented on the corresponding tables and graphics. However, since the main purpose of the maps is to show contrast of the renewable energy behaviors (in light of its high geo temporal variability), comparison between maps should always consider that the color bar in each map may be in different scale since the Jenks Natural Breaks classification method was used.
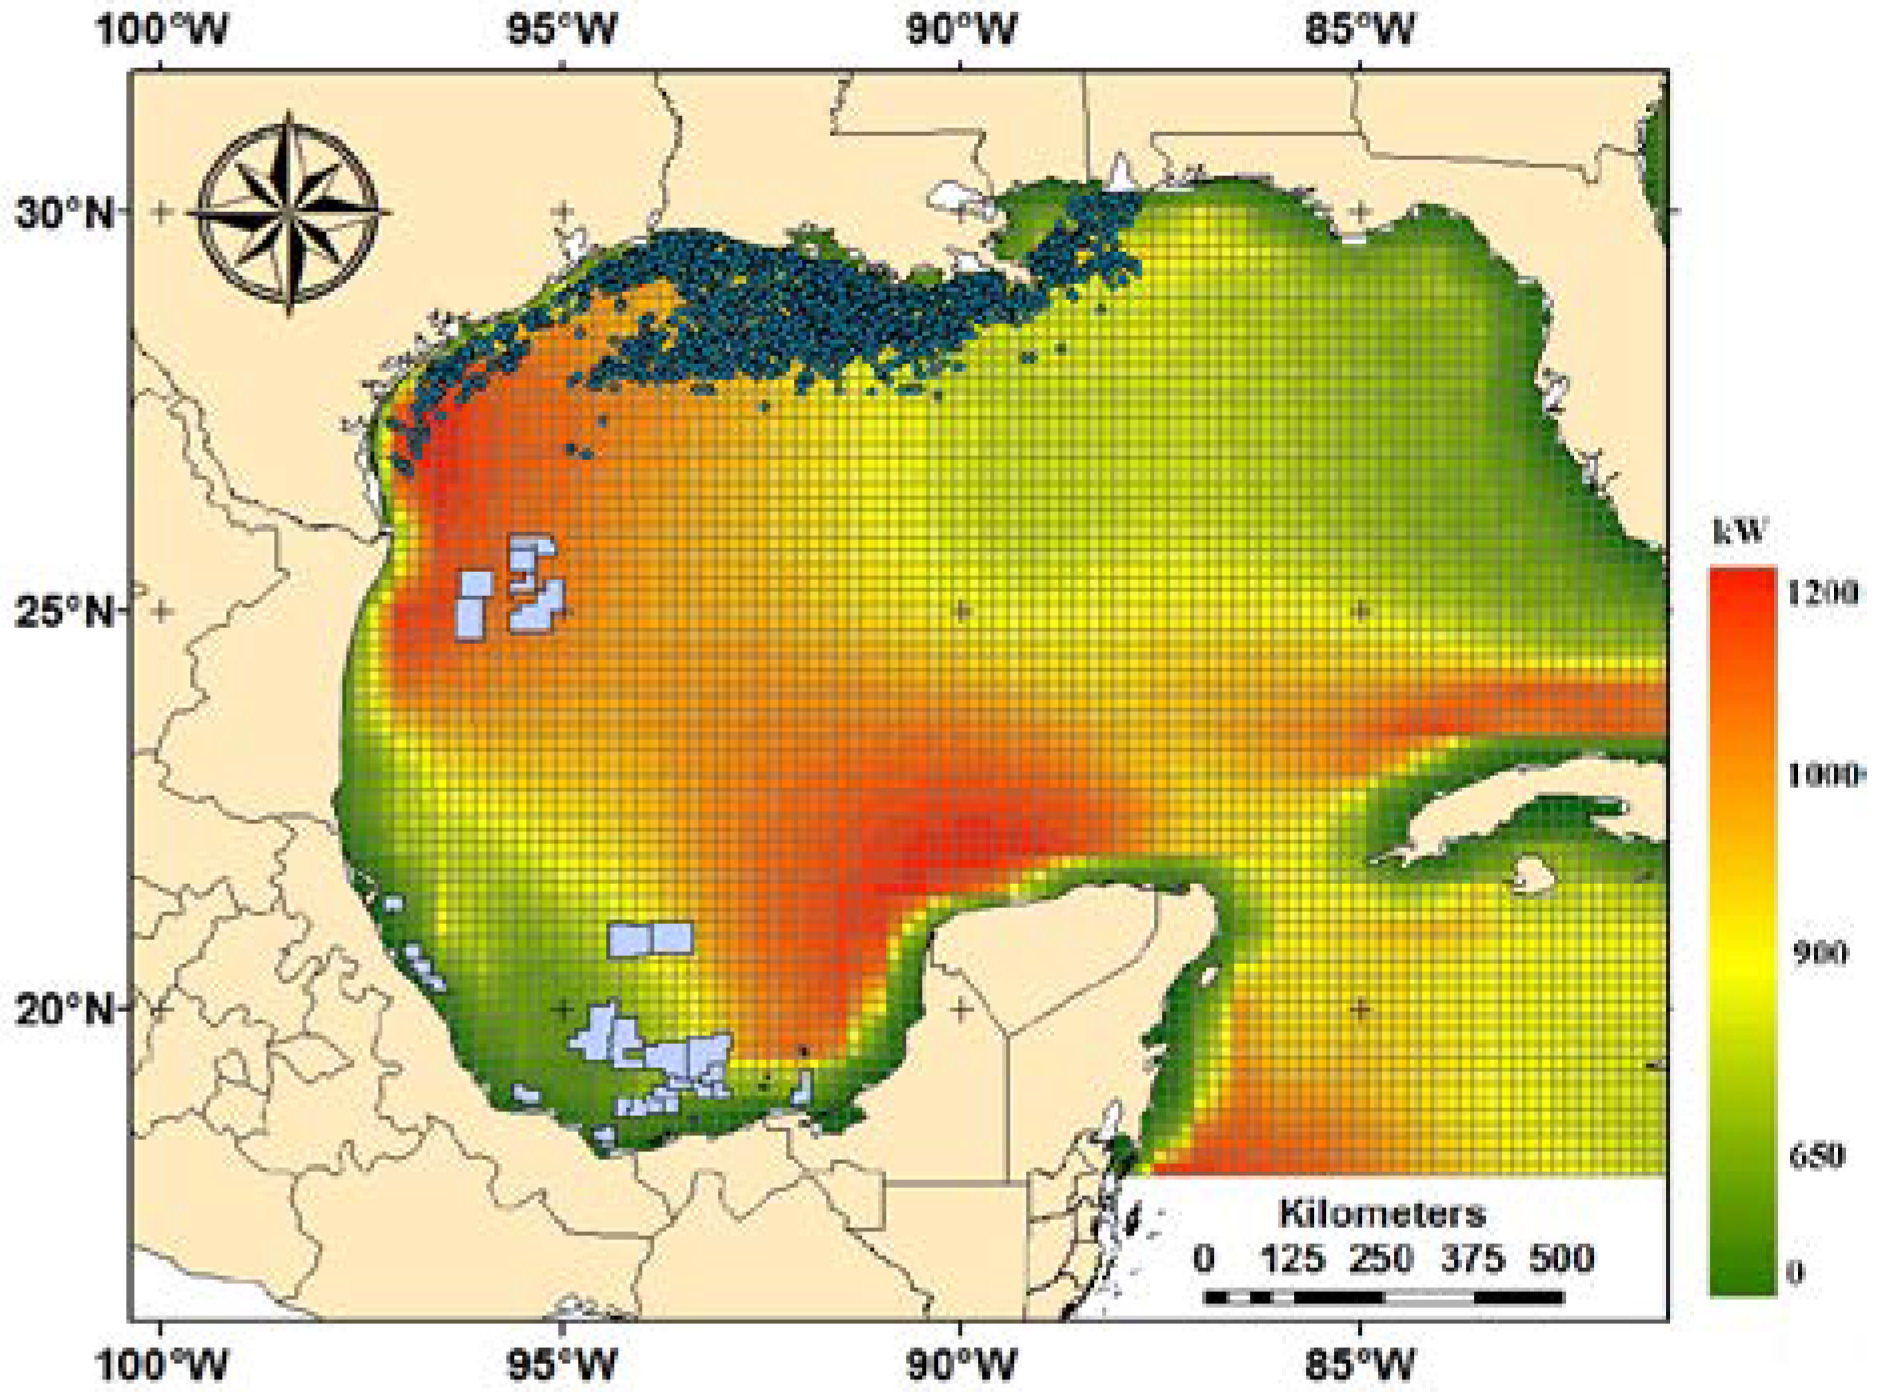
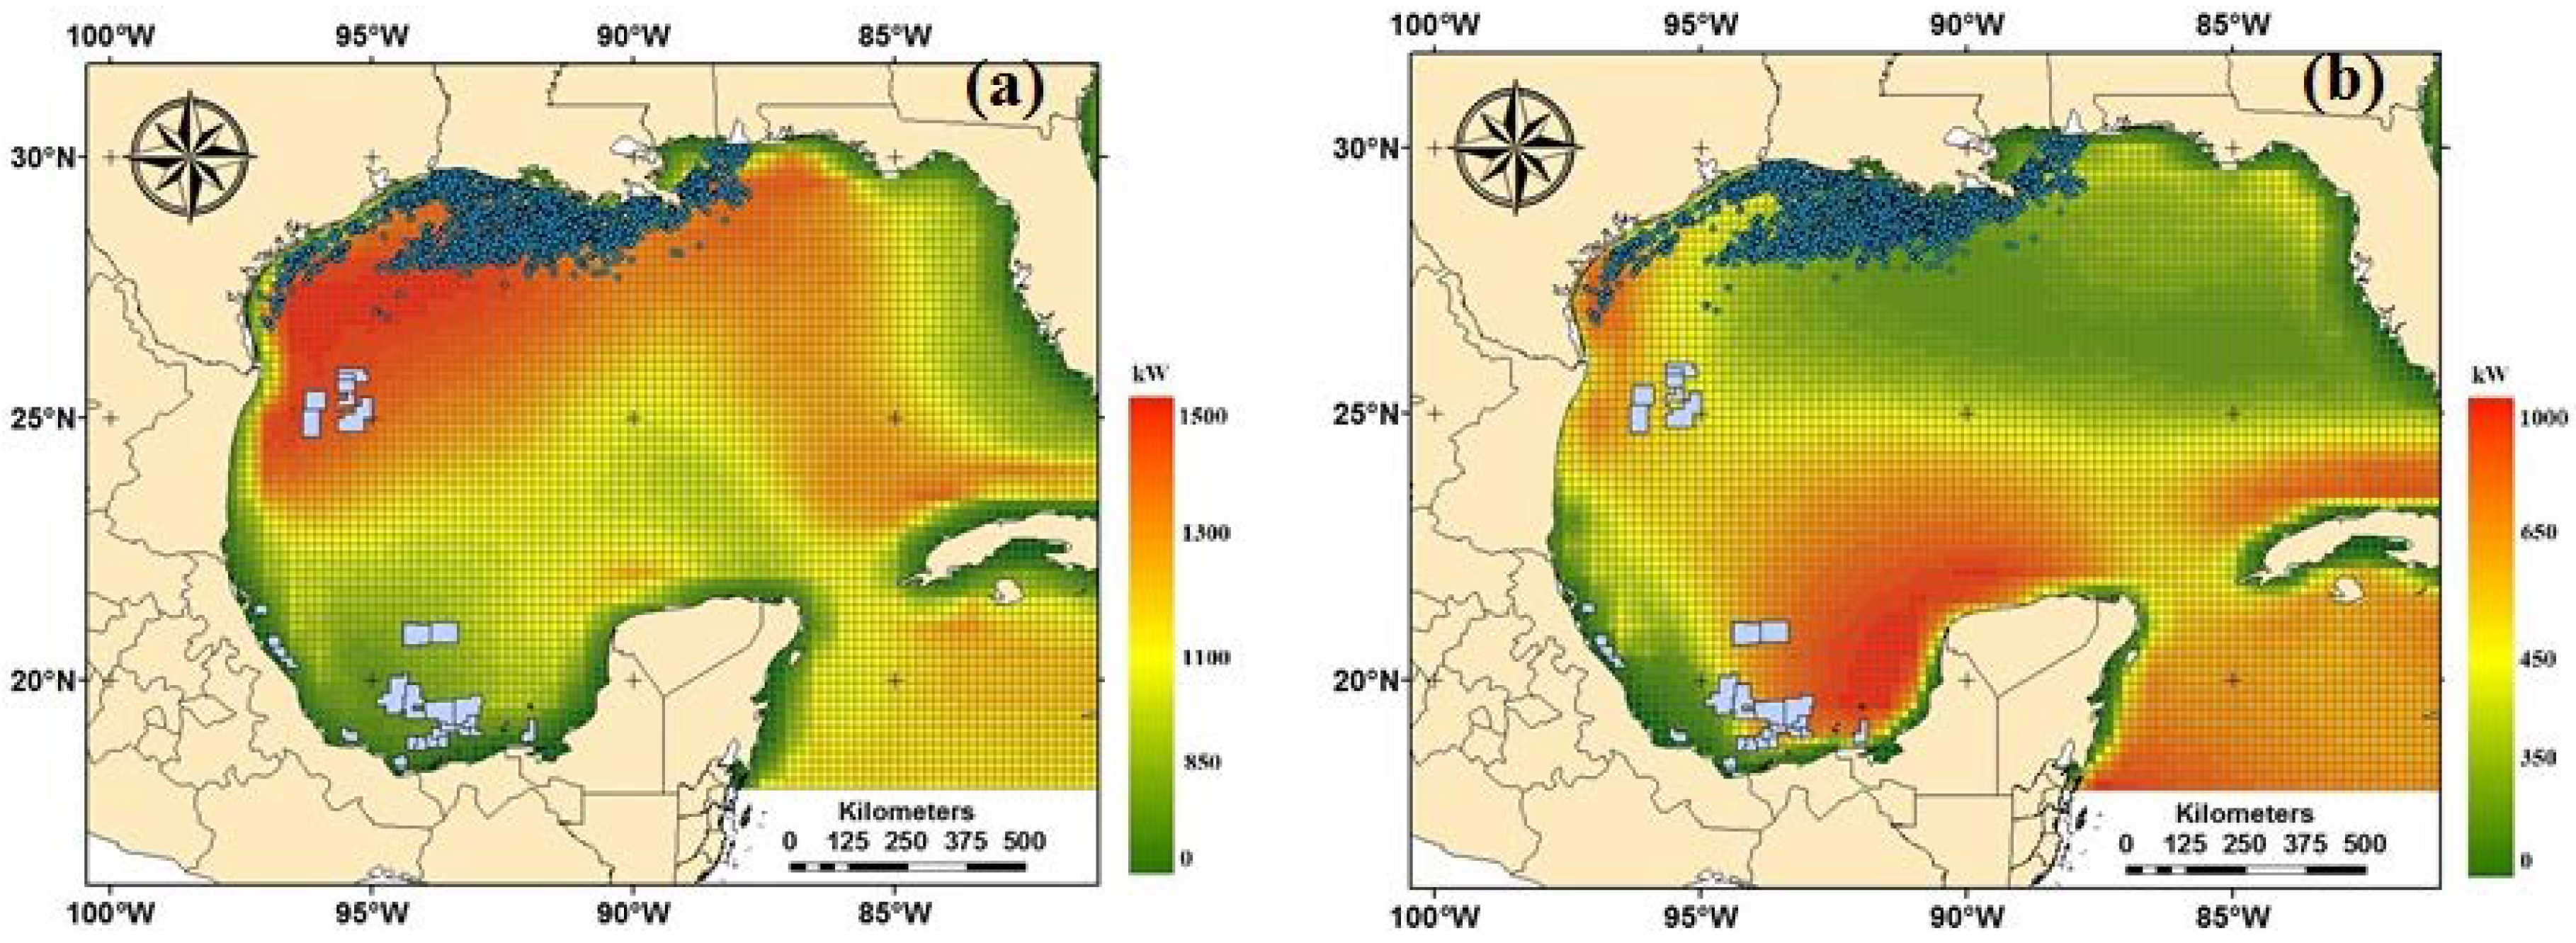
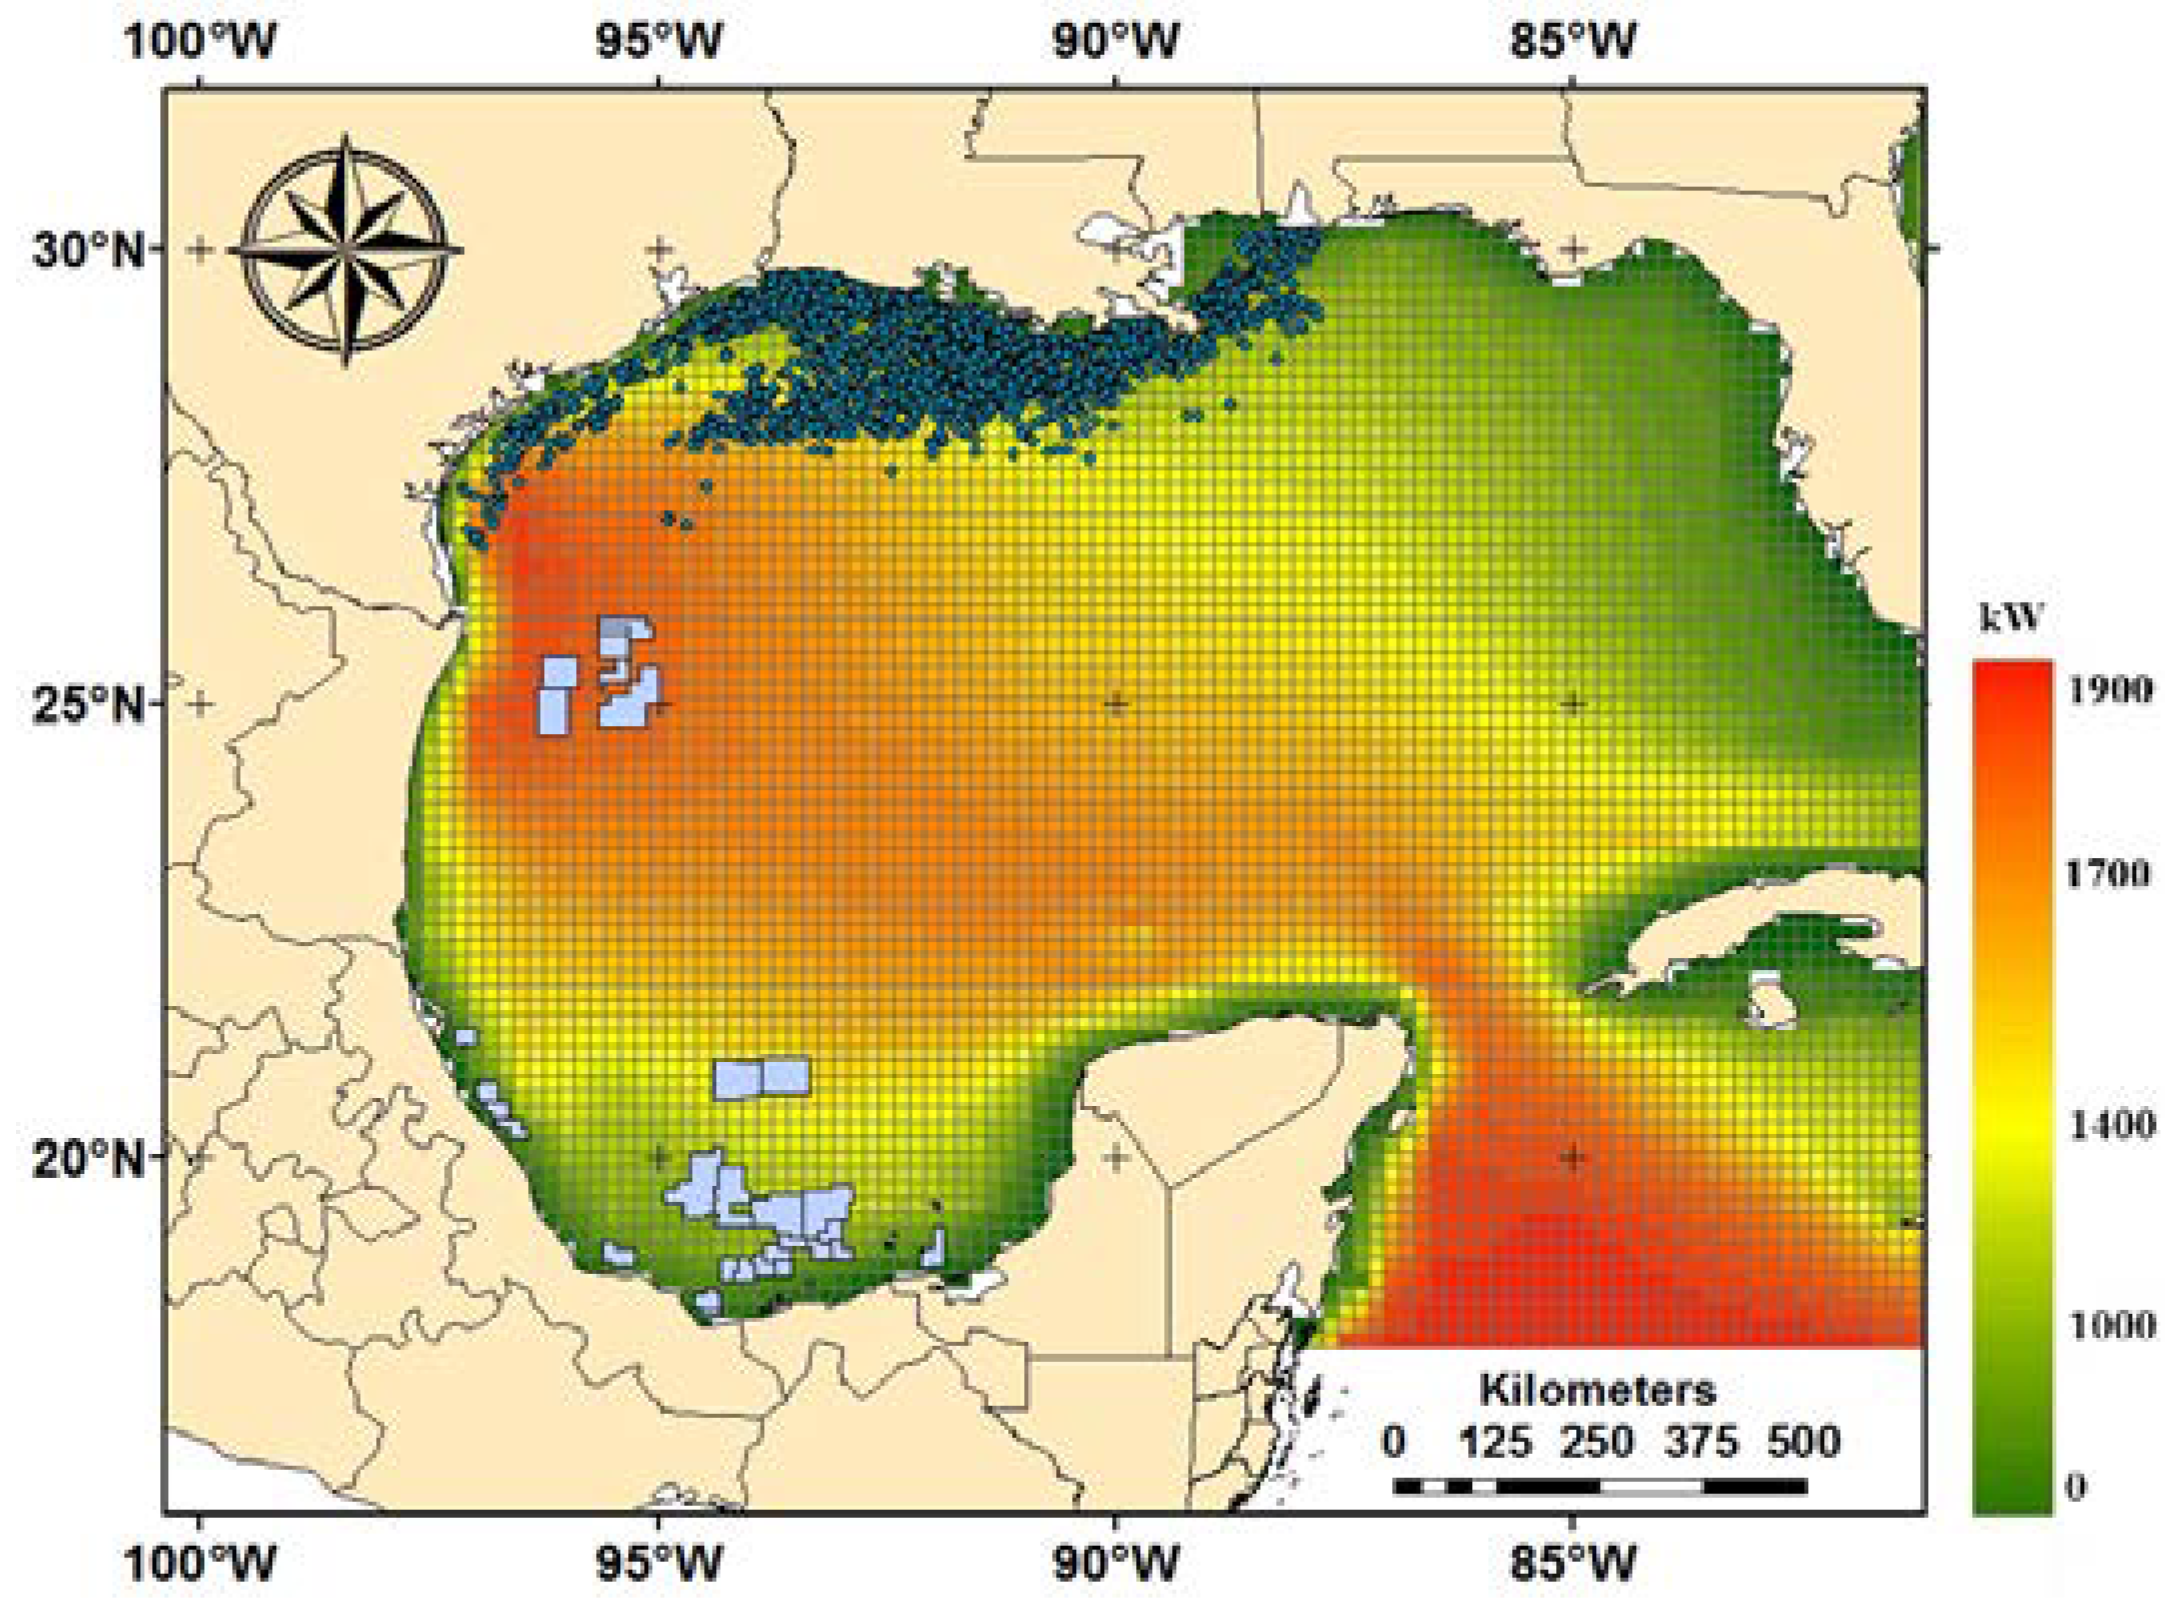
Figure 4 represents the average wave power generated by one Pelamis 750 kW WEC over the 36 year period on each location in the Gulf of Mexico. It shows a high wave power concentration on the western central location and the Yucatan Strait. It can be observed that the CNH region I in the north of the Gulf of Mexico is one of highest wave power regions, and a significant number of U.S. oil platforms and CNH regions II and III in the Gulf of Campeche are located in the yellow ring surrounding the wave power map, which indicates commercially acceptable power levels while not being subjected to the harsher marine conditions caused by more energetic waves.
The average wind power generated by one Vestas V90 3 MW over the 36 year period in the Gulf of Mexico is presented in Figure 5, showing a high wind power concentration on the northwestern Gulf of Mexico region, the western Yucatan Peninsula coast, and the Florida Strait. It can be observed that the CNH region I in the northern region of the Gulf of Mexico is one of the highest wind power regions similarly with wave power. In addition, some U.S. oil platforms are located on high wind power locations along the Texas coast, and a significant number of U.S. oil platforms and CNH regions II and III in the Gulf of Campeche are located in the yellow band surrounding the wind power map, which indicates acceptable power levels.
3. Results and Discussion
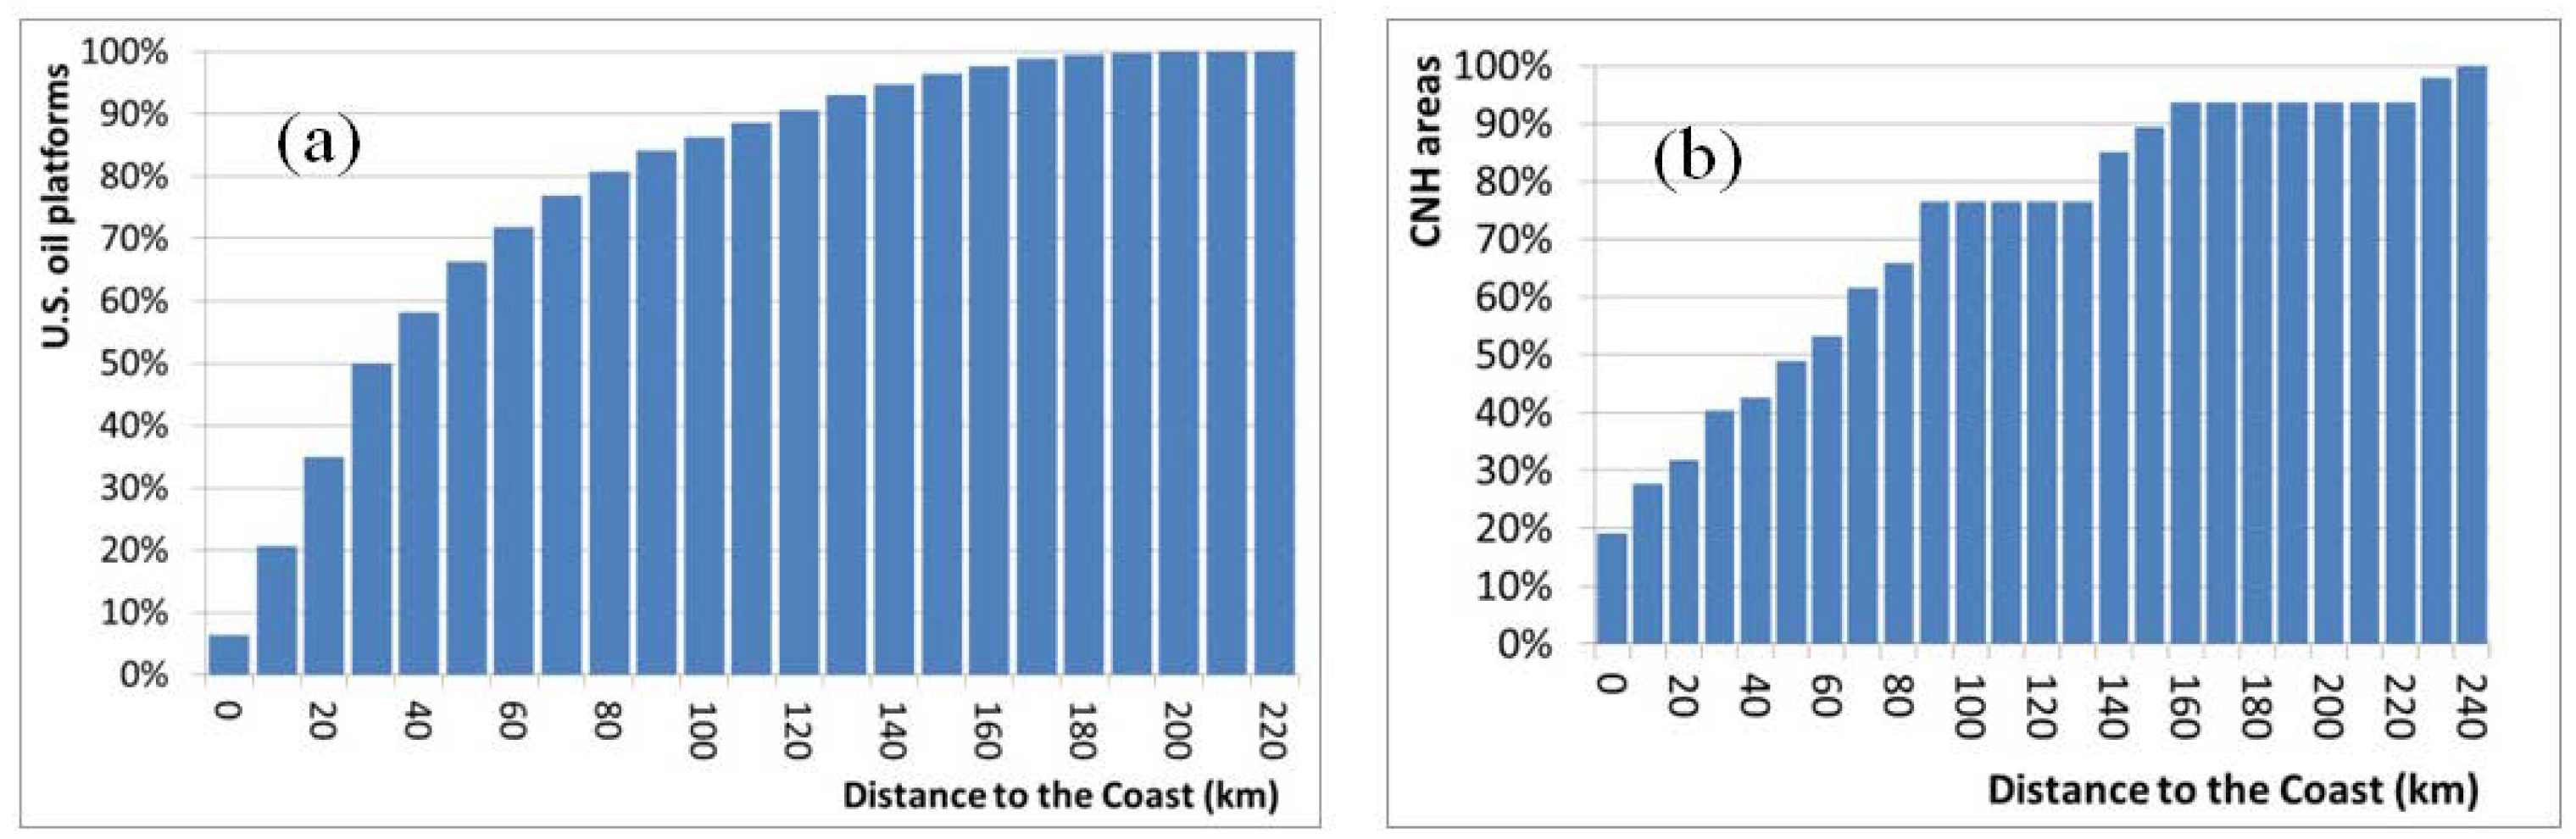
The distance to the coast is an important factor when considering the feasibility of combining offshore renewable energy with oil platforms and the onshore grid. Longer distances increase the capital and maintenance costs and energy losses due to transmission. Three hundred (300) kilometers has been considered an acceptable distance from the coast to oil rigs when connecting to the onshore grid [7,13]. The Troll A offshore oil platform, located to the west of Bergen, Norway, has been successfully connected to the onshore grid over a distance of 65 km [7]. In this paper, two distinctive analyses related to distance to the coast were performed to calculate the distance from each installation to its closest coastal location, considering the U.S. oil platforms and the CNH areas separately. For the CNH areas, the distance was calculated from each of the WaveWatch III data locations that are relevant to a particular CNH area.
The distance analysis results are presented in Figure 6, which shows the cumulative percentage of U.S. oil platforms and CNH areas according to different ranges of distance to the coast, indicating an acceptable distance range (less than 300 km) to the coast on both cases. Almost 80% of the U.S. oil platforms and CNH areas are located at a distance less than 80 km and 90 km from the coast, respectively. The maximum distance is 230 km for U.S. oil platforms and 240 km for the CNH areas, which is less than 300 km as the acceptable distance.
Three different scenarios were analyzed for in this paper, including electric power from: (1) wind only, (2) wave only, and (3) wind and wave combined. The results and discussion of each scenario are presented below.
Previous research [66,67,68,75] has indicated that both wind and wave energy in this area has a distinctive seasonal and monthly behavior. Since wave energy is particularly dependent on local weather patterns in the Gulf of Mexico, both wind and wave energy share the seasonal and monthly variability behavior. In the Gulf of Mexico, summer has been ascertained as the lowest wind and wave energy periods, with July and August having the lowest power outputs in the entire year. On the other hand, both resources have higher power output during fall and winter seasons with January and December providing the highest power output in the entire year. Spring season behaves as a transition period to the lower summer months [66,67,68]. Inter-year variations are also important, and should be considered when performing particular analysis for an installation or cluster of installations [67].
3.1. Wind Power Only
The wind energy assessments for the U.S. oil platforms and the three CNH areas were done monthly, considering that the Gulf of Mexico presents important temporal variability on both wind and wave energy resources throughout the year [66,67,68]. In addition, the assessments were done separately for both regions due to several reasons. First, the U.S. oil platforms were considered as fixed point installations while the CNH areas were considered as polygons, with larger area including more WaveWatch III data locations. Second, the map shown in Figure 5 indicates that the wind energy characteristics of both locations are different, and it was considered important to differentiate the wind energy behavior in both locations. Last, the assessment objectives were different, considering that the U.S. oil platforms are already in operation while the CNH areas are mostly geared for planning and future installations.
Table 1 shows the percentages of total U.S. oil platforms and CNH areas corresponding to different wind power output levels. Wind energy in the U.S. oil platforms areas had a seasonal behavior with each month of the year showing a distinctive pattern. In the U.S. oil platforms areas, the wind power was high from November to April. It can also be observed that most U.S. oil platform locations were in higher wind power levels between December and March (curves skewed to the higher levels), where the curves of November and April tended to be similar as normal distribution curve. On the other hand, most U.S. oil platforms were in lower wind power areas from June to August (curves skewed to the lower levels) with low overall power levels, which match with the expected summer low offshore renewable energy levels [66,67,68,75]. The months of May and September showed moderate power levels with curves tending to be normally distributed as well.
The capacity factor of wind turbine (actual power output divided by nameplate capacity) is normally 30%, but it can vary between 20% and 30% due to time-varying influences, such as wind resource inter-year variations [69,76]. Vestas V90 3MW installed in the Barrow Offshore Wind Farm (UK) reported a 24.1% capacity factor while a capacity factor of 27.7% was reported for those installed in Kentish Flats Offshore Wind Farm (Thames River Estuary in the Kent coast, UK) [77]. Different offshore wind farms in other European locations reported different capacity factors, depending on the installed wind turbine model and the local meteorological conditions [77]. Considering the nameplate capacity of one Vestas V90 is 3 MW, it will reach 20% or higher capacity factor if its output power is 600 kW or higher, while it will reach 30% or higher capacity factor if its output power is 900 kW or higher. For most of the U.S. oil platforms areas, the capacity factors of seven months fall above the 30% range and nine months above the 20% range with only three months (June to August) having less than 20% capacity factor. For most of the CNH areas capacity factor are above 20–30% for all months of the year, except August. However, CNH areas do not have distinctive pattern of the wind energy behavior within the same month. Instead, different patterns in the CNH areas overlapped in the same month.
To complement and further explain the results listed in Table 1, maps of January and August were created as shown in Figure 7 applying Jenks natural breaks classification method for the color bars. January (Figure 7a) showed several distinctive patterns overlapped or combined in which higher wind power was concentrated in the northern section of the Gulf of Mexico, explaining why the U.S. oil platform locations performed better than CNH in January. In addition, Figure 7a also directly shows that 25% of CNH areas fell in the high power generation range (1350–1450 kW) in January in Table 1, which is disjointed from the main body of data and performed better than the rest of the CNH areas. This can be explained by CNH Region I being engulfed by the higher northern wind pattern. Meanwhile, Figure 7b allows understanding that some sections of the CNH areas performed better than the US oil platforms during August. Sections of CNH Regions II and III are part of the southern Gulf of Mexico higher wind pattern during August. Furthermore, the maps indicate that one possible reason for CNH areas lacking of uniform behavior is that CNH areas spread over larger geographic areas, which experienced different wind energy patterns.
The maximum wind power level in January was 1500 kW, while the maximum level in August was 1000 kW. In January, CNH region I was in the highest wind power level, while wind power in CNH regions II and III was in lower level. In August, it shows an almost opposite scenario. CNH regions II and III produced higher wind power than CNH region I did.
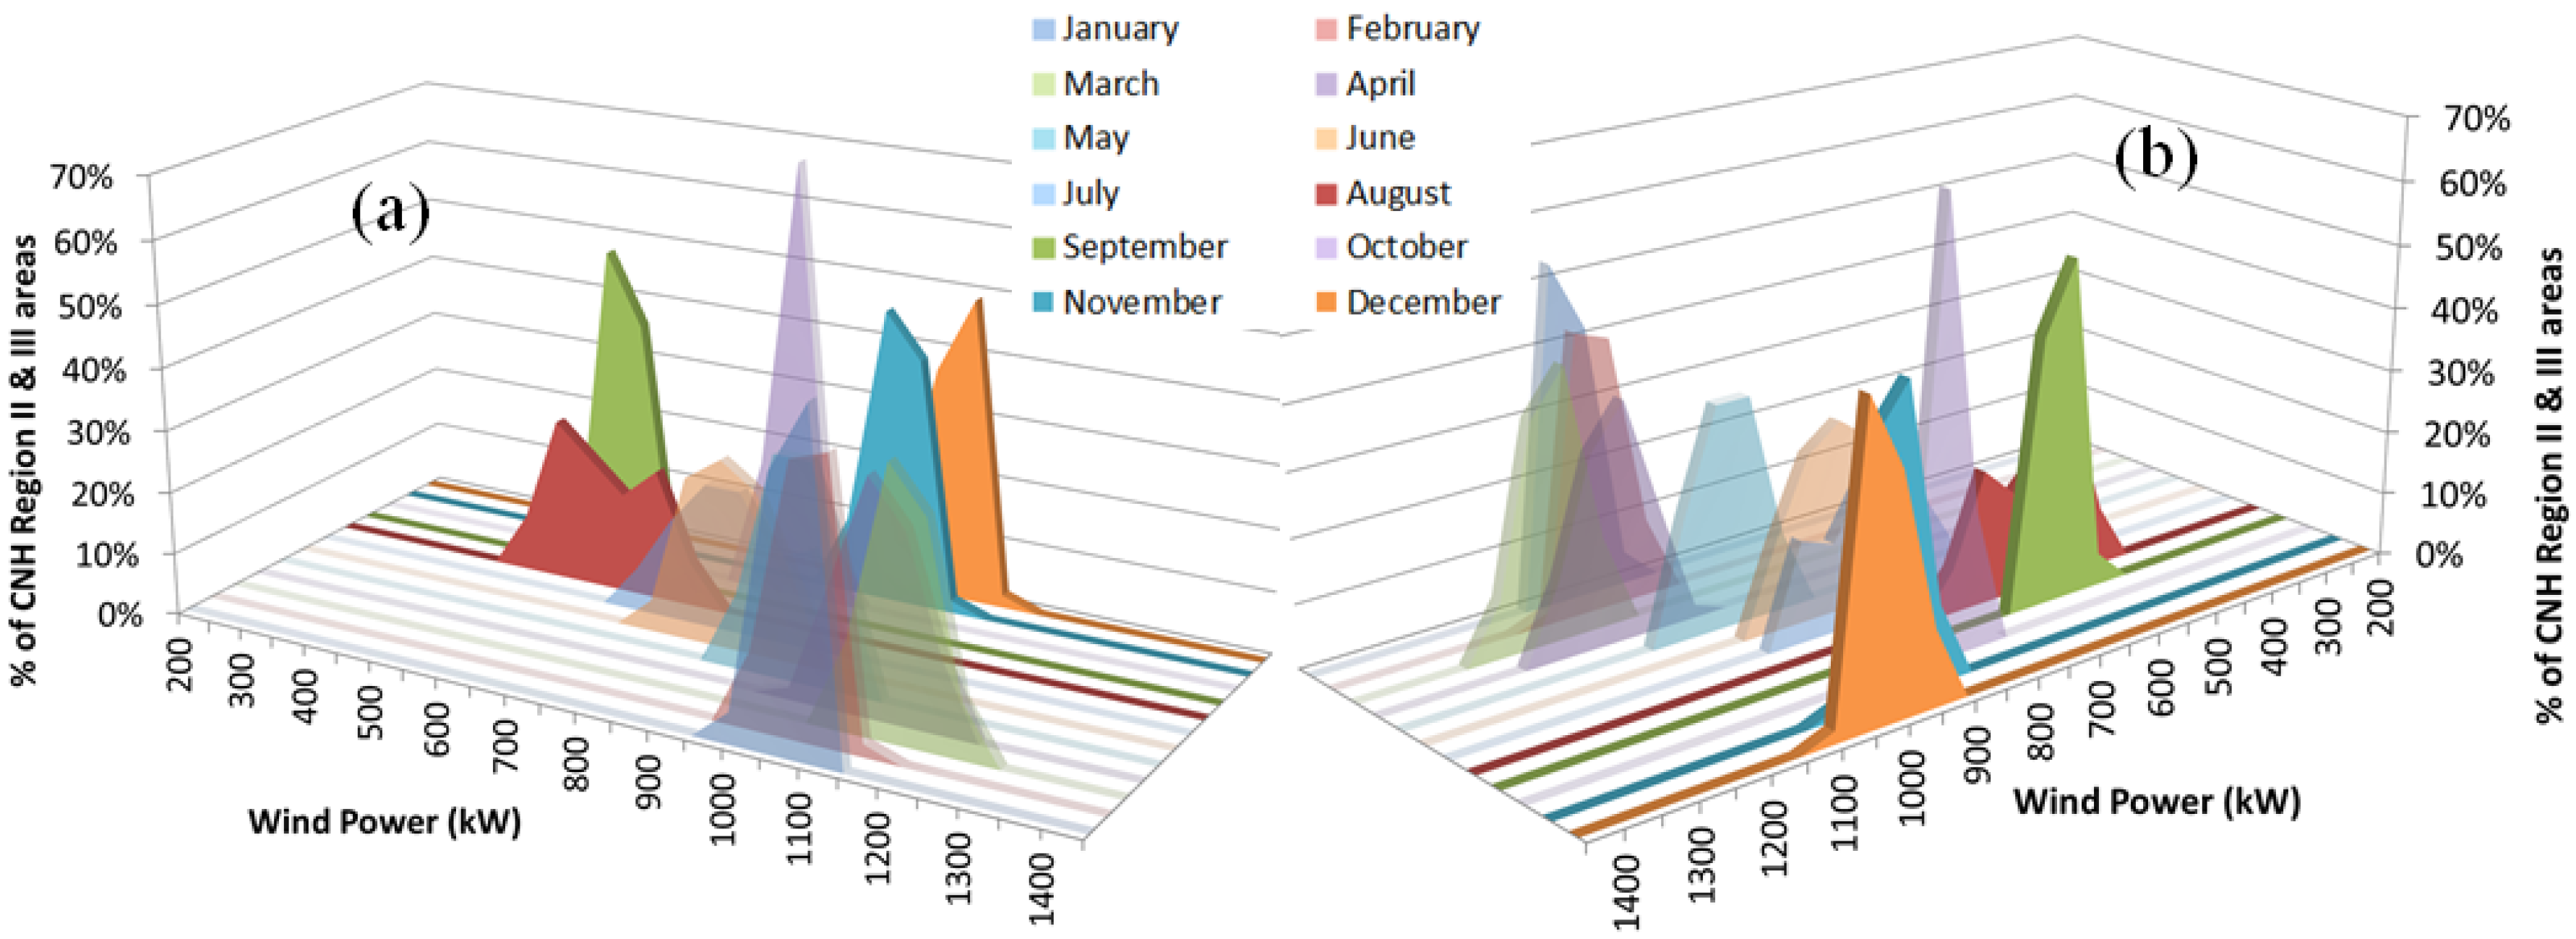
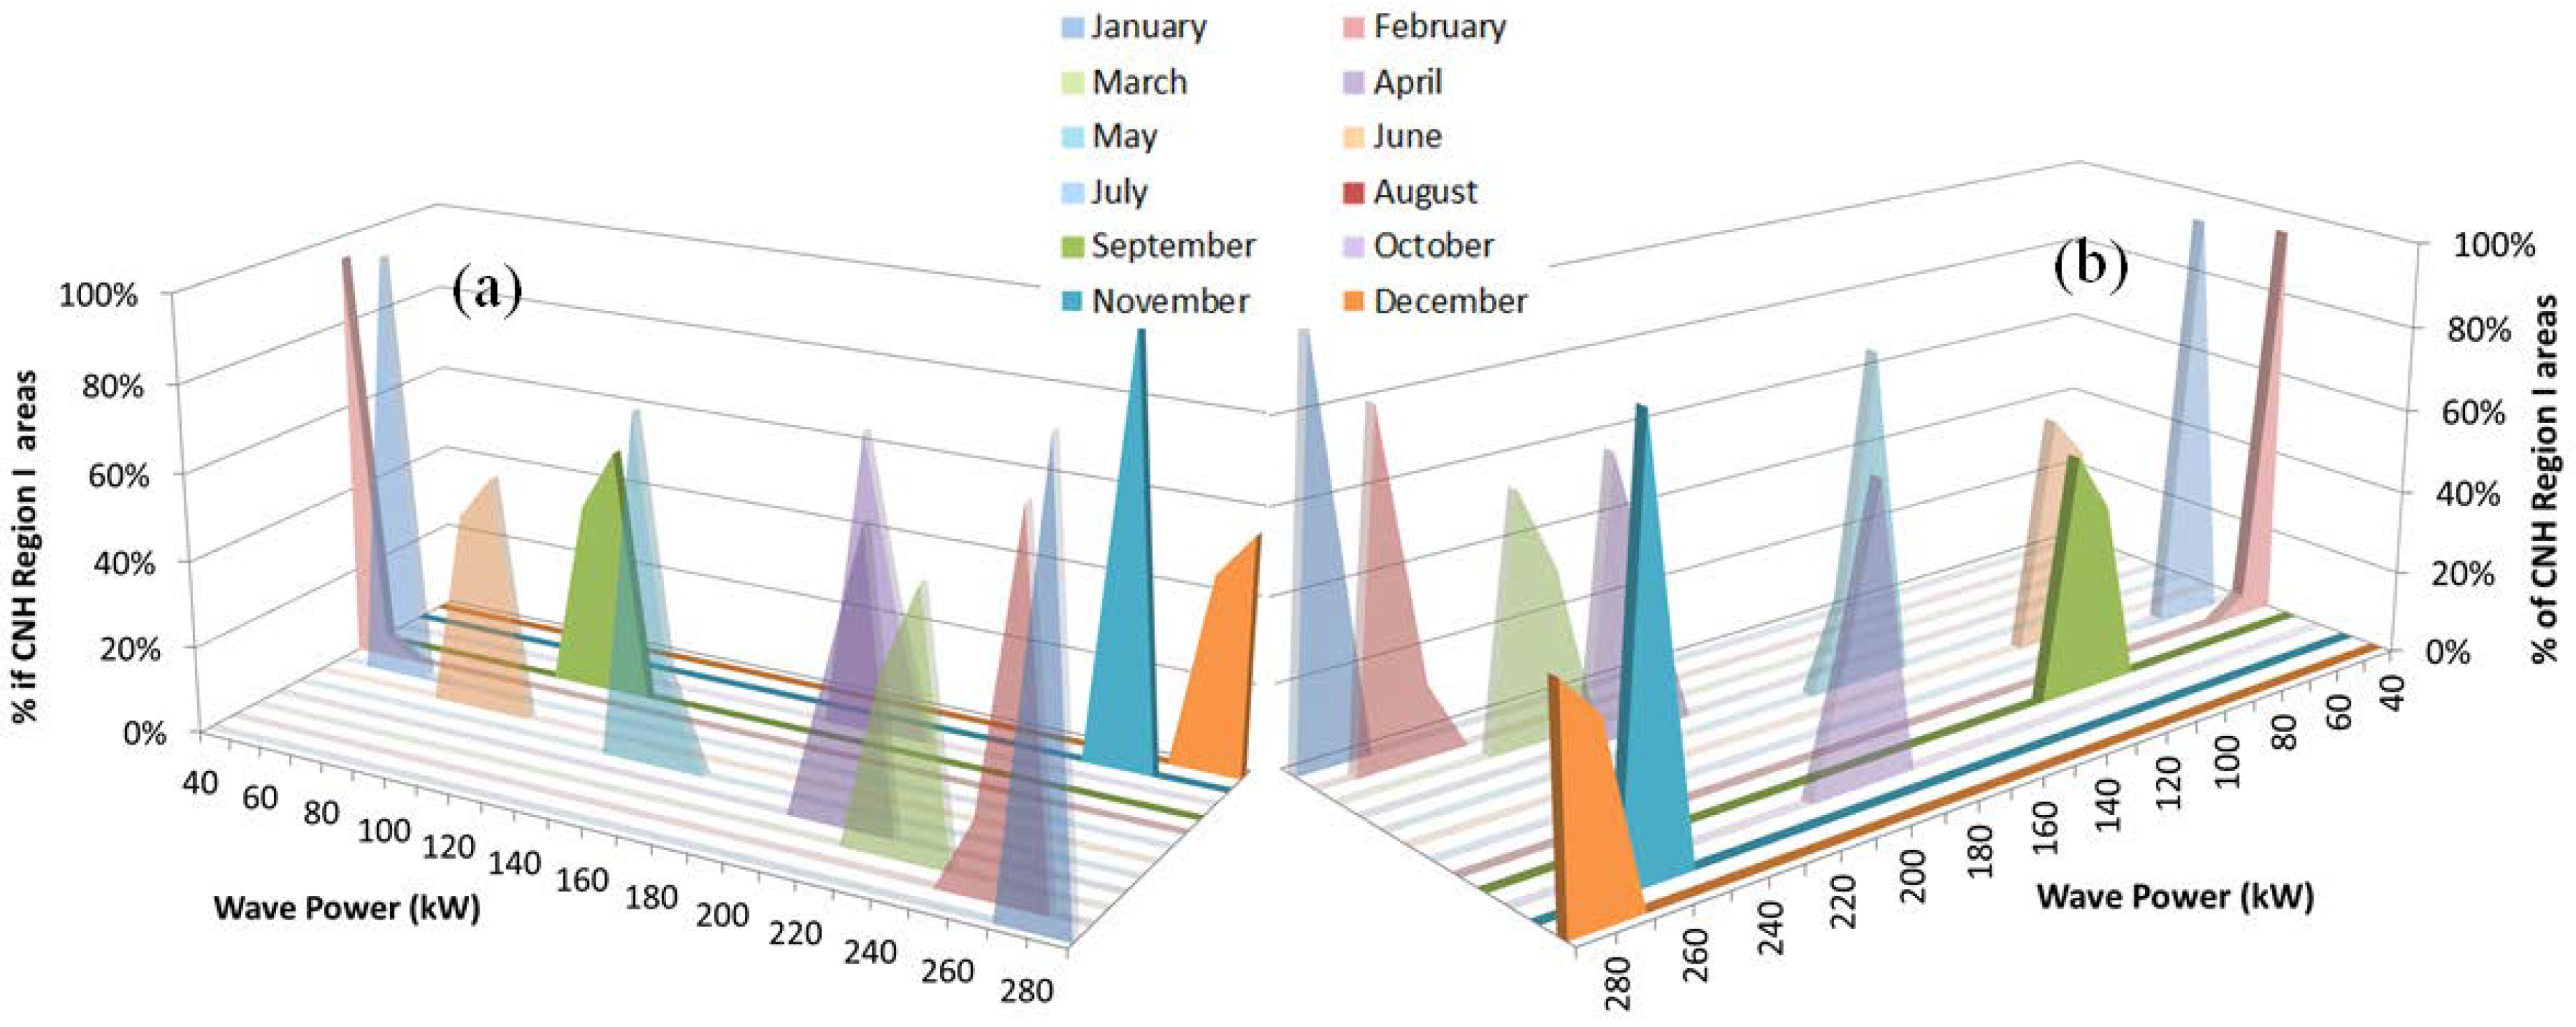
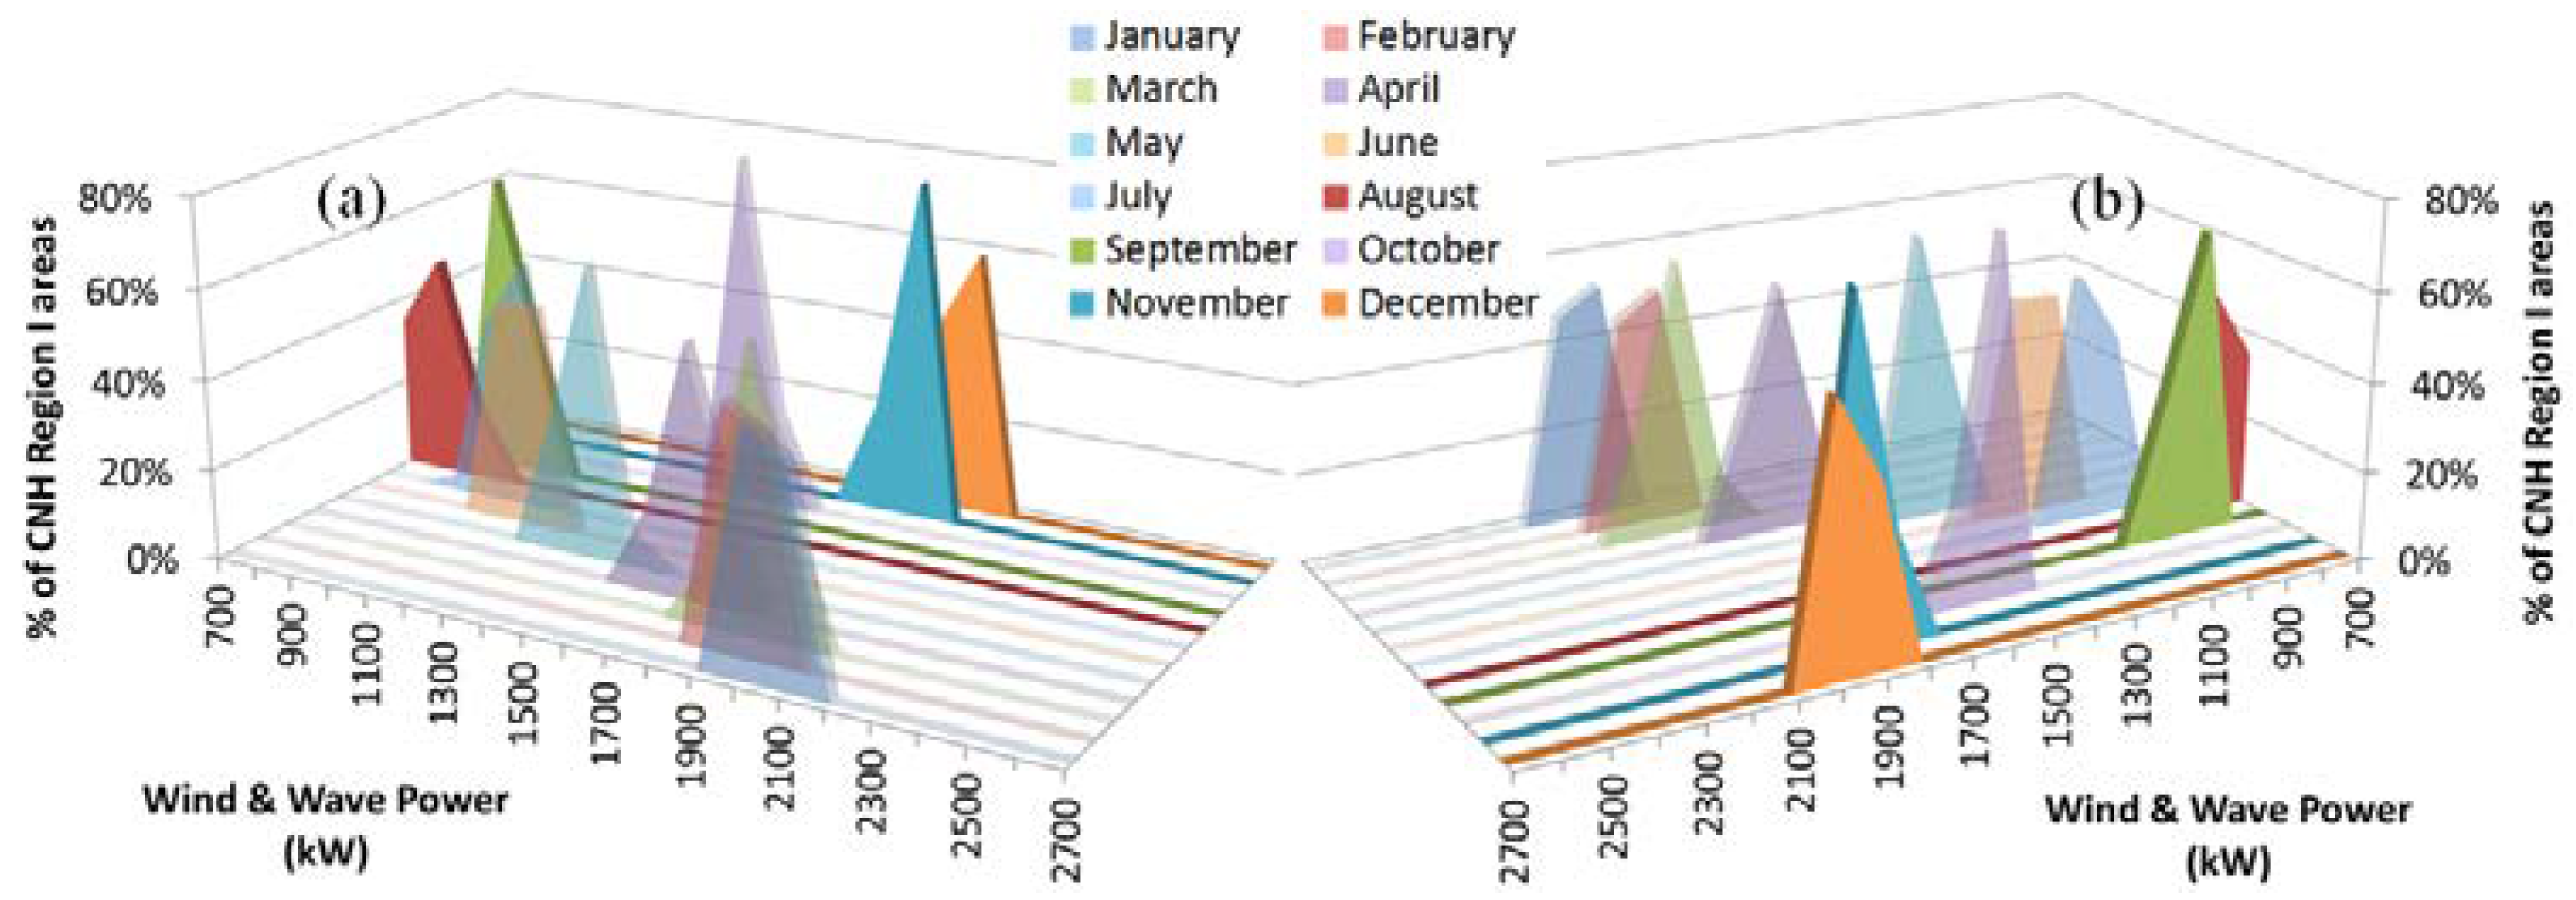
Individual histogram data of different portions of the CNH areas was then considered to better understand the wind energy behavior in these areas. Figure 8 shows that different percentages of CNH region I produced different monthly wind power levels. The ranges of monthly wind power level of CNH region I were within 200 kW, with small variation within the same month. Summer months had lower wind power levels. As for capacity factor, only August showed a poor performance below 20% (600 kW). June, July and September had capacity factors ranging between 20% (600 kW) and 30% (900 kW), while the other months performed above 30%, with best power levels from November to April.
The CNH region II (Figure 9) had lower overall wind power levels than the CNH region I, with a high seasonal behavior. Similarly, with the exception of August, the other months had wind power capacity factor higher than 20%. There were seven months, from November to May, having power performance higher than 30% of nameplate capacity. Furthermore, Table 2 shows that the CHN region III, located in the south of the Gulf of Campeche, had overall low wind power levels and less compact distribution, indicating that wind power in CNH region III had very high variation within a given month. Similarly, most locations in CNH region III have 20% or above capacity factor over the entire year except August and September, and almost all the locations had 30% or above capacity factor from November to May.
3.2. Wave Power Only
A similar histogram analysis related to the wave energy extracted by one Pelamis 750 kW was conducted to investigate the feasibility of using wave energy to supply electricity to the U.S. oil platforms and potential CNH areas (Table 3). By comparing to wind energy results above, it is possible to assess which renewable energy source has better potential for each location. Previous research has estimated that the capacity factor of the Pelamis 750 kW in several locations in Canada would fluctuate from the lowest value of 14.3% in the Tofino Ucluelet location to the highest estimation of 26.2% at the Hibernia Oil Platform [78]. Different research indicated that the Pelamis 750 kW would operate at 20% capacity factor in San Francisco, California [49,77]. In addition, the performances of two other WECs (AquaBuOY and WaveDragon) were evaluated alongside the Pelamis 750 kW in the same Canadian locations. Results indicated that the lowest annual performance among the WECs was the AquaBuOY in Tofino Ucluelet with 9.8% capacity factor, while the highest WEC performance was the WaveDragon with 32.1% at Hibernia Oil Platform [79]. Considering 20% (150 kW) as acceptable capacity factor for Pelamis WEC [69,79], it can be observed from Table 4 and Table 5 that most U.S. oil platform areas appears to be underperforming with capacity factor less than 20%. The proximity of the U.S. oil platforms to the northern coast of the Gulf of Mexico and the dependence of wave energy on northerly weather patterns can explain the low wave energy levels. However, a small number of these oil platforms perform above 20% capacity factor during eight months over the years. It is important to further segment the U.S. oil platform areas or perform individual analysis for each platform to assess the feasibility of supplying electricity with wave energy to a particular platform.
The wave energy behavior in the CNH areas did not show distinctive pattern within the same month. Some locations in the CNH areas had 20% or lower capacity factor, and a considerable number of locations had high wave power levels above 20% capacity factor. From October to May, a large number of locations had capacity factor higher than 20%, and some of them produced 200 kW during five months of a year, which is encouraging. However, it would be necessary to further segment CNH areas to determine the best locations with wave energy potential.
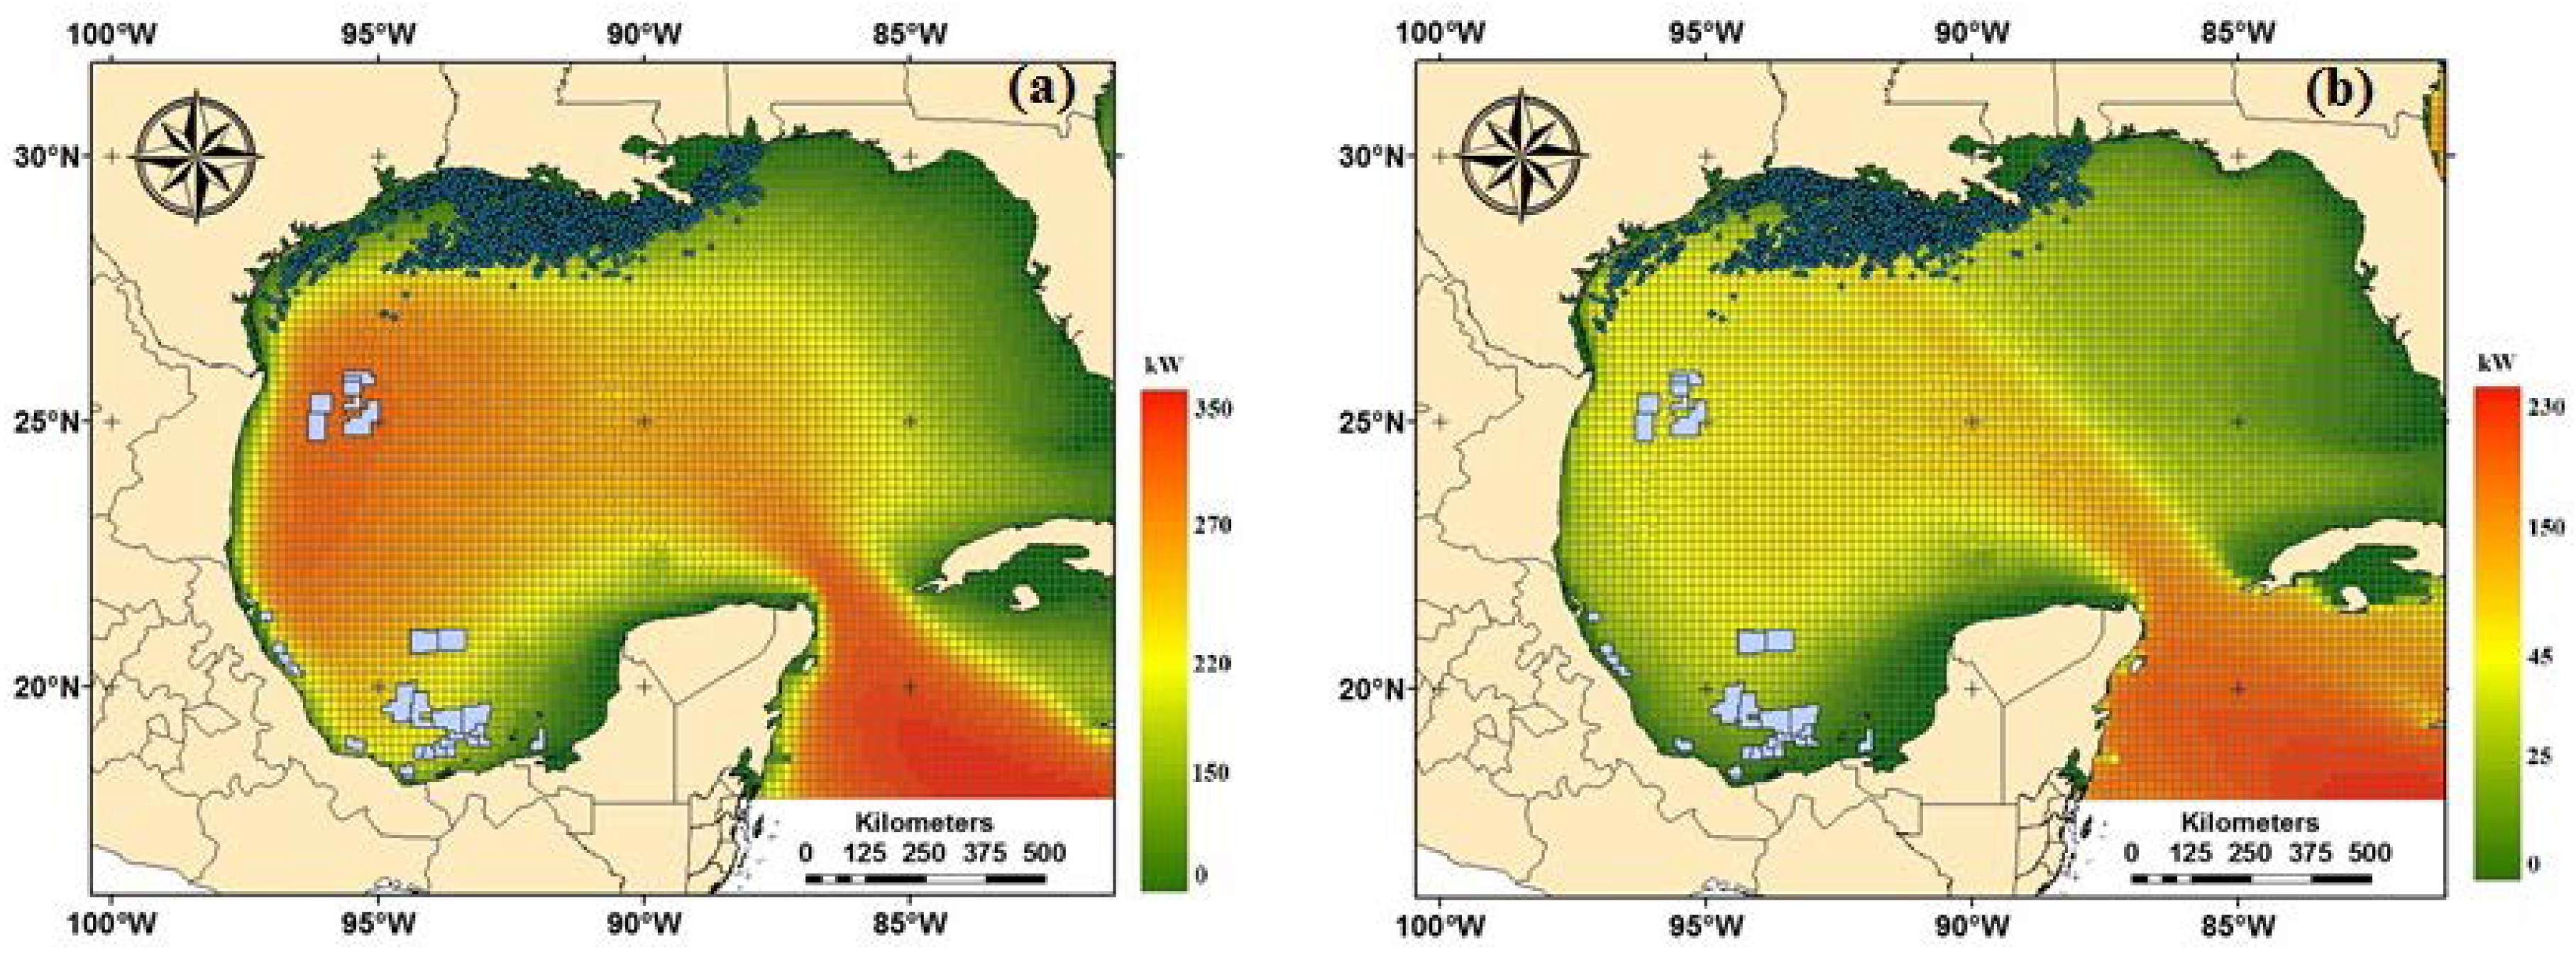
Figure 10 indicates the average wave power in January and August applying the Jenks natural breaks classification method to provide further understanding of the results listed in Table 3. This provides a good contrast for analysis this high variability (geo temporal) renewable energy resource. Figure 10) indicates that the maximum power level was 350 kW in January concentrated mostly in Strait of Yucatan and the northwest coastal section of the Gulf of Mexico, encompassing the CNH areas closer to the U.S.–Mexico EEZ border. The southern section showed low wave power levels, affecting the CNH regions II and III. It directly indicates that CNH areas performed better than U.S. oil platforms during January, and also explains that more than 25% of the CNH areas performed above the 285 kW level as shown in Table 3. According to Figure 10, it can be ascertained that the better performing area mainly belongs to CNH region I and probably some sections of region II. Figure 10b indicates that the highest wave power levels in August occurred in Strait of Yucatan, the central Gulf of Mexico and the southern Texas Coast. It allows discovering of CNH region I as the main CNH area under the influence of the highest wave energy patterns at the northern Gulf of Mexico. The information provided by these maps indicates that it would be beneficial to further segment the CNH areas to better understand wave energy harvesting feasibility.
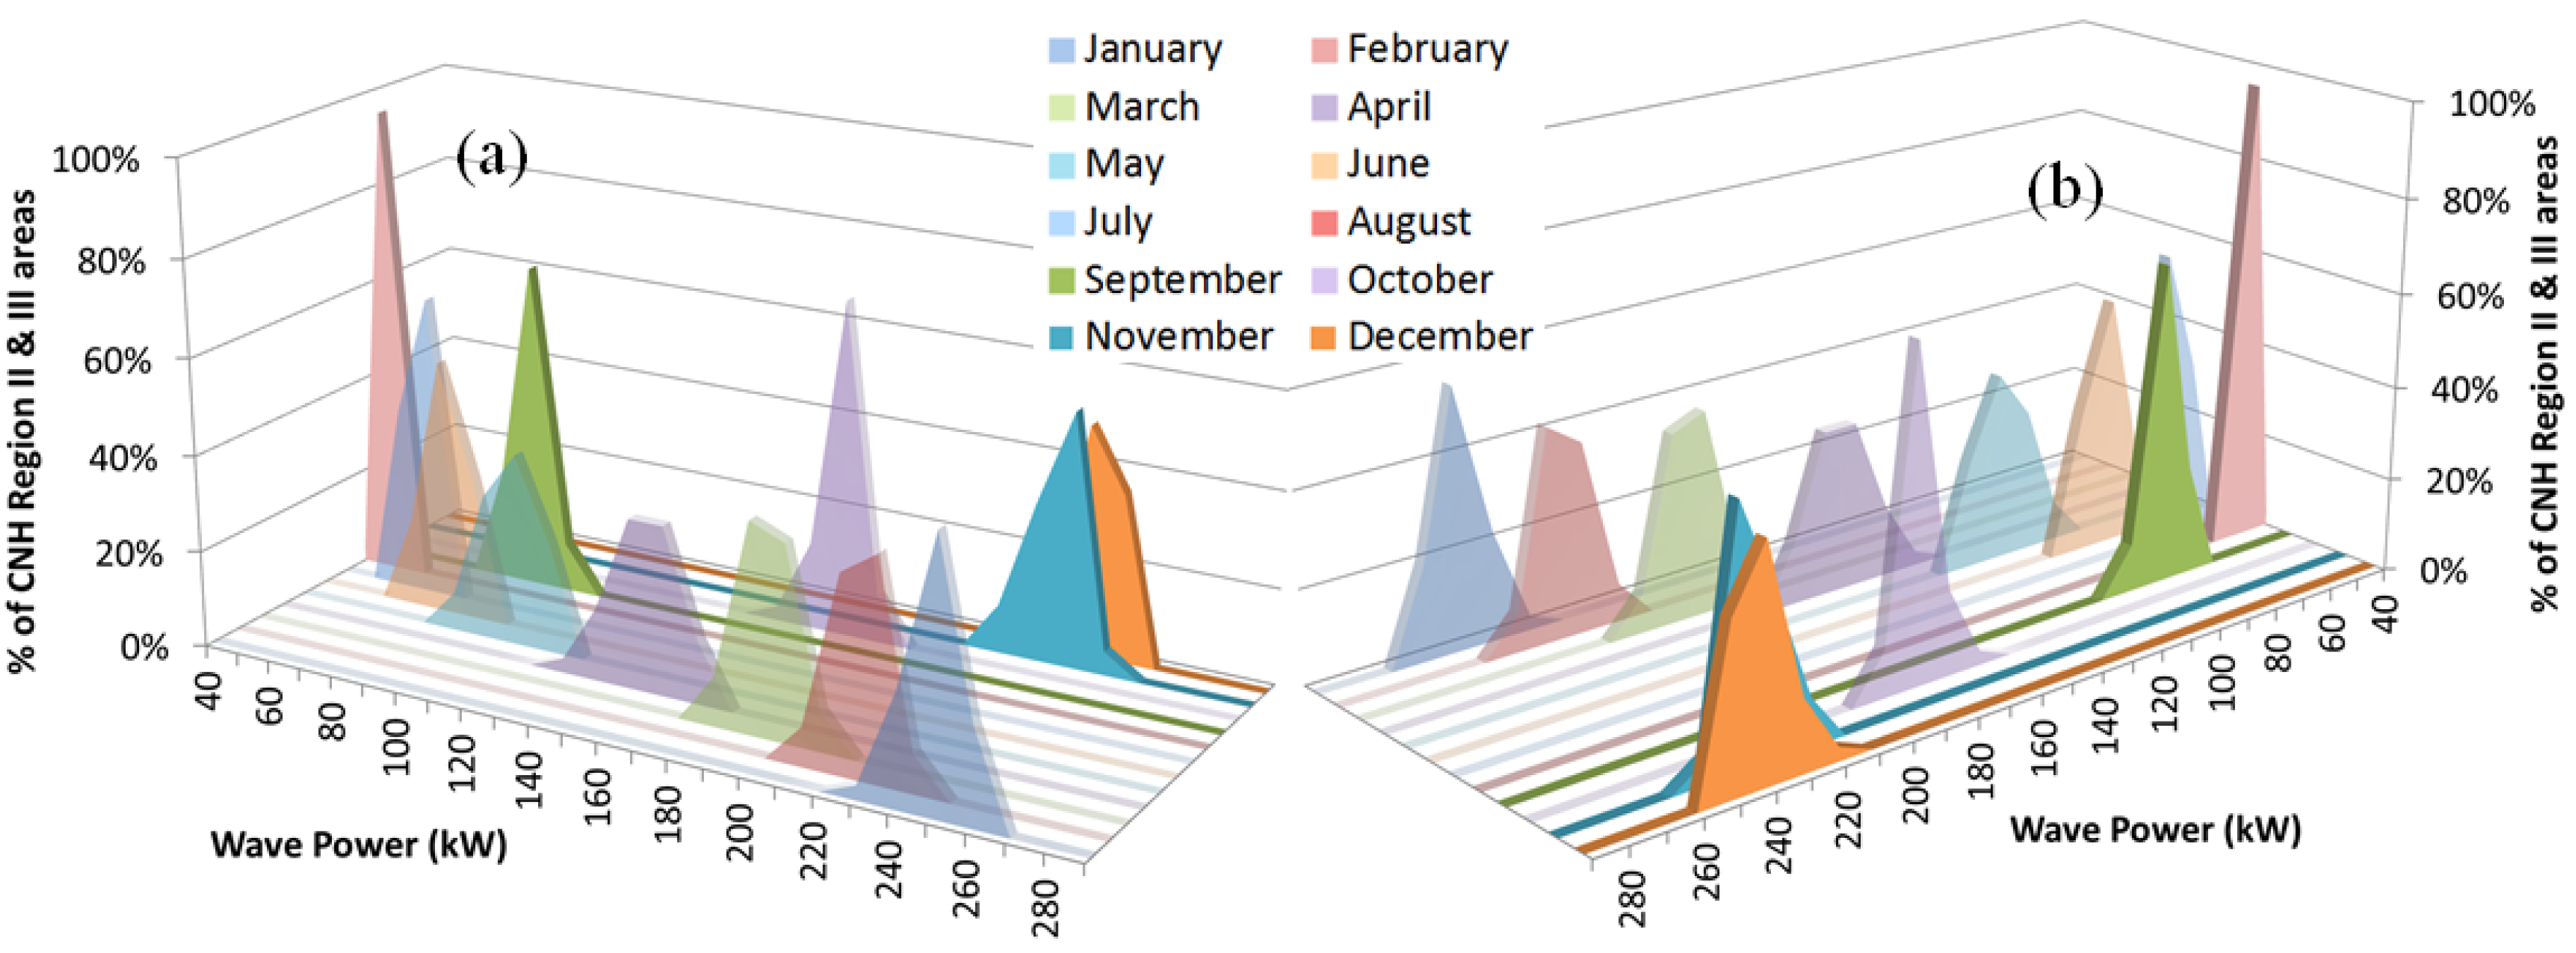
Figure 11 shows the monthly average wave power in CNH region I and II indicating a strong seasonal behavior in region I. The capacity factor was above 20% (150 kW) from October to May, while it shows much more energetic wave behavior from November to April. However, the wave power levels were lower from June to September, due to the seasonal meteorological conditions in the area, leading to the possibility of adjusting the Pelamis WEC to perform better under these different meteorological conditions.
In CNH region II, as shown in Figure 12, the overall wave power was lower than CNH region I, but it was still above the 20% capacity factor from October to March and for almost 50% of the locations in April. The rest of the calendar year showed lower wave power levels.
On the other hand, results of the CNH region III, as shown in Table 4, indicates acceptable performance at most locations from November to February and almost 50% of locations from October to April. The wider histogram distribution indicates less similar behavior in this region in regards to wave power. It is possible to analyze particular areas leading to finding promising locations for longer periods of time with acceptable performance.
3.3. Wind and Wave Power Combined
After independently assessing the wave and wind power potential, it was important to combine them, considering simultaneously extracting both renewable energy resources. As previously discussed the Gulf of Mexico is not uniform in its spatial and time distribution of wind and wave energy, with a large number of locations having high variability and diverse behavior on the wind and wave power potentials. Therefore, the combination of both resources could aid in reducing variability and enhance energy production at those locations [26,48,69,80,81].
Since the equipment considered for this research have different nameplate capacities, a combination of one Vesta V90 3 MW wind turbine with four Pelamis 750 kW WEC was applied, creating an installation with total nameplate capacity of 6 MW, equally divided between both resources. Therefore, an array of four Pelamis 750 kW and one Vestas V90 3 MW was considered for each location of US oil platforms and for the locations of the CNH regions. Figure 13 shows yearly average wind and wave power combinations with the proposed installation, indicating a pattern of high energy in the U.S.–Mexico border coast extending to the central Gulf of Mexico to the western section of the Yucatan Peninsula. When compared with the individual patterns of wind and wave power, this map indicates that the variability of average renewable energy was reduced and the areas above the 20% capacity factor threshold (1.2 MW) was extended to larger sections of the Gulf of Mexico, creating more adequate potential areas.
Table 5 indicates that a large number of locations in U.S. oil platforms areas between October and April have 20% or higher capacity factor, with power reduction occurring during the summer months. It will be important to perform specific analysis for desired locations to ascertain if the use of one of the available resources or its combination is the optimal alternative, depending on the obtained variability reduction and the behavior of the resources during the year. On the other hand, Table 5 also shows that at least two distinctive behaviors were presented in the CNH areas when combining wind and wave power. One of the potential behaviors is having high combined power output with potentially only underperforming on the months of June to August. Overall, a large number of locations in the CNH areas performed over the threshold limit from October to April.
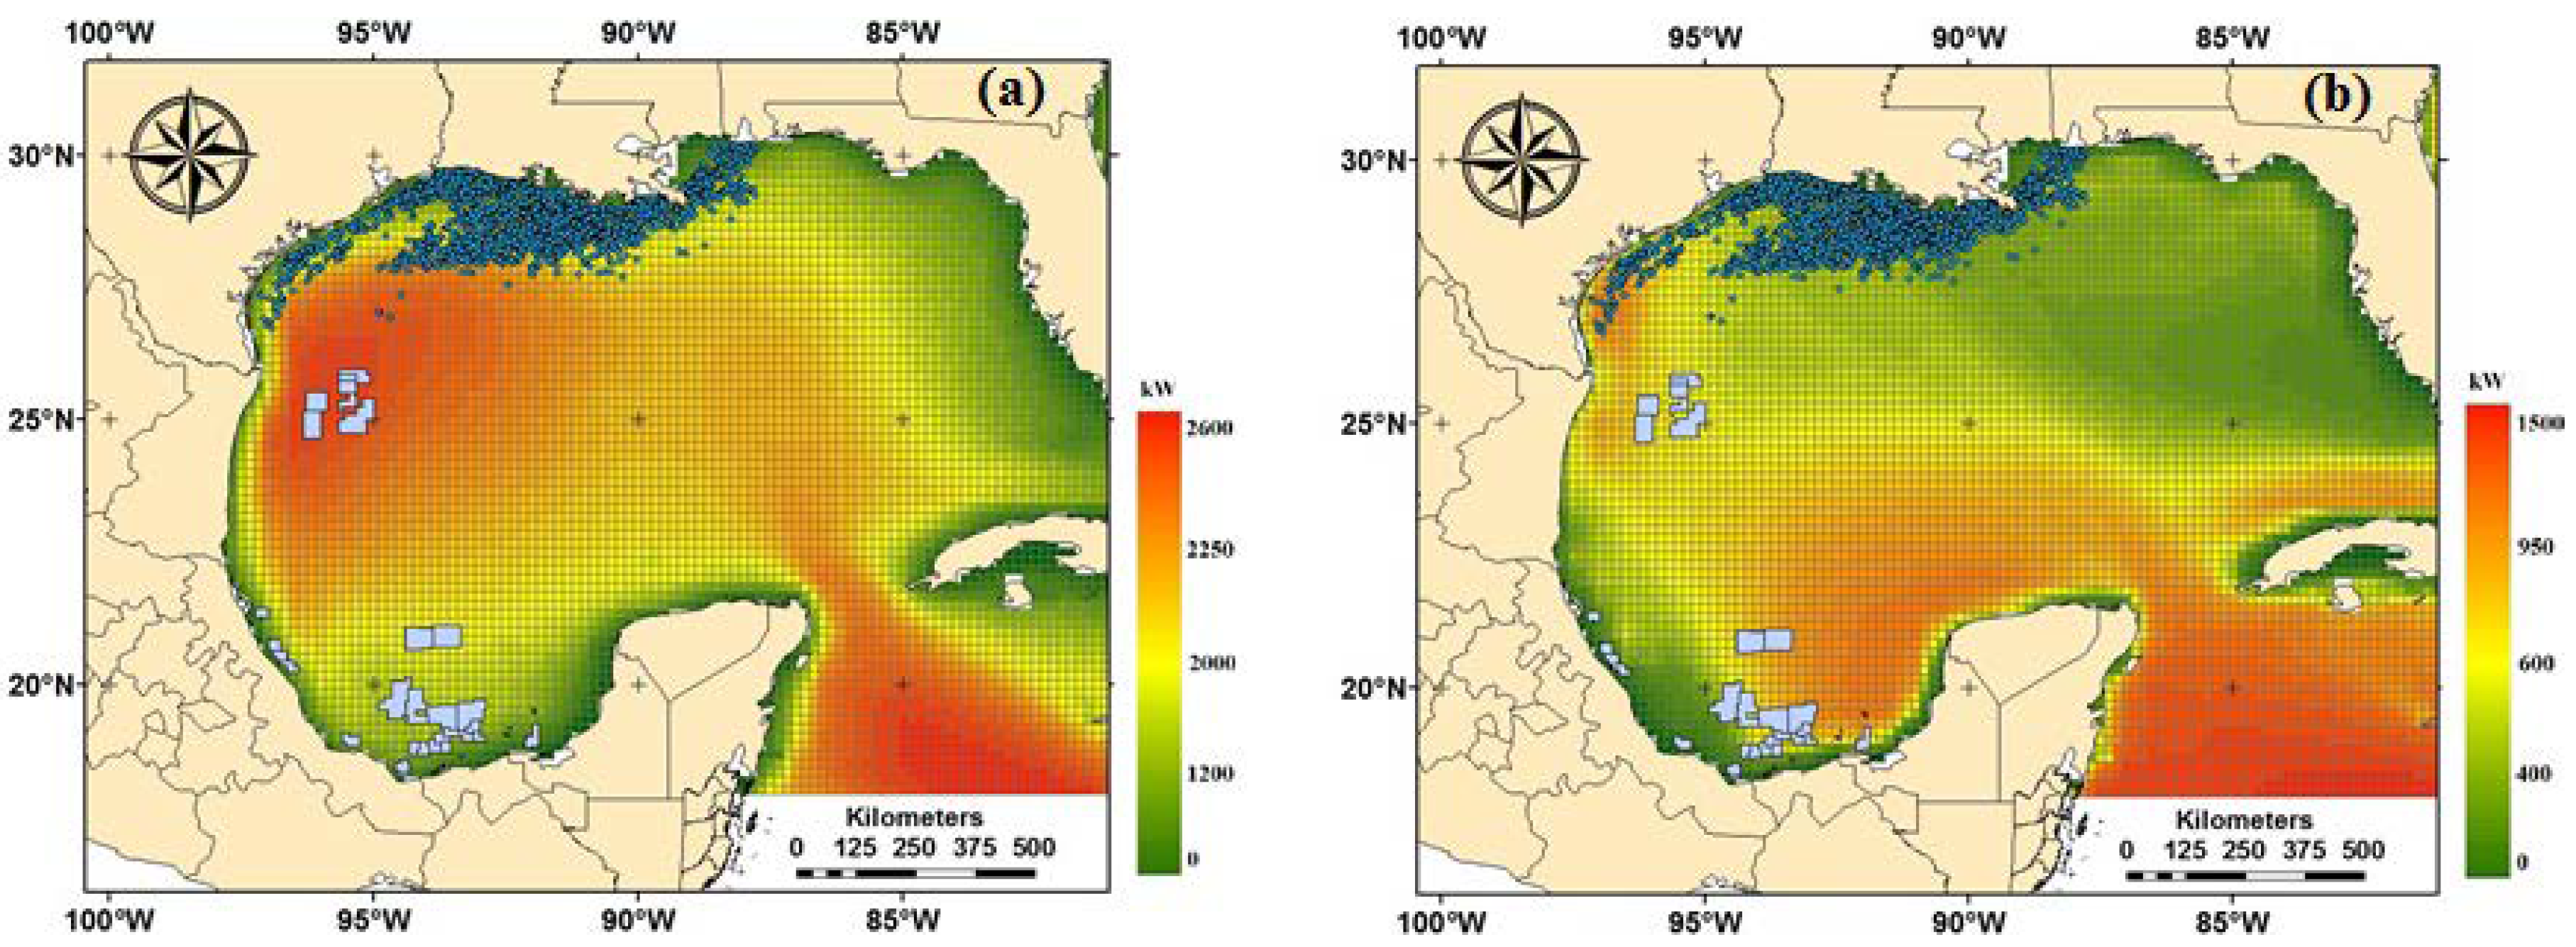
Maps for the months of January and August were created to better understand the diverse seasonal and geographical performance of the combined power output (Figure 14). The Jenks natural breaks classification method was used to provide further analysis tools on results previously presented. Figure 14a shows that the highest power output in January could reach up to 2600 kW concentrated on the northwest region of the Gulf of Mexico, benefiting the CNH region I and a number of U.S. oil platforms. It explains that the CNH areas had better performance than the U.S. oil platforms during January. CNH region I and part of region II were under moderate power levels, shown as the yellow ring surrounding the high red power areas. The power range bin 2500–2600 kW in Table 5 contains more than 25% of the CNH areas, and is disconnected from the general performance data on the CNH table. It indicates that different sections of the CNH areas are under diverse wind and wave energy influences, which is validated by Figure 14a. On the other hand, the highest power level in August, the lowest performing month of the year, was 1500 kW, and it was concentrated on the coastal region on the U.S.–Mexico border and on the south of the Gulf of Mexico (Figure 14b), benefiting some of the U.S. oil platforms and the CNH region III.
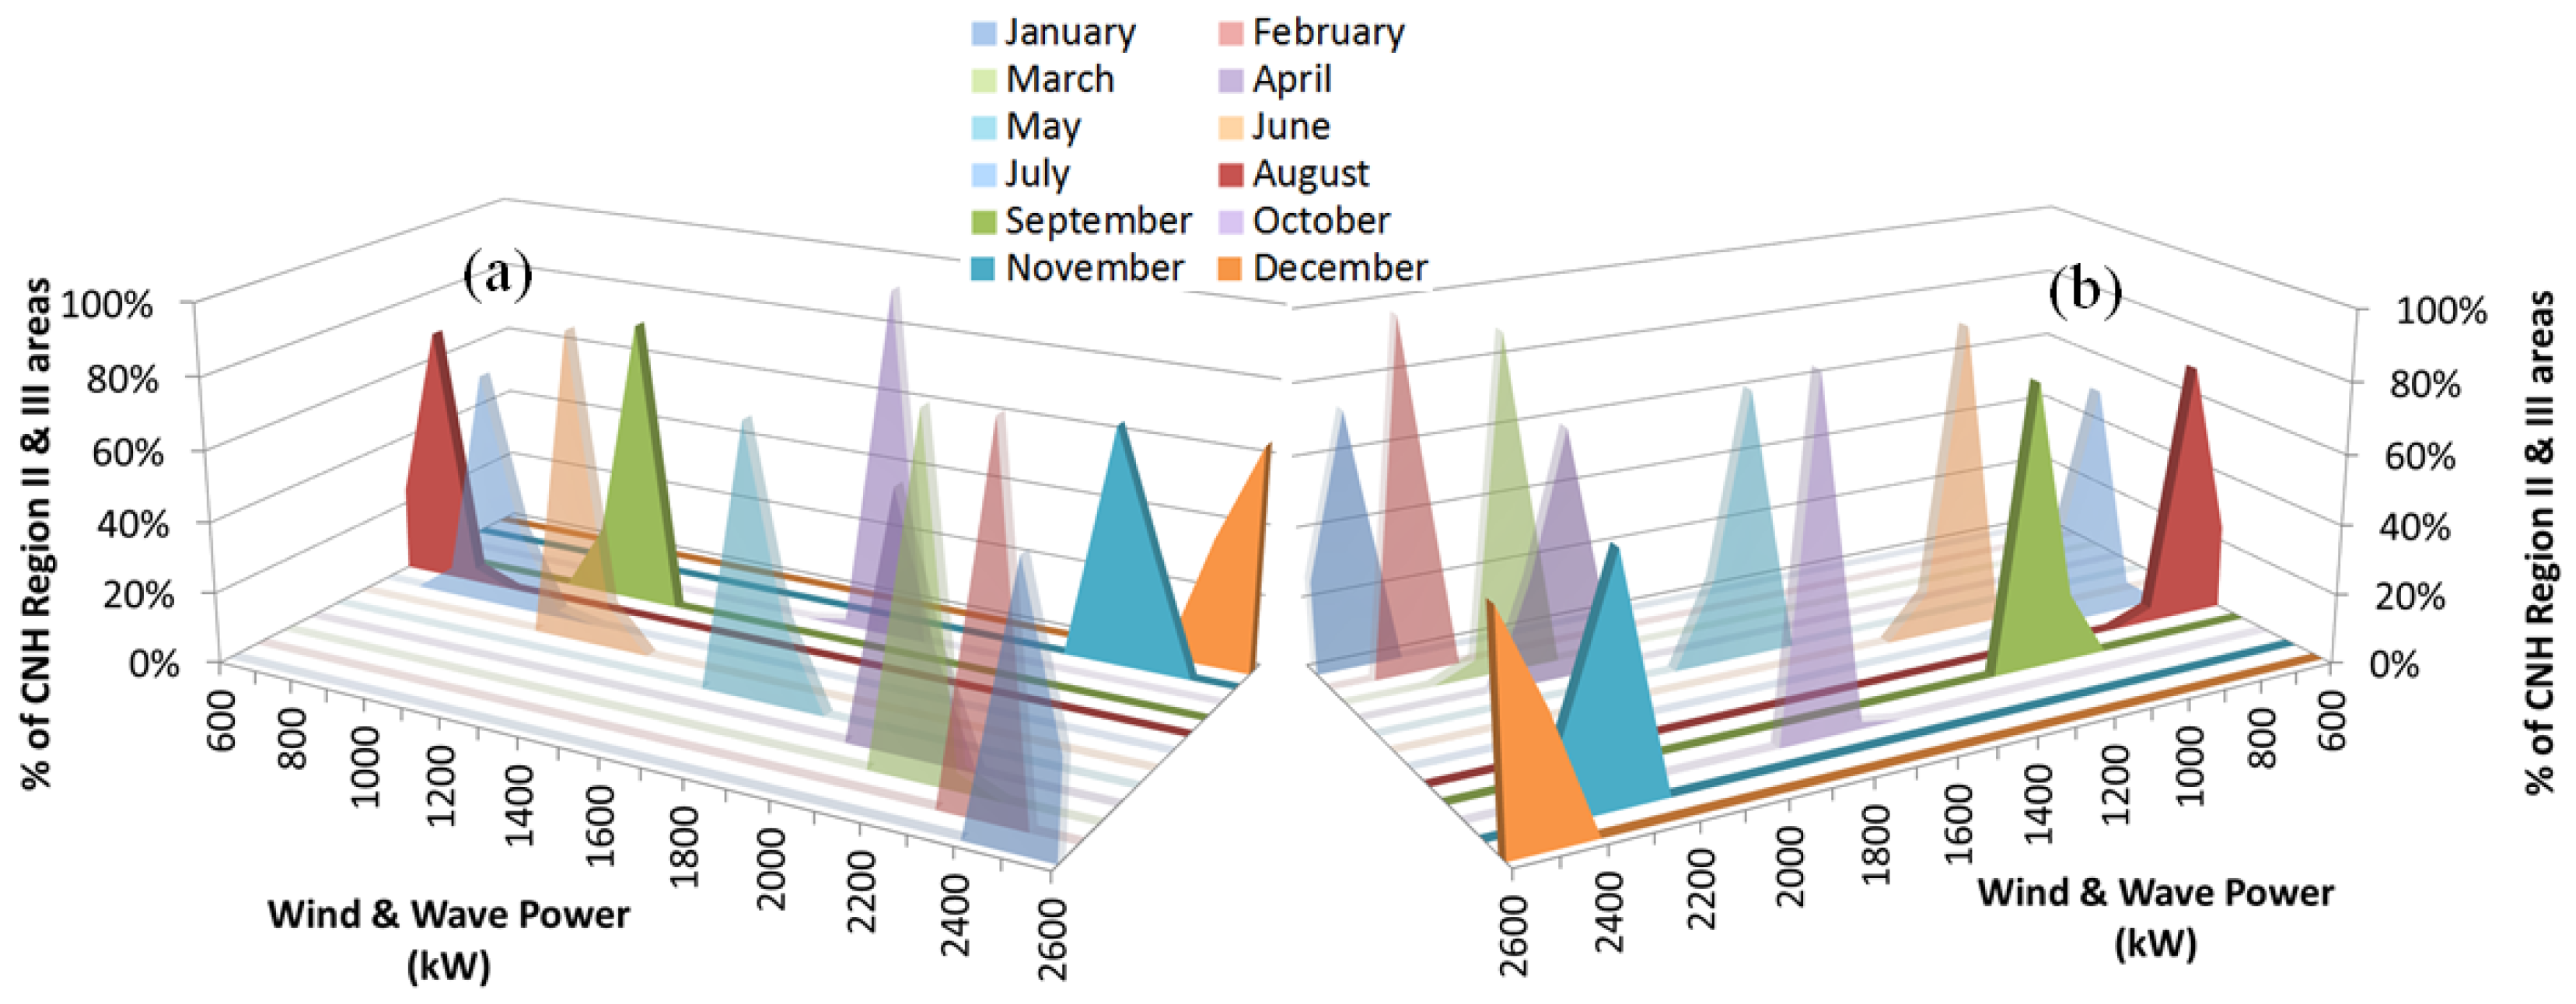
A better understanding of the wind and wave energy combined behavior was obtained by creating histograms segmenting the CNH areas in three major regions. The CNH region I as shown in Figure 15 had a very clear seasonal behavior with small variation in each month, where the capacity factor was over 20% from October to May. The CNH region II as shown in Figure 16 had higher overall power levels than the CNH region I, and it had only three months, from July to September, underperforming below the 20% threshold with six months above 2000 kW.
Table 6 shows that the results of the CNH region III for each month spread over a larger range of power levels, indicating that the behavior of the different areas was not consistent. It shows a right skewedness curve or trend for most months, except August. The power output in most locations remained above the 20% threshold in seven months, which indicates a significant number of locations in the CNH region III having good power levels.
4. Conclusions
The assessment of power extracted from wave and wind in the Gulf of Mexico for its application in offshore oil industry showed promising results. The concept of connecting offshore oil installations to wave and wind harvesters and simultaneously connecting them to the onshore grid is feasible for both U.S. and Mexico EEZ in the Gulf of Mexico. Research results indicated that the distance from the coast to current and planned offshore facilities is mostly on the shortest ranges of the feasibility threshold, which is encouraging.
Analysis performed for the assessment wind and wave power output in the Gulf of Mexico showed a lack of spatial and temporal uniformity, with high geo temporal variability on both wind and wave resources. Results provided by the maps and statistical tools indicated that most of the U.S. oil platforms and CNH areas have very good potential for the extraction of either wind or wave energy. Furthermore, there are a significant number of locations in the Gulf of Mexico where renewable energy extraction for the combined two sources is feasible, generating significant economic and environmental advantages.
The maps generated by the GIS and statistical tools allows for better understanding of the statistical results generated by the methodology. In addition, these maps show that the combination of wind and wave energy promoted the advantages in many locations, increasing the energy extraction levels and reducing its variability. Synergies generated by the proposed system, considering each resource individually or combined, could be maximized in an important number of locations on the Gulf of Mexico.
Considering that some of the locations evaluated are better suited for the extraction of just one renewable energy resource or for the combination of both resources, it would be important to perform individual analysis for particular areas (regional analysis) applying the proposed methodology for each location with better spatial resolution if possible. This will help the decision making process of the design of the best system in each particular oil installation location.
Regional analysis will be of special importance for both future projects and existing installations, which economic and environmental characteristics would be enhanced by including renewable energy to its overall operation, allowing for savings on electricity consumption, potential extra income from sales of energy to the onshore grid and reduction on the emission of pollutants to the atmosphere.
It should be noted that the equipment selected in this paper is incidental to the methodology. The main requirement is to have power curve from the selected equipment that allows calculating its power output while operating under different geographic and temporal meteorological conditions. Since power curves of different equipment can be incorporated to the methodology on a plug-in basis to calculate the required power output, the possibility of choosing different equipment with the same methodology is one of the strengths, allowing researchers and developers to perform sensitivity analysis on the selection of the best technology for each particular location. In addition, the methodology could be expanded to other geographical regions with the inclusion of the corresponding historical meteorological data.
Future research will evaluate the correlation between wind and wave in the Gulf of Mexico, particularly considering the dependence of wave to localized weather patterns and monthly as well as seasonal variations of both resources. As previously indicated, both wind and wave resources are higher during fall and winter seasons with a transitional period during spring and low energy during summer [66,67,68]. Previous research has also indicated that the combination of both resources reduces the variability of the wave resource and increases overall power output [66]. Future research will evaluate the complementarity of both resources and the possible synergies related to variability reduction achieved by its combination.
Future research will also include comparative analysis between different equipment to harvest wind and wave energy, evaluating the most adequate technology for each particular location. The plug in capability for diverse power curves offered by the methodology will allow for the development of these comparative analyses, applying the same underlying meteorological and geographical data. New insights on the development of equipment could be derived from these comparative analyses. Evaluating several designs it could be possible to gain better understanding on the characteristics that perform better on each location and to find feasible combinations.
Author Contributions
Francisco Haces-Fernandez developed the research method and completed the research activities under the supervision of Hua Li and David Ramirez. The initial paper was written by Francisco Haces-Fernandez, while Hua Li made major revision on the draft paper and David Ramirez also revised the draft paper. Both Hua Li and David Ramirez approved the final version to be published.
Acknowledgments
The authors are thankful to the support from CONACYT (Consejo Nacional de Ciencia y Tecnología) and COTACYT (Consejo Tamaulipeco de Ciencia y Tecnologia) through the scholarship number 218681, Texas A&M University-Kingsville, Eagle Ford Center for Research and Outreach, the Center for Research Excellence in Science and Technology-Research on Environmental Sustainability in Semi-Arid Coastal Areas (CREST-RESSACA) and National Science Foundation (award # EEC 1359414).
Conflicts of Interest
The authors declare no conflict of interest.
Abbreviations
| CNH | Comisión Nacional de Hidrocarburos |
| EEZ | Exclusive Economic Zones |
| EMEC | European Marine Energy Centre |
| GIS | Geographical Information Systems |
| NOAA | National Oceanic and Atmospheric Administration |
| PEMEX | Petroleos Mexicanos |
| PM10 | Particulate Matter 10 micrometers or less |
| PM2.5 | Particulate Matter 2.5 micrometers or less |
| VOC | Volatile Organic Compounds |
| WEC | Wave Energy Converter |
References
- Korpås, M.; Warland, L.; He, W.; Tande, J.O.G. A case-study on offshore wind power supply to oil and gas rigs. Energy Procedia 2012, 24, 18–26. [Google Scholar] [CrossRef]
- He, W.; Uhlen, K.; Hadiya, M.; Chen, Z.; Shi, G.; del Rio, E. Case study of integrating an offshore wind farm with offshore oil and gas platforms and with an onshore electrical grid. J. Renew. Energy 2013, 2013, 607165. [Google Scholar] [CrossRef]
- Årdal, A.R.; Undeland, T.; Sharifabadi, K. Voltage and frequency control in offshore wind turbines connected to isolated oil platform power systems. Energy Procedia 2012, 24, 229–236. [Google Scholar] [CrossRef]
- Årdal, A.R. Feasibility Studies on Integrating Offshore Wind Power with Oil Platforms. Master’s Thesis, Institutt for Elkraftteknikk, Trondheim, Norway, 2011. [Google Scholar]
- Kolstad, M.L.; Sharifabadi, K.; Årdal, A.R.; Undeland, T.M. Grid integration of offshore wind power and multiple oil and gas platforms. In Proceedings of the 2013 MTS/IEEE OCEANS-Bergen, Bergen, Norway, 10–13 June 2013; pp. 1–7. [Google Scholar]
- Kolstad, M.L. Integrating Offshore Wind Power and Multiple Oil and Gas Platforms to the Onshore Power Grid Using VSC-HVDC Technology. Mar. Technol. Soc. J. 2014, 48, 31–44. [Google Scholar] [CrossRef]
- Marvik, J.I.; Øyslebø, E.V.; Korpås, M. Electrification of offshore petroleum installations with offshore wind integration. Renew. Energy 2013, 50, 558–564. [Google Scholar] [CrossRef]
- Aardal, A.R.; Marvik, J.I.; Svendsen, H.; Tande, J.O.G. Study of Offshore Wind as Power Supply to Oil and Gas Platforms. In Proceedings of the Offshore Technology Conference, Houston, TX, USA, 30 April–3 May October 2012. [Google Scholar]
- TCEQ—Eastern Research Group, Inc. Emissions from Oil and Gas Production Facilities. Texas Commission on Environmental Quality. TCEQ. Final Report. TCEQ Contract 582-7-84003 August 31, 2007. ERG No. 0227.00.001.001. Available online: https://www.tceq.texas.gov/assets/public/implementation/air/am/contracts/reports/ei/5820784003FY0701-20090831-ergi-ei_from_old_gas_facilities.pdf (accessed on 4 July 2017).
- Villasenor, R.; Magdaleno, M.; Quintanar, A.; Gallardo, J.C.; López, M.T.; Jurado, R.; Vallejo, C.J. An air quality emission inventory of offshore operations for the exploration and production of petroleum by the Mexican oil industry. Atmos. Environ. 2003, 37, 3713–3729. [Google Scholar] [CrossRef]
- O’Connor, P.A.; Cleveland, C.J. US Energy Transitions 1780–2010. Energies 2014, 7, 7955–7993. [Google Scholar] [CrossRef]
- Han, S.; Zhang, B.; Sun, X.; Han, S.; Höök, M. China’s Energy Transition in the Power and Transport Sectors from a Substitution Perspective. Energies 2017, 10, 600. [Google Scholar] [CrossRef]
- Pierobon, L. Novel Design Methods and Control Strategies for Oil and Gas Offshore Power Systems; DTU Mechanical Engineering: Lyngby, Denmark, 2014. [Google Scholar]
- Svendsen, H.G.; Hadiya, M.; Øyslebø, E.V.; Uhlen, K. Integration of offshore wind farm with multiple oil and gas platforms. In Proceedings of the 2011 IEEE PES Trondheim PowerTech, Trondheim, Norway, 19–23 June 2011; pp. 1–3. [Google Scholar]
- Boxem, T.; Koornneef, J.; van Dijk, R.; Halter, M.; EBN, E.N.; Breunesse, E.; Prins, J. System Integration Offshore Energy: Innovation Project North Sea Energy; The Netherlands Organization for Applied Scientific Research (TNO): Hague, The Netherlands, 2016. [Google Scholar]
- Jepma, C.J. On the Economics of Offshore Energy Conversion: Smart Combinations. Converting Offshore Wind Energy into Green Hydrogen on Existing Oil and Gas Platforms in the North Sea. Energy Delta Institute (EDI). 3 February 2017. Available online: https://www.gasmeetswind.eu/wp-content/uploads/2017/05/EDI-North-Sea-smart-combinations-final-report-2017.pdf (accessed on 3 July 2017).
- Mundheim, K. Monotower production platform swith renewable energy. In Proceedings of the Offshore Mediterranean Conference and Exhibition, Ravenna, Italy, 28–30 March 2007. [Google Scholar]
- Nielsen, J.S.; Sørensen, J.D. Methods for risk-based planning of O&M of wind turbines. Energies 2014, 7, 6645–6664. [Google Scholar]
- Halabi, M.A.; Al-Qattan, A.; Al-Otaibi, A. Application of solar energy in the oil industry—Current status and future prospects. Renew. Sustain. Energy Rev. 2015, 43, 296–314. [Google Scholar] [CrossRef]
- Yang, M.; Khan, F.I.; Sadiq, R.; Amyotte, P. A rough set-based quality function deployment (QFD) approach for environmental performance evaluation: A case of offshore oil and gas operations. J. Clean. Prod. 2011, 19, 1513–1526. [Google Scholar] [CrossRef]
- Wilson, J.C.; Elliott, M.; Cutts, N.D.; Mander, L.; Mendão, V.; Perez-Dominguez, R.; Phelps, A. Coastal and Offshore Wind Energy Generation: Is It Environmentally Benign? Energies 2010, 3, 1383–1422. [Google Scholar] [CrossRef]
- Lu, S.Y.; Jason, C.S.; Wesnigk, J.; Delory, E.; Quevedo, E.; Hernández, J.; Anastasiadis, P. Environmental aspects of designing multi-purpose offshore platforms in the scope of the FP7 TROPOS Project. In Proceedings of the OCEANS 2014, Taipei, Taiwan, 7–10 April 2014. [Google Scholar]
- Smailes, M.; Ng, C.; Mckeever, P.; Shek, J.; Theotokatos, G.; Abusara, M. Hybrid, Multi-Megawatt HVDC Transformer Topology Comparison for Future Offshore Wind Farms. Energies 2017, 10, 851. [Google Scholar] [CrossRef]
- Hyttinen, M.; Lamell, J.O.; Nestli, T.F. New application of voltage source converter (VSC) HVDC to be installed on the gas platform Troll A. In Proceedings of the Cigre Session, New Delhi, India, 17–18 November 2004; p. B4-210. [Google Scholar]
- Antonio, F.d.O. Wave energy utilization: A review of the technologies. Renew. Sustain. Energy Rev. 2010, 14, 899–918. [Google Scholar]
- Perez-Collazo, C.; Greaves, D.; Iglesias, G. A review of combined wave and offshore wind energy. Renew. Sustain. Energy Rev. 2015, 42, 141–153. [Google Scholar] [CrossRef]
- Silva, D.; Rusu, E.; Soares, C.G. Evaluation of various technologies for wave energy conversion in the Portuguese nearshore. Energies 2013, 6, 1344–1364. [Google Scholar] [CrossRef]
- Silva, D.; Rusu, E.; Guedes Soares, C. High-Resolution Wave Energy Assessment in Shallow Water Accounting for Tides. Energies 2016, 9, 761. [Google Scholar] [CrossRef]
- Franzitta, V.; Curto, D. Sustainability of the renewable energy extraction close to the Mediterranean Islands. Energies 2017, 10, 283. [Google Scholar] [CrossRef]
- Franzitta, V.; Catrini, P.; Curto, D. Wave energy assessment along Sicilian coastline, based on deim point absorber. Energies 2017, 10, 376. [Google Scholar] [CrossRef]
- Franzitta, V.; Curto, D.; Milone, D.; Rao, D. Assessment of renewable sources for the energy consumption in Malta in the Mediterranean Sea. Energies 2016, 9, 1034. [Google Scholar] [CrossRef]
- New Plans to Increase Clean Power Are Ambitious and Expensive Offshore Wind Power. Oil Rigs to Whirligigs. Available online: https://www.economist.com/node/15287732 (accessed on 14 January 2010).
- Montilla-D Jesus, M.E.; Arnaltes, S.; Castronuovo, E.D.; Santos-Martin, D. Optimal Power Transmission of Offshore Wind Power Using a VSC-HVdc Interconnection. Energies 2017, 10, 1046. [Google Scholar] [CrossRef]
- Poulsen, T.; Hasager, C.B. How Expensive Is Expensive Enough? Opportunities for Cost Reductions in Offshore Wind Energy Logistics. Energies 2016, 9, 437. [Google Scholar] [CrossRef] [Green Version]
- Shankleman, J. Big Oil Replaces Rigs with Wind Turbines. Bloomberg Markets Online. Available online: https://www.bloomberg.com/news/articles/2017-03-23/oil-majors-take-a-plunge-in-industry-that-may-hurt-fossil-fuel (accessed on 30 November 2017).
- 4C Submarine Cable Consultancy. Offshore Wind Turbine Database. Available online: http://www.4coffshore.com/windfarms/enbw-baltic-2-germany-de52.html (accessed on 30 March 2018).
- Texas A&M University. The Gulf of Mexico Coastal Ocean Observing System. Bathymetry Related Data in Shapefile Format. Available online: http://gcoos.tamu.edu/products/topography/Shapefiles.html (accessed on 13 December 2016).
- European Wind Energy Association. Deep Water: The Next Step for Offshore Wind Energy. Available online: http://www. ewea. Org (accessed on 18 March 2018).
- Perez-Collazo, C.; Greaves, D.; Iglesias, G. A novel hybrid wind-wave energy converter for jacket-frame substructures. Energies 2018, 11, 637. [Google Scholar] [CrossRef]
- Antonio, F.d.O. First-generation wave power plants: Current status and R&D requirements. In Proceedings of the ASME 2003 22nd International Conference on Offshore Mechanics and Arctic Engineering, Cancun, Mexico, 8–13 June 2003; American Society of Mechanical Engineers: New York, NY, USA, 2003; pp. 723–731. [Google Scholar]
- Shih, H.J.; Chang, C.H.; Chen, W.B.; Lin, L.Y. Identifying the Optimal Offshore Areas for Wave Energy Converter Deployments in Taiwanese Waters Based on 12-Year Model Hindcasts. Energies 2018, 11, 499. [Google Scholar] [CrossRef]
- Wu, W.; Yang, Z.; Wang, T. Wave Resource Characterization Using an Unstructured Grid Modeling Approach. Energies 2018, 11, 605. [Google Scholar] [CrossRef]
- U.S. Geological Survey, Coastal and Marine Geology Program. Locations of Oil and Gas Platforms in the Gulf of Mexico; Woods Hole Science Center: Woods Hole, MA, USA, 2017. [Google Scholar]
- National Commission for Hydrocarbons (Comisión Nacional de Hidrocarburos—CNH). Mexican Federal Government. Available online: http://rondasmexico.gob.mx/ (accessed on 3 July 2017).
- EMEC. Pelamis Wave Power. EMEC. The European Marine Energy Center LTD: Orkney, Scotland. Available online: http://www.emec.org.uk/about-us/wave-clients/pelamis-wave-power/ (accessed on 30 March 2018).
- Rusu, E. Evaluation of the wave energy conversion efficiency in various coastal environments. Energies 2014, 7, 4002–4018. [Google Scholar] [CrossRef]
- Wan, Y.; Fan, C.; Zhang, J.; Meng, J.; Dai, Y.; Li, L.; Zhang, X. Wave Energy Resource Assessment off the Coast of China around the Zhoushan Islands. Energies 2017, 10, 1320. [Google Scholar] [CrossRef]
- Wan, Y.; Fan, C.; Dai, Y.; Li, L.; Sun, W.; Zhou, P.; Qu, X. Assessment of the Joint Development Potential of Wave and Wind Energy in the South China Sea. Energies 2018, 11, 398. [Google Scholar] [CrossRef]
- Bedard, R.; Hagerman, G.; Siddiqui, O. System Level Design, Performance and Costs for San Francisco California Pelamis Offshore Wave Power Plant; Report WP-006-SFa; EPRI: San Francisco, CA, USA, 2004. [Google Scholar]
- Reikard, G.; Robertson, B.; Buckham, B.; Bidlot, J.R.; Hiles, C. Simulating and forecasting ocean wave energy in western Canada. Ocean Eng. 2015, 103, 223–236. [Google Scholar] [CrossRef]
- Previsic, M. Deployment Effects of Marine Renewable Energy Technologies: Wave Energy Scenarios (No. DOE/GO18175); RE Vision Consulting, LLC: Sacramento, CA, USA, 2010. [Google Scholar]
- Pelamis Wave Power. Pelamis Wave Power. Brochure. Technical Details. Patents: US6476511, AU754950, ZA20012008, EP1115976B. Available online: http://ctp.lns.mit.edu/energy/files/pelamisbrochure.pdf (accessed on 30 March 2018).
- Bahaj, A.S. Generating electricity from the oceans. Renew. Sustain. Energy Rev. 2011, 15, 3399–3416. [Google Scholar] [CrossRef]
- Vestas Wind Systems A/S. General Specification for V90—3.0 MW.V. (2006, October). Available online: http://report.nat.gov.tw/ReportFront/report_download. Jspx?sysId =C09503816&fileNo=002 (accessed on 4 October 2016).
- Sclavounos, P.D.; Lee, S.; DiPietro, J.; Potenza, G.; Caramuscio, P.; De Michele, G. Floating offshore wind turbines: Tension leg platform and taught leg buoy concepts supporting 3–5 MW wind turbines. In Proceedings of the European Wind Energy Conference EWEC, Warsaw, Poland, 20–23 April 2010; pp. 20–23. [Google Scholar]
- MHI Vestas Offshore Wind A/S. Vestas Wind Float (PT). Denmark. Available online: http://www.mhivestasoffshore.com/windfloat/ (accessed on 3 April 2018).
- Mark, E. Ship Shape: This Floating Offshore Wind Farm Could Be the Future of Renewable Energy. Available online: https://www.ge.com/reports/ship-shape-this-floating-offshore-wind-farm-could-be-the-future-of-renewable-energy/ (accessed on 30 August 2016).
- IRENA. Floating Foundations: A Game Changer for Offshore Wind Power, International. Renewable Energy Agency: Abu Dhabi, 2016. Available online: http://www.irena.org/-/media/Files/IRENA/Agency/Publication/2016/IRENA_Offshore_Wind_Floating_Foundations_2016.pdf (accessed on 3 April 2018).
- U.S. Department of Energy. Wind on the Waves: Floating Wind Power Is Becoming a Reality; Office of Energy Efficiency and Renewable Energy U.S. Department of Energy: Washington, DC, USA, 2017.
- Hagerman, G. Southern New England wave energy resource potential. In Proceedings of the Building Energy; Tufts University: Boston, MA, USA, 2001. [Google Scholar]
- Contestabile, P.; Ferrante, V.; Vicinanza, D. Wave energy resource along the coast of Santa Catarina (Brazil). Energies 2015, 8, 14219–14243. [Google Scholar] [CrossRef]
- Musial, W.D. Status of Wave and Tidal Power Technologies for the United States; National Renewable Energy Laboratory: Golden, CO, USA, 2008.
- Kamranzad, B.; Etemad-Shahidi, A.; Chegini, V. Sustainability of wave energy resources in southern Caspian Sea. Energy 2016, 97, 549–559. [Google Scholar] [CrossRef]
- Mirzaei, A.; Tangang, F.; Juneng, L. Wave energy potential along the east coast of Peninsular Malaysia. Energy 2014, 68, 722–734. [Google Scholar] [CrossRef]
- Ramírez, G.; de Dios, J.; Mejía Fuentes, O.I.; Menjívar Pino, P.J. Evaluacion del Potential Energetico del Oleaje en las Costas de El Salvador. Ph.D. Thesis, Universidad de El Salvador, San Salvador, El Salvador, 2007. [Google Scholar]
- Haces-Fernandez, F. Investigation on the Possibility of Extracting Wave Energy from the Texas Coast. Master’s Thesis, Texas A&M University-Kingsville, Kingsville, TX, USA, December 2014. [Google Scholar]
- Haces-Fernandez, F.; Li, H.; Ramirez, D. Wave Energy Characterization and Assessment in the US Gulf of Mexico, East and West Coasts with Energy Event Concept. Renew. Energy 2018, 123, 312–322. [Google Scholar] [CrossRef]
- Haces-Fernandez, F.; Martinez, A.; Ramirez, D.; Li, H. Characterization of wave energy patterns in Gulf of Mexico. In Proceedings of the IIE Annual Conference on Institute of Industrial and Systems Engineers, Pittsburgh, PA, USA, 20–23 May 2017; pp. 1532–1537. [Google Scholar]
- Stoutenburg, E.D.; Jenkins, N.; Jacobson, M.Z. Power output variations of co-located offshore wind turbines and wave energy converters in California. Renew. Energy 2010, 35, 2781–2791. [Google Scholar] [CrossRef]
- Hsu, S.A.; Meindl, E.A.; Gilhousen, D.B. Determining the power-law wind-profile exponent under near-neutral stability conditions at sea. J. Appl. Meteorol. 1994, 33, 757–765. [Google Scholar] [CrossRef]
- Chen, J.; Yang, S.; Li, H.; Zhang, B.; Lv, J. Research on geographical environment unit division based on the method of natural breaks (Jenks). In Proceedings of the International Archives of the Photogrammetry, Remote Sensing and Spatial Information Sciences XL-4 (W3), Beijing, China, 5–6 December 2013; pp. 47–50. [Google Scholar]
- Wong, M.S.; Zhu, R.; Liu, Z.; Lu, L.; Peng, J.; Tang, Z.; Ho Lo, C.; Chan, W.K. Estimation of Hong Kong’s solar energy potential using GIS and remote sensing technologies. Renew. Energy 2016, 99, 325–335. [Google Scholar] [CrossRef]
- Mellino, S.; Ulgiati, S. Mapping the evolution of impervious surfaces to investigate landscape metabolism: An Emergy–GIS monitoring application. Ecol. Inform. 2015, 26, 50–59. [Google Scholar] [CrossRef]
- Miller, A.; Li, R. A geospatial approach for prioritizing wind farm development in Northeast Nebraska, USA. ISPRS Int. J. Geo-Inf. 2014, 3, 968–979. [Google Scholar] [CrossRef]
- Rusu, E.; Onea, F. Joint Evaluation of the Wave and Offshore Wind Energy Resources in the Developing Countries. Energies 2017, 10, 1866. [Google Scholar] [CrossRef]
- Wiser, R.; Bolinger, M.; Barbose, G.; Darghouth, N.; Hoen, B.; Mills, A.; Widiss, R. 2015 Wind Technologies Market Report; U.S. Department of Energy (DOE): Washington, DC, USA, 2015.
- Feng, Y.; Tavner, P.J.; Long, H. Early experiences with UK Round 1 offshore wind farms. Proc. Inst. Civ. Eng. Energy 2010, 163, 167–181. [Google Scholar] [CrossRef] [Green Version]
- Dunnett, D.; Wallace, J.S. Electricity generation from wave power in Canada. Renew. Energy 2009, 34, 179–195. [Google Scholar] [CrossRef]
- Dalton, G.J.; Alcorn, R.; Lewis, T. Case study feasibility analysis of the Pelamis wave energy convertor in Ireland, Portugal and North America. Renew. Energy 2010, 35, 443–455. [Google Scholar] [CrossRef]
- Astariz, S.; Iglesias, G. Enhancing wave energy competitiveness through co-located wind and wave energy farms. A review on the shadow effect. Energies 2015, 8, 7344–7366. [Google Scholar] [CrossRef]
- Lee, H.; Poguluri, S.K.; Bae, Y.H. Performance Analysis of Multiple Wave Energy Converters Placed on a Floating Platform in the Frequency Domain. Energies 2018, 11, 406. [Google Scholar] [CrossRef]
Figure 1.
Study area with offshore platforms and Comisión Nacional de Hidrocarburos (CNH) areas identified.
Figure 1.
Study area with offshore platforms and Comisión Nacional de Hidrocarburos (CNH) areas identified.


Figure 3.
Electric Power output (kW) table of Vesta V90 3 MW [54].
Figure 3.
Electric Power output (kW) table of Vesta V90 3 MW [54].

Figure 4.
Yearly average wave power generated by one Pelamis 750 kW WEC over 36 years.

Figure 5.
Yearly average wind power generation by one Vestas V90 3 MW over 36 years.

Figure 6.
Cumulative histograms of distance to the coast: (a) U.S. oil platforms, and (b) CNH areas.
Figure 6.
Cumulative histograms of distance to the coast: (a) U.S. oil platforms, and (b) CNH areas.

Figure 7.
Monthly average wind power generated by one Vestas V90 3 MW over 36 years applying Jenks natural breaks classification method for color bar: (a) January, and (b) August.
Figure 7.
Monthly average wind power generated by one Vestas V90 3 MW over 36 years applying Jenks natural breaks classification method for color bar: (a) January, and (b) August.

Figure 8.
Percentage of the area of CNH region I generating the indicated wind power from one Vestas V90 3 MW: (a) front view, and (b) back view.
Figure 8.
Percentage of the area of CNH region I generating the indicated wind power from one Vestas V90 3 MW: (a) front view, and (b) back view.

Figure 9.
Percentage of the area of CNH region II generating the indicated wind power from one Vestas V90 3 MW: (a) front view, and (b) back view.
Figure 9.
Percentage of the area of CNH region II generating the indicated wind power from one Vestas V90 3 MW: (a) front view, and (b) back view.

Figure 10.
Monthly average wave power generated by one Pelamis WEC over 36 years applying Jenks natural breaks classification method for color bar: (a) January, and (b) August.
Figure 10.
Monthly average wave power generated by one Pelamis WEC over 36 years applying Jenks natural breaks classification method for color bar: (a) January, and (b) August.

Figure 11.
Percentage of the area of CNH region I generating the indicated wave power from one Pelamis 750 kW: (a) front view, and (b) back view.
Figure 11.
Percentage of the area of CNH region I generating the indicated wave power from one Pelamis 750 kW: (a) front view, and (b) back view.

Figure 12.
Percentage of the area of CNH region II generating the indicated wave power from one Pelamis 750 kW: (a) front view, and (b) back view.
Figure 12.
Percentage of the area of CNH region II generating the indicated wave power from one Pelamis 750 kW: (a) front view, and (b) back view.

Figure 13.
Yearly average of combined power generated by four Pelamis 750 kW WEC and one Vestas V90 3 MW with Jenks natural breaks classification method for color bar.
Figure 13.
Yearly average of combined power generated by four Pelamis 750 kW WEC and one Vestas V90 3 MW with Jenks natural breaks classification method for color bar.

Figure 14.
Monthly average of combined wave and wind power generated by four Pelamis and one Vestas with Jenks natural breaks classification method for color bar: (a) January, and (b) August.
Figure 14.
Monthly average of combined wave and wind power generated by four Pelamis and one Vestas with Jenks natural breaks classification method for color bar: (a) January, and (b) August.

Figure 15.
Percentage of the area of CNH region I generating the indicated wave and wind power by four Pelamis 750 kW and one Vestas V90 3 MW: (a) front view, and (b) back view.
Figure 15.
Percentage of the area of CNH region I generating the indicated wave and wind power by four Pelamis 750 kW and one Vestas V90 3 MW: (a) front view, and (b) back view.

Figure 16.
Percentage of the area of CNH region II generating the indicated wave and wind power by four Pelamis 750 kW and one Vestas V90 3 MW: (a) front view, and (b) back view.
Figure 16.
Percentage of the area of CNH region II generating the indicated wave and wind power by four Pelamis 750 kW and one Vestas V90 3 MW: (a) front view, and (b) back view.


Table 1.
Percentage of U.S. oil platforms and CNH areas generating the indicated electric power from one Vestas V90 3 MW.
Table 1.
Percentage of U.S. oil platforms and CNH areas generating the indicated electric power from one Vestas V90 3 MW.
| Power (kW) | Wind Power U.S. Oil Platforms (%) | Wind Power CNH Total Areas (%) | ||||||||||||||||||||||
|---|---|---|---|---|---|---|---|---|---|---|---|---|---|---|---|---|---|---|---|---|---|---|---|---|
| Jan | Feb | Mar | Apr | May | Jun | Jul | Aug | Sep | Oct | Nov | Dec | Jan | Feb | Mar | Apr | May | Jun | Jul | Aug | Sep | Oct | Nov | Dec | |
| 150 | -- | -- | -- | -- | -- | -- | -- | -- | -- | -- | -- | -- | -- | -- | -- | -- | -- | 2 | 3 | 5 | 2 | 1 | -- | -- |
| 200 | -- | -- | -- | -- | -- | -- | -- | 1 | -- | -- | -- | -- | -- | -- | -- | -- | -- | 3 | 3 | 4 | 3 | -- | -- | -- |
| 250 | -- | -- | -- | -- | -- | -- | 4 | 4 | -- | -- | -- | -- | 1 | -- | -- | 2 | 3 | 2 | 4 | 3 | 2 | 2 | 2 | 2 |
| 300 | -- | -- | -- | -- | -- | 1 | 15 | 27 | -- | -- | -- | -- | -- | 1 | 2 | 2 | -- | 3 | 2 | 5 | 3 | 2 | -- | -- |
| 350 | -- | -- | -- | -- | -- | 3 | 50 | 44 | -- | -- | -- | -- | 2 | 2 | 2 | -- | 2 | 2 | 3 | 7 | 5 | 2 | 2 | 2 |
| 400 | -- | -- | -- | -- | 1 | 3 | 15 | 14 | 1 | -- | -- | -- | 2 | 1 | 1 | 2 | 2 | 4 | 4 | 5 | 3 | 2 | 2 | 2 |
| 450 | -- | -- | -- | -- | -- | 24 | 6 | 7 | 1 | -- | -- | -- | 1 | -- | 1 | 2 | 4 | 4 | 3 | 12 | 5 | 2 | 2 | 2 |
| 500 | -- | -- | -- | -- | -- | 29 | 6 | 3 | 3 | -- | -- | -- | 2 | 2 | -- | 2 | 3 | 2 | 4 | 19 | 4 | 2 | 1 | 2 |
| 550 | -- | -- | -- | -- | 3 | 16 | 2 | -- | 10 | -- | -- | -- | 1 | 1 | 2 | 3 | 3 | 5 | 4 | 11 | 18 | 4 | 2 | -- |
| 600 | -- | -- | -- | 1 | 2 | 7 | 2 | -- | 5 | 1 | -- | -- | 2 | 4 | 3 | 3 | 5 | 4 | 8 | 6 | 18 | 3 | 3 | 3 |
| 650 | -- | -- | -- | -- | 14 | 7 | -- | -- | 14 | 2 | -- | -- | 4 | 2 | 2 | 2 | 5 | 4 | 13 | 5 | 9 | 5 | 2 | 3 |
| 700 | -- | -- | -- | -- | 25 | 7 | -- | -- | 31 | 5 | -- | -- | 2 | 2 | 2 | 5 | 3 | 2 | 11 | 9 | 23 | 4 | 3 | 2 |
| 750 | -- | -- | -- | -- | 18 | 2 | -- | -- | 33 | 6 | -- | -- | 2 | 4 | 3 | 3 | 3 | 4 | 7 | 4 | 5 | 17 | 4 | 3 |
| 800 | -- | -- | 1 | 2 | 10 | 1 | -- | -- | 2 | 5 | 1 | -- | 3 | 2 | 2 | 4 | 4 | 27 | 6 | 3 | -- | 13 | 4 | 4 |
| 850 | -- | 2 | 2 | 3 | 7 | -- | -- | -- | -- | 12 | 2 | -- | 5 | 7 | 5 | 4 | 6 | 15 | 5 | -- | -- | 12 | 15 | 11 |
| 900 | 1 | 2 | 4 | 4 | 6 | -- | -- | -- | -- | 16 | 2 | 2 | 10 | 9 | 6 | 5 | 8 | 10 | 4 | -- | -- | 3 | 14 | 13 |
| 950 | -- | 5 | 7 | 13 | 9 | -- | -- | -- | -- | 18 | 8 | 1 | 10 | 10 | 5 | 8 | 9 | 5 | 6 | 2 | -- | 2 | 11 | 8 |
| 1000 | 3 | 5 | 11 | 16 | 4 | -- | -- | -- | -- | 30 | 5 | 3 | 8 | 7 | 8 | 5 | 8 | -- | 5 | -- | -- | 21 | 6 | 8 |
| 1050 | 6 | 10 | 17 | 19 | 1 | -- | -- | -- | -- | 5 | 9 | 6 | 10 | 9 | 7 | 5 | 7 | 2 | 3 | -- | -- | 3 | 2 | 9 |
| 1100 | 5 | 10 | 13 | 19 | -- | -- | -- | -- | -- | -- | 10 | 5 | 9 | 8 | 6 | 7 | 18 | -- | -- | -- | -- | -- | -- | -- |
| 1150 | 10 | 13 | 28 | 16 | -- | -- | -- | -- | -- | -- | 14 | 12 | 1 | 2 | 8 | 5 | 7 | -- | 2 | -- | -- | -- | -- | -- |
| 1200 | 13 | 16 | 14 | 6 | -- | -- | -- | -- | -- | -- | 19 | 13 | -- | -- | 6 | 3 | -- | -- | -- | -- | -- | -- | -- | -- |
| 1250 | 17 | 20 | 3 | 1 | -- | -- | -- | -- | -- | -- | 17 | 14 | -- | -- | 7 | 19 | -- | -- | -- | -- | -- | -- | 9 | -- |
| 1300 | 18 | 12 | -- | -- | -- | -- | -- | -- | -- | -- | 11 | 21 | -- | 6 | 22 | 9 | -- | -- | -- | -- | -- | -- | 11 | -- |
| 1350 | 18 | 5 | -- | -- | -- | -- | -- | -- | -- | -- | 2 | 16 | 5 | 20 | -- | -- | -- | -- | -- | -- | -- | -- | 5 | 3 |
| 1400 | 7 | -- | -- | -- | -- | -- | -- | -- | -- | -- | -- | 6 | 16 | 1 | -- | -- | -- | -- | -- | -- | -- | -- | -- | 14 |
| 1450 | 2 | -- | -- | -- | -- | -- | -- | -- | -- | -- | -- | 1 | 4 | -- | -- | -- | -- | -- | -- | -- | -- | -- | -- | 9 |
Table 2.
Percentage of the CNH region III area that would generate the indicated electric power from one Vestas V90 3 MW.
Table 2.
Percentage of the CNH region III area that would generate the indicated electric power from one Vestas V90 3 MW.
| Power (kW) | Wind Power in CNH Region III (% of Areas) | |||||||||||
|---|---|---|---|---|---|---|---|---|---|---|---|---|
| Jan | Feb | Mar | Apr | May | Jun | Jul | Aug | Sep | Oct | Nov | Dec | |
| 500 | -- | -- | -- | -- | -- | -- | -- | 8 | 2 | -- | -- | -- |
| 550 | -- | -- | -- | -- | -- | -- | 2 | 11 | 4 | -- | -- | -- |
| 600 | -- | -- | -- | -- | -- | 3 | 5 | 12 | 6 | 2 | -- | -- |
| 650 | -- | -- | -- | -- | 3 | 6 | 6 | 8 | 6 | 2 | -- | -- |
| 700 | -- | -- | -- | 2 | 5 | 5 | 7 | 12 | 2 | 2 | 2 | -- |
| 750 | -- | -- | -- | 3 | 3 | 9 | 10 | 8 | 40 | 3 | 2 | 2 |
| 800 | 2 | 3 | 3 | 5 | 8 | 9 | 6 | 6 | 32 | 6 | 2 | 3 |
| 850 | 3 | 3 | 4 | 3 | 13 | 11 | 5 | 5 | 8 | 6 | 3 | 2 |
| 900 | 5 | 5 | 3 | 6 | 8 | 6 | 10 | 17 | -- | 3 | 5 | 6 |
| 950 | 2 | 6 | 4 | 8 | 8 | 10 | 6 | 7 | -- | 44 | 4 | -- |
| 1000 | 5 | 2 | 6 | 10 | 9 | 12 | 6 | 6 | -- | 26 | 3 | 5 |
| 1050 | 5 | 18 | 10 | 10 | 12 | 13 | 5 | -- | -- | 6 | 38 | 22 |
| 1100 | 26 | 19 | 11 | 13 | 14 | 10 | 5 | -- | -- | -- | 29 | 33 |
| 1150 | 19 | 23 | 7 | 18 | 8 | 6 | 7 | -- | -- | -- | 9 | 15 |
| 1200 | 17 | 9 | 18 | 9 | 6 | -- | 15 | -- | -- | -- | 3 | 9 |
| 1250 | 10 | 6 | 16 | 6 | 3 | -- | 5 | -- | -- | -- | -- | 3 |
| 1300 | 6 | 6 | 9 | 5 | -- | -- | -- | -- | -- | -- | -- | -- |
| 1350 | -- | -- | 6 | 2 | -- | -- | -- | -- | -- | -- | -- | -- |
| 1400 | -- | -- | 3 | -- | -- | -- | -- | -- | -- | -- | -- | -- |
Table 3.
Wave power generated by one Pelamis 750 kW WEC presented by the percentage of study areas under different power levels.
Table 3.
Wave power generated by one Pelamis 750 kW WEC presented by the percentage of study areas under different power levels.
| Power (kW) | Wave Power U.S. Oil Platforms (%) | Wave Power CNH Total Areas (%) | ||||||||||||||||||||||
|---|---|---|---|---|---|---|---|---|---|---|---|---|---|---|---|---|---|---|---|---|---|---|---|---|
| Jan | Feb | Mar | Apr | May | Jun | Jul | Aug | Sep | Oct | Nov | Dec | Jan | Feb | Mar | Apr | May | Jun | Jul | Aug | Sep | Oct | Nov | Dec | |
| 10 | 16 | 16 | 14 | 14 | 19 | 23 | 30 | 26 | 13 | 16 | 15 | 15 | -- | -- | -- | -- | 3 | 13 | 17 | 17 | 1 | -- | -- | -- |
| 20 | 6 | 6 | 4 | 5 | 14 | 20 | 29 | 31 | 11 | 8 | 10 | 6 | -- | -- | -- | 1 | 7 | 10 | 12 | 21 | 3 | -- | -- | -- |
| 30 | 9 | 8 | 4 | 5 | 12 | 12 | 14 | 23 | 12 | 11 | 8 | 9 | -- | -- | -- | -- | 7 | 11 | 14 | 22 | 6 | -- | -- | -- |
| 40 | 8 | 6 | 6 | 8 | 10 | 12 | 9 | 18 | 12 | 4 | 7 | 5 | -- | -- | -- | 3 | 9 | 11 | 13 | 39 | 8 | -- | -- | -- |
| 50 | 11 | 12 | 8 | 6 | 9 | 11 | 12 | 2 | 11 | 13 | 11 | 13 | -- | -- | -- | 4 | 10 | 9 | 10 | 1 | 11 | -- | -- | -- |
| 60 | 6 | 4 | 7 | 9 | 6 | 8 | 6 | -- | 7 | 6 | 5 | 4 | -- | -- | 2 | 4 | 9 | 8 | 34 | -- | 12 | 2 | -- | -- |
| 70 | 3 | 5 | 7 | 3 | 8 | 7 | -- | -- | 9 | 4 | 4 | 3 | -- | -- | 2 | 5 | 7 | 8 | -- | -- | 18 | 2 | -- | -- |
| 80 | 4 | 4 | 4 | 4 | 5 | 5 | -- | -- | 10 | 3 | 3 | 4 | -- | -- | 4 | 8 | 5 | 4 | -- | -- | 12 | 2 | -- | -- |
| 90 | 2 | 4 | 4 | 6 | 5 | 2 | -- | -- | 8 | 4 | 3 | 3 | -- | -- | 2 | 8 | 6 | 12 | -- | -- | 2 | 3 | -- | 3 |
| 100 | 4 | 4 | 5 | 4 | 3 | -- | -- | -- | 6 | 8 | 3 | 4 | -- | 2 | 3 | 9 | 7 | 14 | -- | -- | -- | 2 | 2 | 3 |
| 110 | 3 | 3 | 4 | 5 | 3 | -- | -- | -- | 1 | 4 | 4 | 4 | 1 | 3 | 3 | 8 | 4 | -- | -- | -- | 11 | 2 | 2 | -- |
| 120 | 4 | 5 | 3 | 6 | 3 | -- | -- | -- | -- | 5 | 6 | 4 | 3 | 2 | 5 | 5 | -- | -- | -- | -- | 16 | 5 | 2 | 4 |
| 130 | 5 | 5 | 4 | 5 | 2 | -- | -- | -- | -- | 4 | 4 | 4 | 2 | 2 | 8 | 5 | -- | -- | -- | -- | -- | 7 | 1 | 3 |
| 140 | 3 | 2 | 6 | 4 | -- | -- | -- | -- | -- | 5 | 3 | 3 | 1 | 2 | 8 | 6 | -- | -- | -- | -- | -- | 11 | 2 | 3 |
| 150 | 2 | 4 | 5 | 5 | 1 | -- | -- | -- | -- | 5 | 3 | 3 | 2 | 3 | 9 | 5 | 21 | -- | -- | -- | -- | 10 | 2 | 3 |
| 160 | 3 | 3 | 2 | 3 | -- | -- | -- | -- | -- | -- | 2 | 3 | 1 | 4 | 7 | 2 | 5 | -- | -- | -- | -- | 15 | 4 | 3 |
| 170 | 2 | 2 | 4 | 3 | -- | -- | -- | -- | -- | -- | 3 | 3 | 2 | 6 | 5 | -- | -- | -- | -- | -- | -- | 10 | 5 | 6 |
| 180 | 2 | 2 | 4 | 3 | -- | -- | -- | -- | -- | -- | 2 | 2 | 4 | 8 | 7 | -- | -- | -- | -- | -- | -- | 2 | 7 | 5 |
| 190 | 2 | 3 | 3 | 2 | -- | -- | -- | -- | -- | -- | 2 | 2 | 4 | 8 | 5 | -- | -- | -- | -- | -- | -- | 19 | 6 | 8 |
| 200 | 3 | 2 | 2 | -- | -- | -- | -- | -- | -- | -- | 2 | 4 | 7 | 10 | 12 | -- | -- | -- | -- | -- | -- | 8 | 8 | 7 |
| 210 | 1 | -- | -- | -- | -- | -- | -- | -- | -- | -- | -- | 2 | 6 | 12 | -- | 8 | -- | -- | -- | -- | -- | -- | 9 | 9 |
| 220 | 1 | -- | -- | -- | -- | -- | -- | -- | -- | -- | -- | -- | 9 | 7 | -- | 19 | -- | -- | -- | -- | -- | -- | 14 | 13 |
| 230 | -- | -- | -- | -- | -- | -- | -- | -- | -- | -- | -- | -- | 14 | 2 | 11 | -- | -- | -- | -- | -- | -- | -- | 9 | 12 |
| 240 | -- | -- | -- | -- | -- | -- | -- | -- | -- | -- | -- | -- | 12 | -- | 17 | -- | -- | -- | -- | -- | -- | -- | -- | 6 |
| 250 | -- | -- | -- | -- | -- | -- | -- | -- | -- | -- | -- | -- | 5 | -- | -- | -- | -- | -- | -- | -- | -- | -- | -- | -- |
| 260 | -- | -- | -- | -- | -- | -- | -- | -- | -- | -- | -- | -- | -- | 6 | -- | -- | -- | -- | -- | -- | -- | -- | 27 | -- |
| 270 | -- | -- | -- | -- | -- | -- | -- | -- | -- | -- | -- | -- | -- | 23 | -- | -- | -- | -- | -- | -- | -- | -- | -- | -- |
| 280 | -- | -- | -- | -- | -- | -- | -- | -- | -- | -- | -- | -- | 27 | -- | -- | -- | -- | -- | -- | -- | -- | -- | -- | 12 |
Table 4.
Percentage of the area of CNH region III generating the indicated electric power from one Pelamis 750 kW.
Table 4.
Percentage of the area of CNH region III generating the indicated electric power from one Pelamis 750 kW.
| Power (kW) | Wave Power in CNH Region III (% of Areas) | |||||||||||
|---|---|---|---|---|---|---|---|---|---|---|---|---|
| Jan | Feb | Mar | Apr | May | Jun | Jul | Aug | Sep | Oct | Nov | Dec | |
| 10 | -- | -- | -- | -- | -- | 4 | 6 | 6 | -- | -- | -- | -- |
| 20 | -- | -- | -- | -- | -- | 16 | 23 | 39 | -- | -- | -- | -- |
| 30 | -- | -- | -- | -- | 8 | 27 | 30 | 50 | -- | -- | -- | -- |
| 40 | -- | -- | -- | -- | 19 | 27 | 29 | 5 | 12 | -- | -- | -- |
| 50 | -- | -- | -- | -- | 25 | 18 | 12 | -- | 25 | -- | -- | -- |
| 60 | -- | -- | -- | 2 | 22 | 8 | -- | -- | 27 | -- | -- | -- |
| 70 | -- | -- | -- | 6 | 17 | -- | -- | -- | 28 | -- | -- | -- |
| 80 | -- | -- | -- | 17 | 9 | -- | -- | -- | 8 | -- | -- | -- |
| 90 | -- | -- | -- | 21 | -- | -- | -- | -- | -- | -- | -- | -- |
| 100 | -- | -- | 2 | 20 | -- | -- | -- | -- | -- | 2 | -- | -- |
| 110 | -- | -- | 6 | 19 | -- | -- | -- | -- | -- | 4 | -- | -- |
| 120 | -- | -- | 10 | 11 | -- | -- | -- | -- | -- | 10 | -- | -- |
| 130 | -- | -- | 18 | 4 | -- | -- | -- | -- | -- | 15 | -- | -- |
| 140 | -- | 3 | 20 | -- | -- | -- | -- | -- | -- | 23 | -- | -- |
| 150 | -- | 5 | 20 | -- | -- | -- | -- | -- | -- | 18 | 3 | -- |
| 160 | -- | 9 | 17 | -- | -- | -- | -- | -- | -- | 28 | 7 | 4 |
| 170 | 4 | 14 | 7 | -- | -- | -- | -- | -- | -- | -- | 11 | 9 |
| 180 | 9 | 17 | -- | -- | -- | -- | -- | -- | -- | -- | 15 | 10 |
| 190 | 10 | 18 | -- | -- | -- | -- | -- | -- | -- | -- | 17 | 15 |
| 200 | 14 | 17 | -- | -- | -- | -- | -- | -- | -- | -- | 14 | 16 |
| 210 | 17 | 17 | -- | -- | -- | -- | -- | -- | -- | -- | 16 | 16 |
| 220 | 16 | -- | -- | -- | -- | -- | -- | -- | -- | -- | 17 | 19 |
| 230 | 21 | -- | -- | -- | -- | -- | -- | -- | -- | -- | -- | 11 |
Table 5.
Percentages of areas on U.S. oil platforms and CNH areas under different power levels generated by four Pelamis 750 kW WEC and one Vestas V90 3 MW.
Table 5.
Percentages of areas on U.S. oil platforms and CNH areas under different power levels generated by four Pelamis 750 kW WEC and one Vestas V90 3 MW.
| Power (kW) | Wave Wind Combined Power U.S. Oil Platforms (%) | Wave Wind Power CNH Total Areas (%) | ||||||||||||||||||||||
|---|---|---|---|---|---|---|---|---|---|---|---|---|---|---|---|---|---|---|---|---|---|---|---|---|
| Jan | Feb | Mar | Apr | May | Jun | Jul | Aug | Sep | Oct | Nov | Dec | Jan | Feb | Mar | Apr | May | Jun | Jul | Aug | Sep | Oct | Nov | Dec | |
| 100 | -- | -- | -- | -- | -- | -- | -- | -- | -- | -- | -- | -- | -- | -- | -- | -- | -- | -- | -- | 1 | -- | -- | -- | -- |
| 200 | -- | -- | -- | -- | -- | -- | -- | -- | -- | -- | -- | -- | -- | -- | -- | -- | -- | 3 | 5 | 6 | 1 | -- | -- | -- |
| 300 | -- | -- | -- | -- | -- | -- | 10 | 13 | -- | -- | -- | -- | -- | -- | -- | 1 | 1 | 3 | 3 | 6 | 4 | -- | -- | -- |
| 400 | -- | -- | -- | -- | -- | 4 | 39 | 38 | -- | -- | -- | -- | -- | -- | 1 | 1 | 3 | 4 | 5 | 10 | 3 | 1 | -- | -- |
| 500 | -- | -- | -- | -- | 1 | 20 | 28 | 42 | 4 | -- | -- | -- | -- | -- | -- | 2 | 2 | 7 | 5 | 8 | 5 | 1 | -- | -- |
| 600 | -- | -- | -- | -- | 4 | 29 | 17 | 4 | 10 | 2 | -- | -- | -- | -- | 1 | 2 | 5 | 4 | 8 | 14 | 8 | 2 | 1 | 1 |
| 700 | -- | -- | -- | -- | 12 | 17 | 3 | 2 | 9 | 4 | -- | -- | 1 | 2 | 2 | 2 | 4 | 7 | 4 | 33 | 9 | 1 | -- | -- |
| 800 | -- | -- | 2 | 2 | 23 | 17 | 2 | 1 | 20 | 9 | 2 | -- | -- | 2 | 2 | 3 | 6 | 7 | 8 | 15 | 22 | 3 | 2 | 1 |
| 900 | 2 | 2 | 3 | 5 | 17 | 6 | -- | -- | 20 | 7 | 2 | 2 | 1 | 1 | 2 | 4 | 6 | 10 | 25 | 6 | 17 | 4 | -- | 1 |
| 1000 | 3 | 8 | 10 | 10 | 12 | 4 | 1 | -- | 16 | 11 | 9 | 4 | 1 | 2 | 2 | 3 | 12 | 12 | 19 | 1 | 4 | 5 | 3 | 2 |
| 1100 | 8 | 8 | 8 | 11 | 13 | 2 | -- | -- | 15 | 18 | 9 | 9 | 2 | 2 | 5 | 5 | 13 | 10 | 15 | -- | 5 | 5 | 3 | 3 |
| 1200 | 9 | 9 | 8 | 13 | 8 | -- | -- | -- | 6 | 11 | 5 | 8 | 2 | 3 | 4 | 9 | 8 | 30 | 3 | -- | 22 | 7 | 3 | 2 |
| 1300 | 8 | 14 | 14 | 9 | 4 | 1 | -- | -- | -- | 7 | 19 | 11 | 3 | 4 | 6 | 13 | 5 | 3 | -- | -- | -- | 13 | 3 | 4 |
| 1400 | 16 | 14 | 11 | 13 | 3 | -- | -- | -- | -- | 13 | 11 | 14 | 4 | 6 | 4 | 10 | 7 | -- | -- | -- | -- | 19 | 5 | 4 |
| 1500 | 11 | 7 | 7 | 8 | 2 | -- | -- | -- | -- | 9 | 8 | 9 | 5 | 4 | 13 | 6 | -- | -- | -- | -- | -- | 10 | 6 | 6 |
| 1600 | 7 | 7 | 7 | 10 | 1 | -- | -- | -- | -- | 7 | 6 | 8 | 3 | 9 | 10 | 2 | -- | -- | -- | -- | -- | 2 | 9 | 6 |
| 1700 | 6 | 8 | 10 | 8 | -- | -- | -- | -- | -- | 2 | 9 | 6 | 7 | 18 | 9 | 6 | 21 | -- | -- | -- | -- | -- | 21 | 18 |
| 1800 | 8 | 8 | 8 | 5 | -- | -- | -- | -- | -- | -- | 7 | 9 | 18 | 6 | 1 | 3 | 7 | -- | -- | -- | -- | 27 | 6 | 11 |
| 1900 | 7 | 6 | 7 | 4 | -- | -- | -- | -- | -- | -- | 5 | 6 | 11 | 8 | 7 | -- | -- | -- | -- | -- | -- | -- | 10 | 6 |
| 2000 | 5 | 4 | 5 | 2 | -- | -- | -- | -- | -- | -- | 4 | 5 | 8 | 5 | 3 | -- | -- | -- | -- | -- | -- | -- | -- | 7 |
| 2100 | 5 | 3 | -- | -- | -- | -- | -- | -- | -- | -- | 3 | 4 | 6 | -- | -- | 20 | -- | -- | -- | -- | -- | -- | -- | -- |
| 2200 | 3 | 2 | -- | -- | -- | -- | -- | -- | -- | -- | 1 | 3 | -- | -- | 27 | 8 | -- | -- | -- | -- | -- | -- | -- | -- |
| 2300 | 2 | -- | -- | -- | -- | -- | -- | -- | -- | -- | -- | 2 | -- | -- | 1 | -- | -- | -- | -- | -- | -- | -- | 19 | -- |
| 2400 | -- | -- | -- | -- | -- | -- | -- | -- | -- | -- | -- | -- | -- | 28 | -- | -- | -- | -- | -- | -- | -- | -- | 9 | -- |
| 2500 | -- | -- | -- | -- | -- | -- | -- | -- | -- | -- | -- | -- | 20 | -- | -- | -- | -- | -- | -- | -- | -- | -- | -- | 10 |
| 2600 | -- | -- | -- | -- | -- | -- | -- | -- | -- | -- | -- | -- | 8 | -- | -- | -- | -- | -- | -- | -- | -- | -- | -- | 18 |
Table 6.
Percentage of the CNH region III area generating the indicated electric power by four Pelamis 750 kW and one Vestas V90 3 MW.
Table 6.
Percentage of the CNH region III area generating the indicated electric power by four Pelamis 750 kW and one Vestas V90 3 MW.
| Power (kW) | Wind and Wave Power Combined in CNH Region III (% of Areas) | |||||||||||
|---|---|---|---|---|---|---|---|---|---|---|---|---|
| Jan | Feb | Mar | Apr | May | Jun | Jul | Aug | Sep | Oct | Nov | Dec | |
| 400 | -- | -- | -- | -- | -- | -- | -- | 13 | -- | -- | -- | -- |
| 500 | -- | -- | -- | -- | -- | 7 | 5 | 18 | 5 | -- | -- | -- |
| 600 | -- | -- | -- | -- | 3 | 5 | 13 | 21 | 7 | -- | -- | -- |
| 700 | -- | -- | -- | -- | 8 | 15 | 12 | 19 | 11 | -- | -- | -- |
| 800 | -- | -- | -- | 3 | 9 | 10 | 15 | 20 | 52 | 3 | -- | -- |
| 900 | -- | -- | -- | 6 | 14 | 24 | 12 | 9 | 25 | 2 | -- | -- |
| 1000 | -- | -- | 3 | 6 | 21 | 29 | 17 | -- | -- | 3 | 3 | -- |
| 1100 | -- | 2 | 3 | 4 | 28 | 10 | 21 | -- | -- | 5 | -- | 2 |
| 1200 | 2 | 3 | 6 | 18 | 17 | -- | 5 | -- | -- | 12 | 3 | 2 |
| 1300 | 2 | 3 | 6 | 31 | -- | -- | -- | -- | -- | 26 | 2 | 2 |
| 1400 | 3 | 6 | 3 | 22 | -- | -- | -- | -- | -- | 49 | 5 | 3 |
| 1500 | 3 | 7 | 30 | 10 | -- | -- | -- | -- | -- | -- | 11 | 9 |
| 1600 | 7 | 17 | 24 | -- | -- | -- | -- | -- | -- | -- | 16 | 10 |
| 1700 | 10 | 49 | 25 | -- | -- | -- | -- | -- | -- | -- | 55 | 42 |
| 1800 | 46 | 13 | -- | -- | -- | -- | -- | -- | -- | -- | 5 | 30 |
| 1900 | 27 | -- | -- | -- | -- | -- | -- | -- | -- | -- | -- | -- |
© 2018 by the authors. Licensee MDPI, Basel, Switzerland. This article is an open access article distributed under the terms and conditions of the Creative Commons Attribution (CC BY) license (http://creativecommons.org/licenses/by/4.0/).
Share and Cite
MDPI and ACS Style
Haces-Fernandez, F.; Li, H.; Ramirez, D. Assessment of the Potential of Energy Extracted from Waves and Wind to Supply Offshore Oil Platforms Operating in the Gulf of Mexico. Energies 2018, 11, 1084. https://doi.org/10.3390/en11051084
AMA Style
Haces-Fernandez F, Li H, Ramirez D. Assessment of the Potential of Energy Extracted from Waves and Wind to Supply Offshore Oil Platforms Operating in the Gulf of Mexico. Energies. 2018; 11(5):1084. https://doi.org/10.3390/en11051084
Chicago/Turabian StyleHaces-Fernandez, Francisco, Hua Li, and David Ramirez. 2018. "Assessment of the Potential of Energy Extracted from Waves and Wind to Supply Offshore Oil Platforms Operating in the Gulf of Mexico" Energies 11, no. 5: 1084. https://doi.org/10.3390/en11051084
Note that from the first issue of 2016, this journal uses article numbers instead of page numbers. See further details here.