Effects of Supply Power and Environmental Conditions on Urea Coolant Melting Phenomena in Urea Supply Lines in Vehicles


1
Department of Automotive Engineering, Korea National University of Transportation, Chungju-si 27469, Korea
2
Hanil Tube Corporation, Incheon 22744, Korea
*
Author to whom correspondence should be addressed.
Energies 2018, 11(5), 1099; https://doi.org/10.3390/en11051099
Submission received: 9 April 2018
/
Revised: 19 April 2018
/
Accepted: 27 April 2018
/
Published: 30 April 2018
Abstract
:Freezing of urea is one of the major barriers to using the urea-SCR technique in vehicles. Therefore, urea melting-time predictions under various environmental conditions are very important. Transient numerical analysis was performed to predict the melting time. The urea supply line was composed of a double tube structure. Two copper wires were installed around the inner tube for the heater role. The urea melting time was calculated using ANSYS transient thermal v.15. The supply voltage, ambient temperature, and heat transfer coefficient on the external surface of supply line were changed to evaluate the effects of supply power and environmental conditions. The urea melted in less than 600 s in all cases. The urea melting time was influenced by the ambient temperature rather than the speed of the vehicle.
1. Introduction
Diesel engines are useful and growing in popularity not only for commercial vehicles but also for passenger cars owing to their high compressor ratios and fuel efficiency. However, the diesel engines generate large amounts of NOx and particle material (PM) compared with gasoline engines because of diesel combustion characteristics. It causes serious environmental problems, and many countries have attempted to control the NOx and PM emissions using regulations. Particularly, the European Union (EU) announced the Euro 6 regulation, which is currently the strictest regulation of vehicle emissions. Many technologies, such as lean NOx trap (LNT), selective catalytic reduction (urea-SCR), and hydrocarbon-SCR (HC-SCR) have been developed to reduce NOx emissions from diesel engines and meet various emission regulations [1,2].
Among these technologies, urea-SCR shows high performance in reducing NOx emissions. The urea-SCR method was only used in heavy-duty vehicles because it required additional space to install an additional urea tank, inlet, and supply lines. After the Volkswagen diesel engine scandal, the urea-SCR method became a major technology to reduce the NOx emissions in diesel passenger cars.
However, the urea-SCR technique has some problems for stable operation in automobiles. One major problem is the freezing of urea. The freezing point of urea is approximately −11 °C. During winter in North America, Asia, and Europe, the ambient temperature is lower than the freezing point of urea, and the urea cannot be supplied to the injection system in a liquid state. Thus, a urea heating system must be installed to supply a sufficient amount of liquid urea during driving.
Typically, a urea heating system has two parts: (1) a heating system in a urea tank and (2) a heating system in the urea supply line. This urea heating system should melt an amount of frozen urea as soon as possible after starting the car under the constraint of limited heating power, which is supplied via the car battery [3]. Many studies focused on the heater in the urea tank [4,5,6,7]. The heater in the urea tank requires a large amount of power to melt a large amount of urea perfectly in a tank. Therefore, the study of heaters in urea tanks has focused on designing the heating line and analysis of the melting characteristics of urea.
If the remaining urea in the supply line is not melted after starting the car, the urea is not supplied to the SCR system and it does not operate normally. This is the main reason a large amount of NOx is created immediately after starting the car. Therefore, the object of a heating system for a urea supply line is to melt the remaining urea in the supply line rapidly after starting the car.
The heat transfer and melting phenomena in a urea supply line are affected largely by the environmental conditions, such as ambient temperature and vehicle driving speed. This is because the urea supply line is exposed to the atmosphere. Thus, the design point of a heating system for a urea supply line is different from that of the heating system of the urea tank. Generally, car makers recommend idling a diesel car between 5 and 10 min in winter. The remaining urea in the supply line should melt during the idling state. Therefore, the urea melting-time predictions under various environmental conditions are important. In this study, transient numerical analysis was performed to predict the melting time. The supply voltage, ambient temperature, and heat transfer coefficient on the external surface of supply line were changed to evaluate the effects of the power supply and environmental conditions. We expect that this study will be helpful in designing advanced heating systems for urea supply lines, as well as contributing to the reduction of NOx emissions from vehicles.
2. Research Method
2.1. Structure of the Heating System in the Urea Supply Line
Figure 1 shows the structure of the heating system in the urea supply line. The urea supply line comprises two polymer tubes. The urea passes through the inner tube. The air layer exists between the inner and outer tubes as a thermal insulator. The diameter and thickness of the inner tube are 4.5 mm and 1.0 mm, respectively. The material of the inner tube is polyphthalamide (PPA). The air gap between the inner and outer tubes is 1 mm, and the outer tube thickness is 2 mm. The outer tube material is thermoplastic elastomer (TPE).
The heater line is located on the outer surface of the inner tube. Two copper lines are twisted and connected to the battery of the vehicle. Thus, the supply voltage range is 10–16 V, which depends on the battery status. The resistance of the copper line is 3.25 Ω. The range of the supply power in this urea heating system is large. Therefore, the numerical analysis was performed by changing the power supply to evaluate the effect of the power supply on the urea melting time in the supply line.
2.2. Heat Transfer Circuit of the Urea Supply Line
Before explaining the heat transfer circuit of the urea supply line, the urea properties and phase change analysis are explained. The urea properties are shown in Figure 2 and Table 1 [8]. Urea enthalpy should be calculated to the relevant urea phase change using the latent heat and specific heat of the urea.
Average specific heat: Cavg = (Cs + CL)/2
Specific heat for transition: C* = Cavg + {Latent heat/(TS − TL)}
Enthalpy between solid/liquid temperature: HTR = H + ρC × (TL − TS)
The latent heat is related using the enthalpy property, which varies with temperature, and the enthalpy can be calculated by Equations (1)–(4), which are suggested in the ANSYS Mechanical Manual [9].
Figure 3 shows the heat transfer circuit of the urea supply line. The heat transfer circuit of the urea supply line is composed of six thermal resistances. In this study, the urea status is solid owing to low ambient temperature. Thus, the conductivity of urea is the thermal resistances in the heat transfer circuit. Furthermore, the conductivities of pipelines and air are those of the thermal resistances in the heat transfer circuit. These conductivities are constant values, which are independent of the temperature because the temperature does not change much to cause conductivity variation. These thermal resistances are described as Equations (5) and (6).
The heat flux of the heater is important in the heat transfer circuit. It is changed by the battery status of the vehicle and is one of the variables in this study. In this study, the heat flux variation in the heater is from 2500 W/m2 to 7500 W/m2, which is changed by the voltage variation.
The last thermal resistance is the convective heat transfer coefficient and the ambient temperature on outer surface of the pipeline. These are changed by vehicle speed and climate. The Reynolds number based on the urea supply tube diameter changes from 1699 to 23,788 by changing the vehicle speed from 10 km/h to 140 km/h. The convective heat transfer coefficient can be predicted using the correlation equation of the average convective heat transfer coefficient on the cylinder surface, as shown in Equation (7) [10] and Figure 4. To evaluate these factors, the convective heat transfer coefficient and ambient temperature on the outer surface are changed from 100 W/m2∙K to 300 W/m2∙K and −25 °C to −50 °C.
Nu = 0.683 Re0.466Pr0.33 (40 < Re < 4000)
Nu = 0.193 Re0.618Pr0.33 (4000 < Re < 40,000)
2.3. Numerical Analysis Setting
To investigate the characteristics of the urea melting phenomena, transient numerical analysis was conducted using a commercial finite-element method (FEM) program, ANSYS transient thermal v.15. Figure 5 shows the numerical analysis model. It has the same structure and size as a real model without the length of the model. To reduce the calculation time, the length of the numerical analysis model is short, 0.05 m. The number of the grid is 1,915,630, and the time step is 5 s. The total time and time step are sufficient to investigate the urea phase change in this study. Detailed boundary conditions for numerical analysis are summarized in Table 2.
3. Results and Discussion
3.1. Urea Melting Phenomena in the Supply Line
Figure 6 shows the urea temperature variation under −25 °C outside temperature and h = 100 W/m2∙K condition. The urea temperature increased rapidly with increasing heating time. Then, the urea phase change started at approximately −12 °C and it finished at approximately −10 °C. In the results, when the heat flux was 2500 W/m2, the urea melting time was more than 450 s. The urea melting time decreased with the increase in the heat flux, and it took less than 100 s at a heat flux of 7500 W/m2. These numerical analysis results agree with the experimental results [11].
Generally, auto makers have required the urea melting time to be less than 600 s at −25 °C outside temperature. This urea heating system, composed of two copper lines, satisfied the auto makers’ requirement.
To increase the urea temperature in the pipe, it was necessary to supply a heat flux larger than the heat loss to the external surface of the tube. All cases in this study satisfied the above condition, and they could melt the urea in the desired time. However, in the case of a low heat flux ( = 2500 W/m2), the urea melting time significantly increased compared with high-heat-flux cases. This was because the difference between the amount of supply heat flux and the amount of heat loss to the external surface of the tube was not large. When the temperature of urea was −11 °C, the temperature difference with the outside was approximately 14 °C, and the heat loss taken to the outside of tube was approximately 1400 W/m2. Then, the remaining heat flux was absorbed to the latent heat. The low amount of supply heat did not significantly contribute to the increase in the urea temperature in the phase change region. As a result, the urea melting time in the phase change region increased significantly compared with the large heat flux cases. When the heat flux is lower than 2500 W/m2, it is expected that the urea in the supply line will not be melted at the desired time. Therefore, the amount of power supplied from the vehicle battery is important for the operation of the urea heating system.
Figure 7 shows the urea temperature distributions on the inner surface of the urea supply line at the urea melting point. The urea temperature was locally high owing to the location of the heating line; therefore, the urea melting started near the heat line region. However, the temperature variation between maximum and minimum points was not more than 0.5 °C. Therefore, the urea in the supply line melted in almost the same time as in the whole region.
Figure 8 shows the temperature distributions on the cross section of the urea tube according to the urea melting point. The urea temperature was −11 °C, and the temperature difference in the urea region was not more than 0.5 °C. The peak temperature on the heating line point was more than 60 °C. The peak temperature region was narrow because of the low conductivity of the tube material and air gap. However, the heating line contacted the outer surface of the inner tube. The melting point of the inner tube material, polymer, was not high. Therefore, it was important to adjust the peak temperature of the heating line for protecting the inner tube.
3.2. Effect of Ambient Conditions
This study investigated the effect of ambient conditions, such as vehicle speed and ambient temperature. When the vehicle speed increased, the convective heat transfer coefficient on the outer surface also increased. In this study, the convective heat transfer coefficient on the outer surface changed from 100 W/m2∙K to 300 W/m2∙K. The ambient temperature was one of the main factors to influence the urea melting time. The ambient temperature changed from −25 °C to −50 °C.
Figure 9 shows the urea temperature variation when changing the external heat transfer coefficient owing to vehicle velocity. The external heat transfer coefficient changed from 100 W/m2∙K to 300 W/m2∙K. The urea temperature during the urea melting did not change, despite the change in the external heat transfer coefficient. The temperature difference was 0.2 °C between h = 100 W/m2∙K and h = 300 W/m2∙K.
Table 3 and Table 4 summarize the thermal resistance in the urea-SCR heating tube. The thermal resistance of the air gap located between the inner and outer tube took up most of the total thermal resistance of the tube owing to low air thermal conductivity. Then, the thermal resistance of external convective heat transfer occupied 2–6% of the total thermal resistance, which depended on the external convective heat transfer coefficient. As a result, the total thermal resistance did not change much, even if the heat transfer coefficient on the external surface increased three times because of the change in the vehicle speed. There was no meaningful change in the urea melting time. It was confirmed that the air gap is a good insulator to reduce the effect of external convective heat transfer.
To investigate the effect of ambient temperature, the ambient temperature was changed from −50 °C to −25 °C. Figure 10 shows the urea temperature variation in the different ambient temperatures. As the ambient temperature decreased, the usage time of urea melting increased because it required a large quantity of heat. It took about 300 s for urea to melt at Tamb = −35 °C; however, it did not fully melt even after 1000 s at −50 °C. Especially, the urea temperature in the Tamb = −50 °C case did not change after 500 s, which was the phase change section. This means that the heat balance between the heater and heat loss to the external surface of the tube is equal. The heat from the heating line did not transfer to the phase change from solid to liquid of the urea. In the Tamb = −50 °C condition, the heat flux on the heater should be more than 5000 W/m2 to melt the urea in a tube. The heat flux in the heater should be controlled following the ambient temperature to reduce the urea melting time.
4. Conclusions
Heat transfer and urea melting time prediction in a urea supply line were investigated. The urea melting was affected by supply power and environmental conditions, such as the ambient temperature and vehicle speed. Transient numerical analysis was used to investigate the effect of ambient conditions and supply power. Results indicated the following conclusions:
- There is a limit to the power supply to the heater because of the limitation of the output of the vehicle battery. Nevertheless, the urea melted in less than 600 s at Tamb = −25 °C, even at the lowest power supply ().
- When the vehicle speed increased, the convective heat transfer coefficient on the external surface of the tube also increased. However, the thermal resistance of convective heat transfer on the external surface was not a large portion of the total thermal resistance of the urea supply tube. As a result, the urea melting time did not change, even though the vehicle speed increased.
- The urea melting time was largely affected by the ambient temperature. When the ambient temperature was −50 °C, the urea did not melt in the case due to the match of the heat balance between the heat supply and heat loss to the external surface of the tube. Therefore, the power supply should be controlled for urea melting by the ambient temperature.
Author Contributions
J.C. and J.S.P. designed and conducted numerical analysis. S.-H.C. and M.S.C. contributed to analysis and guided writing the manuscript. All authors analyzed the data. All authors discussed the results and commented on the manuscript.
Acknowledgments
This research was supported by Basic Science Research Program through the National Research Foundation of Korea (NRF) funded by the Ministry of Education (2016R1D1A1B03935374).
Conflicts of Interest
The authors declare no conflict of interest.
Nomenclature
| Cavg | Average specific heat of urea |
| CL | Specific heat of liquid urea |
| CS | Specific heat of solid urea |
| H | Enthalpy of urea |
| HTR | Enthalpy of urea between solid/liquid temperature |
| he | Convective heat transfer coefficient on external surface |
| kair | Conductivity of air |
| ki | Conductivity of TPE |
| ko | Conductivity of PPA |
| kurea | Conductivity of urea |
| L | Length of tube |
| Nu | Nusselt number |
| Pr | Prandtl number |
| Heat flux | |
| Rc | Resistance of copper |
| Re | Reynolds number |
| ri1 | Inner diameter of inner pipe |
| ri2 | Outer diameter of inner pipe |
| rair | Inner diameter of outer pipe |
| rout | Outer diameter of outer pipe |
| T | Temperature |
| V | Voltage |
| Density of urea |
References
- A Cleaner and Safer Future with SCR. AutoTechnology 2004, 4, 28–30. [CrossRef]
- Willems, F.; Cloudt, R.; Van Den Eijnden, E.; Van Genderen, M.; Verbeek, R.; De Jager, B.; Boomsma, W. Is closed-loop SCR control required to meet future emission targets? In SAE Technical Paper; SAE International: Hong Kong, China, 2007. [Google Scholar]
- Lee, S.-Y.; Kim, M.-Y.; Lee, C.-H.; Park, Y.-B. Numerical Investigation of the Urea Melting and Heat Transfer Characteristics with Three Different Types of Coolant Heaters. Trans. Korean Soc. Automot. Eng. 2012, 20, 125–132. [Google Scholar] [CrossRef]
- Van Helden, R.; Verbeek, R.; Willems, F.; van der Welle, R. Optimization of Urea SCR deNOx Systems for HD Diesel Engines. In SAE Technical Paper; SAE International: Hong Kong, China, 2004. [Google Scholar]
- Choi, B.-C.; Kim, Y.K.; Jhung, W.-N.; Lee, C.-H.; Hwang, C.-Y. Experimental investigation on melting characteristics of frozen urea-water-solutions for a diesel SCR de-NOx-system. Appl. Therm. Eng. 2013, 50, 1235–1245. [Google Scholar] [CrossRef]
- Birkhold, F.; Meingast, U.; Wassermann, P.; Deutschmann, O. Modeling and simulation of the injection of urea-water-solution for automotive SCR DeNOx-systems. Appl. Catal. B Environ. 2007, 70, 119–127. [Google Scholar] [CrossRef]
- Aus der Wiesche, S. Numerical heat transfer and thermal engineering of AdBlue (SCR) tanks for combustion engine emission reduction. Appl. Therm. Eng. 2007, 27, 1790–1798. [Google Scholar] [CrossRef]
- AdBlue, Technical leaflet, M 6221 e, November 2006. Available online: http://www.gabriels.be/sites/gabriels/files/pdf/technische_fiche_adblue-_engels.pdf (accessed on 29 April 2018).
- ANSYS, Release 18.0 User’s Guide. 2017. Available online: https://support.ansys.com/AnsysCustomerPortal/en_us/Knowledge+Resources/Tutorials+&+Training+Materials (accessed on 29 April 2018).
- Incropera, F.; DeWitt, D.; Bergman, T.; Lavine, A. Fundamentals of Heat and Mass Transfer, 6th ed.; John Wiley & Sons: Hoboken, NJ, USA, 2007; pp. 423–428. [Google Scholar]
- Sin, Y.; Kim, H.; Han, S.; Choo, S. Thawing characteristics of the urea solution in accordance with the heating voltage and ambient temperature. In Proceeding of KSAE; The Korea Society of Automotive Engineers: Seoul, Korea, 2016; pp. 109–111. [Google Scholar]
Figure 1.
Cross section of urea supply line with heater.
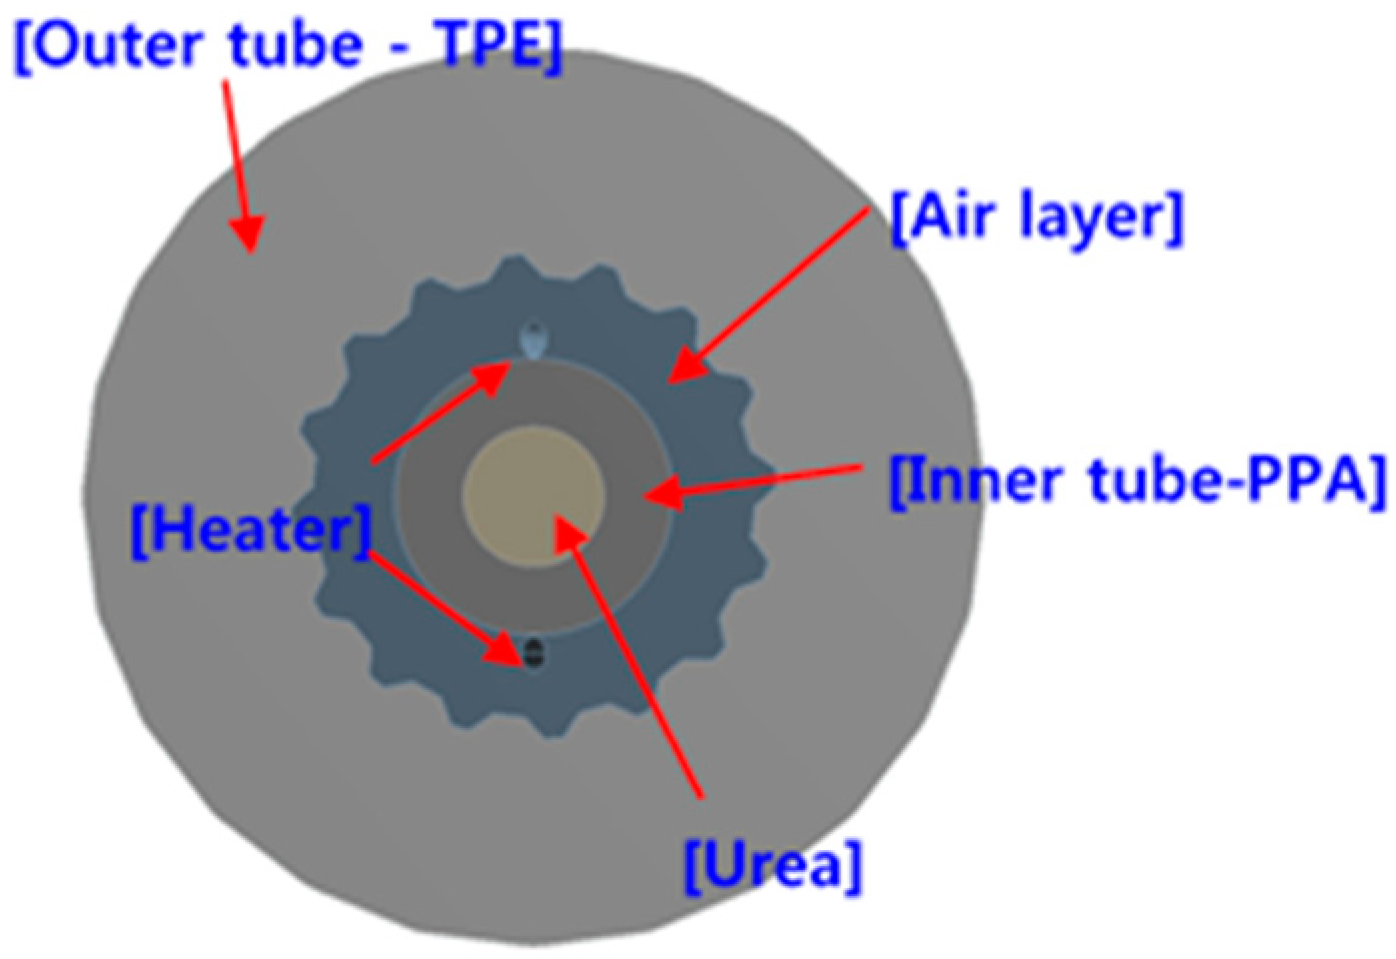
Figure 2.
Urea properties with temperature, density, and specific heat.
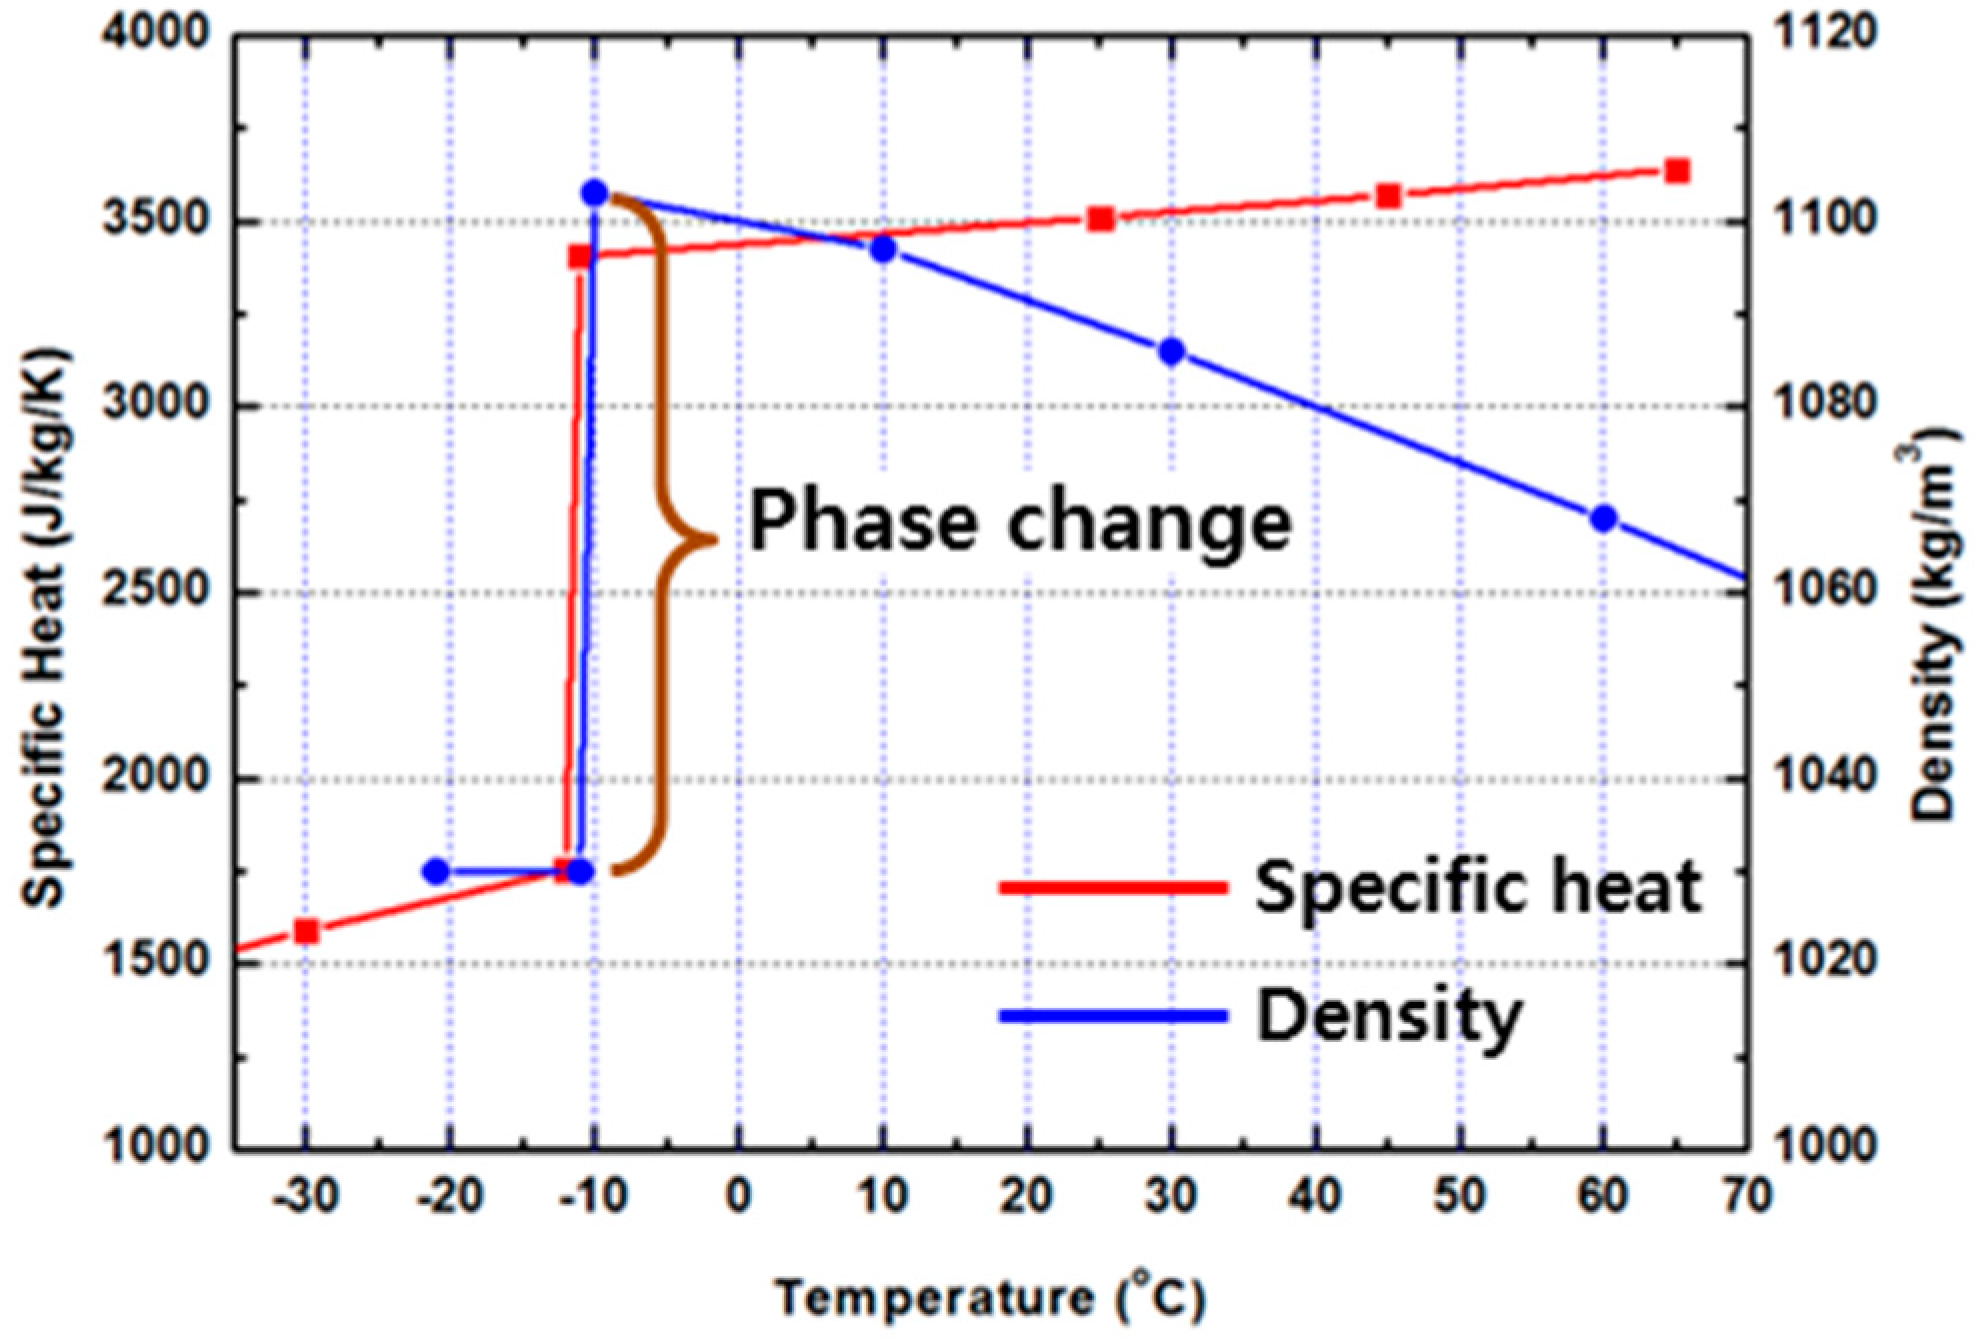
Figure 3.
Heat transfer circuit of urea supply tube with heater.
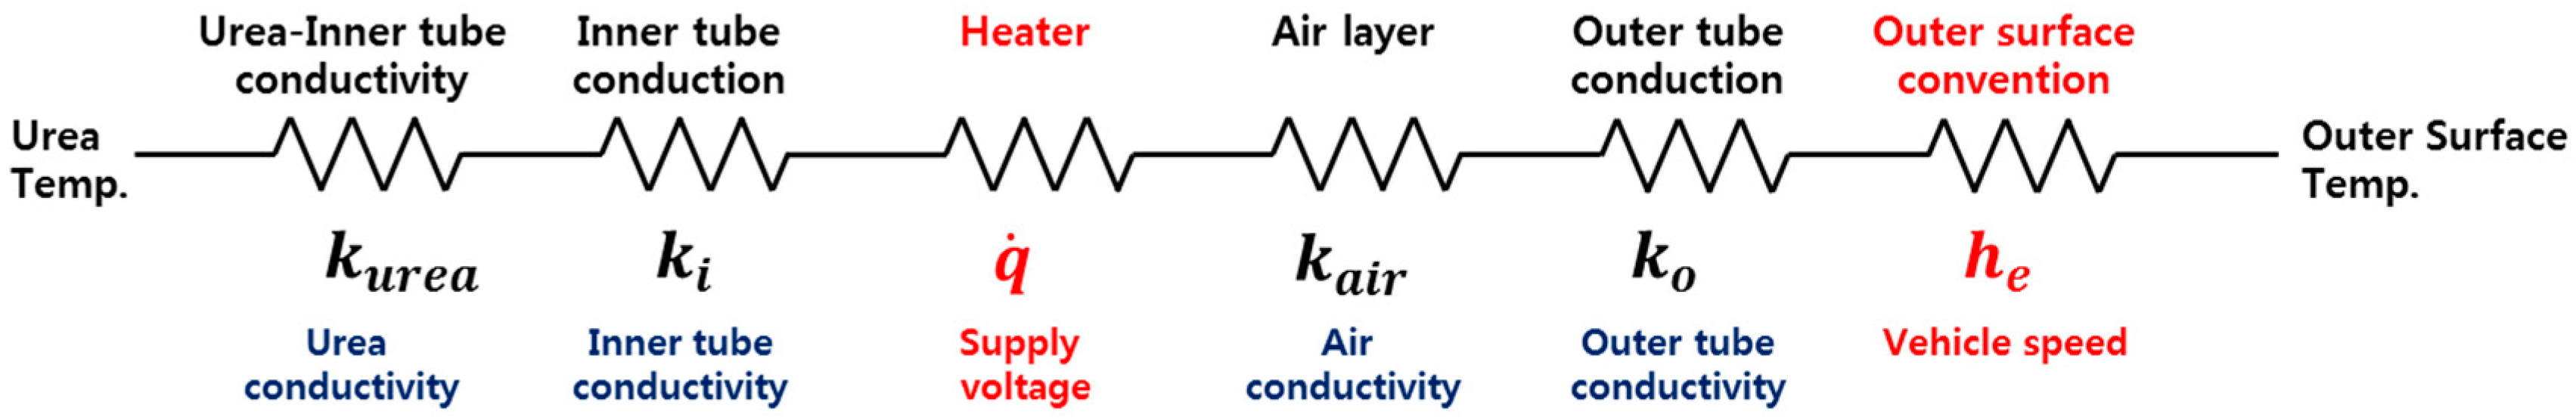
Figure 4.
Heat transfer coefficient and Reynolds number on outer surface of tube.
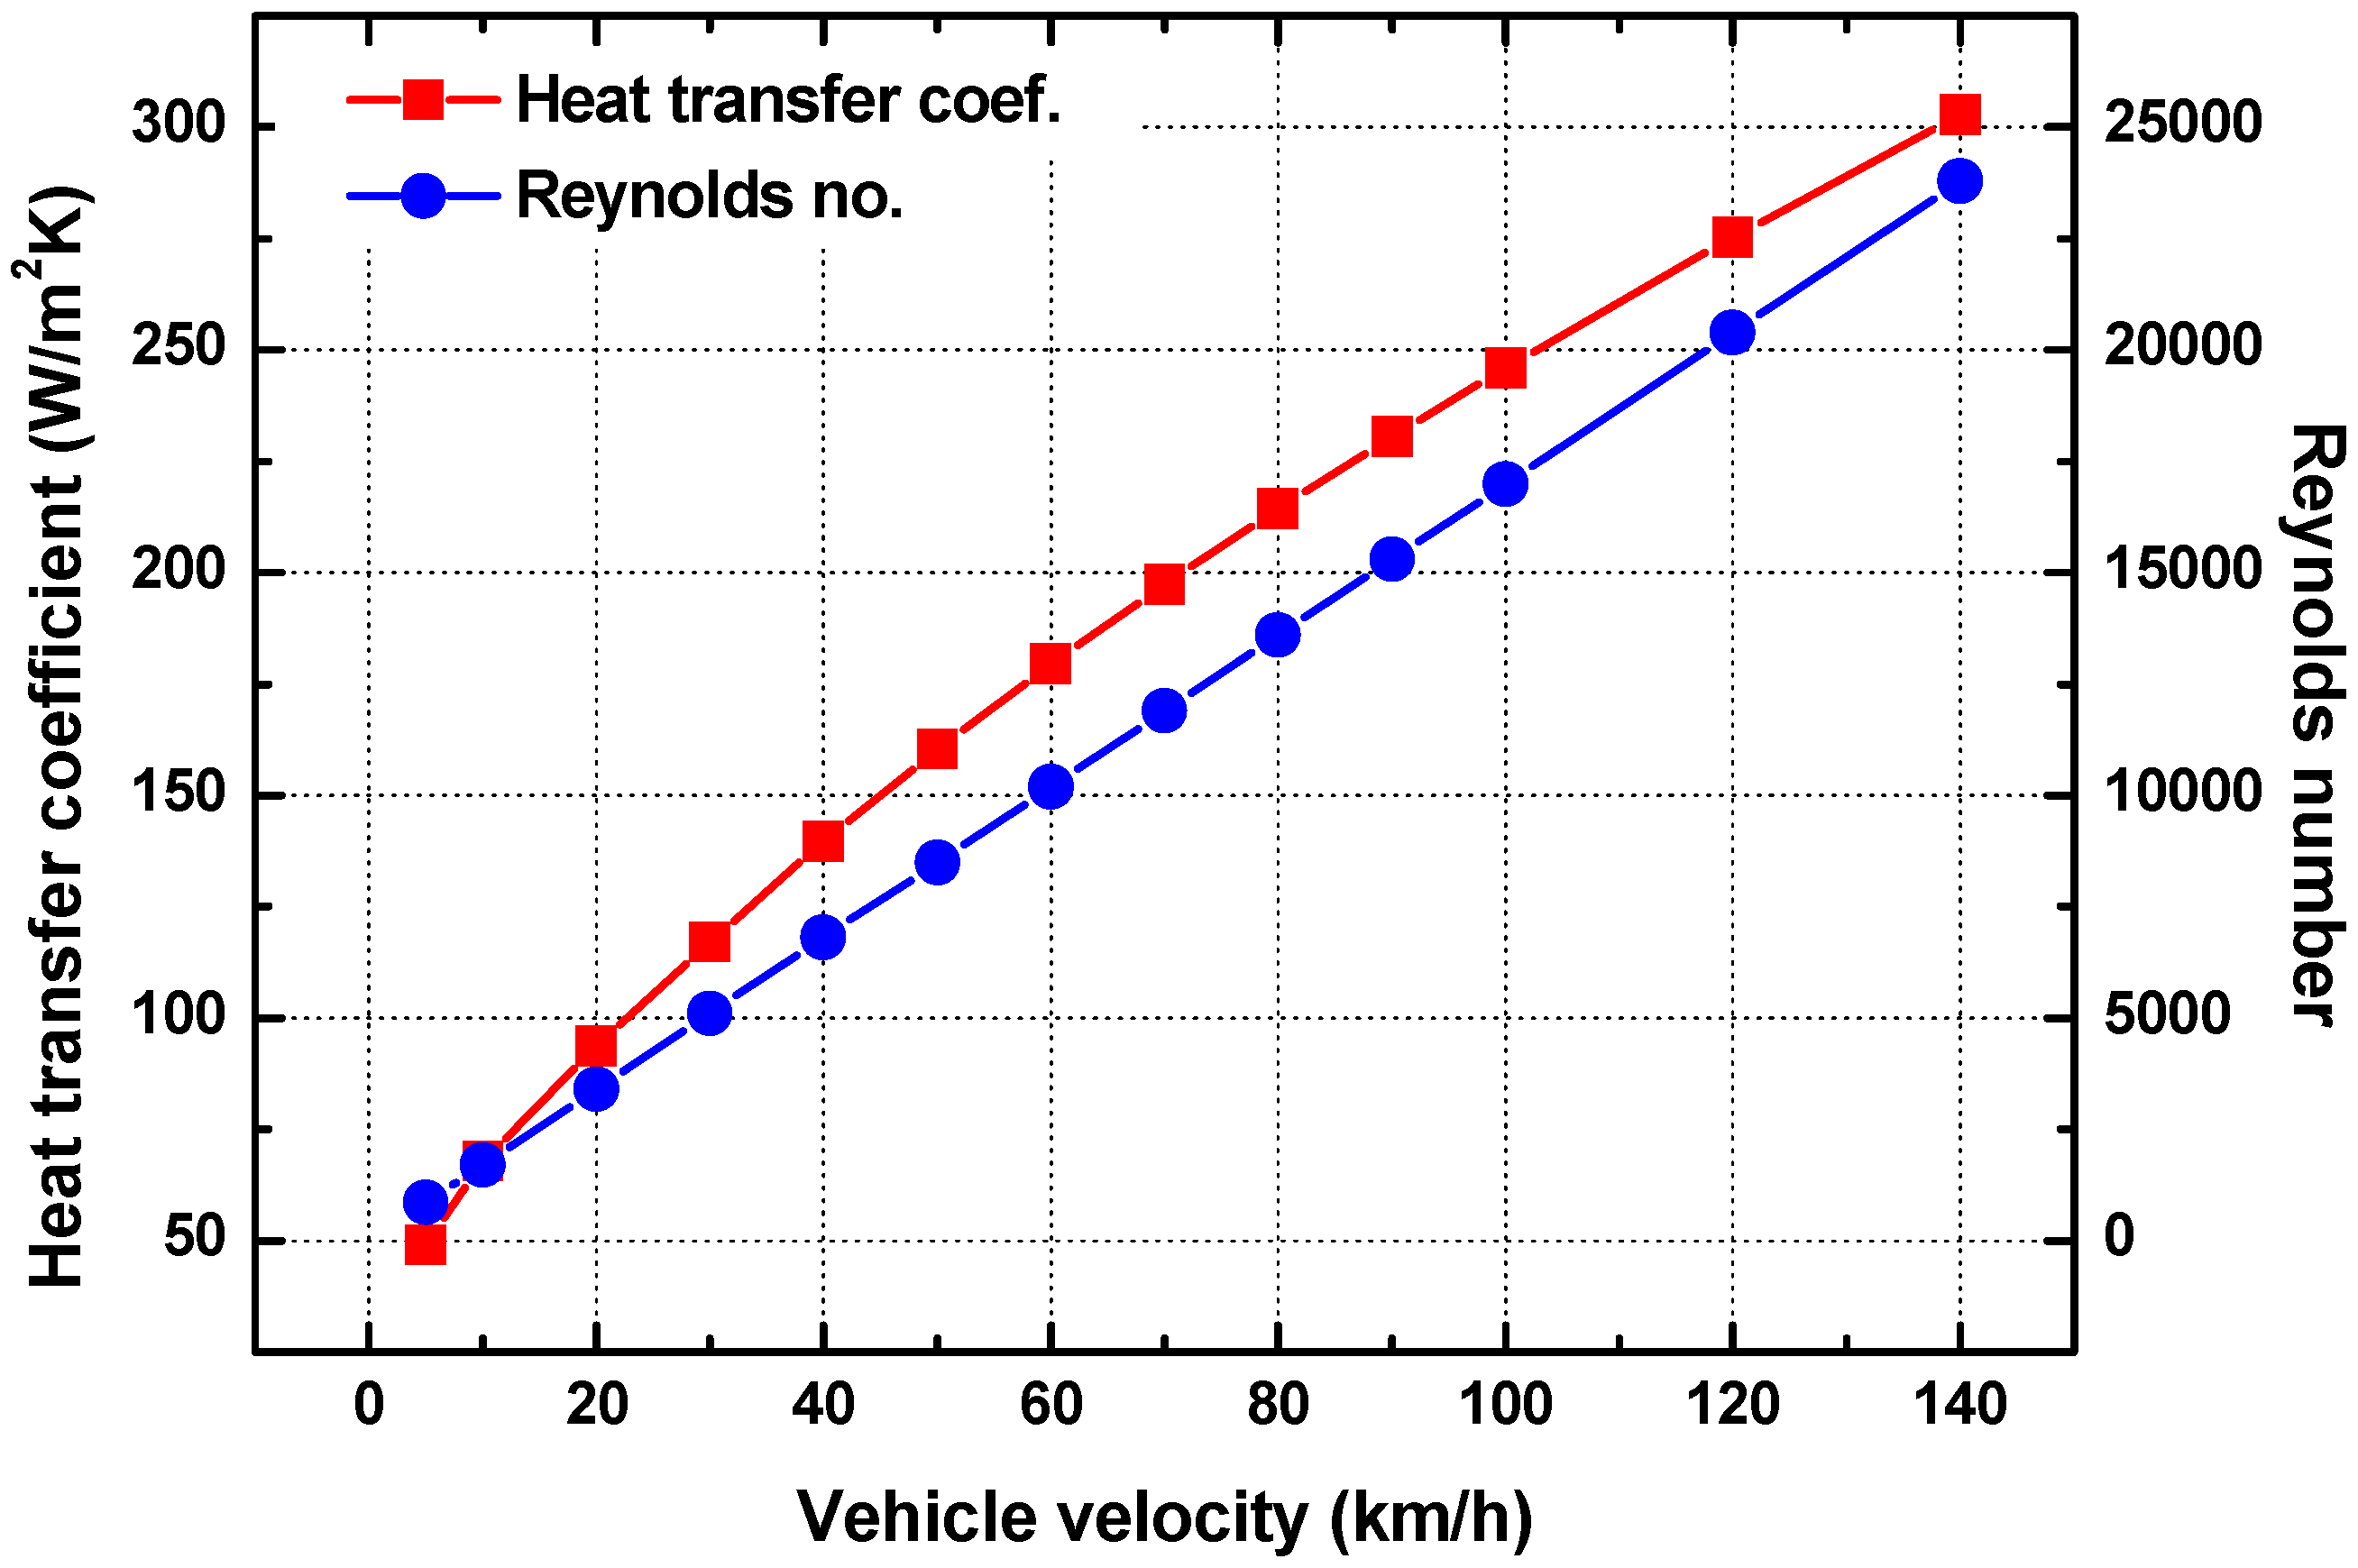
Figure 5.
Grid of analysis model.

Figure 6.
Urea temperature variation during urea melting at h = 100 W/m2∙K.
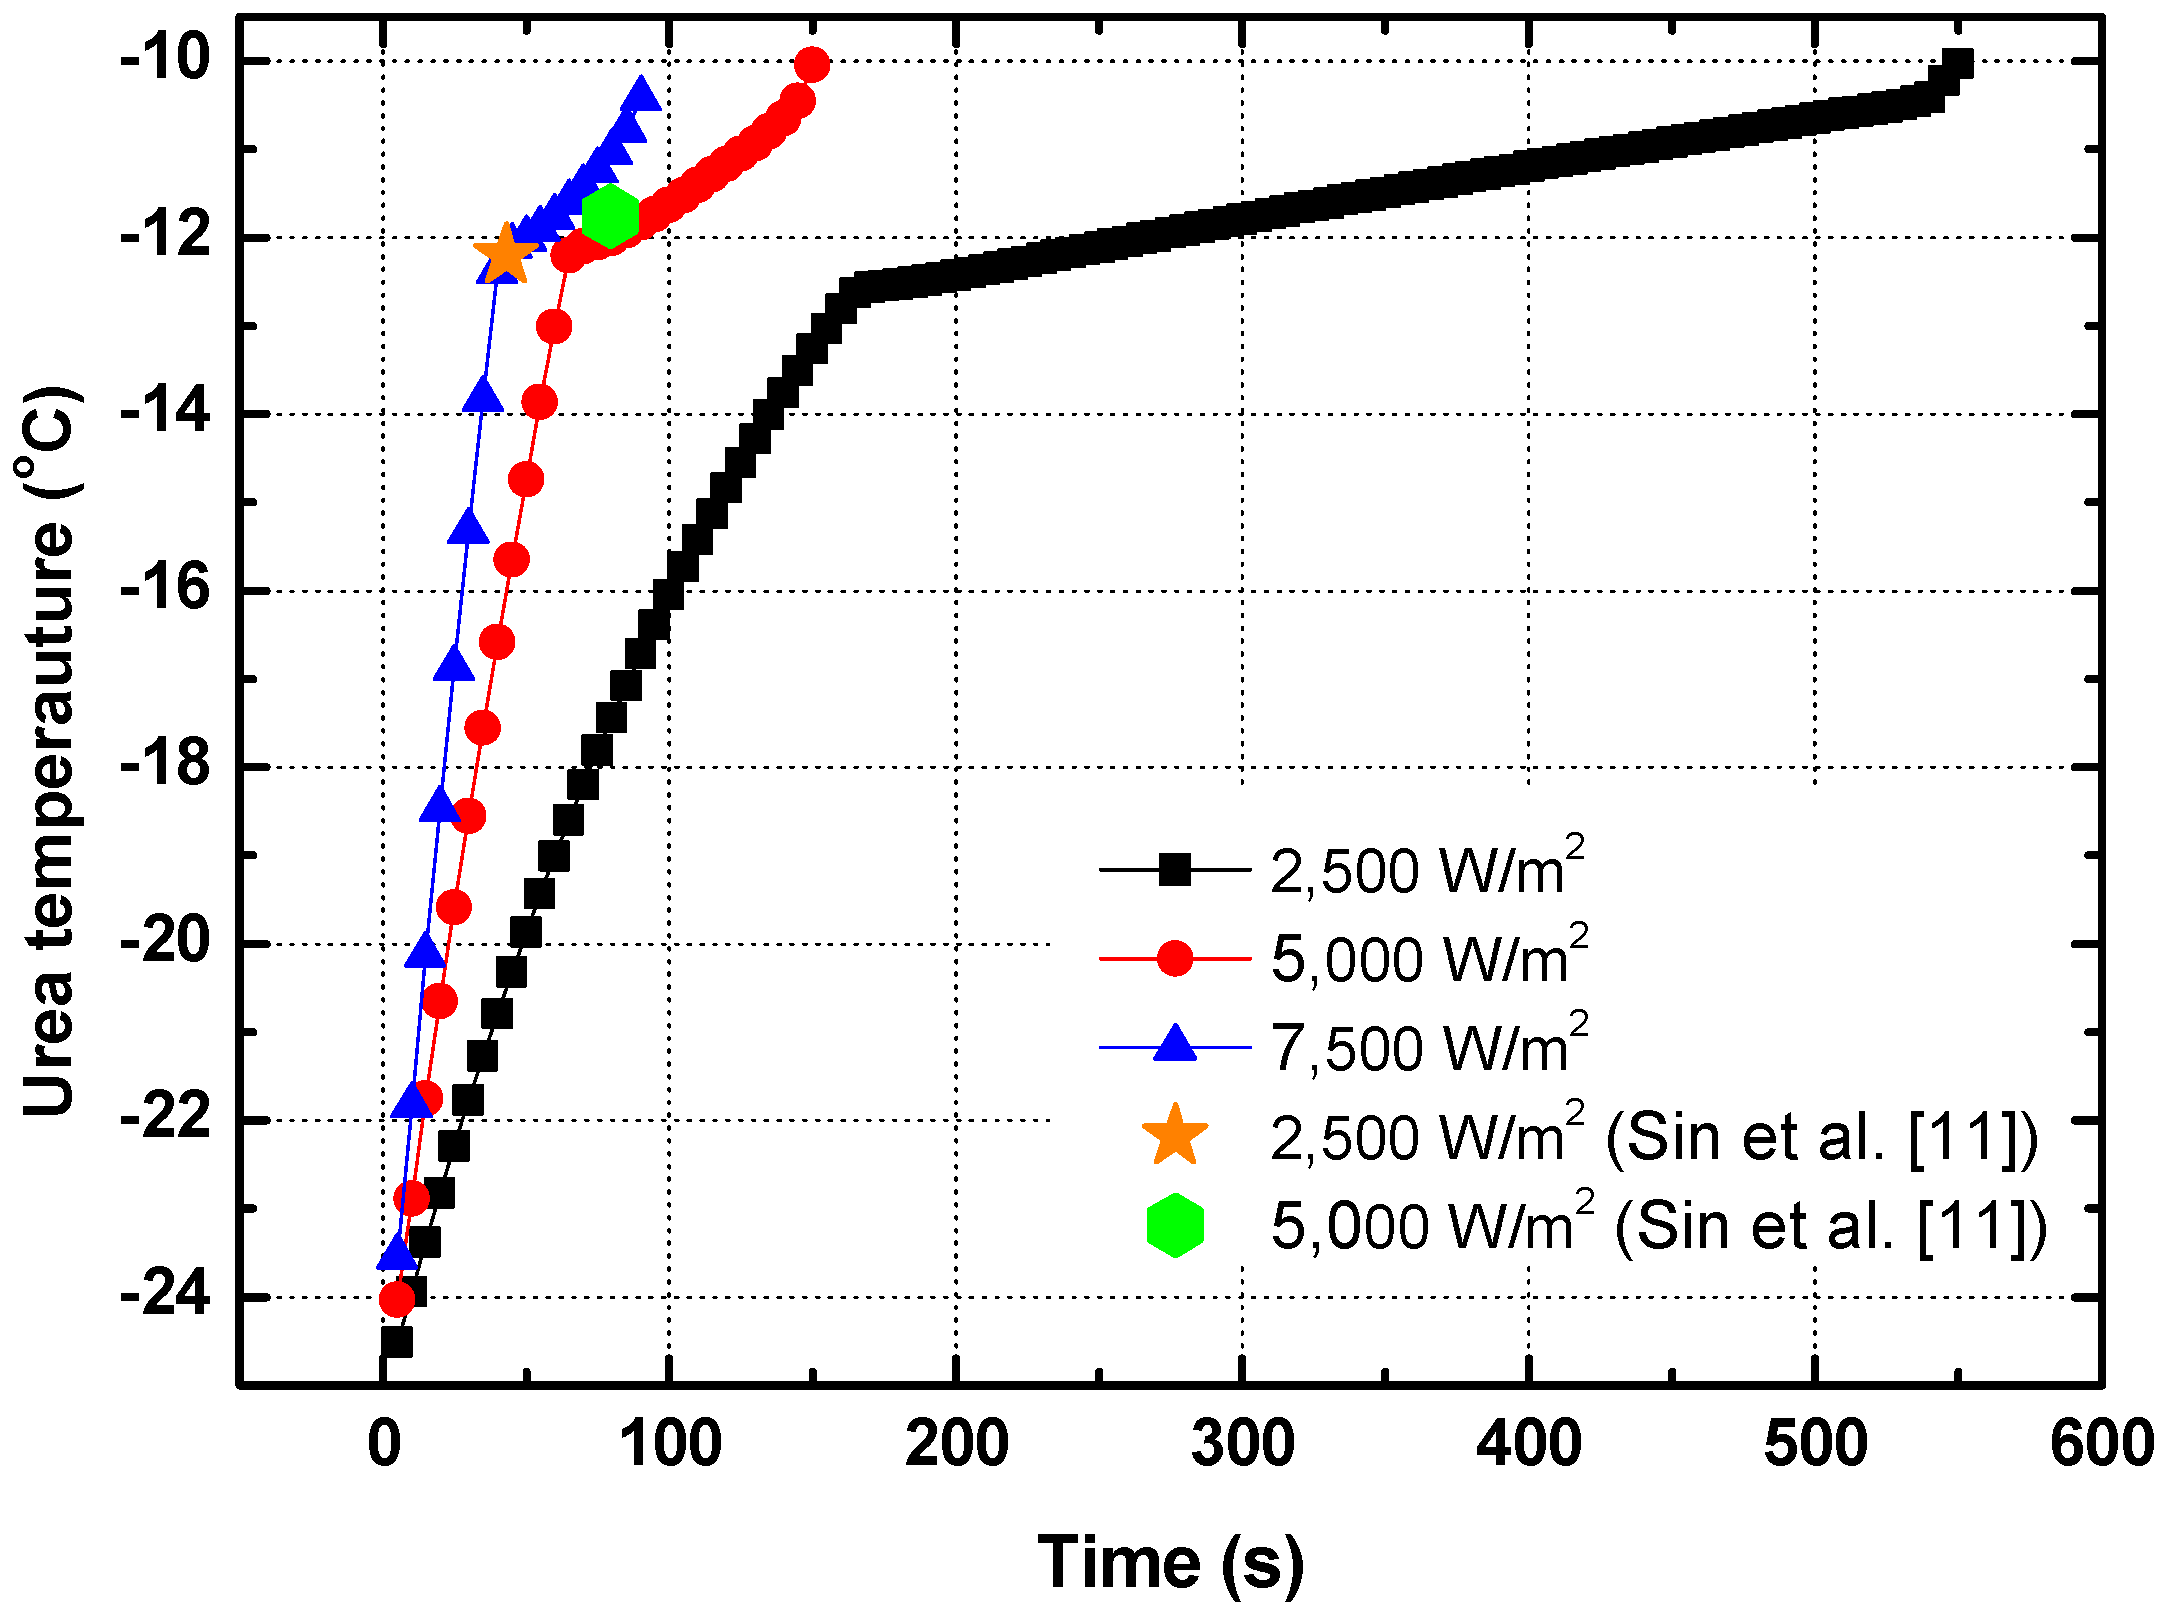
Figure 7.
Urea temperature on inner tube at urea melting point.

Figure 8.
Urea temperature on inner tube at urea melting point: (a) Urea temperature on inner tube at urea melting point; (b) Urea temperature on inner tube at urea melting point.
Figure 8.
Urea temperature on inner tube at urea melting point: (a) Urea temperature on inner tube at urea melting point; (b) Urea temperature on inner tube at urea melting point.
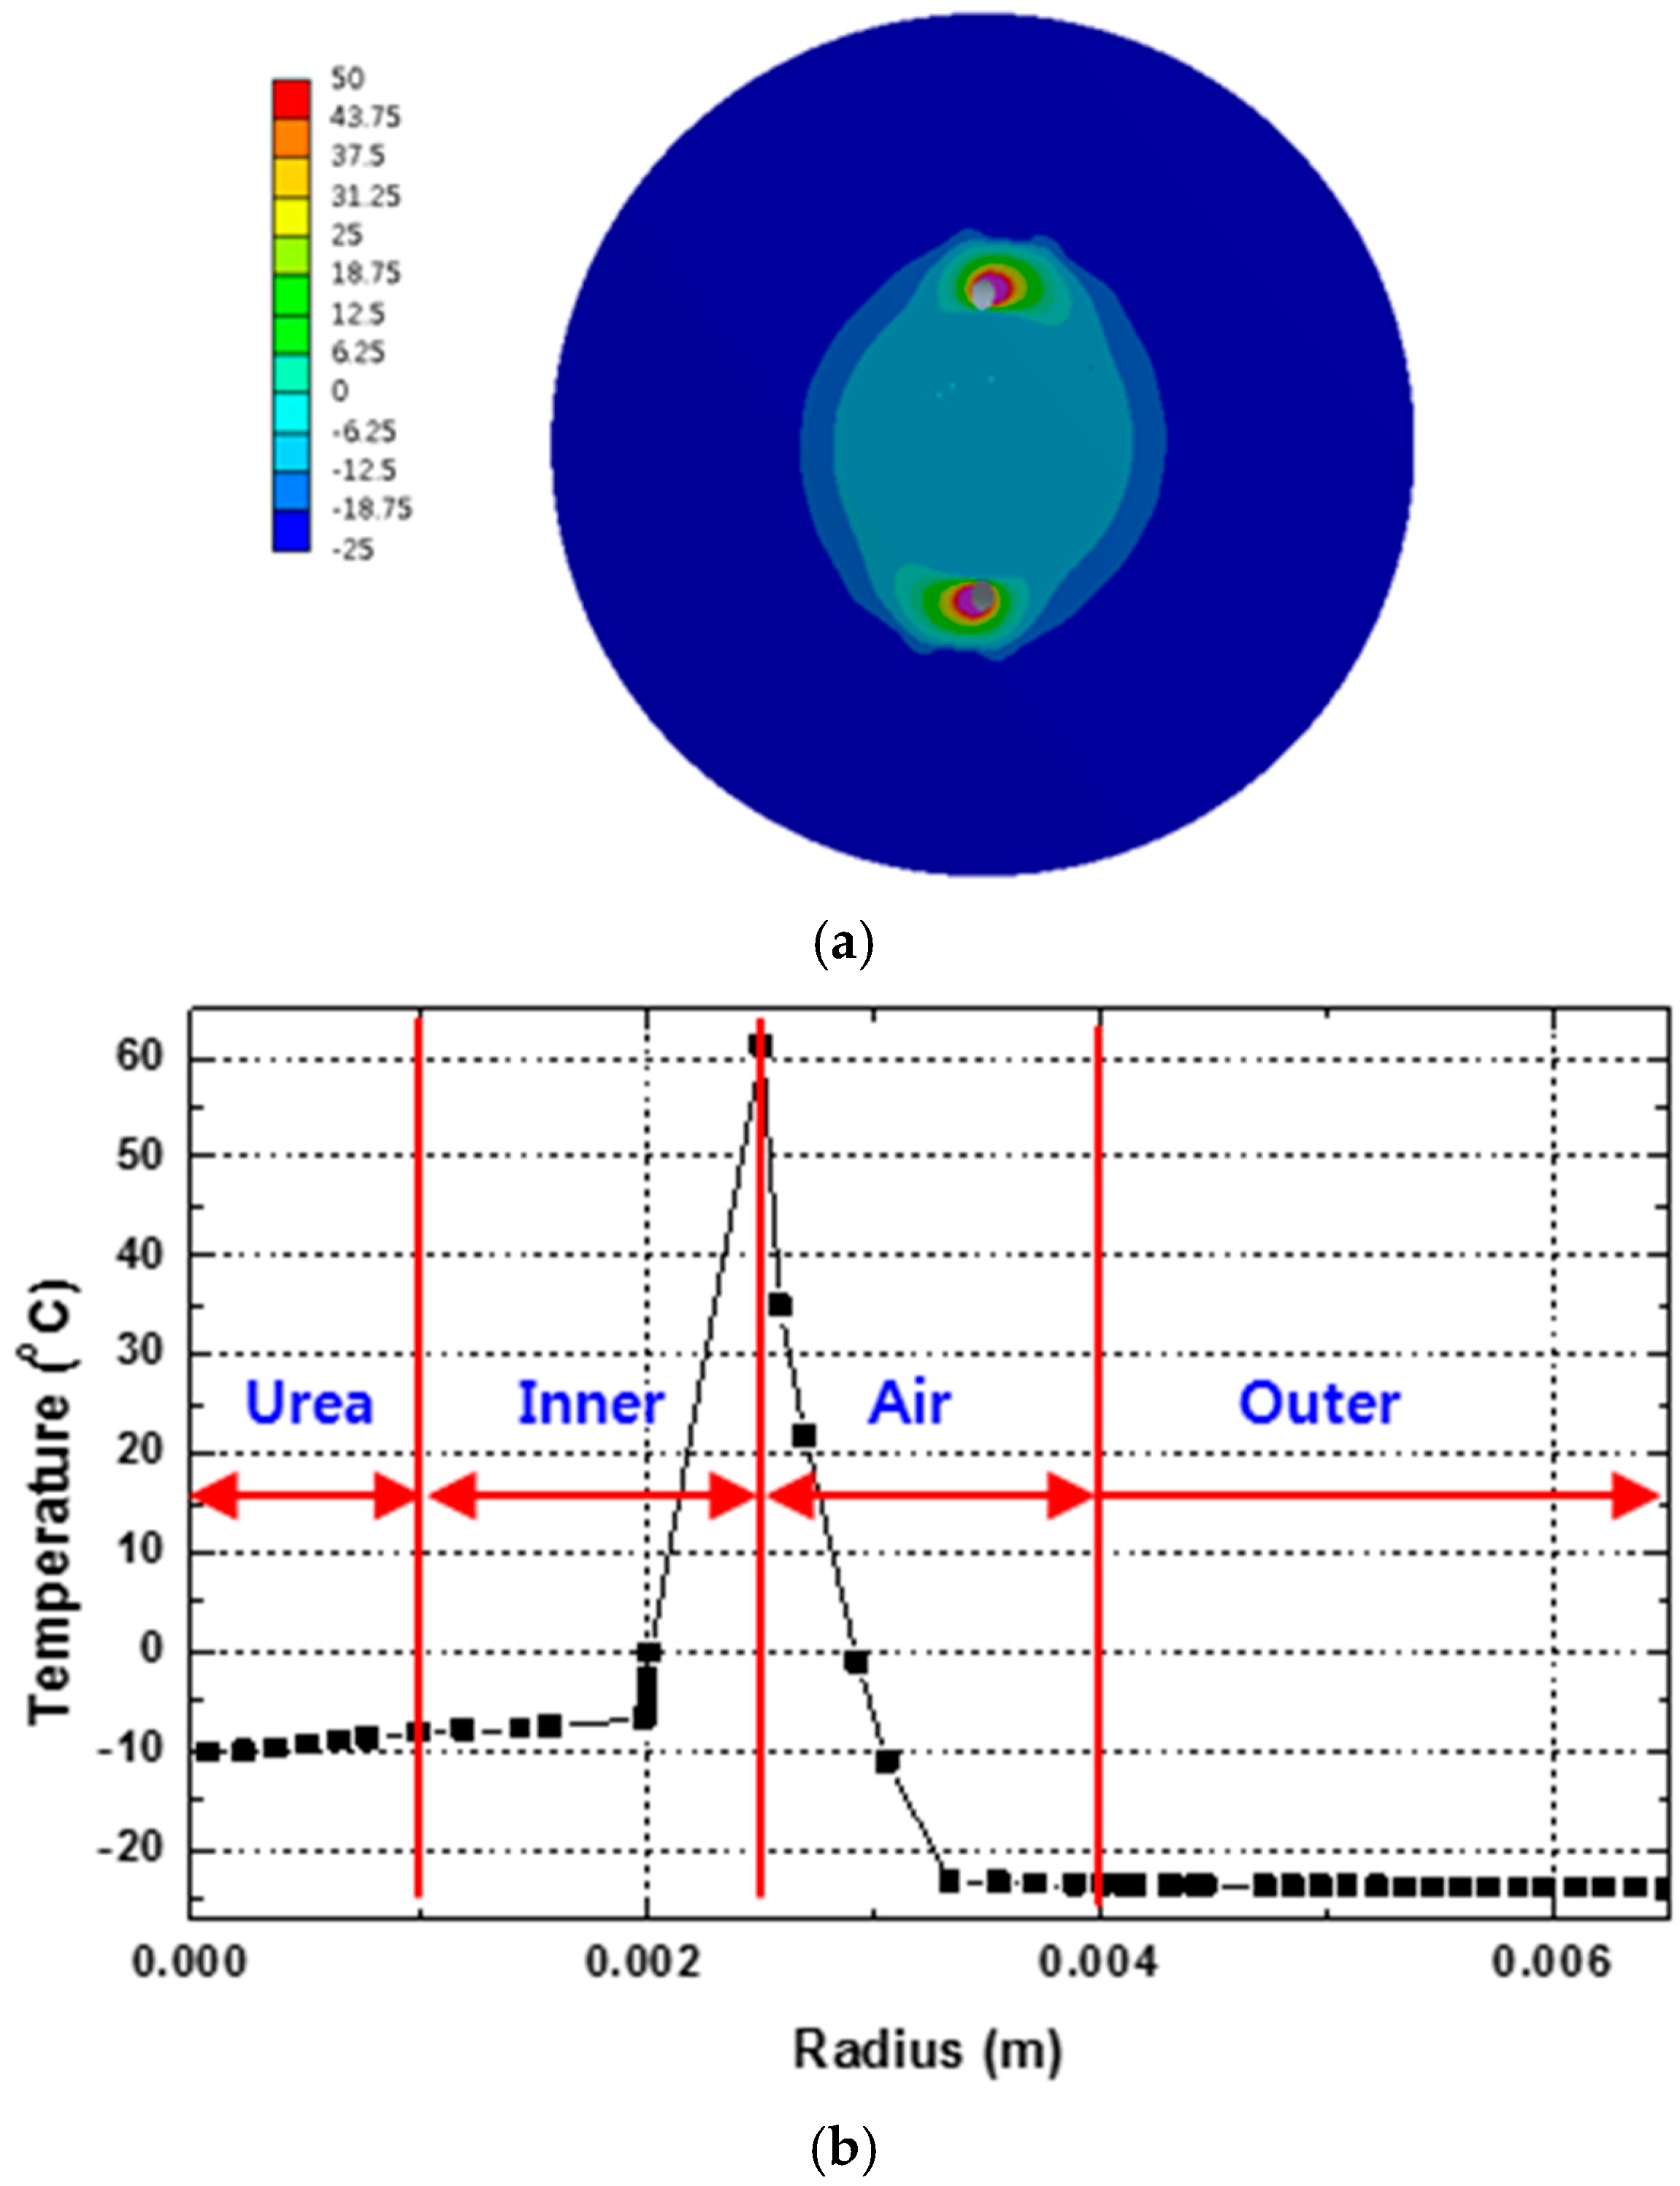
Figure 9.
Urea temperature variation at h = 100 W/m2∙K and 300 W/m2∙K.
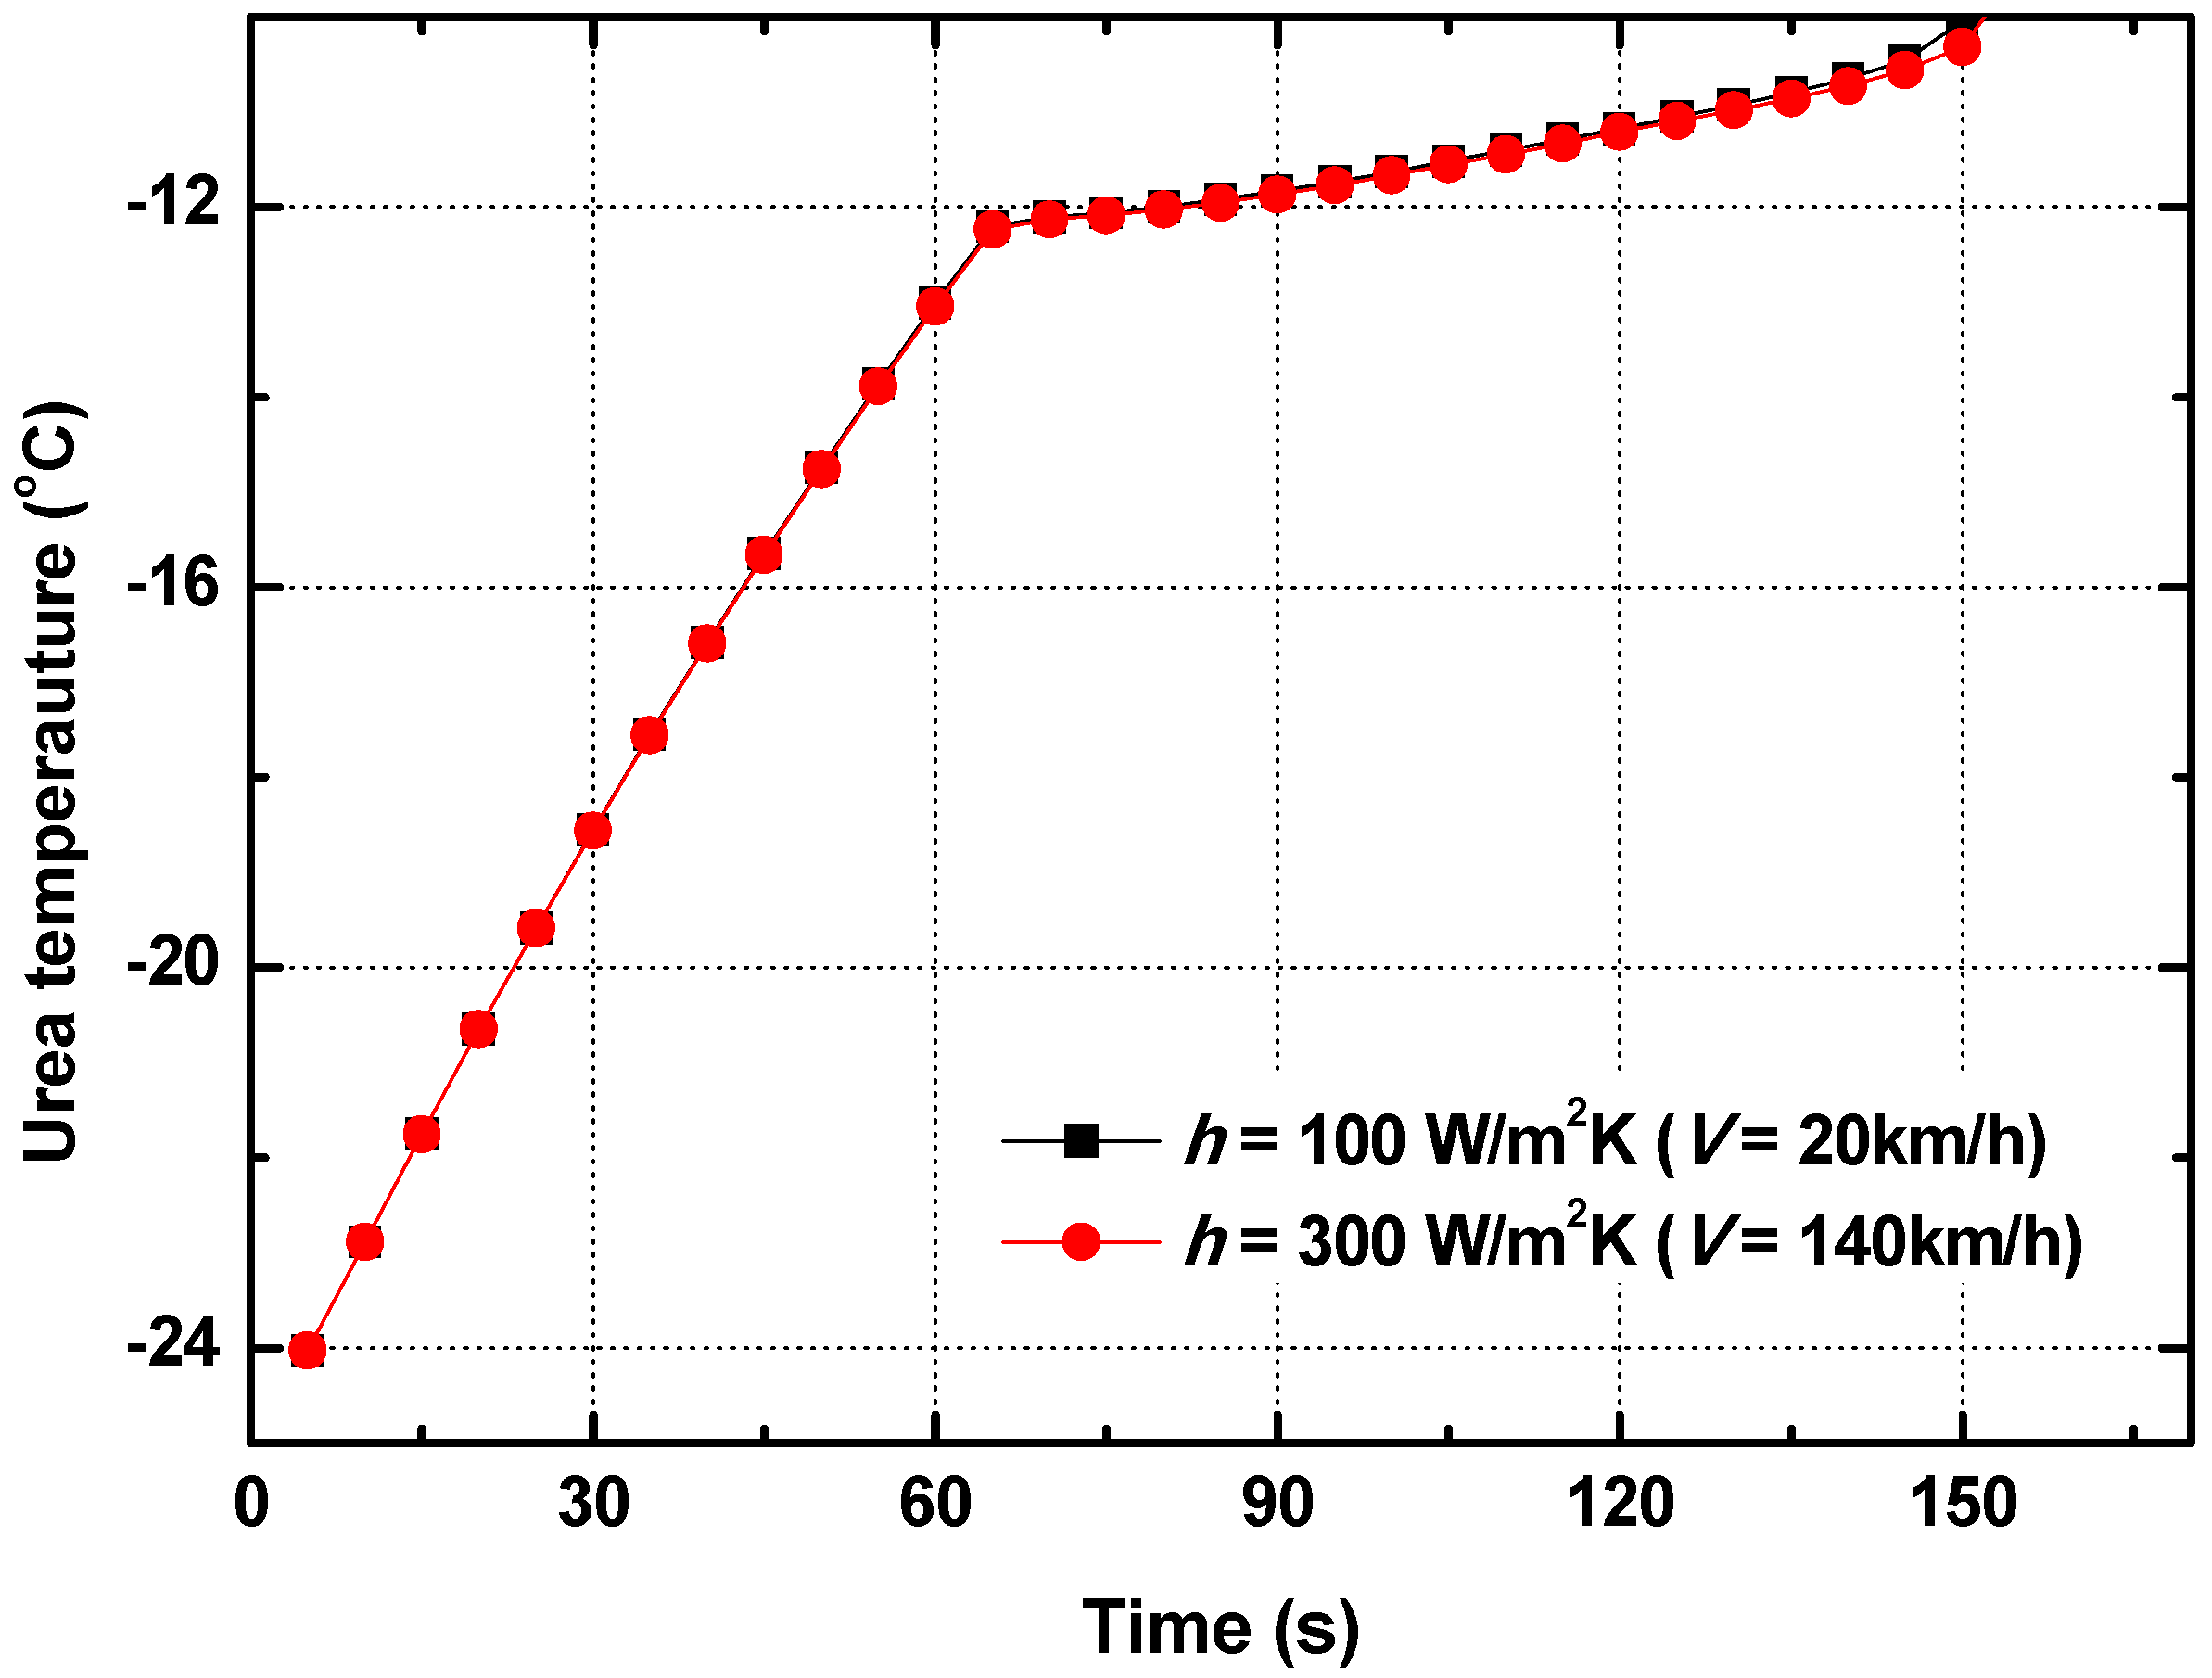
Figure 10.
Urea temperature variation in different ambient temperatures at .


Table 1.
Urea and tube material thermal properties [8].
Table 1.
Urea and tube material thermal properties [8].
| Conductivity of TPE | 2.61 W/m∙K | Conductivity of air | 0.0242 W/m∙K |
| Conductivity of PPA | 3.00 W/m∙K | Conductivity of urea, liquid | 0.570 W/m∙K |
| Latent heat of urea | 152.86 kJ/kg | Conductivity of urea, solid | 0.750 W/m∙K |
Table 2.
Boundary conditions of numerical analysis.
| No. of Grid | 1,915,630 | Heat Flux Variation | 2500 W/m2 to 7500 W/m2 |
| Total analysis time | 600 s | Initial temp. variation | −25 °C to −50 °C |
| Time step | 5 s | Outer heat transfer coef. | 100 W/m2∙K to 300 W/m2∙K |
Table 3.
Thermal resistances in the urea-SCR supply line.
| Location | Thermal Resistance |
|---|---|
| Thermal resistance in urea | 4.24 |
| Thermal resistance in inner pipe | 0.845 |
| Thermal resistance in air gap | 69.8 |
| Thermal resistance in outer pipe | 0.688 |
| Thermal resistance in external surface (h = 100 W/m2∙K) | 4.90 |
| Thermal resistance in external surface (h = 300 W/m2∙K) | 1.63 |
Table 4.
Total thermal resistance in the urea-SCR supply line as change in vehicle speed.
| Convective Heat Transfer Coefficient on External Surface | Thermal Resistance in External Surface | Total Thermal Resistance |
|---|---|---|
| h = 10 W/m2∙K | 49.0 | 124.6 |
| h = 100 W/m2∙K | 4.90 | 80.51 |
| h = 300 W/m2∙K | 1.63 | 77.24 |
© 2018 by the authors. Licensee MDPI, Basel, Switzerland. This article is an open access article distributed under the terms and conditions of the Creative Commons Attribution (CC BY) license (http://creativecommons.org/licenses/by/4.0/).
Share and Cite
MDPI and ACS Style
Cha, J.; Chon, M.S.; Choo, S.-H.; Park, J.S. Effects of Supply Power and Environmental Conditions on Urea Coolant Melting Phenomena in Urea Supply Lines in Vehicles. Energies 2018, 11, 1099. https://doi.org/10.3390/en11051099
AMA Style
Cha J, Chon MS, Choo S-H, Park JS. Effects of Supply Power and Environmental Conditions on Urea Coolant Melting Phenomena in Urea Supply Lines in Vehicles. Energies. 2018; 11(5):1099. https://doi.org/10.3390/en11051099
Chicago/Turabian StyleCha, Junepyo, Mun Soo Chon, Seong-Hwa Choo, and Jun Su Park. 2018. "Effects of Supply Power and Environmental Conditions on Urea Coolant Melting Phenomena in Urea Supply Lines in Vehicles" Energies 11, no. 5: 1099. https://doi.org/10.3390/en11051099
Note that from the first issue of 2016, this journal uses article numbers instead of page numbers. See further details here.