Article

Investigation of Airflow Patterns in a New Design of Wind Tower with a Wetted Surface

Department of Earth and Environmental Sciences, University of Waterloo, Waterloo, ON, N2L 3G1, Canada
*
Author to whom correspondence should be addressed.
Energies 2018, 11(5), 1100; https://doi.org/10.3390/en11051100
Submission received: 26 March 2018 / Revised: 19 April 2018 / Accepted: 27 April 2018 / Published: 30 April 2018
(This article belongs to the Special Issue Building Energy Use: Modeling and Analysis)

Abstract

:
Passive cooling systems, such as wind towers, can help to reduce energy consumption in buildings and at the same time reduce greenhouse gas (GHG) emissions. Wind towers can naturally ventilate buildings and also can create enhanced thermal comfort for occupants during the warm months. This study proposes a modern wind tower design with a moistened pad. The new design includes a fixed column, a rotating and movable head, an air opening with a screen, and two windows at the end of the column. The wind tower can be installed on roof-tops to take advantage of ambient airflow. The wind tower’s head can be controlled manually or automatically to capture optimum wind velocity based on desired thermal condition. To maximize its performance, a small pump was considered to circulate and spray water on an evaporative cooling pad. A computational fluid dynamics (CFD) simulation of airflow around and inside the proposed wind tower is conducted to analyze the ventilation performance of this new design of wind tower. Thereby, the velocity, total pressure, and pressure coefficient distributions around and within the wind tower for different wind velocities are examined. The simulation results illustrate that the new wind tower design with a moistened pad can be a reasonable solution to improve naturally the thermal comfort of buildings in hot and dry climates.

1. Introduction

Optimized energy consumption and thermal comfort for occupants are important factors in designing buildings, especially in hot and dry climates. It is estimated that over 40 per cent of the total energy consumed in the world is employed in buildings [1,2], and approximately more than 60 per cent of this involves heating, ventilation, and air conditioning (HVAC) systems [1,3]. For example, 65 per cent of the total energy consumed in China’s buildings is from HVAC systems [4], and this percentage in the EU is around 57% [5]. According to reports by Gong et al. [6] and Wang et al. [7], it is predicted that energy consumption in buildings will increase in the future owing to the variations of lifestyles and technology along with increased economic prosperity, so homes will take a larger share of total energy consumption. Robert and Kummert [8] reported that one-third of GHG emissions are created because of energy consumption in buildings. Therefore, passive ventilation systems, such as wind towers, can not only play a significant role in reducing energy consumption in buildings, but also diminish GHG emissions [9].
Bahadori [9,10,11,12,13,14,15,16,17,18] is a pioneer in wind tower research and has carried out extensive studies on passive cooling systems in hot and dry regions over the last four decades. He suggested two modern wind tower designs to improve their performance: “wind towers with wetted columns” and “wind towers with wetted surfaces” [9,13,16]. Bahadori et al. [9,13,16,18,19] theoretically and empirically investigated the operation of both new designs and compared their performance with conventional wind towers. They concluded that the modern wind towers had a better thermal performance compared to the conventional wind towers at a lower temperature and a higher relative humidity. In addition, the efficiency of wind towers with wetted columns is greater than other wind towers in the regions where the velocity of wind is high enough.
Dehghani-Sanij et al. [20,21,22,23,24,25,26,27,28,29,30,31,32] have conducted several studies on passive cooling and natural ventilation systems, such as wind towers, domed roofs, and cisterns in hot and dry climates. Their investigations illustrated that these systems were appropriate solutions to make pleasant cool air in buildings and provide cold drinkable water to people throughout the warm months. Figure 1 shows areas in the Middle East which have utilized wind towers as part of their architectural designs. Figure 2 shows widespread use of conventional and traditional wind towers in Yazd city, Iran as an example. Two new designs of wind towers that can be used in windy regions were proposed by Dehghani-Sanij et al. [33]. These can be installed on top of buildings to face in the direction of maximum wind velocity. They also suggested that the modern wind towers can be utilized in combination with one or more windows, and along with another wind tower facing a different direction, combined with a solar chimney, to improve their operation in buildings [33].
M.R. Khani et al. [34,35] introduced a modular wind tower with wetted pads to use in hot, dry areas. They experimentally and analytically evaluated the modular wind tower’s performance by analyzing several parameters such as air velocity, air temperature and relative humidity at various times and points when the wind velocity was equal to zero. The results showed that the modular wind tower can reduce the air temperature considerably and enhance the relative humidity of airflow in the building. Furthermore, this wind tower can create a mass flow rate entering the building due to buoyancy forces in the absence of ambient wind. A significant benefit of this kind of wind tower is that its construction cost is lower compared to other wind towers.
Pearlmutter et al. [36,37,38] investigated and developed the operation of an evaporative cool tower with multi-stage down-draft (DECT) using theoretical and empirical approaches. The proposed cool tower has a two-stage cooling process. In the first stage, hot and dry ambient air enters the tower and cools adiabatically by evaporation; in the second stage, air from the internal enclosure arrives to down cone. One airflow is thus mixed with the other airstream, and the mixture is cooled by evaporation. Experimental results indicate that the outlet air temperature of the tower is low enough and suitable for occupants. The second stage plays an important role in reducing air temperature, thus using this cool tower is a useful way to provide thermal comfort for semi-enclosed spaces in hot and arid areas.
Issa and Chang [39] studied and developed a theoretical model of the three-stage wind tower with a bypass system for indoor cooling. This model examined several parameters, such as inlet airflow velocity, inlet air temperature, and relative humidity, for a large range of ambient conditions. In this design, airflow enters the cooling system in three stages and then cools by evaporation. The results illustrated that this cooling wind tower design has good efficiency for use in rural dry and hot regions.
Soutullo et al. [40,41,42] studied the energy performance of an evaporative wind tower. They considered and developed two theoretical models, including a thermal model and a fluid flow model. For the performance analysis of the thermal model of the wind tower, a fan and nozzles were employed. This model was used to obtain the thermal response of the system to examine the sensitivity of several design parameters such as water flow, airflow and absorption coefficient of the plastic. The fluid flow model explained the performance of the wind tower when it does not use the fan and nozzles. The thermal results showed a reduction of the air temperature at the exit of the tower between 6 and 8 °C, and an upward increment in the mean relative humidity of 27%. Furthermore, the mean cooling performance of the system was from 38 to 32%, depending on the position investigated.
The main purpose of this study is to introduce a new design of wind tower with a moistened pad. To evaluate the ventilation performance of this design, airflow patterns around and inside the wind tower are simulated using a CFD code. Furthermore, the distributions of velocity, total pressure and pressure coefficient around and within the proposed wind tower for various wind velocities are investigated.

2. The Proposed Wind Tower

Traditional and conventional wind towers with various shapes have been used in the Middle East for many years (more than one thousand years ago in Iran [9]) to establish natural air conditioning and facilitate air circulation in buildings. Bahadori and Dehghani-Sanij [9] classified traditional and conventional wind towers into four general groups: (1) one-sided wind towers; (2) two-sided wind towers; (3) four, six, eight-sided wind towers; and (4) cylindrical wind towers. In areas with consistent wind direction, one-sided wind towers are utilized. But for areas with variable wind directions, other types of wind towers are employed. Figure 3 shows different types of wind towers in various forms.
Traditional and conventional wind towers have several restrictions, which some of them are [9,32,33]:
(1)
Wind tower air openings allow entrance of small birds, insects and dust to the building,
(2)
The wind towers’ head is immobile and mostly cannot catch the optimum wind velocity,
(3)
A portion of the airflow entering from the wind tower (excluding one-sided wind towers) exits without any circulation in the building,
(4)
Low performance is achieved in regions with very low wind velocity,
(5)
Deterioration with precipitation, sun and wind, and restrictions in building and installation,
(6)
The quantity of coolness that can be accumulated in the mass of a traditional wind tower is normally restricted, and may not be sufficient to meet the cooling needs on warm days.
To address these restrictions, we designed a new wind tower to take advantage of moistened pads (Figure 4). Figure 5 illustrates the schematic design of the proposed wind tower in detail.
The new design of wind tower includes the following components:
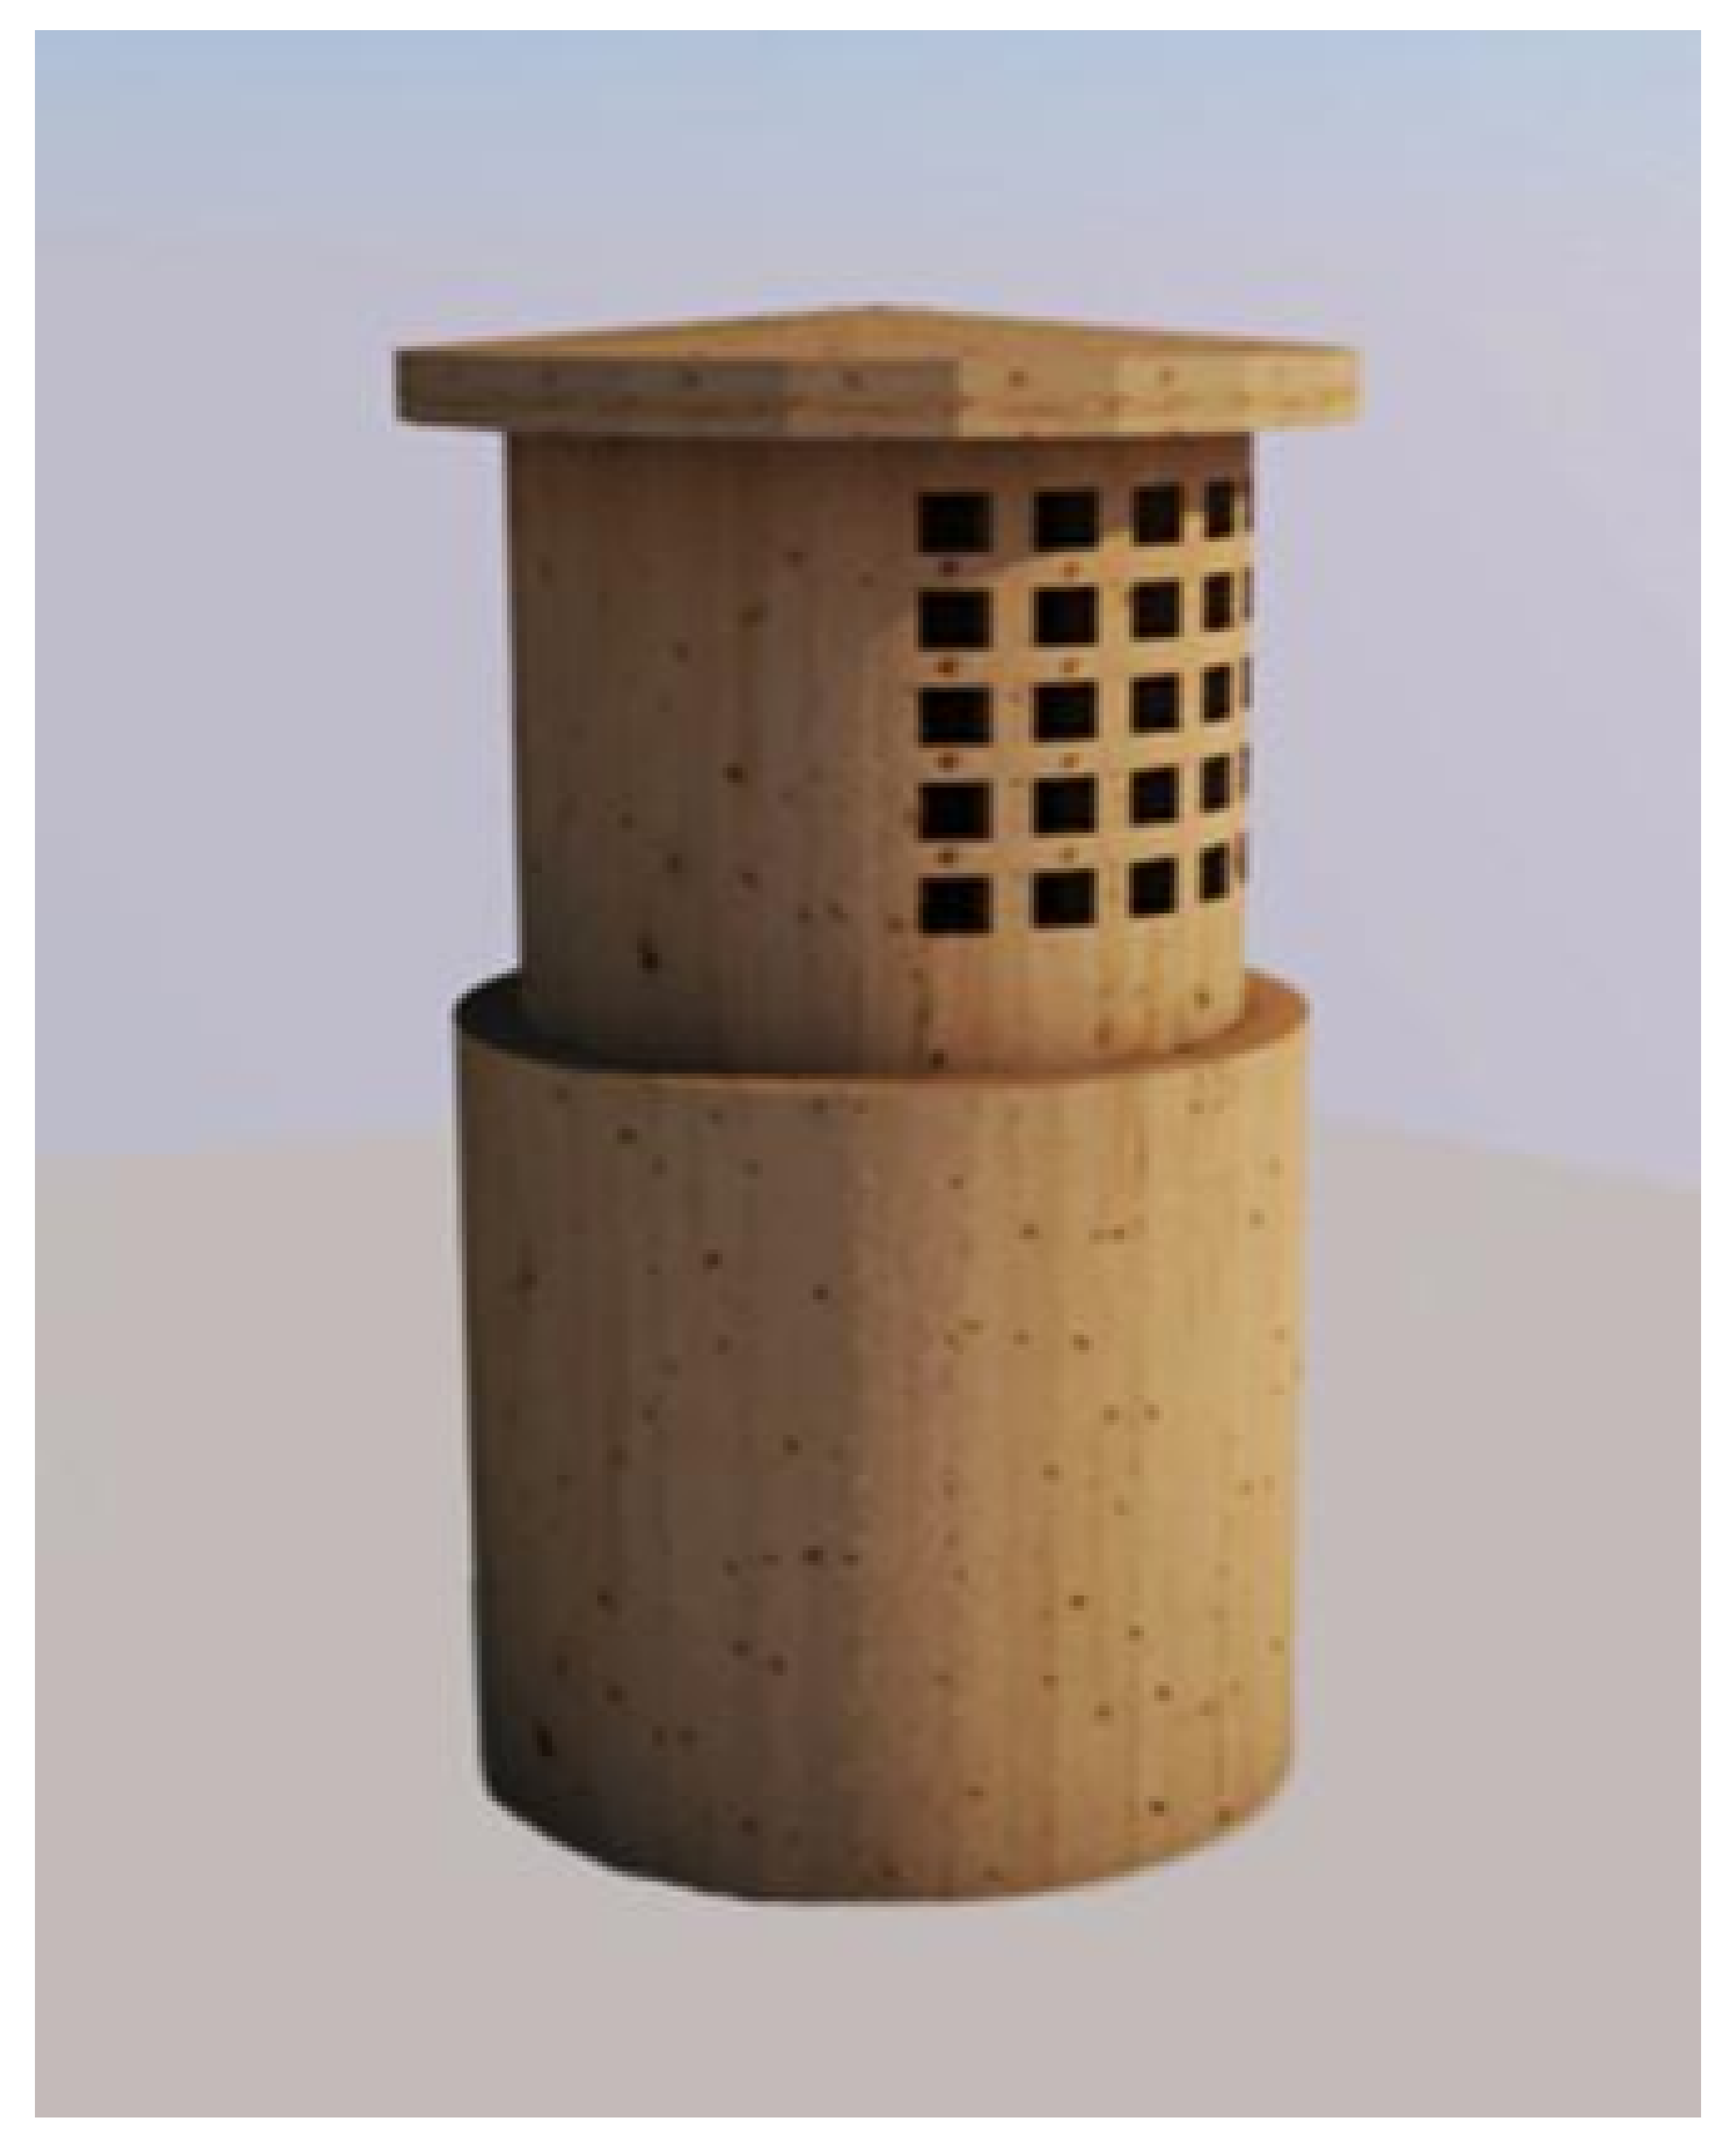
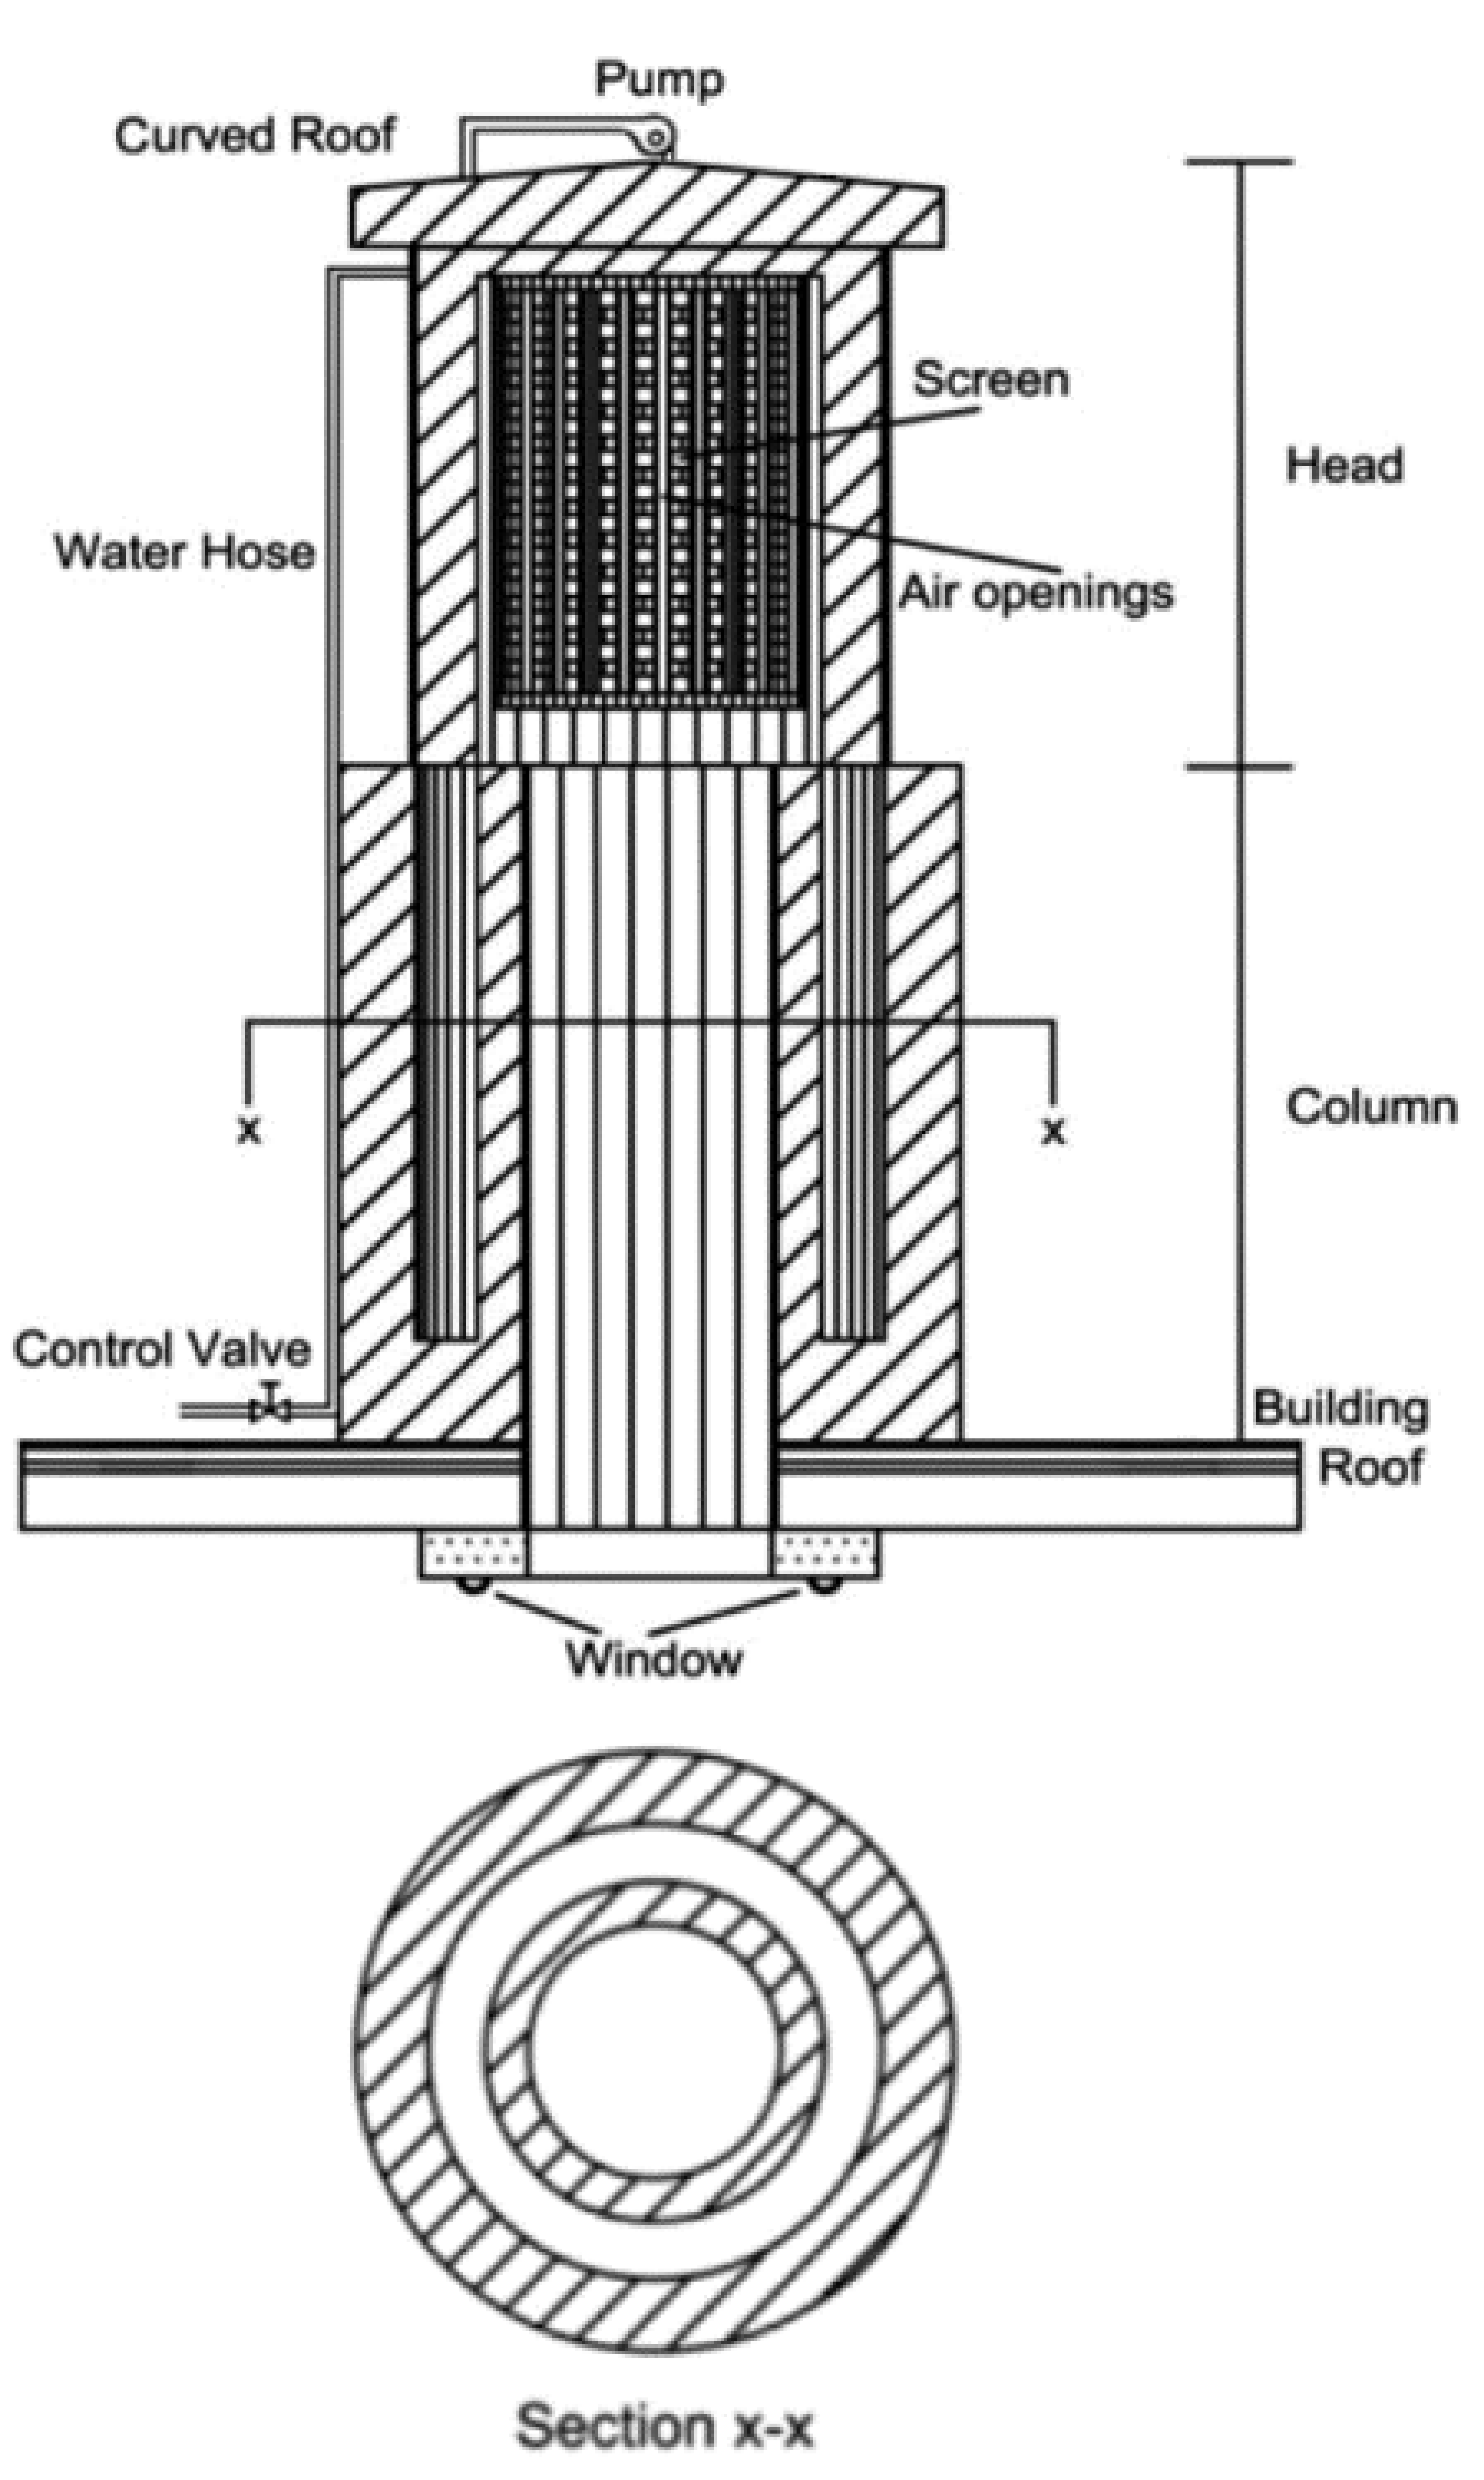
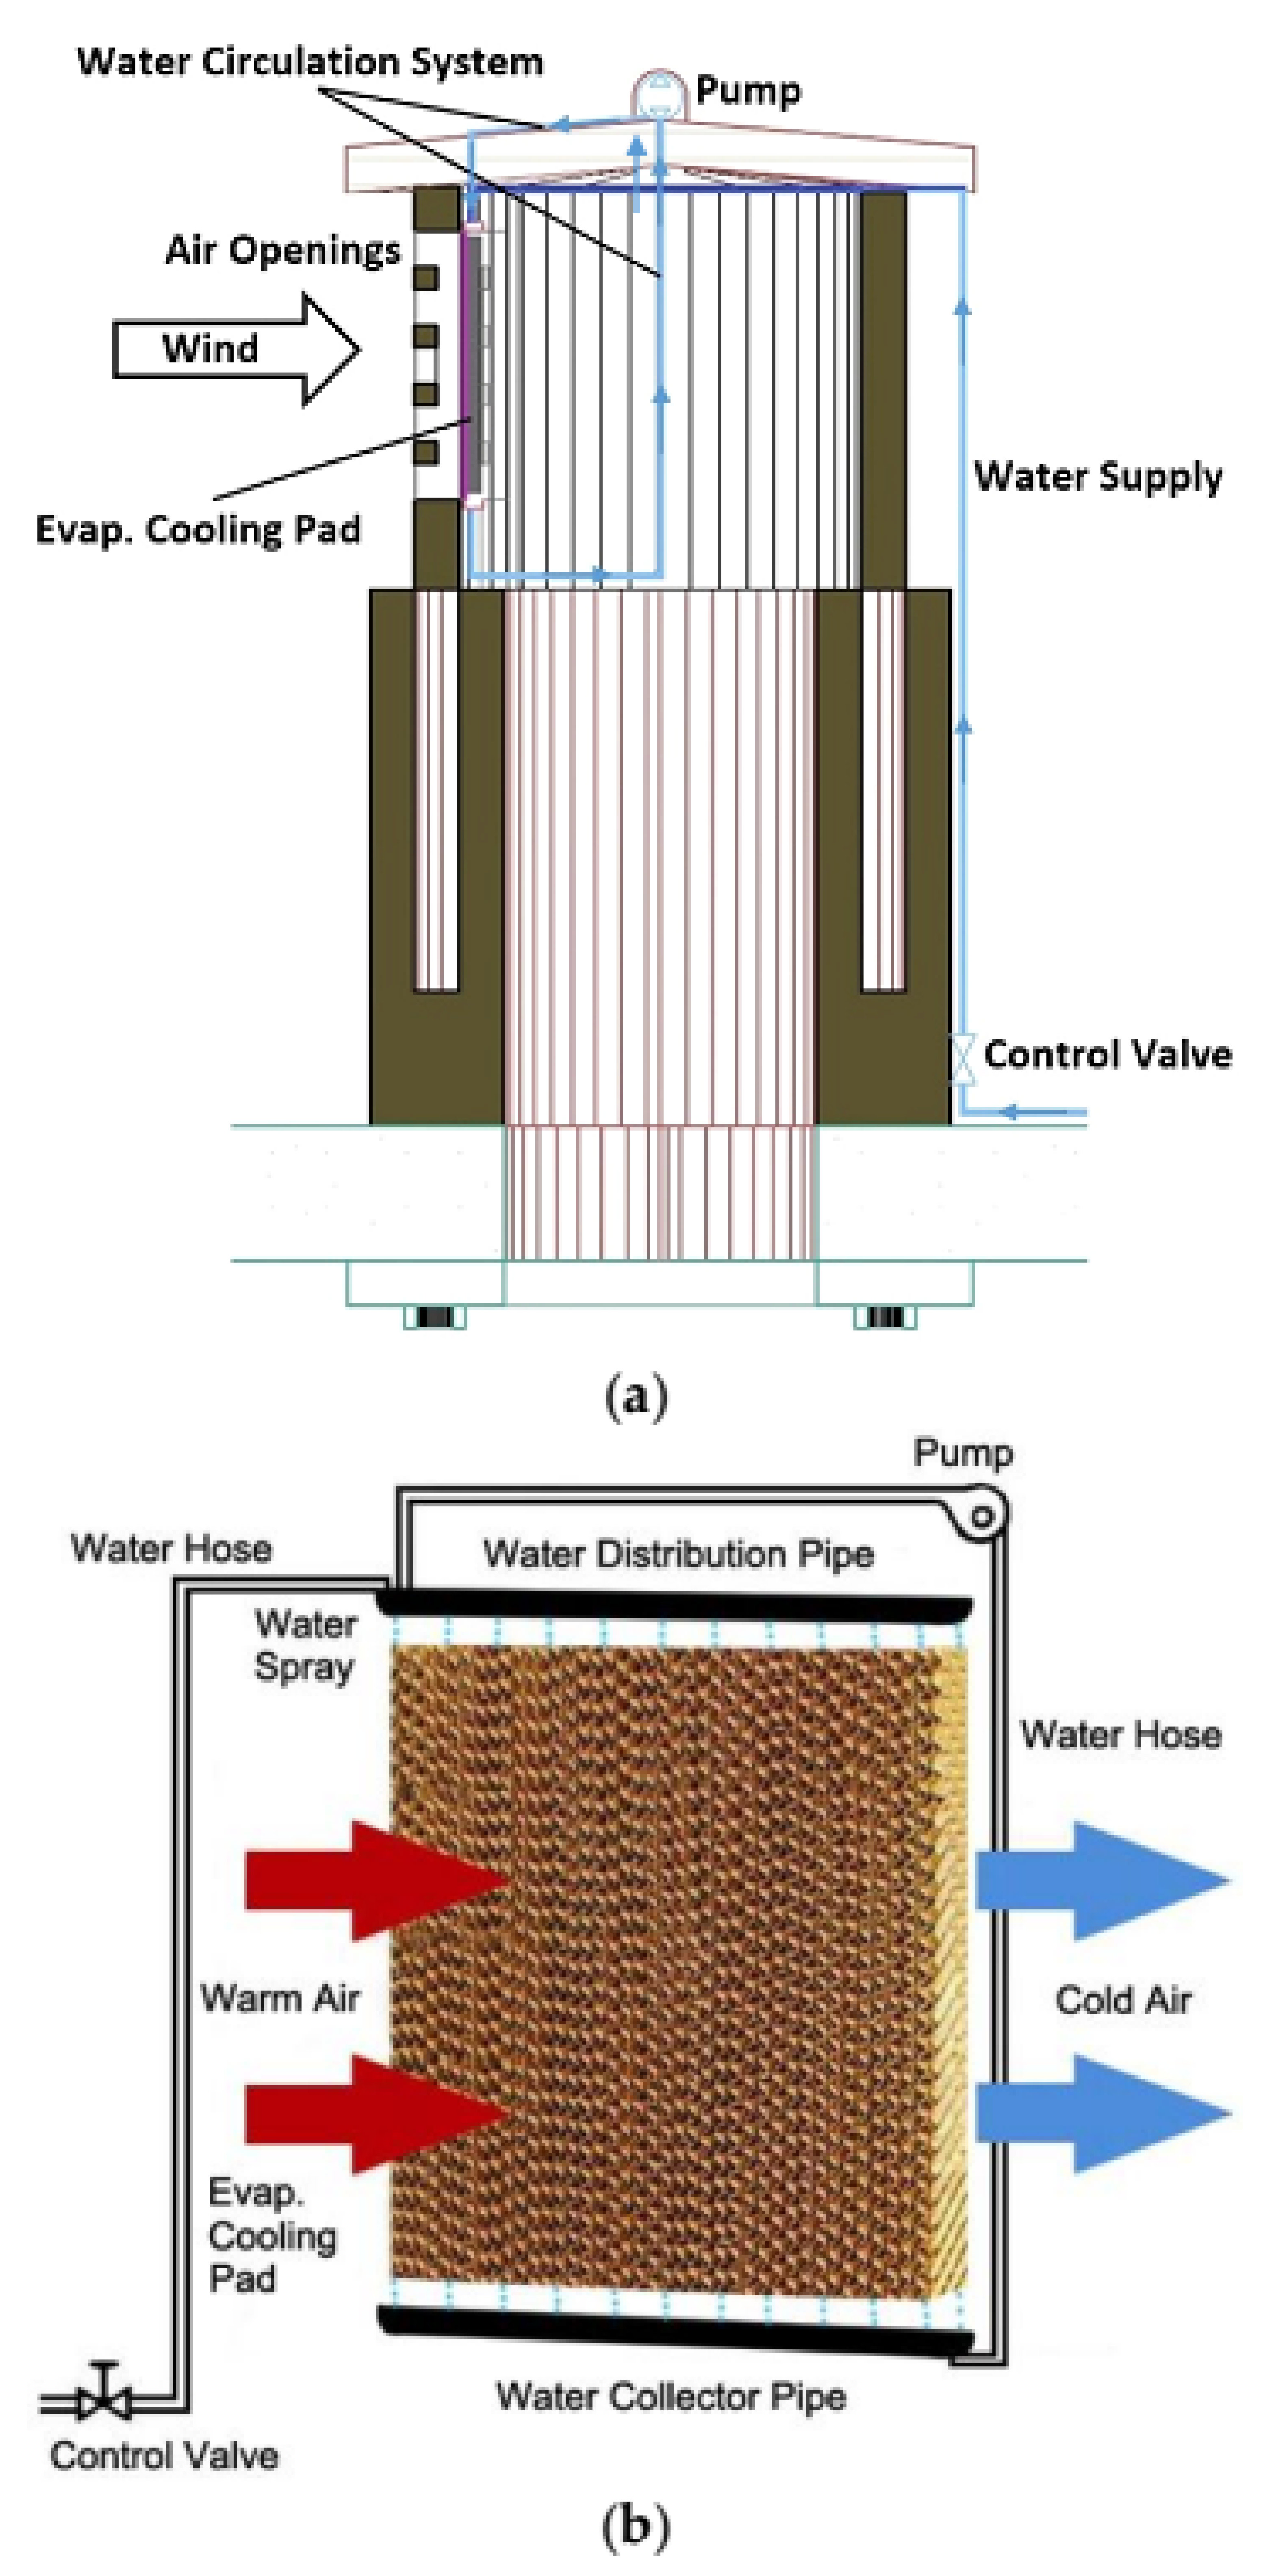
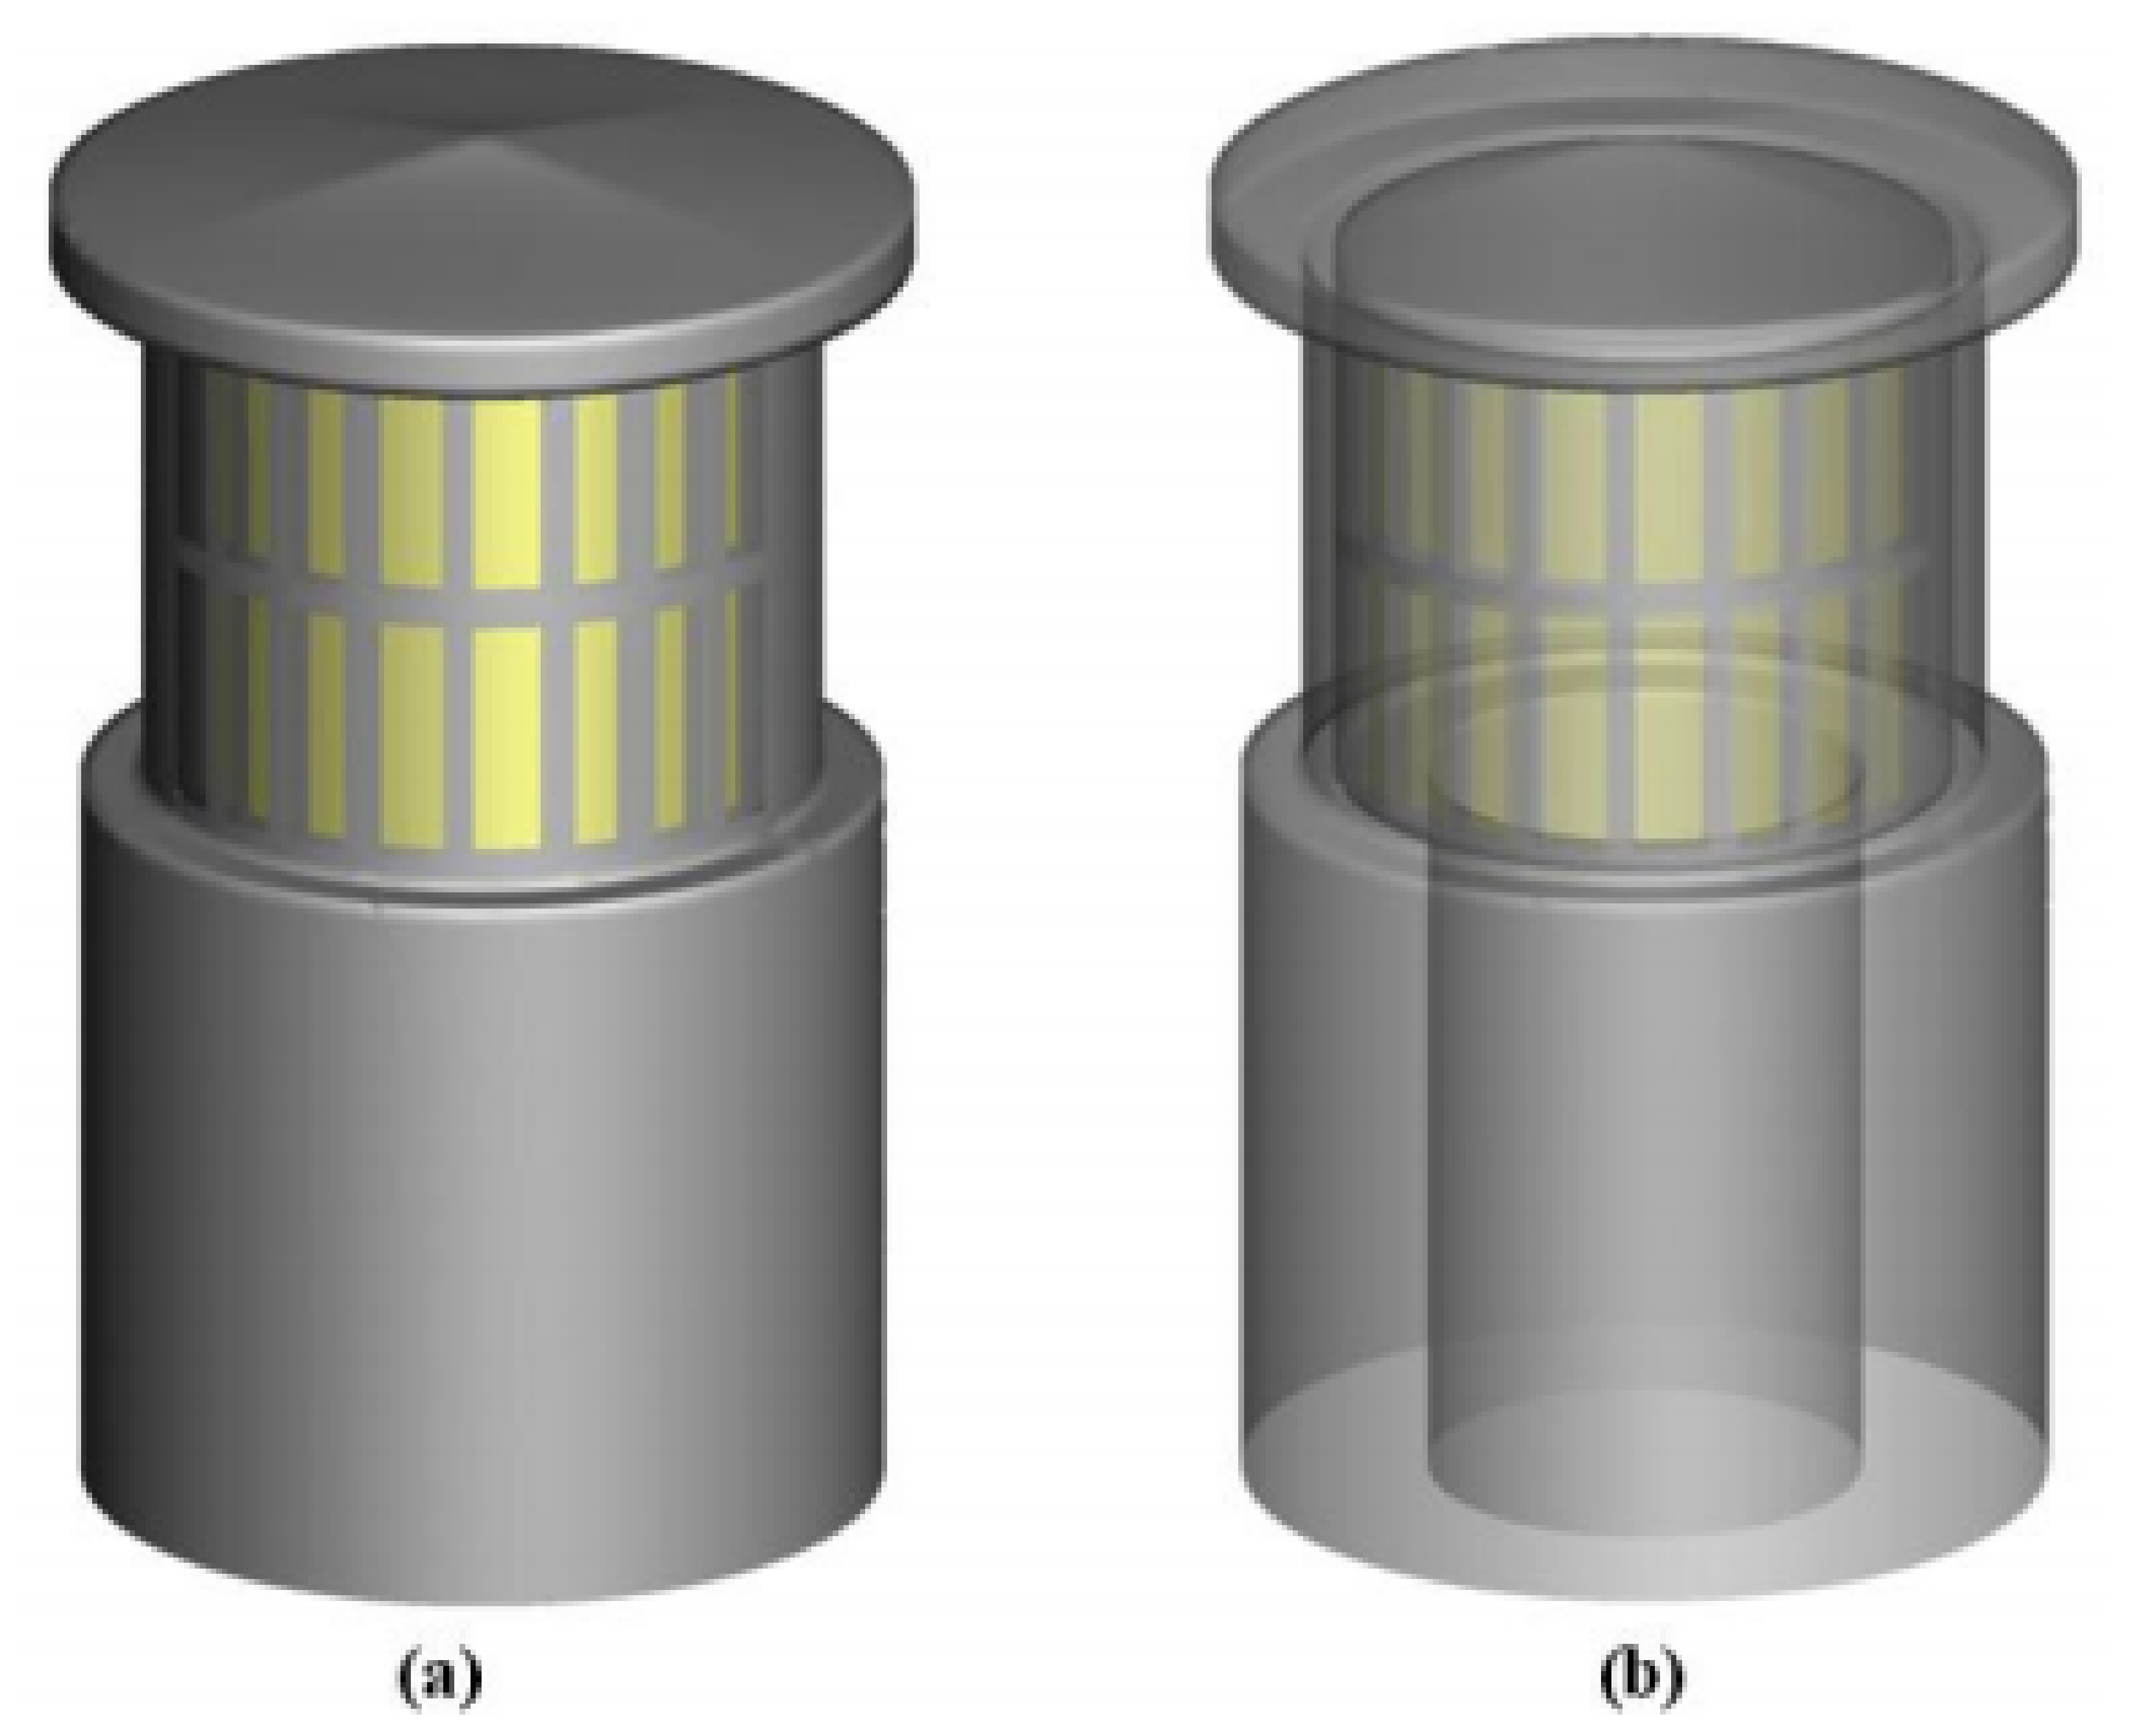
  • Column: The column of the wind tower is fixed. It can be installed on top of the building. There is a space between internal and external parts of the column (Figure 5, section x-x), and the wind tower’s head can be placed inside it.
  • Head: This part is adjustable vertically and can spin and set itself in the desired direction (e.g., maximum wind velocity). To cool down the inlet airflow, a small pump is used to circulate and spray water on an evaporative cooling pad (Figure 6). The roof is inclined to prevent water leakage inside the column and the building during precipitation.
  • Windows: To control the airflow entering the building, two sliding windows are installed at the bottom of the wind tower’s column. These can be opened or closed manually or automatically.
This wind tower can be built from different materials such as galvanized steel and fiberglass. To reduce overheating issues, light colours can be used on external surfaces. Further, the direction of the wind can be detected using a wind vane and the wind tower’s head adjusted accordingly. The size of the proposed wind tower depends on (1) the desired air mass flow rate; (2) the building size and cooling needs; and (3) the wind velocity and temperature in the region.

3. Numerical Procedures, Materials and Methods

3.1. CFD Methodology

Simulation involves geometrical modeling, development of the computational domain, grid generation, and applying the boundary conditions. For the three-dimensional simulations of airflow in the wind tower, we use a commercial CFD code which solves the Reynolds-Averaged Navier-Stokes (RANS) equations by applying the Finite Volume Method (FVM).

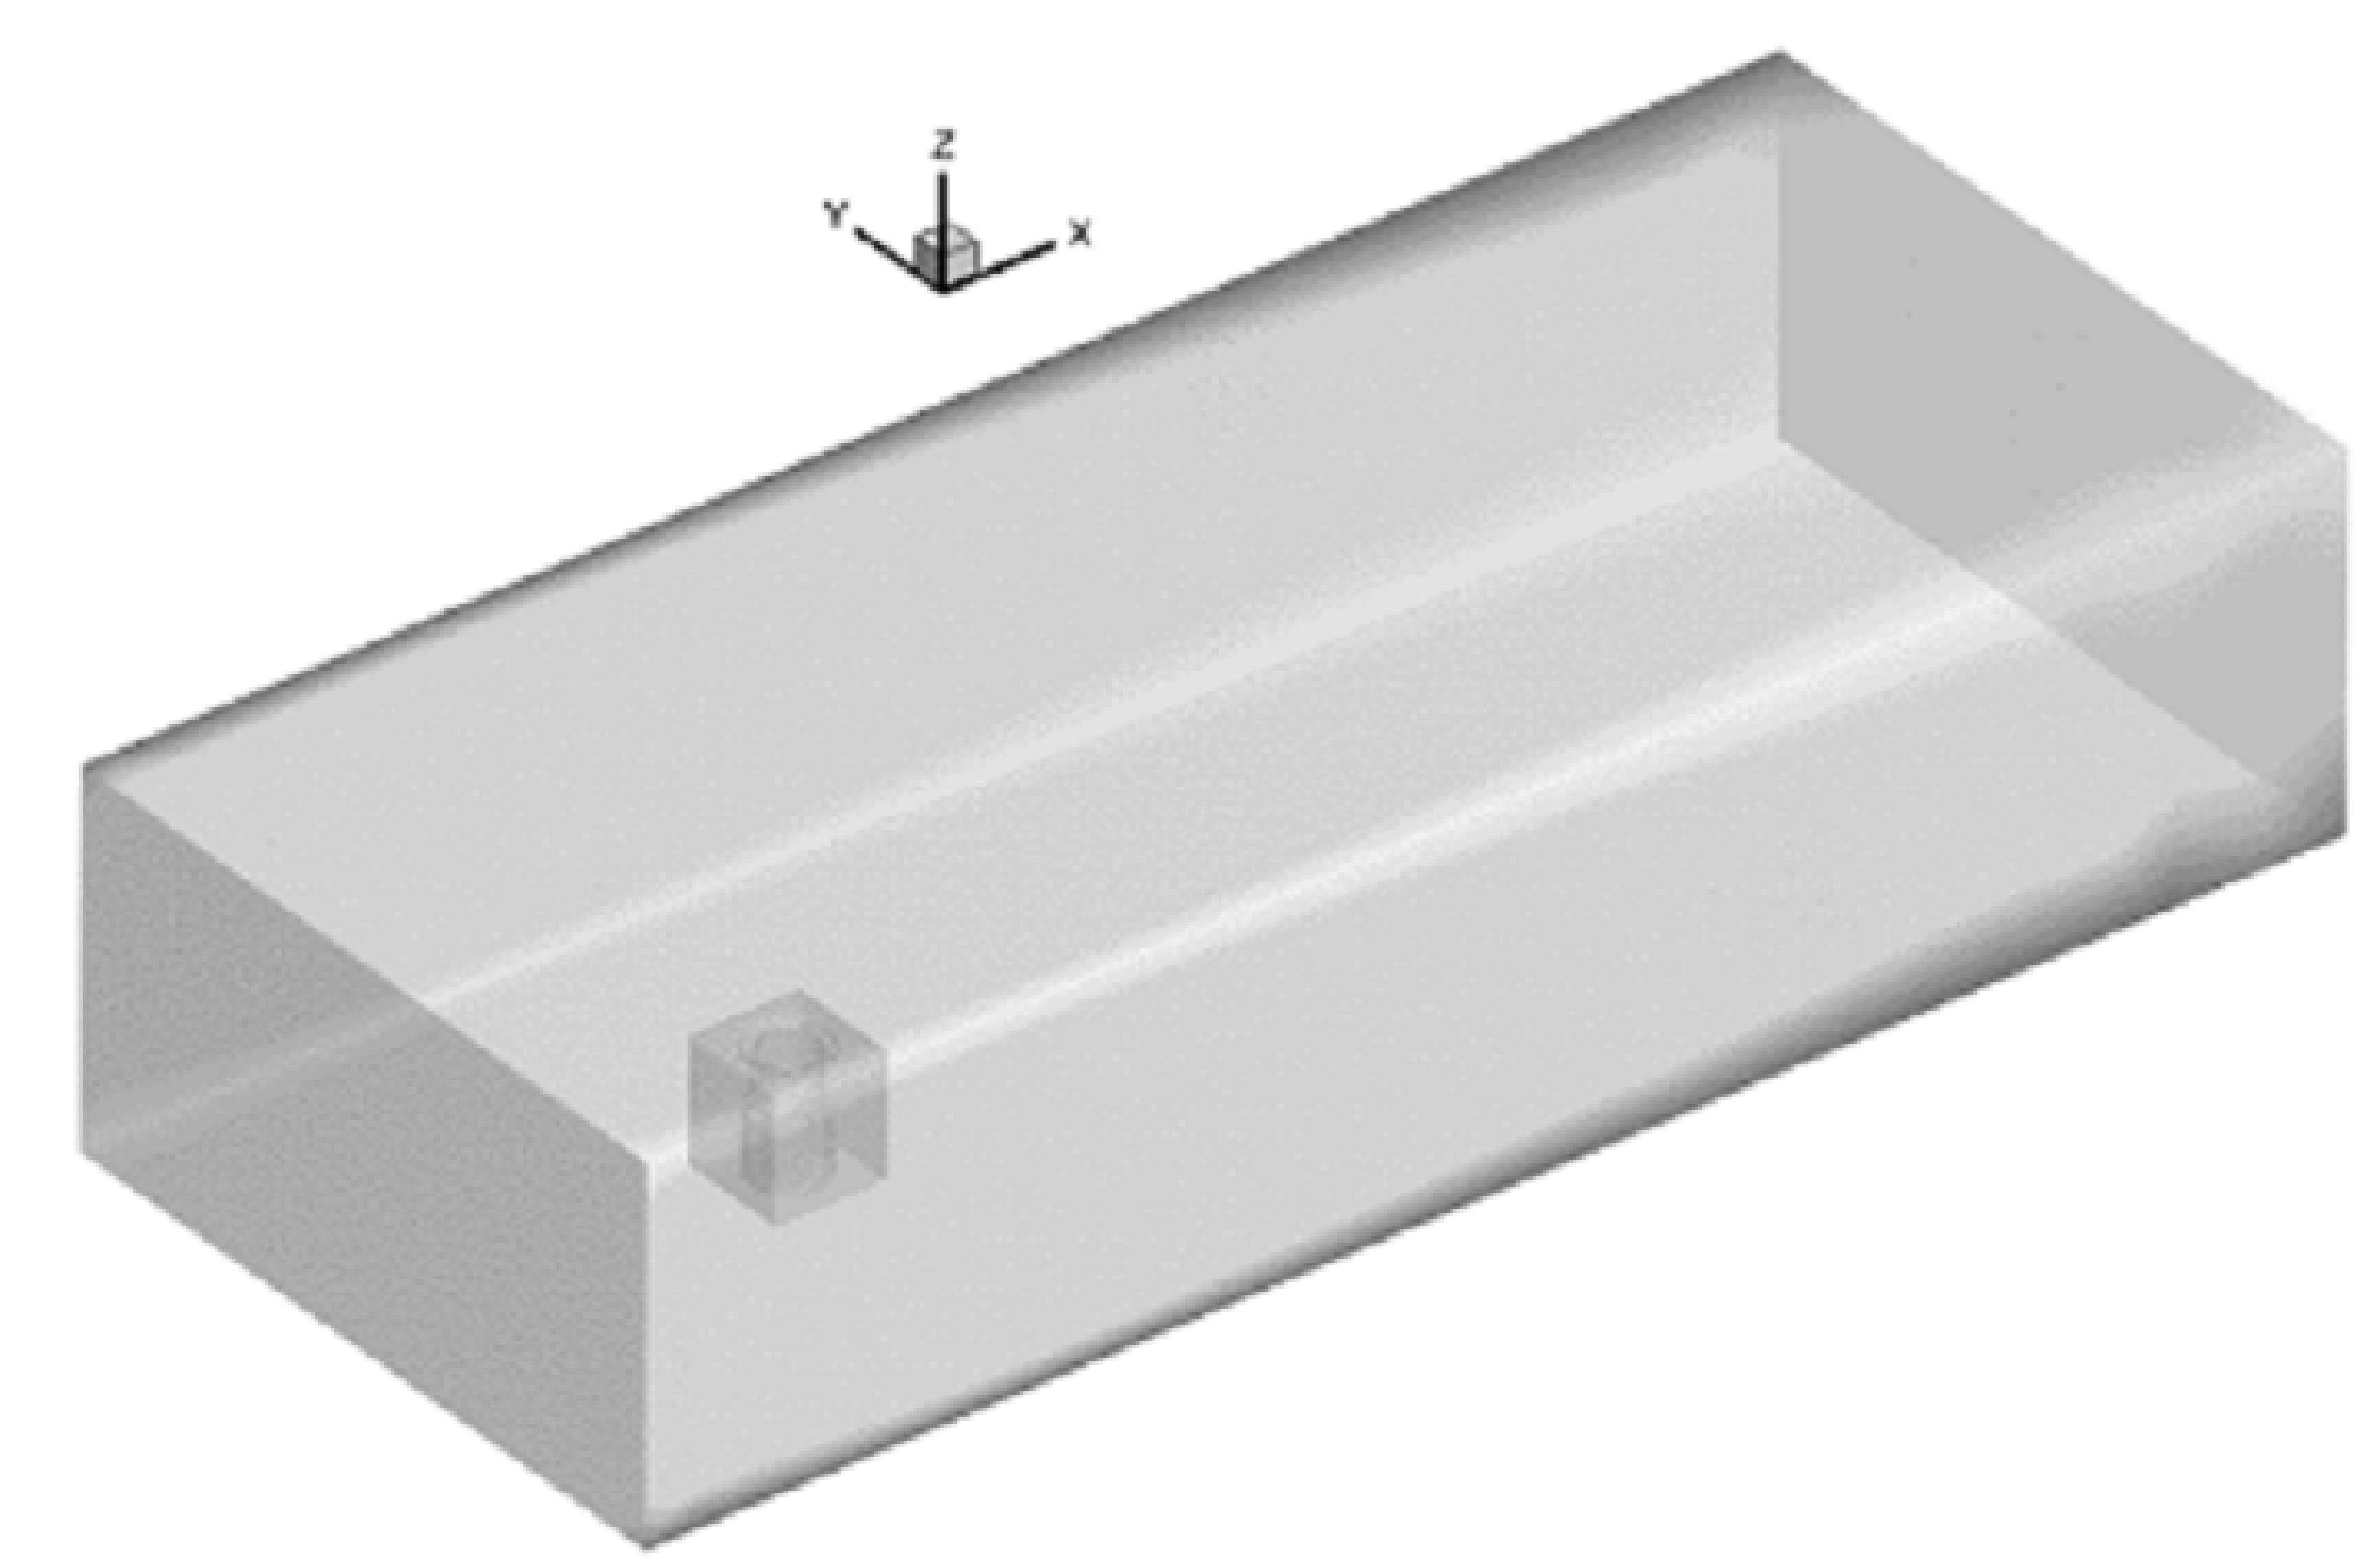
3.2. Geometrical Modeling

Geometrical modeling of a complex wind tower shape is a time-consuming process. The geometry is therefore divided into simpler components, and each component is modeled separately. Superposition of the components generated the final geometric model of the wind tower. Wind tower characteristics are stipulated in Table 1, and a three-dimensional model shown in Figure 7.
To attain an acceptable simulation accuracy, the computational domain is divided into three portions: an upstream, a downstream, and a wind tower region. In the upstream and downstream directions, the boundaries are extended to prevent reverse flow in the outlet. Taking H as the height of the wind tower, upstream and downstream regions have the dimensions of 3.5H (length) × 3H (height) × 6H (width) and 10.5H × 3H × 6H, respectively (Figure 8). The blockage ratio is defined as the cross-sectional area of the tower in the domain area. This parameter must be small enough to avoid the blockage effect, and we determine that the blockage ratio is around 3.3% which is considered acceptable for the simulations [43,44].

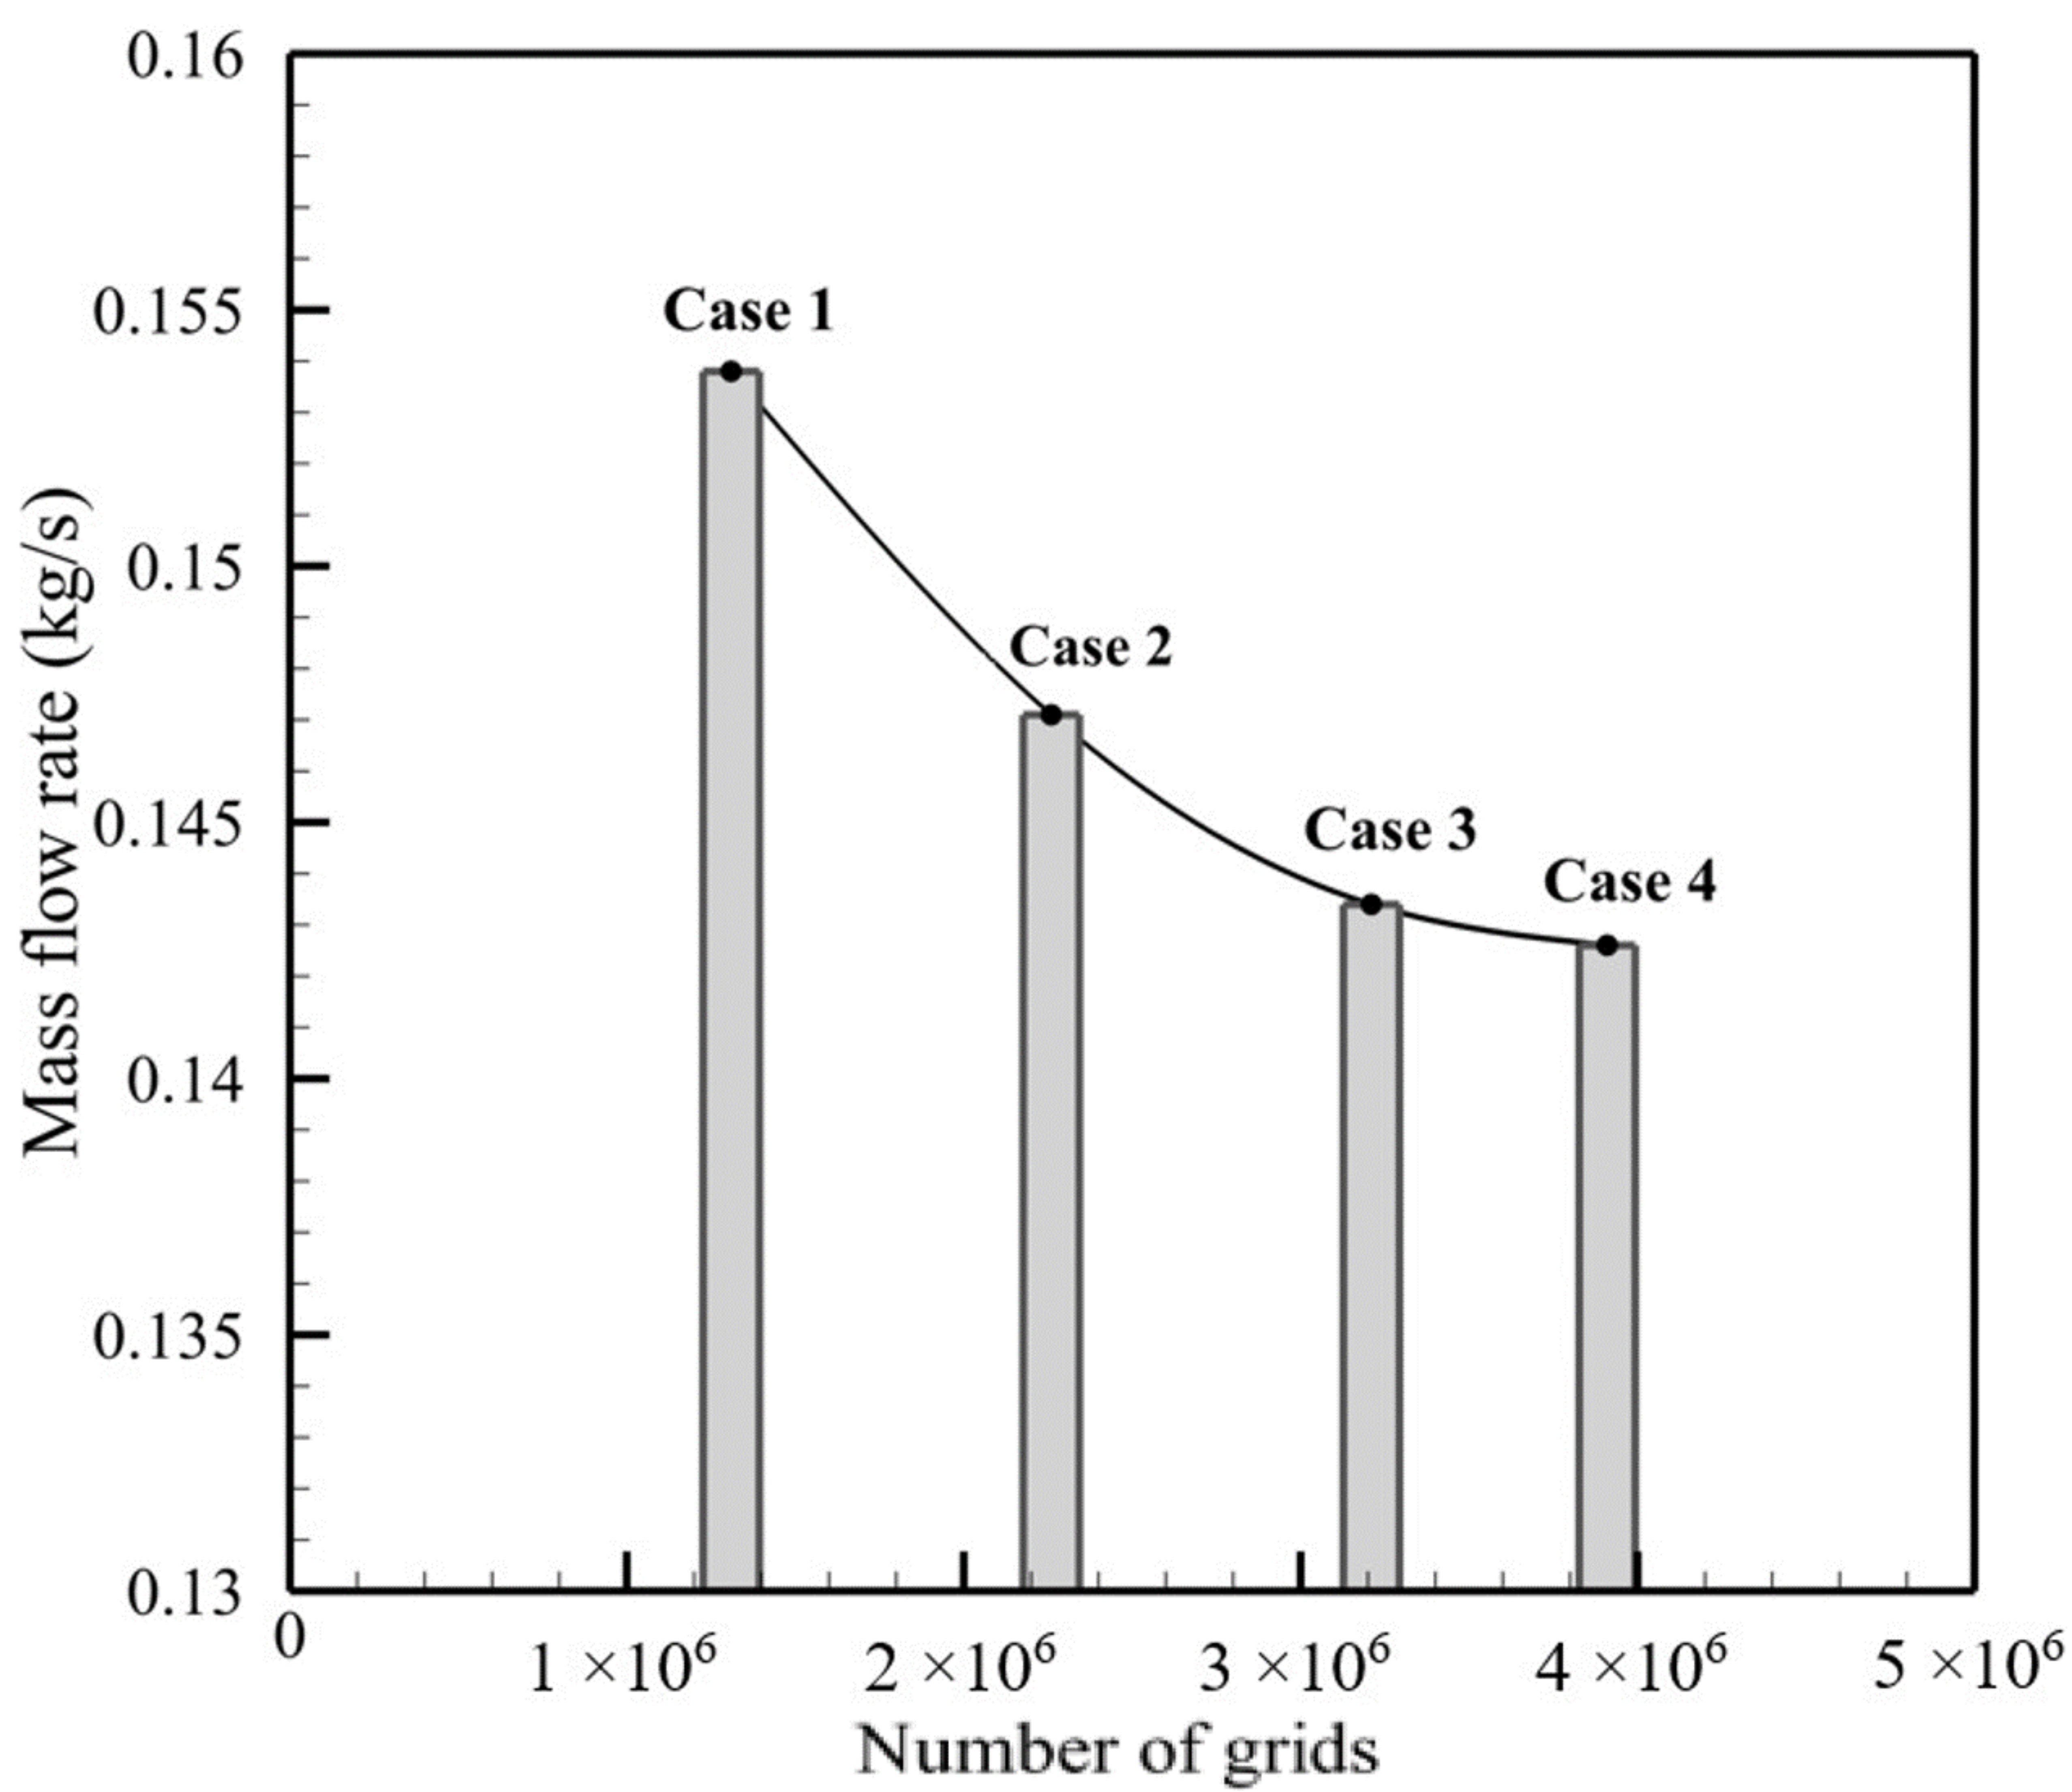
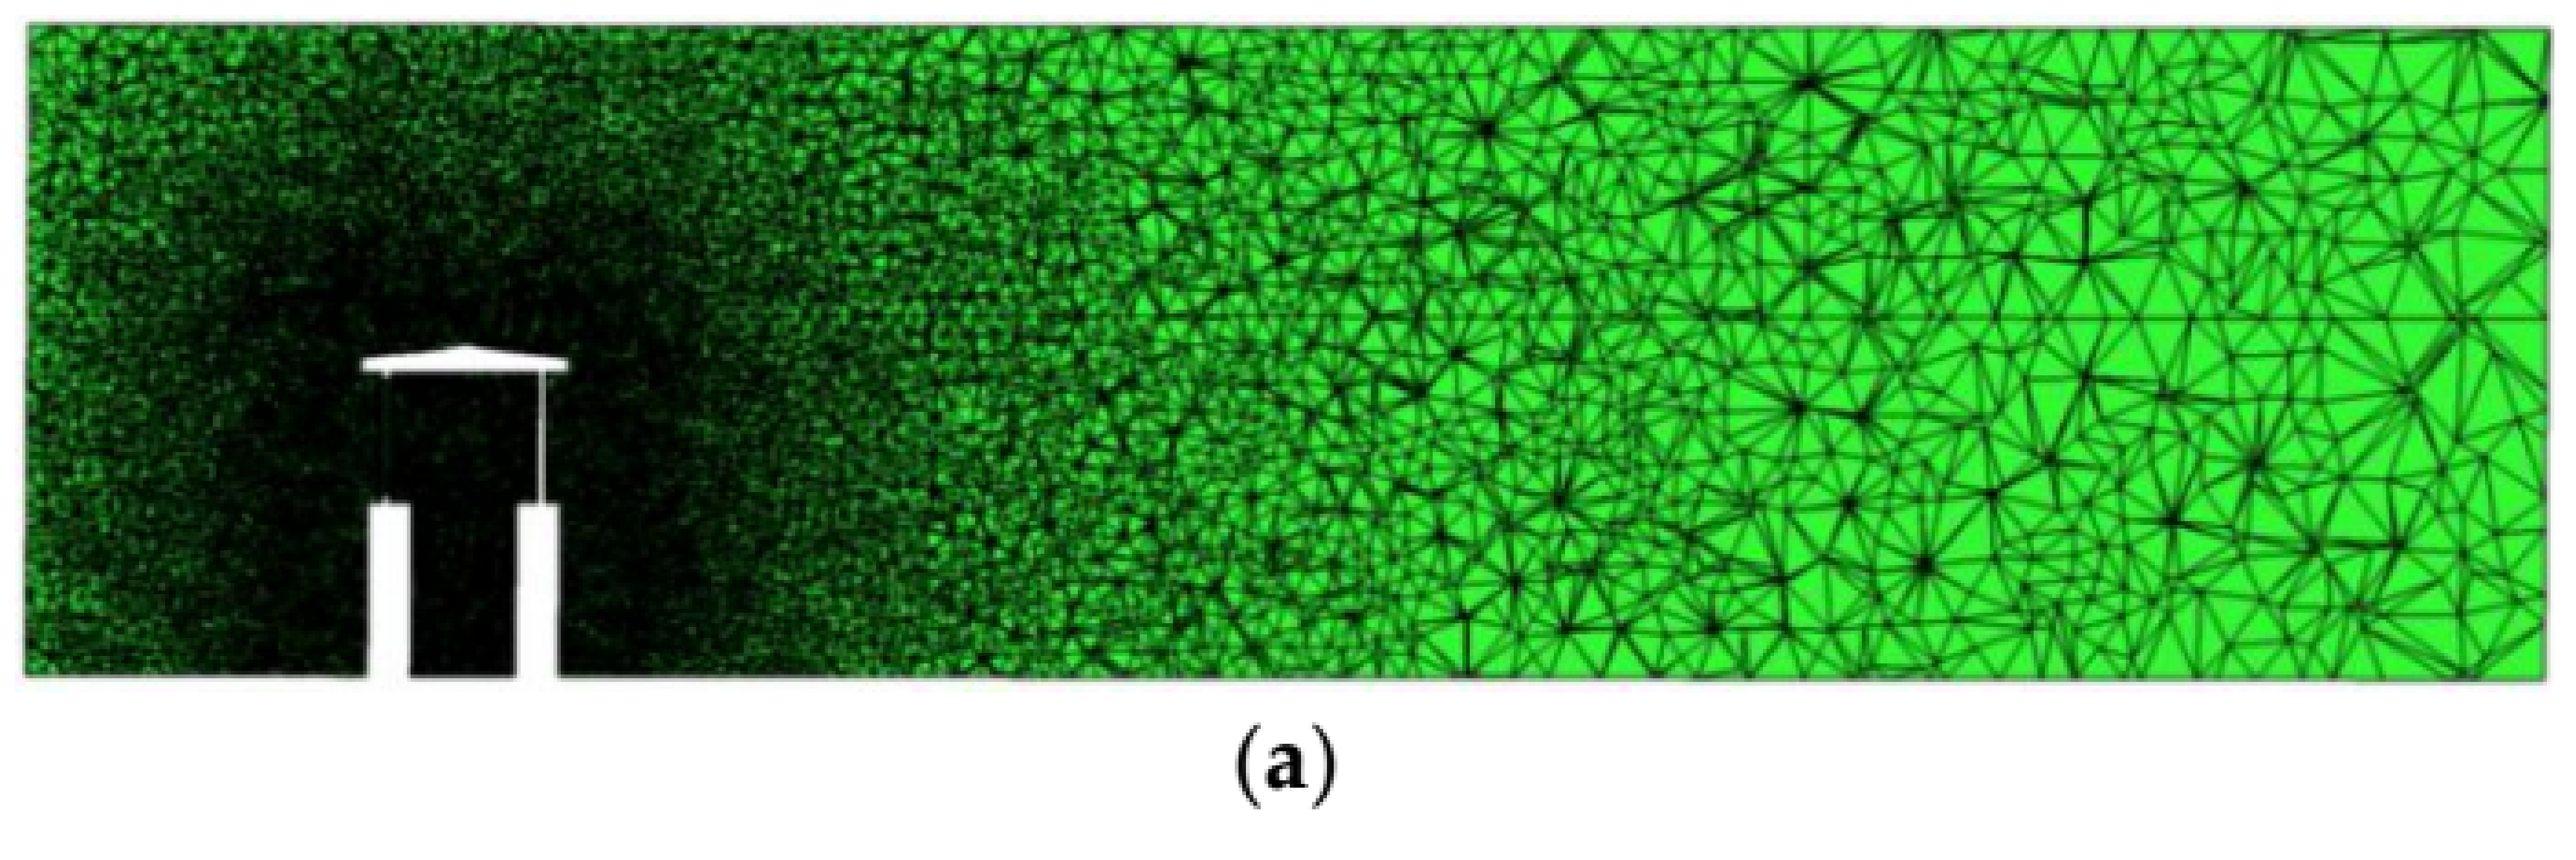
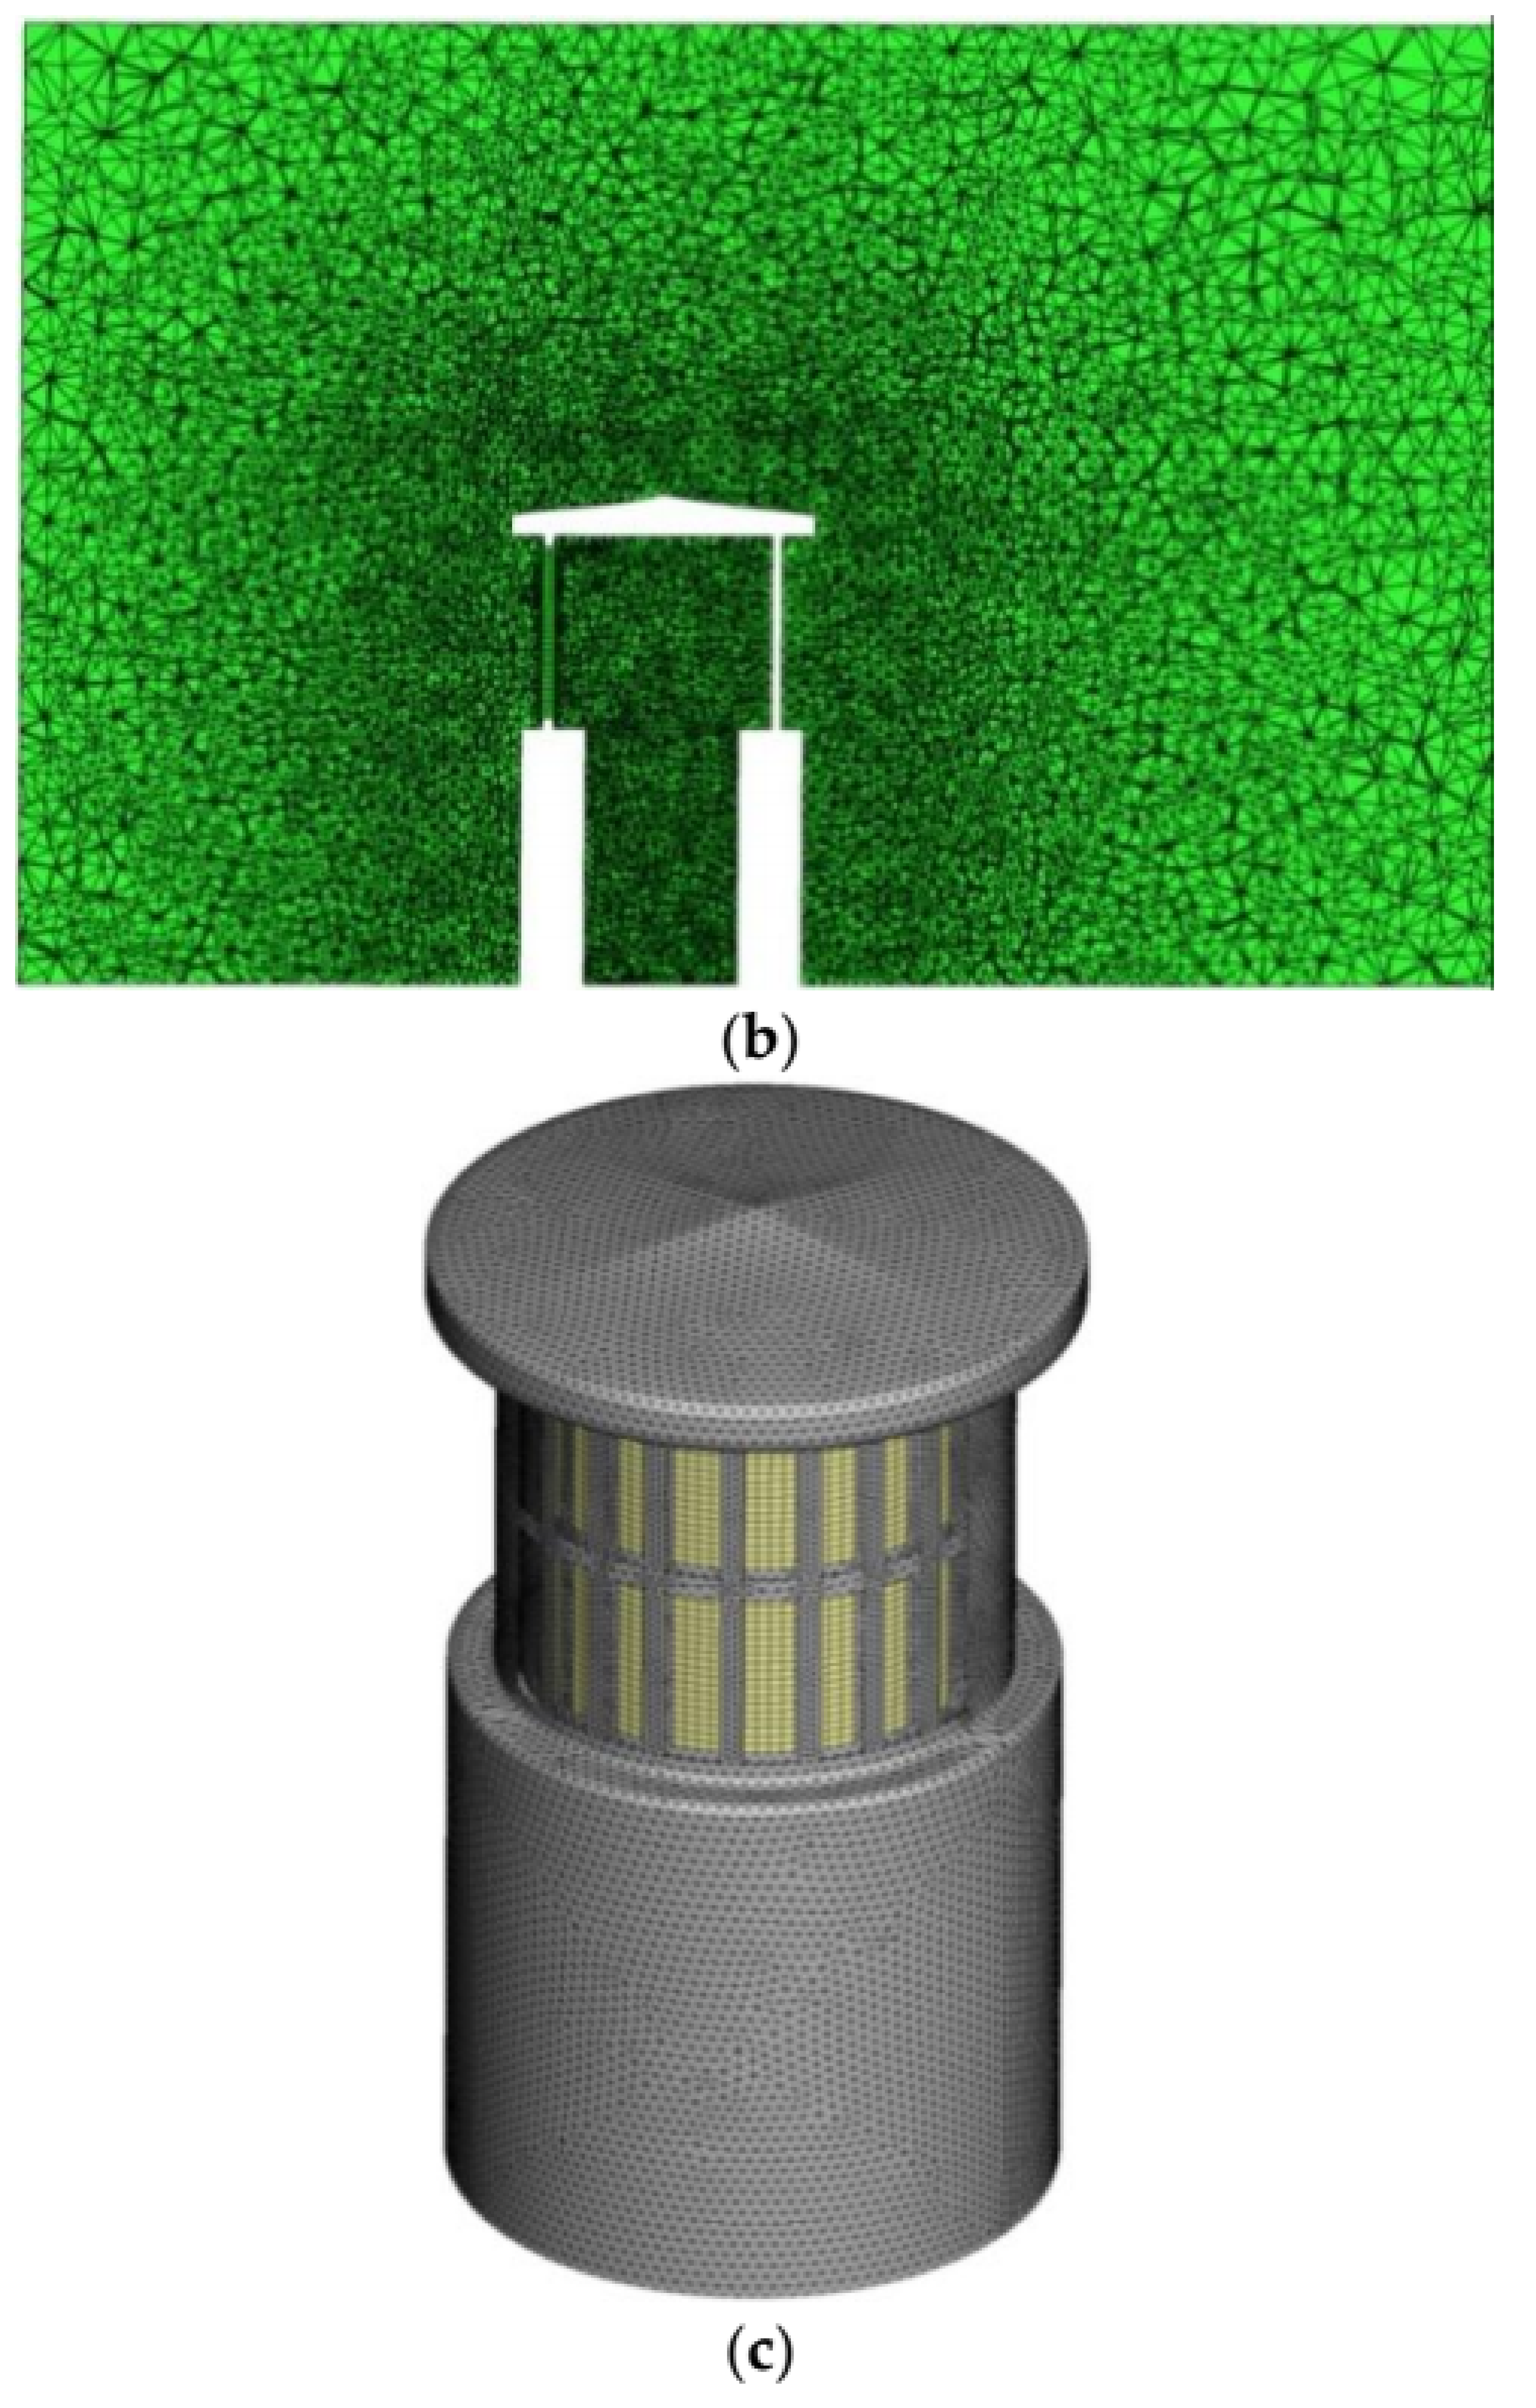
3.3. Grid Generation

The physical model is composed of several computational domains with different geometric configurations. Grids are created for each domain and then connected to generate the whole grid. Several versions of the computational mesh are generated to examine grid independency. A suitable number of cells is selected as a trade-off between the computing resources cost and the simulation results. When the finer grids do not change, the refined grid is considered to have an appropriate grid independency level (Figure 9). The mass flow rates for case 3 and 4 are approximately the same, and since case 3 has the lowest computational costs, it is considered as the best choice. It should be noted that case 3 is also acceptable for the other inlet wind velocities, including limits of 0.1 m/s and 4 m/s. Figure 10 illustrates the grid generation on different planes in the computational domain. To address the issue of complex geometry, combinations of structured and unstructured tetrahedral (T-grid) grids are used for the whole computational domain.

3.4. Solver and Boundary Conditions

The commercial CFD code ANSYS Fluent 18.0 (ANSYS, Inc., Canonsburg, PA, USA) is used as the solver for the simulation process. Steady-state three-dimensional CFD simulations are performed with a standard k-ε turbulence model, following previous studies on wind towers [1,43,44,45,46,47,48,49]. It is possible to predict the natural ventilation airflows inside and around wind towers and also indoor airflows with this approach. The three-dimensional Navier-Stokes equations and continuity equation are solved simultaneously with the turbulence model to simulate the airflow field [50,51,52]. For boundary layer calculations, the standard wall function is used. For the convection terms, a second-order upwind scheme is used, and second-order accuracy is also adopted for the viscous terms. The pressure-velocity coupling is handled by the Semi-Implicit Method for Pressure-Linked Equations (SIMPLE) algorithm. For all equations, the convergence criteria require that the residuals decline to 10−6, and when the difference of air mass flow rates between inlet and outlet is lower than 0.1% (due to mass conservation), then the calculation is terminated [51,52]. Table 2 shows major assumptions used in the CFD simulation containing model description, operating conditions, materials and boundary conditions.
For evaporative cooling pad calculations, a porous media model is considered to be computationally effective. The Darcy-Forchheimer equation, which contains both inertial and viscous forces, is defined as [52,53,54,55,56]:
Δ P = t e x ( μ K v i + 1 2 ρ C 2 | v | v i )
where K is the permeability (m2) and C2 is the inertial drag factor (m−1). Also, vi, | v | , ρ, ∆P and tex represent the velocity of inlet flow (m/s), magnitude of the velocity, air density (kg/m3), static pressure drop across the pad (Pa) and thickness of evaporative cooling pad (m), respectively. In Equation (1), the terms 1/K and C2 denote the viscous and inertial damping factors, respectively.

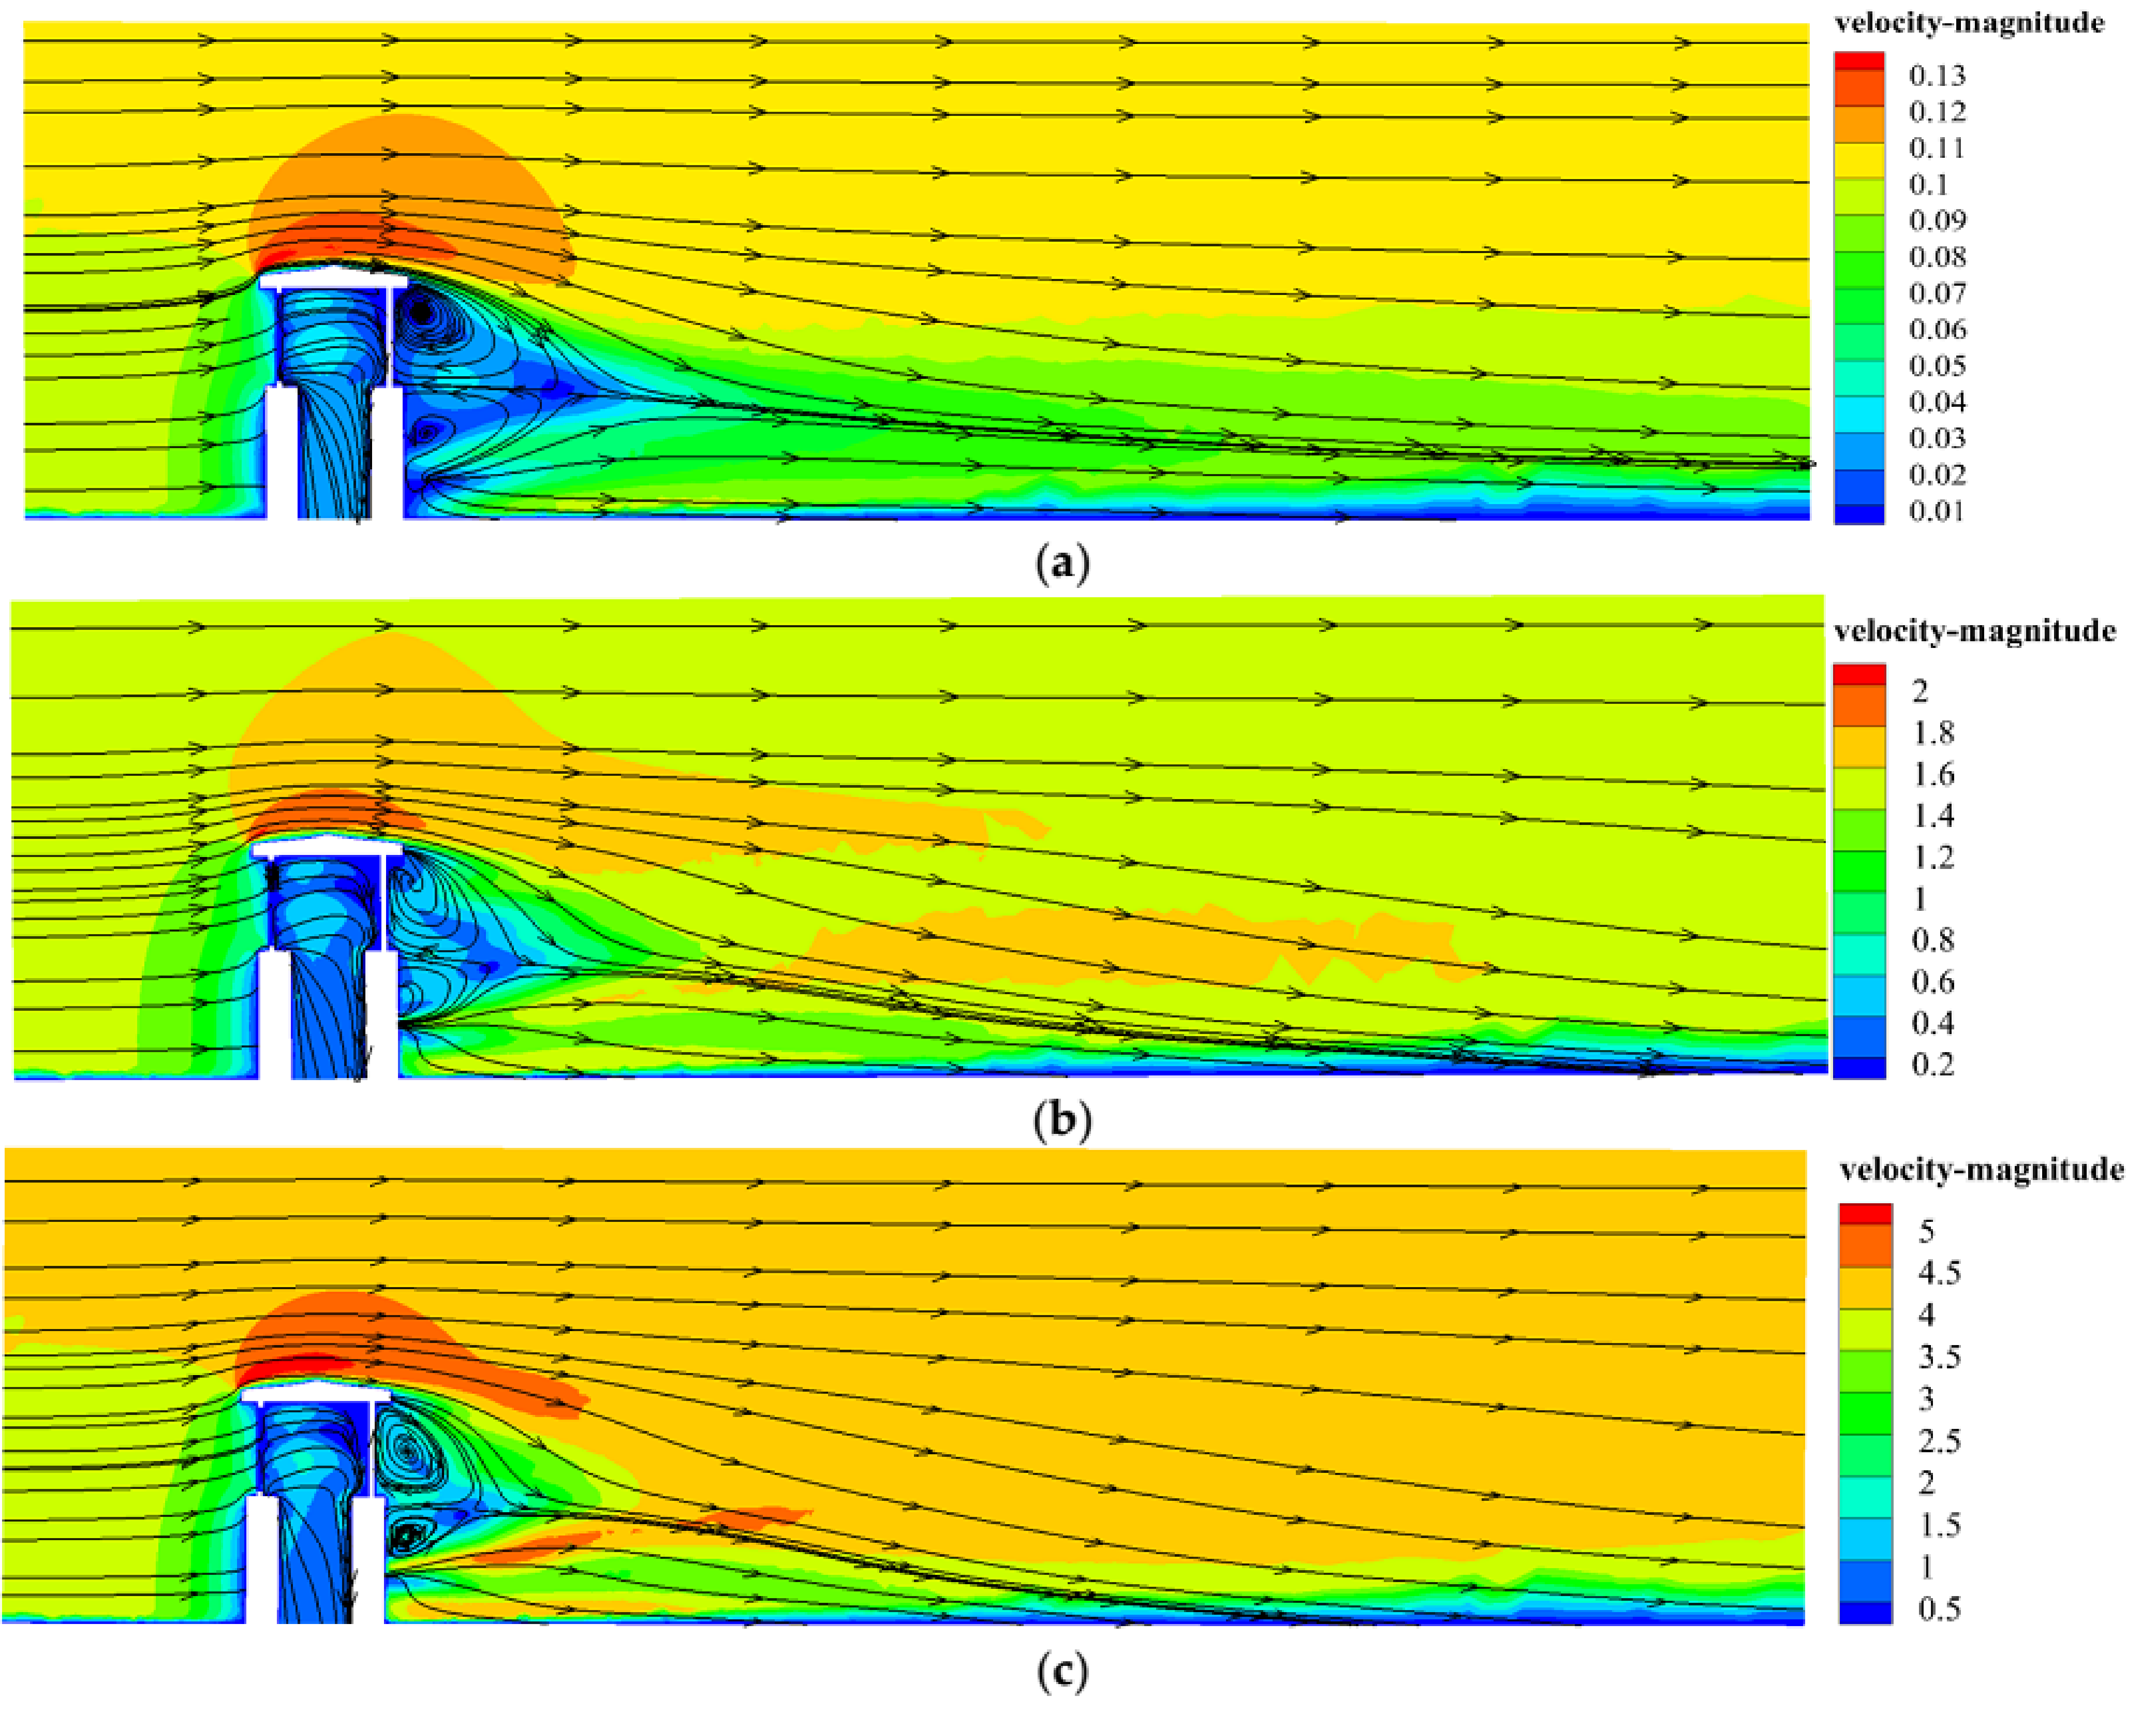
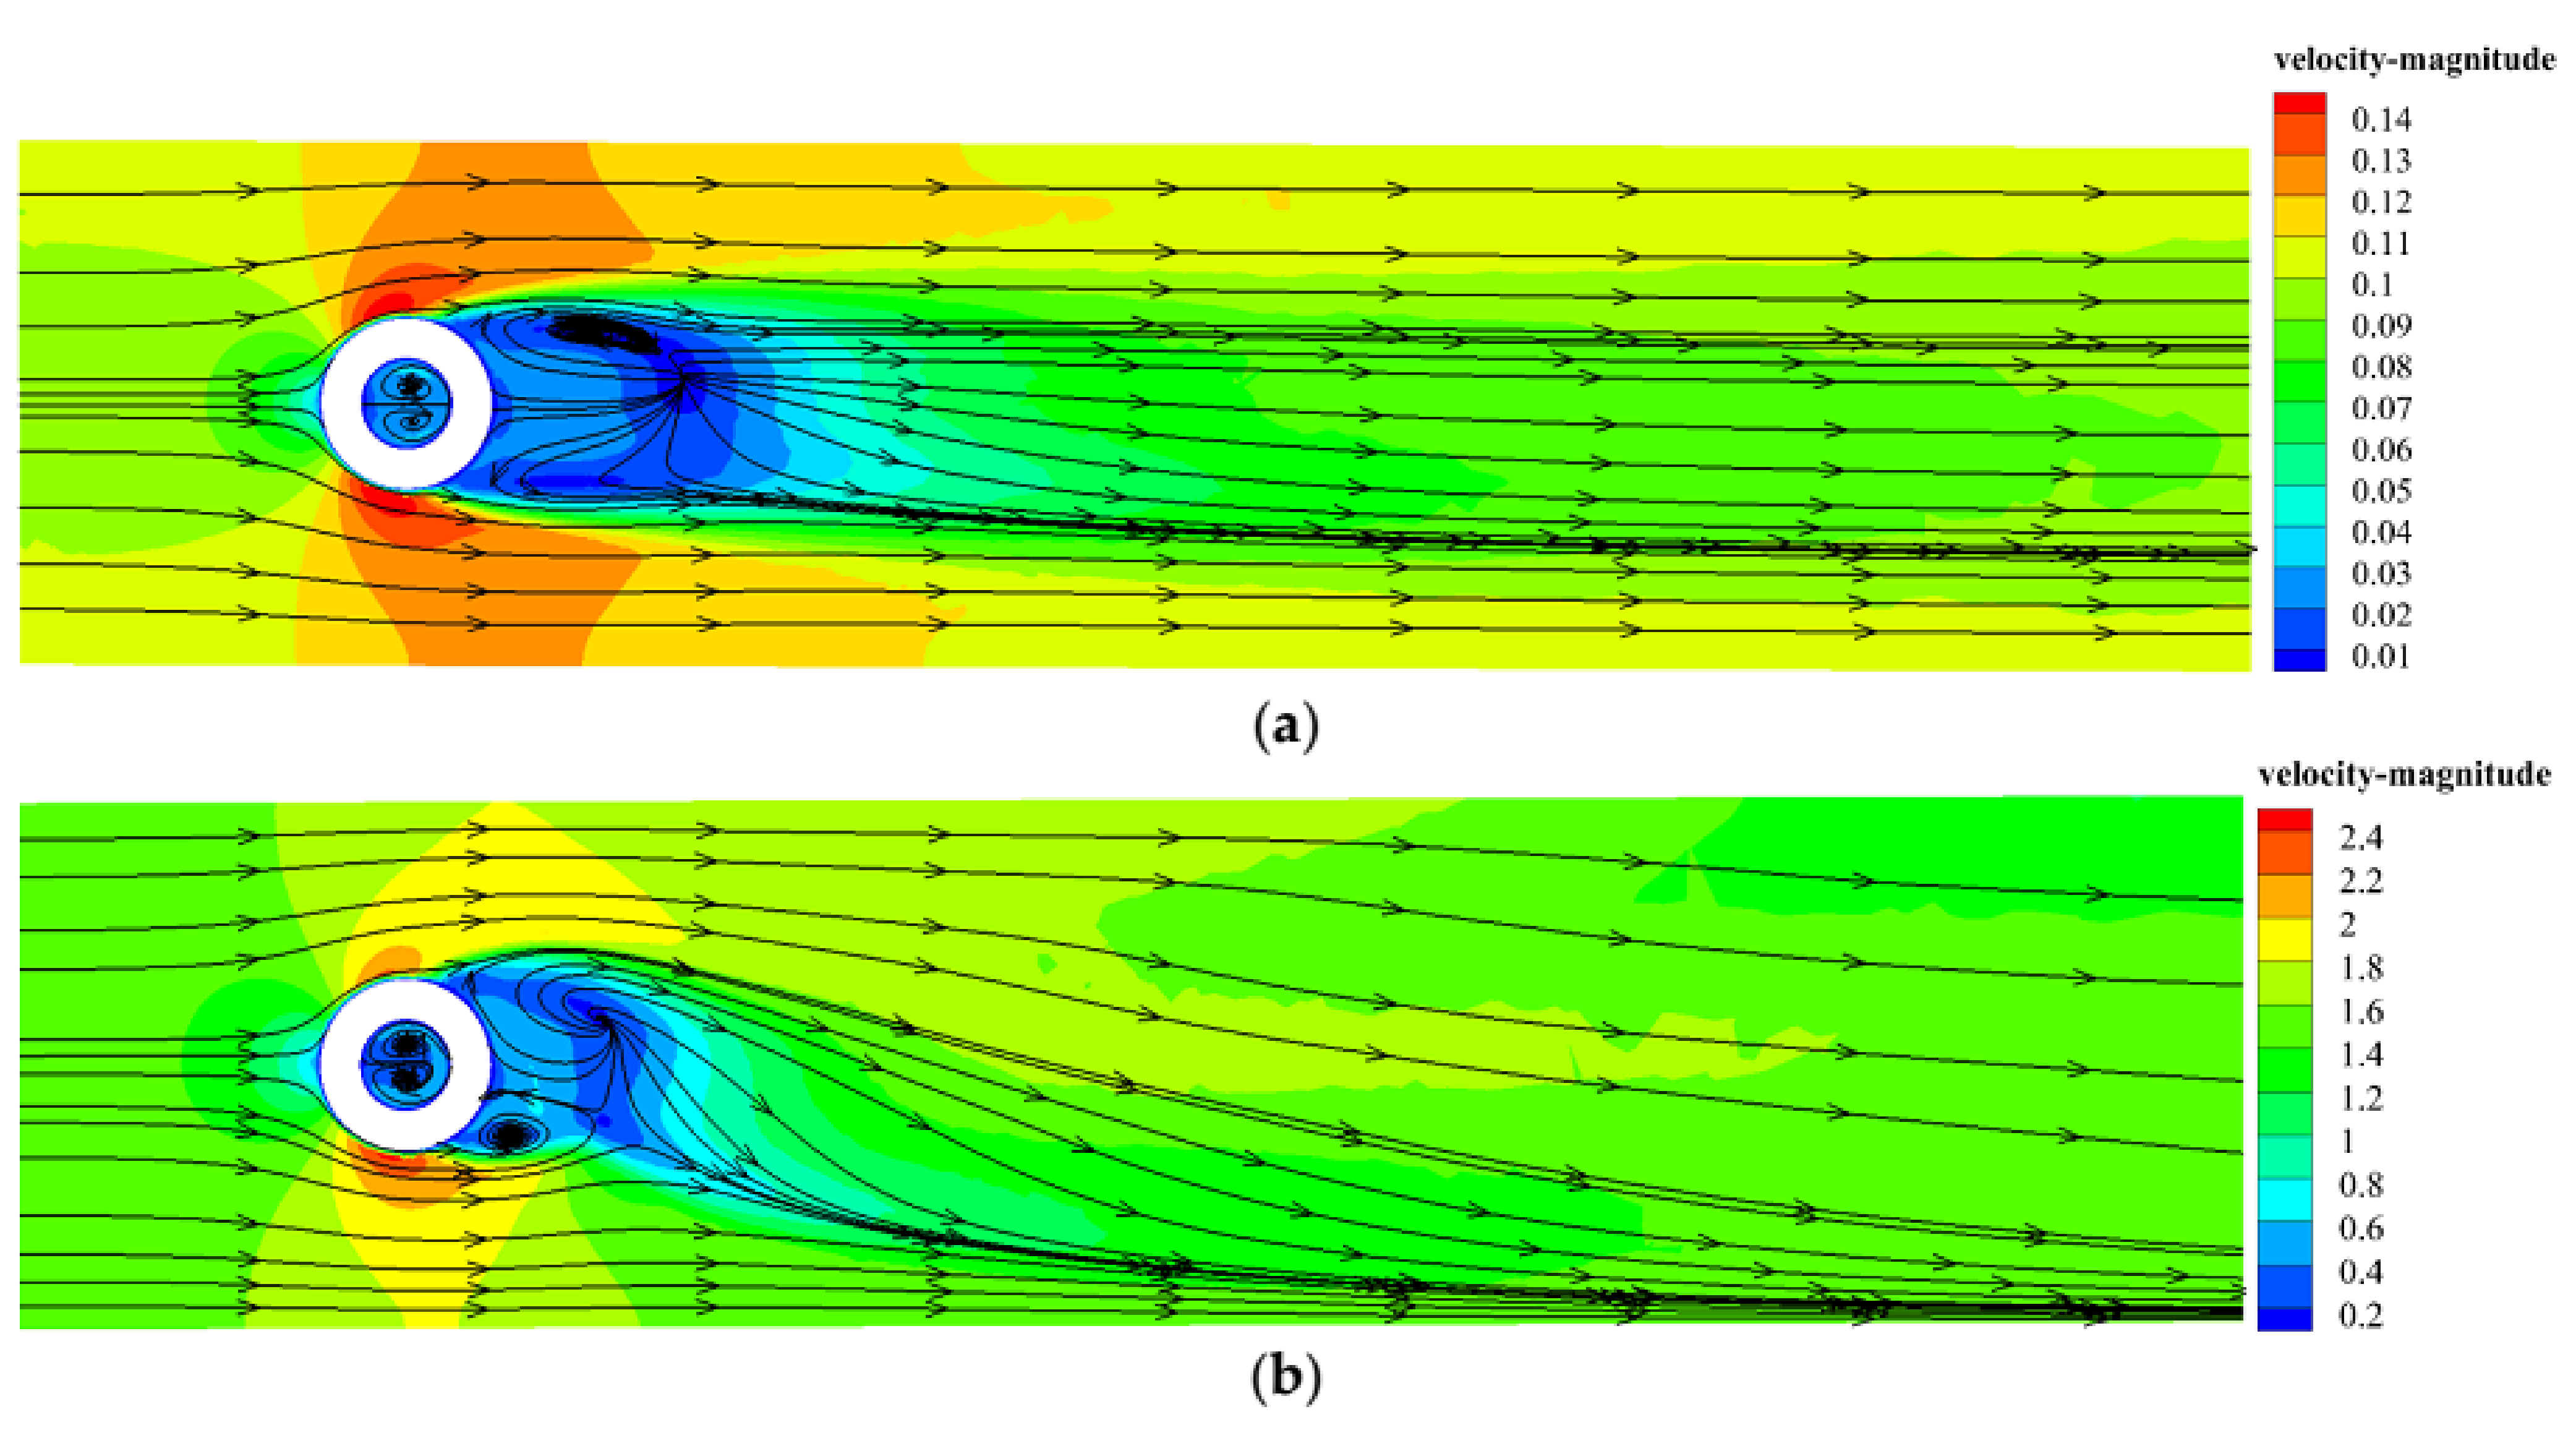
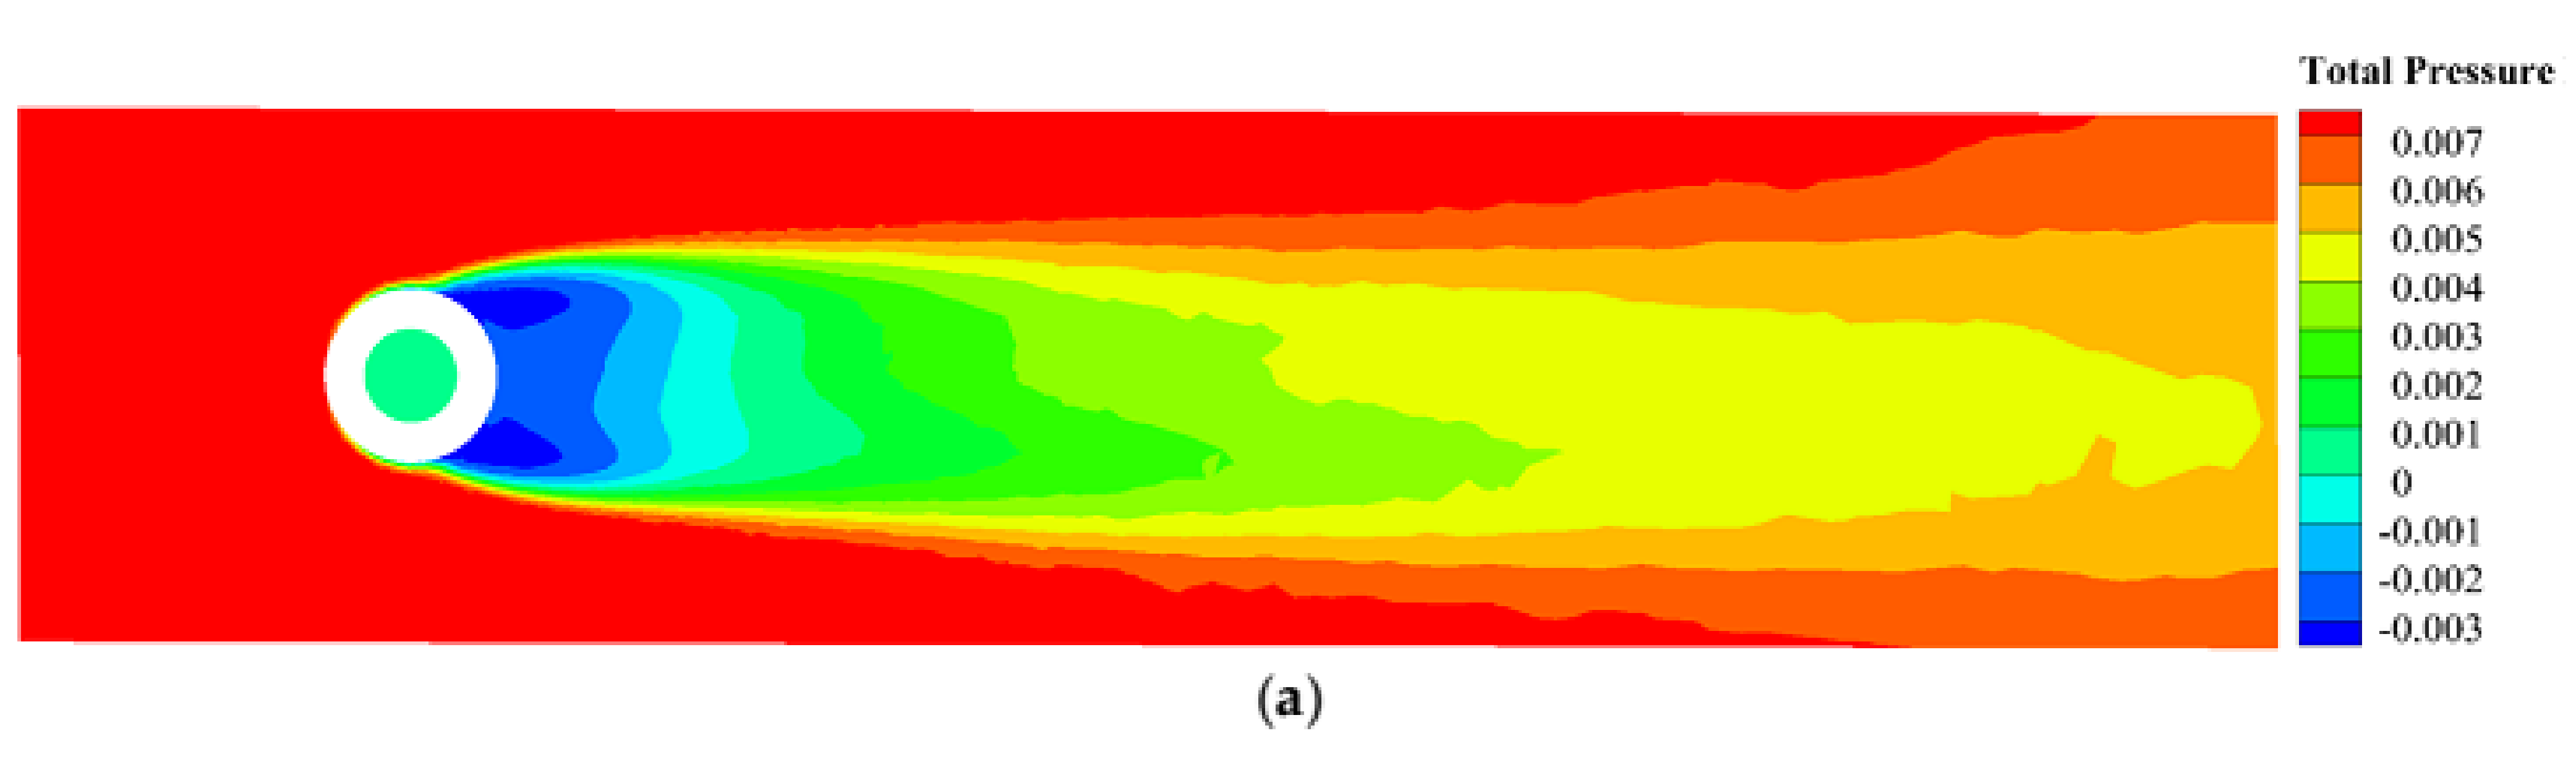
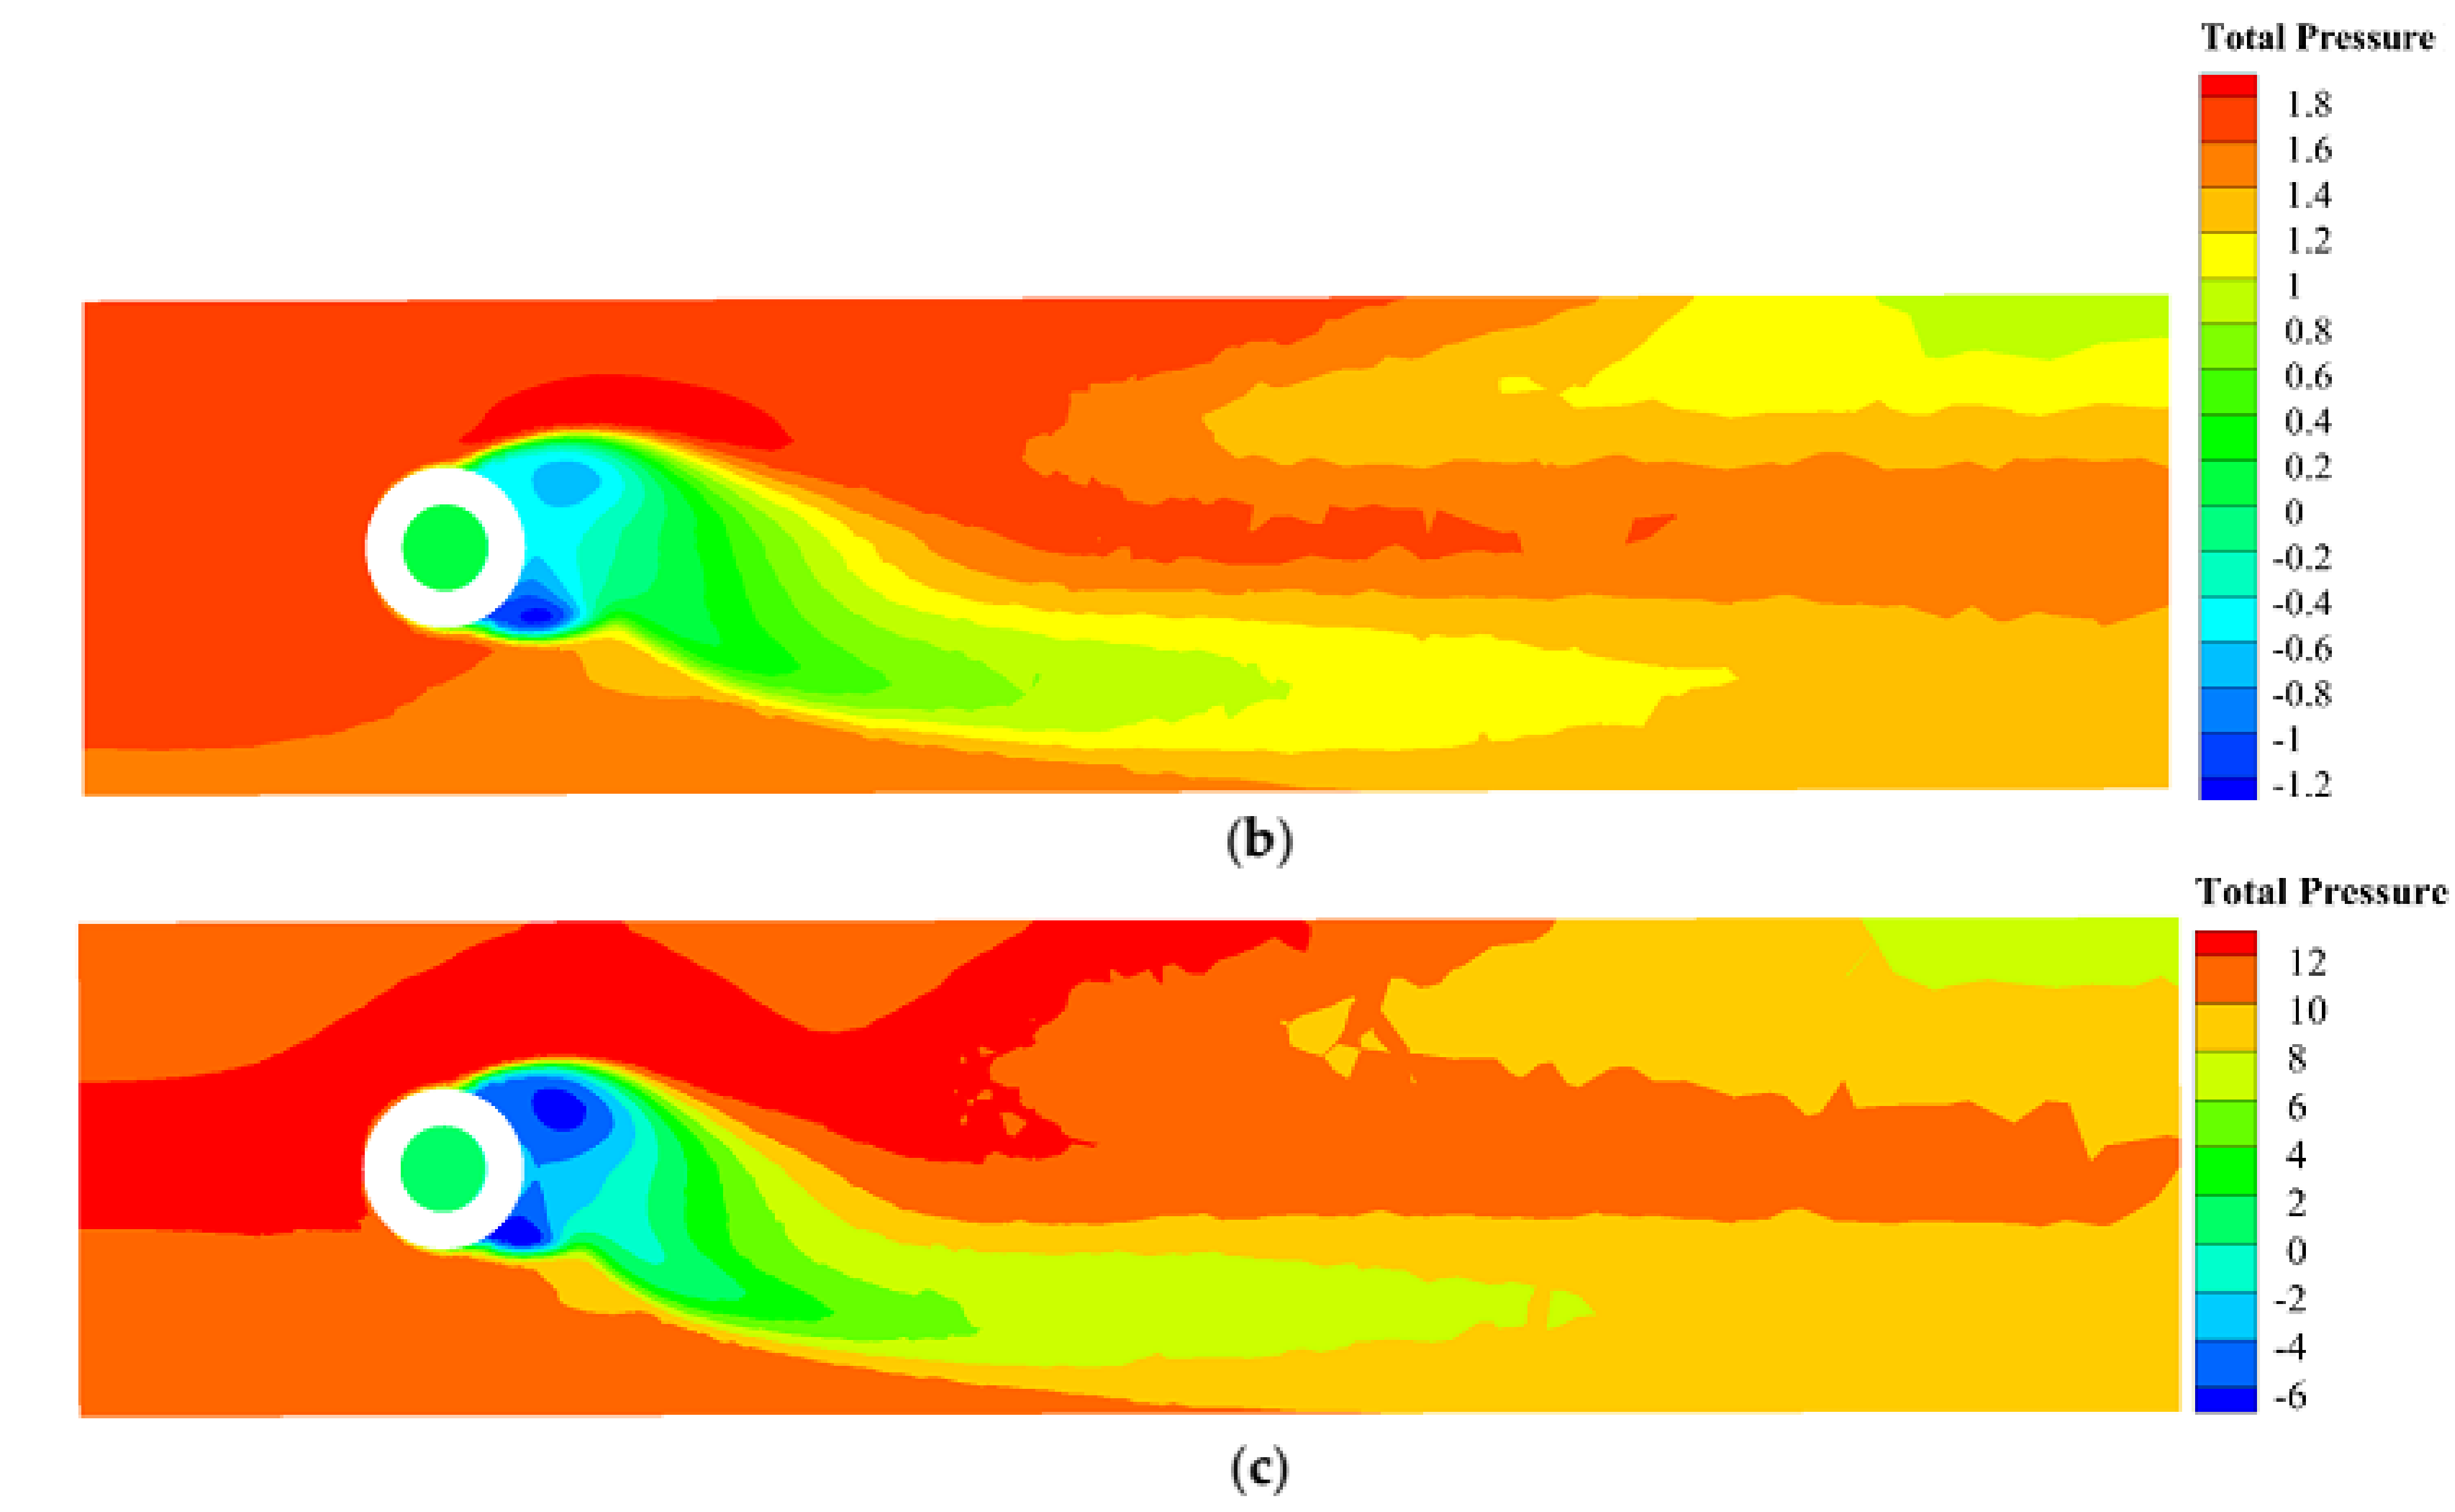
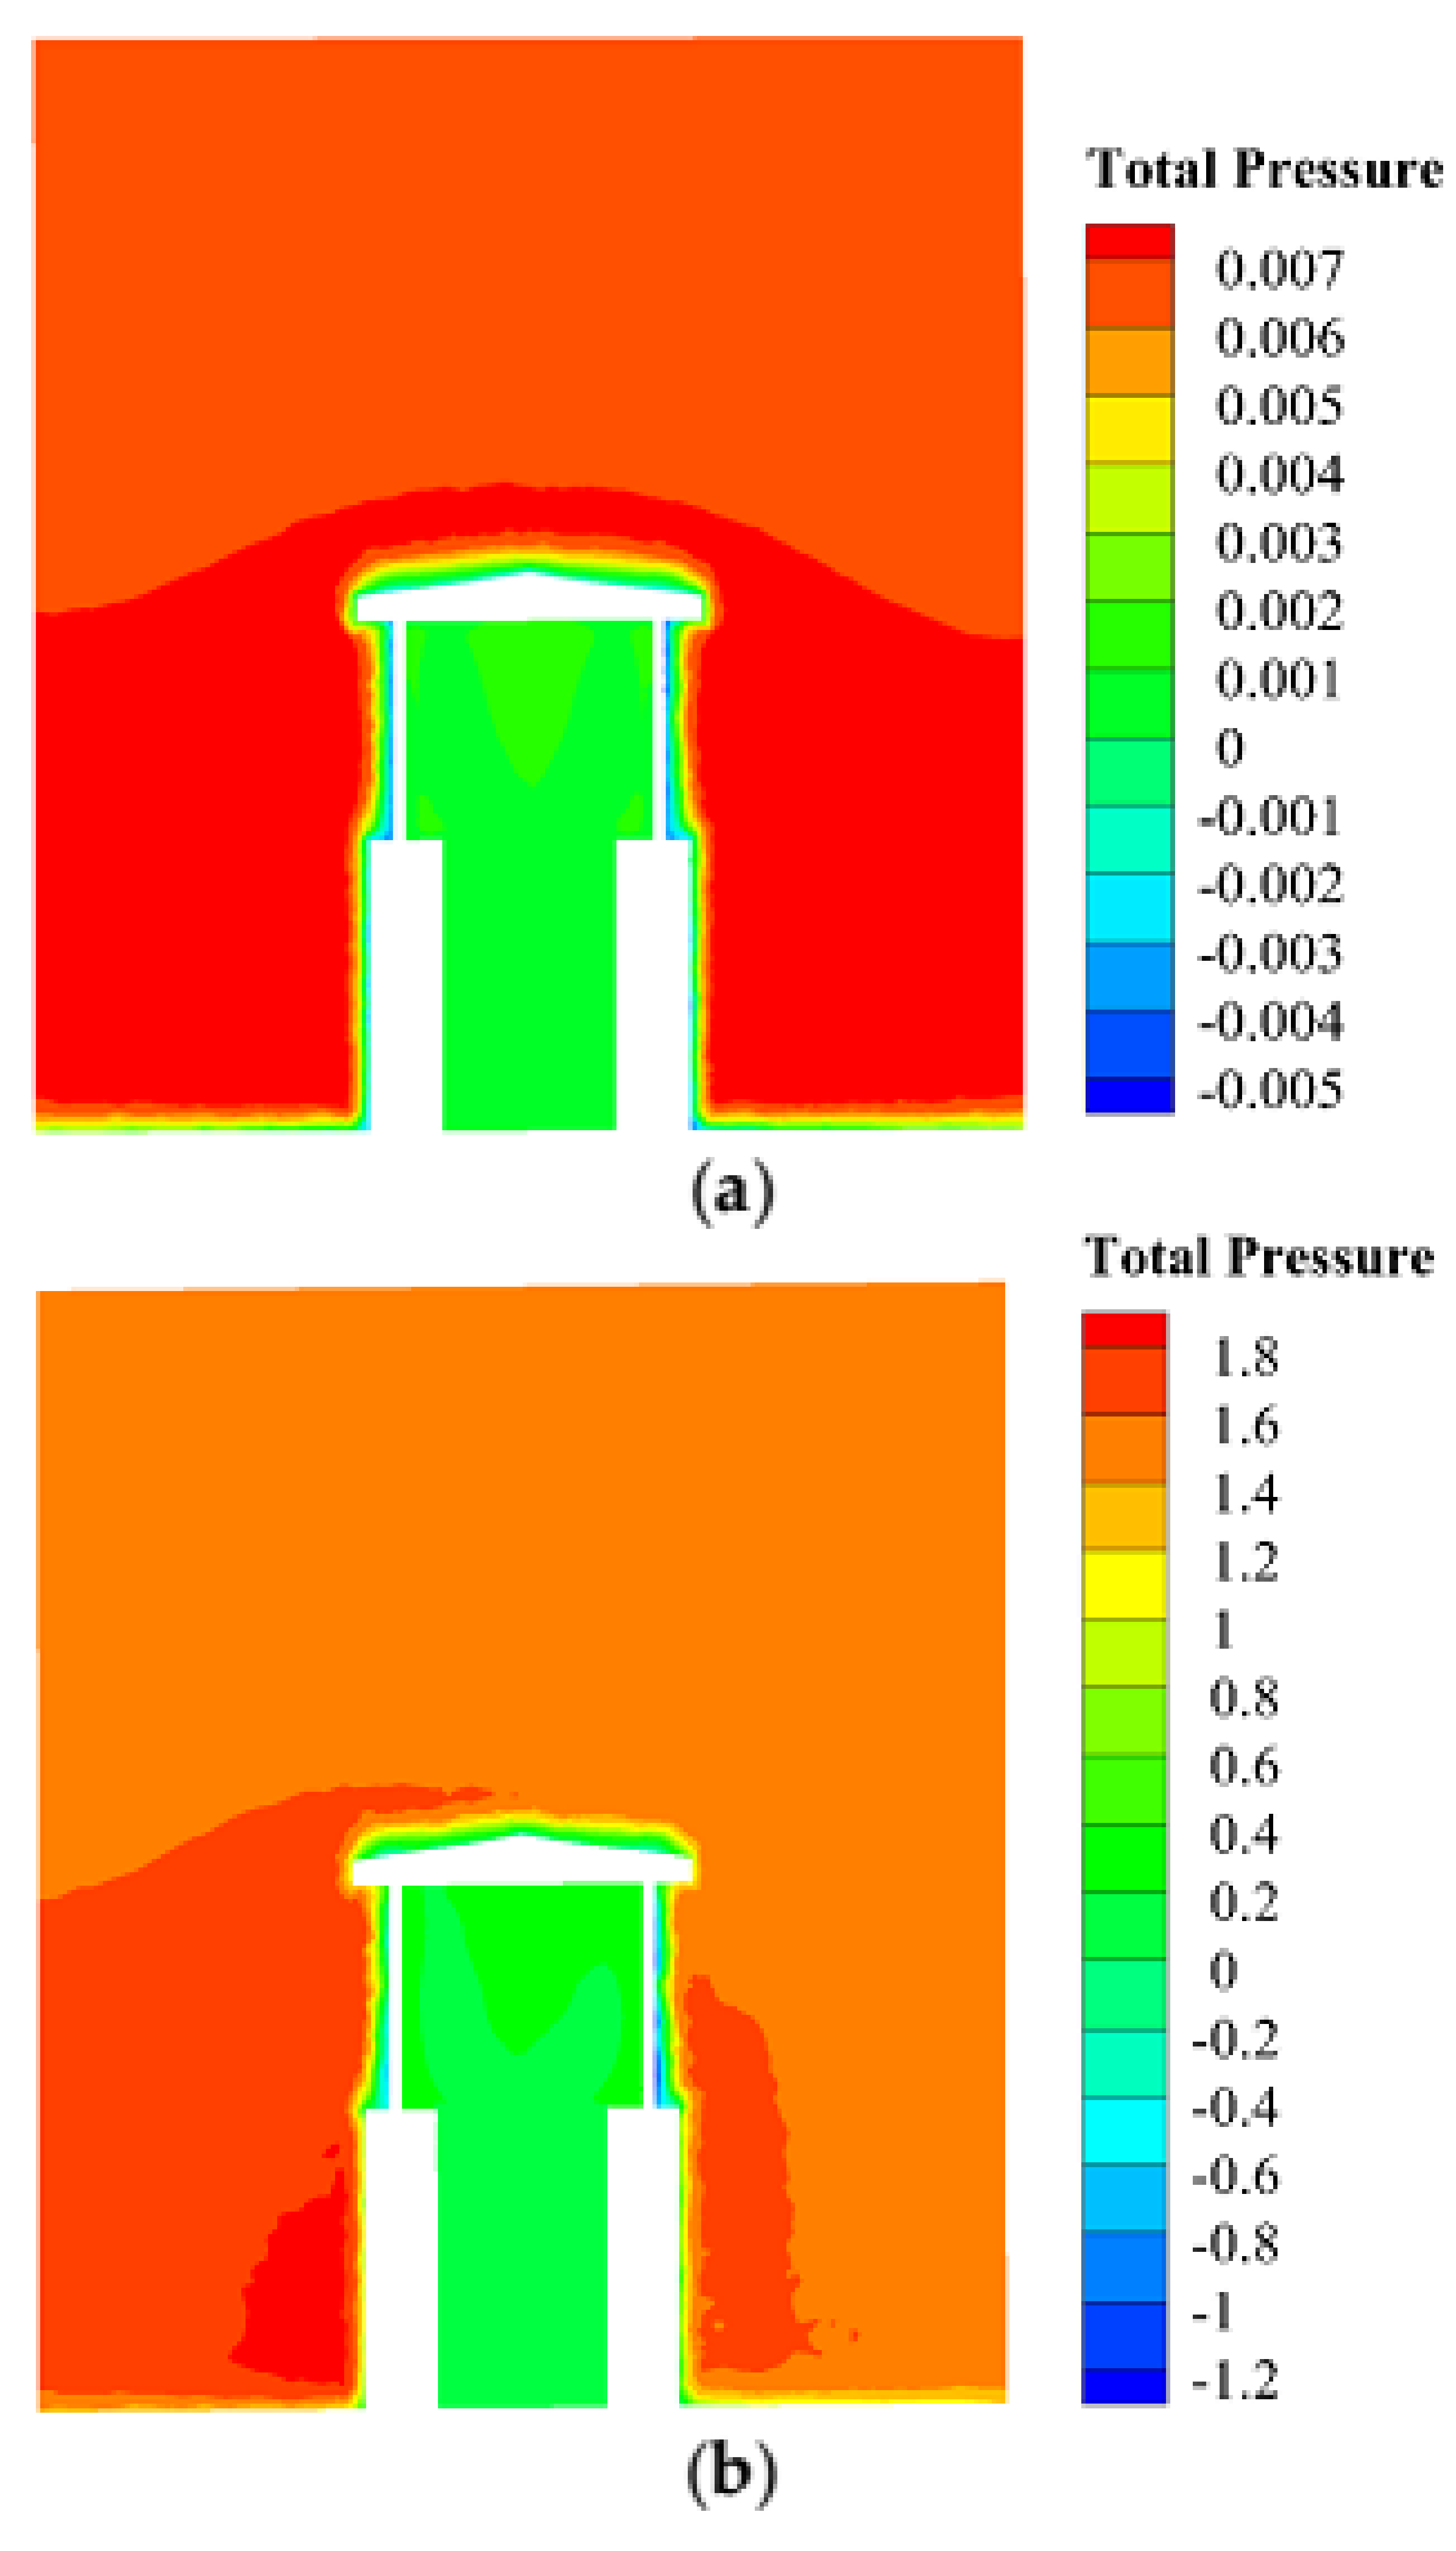
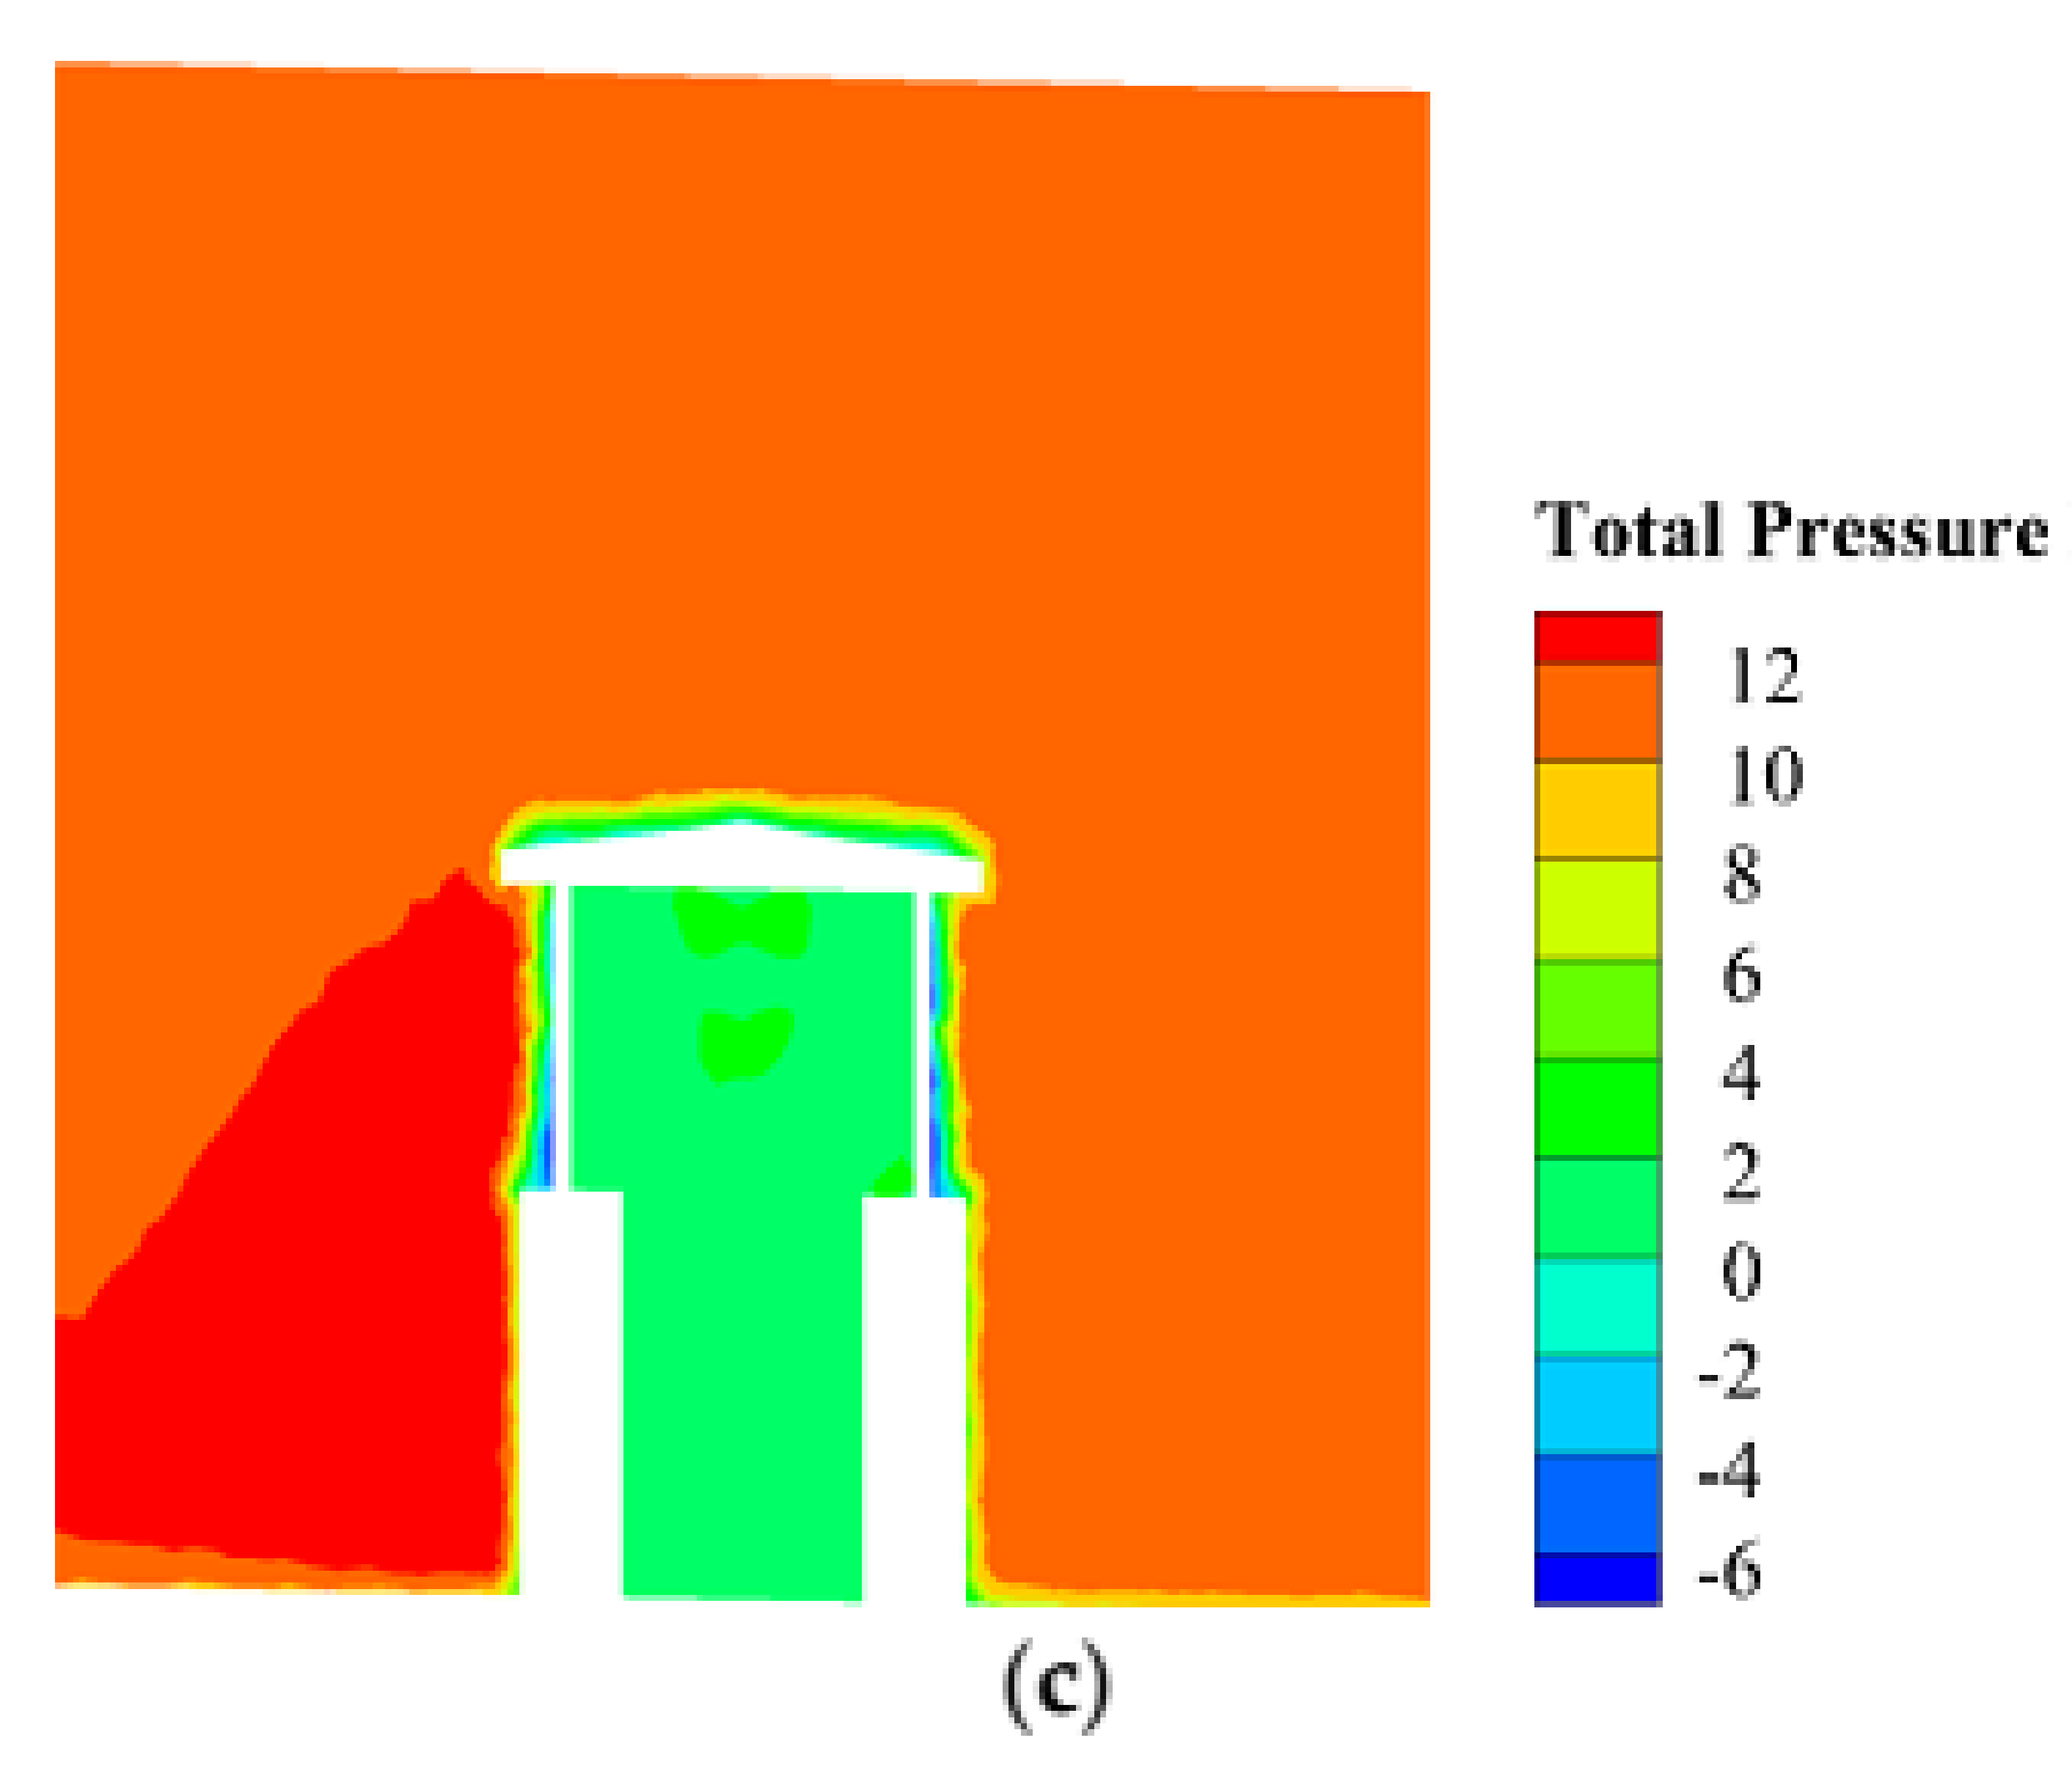
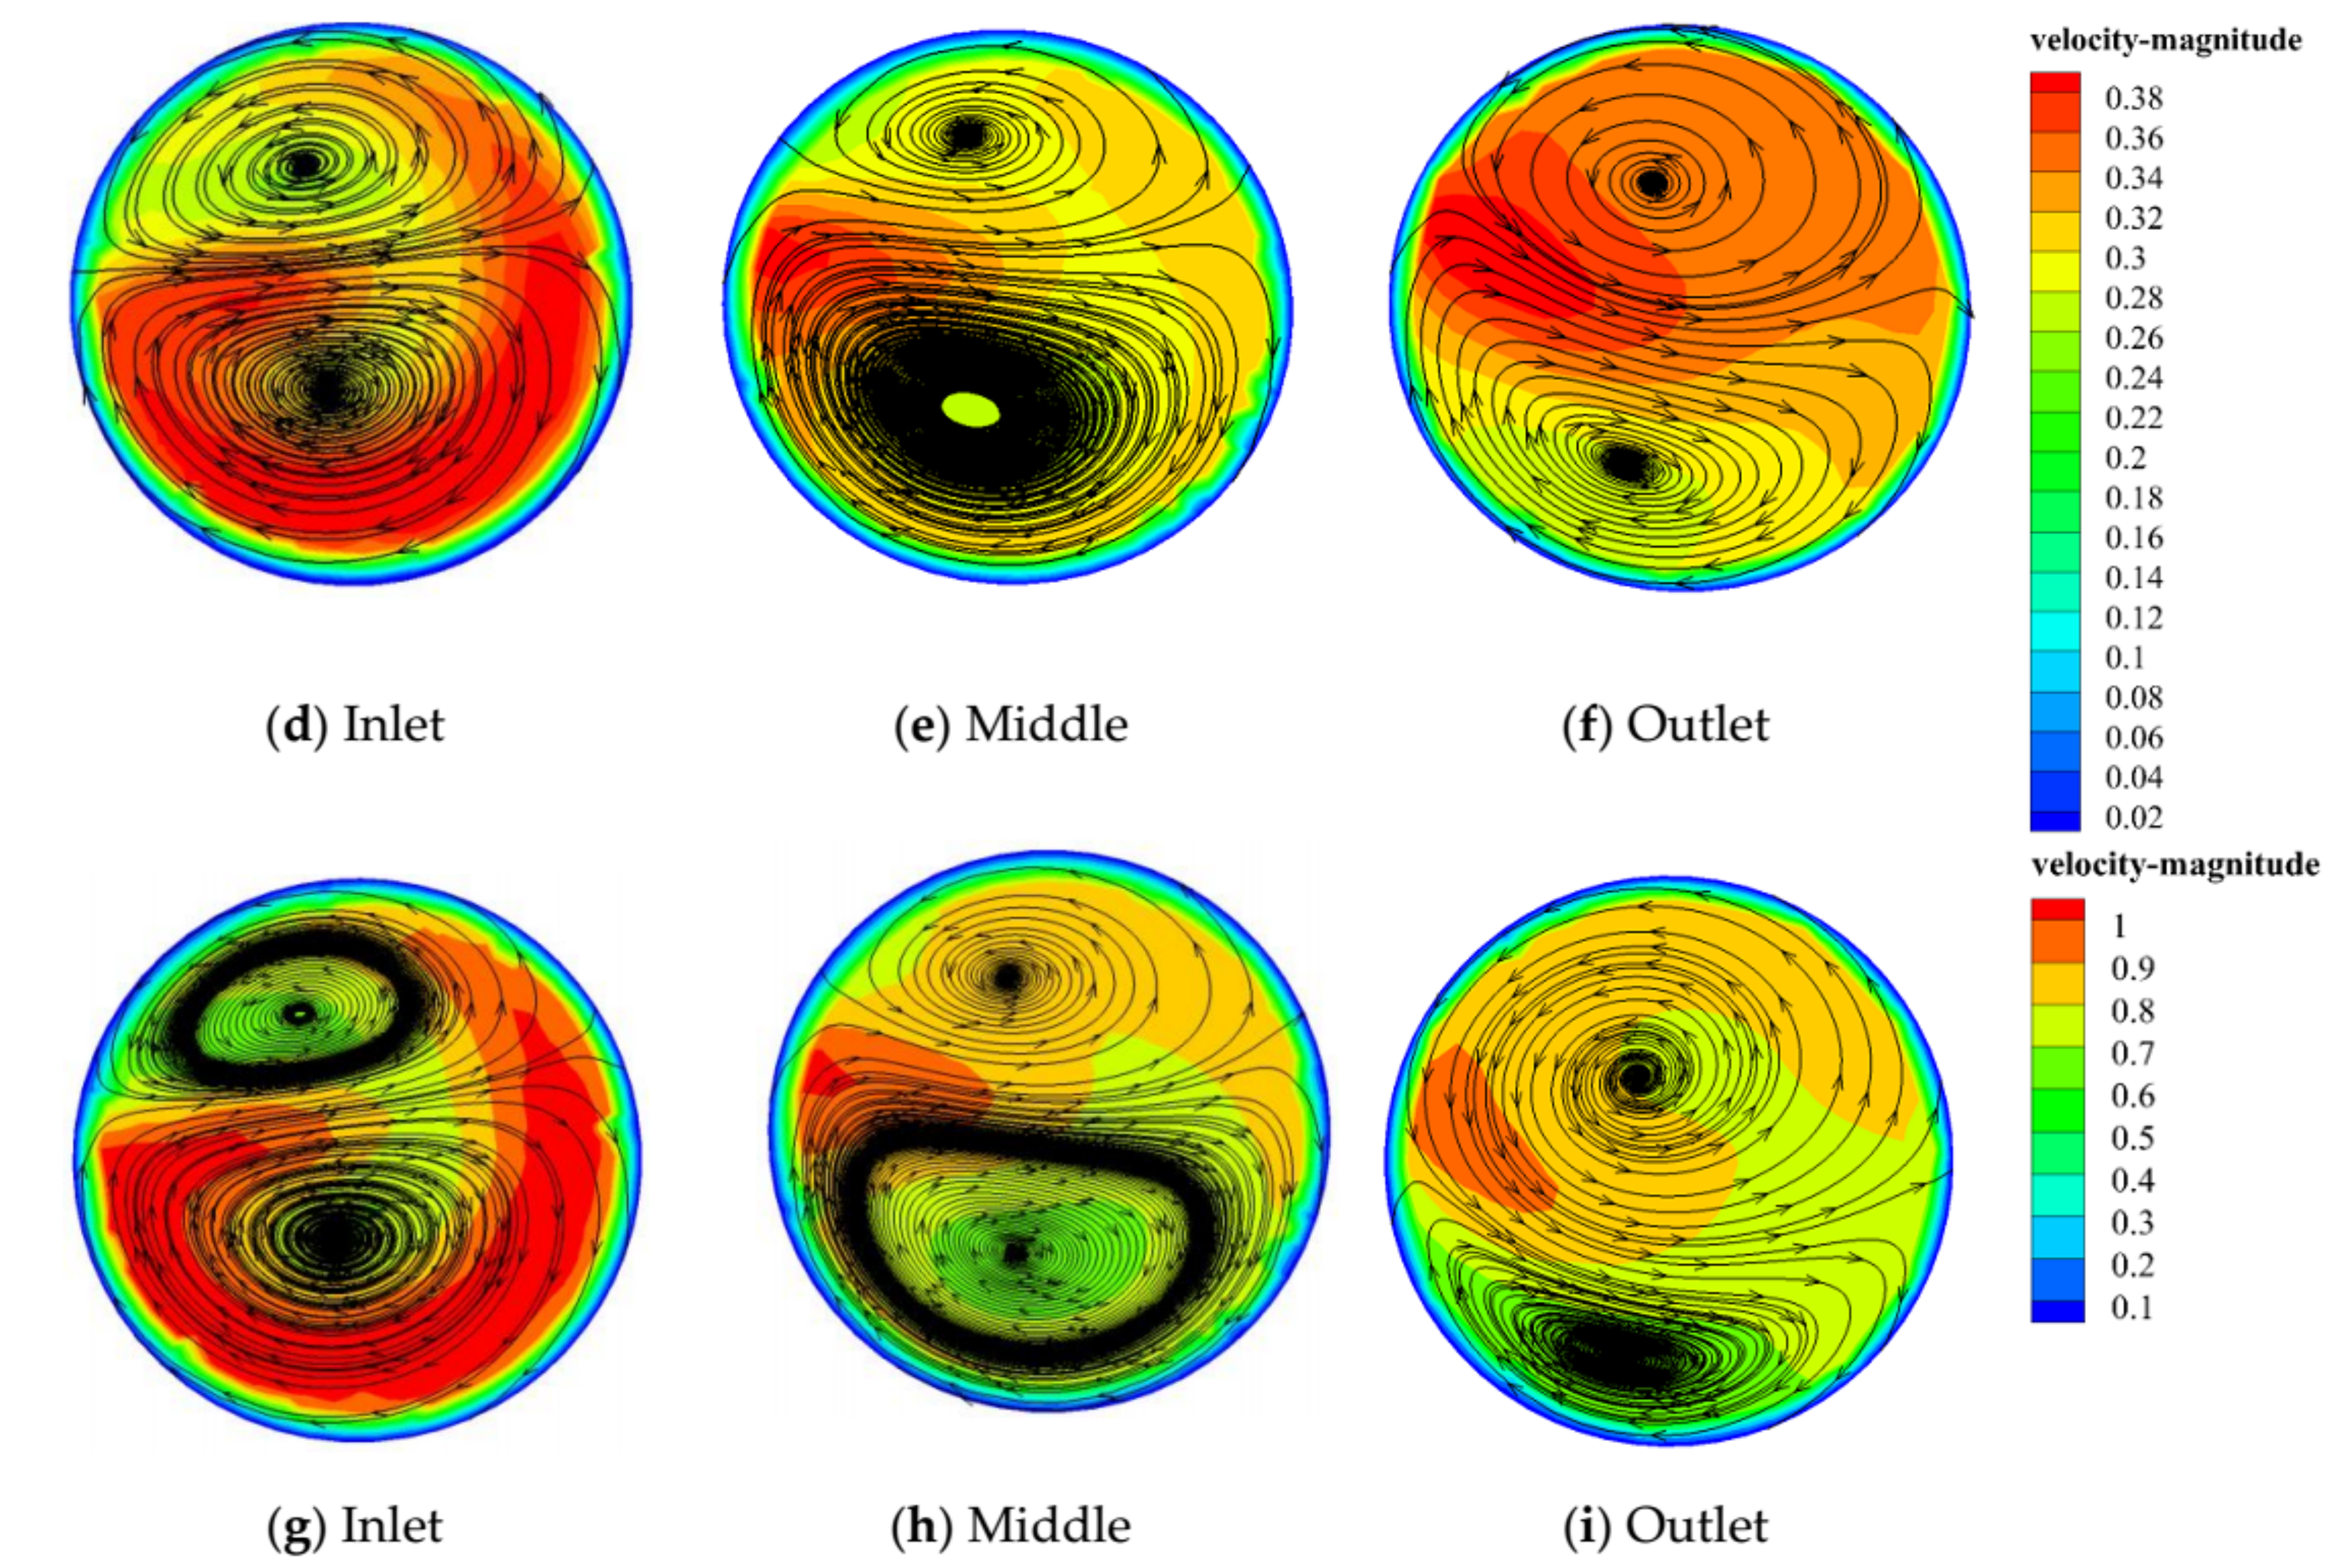
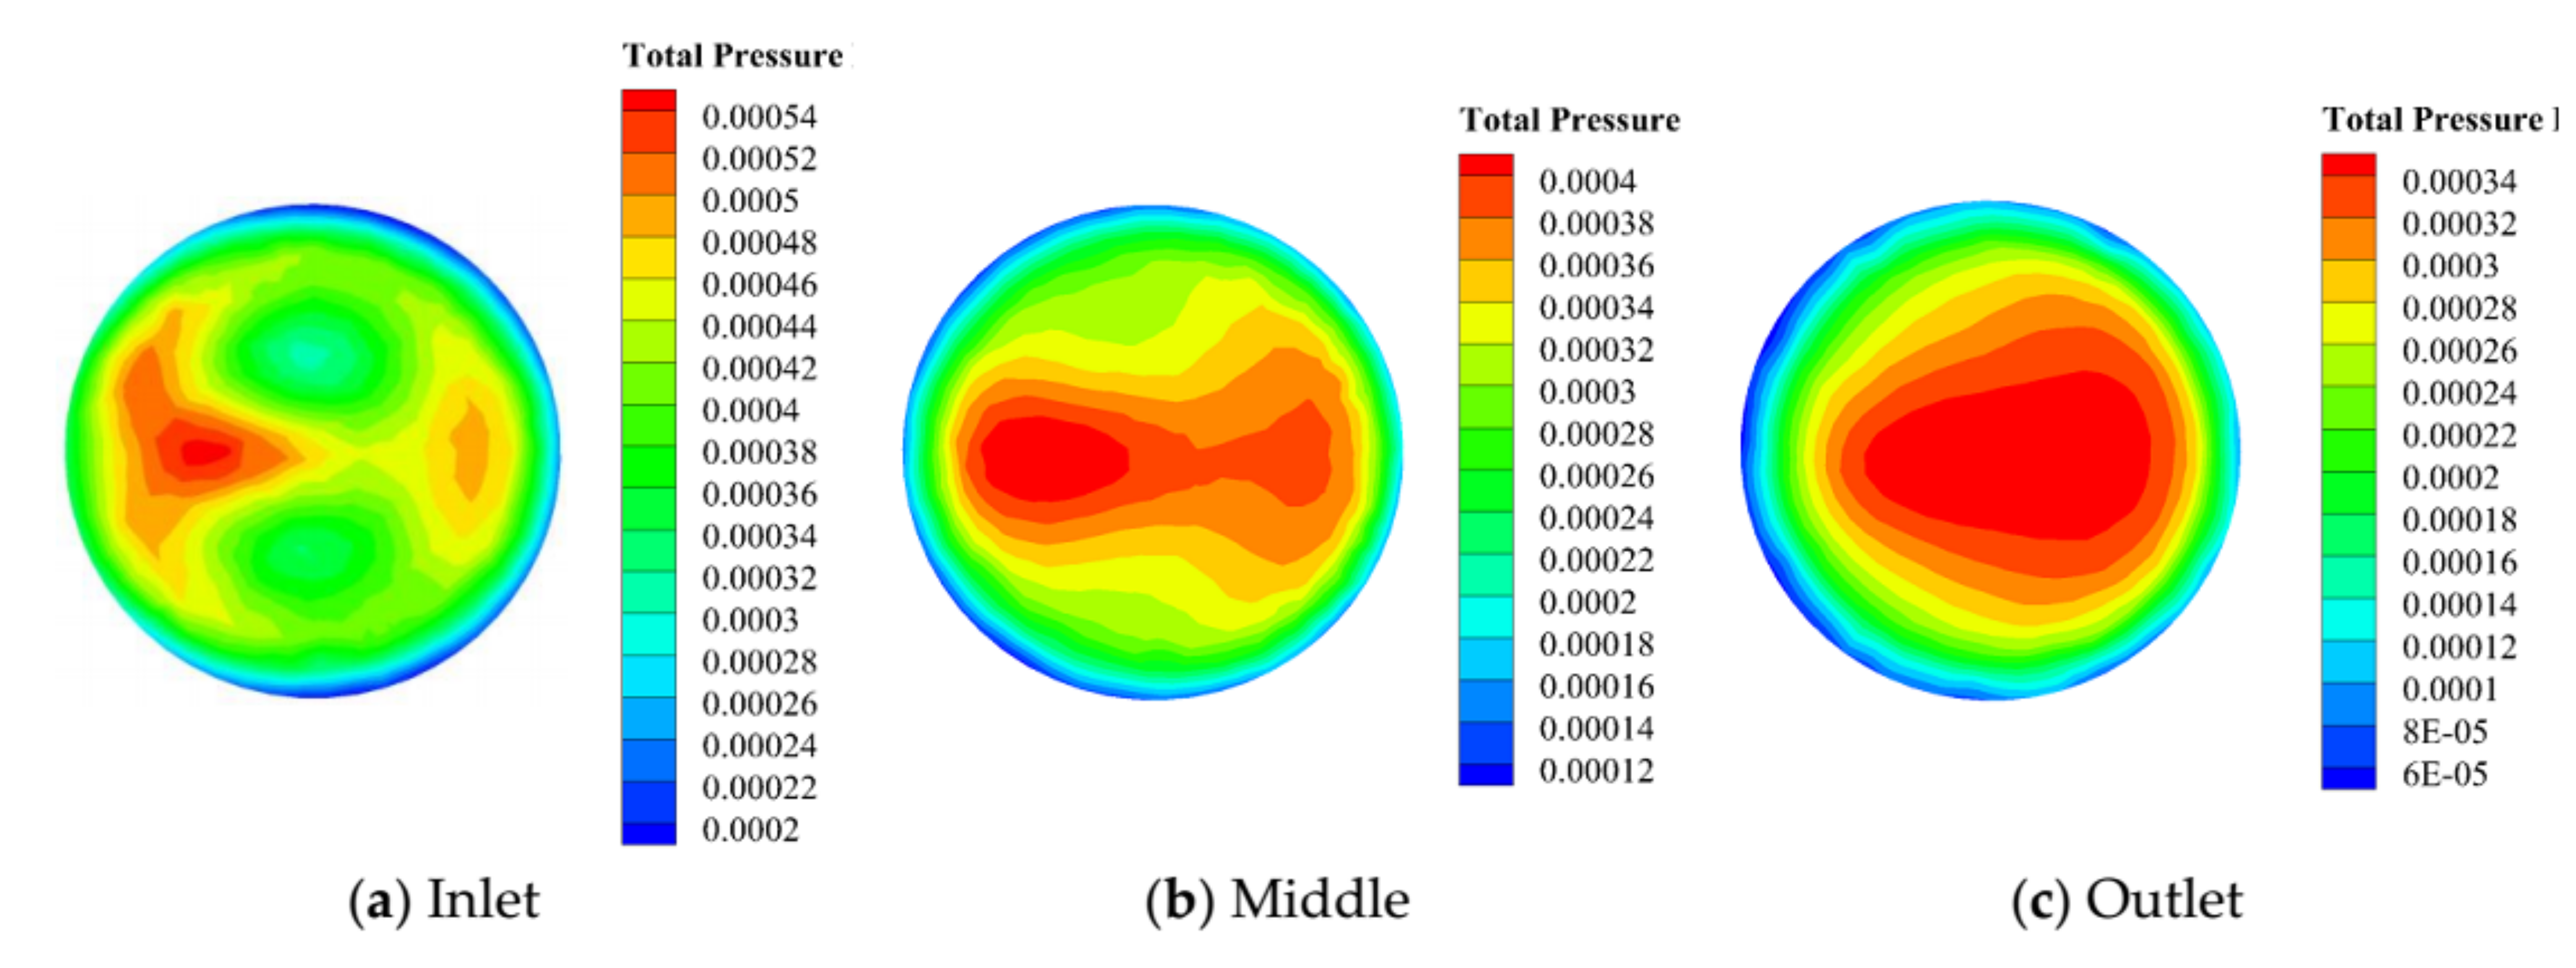
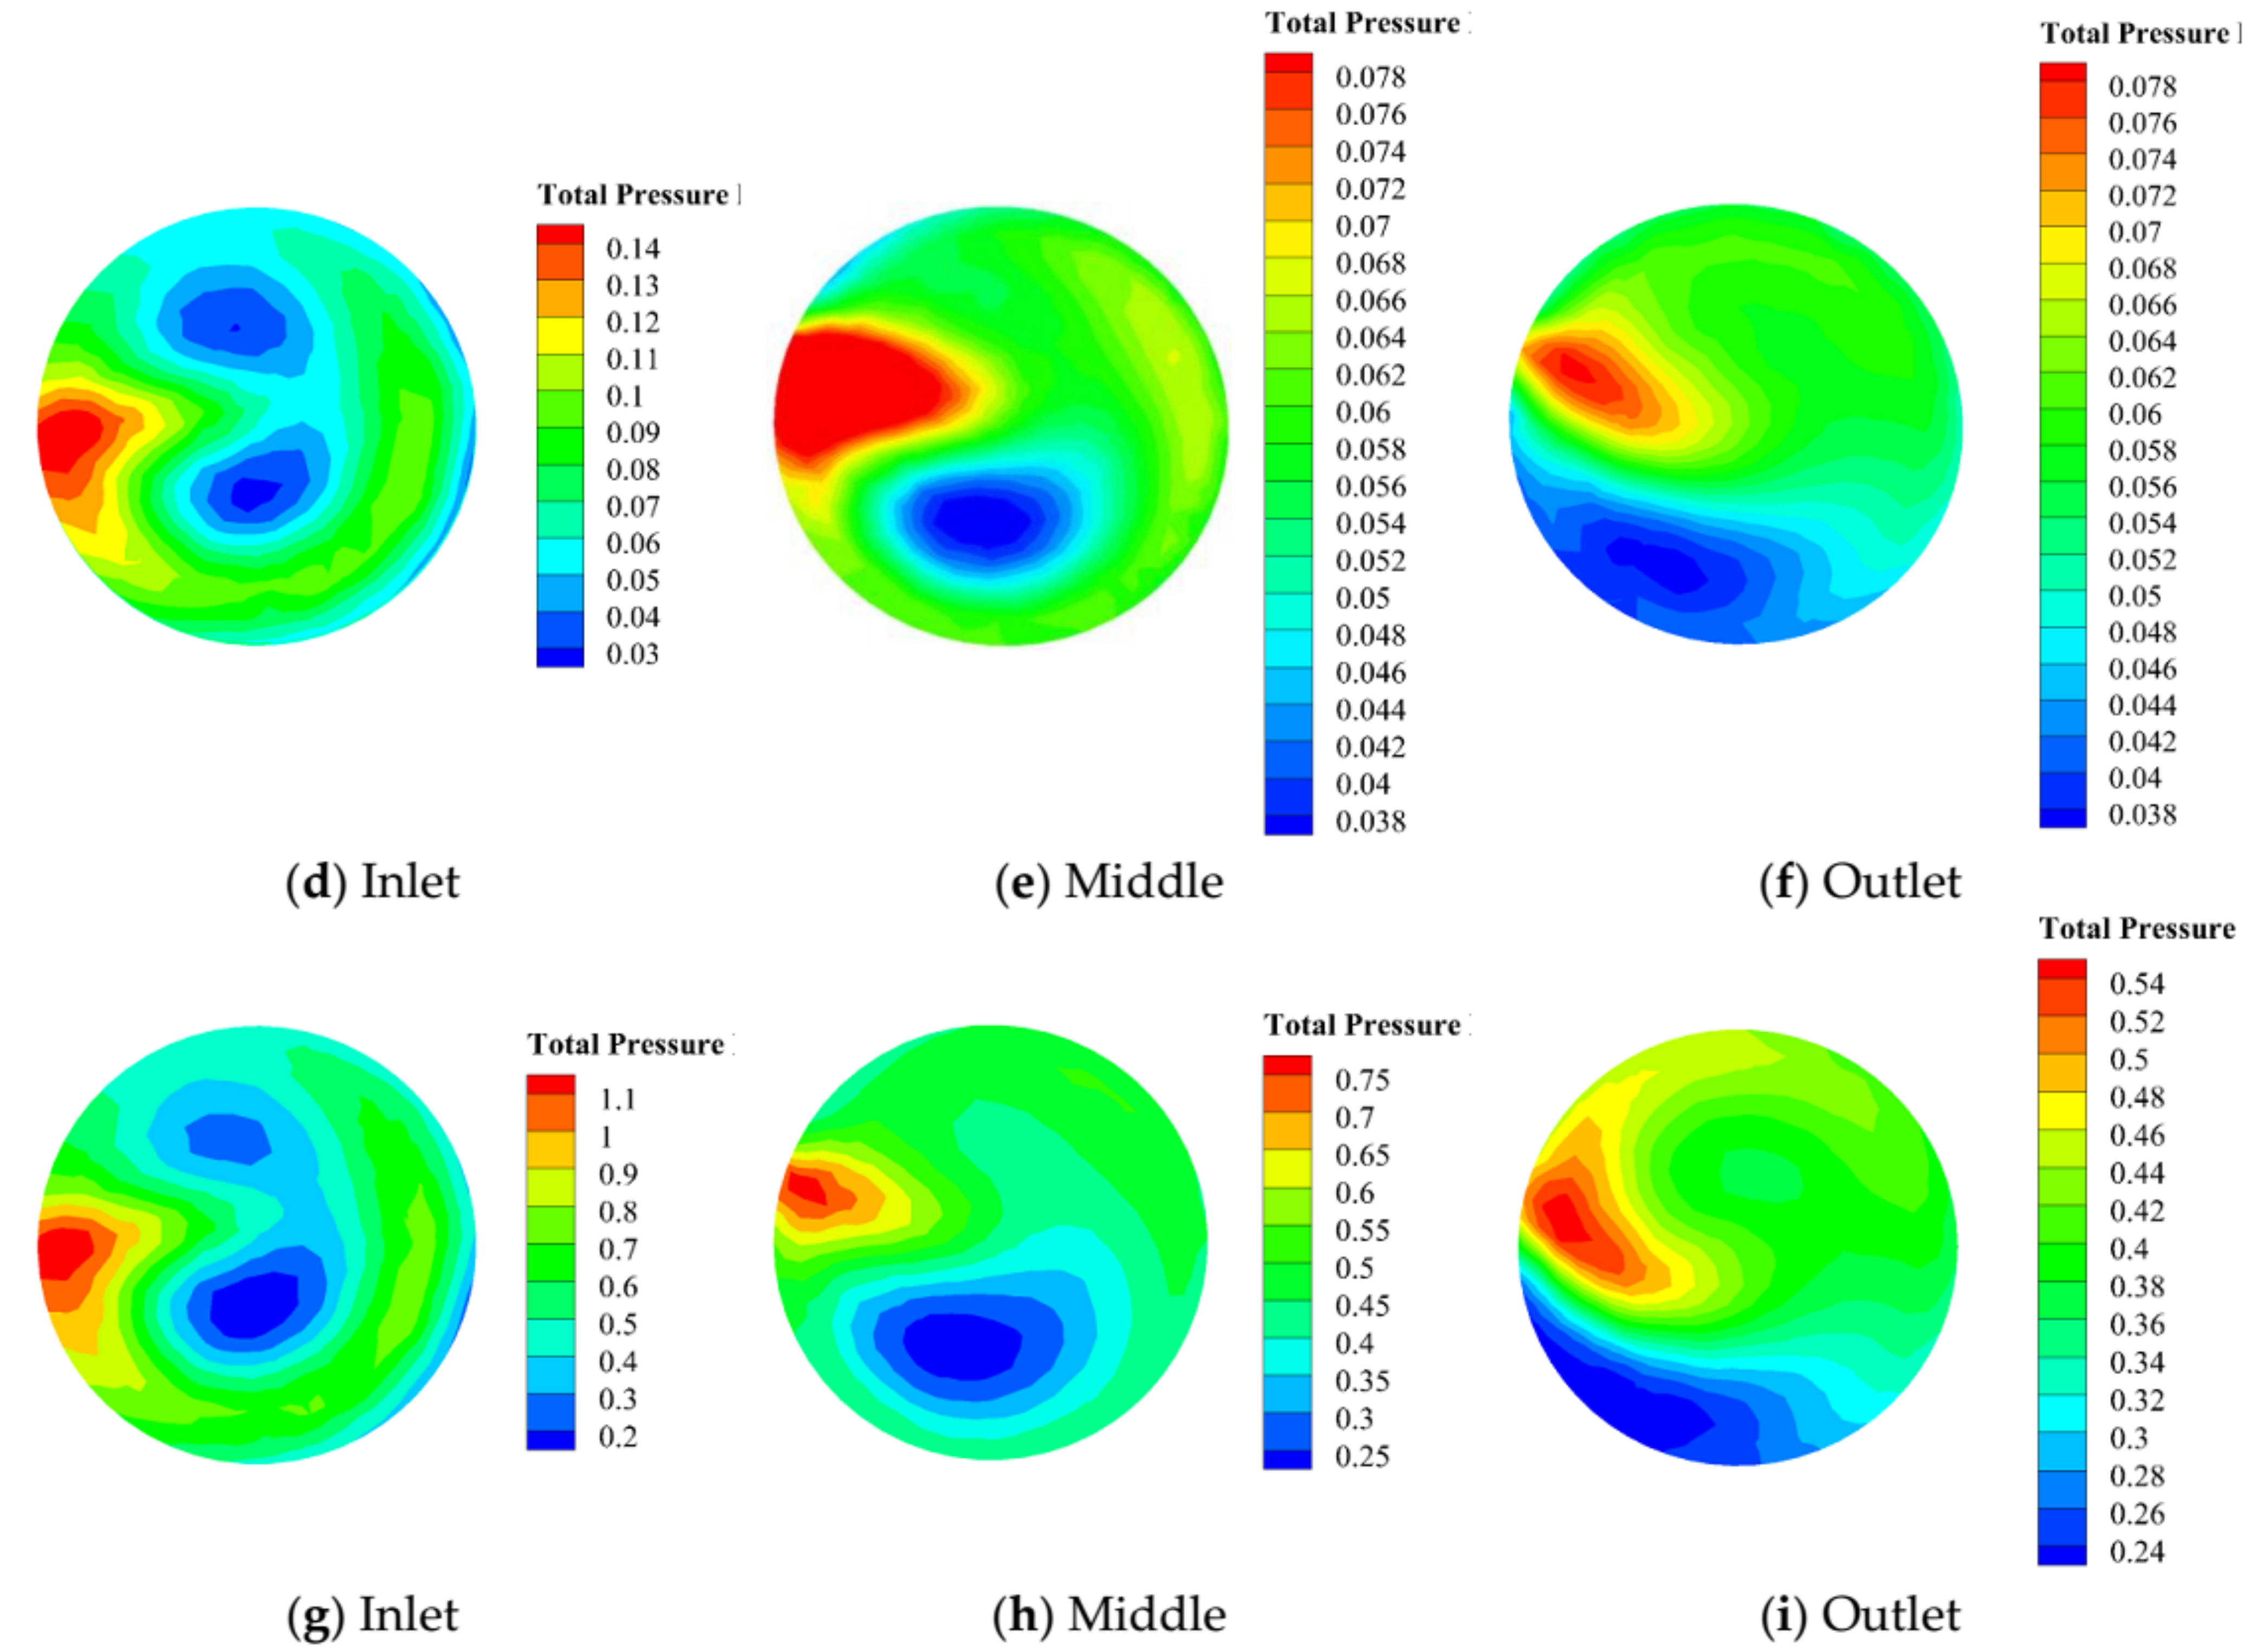
4. Results and Discussion

The distributions of velocity, total pressure, and pressure coefficient around and inside the wind tower are analyzed to evaluate the performance of the wind tower design. Figure 11, Figure 12 and Figure 13 display the velocity distribution and streamlines evolution around and inside the wind tower for three wind velocities in the xz-plane, xy-plane and yz-plane, respectively. As illustrated, the airflow velocity decreases after passing the evaporative cooling pad. When the wind velocity in the ambient air is close to zero, some downward airflow can be created inside the wind tower owing to buoyancy forces arising from the greater air density inside the wind tower compared to the outside.
According to Figure 11, Figure 12 and Figure 13, the separation region inside the wind tower’s column is very small; therefore, the effective space for passing airflow within the column is large enough. The length of the channel is extended sufficiently to prevent reverse flow in the outlet. Hence, the effect of the wind tower in the outlet is negligible. The wake region on the backside of the wind tower dissipates substantial energy. Also, eddies inside the wind tower, though small, can reduce its efficiency. By increasing wind velocity, at least two main improvements in the wind tower efficiency can occur. First, eddies inside the wind tower will be relatively smaller, so the wind tower efficiency will improve. Second, the impact of the wake region on energy dissipation at the backside of the wind tower will decrease.
Figure 14, Figure 15 and Figure 16 show the total pressure distribution around and inside the wind tower for three wind velocities in the xz-plane, xy-plane and yz-plane, respectively. As observed in these figures, there are high and low pressure regions around the wind tower: the pressure is high in front of the wind tower and it decreases to its lowest amount at the backside, as the airflow moves past the wind tower. The position of high and low pressure regions varies around the wind tower with changing wind velocity. As a result, the pressure on the wind tower’s column is greater compared to the head of the tower at higher wind velocity. Thus, the relative dimensions play an important role in designing the proposed wind tower.
By calculating the pressure coefficient, the ventilation performance of the proposed wind tower can be estimated. The pressure coefficient expresses the ratio of the local surface pressure and the dynamic pressure, given by [57,58]:
C p = P P s 1 2 ρ V r e f 2
here, P is the local surface pressure (Pa), ρ is the air density (kg/m3), and Ps and Vref are the upstream static pressure (Pa) and free flow velocity (m/s), respectively. Figure 17 and Figure 18 illustrate the pressure coefficient distribution around and inside the wind tower for three wind velocities in the xz-plane and xy-plane, respectively. As shown, at low wind velocities, the difference between the pressure coefficients at the air opening and inside of the wind tower is negligible; thus, there is not enough flow to overcome the resistance of the pad. For example, this difference is very small when the wind velocity is equal to 0.1 m/s (Figure 17a and Figure 18a); therefore, the natural ventilation performance of the wind tower design with low wind velocities is insignificant. Conversely, at higher wind velocities, the difference between the pressure coefficients at the air opening and inside the wind tower is considerable (Figure 17c and Figure 18c), and there are no large eddies and non-effective airflow rotations inside the wind tower. Consequently, the natural ventilation performance of the proposed wind tower for higher velocities is significant. Table 3 shows the mass flow rate at the exit of the wind tower’s column for three wind velocities. By increasing the wind velocity, the outlet mass flow rate from the wind tower increases.
Figure 19 demonstrates the velocity distribution and streamlines at the inlet, middle, and outlet of the wind tower’s column for three wind velocities. The airflow at the inlet of wind tower’s column is clearly divided into two rotational streams, such that at the wind velocity of 0.1 m/s these rotational streams are almost symmetric. Additionally, the velocity distribution within the wind tower’s column for a wind velocity of 0.1 m/s is approximately symmetric but non-uniform (Figure 19a–c). At high wind velocities, there are two rotational streams inside the wind tower’s column, but they are not symmetric, nor are the velocity distributions uniform. For instance, at a wind velocity of 4 m/s, the pattern and quantity of the airflow at the inlet, middle, and outlet of the wind tower’s column are different, and as a result, the configuration of the evaporative cooling pads plays an important role on the pattern and quantity of the airflow inside the wind tower.
Figure 20 shows the total pressure distribution at the inlet, middle, and outlet of the wind tower’s column for three wind velocities. As illustrated in Figure 20a–c, the pressure distribution within the wind tower’s column for the wind velocity of 0.1 m/s is approximately symmetric. As seen in Figure 20d–f, the pressure distributions inside the wind tower’s column are non-uniform. At high wind velocities, the pattern of pressure distribution for various levels on the inside of the wind tower’s column is different (Figure 20g–i).

5. Conclusions

A modern wind tower with a moistened pad is designed to eliminate or reduce the restrictions of the traditional and conventional wind towers and to have a better performance in creating thermal comfort for building occupants throughout the warm months. To evaluate the ventilation performance of this new design, a CFD simulation of airflow around and inside the wind tower is carried out. Also, the distributions of velocity, total pressure and pressure coefficient around and within the proposed wind tower for three wind velocities are investigated. The simulation results show that there is a very small separation region within the column of the wind tower, so the effective space for passing airflow inside the column is large enough. In addition, the proposed wind tower has a greater efficiency at higher wind velocities because by increasing the velocity of wind the eddies within the wind tower will be relatively smaller and the influence of the wake region on energy dissipation at the backside of the wind tower will be less. Also, the difference between the pressure coefficients at the air opening and inside the wind tower is significant. As a general result, wind velocity plays a substantial role in the natural ventilation performance of the proposed wind tower, so that at higher velocities, the ventilation performance is greater.
The new design of wind tower has the following important specifications: (1) simple design and manufacturing; (2) easy installation and usage; and (3) better performance since it can spin and set itself in the direction of maximum wind velocity. This wind tower design can help diminish GHG emissions and environmental pollution associated with conventional air conditioning. The proposed wind tower can be an appropriate option for natural ventilation of buildings in hot and dry climates. Hence, this new design can be used as a green architectural component in new buildings.

Author Contributions

Alireza Dehghani-Sanij, Madjid Soltani, Maurice B. Dusseault and SeyedBijan Mahbaz proposed and designed the modern wind tower; Farshad M. Kashkooli, Ahmad Sayadnia and Kobra Gharali performed the numerical simulations; Alireza Dehghani-Sanij, Madjid Soltani, Farshad M. Kashkooli, Maurice B. Dusseault and SeyedBijan Mahbaz wrote the paper.

Conflicts of Interest

The authors declare no conflict of interest.

References

  1. Saadatian, O.; Chin, H.L.; Sopian, K.; Sulaiman, M.Y. Review of Wind Catcher Technologies. Renew. Sustain. Energy Rev. 2012, 12, 1477–1495. [Google Scholar] [CrossRef]
  2. Masoso, O.T.; Grobler, L.J. The Dark Side of Occupants’ Behavior on Building Energy Use. Energy Build. 2010, 42, 173–177. [Google Scholar] [CrossRef]
  3. Chan, H.Y.; Riffat, S.B.; Zhu, J. Review of Passive Solar Heating and Cooling Technologies. Renew. Sustain. Energy Rev. 2010, 14, 781–789. [Google Scholar] [CrossRef]
  4. Wu, Y. Chinese Building Energy Conservation: Existing Situation, Problems and Policy. In Proceedings of the International Conference on Sustainable Development in Building and Environment, Chongqing, China, 24–27 October 2003. [Google Scholar]
  5. Chwieduk, D. Towards Sustainable-Energy Buildings. Appl. Energy 2003, 76, 211–217. [Google Scholar] [CrossRef]
  6. Gong, G.; Zeng, W.; Wang, L.; Wu, C. A New Heat Recovery Technique for Air-Conditioning/Heat-Pump System. Appl. Thermal. Eng. 2008, 28, 2360–2370. [Google Scholar] [CrossRef]
  7. Wang, S.; Fang, C.; Guan, X.; Pang, B.; Ma, H. Urbanisation, Energy Consumption, and Carbon Dioxide Emissions in China: A Panel Data Analysis of China’s Provinces. Appl. Energy 2014, 136, 738–749. [Google Scholar] [CrossRef]
  8. Robert, A.; Kummert, M. Designing Net-Zero Energy Buildings for the Future Climate, Not for the Past. Build. Environ. 2012, 55, 150–158. [Google Scholar] [CrossRef]
  9. Bahadori, M.N.; Dehghani-Sanij, A.R. Wind Towers: Architecture, Climate and Sustainability; Sayigh, A.A.M., Ed.; Springer: Basel, Switzerland, 2014. [Google Scholar]
  10. Bahadori, M.N. Natural Cooling in Hot Arid Regions. In Solar Energy Application in Buildings; Sayigh, A.A.M., Ed.; Academic Press Inc.: New York, NY, USA, 1977; pp. 195–225. [Google Scholar]
  11. Bahadori, M.N. Passive Cooling Systems in Iranian Architecture. Sci. Am. 1978, 238, 144–145. [Google Scholar] [CrossRef]
  12. Bahadori, M.N. Pressure Coefficients to Evaluate Air Flow Patterns in Wind Towers. In Proceedings of the International Passive and Hybrid Cooling Conference, Miami Beach, FL, USA, 6–16 November 1981; American Section of the International Solar Energy Society: Newark, DE, USA, 1981; pp. 206–210. [Google Scholar]
  13. Bahadori, M.N. An Improved Design of Wind Towers for Natural Ventilation and Passive Cooling. Sol. Energy 1985, 36, 119–129. [Google Scholar] [CrossRef]
  14. Bahadori, M.N. Thermal Performance of Adobe Structures with Domed Roofs and Moist Internal Surfaces. Sol. Energy 1986, 36, 365–375. [Google Scholar] [CrossRef]
  15. Bahadori, M.N. A Passive Cooling/Heating System for Hot, Arid Regions. In Proceedings of the 13th National Passive Solar Conference, Cambridge, MA, USA, 20–24 June 1988; pp. 364–367. [Google Scholar]
  16. Bahadori, M.N.; Pakzad, A.R. Performance Evaluation of New Designs of Wind Towers. Paper No. FEDSM 2002–31247. In Proceedings of the ASME FEDSM02, ASME 2002 Fluids Engineering Division Summer Meeting, Montreal, QC, Canada, 14–18 July 2002. [Google Scholar]
  17. Bahadori, M.N.; Yaghobi, M. Ventilation and Natural Cooling System in Traditional Buildings of Iran; University Publication Center: Tehran, Iran, 2006. [Google Scholar]
  18. Bahadori, M.N.; Mazidi, M.; Dehghani, A.R. Experimental Investigation of New Designs of Wind Towers. Renew. Energy 2008, 33, 2273–2281. [Google Scholar] [CrossRef]
  19. Karakasanis, C.; Bahadori, M.N.; Vickery, B.J. Evaluation of Air Flow Rates in Employing Wind Towers. Sol. Energy 1986, 37, 363–374. [Google Scholar] [CrossRef]
  20. Dehghani-Sanij, A.R. Cisterns: Sustainable Development, Architecture and Energy; Sayigh, A.A.M., Ed.; River Publishers: Aalborg, Denmark, 2016. [Google Scholar]
  21. Arefmanesh, A.; Dehghan, A.A.; Dehghani, A.R. Thermal Characteristics of an Underground Cold Water Reservoir: Analytical and Experimental Studies. Appl. Therm. Eng. 2009, 29, 3261–3265. [Google Scholar] [CrossRef]
  22. Razavi, M.; Dehghani, A.R.; Khanmohammadi, M. Simulation of Thermal Stratification in Cisterns Using Artificial Neural Networks. J. Energy Heat Mass Transf. 2009, 31, 201–210. [Google Scholar]
  23. Madoliat, R.; Razavi, M.; Dehghani, A.R. Modeling of Heat Transfer in Cisterns Using Artificial Neural Networks. J. Thermophys. Heat Transf. 2009, 23, 411–416. [Google Scholar] [CrossRef]
  24. Dehghan, A.A.; Dehghani, A.R. Experimental and Theoretical Investigation of Thermal Performance of Underground Cold-water Reservoirs. Int. J. Therm. Sci. 2011, 50, 816–824. [Google Scholar] [CrossRef]
  25. Siahoui, H.A.; Dehghani, A.R.; Razavi, M.; Khani, M.R. Investigation of Thermal Stratification in Cisterns Using Analytical and Artificial Neural Networks Methods. J. Energy Conver. Manag. 2011, 52, 505–511. [Google Scholar] [CrossRef]
  26. Razavi, M.; Dehghani-Sanij, A.R.; Khani, M.R.; Dehghani, M.R. Comparing Meshless Local Petrov-Galerk in and Artificial Neural Networks Methods for Modeling Heat Transfer in Cisterns. Renew. Sustain. Energy Rev. 2015, 43, 521–529. [Google Scholar] [CrossRef]
  27. Dehghani-Sanij, A.R.; Khani, M.R.; Jalali, A.; Khani, M.; Narimannejad, S. Evaluation of Water Quality of Cisterns. Int. J. Environ. Resour. 2015, 4, 1–8. [Google Scholar] [CrossRef]
  28. Dehghani-Sanij, A.R.; Khani, M.R.; Zhang, B.; Narimannejad, S.; Mohammadni, M. Water Quality Analysis of Underground Reservoirs in Hot and Arid Regions. J. Appl. Environ. Biol. Sci. 2016, 6, 149–161. [Google Scholar]
  29. Dehghani, A.R.; Aghanajafi, C. Experimental Study of Performance of Two New Wind Tower Designs and Their Comparison with Traditional Wind Towers. Iran. J. Energy 2005, 9, 14–26. [Google Scholar]
  30. Mazidi, M.; Dehghani, A.R.; Aghanajafi, C. Wind Towers’ Role in Natural Air Conditioning and Passive Cooling of Buildings in Hot, Arid Regions. WSEAS Trans. Fluid Mech. 2006, 1, 959–966. [Google Scholar]
  31. Khani, M.R.; Yaghmaeian, K.; Dehghani, A.R. An Experimental Study in Passive Cooling Systems and Investigation of Their Role in Diminish Usage Energy and Environmental Pollutants. Int. J. Appl. Eng. Res. 2009, 4, 519–528. [Google Scholar]
  32. Dehghani-Sanij, A.R.; Soltani, M. Wind Tower with Moving Wetted Surfaces. Industrial Property General Office of Iran. Patent Registration No. 92228, 17 May 2017. [Google Scholar]
  33. Dehghani-Sanij, A.R.; Soltani, M.; Raahemifar, K. A New Design of Wind Tower for Passive Ventilation in Buildings to Reduce Energy Consumption in Windy Regions. Renew. Sustain. Energy Rev. 2015, 42, 182–195. [Google Scholar] [CrossRef]
  34. Khani, S.M.R.; Bahadori, M.N.; Dehghani-Sanij, A.R. Experimental Investigation of a Modular Wind Tower in Hot and Dry Regions. Energy Sustain. Dev. 2017, 39, 21–28. [Google Scholar] [CrossRef]
  35. Khani, S.M.R.; Bahadori, M.N.; Dehghani-Sanij, A.R.; Nourbakhsh, A. Performance Evaluation of a Modular Design of Wind Tower with Wetted Surfaces. Energies 2017, 10, 845. [Google Scholar] [CrossRef]
  36. Pearlmutter, D.; Erell, E.; Etzion, Y. A Multi-Stage Down-Draft Evaporative Cool Tower for Semi-Enclosed Spaces: Experiments with a Water Spraying System. Sol. Energy 2008, 82, 430–440. [Google Scholar] [CrossRef]
  37. Pearlmutter, D.; Erell, E.; Etzion, Y.; Meir, I.A.; Di, H. Refining the Use of Evaporation in an Experimental Down-Draft Cool Tower. Energy Build. 1996, 23, 191–197. [Google Scholar] [CrossRef]
  38. Erell, E.; Pearlmutter, D.; Etzion, Y. A Multi-Stage Down-Draft Evaporative Cool Tower for Semi-Enclosed Spaces: Aerodynamic Performance. Sol. Energy 2008, 82, 420–429. [Google Scholar] [CrossRef]
  39. Issa, R.J.; Chang, B. Performance Prediction of a Multi-Stage Wind Tower for Indoor Cooling. J. Therm. Sci. 2012, 21, 327–335. [Google Scholar] [CrossRef]
  40. Soutullo, S.; Sanjuan, C.; Heras, M.R. Energy Performance Evaluation of an Evaporative Wind Tower. Sol. Energy 2012, 86, 1396–1410. [Google Scholar] [CrossRef]
  41. Soutullo, S.; Olmedo, R.; Sanchez, M.N.; Heras, M.R. Thermal Conditioning for Urban Outdoor Spaces Through the Use of Evaporative Wind Towers. Buil. Environ. 2011, 46, 2520–2528. [Google Scholar] [CrossRef]
  42. Soutullo, S.; Sanchez, M.N.; Olmedo, R.; Heras, M.R. Theoretical Model to Estimate the Thermal Performance of an Evaporative Wind Tower Placed in an Open Space. Renew. Energy 2011, 36, 3023–3030. [Google Scholar] [CrossRef]
  43. Calautit, J.K.; Hughes, B.R.; O’Connor, D.; Shahzad, S.S. Numerical and Experimental Analysis of a Multi-Directional Wind Tower Integrated with Vertically-arranged Heat Transfer Devices (VHTD). Appl. Energ. 2017, 185, 1120–1135. [Google Scholar] [CrossRef]
  44. Calautit, J.K.; Hughes, B.R.; Nasir, D.S.N.M. Climatic Analysis of a Passive Cooling Technology for the Built Environment in Hot Countries. Appl. Energy 2017, 186, 321–335. [Google Scholar] [CrossRef]
  45. Calautit, J.K.; Hughes, B.R.; Shahzad, S.S. CFD and Wind Tunnel Study of the Performance of a Uni-Directional Wind Catcher with Heat Transfer Devices. Renew. Energy 2015, 83, 85–99. [Google Scholar] [CrossRef]
  46. Calautit, J.K.; O’Connor, D.; Hughes, B.R. Determining the Optimum Spacing and Arrangement for Commercial Wind Towers for Ventilation Performance. Build. Environ. 2014, 82, 274–287. [Google Scholar] [CrossRef]
  47. Esfeh, M.K.; Dehghan, A.A.; Manshadi, M.D.; Mohagheghian, S. Visualized Flow Structure Around and Inside of One-Sided Wind-Catchers. Energy Build. 2012, 55, 545–552. [Google Scholar] [CrossRef]
  48. Montazeri, H. Experimental and Numerical Study on Natural Ventilation Performance of Various Multi-Opening Wind Catchers. Build. Environ. 2011, 46, 370–378. [Google Scholar] [CrossRef]
  49. Liu, S.C.; Mak, C.M.; Niu, J.L. Numerical Evaluation of Louver Configuration and Ventilation Strategies for the Wind-Catcher System. Build. Environ. 2011, 46, 1600–1616. [Google Scholar] [CrossRef]
  50. Soltani, M.; Chen, P. Shape Design of Internal Flow with Minimum Pressure Loss. Adv. Sci. Lett. 2009, 2, 347–355. [Google Scholar] [CrossRef]
  51. Zargar, B.; Kashkooli, F.M.; Soltani, M.; Wright, K.E.; Ijaz, M.K.; Sattar, S.A. Mathematical Modeling and Simulation of Bacterial Distribution in an Aerobiology Chamber Using Computational Fluid Dynamics. Am. J. Infect. Control. 2016, 44, S127–S137. [Google Scholar] [CrossRef] [PubMed]
  52. Mehryan, S.A.M.; Kashkooli, F.M.; Soltani, M. Comprehensive Study of the Impacts of Surrounding Structures on the Aero-Dynamic Performance and Flow Characteristics of an Outdoor Unit of Split-Type Air Conditioner. Build. Simul. 2018, 11, 325–337. [Google Scholar] [CrossRef]
  53. Nield, D.A.; Bejan, A. Convection in Porous Media; Springer: New York, NY, USA, 2006. [Google Scholar]
  54. Joseph, D.D.; Nield, D.A.; Papanicolaou, G. Nonlinear Equation Governing Flow in a Saturated Porous Medium. Water Resour. Res. 1980, 18, 1049–1052. [Google Scholar] [CrossRef]
  55. Chengjun, W.; Jiang, L.; Jie, P. Influence of Surrounding Structures Upon the Aerodynamic and Acoustic Performance of the Outdoor Unit of a Split Air-Conditioner. Chin. J. Mech. Eng. 2014, 27, 836–845. [Google Scholar]
  56. Li, J.; Hou, Y.; Liu, J.; Wang, Z.; Li, F. Window Purifying Ventilator Using a Cross-Flow Fan: Simulation and Optimization. Build. Simul. 2016, 9, 481–488. [Google Scholar] [CrossRef]
  57. Montazeri, H.; Montazeri, F.; Azizian, R.; Mostafavi, S. Two-Sided Wind Catcher Performance Evaluation Using Experimental, Numerical and Analytical Modeling. Renew. Energy 2010, 35, 1424–1435. [Google Scholar] [CrossRef]
  58. Dehghan, A.A.; Esfeh, M.K.; Manshadi, M.D. Natural Ventilation Characteristics of One-Sided Wind Catchers: Experimental and Analytical Evaluation. Energy Build. 2013, 61, 366–377. [Google Scholar] [CrossRef]
Figure 1. The areas in the Middle East that have employed the conventional and traditional wind towers [9].
Energies 11 01100 g001
Figure 2. A view of conventional and traditional wind towers in Yazd city, Iran [9].
Energies 11 01100 g002
Figure 3. View of the wind towers in (a) Cairo, Egypt, (b) Duha, Qatar, (c) Dubai, UAE, as well as (d) Bandar Lengeh, (e) Yazd and (f) Abarkouh in Iran [9].
Energies 11 01100 g003
Figure 4. A view of the proposed wind tower design [32].
Energies 11 01100 g004
Figure 5. A cross-section of the wind tower [32].
Energies 11 01100 g005
Figure 6. A schematic illustration of (a) installation position of moistened pad in the wind tower and (b) water distribution system as well as air cooling by the moist pad.
Energies 11 01100 g006
Figure 7. A three-dimensional model of the wind tower, (a) external view and (b) transparent view.
Energies 11 01100 g007
Figure 8. Computational domain considered for the proposed wind tower.
Energies 11 01100 g008
Figure 9. Grid independency of the current study according to the inlet wind velocity of 1.5 m/s.
Energies 11 01100 g009
Figure 10. Grid generation on different planes: (a) xz-plane; (b) yz-plane; and (c) wind tower 3D view.
Energies 11 01100 g010aEnergies 11 01100 g010b
Figure 11. Distribution of velocity and streamlines evolution in xz-plane for different inlet wind velocities: (a) 0.1 m/s, (b) 1.5 m/s, and (c) 4 m/s.
Energies 11 01100 g011
Figure 12. Distribution of velocity and streamlines evolution in xy-plane for different inlet wind velocities: (a) 0.1 m/s; (b) 1.5 m/s; and (c) 4 m/s.
Energies 11 01100 g012aEnergies 11 01100 g012b
Figure 13. Distribution of velocity and streamlines evolution in yz-plane for different inlet wind velocities: (a) 0.1 m/s; (b) 1.5 m/s; and (c) 4 m/s.
Energies 11 01100 g013aEnergies 11 01100 g013b
Figure 14. Distribution of total pressure in xz-plane for different inlet wind velocities: (a) 0.1 m/s; (b) 1.5 m/s; and (c) 4 m/s. In this figure, the unit of total pressure is kPa.
Energies 11 01100 g014
Figure 15. Distribution of total pressure in xy-plane for different inlet wind velocities: (a) 0.1 m/s; (b) 1.5 m/s; and (c) 4 m/s. In this figure, the unit of total pressure is kPa.
Energies 11 01100 g015aEnergies 11 01100 g015b
Figure 16. Distribution of total pressure in yz-plane for different inlet wind velocities: (a) 0.1 m/s; (b) 1.5 m/s; and (c) 4 m/s. In this figure, the unit of total pressure is kPa.
Energies 11 01100 g016aEnergies 11 01100 g016b
Figure 17. Distribution of pressure coefficient in xz-plane for different inlet wind velocities: (a) 0.1 m/s; (b) 1.5 m/s; and (c) 4 m/s.
Energies 11 01100 g017
Figure 18. Distribution of pressure coefficient in xy-plane for different inlet wind velocities: (a) 0.1 m/s; (b) 1.5 m/s; and (c) 4 m/s.
Energies 11 01100 g018aEnergies 11 01100 g018b
Figure 19. Distribution of velocity and streamlines in different planes within. wind tower’s column for: (ac) 0.1 m/s; (df) 1.5 m/s; and (gi) 4 m/s.
Energies 11 01100 g019aEnergies 11 01100 g019b
Figure 20. Distribution of total pressure in different planes within wind tower’s column for: (ac) 0.1 m/s; (df) 1.5 m/s; and (gi) 4 m/s.
Energies 11 01100 g020aEnergies 11 01100 g020b
Table 1. Characteristics of the proposed wind tower.
ParameterValue
1Inner radius of wind tower’s column0.35 m
2Outer radius of wind tower’s column0.65 m
3Height of wind tower’s column1.20 m
4Inner radius of wind tower’s head0.45 m
5Outer radius of wind tower’s head0.55 m
6Height of wind tower’s head0.90 m
7Height of curved roof0.15 m
8Percent of the air-inlet from the air openings33.33%
Table 2. Major assumptions used in the CFD simulation.
ParametersAssumption
ModelSolverPressure based
SpaceThree-dimensional Steady
TimeStandard k-ε
Turbulence model
Operating conditionsOperating pressure101 kPa
Gravitational acceleration−9.81 m/s2 in z-direction
MaterialAir-
DensityIdeal gas
Boundary conditionsInlet of the chamberVelocity inlet
Bottom of the chamberWall
Outlet of the chamberPressure outlet
Other walls of the chamberSymmetry
Wind tower wallsWall
Outlet of the wind towerPressure outlet
Evaporative cooling padPorous medium
Table 3. Outlet mass flow rate from the wind tower in different wind velocities.
Inlet Velocity (m/s)Outlet Mass Flow Rate (kg/s)
10.10.0105
21.50.1434
340.3864

