Article

Performance and Regulated/Unregulated Emission Evaluation of a Spark Ignition Engine Fueled with Acetone–Butanol–Ethanol and Gasoline Blends

1
School of Mechanical, Electronic and Control Engineering, Beijing Jiaotong University, Beijing 100044, China
2
Department of Mechanical Science and Engineering, University of Illinois at Urbana-Champaign, Champaign, IL 61801, USA
*
Author to whom correspondence should be addressed.
Energies 2018, 11(5), 1121; https://doi.org/10.3390/en11051121
Submission received: 10 April 2018 / Revised: 27 April 2018 / Accepted: 27 April 2018 / Published: 2 May 2018
(This article belongs to the Section A: Sustainable Energy)

Abstract

:
An experimental investigation was conducted on the effect of equivalence ratios and engine loads on performance and emission characteristics using acetone–butanol–ethanol (ABE) and gasoline blends. Gasoline blends with various ABE content (0 vol % to 80 vol % ABE, referred to as G100, ABE10, ABE20, ABE30, ABE60, and ABE80, respectively) were used as test fuels, where the volumetric concentration of A/B/E was 3:6:1. The experiments were conducted at engine loads of 3, 4, 5, and 6 bar brake mean effective pressure at an engine speed of 1200 rpm and under various equivalence ratios (φ = 0.83–1.25). The results showed that ABE addition in the fuel blends could increase brake thermal efficiency and decrease unburned hydrocarbon (UHC), carbon dioxide (CO), and oxynitride (NOx). As for unregulated emissions, acetaldehyde and 1,3-budatiene emissions increased with the increased ABE content in blend fuels. Regarding the aromatic emissions, ABE addition led to a decrease in benzene, toluene, and xylene emissions. The study indicated that ABE could be used as a promising alternative fuel in spark ignition (SI) engines for enhancing the brake thermal efficiency and reducing regulated emissions and aromatic air toxics.

1. Introduction

In recent years, with the worldwide energy crisis and environmental degradation, several studies have focused on utilizing renewable and environmentally friendly energy sources in internal combustion engines [1,2]. In order to increase combustibility, reduce emissions, and minimize the generation of volatile organic compounds, oxygenated additives in fuel blends are one of the possible solutions [3]. Biofuels are the most widely used oxygenated additives due to the resulting reduction of particulate matter (PM), carbon monoxide (CO), unburned hydrocarbon (UHC), sulfur dioxide (SO2), and polycyclic aromatic hydrocarbon (PAH) in internal combustion engines [4,5,6]. Among biofuels, bio-butanol, which is considered to a promising alternative fuel, has recently attracted increased attention [7,8,9,10,11]. Bio-butanol offers a number of advantages over ethanol, which is currently one of the most widely used alternative fuels [12,13]. Advantages include higher energy density and better miscibility with gasoline, and the fuel is less hydrophilic and corrosive, leading to better fuel economy and capability to blend with gasoline in a higher proportion without modifying the engine [14,15,16].
Typically, bio-butanol is produced via acetone–butanol–ethanol (ABE) fermentation from biomass feedstock. The main limitation of producing bio-butanol on a large scale is that the separation process of butanol from the ABE fermentation products requires extra energy consumption and thus increases manufacturing costs [17,18,19,20,21]. This issue has prompted researchers’ interests in the possibility of utilizing ABE directly as an alternative fuel in order to eliminate the costs of the separation process in bio-butanol production. Nithyanandan et al. [22,23] investigated the effects of ABE–gasoline blends on performance and emissions in a spark ignition (SI) engine, and found that ABE20 had a shorter ignition delay, and ABE40 showed decreased carbon monoxide (CO) but increased unburned hydrocarbons (UHCs) emissions. In addition, they [15,24] also investigated the impact on an SI engine of acetone addition to ABE gasoline blend fuels. Results indicated that acetone addition could benefit the combustion quality, and ABE (6:3:1) (component ratio of A/B/E is 6:3:1 by volume) had better thermal efficiency and lower CO and UHC emissions compared with ABE (3:6:1) and ABE (5:14:1). Zhou et al. [25,26] conducted an experimental investigation using a constant volume chamber on the impact of ABE–diesel fuel blends on combustion characteristics. They found that ABE20 (20 vol % ABE and 80% diesel) showed a longer ignition delay, almost no soot luminosity, and a better combustion efficiency than that of diesel. Wu et al. [27,28,29] investigated the combustion characteristics of different blend ratios of ABE and diesel in a constant volume chamber at different ambient temperatures, and found that ABE blends displayed a considerable reduction in soot emissions. In addition, they pointed out that ABE (6:3:1) indicated a stronger premixed combustion and a shorter combustion duration.
As for ABE emission behaviors, previous studies have mainly focused on regulated emissions. Only a few studies have investigated unregulated emissions of ABE and most of them mainly focused on polycyclic aromatic hydrocarbon (PAH) emissions using ABE–diesel blends [18,30]. There is a lack of information on the unregulated emissions of ABE–gasoline blend fuels as applied to an SI engine. Since unregulated emissions increase health risks for humans, such as increasing the probability of developing cancer or other health problems that cause severe damage to the immune, neurological, reproductive, and respiratory systems [31,32], the investigation of unregulated emissions is equally important. In order to fill in this gap, regulated and unregulated emissions of an SI port fuel injection (PFI) engine were investigated in this study under different engine loads and equivalence ratios, fueled with varying ABE content (0 vol %, 10 vol %, 20 vol %, 30 vol %, 60 vol %, and 80 vol % ABE referred to as G100, ABE10, ABE20, ABE30, ABE60, and ABE80) in ABE–gasoline fuel blends. Besides the regulated emissions (UHC, CO, NOx), some important unregulated emission compounds (including acetaldehyde, 1,3-butadiene, benzene, toluene, ethylbenzene, and xylene isomers, which are classified as air toxics by United States Environmental Protection Agency (USEPA) [33]) were also measured by gas chromatography coupled with a mass spectrometer (GC/MS) and gas chromatography with a flame ionization detector (GC/FID).

2. Experimental Setup

2.1. Fuel Preparation

Pure gasoline from Mobil with a research octane number of 92 was used as the baseline fuel (G100) in this study. The ABE mixture consisted of acetone, n-butanol, and ethanol, which were from Sigma Aldrich, and was prepared using acetone, butanol, and ethanol at a ratio of 3:6:1 by volume, since this ratio is the most common proportion of ABE from the fermentation process [34,35]. Next, different quantities of ABE were blended with gasoline (G100) to prepare ABE10 (10 vol % ABE, 90 vol % gasoline), ABE20, ABE30, ABE60, and ABE80, as shown in Table 1. A gravitational test was used for examining the stability of test fuels, and they were then deposited in test tubes for two weeks at 1 atm and 25 °C. The blends showed a clear single phase throughout the stability test.

2.2. Engine Setup

The engine used in this study was a single-cylinder PFI SI engine with identical cylinder geometry to that of a 2000 Ford Mustang Cobra V8 engine. The original V8 engine has 239 kW of peak power and 407 Nm of torque, resulting in the single-cylinder engine having 30 kW of peak power and 52 Nm of torque. The engine specifications are shown in Table 2. A GE type TLC-15 class 4-35-1700 dynamometer (GE, Boston, MA, USA) was connected to the engine and was controlled by a DyneSystems DYN-LOC IV controller. In addition, the throttle position was controlled by a DyneSystems DTC-1 digital throttle controller. A Kistler type 6125B pressure transducer and LabVIEW code were used for measuring and recording the in-cylinder pressure. A BEI XH25D shaft encoder (BEI, Thousand Oaks, CA, USA) was used for acquiring the crank angle position. The engine was controlled using a Megasquirt II V3.0 Engine Control Unit (ECU), which allowed adjustment of the fuel injection time, spark advance angle, and the air–fuel ratio (AFR). A Bosch injector # 0 280 150 558 (Bosch, Stuttgart, Germany) rated at 440 cm3/min at a fuel pressure of 3 bar was also used as the fuel injector. The measuring range, accuracy, and resolution of the main experimental apparatus are listed in Table 3. A schematic of the experimental setup is shown in Figure 1.

2.3. Emissions Analysis

The air/fuel ratio (AFR) and NOx emissions were measured using a Horiba MEXA-720 non-sampling type meter (Horiba, Irvine, CA, USA), and UHC and CO emissions were measured using a Horiba MEXA-554JU sampling type meter (Horiba, Irvine, CA, USA). The detailed measuring range, accuracy, and resolution of these emission analyzers are also shown in Table 3. As for the unregulated emissions, gas samples were analyzed using both a GC-MS and a GC-FID and were collected from the engine using an exhaust gas sampling collection device. The sampling unit consisted of a particulate filter, a sample-collecting tank, a six-port valve and a sampling loop, as well as a vacuum pump. All of the components were wrapped with temperature-controlled heating tape. The identification of the samples was performed using a gas chromatograph (GC 6890N, Agilent, Santa Clara, CA, USA) coupled with a mass spectrometer detector (MSD 5973N, Agilent, Santa Clara, CA, USA), and the quantification of the samples was performed using a gas chromatograph (GC 5890 series II, Hewlett Packard, Palo Alto, CA, USA) with a flame ionization detector (FID, Hewlett Packard, Palo Alto, CA, USA). The same capillary column (DB-1 123-1063E, Agilent, Santa Clara, CA, USA) and operational conditions were used for both GC-MS and GC-FID. Helium was used as the carrier gas at a flow rate of 1.2 mL/min, and other analysis parameters and details are presented in Table 4.

2.4. Test Conditions

In this study, the engine was operated at 1200 rpm under four different loads of 3, 4, 5, and 6 bar brake mean effective pressure (BMEP). Meanwhile, the equivalence ratio was varied over a range of lean, stoichiometric, and rich conditions, from 0.83 to 1.25. The run time for each case in the investigations was about 71 min, including 20 min for engine warming up, and 51 min for running the GC-MS and GC-FID analysis. Spark timing was set to each fuels’ maximum brake torque (MBT) timing (Table 5) in order to get maximum power as well as efficiency, the unit of spark timing is crank angle before top dead center (°CA BTDC). The tests were performed in a temperature-controlled laboratory, and test conditions are summarized in Table 6. Equivalence ratio and NOx were measured and averaged over a 60 s steady-state period, while UHC and CO were recorded directly from the emissions analyzer. For each test fuel, experiments were conducted three times and the datasets were averaged.

3. Results and Discussion

3.1. Engine Performance

Table 7 compares the brake thermal efficiency (BTE) and brake specific fuel consumption (BSFC) of all test fuels at stoichiometric conditions under different engine loads. BTE indicates the extent to which the fuel energy input is converted to net work output. ABE addition in the fuel blends mostly increased the BTE because the lower carbon numbers and higher oxygen content in ABE can enhance combustion quality. ABE20 shows the highest BTE among all test fuels under different engine loads. It is also observed that BTE increased with increasing engine load due to higher combustion temperature. As for the BSFC of test fuels, all of the ABE–gasoline blend fuels lead to an increase in fuel consumption under the same engine load, which can be explained by the lower heating value (LHV) of ABE blends as well as the fact that the stoichiometric AFRs of ABE are quite lower compared with those of gasoline. More fuel is needed to maintain the same power output. In addition, the BSFC of each test fuel decreased with increasing engine load due to the increased BTE.

3.2. Regulated Emissions

Regulated emissions including UHC, CO, and NOx were measured. The results of these regulated emissions for all test fuels at different loads and under various equivalence ratios are shown in Table 8 and Figure 2, respectively. The error bars in Figure 2 represent the error range (standard deviation among runs).
Table 8 shows the UHC emissions of different ABE blend ratios under various engine loads. ABE10 has the highest UHC emissions. However, as the ABE blend ratios keep increasing, the UHC emissions decrease, and ABE80 has the lowest emissions among all test fuels. In general, UHC emissions are affected by the quality of combustion. The higher oxygen content in ABE results in more complete combustion [37] and thus lowers the UHC emissions. However, a lower stoichiometric AFR of ABE requires more fuel to be injected, which could lead to an increase in UHC emissions. These competing factors could be the reasons for higher UHC emissions for ABE10 and lower UHC emissions for the other ABE blend fuels. Figure 2a shows the impact of the equivalence ratio on the UHC emissions of all test fuels. It was observed that UHC emissions increase under rich conditions due to the incomplete combustion and reduced combustion quality [38].
Table 8 and Figure 2b show the CO emissions of test fuels at different engine loads and equivalence ratios. Results indicate that with increasing content of ABE, CO emissions decrease first during relatively lower ABE content, and then increase after ABE30. ABE30 shows the lowest CO emissions; this is because the increased oxygen content in blends could enhance the oxidation of CO, thus lowering the CO emissions. However, for a higher blend ratio of ABE, ABE80 has the highest CO emission among the ABE blends, but still lower than that of gasoline. This could be explained by the higher alcohol content, which leads to a charge cooling effect and lowers the temperature, thus slowing down the postflame oxidation of CO emissions. Previous studies also showed higher CO emissions with higher ABE content due to a shorter combustion duration (higher laminar flame speed due to butanol addition), which also leads to a decrease in postflame CO oxidation [2,39,40,41]. It is also observed that CO emissions increased with increasing engine loads and equivalence ratios.
At stoichiometric conditions under different engine loads, ABE10 has higher NOx emissions than does gasoline, which can be seen in Table 8. However, when continuously increasing the ABE blend ratio, a decrease in NOx emissions could be found, and ABE60 has the lowest NOx emissions among the test fuels. The fuel-borne oxygen in ABE blends promotes NOx formation [42,43]; however, when the ABE blend ratio increases, the higher oxygen content could lower combustion temperature, and thus decrease NOx emissions. Figure 2c also shows the variation of NOx for the test fuels at different equivalence ratios. The highest NOx emissions are at φ = 0.9–1.0 due to the complete combustion attained in this equivalence ratio range.
Compared to the latest exhaust emission standards for spark ignition engines from United States Environmental Protection Agency (USEPA) [44], ABE60 and ABE80 have lower UHC emissions, ABE30 has lower CO emission, and all test fuels have slightly higher NOx emissions. It can be concluded that ABE addition could meet the USEPA emission standard of UHC and CO emissions.

3.3. Unregulated Emissions
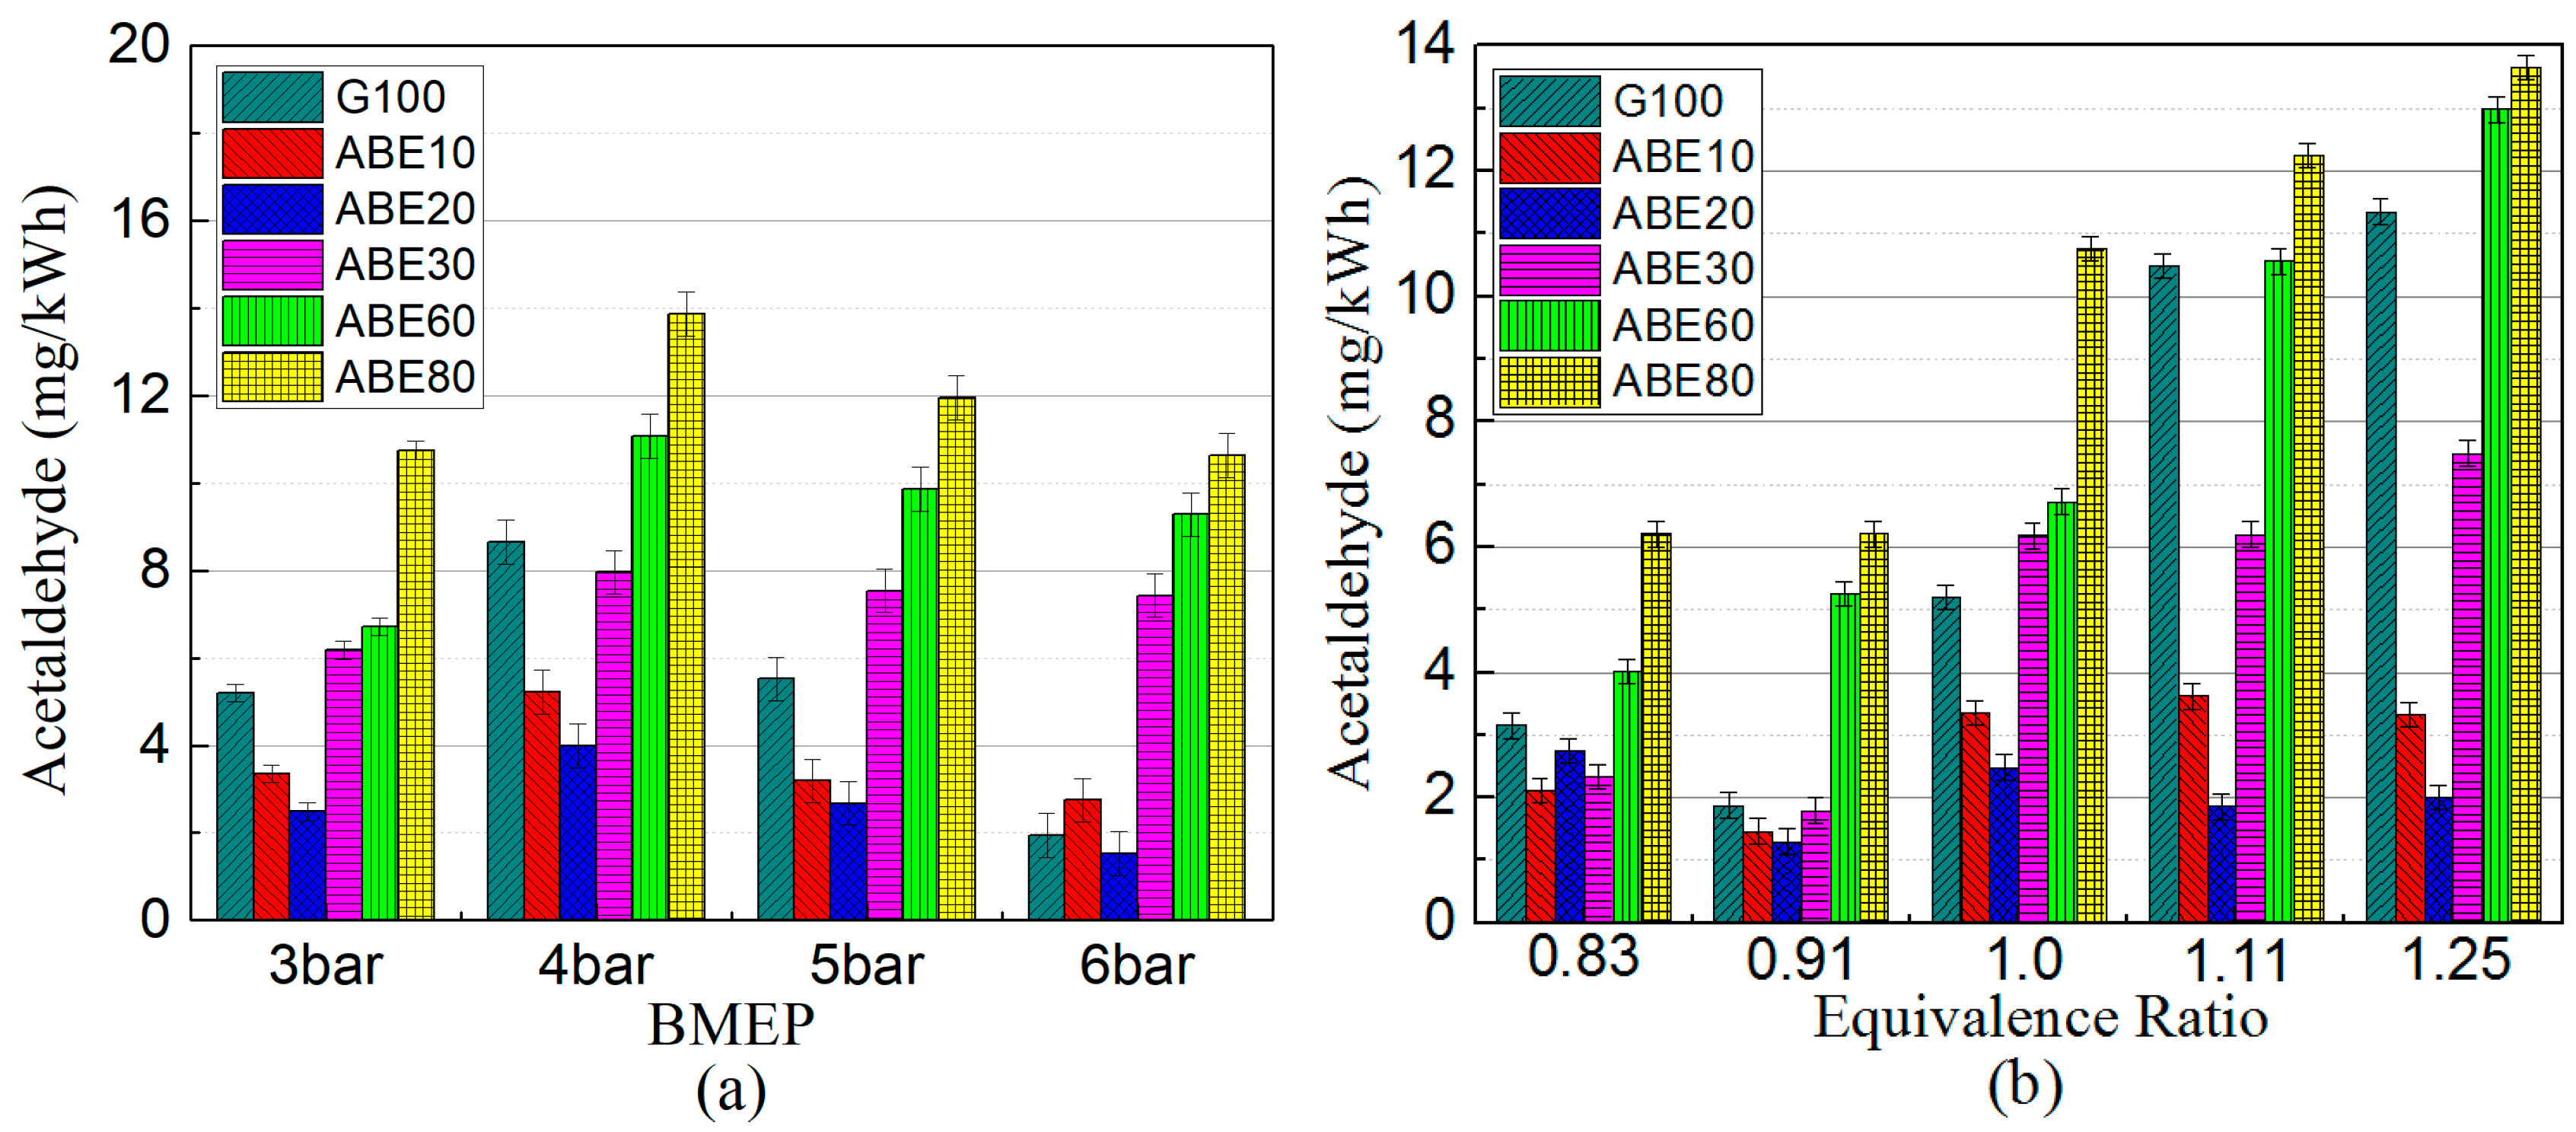
This section presents the concentrations of representative unregulated pollutant emissions emitted by burning different fuel blends. According to the results of previous studies [1,33,45,46,47,48], acetaldehyde, 1,3-butadiene, benzene, toluene, ethylbenzene, and xylene isomers (o-xylene, m-xylene, and p-xylene) were selected as target toxic emissions from the exhaust gas.
Because of the limitations in resolving the peaks in chromatography, the concentrations of m-xylene and p-xylene are shown as a total amount. In addition, due to the xylene isomers have similar mass spectra (MS of m/p-xylene and o-xylene are shown in Figure 3), these compounds need to be recognized based on both their mass spectra and retention time determined from the chromatogram. A chromatogram of these unregulated emissions is shown in Figure 4 and the retention times of these emissions are presented in Table 9. The concentration of each compound shown below is the average of three repeatable tests for each fuel. Due to the limitations in resolving the peaks in chromatography, the results of m-xylene and p-xylene have been shown as a sum of their concentrations. Figure 5, Figure 6, Figure 7, Figure 8, Figure 9, Figure 10 and Figure 11 below show the distributions of the target unregulated emissions using different tested fuel blends under various engine load and equivalence ratios. The error bars in Figure 5, Figure 6, Figure 7, Figure 8, Figure 9, Figure 10 and Figure 11 represent the error range (standard deviation among runs).

3.3.1. Acetaldehyde

Acetaldehyde is one of the most abundant aldehydes in exhaust emissions, and has been confirmed to pose a high risk to public health. The variation of acetaldehyde emissions with load (3 to 6 bar BMEP) at stoichiometric conditions is shown in Figure 5a. With the increase of the engine load, acetaldehyde emissions of each test fuel are firstly increased and then decrease at higher load. Previous studies revealed that acetaldehyde is formed under both relatively low temperatures and oxygen concentrations for the reason that the unburnt fuel slows down the decomposition process during the chemical reactions [49,50]. The increase in acetaldehyde emissions at relatively low load is due to the increased fuel consumption, but we see a decreasing trend at higher load, which could be attributed to the higher combustion temperature. This trend is also similar to that found in biodiesel investigations under different engine loads [33]. In addition, under constant engine load conditions, acetaldehyde emissions increase with increasing ABE content. Acetaldehyde can be produced by oxidation of hydrocarbons and is much easier to generate from the oxidation of ethanol [51]. In the case of butanol, acetaldehyde can also be formed through β -scission of aC4H8OH [52]. Previous studies have concluded that the addition of ethanol and butanol in fuel blends could cause higher acetaldehyde emissions [48,53,54]. Figure 5b presents the impact of the equivalence ratio on acetaldehyde emission for all test fuels. It can be seen that acetaldehyde emission increases under rich conditions. In addition, among all test fuels, ABE80 has the highest acetaldehyde emissions and ABE20 has the lowest acetaldehyde emissions under most equivalence ratios.

3.3.2. 1,3-Butadiene

1,3-Butadiene is generally regarded as one of the most harmful emissions due to its toxic and carcinogenic properties [55]. Figure 6a,b show the 1,3-butadiene emissions under different engine loads and different equivalence ratios, respectively. It can be seen that at the same conditions for all test fuels, 1,3-butadiene emissions increase with the increase of ABE content in the fuels. This is due to the lower stoichiometric AFR of ABE blends, which requires more fuel to be injected, thus leading to an increase in 1,3-butadiene emissions [33]. In contrast, when the engine load is increased, the 1,3-butadiene emissions of each fuel show a decreasing trend, and a similar trend is also observed with increasing equivalence ratio. Similar trends could also be observed in the study of alcohol and gasoline blends [56]. The formation of 1,3-butadiene emissions is closely related to the AFR and combustion temperature. The oxidation of the pyrolytic products could be promoted by a higher combustion temperature, higher engine load, and higher equivalence ratio [33].

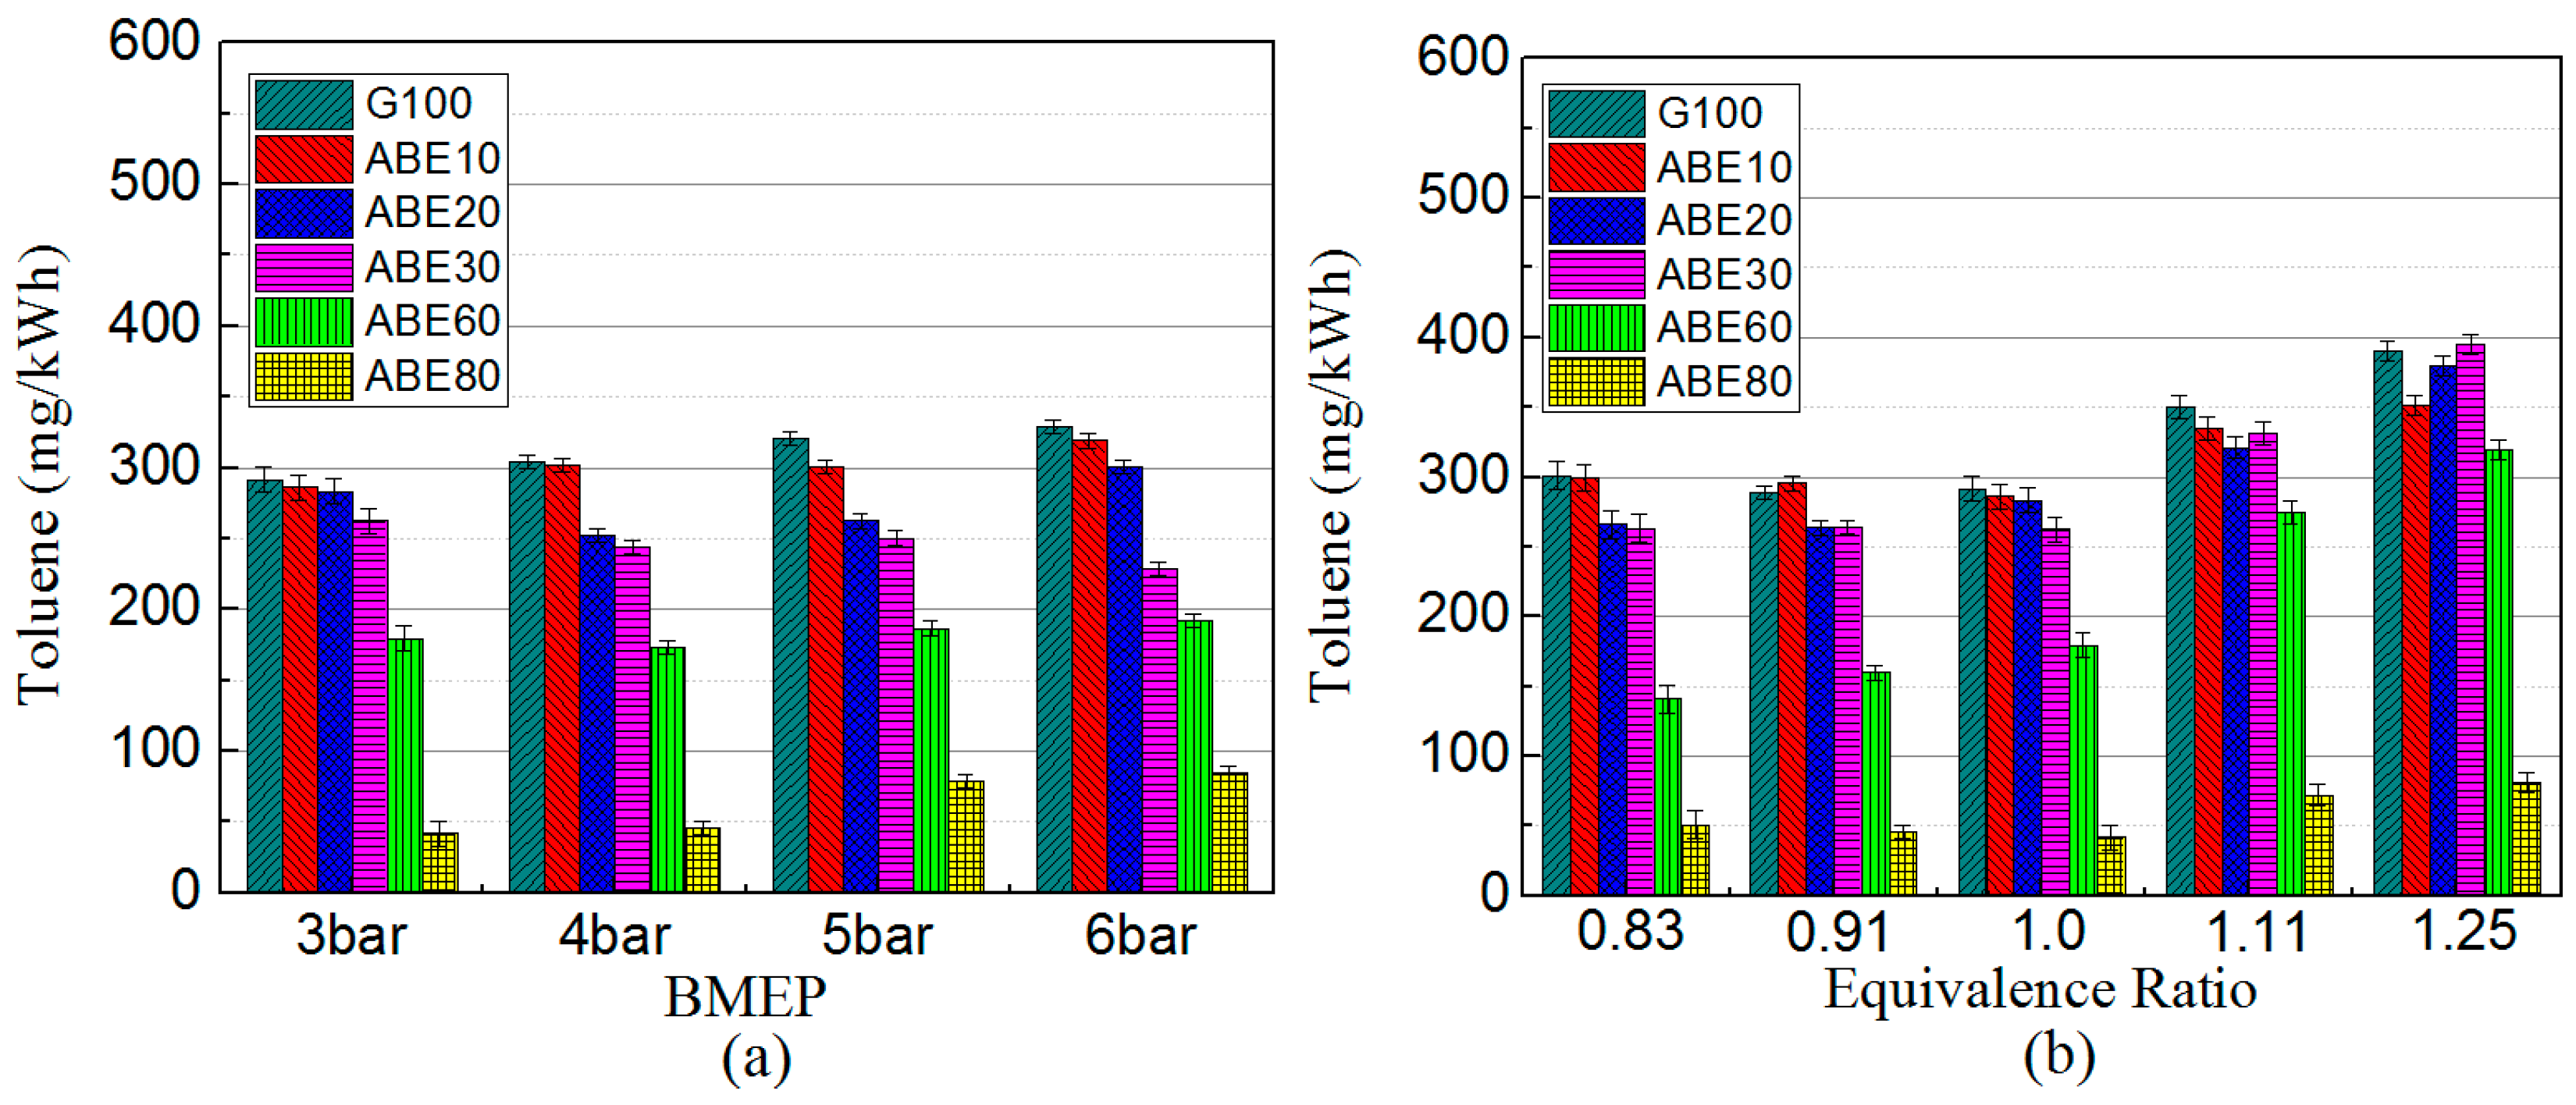
3.3.3. Benzene, Toluene, Ethylbenzene, and Xylene (BTEX) Emissions

The emissions of benzene, toluene, ethylbenzene, and xylene (BTEX), which are the most reactive volatile organic compounds, were measured. The major sources of BTEX emissions in internal combustion engines are from unburned fuel, structural modifications, and pyrosynthesis during the combustion process [57].
The formation of benzene emissions comes from both fuel-borne benzene in unburned fuel and the combustion process of other aromatic and nonaromatic compounds [58]. Figure 7a,b present the variation of benzene emissions under different engine loads and equivalence ratios. Benzene emissions decrease with increased engine load and with decreased equivalence ratio. In addition, benzene emissions also decrease with the increase of the ABE blend ratio under the same engine load. ABE80 has the lowest benzene emissions and ABE10 has the highest benzene emissions among these fuel blends. The benzene emissions of ethanol–gasoline blends with different blend ratios show similar behavior [48]. ABE increases the concentration of oxygen in the fuel blends, thus accelerating the transformation of carbon atoms into carbon dioxide, which leads to the reduction of benzene emissions. Therefore, it can be concluded that benzene emissions tend to increase under low temperature and to be reduced under oxygen-rich conditions.
Toluene shows the highest concentration among BTEX emissions for all test fuels. The trends of toluene emission as a representative species for aromatic emissions are shown in Figure 8a,b. A trend of reduced toluene emission with increasing amount of ABE in the blend can be observed. This is more likely caused by the reduction of aromatics in the fuel blends rather than changes in the fuel chemistry [59]. This trend of toluene emission is consistent with that of alcohol–gasoline blends [57]. In addition, a slight increase in the toluene emissions occurred with increasing engine load. As engine load is increased, the engine needs a proportional increase in fuel injection, resulting in an increase of toluene emissions. The same trend is also observed with increasing equivalence ratio.
Ethylbenzene emissions do not exhibit any significant differences under various engine loads and equivalence ratios in Figure 9a,b. However, under the same engine load, increases in ethylbenzene emission could be seen with ABE addition among ABE10, ABE20, and ABE30. Previous studies have found that the addition of ethanol or butanol in fuel blends could result in slightly higher ethylbenzene emission under low ethanol/butanol blend ratios [1,57]. ABE80 shows the lowest ethylbenzene emission, which is possibly due to the reduction of aromatics in the blend fuels. Figure 10 and Figure 11 present the xylene emissions under different engine loads and equivalence ratios. Similar to the ethylbenzene emission trends, there are no significant changes to the xylene emissions while varying load or equivalence ratio. However, when comparing different fuel blends at the same conditions, xylene emissions show a decreasing trend with increasing ABE blend ratio. The reduction in the xylene emissions can be explained by the same reasons suggested for toluene.
The overall reduction in BTEX emissions of ABE-containing blend fuels could be explained by their lower number of aromatic components and higher oxygen content. Additionally, a shorter ignition delay and combustion duration and a more complete volatilization of ABE-containing blends [23,24] led to cleaner burning, better performance, and, thus, reduced BTEX emissions.

4. Conclusions

This experimental investigation focused on the effects of ABE–gasoline blends on performance, regulated emissions, and unregulated emissions. The experiments were carried out using fuel blends with different ABE ratios and pure gasoline as a baseline for comparison. The fuel blends were tested at various engine loads and under various equivalence ratios.
For the engine performance, compared with pure gasoline, ABE addition to the fuel blends could increase the BTE and lead to an increase in fuel consumption. ABE20 shows the highest BTE among all test fuels under different engine loads.
For the regulated emissions, high ABE ratios in blends could reduce UHC emissions and medium ABE ratios in blends could decrease CO emission. ABE addition could slightly reduce NOx emissions in high blend ratios—ABE60 had the lowest NOx emissions compared to that of gasoline.
For the unregulated emissions, acetaldehyde and 1,3-butadiene emissions increased with increased ABE content in blends. As for BTEX emissions, ethylbenzene emissions did not exhibit any significant differences under various engine loads and equivalence ratios, but increased with increasing ABE ratio in blends. Toluene and xylene showed decreased trends with increasing engine load, whereas benzene showed an increased trend. Moreover, ABE addition led to reductions in benzene, toluene, and xylene emissions.
It can be concluded that even though blending ABE with gasoline could increase some unregulated emissions such as acetaldehyde and 1,3-butadiene, they could reduce UHC, CO, and NOx emissions, and decrease aromatic air toxics such as benzene, toluene, and xylene emissions as well. Therefore, ABE could be used as a promising alternative fuel in SI engines for enhancing the thermal efficiency and reducing regulated emissions and aromatic air toxics.

Author Contributions

All authors have cooperated for the preparation of the work. Yuanxu Li and Chia-fon F. Lee conceived and designed the experiments; Yuanxu Li, Zhi Ning and Junhao Yan performed the experiments and analyzed the data; Timothy H. Lee and Junhao Yan contributed to set up the electronic controller and instruments; Yuanxu Li, Zhi Ning and Timothy H. Lee wrote and revised the paper.

Acknowledgments

This work is supported by the National Natural Science Foundation of China (Grant No. 51776016, 51606006), Beijing Natural Science Foundation (Grant No. 3172025, 3182030), National Key Research and Development Program (Grant No. 2017YFB0103401), and the National Engineering Laboratory for Mobile Source Emission Control Technology (Grant No. NELMS2017A10). This work is also supported by the Department of Energy under Grant No. DE-EE0006864.

Conflicts of Interest

The authors declare no conflicts of interest.

Nomenclature

ABEacetone–butanol–ethanol
AFRair–fuel ratio
BMEPbrake mean effective pressure
BSFCbrake specific fuel consumption
BTDCbefore top dead center
BTEbrake thermal efficiency
BTEXbenzene toluene ethylbenzene xylene
CO carbon monoxide
ECUengine control unit
FIDflame ionization detector
GCgas chromatograph
LHVlower heating value
MBTmaximum brake torque
MS mass spectrometer
NOxnitrogen oxide
PAHpolycyclic aromatic hydrocarbon
PFIport fuel injection
RONresearch octane number
RPMrevolutions per minute
SIspark ignition
UHCunburned hydrocarbons
φequivalence ratio

References

  1. Karavalakis, G.; Short, D.; Vu, D.; Villela, M.; Asa-Awuku, A.; Durbin, T.D. Evaluating the regulated emissions, air toxics, ultrafine particles, and black carbon from SI-PFI and SI-DI vehicles operating on different ethanol and iso-butanol blends. Fuel 2014, 128, 410–421. [Google Scholar] [CrossRef]
  2. Gu, X.; Huang, Z.; Cai, J.; Gong, J.; Wu, X.; Lee, C.-F. Emission characteristics of a spark-ignition engine fuelled with gasoline-n-butanol blends in combination with EGR. Fuel 2012, 93, 611–617. [Google Scholar] [CrossRef]
  3. Manzetti, S.; Andersen, O. A review of emission products from bioethanol and its blends with gasoline. Background for new guidelines for emission control. Fuel 2015, 140, 293–301. [Google Scholar] [CrossRef]
  4. Xue, J.; Grift, T.E.; Hansen, A.C. Effect of biodiesel on engine performances and emissions. Renew. Sustain. Energy Rev. 2011, 15, 1098–1116. [Google Scholar] [CrossRef]
  5. Dwivedi, D.; Agarwal, A.K.; Sharma, M. Particulate emission characterization of a biodiesel vs diesel-fuelled compression ignition transport engine: A comparative study. Atmos. Environ. 2006, 40, 5586–5595. [Google Scholar] [CrossRef]
  6. Di, Y.; Cheung, C.S.; Huang, Z. Experimental investigation on regulated and unregulated emissions of a diesel engine fueled with ultra-low sulfur diesel fuel blended with biodiesel from waste cooking oil. Sci. Total Environ. 2009, 44, 55–63. [Google Scholar] [CrossRef] [PubMed]
  7. Elfasakhany, A. Experimental investigation on SI engine using gasoline and a hybrid iso-butanol/gasoline fuel. Energy Convers. Manag. 2015, 95, 398–405. [Google Scholar] [CrossRef]
  8. Galloni, E.; Fontana, G.; Staccone, S.; Scala, F. Performance analyses of a spark-ignition engine firing with gasoline–butanol blends at partial load operation. Energy Convers. Manag. 2016, 110, 319–326. [Google Scholar] [CrossRef]
  9. Elfasakhany, A. Experimental study on emissions and performance of an internal combustion engine fueled with gasoline and gasoline/n-butanol blends. Energy Convers. Manag. 2014, 88, 277–283. [Google Scholar] [CrossRef]
  10. Szwaja, S.; Naber, J. Combustion of n-butanol in a spark-ignition IC engine. Fuel 2010, 89, 1573–1582. [Google Scholar] [CrossRef]
  11. Merola, S.S.; Valentino, G.; Tornatore, C.; Marchitto, L. In-cylinder spectroscopic measurements of knocking combustion in a SI engine fuelled with butanol–gasoline blend. Energy 2013, 62, 150–161. [Google Scholar] [CrossRef]
  12. Niven, R.K. Ethanol in gasoline: Environmental impacts and sustainability review article. Renew. Sustain. Energy Rev. 2005, 9, 535–555. [Google Scholar] [CrossRef]
  13. Al-Hasan, M. Effect of ethanol–unleaded gasoline blends on engine performance and exhaust emission. Energy Convers. Manag. 2003, 44, 1547–1561. [Google Scholar] [CrossRef]
  14. Jin, C.; Yao, M.; Liu, H.; Chia-fon, F.L.; Ji, J. Progress in the production and application of n-butanol as a biofuel. Renew. Sustain. Energy Rev. 2011, 15, 4080–4106. [Google Scholar] [CrossRef]
  15. Nithyanandan, K.; Zhang, J.; Li, Y.; Wu, H.; Lee, T.H.; Lin, Y. Improved SI engine efficiency using acetone–butanol–ethanol (ABE). Fuel 2016, 174, 333–343. [Google Scholar] [CrossRef]
  16. Tao, L.; Tan, E.C.; McCormick, R.; Zhang, M.; Aden, A.; He, X. Techno-economic analysis and life-cycle assessment of cellulosic isobutanol and comparison with cellulosic ethanol and n-butanol. Biofuels Bioprod. Biorefin. 2014, 8, 30–48. [Google Scholar] [CrossRef]
  17. He, B.-Q.; Liu, M.-B.; Yuan, J.; Zhao, H. Combustion and emission characteristics of a HCCI engine fuelled with n-butanol–gasoline blends. Fuel 2013, 108, 668–674. [Google Scholar] [CrossRef]
  18. Chang, Y.-C.; Lee, W.-J.; Lin, S.-L.; Wang, L.-C. Green energy: Water-containing acetone–butanol–ethanol diesel blends fueled in diesel engines. Appl. Energy 2013, 109, 182–191. [Google Scholar] [CrossRef]
  19. Jang, Y.-S.; Malaviya, A.; Cho, C.; Lee, J.; Lee, S.Y. Butanol production from renewable biomass by clostridia. Bioresour. Technol. 2012, 123, 653–663. [Google Scholar] [CrossRef] [PubMed]
  20. Qureshi, N.; Hughes, S.; Maddox, I.; Cotta, M. Energy-efficient recovery of butanol from model solutions and fermentation broth by adsorption. Bioprocess Biosyst. Eng. 2005, 27, 215–222. [Google Scholar] [CrossRef] [PubMed]
  21. Afschar, A.; Biebl, H.; Schaller, K.; Schügerl, K. Production of acetone and butanol by Clostridium acetobutylicum in continuous culture with cell recycle. Appl. Microbiol. Biotechnol. 1985, 22, 394–398. [Google Scholar] [CrossRef]
  22. Nithyanandan, K.; Chia-fon, F.L.; Wu, H.; Zhang, J. Performance and emissions of acetone-butanol-ethanol (ABE) and gasoline blends in a port fuel injected spark ignition engine. In ASME 2014 Internal Combustion Engine Division Fall Technical Conference; American Society of Mechanical Engineers: New York, NY, USA, 2014. [Google Scholar]
  23. Nithyanandan, K.; Wu, H.; Huo, M.; Lee, C.-F. A Preliminary Investigation of the Performance and Emissions of a Port-Fuel Injected SI Engine Fueled with Acetone-Butanol-Ethanol (ABE) and Gasoline. SAE Tech. Pap. 2014. [Google Scholar] [CrossRef]
  24. Nithyanandan, K.; Zhang, J.; Yuqiang, L.; Wu, H.; Lee, C.-F. Investigating the Impact of Acetone on the Performance and Emissions of Acetone-Butanol-Ethanol (ABE) and Gasoline Blends in an SI Engine. SAE Tech. Pap. 2015. [Google Scholar] [CrossRef]
  25. Zhou, N.; Huo, M.; Wu, H.; Nithyanandan, K.; Chia-fon, F.L.; Wang, Q. Low temperature spray combustion of acetone–butanol–ethanol (ABE) and diesel blends. Appl. Energy 2014, 117, 104–115. [Google Scholar] [CrossRef]
  26. Zhou, N.; Wu, H.; Lee, C.-F.; Wang, Q.; Huo, M.; Wang, P. Different Percentage of Acetone-Butanol-Ethanol (ABE) and Diesel Blends at Low Temperature Condition in a Constant Volume Chamber. SAE Tech. Pap. 2014. [Google Scholar] [CrossRef]
  27. Wu, H.; Huo, M.; Zhou, N.; Nithyanandan, K.; Lee, C.-F.; Zhang, C. An Experimental Investigation of the Combustion Characteristics of Acetone-Butanol-Ethanol-Diesel Blends with Different ABE Component Ratios in a Constant Volume Chamber. SAE Tech. Pap. 2014. [CrossRef]
  28. Wu, H.; Nithyanandan, K.; Li, B.; Lee, T.H.; Chia-fon, F.L.; Zhang, C. Investigation on Spray and Soot Lift-Off Length of an ABE-Diesel Blend in a Constant Volume Chamber With Diesel Engine Conditions. In ASME 2014 Internal Combustion Engine Division Fall Technical Conference; American Society of Mechanical Engineers: New York, NY, USA, 2014. [Google Scholar]
  29. Wu, H.; Nithyanandan, K.; Zhou, N.; Lee, T.H.; Chia-fon, F.L.; Zhang, C. Impacts of acetone on the spray combustion of Acetone–Butanol–Ethanol (ABE)-Diesel blends under low ambient temperature. Fuel 2015, 142, 109–116. [Google Scholar] [CrossRef]
  30. Chang, Y.-C.; Lee, W.-J.; Wu, T.S.; Wu, C.-Y.; Chen, S.-J. Use of water containing acetone–butanol–ethanol for NO x-PM (nitrogen oxide-particulate matter) trade-off in the diesel engine fueled with biodiesel. Energy 2014, 64, 678–687. [Google Scholar] [CrossRef]
  31. Morello-Frosch, R.; Jesdale, B.M. Separate and unequal: Residential segregation and estimated cancer risks associated with ambient air toxics in US metropolitan areas. Environ. Health Perspect. 2006, 144, 386–393. [Google Scholar] [CrossRef]
  32. Windham, G.C.; Zhang, L.; Gunier, R.; Croen, L.A.; Grether, J.K. Autism spectrum disorders in relation to distribution of hazardous air pollutants in the San Francisco Bay area. Environ. Health Perspect. 2006, 114, 1438–1444. [Google Scholar] [CrossRef] [PubMed]
  33. Man, X.; Cheung, C.; Ning, Z.; Wei, L.; Huang, Z. Influence of engine load and speed on regulated and unregulated emissions of a diesel engine fueled with diesel fuel blended with waste cooking oil biodiesel. Fuel 2016, 180, 41–49. [Google Scholar] [CrossRef]
  34. Liu, F.; Liu, L.; Feng, X. Separation of acetone–butanol–ethanol (ABE) from dilute aqueous solutions by pervaporation. Sep. Purif. Technol. 2005, 42, 273–282. [Google Scholar] [CrossRef]
  35. García, V.; Päkkilä, J.; Ojamo, H.; Muurinen, E.; Keiski, R.L. Challenges in biobutanol production: How to improve the efficiency? Renew. Sustain. Energy Rev. 2011, 15, 964–980. [Google Scholar] [CrossRef]
  36. Li, Y.; Nithyanandan, K.; Lee, T.H.; Donahue, R.M.; Lin, Y.; Lee, C.-F. Effect of water-containing acetone–butanol–ethanol gasoline blends on combustion, performance, and emissions characteristics of a spark-ignition engine. Energy Convers. Manag. 2016, 117, 21–30. [Google Scholar] [CrossRef]
  37. Zouaoui, N.; Brilhac, J.; Mechati, F.; Jeguirim, M.; Djellouli, B.; Gilot, P. Study of experimental and theoretical procedures when using thermogravimetric analysis to determine kinetic parameters of carbon black oxidation. J. Therm. Anal. Calorim. 2010, 102, 837–849. [Google Scholar] [CrossRef]
  38. Heywood, J.B. Pollutant formation and control in spark-ignition engines. Prog. Energy Combust. 1976, 1, 135–164. [Google Scholar] [CrossRef]
  39. Nakata, K.; Utsumi, S.; Ota, A.; Kawatake, K.; Kawai, T.; Tsunooka, T. The effect of ethanol fuel on a spark ignition engine. SAE Tech. Pap. 2006. [Google Scholar] [CrossRef]
  40. Can, Ö.; Celikten, I.; Usta, N. Effects of ethanol addition on performance and emissions of a turbocharged indirect injection Diesel engine running at different injection pressures. Energy Convers. Manag. 2004, 45, 2429–2440. [Google Scholar] [CrossRef]
  41. Zhang, J.; Nithyanandan, K.; Li, Y.; Lee, C.-F.; Huang, Z. Comparative study of high-alcohol-content gasoline blends in an SI engine. SAE Tech. Pap. 2015. [Google Scholar] [CrossRef]
  42. Najafi, G.; Ghobadian, B.; Tavakoli, T.; Buttsworth, D.; Yusaf, T.; Faizollahnejad, M. Performance and exhaust emissions of a gasoline engine with ethanol blended gasoline fuels using artificial neural network. Appl. Energy 2009, 86, 630–639. [Google Scholar] [CrossRef]
  43. Zhuang, Y.; Hong, G. Primary investigation to leveraging effect of using ethanol fuel on reducing gasoline fuel consumption. Fuel 2013, 105, 425–431. [Google Scholar] [CrossRef]
  44. EPA Emission Standards Reference Guide; USEPA: Washington, DC, USA, 2017.
  45. Jia, L.-W.; Shen, M.-Q.; Wang, J.; Lin, M.-Q. Influence of ethanol–gasoline blended fuel on emission characteristics from a four-stroke motorcycle engine. J. Hazard. Mater. 2005, 123, 29–34. [Google Scholar] [CrossRef] [PubMed]
  46. Tsai, J.-H.; Chiang, H.-L.; Hsu, Y.-C.; Weng, H.-C.; Yang, C.-Y. The speciation of volatile organic compounds (VOCs) from motorcycle engine exhaust at different driving modes. Atmos. Environ. 2003, 37, 2485–2496. [Google Scholar] [CrossRef]
  47. Yao, Y.-C.; Tsai, J.-H.; Wang, I.-T. Emissions of gaseous pollutant from motorcycle powered by ethanol–gasoline blend. Appl. Energy 2013, 102, 93–100. [Google Scholar] [CrossRef]
  48. Karavalakis, G.; Durbin, T.D.; Shrivastava, M.; Zheng, Z.; Villela, M.; Jung, H. Impacts of ethanol fuel level on emissions of regulated and unregulated pollutants from a fleet of gasoline light-duty vehicles. Fuel 2012, 93, 549–558. [Google Scholar] [CrossRef]
  49. Liu, Y.-Y.; Lin, T.-C.; Wang, Y.-J.; Ho, W.-L. Carbonyl compounds and toxicity assessments of emissions from a diesel engine running on biodiesels. J. Air Waste Manag. 2009, 59, 163–171. [Google Scholar] [CrossRef] [PubMed]
  50. Zarante, P.; Costa, T.; Sodré, J. Aldehyde emissions from an ethanol-fuelled spark ignition engine: Simulation and FTIR measurements. Blucher Chem. Eng. Proc. 2015, 1, 7738–7745. [Google Scholar]
  51. Liu, F.; Liu, P.; Zhu, Z.; Wei, Y.; Liu, S. Regulated and unregulated emissions from a spark-ignition engine fuelled with low-blend ethanol–gasoline mixtures. Proc. Inst. Mech. Eng. Part D J. Automob. Eng. 2012, 226, 517–528. [Google Scholar] [CrossRef]
  52. Broustail, G.; Halter, F.; Seers, P.; Moréac, G.; Mounaim-Rousselle, C. Comparison of regulated and non-regulated pollutants with iso-octane/butanol and iso-octane/ethanol blends in a port-fuel injection spark-ignition engine. Fuel 2012, 94, 251–261. [Google Scholar] [CrossRef]
  53. Schifter, I.; Diaz, L.; Rodriguez, R.; Salazar, L. Oxygenated transportation fuels. Evaluation of properties and emission performance in light-duty vehicles in Mexico. Fuel 2011, 90, 779–788. [Google Scholar] [CrossRef]
  54. Yanowitz, J.; Knoll, K.; Kemper, J.; Luecke, J.; McCormick, R.L. Impact of adaptation on flex-fuel vehicle emissions when fueled with E40. Environ. Sci. Technol. 2013, 47, 2990–2997. [Google Scholar] [CrossRef] [PubMed]
  55. Krahl, J.; Munack, A.; Schröder, O.; Stein, H.; Bünger, J. Influence of biodiesel and different designed diesel fuels on the exhaust gas emissions and health effects. SAE Tech. Pap. 2003. [CrossRef]
  56. Wallner, T.; Frazee, R. Study of Regulated and Non-Regulated Emissions from Combustion of Gasoline, Alcohol Fuels and their Blends in a DI-SI Engine. SAE Tech. Pap. 2010. [Google Scholar] [CrossRef]
  57. Correa, S.M.; Arbilla, G. Aromatic hydrocarbons emissions in diesel and biodiesel exhaust. Atmos. Environ. 2006, 40, 6821–6826. [Google Scholar] [CrossRef]
  58. Zervas, E.; Montagne, X.; Lahaye, J. Influence of fuel and air/fuel equivalence ratio on the emission of hydrocarbons from a SI engine. 1. Experimental findings. Fuel 2004, 83, 2301–2311. [Google Scholar] [CrossRef]
  59. Kar, K.; Cheng, W.K. Speciated engine-out organic gas emissions from a PFI-SI engine operating on ethanol/gasoline mixtures. SAE Int. J. Fuels Lubr. 2009, 2, 91–101. [Google Scholar] [CrossRef]
Figure 1. Schematic of the engine test bench.
Energies 11 01121 g001
Figure 2. Regulated emissions of (a) UHC, (b) CO and (c) NOx at 3 bar BMEP under different equivalence ratios.
Energies 11 01121 g002
Figure 3. Mass spectrometry of m-xylene and p-xylene (a) and o-xylene (b).
Energies 11 01121 g003
Figure 4. Chromatogram of exhaust gas.
Energies 11 01121 g004
Figure 5. Acetaldehyde emissions at (a) stoichiometric conditions under different BMEPs, and at (b) 3 bar BMEP under different equivalence ratios.
Energies 11 01121 g005
Figure 6. 1,3-Butadiene emissions at (a) stoichiometric conditions under different BMEP, and at (b) 3 bar BMEP under different equivalence ratios.
Energies 11 01121 g006
Figure 7. Benzene emissions at (a) stoichiometric conditions under different BMEP, and at (b) 3 bar BMEP under different equivalence ratios.
Energies 11 01121 g007
Figure 8. Toluene emissions at (a) stoichiometric conditions under different BMEP, and at (b) 3 bar BMEP under different equivalence ratios.
Energies 11 01121 g008
Figure 9. Ethylbenzene emissions at (a) stoichiometric conditions under different BMEP, and at (b) 3 bar BMEP under different equivalence ratios.
Energies 11 01121 g009
Figure 10. m+p-Xylene emissions at (a) stoichiometric conditions under different BMEP, and at (b) 3 bar BMEP under different equivalence ratios.
Energies 11 01121 g010
Figure 11. o-Xylene emissions at (a) stoichiometric conditions under different BMEP, and at (b) 3 bar BMEP under different equivalence ratios.
Energies 11 01121 g011
Table 1. Properties of the test fuels [15,36].
ParametersGasolineAcetoneButanolEthanol
Chemical FormulaC4–C12C3H6OC4H9OHC2H5OH
Oxygen Content (wt %)027.621.634.8
Lower Heating Value (MJ/kg)43.429.633.126.8
Density (kg/m3)730791813795
Energy Density (MJ/l)31.6823.3826.9121.31
Research Octane Number 9211787100
Boiling Temperature (°C)38–20456.211878
Latent Heat at 298 K (kJ/kg)380–500518582904
Auto-Ignition Temperature (°C)228–470465343420
Stoichiometric Air/Fuel Ratio14.79.511.29.0
Laminar Flame Speed (cm/s)33–44344848
Table 2. Engine specifications.
Displaced volume (cm3)575
Stroke (mm)90.1
Bore (mm)90.3
Connecting rod length (mm)150.7
Compression ratio9.6:1
Number of valves4
Number of cylinders1
Fuel injectionPort Fuel Injection
Table 3. Measuring range, accuracy, and resolution of main experimental apparatus.
ApparatusMeasuring RangeAccuracy (±)ResolutionRepeatability Uncertainty (±)
Dynamometer torque0–55 Nm0.5%0.1 Nm0.8%
Dynamometer speed0–4500 rpm0.2%1 rpm0.4%
Pressure transducer0–25,000 kPa0.4%1 kPa0.5%
Shaft encoder0–30000 rpm0.5 bit12 bit0.3%
Lambda 0.65–13.70.3%0.011.0%
CO emission0–10% Vol0.06%0.01% Vol1.2%
Hydrocarbon emission0–10,000 ppm Vol12 ppm Vol1 ppm Vol2.4%
NOx emission0–5000 ppm3%1 ppm1.5%
Table 4. Analysis parameters of GC-MS and GC-FID.
GC-MSGC-FID
ApparatusAgilentHewlett Packard
GC 6890N-MSD 5973NGC 5890 series II-FID
ColumnDB-1DB-1
Length60 m60 m
Internal diameter0.32 mm0.32 mm
Carrier gasHeliumHelium
Injector temperature300 °C300 °C
Detector temperatureMS Quad: 150 °C
MS Source: 230 °C
300 °C
Separation conditionsInitial: 160 °C for 2 min
160 °C–210 °C with 5 min/°C
Final: 210 °C for 5 min
Initial: 160 °C for 2 min
160 °C–210 °C with 5 min/°C
Final: 210 °C for 5 min
Table 5. Maximum brake torque (MBT) of all test fuels.
BMEP (bar)3 4 5 6
Gasoline (°CA BTDC)19232425
ABE10 (°CA BTDC)18.822.924.124.8
ABE20 (°CA BTDC)18.522.723.624.9
ABE30 (°CA BTDC)18.222.623.524.4
ABE60 (°CA BTDC)18.322.723.224.5
ABE80 (°CA BTDC)18.122.523.124.6
Table 6. Test conditions.
Engine speed (rpm)1200
Load (bar BMEP) 3, 4, 5, and 6
Equivalence ratio0.83~1.25
Spark timingEach fuel’s MBT
Fuel injection pressure300 kPa
Table 7. BTE and BSFC of test fuels at different engine loads.
Load3 Bar BMEP4 Bar BMEP5 Bar BMEP6 Bar BMEP
BTE (%)BSFC (g/kWh)BTE (%)BSFC (g/kWh)BTE (%)BSFC (g/kWh)BTE (%)BSFC (g/kWh)
G10020.45399.7322.71365.3223.01360.5223.42346.82
ABE1020.83410.5422.99372.0123.59362.4823.66361.44
ABE2021.02419.7923.57383.7623.86380.3223.99367.86
ABE3020.74438.4023.12385.7023.66386.2523.74384.23
ABE6020.61485.8123.03444.6323.48419.1123.71431.12
ABE8020.56556.6522.95498.6923.29491.3923.67483.67
Table 8. Regulated emissions of test fuels at φ = 1 under different engine loads.
Load3 Bar BMEP4 Bar BMEP5 Bar BMEP6 Bar BMEP
Regulated Emissions (g/kWh)UHCCONOxUHCCONOxUHCCONOxUHCCONOx
G1004.3232.9513.744.7332.8512.974.7437.12 12.754.3543.5612.78
ABE105.2323.8515.575.0924.4115.534.9428.45 16.234.8431.2016.11
ABE204.1623.3713.743.7822.8412.614.0327.28 12.683.6729.5113.77
ABE303.9919.2414.493.6621.3312.503.5427.1112.553.6127.1513.27
ABE602.9729.5812.802.3029.2812.451.9230.18 12.061.7632.5013.10
ABE801.7936.2613.511.5932.4912.551.5232.94 14.611.3734.0813.89
Table 9. Retention time for unregulated emissions.
CompoundRetention Time (min)
1,3-Butadiene2.804 ± 0.001
Benzene3.150 ± 0.001
Toluene3.426 ± 0.001
Acetaldehyde3.648 ± 0.001
Ethylbenzene3.829 ± 0.001
m-xylene and p-xylene3.869 ± 0.001
o-xylene4.024 ± 0.001

