1. Background
Higher Education Institutions (HEI) are key components of education systems across the globe, transcending international borders, socio-political regimes, and economic systems [
1]. The Higher Education (HE) sector of the United Kingdom plays a vital role in the country’s economy with an economic contribution of £39.9 billion per year [
2]. But, on the other hand, because of its increasing energy demand, the HE sector is responsible for considerable environmental pollution. In 2005/06, the sector emitted nearly 2.15 million tonnes of Carbon Dioxide (CO
2) emissions [
3].
Owing to the significance of this matter, the HE Funding Council for England (HEFCE), in 2010, published its Carbon Reduction Target and Strategy for the HE sector. This document aims to reduce carbon emissions in HE by linking carbon to capital funding. It further develops a carbon reduction strategy by setting a carbon reduction target of 43% for 2020 from a 2005/06 baseline. Institutions are required to produce carbon plans and to demonstrate progress against those plans [
4].
Figure 1 shows the sector’s carbon emissions since 2005/06. It is apparent that carbon emissions were increasing till 2009/10, but after introduction of the HE sector’s carbon reduction targets of 43% in 2010, the emissions started decreasing and were observed as being 19% lower in 2015/16 when compared to the base year’s emissions. This decreasing trend is the result of installation of renewable and clean energy technologies by the universities and energy efficiency initiatives. However, yet, the current average annual rate of decrease in emissions is 1.9%, which clearly suggests that the sector, despite its solid carbon reduction initiatives, will be missing its 2020 target of 43% by a big margin [
5].
Grid electricity and natural gas are the two main sources for sector’s carbon emissions, with a share of 63% and 33.3%, respectively [
6]. This suggests that offsetting the grid electricity through onsite electricity generation using a clean and reliable alternative technology could result in significant carbon savings.
HEIs approach to achieving this target is to identify and to implement carbon reduction projects that maximize both the direct (financial) and indirect benefits, whilst minimizing the capital and operational costs. Through these carbon reduction projects, universities are investigating a number of renewable and clean energy technologies such as solar, wind, heat pump, and Combined Heat and Power (CHP). CHP is the simultaneous generation of usable heat and power (usually electricity) in a single process [
7]. Electricity is generated on or close to the end user’s site, allowing capturing and using the resulting waste heat for site applications [
8]. A comparison between CHP and a conventional heat and power system is shown in
Figure 2. It is apparent that a CHP offers higher efficiency with an overall efficiency of 80% as compared to a 55% overall efficiency of a typical gas power plant.
The HE sector of United Kingdom is comprised of about 161 universities. The sector offers strong potential for renewable and clean technologies. In 2014-15, the share of renewable technologies towards the sector’s total energy consumption was found to be 0.49% only. Among these, energy that was generated from biomass, wind, and solar PV was 63%, 18%, and 11%, respectively, whereas, the remaining 7% was generated from other renewable resources, such as biofuels. On the other hand, the CHP plants (usually categorized as clean technology) met 13% energy demand of the sector in 2014-15, which is 3.1% higher when compared to 2011-12. Towards the end of 2011, 49 out of 161 universities had installed CHP systems. This number jumped to 67 in 2015/16, showing universities great interest in this technology. In 2015-16, CHP systems generated 33% more energy when compared to 2008-09 figures [
10].
Figure 3 shows an annual increase in the sector’s CHP energy generation.
This gradual increase in yearly energy generation from CHP systems could be attributed to the increased number of CHP installations in the universities.
Table 1 shows the top eleven universities in terms of CHP energy generation. It is apparent that the University of Liverpool generated the highest CHP energy with a share of 14% with the University of Edinburgh and the University of Birmingham at second and third positions, with shares of 11% and 10%, respectively. Top five universities generated 50% of the sector’s total CHP energy generation.
Yet, there are 95 universities in the UK where CHP technology has not been installed. This clearly demonstrates that despite its higher efficiency and the higher carbon savings potential, the CHP technology may not be feasible for some university campuses based on numerous barriers. Such barriers were identified by Amber and Parkin [
11] through a questionnaire that was sent to the energy managers of the UK universities. Among these, the top barrier identified were the site constraints, such as buildings sensitivity, low energy demands, and complex infrastructure. These site constraints will be different in almost all cases, and may strongly influence the optimum sizing of CHP system. For example, the existing electrical and mechanical infrastructure should be studied thoroughly in order to make sure that electrical and mechanical integration of CHP will be feasible and it will not trouble the existing system and the building operation. Other constraints may include buildings sensitivity, building material, and access to the plant room and switch room, and the availability of space inside the plant room and switch room. Building’s sensitivity here is referred to the sensitive nature of the activities taking place, e.g., medical research centers where electricity supply cannot be switched off, even for a shorter period of time due to the sensitive nature of activities taking place inside. Such buildings may have good thermal and electrical demands, but due to their sensitivity, CHP integration in such buildings may not be allowed by the University’s management.
It is of great importance that CHP’s feasibility must be completed after taking into account all such site constraints that could affect the economics of the project. Therefore, a detailed techno, economic, and environmental assessment based on such site constraints is indispensable, which should help the decision makers in making an appropriate decision [
12]. In most cases, such assessment is done by the consultancy firms that charge a handsome amount for this crucial activity. The output of this feasibility study strongly depends on the professional expertise and the resources of the consultancy firm.
For a CHP project to be an economical option for the university, building(s) energy demands play the vital role [
13]. Buildings with high and year-round electrical and thermal demands offer strong potential for CHP installation [
14]. Another key factor that could affect the economic feasibility of a CHP scheme is the spark gap. Spark gap is the difference between the electricity and natural gas tariff. The higher the spark gap, the higher financial savings could be expected from the CHP plant, thus making it an economically viable option [
15]. A spark gap of three or more is usually desired for a CHP project to be economical [
16]. The capital cost of the project is also a dominant factor that could affect a project’s economic feasibility based on the site constraints discussed earlier [
17].
Owing to the significance of this subject, this study aims to highlight the importance of such crucial factors by undertaking a detailed technical, economic, and environmental feasibility of CHP for a university campus that was located in London, UK. It is anticipated this study will be helpful for the building services engineers in understating the direct and indirect effect of variety of site constraints on the economics of a CHP project. Methodology and results of this study are presented in detail in
Section 2.
Section 3 shows the conclusions of the study.
2. Methodology
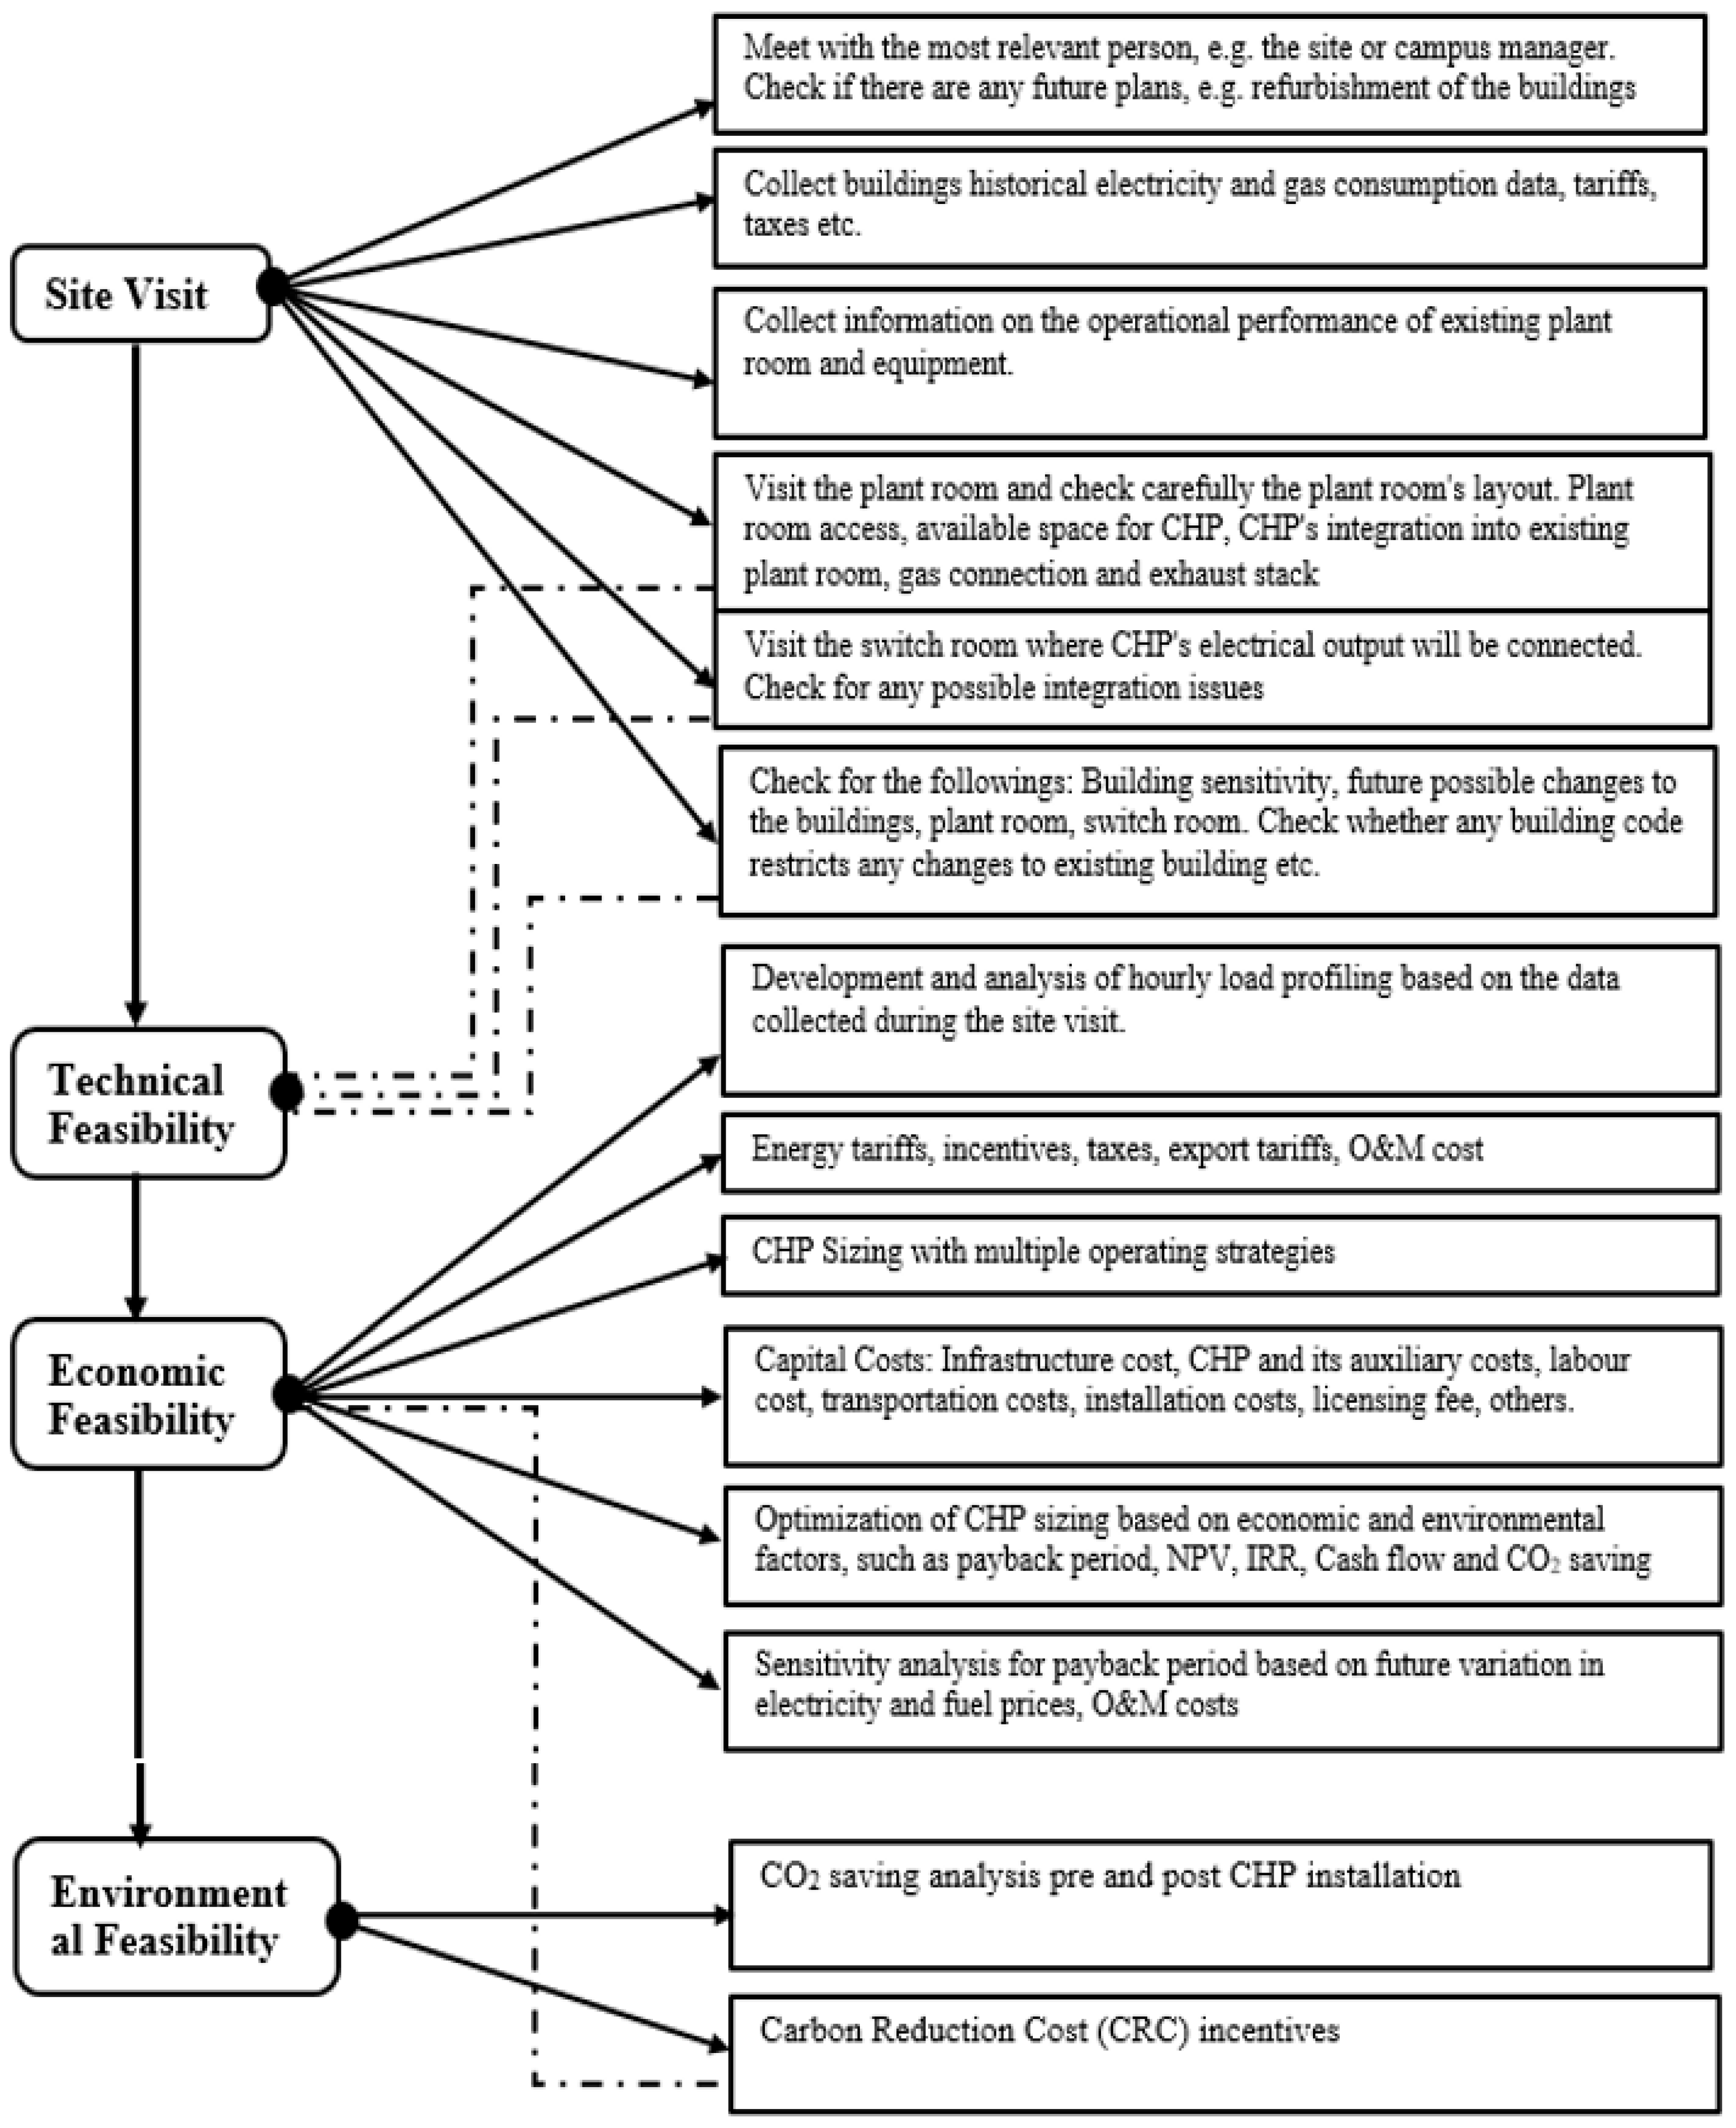
Figure 4 demonstrates the methodology that was adopted while performing this study.
First step is the site visit. A comprehensive site visit could be helpful in the collection of the required energy consumption data, information about different buildings, plant rooms, and switch rooms. Secondly, the site visit could help in understanding any possible future changes to the buildings, any site constraints that could affect the technical and economic feasibility of CHP. Different factors such as very high sensitive building or asbestos in the building fabric etc. may not allow the shutdown of the building’s supply for even a shorter period of time, thus not allowing CHP installation. Other factors, such as unavailability of space for CHP inside the plant room, difficult access for CHP connection to the plant room, under rated capacity of existing gas connection, longer distance between CHP, and buildings’ switch room could cause additional infrastructure costs that would lead to a higher capital cost of the project and could adversely affect the economic feasibility of the CHP. It is, therefore, desired that all such factors and their associated financial effect must be investigated during the site visit.
2.1. Site Details—The University Campus
The site to be investigated for the CHP’s feasibility is the Charterhouse Square Campus of the Queen Mary University of London (QMUL). With nearly 17,140 students and 4000 staff, QMUL is a member of the Russell Group of leading British research universities. The University’s Carbon Management and Implementation Plan was approved by Council in April 2011 and identified that the baseline carbon emissions (2005/6) were 24,255 t/CO2. Because of its charity status, QMUL is exempted from the Climate Change Levy (CCL) tax on its utilities.
2.2. Site Visit and Technical Feasibility of CHP
During the site visit of the campus, data and information were collected from the office of the site manager. Plant rooms and switch rooms of the buildings were visited and the necessary notes were made. The site manager was interviewed about the possible opportunity of a CHP plant inside the existing plant room. The Charterhouse Square campus of QMUL is situated in London and it is shown in
Figure 5.
The campus mainly includes one student accommodation (Building-B) and four research oriented buildings, i.e., (Buildings-A, C, D and E). Buildings sensitivity was discussed with the site manager who confirmed that buildings have resilience to allow for the installation of a CHP plant.
Building-B is a student residence hall with 209 single rooms. The central plant room is located in the basement of this building and it provides heating and hot water to buildings B, D and E via a mini district heating scheme. Supply and return hot water pipes run through a tunnel between Building-B and Building-E.
Table 2 shows the life and the area of these buildings. It is obvious that buildings A, B and E are very old with age >50 years, whereas buildings C and D are relatively new. Area wise, buildings B and E are the major buildings in the campus.
2.2.1. Plant Room Details and Layout
The plant room is situated in the basement on the east end of the Building-B. The details of different plant equipment are given in
Table 3.
2.2.2. Installation of CHP Inside Plant Room
At current, there are four boilers altogether that can deliver 4900 kWth of thermal supply at any time. Analysis of hourly thermal demand profile will demonstrate whether this plant is over-sized or not. The site manager confirmed that he has never witnessed three boilers running together, and that the plant is oversized. Maintenance issues have been reported with boiler number 2, and its tubes have been inspected recently. Boiler number 1, 2 and 3 share a single flue stack, whereas boiler number 4 has its own dedicated flue stack. The gas meter serving the plant room has a maximum capacity of 4.95 MW and could easily meet the requirements of a CHP plant. It was observed that there is no free space available inside the plant room for any additional equipment or for any maintenance purpose. However, if one or two boilers are removed, there will be adequate space for a CHP plant. This would certainly involve additional cost. There are a number of advantages of installing CHP in place of boiler number 4. These include:
- (a)
no planning permission will be required;
- (b)
easy thermal connection to return header;
- (c)
low infrastructure cost;
- (d)
no separate gas connection is required;
- (e)
easy BMS connection with CHP plant;
- (f)
no noise to the neighboring residential flats; and,
- (g)
no visual impact.
2.2.3. Thermal Connection of CHP with the Existing Infrastructure
CHP could be installed inside the plant room provided at least one boiler, i.e., boiler number 4 is removed. Thermal output of the CHP will be connected to the return header. CHP will act as a lead boiler and will meet the maximum thermal demands of the connected buildings.
2.2.4. Electrical Connection of CHP with the Existing Infrastructure
Ideally, CHP should be connected to a switch room where electricity demand is maximum when compared to other buildings. Building-B’s switch room is very old and there are plans to upgrade it in future. Further, its electricity demand is less than building-E, which offers an opportunity for CHP’s electrical connection. However, the switch room of building-E located in its basement is about 200 m away from the central plant room, i.e., CHP’s proposed place of installation. This will add the electrical cabling cost. Compliance to the Government’s regulation G59 will be ensured for a safe connection. G59 is a regulation that is in place to ensure the safe connection of generator devices that run in parallel with grid electricity. This regulation ensures that no CHP can be connected in parallel to the national grid without the knowledge and permission of the local electricity authority, and it will disconnect from the grid in the case of any power cut to ensure safety [
18].
Through the multiple site visits, it was found there exists no serious threat to the installation of a CHP in the campus. This confirmed the technical viability of the CHP plant.
2.3. Analysis of Energy Consumption Data
The data collected during site visit was critically analysed. It was found that the Charterhouse Square campus currently consumes 18% of the total annual energy consumption of the QMUL and emits 4900 t/CO
2 per year. Data was transformed into hourly electricity and thermal profiles as for a reliable feasibility of a CHP plant, it is very important to have real hourly electricity and thermal demand profiles. Use of estimated hourly profiles might lead to an under-sized or over-sized CHP plant [
19].
2.3.1. Thermal Demand Profile
In 2010, the existing boiler plant room of Building-B consumed 4.19 GWh of gas. This plant supplies heating and hot water to buildings B, D, and E through a mini district heating scheme, and therefore, thermal demand profile is an aggregated profile of buildings B, D and E. Hourly thermal demand profiles were developed using the hourly gas consumption data considering a boiler efficiency of 78%.
Figure 6 shows hourly thermal demand profiles for four seasons, i.e., winter, spring, summer, and autumn. It is apparent that the thermal demand is higher during the winter due to higher heating and hot water demands, and it is lower in the summer as there is only hot water demand. The profiles further suggest that peak thermal demand occurs at 4:00 a.m. when the boilers are started via the Building Management System (BMS). Base thermal demand during the night remains at above 400 kW in winter and drops to 180 kW during summer. The maximum thermal demand at any time during the whole year never goes beyond 675 kWth. This fact is further confirmed by looking at the thermal load duration curve, as shown in
Figure 7.
This clearly demonstrates that this boiler plant is massively over-sized, being almost six times greater than the required size. The profiles further suggest that only one boiler of 1500 kW can easily meet the whole thermal demand of these buildings. This finding was discussed with the site manager who confirmed that he has never seen all of the boilers running together.
This analysis of hourly thermal profiles confirms that there is a strong opportunity to remove boiler number 3 and 4 to provide space for an optimum sized CHP plant. The removal of these two boilers will provide space for a CHP plant and space that is required for its maintenance. With the remaining two boilers, the plant room will have sufficient resilience and capacity to meet the thermal demands of the buildings. Further analysis for CHP feasibility has been done by considering that the CHP plant will be installed inside the plant room in place of boiler number 4, whereas the area that is covered by boiler 3 will be used for maintenance purpose.
2.3.2. Electricity Demand Profile
As CHP’s electrical output can be connected only to a single Low Voltage (LV) supply, it is therefore, recommended to connect CHP with the building having highest electricity consumption. This way a bigger CHP could be sized for higher financial savings. In our case, Building-E has the highest electricity consumption demand, and therefore, electricity consumption demand profile of this building has been considered for the CHP’s connection. The LV switch room of Building-E is located in the building’s basement, and it is 200 m from the main plant room in Building-B. The annual electricity consumption through this switch room is 3 GWh, i.e., nearly double to the electricity consumption at Building-B switch room. The electricity consumption data of the Building-E electricity meter was critically analyzed and was converted into hourly profiles.
Figure 8 shows the hourly demand profile of this building for four different seasons.
Figure 8 demonstrates that the electricity demand starts increasing at 4:00 a.m. when BMS kicks on the boilers. Electrical load further increases when the buildings open at 7:00 a.m. With the arrival of staff and students, load further increases and reaches to peak load demand at 9:00 a.m. due to lighting and IT equipment coming online. It then remains constant until 2:00 p.m. Load demand starts decreasing at 2:00 p.m. until the buildings are closed at 10:00 p.m. The base load over the night period remains constant until 4:00 a.m. This is mainly because of the lighting, air handling units, and extract fans running during this period. At any time in the year, the base electrical load remains above 275 kW. This is further confirmed by looking at the electrical load duration curve, as shown in
Figure 9.
2.4. Economic Feasibility of CHP
First task towards the economic feasibility of a CHP project is the calculation of the optimum size of a CHP plant for the campus.
2.4.1. CHP Sizing
CHP sizing is the main critical component of the economic feasibility study. Ideally, the CHP plant should be sized to operate at maximum continuous rating for a minimum of 5000 h per year in order to maximize return on investment, and maximize the carbon dioxide emission benefits [
20]. CHP sizing is generally performed using a computer-based CHP sizing model. Such a tool needs to be easy to use, but with a full range of characteristics. A model with limited features could result in an under sized or oversized CHP scheme that could lead to a complete failure of the project. For the purpose of this study, we have used the London South Bank University (LSBU) CHP model that was developed by Amber, 2013 as a part of his PhD thesis. The development of the model is fully described in Amber (2013) [
21,
22]. It is a spreadsheet-based model developed in Microsoft Excel
®. Its prime features include its simplicity and ability to model CHP for a single or multiple buildings. User can select a CHP plant size (kWe) to see the technical, financial, and environmental results. The model automatically generates a comparison table for different sizes of CHP plants in terms of capital investment, net savings, payback period, Net Present Value (NPV), Internal Rate of Return (IRR), annual running hours, and CO
2 emissions savings [
22]. This approach makes it very easier for the user to identify and pick up the optimum size of the CHP plant. For finding the optimum size of the CHP, hourly profiles were fed into the LSBU CHP model.
2.4.2. Results of CHP Sizing Exercise
The LSBU model results show that an electricity led gas fired reciprocating engine type CHP of 230 kW electrical output with 304 kW thermal output is an optimum size for this campus. The parasitic load of this CHP is 13 kW which means it will only deliver 215 kW of electricity when running at full load. Electrical efficiency at 100%, 75% and 50% load are 32%, 30% and 29%, respectively, whereas thermal efficiency at 100%, 75% and 50% are 42%, 44% and 49%, respectively. CHP will modulate according to the electricity demand of the building and will generate 1412 MWh of electricity and 1944 MWh of useable heat. It will save £51k per year and it will result in a CO2 emissions reduction of 395 t/CO2.
Figure 10 presents the monthly variation in the gas consumption before and after the installation of 230 kW CHP.
It is apparent that the site’s annual gas consumption will increase by 53%. This increase in the gas consumption is due to the fact that the CHP plant will be running as the lead boiler and it will consume 75% of the future annual gas consumption, whereas boilers will consume only 25%, as shown in
Figure 10. The CHP plant will run as lead boiler and it will meet a higher proportion of the thermal demand of campus buildings. Boilers 1 and 2 will run to only top up supply to the buildings. In terms of thermal demand, the model results show that there will be some excess heat from the CHP plant during the summer months, as the demand during summer drops lower than CHP thermal output, as shown in
Figure 11.
This excess heat could be used for a heat-driven absorption chilling plant that will extend the base load heat demand into the summer months, and thus will increase the running hours of CHP during these months. Absorption chillers use far less electricity than the conventional equivalents and avoid the use of greenhouse or ozone depleting gases. In terms of its electricity generation, the CHP plant will meet 47% of the Building-E’s switch room electricity demand. The CHP plant will not generate any excess electricity and it will modulate in the case that the demand goes below the maximum electrical output. Electricity demand profile that is shown earlier in
Figure 8 suggests that a CHP of size less than the base electrical load (i.e., 275 kW) will run 24/7 at full load, as its electrical capacity is less than the base load. Grid reliance will be reduced by 47%, resulting in an annual saving of £111k in electricity costs. Monthly electricity generation contribution of CHP is shown in
Figure 12.
2.4.3. Environmental Savings
In terms of environmental savings, the CHP model calculates hourly CO2 emissions using a carbon factor 0.541 kg/kWh for electricity and 0.194 kg/kWh for natural gas. The results show that installation of 230 kW CHP will save 395 tonnes of CO2 for this University campus, which is a 16% reduction in current emissions level.
2.4.4. Economic Feasibility Parameters
For performing the economic viability of CHP, the following inputs were fed to the LSBU CHP model, as shown in
Table 4.
2.4.5. Capital Cost Analysis
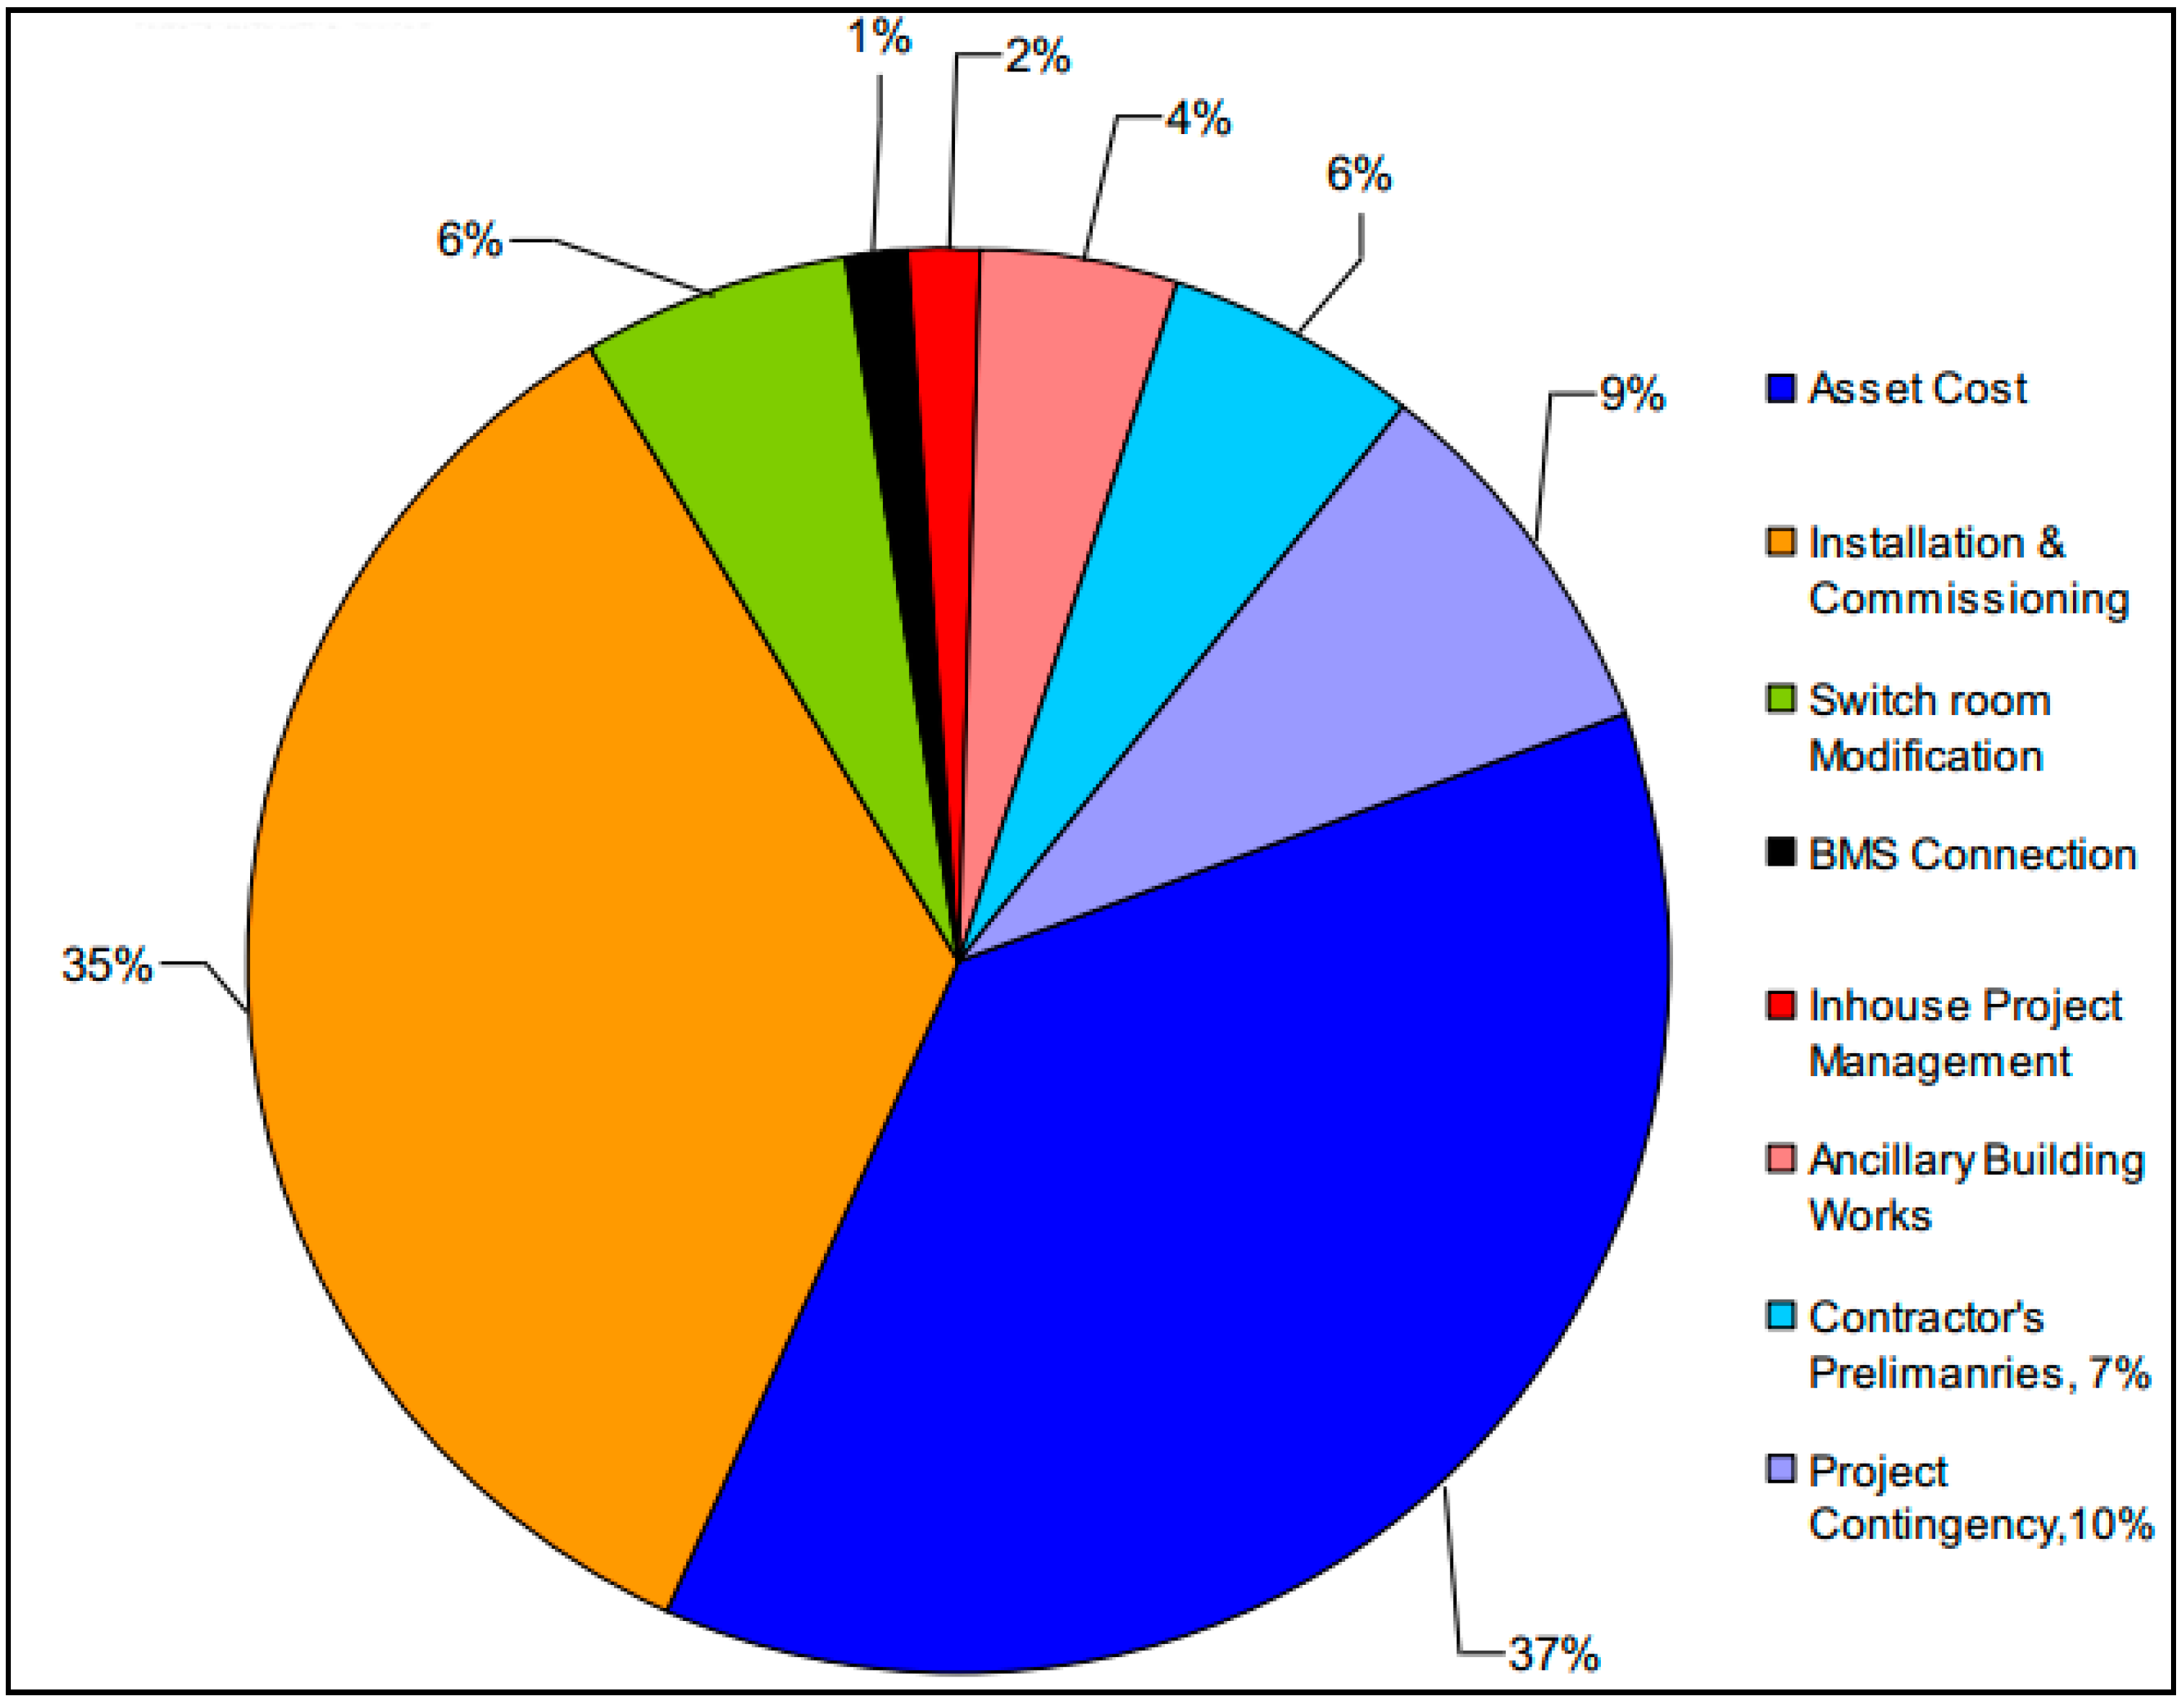
The capital cost of a CHP project is a crucial factor and it plays a vital role in the project’s economics. It is of great importance that the capital cost should include all of the possible costs that the project will incur. For a good estimate of capital cost (CC), meetings were arranged with one of the leading CHP supplier. After multiple visits of the site along with their engineer, a final estimate of the capital cost of the project was made which was £403,000, including Value-Added Tax (VAT) charges. The breakdown of this estimate is shown in
Figure 13. It could be seen that installation and commissioning cost has a second highest share (35%) after the CHP cost, i.e., 37%. This higher installation cost includes all of the modifications to be made in the plant room and switch room. For example, removal of two boilers from the plant room was recommended and this certainly added cost.
2.4.6. Results of Economic Feasibility
Table 5 presents the results of the economic feasibility of the 230 kW CHP for the Charterhouse Square campus of QMUL. It is apparent that the installation of a 230 kW CHP at the Charterhouse Square campus of QMUL will result in a gross and net savings of £66,057 and £51k, respectively. With the current electricity and gas tariffs, the payback period is 7.86 years.
The Net Present Value (NPV) and the Internal Rate of Return (IRR) for this project have been calculated with a weighted average cost of capital (WACC) of 5% and a project life of 10 years—the recommended expected lifespan of this size of the CHP plant. The NPV is calculated to be close to £82k and the IRR is estimated at 9%.
The results of economic feasibility clearly suggest that the installation of a 230 kW CHP is an economical option for the campus, which will not only reduce the grid dependence but will increase the reliability of energy supply and will generate financial and environmental savings.
2.4.7. Sensitivity Analysis of Payback Period
Financial risk is considered as one of the main barriers for investing in energy-efficient technologies [
23]. One of such possible risk is uncertainties of electricity and gas prices [
24]. Wickart and Madlener [
25] found that, under higher price volatility levels, a CHP system offers more profit than a conventional generation plant. Spark gap, which is the difference between electricity and gas price, is therefore an important factor for the economics of the CHP plant. The LSBU CHP model automatically performs a sensitivity analysis for the payback period of the CHP project with different variations in the electricity and gas prices (range: −10% to +30%) in order to check the economic feasibility of CHP.
Figure 14 shows the sensitivity analysis for the optimum sized CHP, i.e., 230 kW.
X-axis shows the variation in gas price, Y-axis shows the payback period, whereas the variation in electricity price is shown by different bars, e.g., green bar represents +30% variation in the electricity price. It is apparent that with the current prices, the payback period is 7.86 years.
The sensitivity analysis shows that if electricity price and gas price increase by 30% and 20% respectively, the payback period of this CHP project will become 5.7 years. This means as long as electricity price increases, the economics of CHP project will become better and better.


