Portuguese Plan for Promoting Efficiency of Electricity End-Use: Policy, Methodology and Consumer Participation


1
School of Technology of Setúbal, Polytechnic Institute of Setúbal, 2910-761 Setúbal, Portugal
2
INESC Coimbra, Pólo II, R. Silvio Lima, 3030-290 Coimbra, Portugal
3
Department of Electrical and Computer Engineering, Pólo II University of Coimbra, 3030-290 Coimbra, Portugal
*
Author to whom correspondence should be addressed.
Energies 2018, 11(5), 1137; https://doi.org/10.3390/en11051137
Submission received: 26 February 2018
/
Revised: 4 April 2018
/
Accepted: 25 April 2018
/
Published: 3 May 2018
(This article belongs to the Special Issue Selected Papers from SDEWES 2017: The 12th Conference on Sustainable Development of Energy, Water and Environment Systems)
Abstract
:The Portuguese Electricity Demand-Side Efficiency Promotion Plan (PPEC) is a voluntary financial mechanism, under which several entities, among them electric utilities, may submit proposals of measures aiming at the reduction of electricity consumption or load management. It is one of the alternative options followed by the Portuguese government to the Energy Efficiency Obligations (EEO) stated in Article 7 of the EU Energy Efficiency Directive. A brief review is presented of the state of the implementation of Article 7 in EU. PPEC is one of the schemes that provide financial support to the implementation of measures whose results contribute to the commitments made under the Portuguese National Energy Efficiency Action Plan (NEEAP), the framework under which the alternatives to the EEO were designed. In the first edition of the PPEC, only three energy services were addressed, while, in the most recent PPEC edition, the sixth, measures addressed nine energy services. In addition, the co-funding by participating consumers and other agents has increased, raising the investment in energy efficiency from actors other than the program administrator. PPEC, although a voluntary mechanism, has proven to be a very competitive one, involving an increasing number of economic agents, measures and addressed energy services.
1. Introduction
On the grounds of Article 7 of the Energy Efficiency Directive (EED), several European Union Member States (MS) have adopted Energy Efficiency Obligations (EEO) [1]. EEO require that energy companies meet a savings target of 1.5% of annual sales to final consumers. However, an alternative was available for MS to fulfill their energy savings obligations. This was the road Portugal decided to follow. Among the policy measures taken to achieve the savings target is the Electricity Demand-Side Efficiency Promotion Plan (PPEC), a voluntary mechanism. Portugal has been implementing PPEC, with a track record of six calls for proposals for energy efficiency measures, since 2007. Under this mechanism, several entities, among them electric utilities, may submit proposals of measures that contribute to the reduction of electricity consumption or load management measures. Load management measures are those that allow a reduction of the costs of supply, without necessarily involving the reduction of energy consumption, namely the transfer of consumption from peak to off-peak hours. The proposed measures are evaluated according to a set of criteria, and the best performing ones are selected to be financed with funds raised from all electric energy ratepayers. Several changes to the regulations have been done over the years. Some of the changes were setting mandatory contribution of beneficiaries to the cost of the measures, setting maximum funding limits, and also setting criteria to assess the contribution of the measures to the national energy policy, among others. The number of participating actors has been increasing, as has also the total projected cost of the candidate measures. In the last PPEC edition, the total cost of the proposed measures accounted to 63 million euros, almost three times the available budget. This trajectory of the program implementation represents a source of data and relevant information on the role played by voluntary mechanisms in the involvement of electric utilities in the promotion of energy efficiency at the end-use.
One of the purposes of this paper is to highlight the role of the PPEC mechanism in the national energy policy and in the Portuguese commitments with the EU. Furthermore, light will be shed on how the participation in the program has been evolving, highlighting the energy services addressed, the sharing of the costs of the measures among the different agents, the evolution of the program administrator and societal costs of each saved kWh and the expected investments. Following a previous study regarding the Portuguese decision on the Article 7 of the EED that was presented at the 2015 ECEEE Summer Study [2], the authors intention was to assess how influential PPEC, as an example of a voluntary program, shows to be on several market agents’ behaviors.
2. Energy Efficiency Mechanisms
In 2017, the International Energy Agency (IEA) published the report “Market-based Instruments for Energy Efficiency: Policy Choice and Design [3], which aimed at the characterization of energy efficiency instruments, such as energy efficiency obligations on utilities and white certificate programs. The study was requested by G7 countries at the Kitakyushu Energy Ministerial Meeting in 2016. MBI were defined as “MBIs for energy efficiency set a policy framework specifying the outcome (e.g., energy savings, cost-effectiveness) to be delivered by market actors, without prescribing the delivery mechanisms and the measures to be used” [3]. Fifty-two MBIs were studied with focus on energy savings and on investment costs. Some of the MBI are mandatory (energy efficiency obligations, white certificates, and energy efficiency resource standards) and others are voluntary (auctions or tendering programs). Regarding the mandatory schemes, 46 where found: 24 in the United States, 12 in Europe (Austria, Bulgaria, Denmark, France, Ireland, Italy, Luxemburg, Malta Poland, Slovenia, Spain, and United Kingdom), four in Australia, and one each in Canada, China, Brazil, Uruguay, Korea, and South Africa. By the time the study was done, three European countries were about to adopt EEO: Croatia, Greece and Latvia. Regarding non-mandatory involvement, auctions, six mechanisms were found, four of them in Europe: United Kingdom, Germany, Switzerland, and Portugal. In the United Kingdom, the voluntary scheme is a capacity market but, due to its design, does not support energy efficiency projects.
A 2017 update of the EEO in Europe [4] found out that Greece and Latvia had already started their EEO; that Malta was preparing an important revision of its obligations mechanism; Lithuania decided to adopt voluntary agreements; and Estonia was not imposing obligations, under the Article 7 of the EED.
The Swiss tender mechanism is managed by the Swiss Federal Office of energy and has been in place since 2010 [5]. The competition is launched annually and both projects and programs can compete for funds. For projects, and since 2015, there are two rounds each year. Projects are energy efficiency measures submitted by the beneficiary. On the other hand, projects are submitted and implemented by intermediaries, entities not directly beneficiaries of the measures. Projects and programs do not compete for the same budget. The budget available has been increasing from 5.5 million Euros, in 2010, to 41 million Euros in 2016. Over the six editions, about 93 million euros were awarded by this scheme. Since the funds come from a levy on the electricity grid, only measures addressing electricity uses can compete for funds. From 2010 to 2015, pumps and circulators received 21.4% of the budget, and lighting, electric motors and water heat pumps have shares of from 9.4% to 8.6%. In fact, an important part of the funds goes to a small number of technologies. In Switzerland, a project can only receive support of up to 40% of the investment cost [3]. The size of the projects must be between 18,000 Euros and 1.8 million Euros (from USD 20,000 to USD 2,060,000) and the programs between 130,000 Euros and 2.8 million Euros (USD 150,000 to USD 3,090,000).
The German mechanism that started in 2016 has two tenders: an “open” tender and a “close” tender [3]. “Specific” measures are those addressing a specific sector, beneficiary or technology, and compete in the close tender. In the open tender compete “neutral” measures, those measures that can be technology- or sector-neutral. The technologies must have a life time of at least ten years to be eligible. The mechanism is financed through the German Energy Efficiency Fund, partly funded by revenues from the EU Emissions Trading system. The available budget to fund electricity related measures was of EUR 50 million in 2016, EUR 100 million in 2017 and 150 million in 2018. A measure can only receive funds of up to 30% of the additional costs of the measure. Additional costs are the difference between the cost of the proposed technology and the cost of the market standard one. A project must have the best cost–benefit ratio and the savings must cost less than 0.10 Euro/kWh (USD 0.11/kWh) to be selected. The size of the projects must be between 27,000 Euros and 1.5 million Euros (from USD 30,000 to USD 1,680,000) and the programs (aggregated projects) between 200,000 Euros and 950,000 (USD 270,000 and 1,070,000). The measures may address all sectors although focusing only on electricity.
In the case of Portugal, where no EEO were adopted, two types of situations can be identified. On the one hand, the Distribution System Operator (DSO) involvement in the PPEC can be easily understood since it is a regulated entity, under a revenue cap kind of regulatory scheme—meaning that revenues are decoupled from sales. On the other hand, other companies in the electricity sector, namely free market retailers, do not necessarily experience decoupling between sales and revenues. In fact, even if they make a big effort to diversify their products, by trading services beyond selling electricity, their revenues depend heavily on sales volume, as profits thereof. In this case, the promotion of energy efficiency can originate revenue losses. The voluntary involvement of these agents in the promotion of energy efficiency may only be justified by the expected market advantage of a “green” image, due to the growing public awareness of the importance of energy efficiency, to preserve or increase market share. This becomes even more relevant to the definition of public policy since, in the PPEC case, cost sharing by promoters and beneficiaries has been increasing. The apparent paradox of the involvement of electric utilities in the promotion of energy efficiency was previously discussed by the authors [6].
In next section, the Portuguese energy efficiency policy is presented, and the role of PPEC is highlighted.
Portuguese Energy Efficiency Policy
In the 2016 Portuguese National Energy Efficiency Action Plan, NEEAP 2016—the Energy Efficiency Strategy, a new goal regarding a maximum limit of primary energy consumption was set. The actions and targets set for the 2013–2016 period included the concerns on energy consumption reduction set to 2020, part of the Directive on Energy Efficiency, Directive No. 2012/27/EU, from the European Parliament and the Council, from 25 October. The Government set a goal of 25% reduction in energy consumption by 2020, based on PRIMES projections made in 2007, setting the maximum consumption limit at approximately 22.5 Mtoe [7]. This commitment goes a little bit further than the 20% reduction set by Directive on Energy Efficiency. Besides the 25% reduction goal, a specific reduction goal for the State was set to 30% of the primary energy consumption by 2020. The NEEAP 2016 was developed in articulation with the 2020 National Renewable Energy Action Plan, NREAP 2020—the Renewable Energy Strategy [8].
The measures that were set in the previous NEEAP, the NEEAP 2008, were analyzed and some changes were made to cope with the new commitment. Some measures were discarded and others were introduced. The NEEAP 2016 includes ten programs covering six distinct areas (Table 1).
These programs can be briefly specified as follows:
- Eco car—measures towards improving energy efficiency of vehicles;
- Urban Mobility—measures to promote the use of the public transportation system and soft modes of transportation;
- Energy Efficiency System for Transport—measures addressing the promotion of railway systems and the energy management of transport fleets;
- House and Office Renovation—measures aiming the improvement of energy efficiency in lighting, home appliances and building retrofits;
- Buildings Energy Efficiency Systems—measures resulting from the energy certification system;
- Solar Thermal—measures addressing the adoption of renewable energy sources in buildings;
- Intensive Energy Consumption Management System—transversal measures in the industrial sector, and the revision of the Portuguese Intensive Energy Consumption Management System (SGCIE—Portuguese acronym for Sistema de Gestão dos Consumos Intensivos de Energia);
- State Energy Efficiency—measures aiming the energy certification of public buildings, as well as the Public Administration Energy Efficiency Program (ECO.AP), State transport fleets and Public lighting;
- Communicate Energy Efficiency—measures promoting communication and awareness campaigns to disseminate more energy efficient habits and attitudes; and
- Efficiency in the Agriculture sector—transversal measures addressing energy efficiency regarding the specificities of the sector.
In 2017, the Portuguese Government presented the third NEEAP that describes the measures to be adopted until 2020, and also the savings expected and obtained for the period from 2008 to 2015 [9]. The impacts of the measures implemented in each area, between 2008 and 2014, as well as the cumulative impact value, are presented in Figure 1. According to the third NEEAP, the slowdown in the economy during the “economic adjustment” period may justify the reduced adoption of energy efficiency measures in the years between 2011 and 2014.
The impact of the measures adopted in the buildings sector (state, residential and services) was still under evaluation at the date of the report. According to the authors of the report, it is expected that the impact of the measures for the 2015 and 2016 will be translated into higher energy savings due to some measures, such as electric mobility and the upgrade of the building stock.
The degrees of implementation of the measures within the NEEAP for 2016 and 2020 are presented in Table 2.
The implementation of the NEEAP is supported by regulatory measures, fiscal differentiation measures and financial support to the implementation of the energy efficiency measures. PPEC is one of the schemes that may provide financial support to the implementation of measures to be considered to account for the NEEAP targets. Other financial resources are the Energy Efficiency Fund, Fund to Support Innovation, the Portuguese Carbon Fund, and the National Strategic Reference Framework, among others. According to the 2017 NEEAP report, the Energy Efficiency Fund supported tangible measures leading to 12,220 toe of reduction in final energy consumption and the estimated savings due to PPEC financed measures is of 13,720 toe, after the implementation of the 2013–2014 edition [9].
In addition to verifying the fulfillment of the commitments assumed, it would be interesting to evaluate the energy and environmental performance of Portugal and to compare it with other countries [10].
PPEC is a mechanism, developed by the Portuguese Energy Services Regulatory Authority (ERSE—Entidade Reguladora dos Serviços Energéticos, in Portuguese), for the promotion of electric energy efficiency at the demand-side, whose first call for proposals occurred in 2007. However, the existence of stimuli to the involvement of electric utilities in the promotion of energy efficiency at the demand-side dates back to 1998. By then, the costs associated to demand-side projects were included in the revenues from the tariffs applied to all electricity consumers [11]. This was in force between 1999 and 2001. Changes were imposed by the Tariff regulation of 2001 [11], which defined a benefit-sharing scheme of 50% for each part, the utility and the consumers. The participation of the public electricity distributors was mandatory and Demand-Side Management Plans (PGP—Planos de Gestão da Procura, in Portuguese) should be presented every year, between 2002 and 2005. Due to uncertainties regarding the regulatory evolution following the reform of the electricity sector, the PGP was suspended and then replaced by PPEC. Unlike PGP, PPEC is a voluntary scheme where, besides electric utilities, other entities can compete for funds to finance energy efficiency improving measures. The measures proposed are subjected to a competition, leading to the selection of the “best” energy efficiency measures, according to a set of criteria defined in advance.
PPEC rules have evolved over the years, motivated either by the experience gained by the regulator with previous editions or by energy policy requirements. With the publication of Ordinance No. 26/2013, on 24 January [12], which established new rules for the evaluation criteria and procedures, to be observed in the ranking and selection of the measures submitted to the competitions, it was determined that the assessment of these measures, in addition to being carried out by ERSE, should also be subjected to the appreciation of the Directorate-General for Energy and Geology (DGEG), a government department, in order to reflect energy policy criteria. A paper presenting the experience of the first two PPEC editions was presented at the 20th International Conference on Electricity Distribution [13]. Some regulatory characteristics of PPEC were presented, as well as the avoided consumption and environmental impacts of the 2007 and 2008 PPEC editions. Another paper was presented at the 2012 9th International Conference on the European Energy Market (EEM) [14]. In this paper, the results from the ex-post evaluation of the first PPEC edition were presented. In addition, in 2012, a paper was published addressing the methodology used for the ranking procedure [15]. In this study, an alternative was proposed that used avoided consumption and cost of saved kWh as decision variables in the definition of the weights of the criteria, for the selection process.
The evaluation of the measures submitted to PPEC in each call for proposals, which happens every two years, is carried out considering two main sets of evaluation criteria, both equally valued: (i) evaluation criteria regarding the efficiency of electricity consumption, from the perspective of economic regulation; and (ii) evaluation criteria related to energy policy objectives and instruments defined by decision of the member of the Government responsible for energy [12].
The evaluation criteria set by ERSE depends on the type of the measures: tangible or intangible measures. The intangible measures are those aimed at providing consumers with relevant information on the efficiency of electricity consumption and its benefits to adopt more efficient consumption habits, namely, training actions, information dissemination campaigns and energy audits. On the other hand, tangible measures are measures that address the installation of equipment with energy efficiency performance superior to the market standard or the replacement of inefficient equipment with more efficient ones. Tangible measures must address a consumption segment, Industry and Agriculture, Commerce and Services, and Households. The evaluation of the tangible measures is done taking into account the following criteria (a) cost–benefit analysis; (b) scale risk; and (c) weight of equipment investment in the total cost of the measure. Regarding intangible measures, their evaluation is made taking into account the following evaluation criteria: (a) quality of the presentation of the measure; (b) ability to overcome market barriers and spillover effect; (c) equity; (d) innovation; and (e) promoters’ experience with similar programs. Each criterion has its own weight in the final score on the measure’s performance.
The promoters, the entities that submit proposals of measures and that are responsible for their implementation, may be electric energy traders, operators of electricity transmission and distribution networks, associations and entities that defend consumers’ interests, municipal associations, business associations, energy agencies, and higher education institutions and research centers.
The evaluation criteria set by the member of the Government responsible for energy, for the last PPEC call for proposals were: (a) alignment with the national energy policy and legislation in force; (b) alignment with the national energy efficiency policy and legislation in force; (c) support for the development and implementation of measures to promote energy efficiency; (d) diversification of promoters; and (e) coordination with other instruments to encourage energy efficiency.
Each PPEC call for proposals has six different competitions: four tenders for tangible measures and two tenders for intangible measures. The tenders for tangible measures go as follows: (a) three calls for tender for all promoters, one for each consumption segment (Industry and Agriculture, Commerce and Services, and Households); and (b) a tender for tangible measures for promoters which are not companies in the electricity sector.
The competitions of intangible measures are: (a) a tender for all promoters; and (b) a tender for promoters who are not companies of the electric sector.
Each candidate measure must include in its application a measurement and verification (M&V) plan, defining the methodology for the verification of savings. This M&V plan should be done by entities independent from the promoter. In addition, ERSE will carry out audits of various measures, by subset, subject to a budget that will not exceed 1% of the annual PPEC budget.
PPEC participation in the costs of tangible measures must be 80% or less of the total cost of the measure, fostering the participation and responsibility of the promoters and beneficiaries. In addition, if the budget for the first year of implementation of a tangible measure is less than 25% of the total PPEC candidate cost, the measure is excluded. Some other budget limits are imposed, such as measures submitted to the competitions for all promoters, with program administrator costs higher than 1/3 of the budget set for their contest and segment; and measures of the competitions for promoters who are not companies of the electric sector with candidate costs to the PPEC greater than 1/6 of the budget defined for the respective competition. The Net Present Value (NPV) from the societal perspective is an indicator of the societal value of the measure. A positive NPV is a screening criterion for a tangible measure to be competing in a tender. The NPV is computed according with the following expression:
where is the total benefits from the societal perspective associated to the measure in year t; is the total costs from the societal perspective associated to the measure in year t; i is the discount rate; and n is the lifetime, in years.
The benefits, from the societal perspective, are the sum of the environmental benefits with the avoided supply costs. The societal costs include the financial costs incurred by the participant consumers, by all electric energy consumers (financed through PPEC), and by the promoters or any other entities. The costs and benefits are calculated in an incremental perspective against the market standard technology. Whenever it is considered that the proposed tangible measure does not contribute to the breakdown of market barriers, a free-ridership factor that penalizes the savings announced by the promoter may be applied.
In the next section, some results from the six editions of PPEC are presented, with emphasis on the costs sharing and the evolution of the program administrator costs and the societal costs of the measures. The analysis will be presented both for eligible and selected measures. Eligible measures are measures that are submitted and accepted into the competition, since they passed the eligibility criteria, and selected measures are the ones that were selected to be financed. PPEC costs are assumed as the costs to be financed by PPEC budget, similar to the perspective of the costs of the Program Administrator (PA) cost test of the California Standard Practice Manual [16].
A previous analysis of the first four editions of PPEC was published before, although with the focus on the involvement of electric utilities in the promotion of energy efficiency on the demand side [17].
3. PPEC Results
3.1. Costs and Budgets
Generally speaking, the participation in PPEC editions has been increasing from one edition to the following one. The number of promoters has been steadily increasing from eight in the first PPEC edition to 87 in the last one (Figure 2). In addition, the number of measures that have been submitted and considered eligible has been increasing. The number of eligible measures rose, from 62 in 2007 to 223 in the last edition, representing an increase of more than three times. The increase was sharper from 2007 to 2008, and there was a slight decrease from 2008 to 2009. This decrease was mostly due to a decrease in the number of tangible measures and a reduction in the pace of increase of intangible measures. The 2008 PPEC rules [18] came into force in the 2009–2010 edition. This change in the rules could also have influenced the reduction of the number of eligible measures.
In Table 3 the allocation of the PPEC funds to each type of measures, consumer segment, and competition, is shown. As mentioned before, the tangible measures in the all promoters’ competition have distinct budgets, depending on the consumer segment addressed.
The PA costs of the eligible measures increased sharply in the first three editions and remained without significant variations since then (Figure 3). In the last four editions, the difference between the highest (61.6 M€ in 2017–2018) and the lowest (57 M€, in 2011–2012) is around of 4.5 M€, 8% of the lowest value. The main variations were an increase in the cost of intangible measures and a decrease in tangible ones, in the same PPEC edition (the 2013–2014 edition). These variations were probably due to the transfer of one million Euros from the tangible measures budget to intangible measures (Table 3).
It is important to have in mind that the first two editions were annual, with a budget of 10 million Euros, and the other four were biennial. The biennial editions have a budget of 23 million Euros (equivalent to 11.5 million Euros/year). In the first two PPEC editions, tangible measures could have a multiannual implementation period of up to three years. However, only the costs to be spent in the first year were considered to be financed by that edition’s budget. For example, for a measure selected in the 2007 edition that had an implementation cost plan for 2007 and 2008, only the costs pertaining to 2007 were financed by the 2007 budget. The costs to be spent in 2008 were to be financed by 2008 budget. Nowadays, only tangible measures with an implementation plan of two years are eligible.
As can be seen in Figure 4, although Commerce and Services has not been the consumer segment with the highest budgets, it has been the one with highest PA costs of the eligible tangible measures. Interesting is the fact that the PA cost of those measures has been very similar for all biennial editions. The same cannot be said to the PA costs of the measures addressing the other two segments.
Although the PA costs of the measures addressing Commerce and Services have been almost constant over the last four editions, the number of eligible measures in this segment more than doubled for the same editions (Figure 5), corresponding to the highest number of measures when compared to the number of those addressing the other two consumer segments. In fact, in the last PPEC edition, nearly 2/3 of the total number of eligible tangible measures addressed the Commerce and Service segment. Regarding the number of selected measures, the Commerce and Services consumer segment is also the one with the highest number of selected measures actually funded by PPEC.
3.2. Costs Sharing among Actors
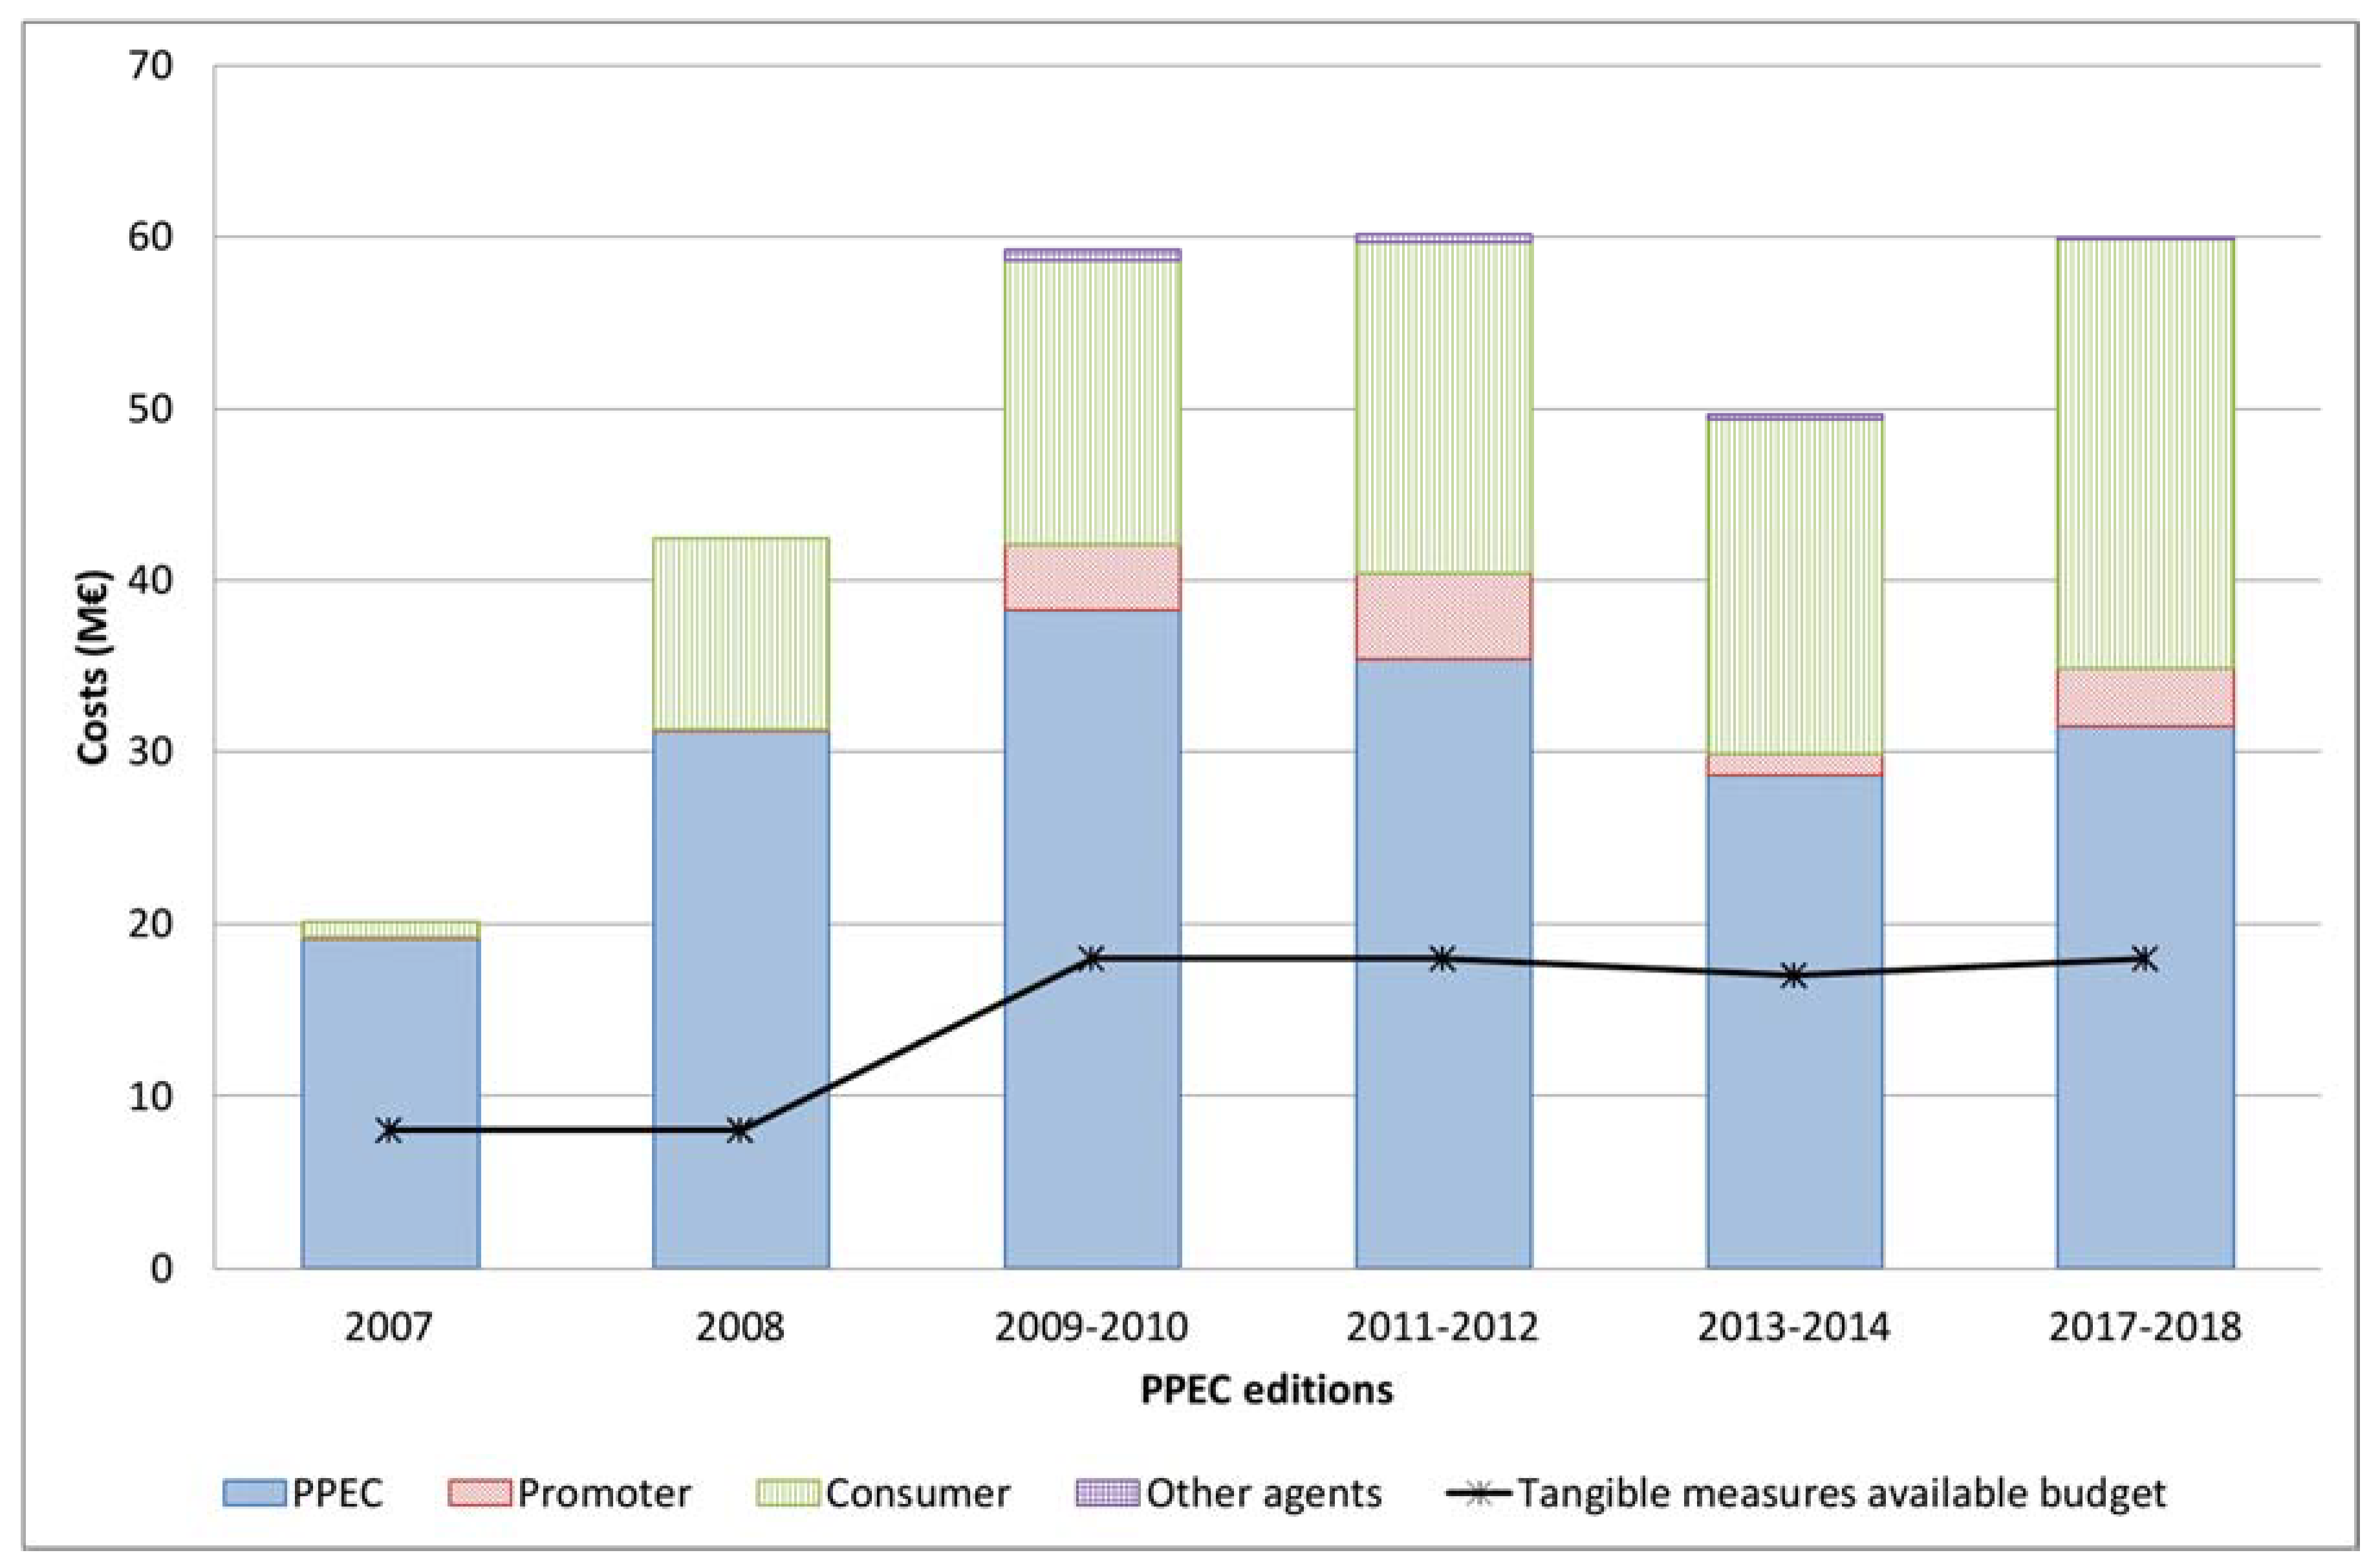
The total cost of a measure, also addressed as the societal cost, can be financed by several agents. Besides the part of the cost of the measures that is financed by PPEC budgets, tangible measures are financed by the promoter, the consumer and/or other agents, such as promoter’s partners. Over time, the societal costs sharing among agents has been changing. In Figure 6, it is possible to see the average costs, by agent, of the eligible tangible measures in each PPEC edition.
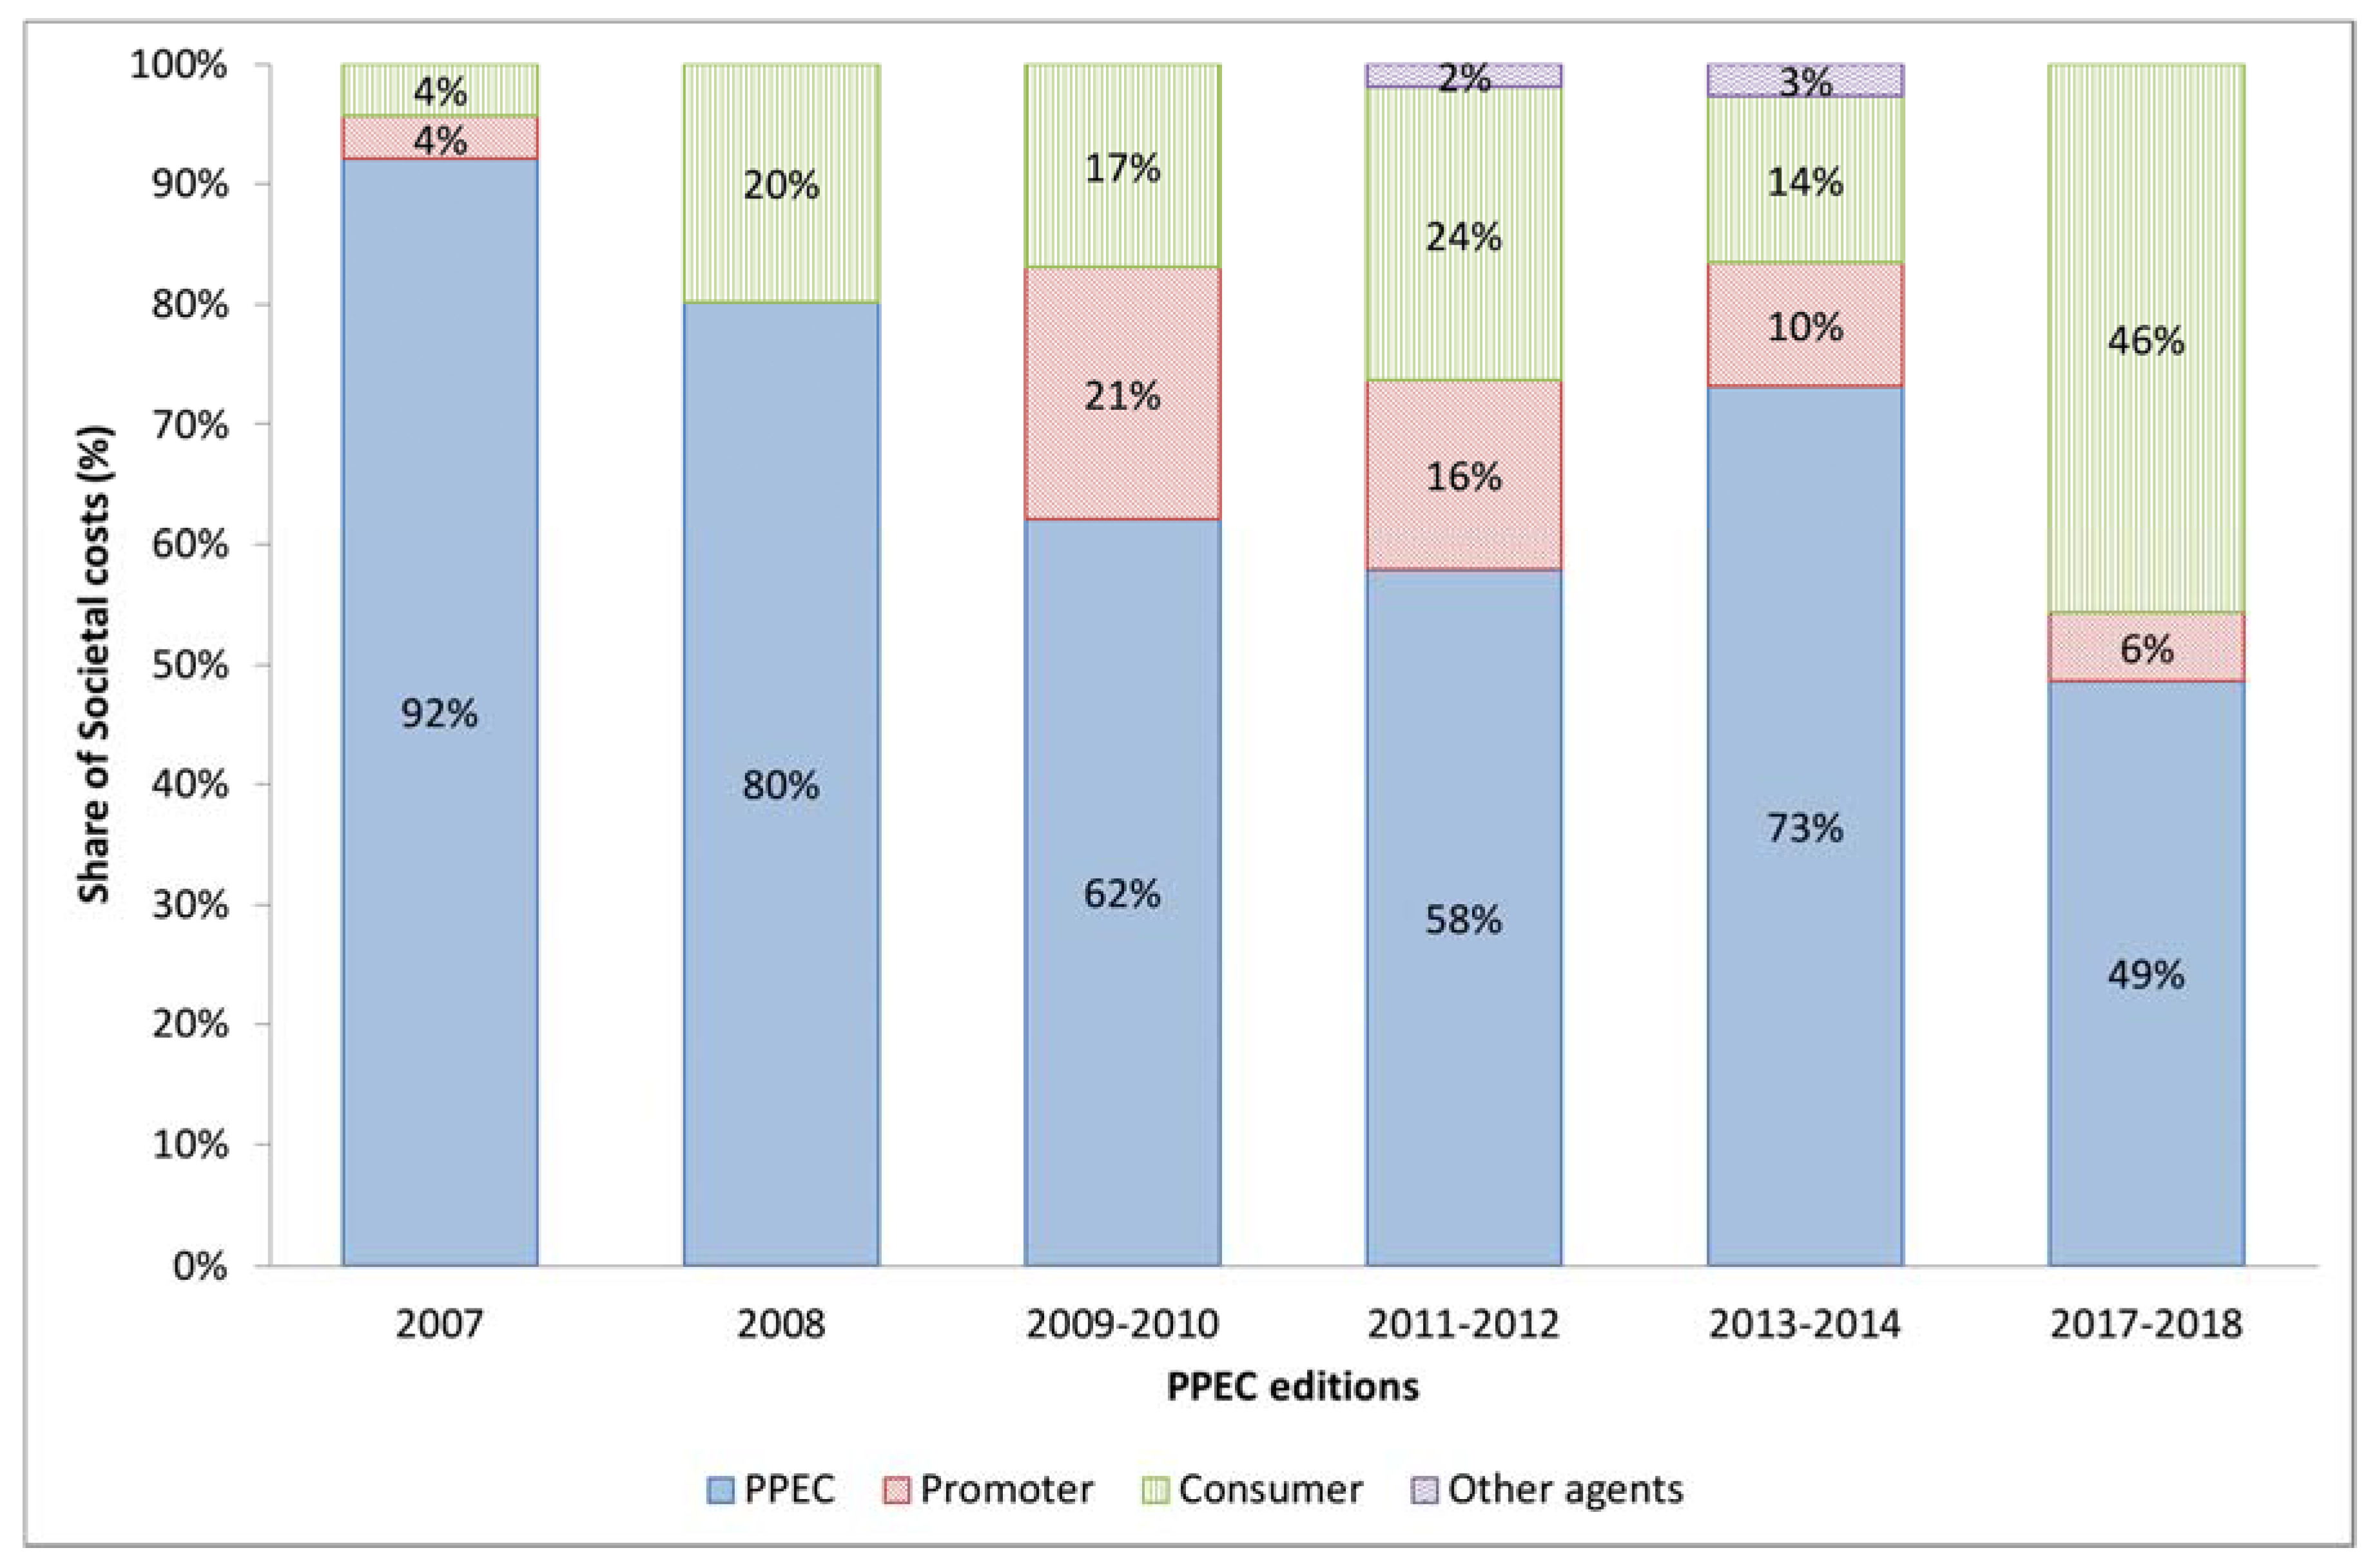
Each agent’s average share of the societal costs of eligible measures is presented in Figure 7.
In Figure 7 the PPEC share in total implementation costs has been decreasing. From the 2009–2010 PPEC edition, PPEC costs cannot exceed 80% of societal costs. Nevertheless, the decreasing tendency is probably because only PPEC costs are considered in the measures evaluation procedures. Then, the lower the participation of PPEC funds in each measure costs, the more interesting tends to be the benefit–cost ratio and the probability for the measure to be selected. Promoters are trying to involve beneficiaries and partners in societal costs. The promoter’s shares tend to be quite small, which is understandable, since they share the costs but do not share the benefits. If the promoter is an electric utility, the incentive to participate in costs sharing is even smaller, since energy efficiency measures will reduce sales. In addition, the participation of partners in costs sharing has been residual or inexistent.
The average share of societal costs of the selected tangible measures (Figure 8) is quite similar to the costs sharing of eligible measures (Figure 6). Since the cost–benefit analysis is made under the perspective of the PA costs, it could be expected that the share of PPEC funds should be less than the share of costs of eligible measures. However, since the Cost–Benefit ratio is not the only criterion, there is no evidence of lower share of PPEC costs in selected measures, when compared to eligible measures.
In the next three figures, societal cost sharing among agents is presented for the selected measures and the three consumption segments: Industry and Agriculture (Figure 9), Commerce and Services (Figure 10) and Households (Figure 11). Regarding PA costs, the measures for Industry and Agriculture follow closely the trend verified for eligible measures (Figure 6). It can be seen that the participation of other agents in costs, besides the PA and the beneficiary, is quite small or inexistent.
In the case of the measures addressing the Commerce and Services segment, PPEC relative participation in the costs of the selected measures has been under 61% since the 2008 edition, even before the 80% limit was defined. The average participation of the promoters in costs, although very small, is higher than the one verified in the case of the Industry and Agriculture measures.
For the Households sector, except for the 2013–2014 edition, the PA share in the societal costs of the measures has also been showing a decreasing tendency. The 73% of PPEC participation in costs, for the 2013–2014 edition, is mostly due to one measure whose PA costs represents 33% of the available budget and 78% of the societal costs. It can also be seen that the promoter’s share in costs is above the one verified in the measures addressing the other two consumer segments.
In the first PPEC edition, total investment in tangible measures was 9.2 M€, being 8.3 M€ from the PPEC budget. In the last PPEC edition, the total expected investment is 35.9 M€, the participation of the PA reaching 18 M€. The expected investment increased 3.9 times, from 9.2 M€ in 2007 to 35.9 M€, in the last PPEC edition, while the PA costs increased only 2.2 times. The existence of a leverage factor [27] is clear. A leverage factor of 1.0 means that all the investment is made from program funds. A leverage factor of 2.0 means that only half the investment is made from program funds. Figure 12 shows the leverage factors for all selected tangible measures (all segments) and for each segment individually, in each PPEC edition. As can be seen, the leverage factors were, in the last PPEC edition, near 2.0 (1.99), meaning that, for each euro invested from the program funds, an additional ninety-nine cents were invested. In the first PPEC edition, the leverage factor was 1.11. In the Households sector, it is expected that 1.06 € will be invested for each euro from PPEC funds, since its leverage factor is 2.06. The lowest leverage factor, of 1.95, occurred in the Commerce and Services sector. Nevertheless, it is very close to the leverage factors found in the other consumer segments. The lowest value for the leverage factor found for the Households segment, in the 2013–2014 edition, is mostly due to that same measure, identified earlier, with the PA costs being 78% of the societal costs.
Looking from another perspective, the extra investment added to each euro invested through PPEC evolved from eleven cents, in the first PPEC edition, to ninety-nine cents in the last edition.
4. Energy Services Addressed
In Figure 13 the PPEC costs of the proposed measures according to the energy services they address (for tangible measures) and the energy related services (for intangible measures) are presented. As can be seen, the most popular energy service addressed is, by far, lighting, mostly involving technology replacement actions. There are, in fact, three energy services related to lighting: interior lighting (mostly in buildings), public and traffic lighting. In the first three editions, most of the measures proposed a change in technology from incandescent to compact fluorescent lamps (CFL). In more recent editions, the standard of the market was considered the CFL, leading promoters to propose the replacement of existing lighting devices with LED technology based devices. The experience obtained by the promoters in previous editions made it possible for them to address more energy services, promoting nowadays a more diversified set of measures.
Regarding tangible measures, the diversity of energy services addressed and the number of selected measures in each PPEC edition is presented in Figure 14. As can be seen, in the first PPEC edition, only three energy services were addressed and the diversity has been increasing since then. Altogether, the number of measures addressing lighting (in buildings, public and traffic) represents almost 51% of the selected measures.
In Table 4, with the clear exception of the first PPEC edition, the PPEC cost of each saved MWh are very competitive. Comparing the values in Table 4 with the values in Table 5, it is possible to see that, due to the very high participation of consumers in costs, generally speaking, the energy services mostly addressed are also the ones with more competitive PPEC costs per each saved MWh.
In more recent PPEC editions, with the investment in LED lamps, the costs of each saved MWh increased. The PA costs of each saved MWh among the selected measures ranged from 8 € to 39 €, in the last PPEC edition.
5. Conclusions
The promotion of energy efficiency at the demand side by electric utilities in Portugal has been in place since 1999: at first with the PGP, where the participation of the regulated utility was mandatory, and then, after 2007, with the PPEC, a voluntary scheme that allows the participation of other promoters not belonging to the electricity sector. The number of promoters over the six PPEC editions increased more than 10 times. In addition, the number of measures increased 3.6 times, with tangible measures increasing at a slightly higher rate (4.1 times) than intangible measures, although the number of intangible measures is higher than the number of eligible measures in almost every PPEC edition. The program costs of the eligible measures have also been 2.5 to 2.7 times the available budget. Thus, if one looks at the number of proponents, the number of measures, or the program costs of the eligible measures, it is safe to say that the PPEC scheme is an effective instrument to foster energy efficiency in electricity consumption.
The consumer participation in costs has been increasing, representing 42% in the case of eligible measures and 47% in the case of the selected measures, in the last PPEC edition. The share of the programs costs, although limited to 80% of the total cost of the measure, represented 53% and 50% of the total cost of eligible and selected measures, respectively, in the last PPEC edition.
Looking at the tangible measures, only three energy services were addressed in the first PPEC edition. In the last edition, nine energy services were addressed. The main energy services addressed are related to lighting, be it in buildings, public lighting or traffic lighting, representing more than 30% of the available budget, for eligible measures, and more than 40% for the selected measures.
The expected investment caused by PPEC increased nearly four times over the six editions. In addition, for each euro invested by PPEC in improving the efficiency in electricity consumption, another euro is invested by consumers, promoters and other agents.
After the 2009–2010 PPEC edition, CFL were considered the market standard and underwent a depreciation in the valuation of savings, resulting in a reduced number of eligible measures supporting this technology and an increase in the measures addressing LED technology, a more expensive but more efficient one.
As can be inferred from the above, the PPEC scheme, although voluntary, is a very effective one, with an increasing number of promoters, from different sectors of the economy. The promoters that have been answering PPEC calls have now experienced teams in the design of new proposals, addressing different energy services and technologies. In addition, participation in costs by actors other than the program administrator leads to a greater accountability of these agents in the effectiveness of the measure.
The PPEC is a very informative case study for assessing the motivations of different market actors, namely electricity sector companies, to be actively involved in the promotion of energy efficiency.
The voluntary nature of this program also allows the participation of a larger number of actors, reaching a more diversified number of consumers that become increasingly aware of the importance of energy efficiency. On the other hand, since it is a voluntary mechanism, projections of energy savings are prone to uncertainty.
Author Contributions
J.L.S. performed the literature research, the data gathering, mining and processing; both authors analyzed the data, have put up the reference framework and derived the conclusions.
Funding
This work has been supported by the Portuguese Foundation for Science and Technology (FCT) under project grant UID/MULTI/00308/2013.
Conflicts of Interest
The authors declare no conflicts of interest.
References
- European Parliament and Council. Directive 2012/27/EU of the European Parliament and of the Council of 25 October 2012 on Energy Efficiency, Amending Directives 2009/125/EC and 2010/30/EU and repealing Directives 2004/8/EC and 2006/32/EC. Available online: https://eur-lex.europa.eu/legal-content/EN/TXT/?uri=celex:32012L0027 (accessed on 14 April 2017).
- Sousa, J.L.; Martins, A.G.; Jorge, H.M. Are energy efficiency obligations an alternative? The case-study of Portugal. In Proceedings of the ECEEE Summer Study Proceedings, Hyères, France, 1–6 June 2015; pp. 371–381. [Google Scholar]
- Rosenow, J.; Cowart, R.; Thomas, S.; Kreuzer, F. Market-Based Instruments for Energy Efficiency—Policy Choice and Design; International Energy Agency: Paris, France, 2017.
- Association for Teacher Education in Europe. Snapshot of Energy Efficiency Obligations schemes in Europe: 2017 update. In Proceedings of the Fourth European Workshop of the White Certificates Club, Paris, France, 30 June 2017. [Google Scholar]
- Radgen, P.; Bisang, K.; Koenig, I. Competitive tenders for energy efficiency—Lessons learnt in Switzerland. In Proceedings of the ECEEE Industrial Summer Study Proceedings, Berlin, Germany, 12–14 September 2016; pp. 81–89. [Google Scholar]
- Sousa, J.L.; Martins, A.G.; Jorge, H.M. Dealing with the paradox of energy efficiency promotion by electric utilities. Energy 2013, 52, 251–258. [Google Scholar] [CrossRef]
- Capros, P.; Mantzos, L.; Papandreou, V.; Tasios, N. Energy and Transport Outlook to 2030—Update 2007; European Communities: Brussels, Belgium, 2008. [Google Scholar]
- Council of Ministers. Council of Ministers Resolution No. 20/2013. Available online: https://ec.europa.eu/energy/sites/ener/files/documents/Portugal_NEEAP_en.pdf (accessed on 14 April 2017).
- PNAEE—Plano Nacional de Acção Para a Eficiência Energética—Third NEEAP 2017–2020. Available online: https://ec.europa.eu/energy/en/topics/energy-efficiency/energy-efficiency-directive/national-energy-efficiency-action-plans accessed on (accessed on 30 March 2018).
- Diário da República. Despacho No. 16 288-A/98; Diário da República: Lisbon, Portugal, 1998; pp. 13286–13292. [Google Scholar]
- Diário da República. Despacho No. 18 412-A/2001; Diário da República: Lisbon, Portugal, 2001; pp. 149441–149491. [Google Scholar]
- Diário da República. Portaria No. 26/2013; Diário da República: Lisbon, Portugal, 2013; pp. 489–491. [Google Scholar]
- Apolinário, I.; Correia de Barros, I.; Coutinho, H.; Ferreira, L.; Madeira, B.; Oliveira, P.; Trindade, A.; Verdelho, P. Promoting demand side management and energy efficiency in Portugal. In Proceedings of the 20th International Conference on Electricity Distribution, Prague, Czech Republic, 8–11 June 2009. [Google Scholar]
- Apolinário, I.; Correia de Barros, I.; Espírito Santo, C.; Ferreira, A.; Ferreira, L.; Madeira, B.; Verdelho, P. Results from a competitive tender mechanism to promote energy efficiency in Portugal. In Proceedings of the 2012 9th International Conference on the European Energy Market, Florence, Italy, 10–12 May 2012. [Google Scholar]
- Sousa, J.L.; Martins, A.G.; Jorge, H.M. Societal objectives as drivers in the search for criteria weights when ranking energy efficiency measures. Energy Policy 2012, 48, 562–575. [Google Scholar] [CrossRef]
- California Public Utilities Commission. California Standard Practice Manual—Economic Analysis of Demand-Side Programs and Projects; California Public Utilities Commission: San Francisco, CA, USA, 2001.
- Sousa, J.L.; Martins, A.G.; Jorge, H.M. World-wide non-mandatory involvement of electricity utilities in the promotion of energy efficiency and the Portuguese experience. Renew. Sustain. Energy Rev. 2013, 22, 319–331. [Google Scholar] [CrossRef]
- Diário da República. Despacho No. 15546/2008; Diário da República: Lisbon, Portugal, 2008; pp. 24886–24895. [Google Scholar]
- Entidade Reguladora dos Serviços Energéticos. Plano de Promoção de Eficiência no Consumo de Energia Eléctrica Para 2007; Entidade Reguladora dos Serviços Energéticos: Lisboa, Portugal, 2007. [Google Scholar]
- Entidade Reguladora dos Serviços Energéticos. Plano de Promoção da Eficiência no Consumo de Energia Eléctrica para 2008; Entidade Reguladora dos Serviços Energéticos: Lisboa, Portugal, 2007. [Google Scholar]
- Entidade Reguladora dos Serviços Energéticos. Plano de Promoção da Eficiência no Consumo de Energia Elétrica PPEC—Documento de Discussão; Entidade Reguladora dos Serviços Energéticos: Lisboa, Portugal, 2008. [Google Scholar]
- Entidade Reguladora dos Serviços Energéticos. Plano de Promoção da Eficiência no Consumo de Energia Eléctrica para 2009–2010; Entidade Reguladora dos Serviços Energéticos: Lisboa, Portugal, 2009. [Google Scholar]
- Entidade Reguladora dos Serviços Energéticos. Plano de Promoção da Eficiência no Consumo de Energia Eléctrica para 2011–2012; Entidade Reguladora dos Serviços Energéticos: Lisboa, Portugal, 2010. [Google Scholar]
- Entidade Reguladora dos Serviços Energéticos. Plano de Promoção da Eficiência no Consumo de Energia Eléctrica para 2013–2014; Entidade Reguladora dos Serviços Energéticos: Lisboa, Portugal, 2013. [Google Scholar]
- Entidade Reguladora dos Serviços Energéticos. Plano de Promoção da Eficiência no Consumo de Energia Eléctrica para 2017–2018—Avaliação na Perspetiva da Regulação Económica; Entidade Reguladora dos Serviços Energéticos: Lisboa, Portugal, 2016. [Google Scholar]
- Direção Geral de Energia e Geologia e Entidade Reguladora dos Serviços Energéticos. Plano de Promoção da Eficiência no Consumo de Energia Eléctrica Para 2017–2018; Direção Geral de Energia e Geologia e Entidade Reguladora dos Serviços Energéticos: Lisboa, Portugal, 2016. [Google Scholar]
- Rohde, C.; Rosenow, J.; Eyre, N.; Giraudet, L.-G. Energy Saving Obligations—Cutting the Gordian Knot of leverage? Energy Effic. 2015, 8, 129–140. [Google Scholar] [CrossRef] [Green Version]
Figure 1.
Impacts of the measures implemented in the different areas as well as the cumulative impact value [9].
Figure 1.
Impacts of the measures implemented in the different areas as well as the cumulative impact value [9].

Figure 2.
Evolution of the number of promoters and eligible measures in each PPEC edition [19,20,21,22,23,24,25].


Figure 4.
PPEC costs of the eligible tangible measures and corresponding available budget, for each PPEC edition [19,20,21,22,23,24,25].

Figure 5.
Number of eligible and selected measures by consumer segment in each PPEC edition [19,20,21,22,23,24,25,26].

Figure 6.
Societal costs of the eligible tangible measures and related available budget [19,20,21,22,23,24,25].

Figure 7.
Share of societal costs of the eligible tangible measures in each PPEC edition [19,20,21,22,23,24,25].

Figure 8.
Share of societal costs of the selected tangible measures in each PPEC edition [19,20,21,22,23,24,25,26].

Figure 9.
Share of societal costs of the selected tangible measures for the Industry and Agriculture consumption segment, in each PPEC edition [19,20,21,22,23,24,25,26].

Figure 10.
Share of societal costs of the selected tangible measures for the Commerce and Services consumption segment, in each PPEC edition [19,20,21,22,23,24,25,26].

Figure 11.
Share of societal costs of the selected tangible measures for the Households consumption segment, in each PPEC edition [19,20,21,22,23,24,25,26].

Figure 12.
Leverage factors, for each PPEC edition, total and for each consumption segments [19,20,21,22,23,24,25,26].

Figure 13.
Costs of the measures by targeted energy services, for each PPEC edition [19,20,21,22,23,24,25].

Figure 14.
Number of selected measures, according to each energy services addressed, in each PPEC edition [19,20,21,22,23,24,25,26].


Table 1.
Areas and programs considered in the NEEAP 2016 [8].
Table 1.
Areas and programs considered in the NEEAP 2016 [8].
| Areas | ||||||
|---|---|---|---|---|---|---|
| Transport | Residential and services | Industry | State | Behavior | Agriculture | |
| Programs | Eco Car | House and Office Renovation | - | - | - | - |
| Urban Mobility | Building Energy Efficiency System | Intensive Energy Consumption Management System | State Energy Efficiency | Communicate Energy Efficiency | Efficiency in Agricultural sector | |
| Transport Energy Efficiency System | Solar Thermal | - | - | - | - | |
Table 2.
Degrees of implementation of the measures within the NEEAP for 2016 and 2020 [9].
Table 2.
Degrees of implementation of the measures within the NEEAP for 2016 and 2020 [9].
| Type of Measures | Primary Energy Saved * | Primary Energy Savings Target 2016 | Primary Energy Savings Target 2016 (Implementation) | Primary Energy Savings Target 2020 | Primary Energy Savings Target 2020 (Implementation) |
|---|---|---|---|---|---|
| (Toe) | (Toe) | (%) | (toe) | (%) | |
| Transports | 297,923 | 343,683 | 87% | 406,815 | 73% |
| Residential and Services | 511,738 | 836,277 | 61% | 1,098,072 | 47% |
| Industry and agriculture | 260,167 | 407,221 | 64% | 561,309 | 46% |
| State | 36,245 | 153,634 | 24% | 295,452 | 12% |
| Behavior | 24,058 | 32,417 | 74% | 32,416 | 74% |
| Total | 1,130,131 | 1,773,232 | 64% | 2,394,064 | 47% |
* Primary energy saved for the period 2008–2014.
Table 3.
Allocation of funds (in millions of Euros) by type of measure, consumer segment and competition, to each PPEC edition [19,20,21,22,23,24,25].
| Type of Measures | 2007 | 2008 | 2009–2010 | 2011–2012 | 2013–2014 | 2017–2018 |
|---|---|---|---|---|---|---|
| Tangible measures | - | - | - | - | - | - |
| Industry and Agriculture | 3 | 3 | 5.8 | 5.8 | 5.1 | 7 |
| Commerce and Services | 2.5 | 2.5 | 4.9 | 4.9 | 4.3 | 4 |
| Households | 2.4 | 2.4 | 5.3 | 5.3 | 4.6 | 3 |
| Non-Electric Sector Promoters | - | - | 2 | 2 | 3 | 4 |
| Total | 8 | 8 | 18 | 18 | 17 | 18 |
| Intangible measures | - | - | - | - | - | - |
| All promoters competition | - | - | 1.5 | 1.5 | 3 | 3 |
| Non-Electric Sector Promoters | 2 | 2 | 3.5 | 3.5 | 3 | 2 |
| Total | 2 | 2 | 5 | 5 | 6 | 5 |
| Total | 10 | 10 | 23 | 23 | 23 | 23 |
Table 4.
Average PA costs of each avoided MWh of the selected measures in each PPEC edition [19,20,21,22,23,24,25,26].
| Type of Measures | 2007 | 2008 | 2009–2010 | 2011–2012 | 2013–2014 | 2017–2018 |
|---|---|---|---|---|---|---|
| Compressed air | - | 20.36 | - | - | 29.82 | 17.14 |
| Energetic Mix | - | - | - | - | - | 12.81 |
| Lighting | 20.86 | 6.08 | 7.93 | 8.93 | 13.58 | 16.68 |
| Load Management Systems (Tangible) | - | 10.31 | 5.50 | 12.29 | 18.45 | 14.11 |
| Motors and drives | 10.25 | 8.29 | 4.44 | 6.94 | 6.57 | 8.70 |
| Public lighting | - | - | 8.95 | 6.73 | 6.71 | 29.06 |
| Refrigeration and freezing | 24.25 | 8.78 | 2.83 | 4.84 | 7.15 | 16.41 |
| Solar water heating | - | - | 4.95 | - | - | - |
| Thermal insolation | - | - | - | - | 13.34 | 13.05 |
| Traffic lights | - | - | 39.82 | 12.51 | 17.05 | 9.91 |
Table 5.
Average Societal costs of each avoided MWh of the selected measures in each PPEC edition (in €/MWh) [19,20,21,22,23,24,25,26].
| Type of Measures | 2007 | 2008 | 2009–2010 | 2011–2012 | 2013–2014 | 2017–2018 |
|---|---|---|---|---|---|---|
| Compressed air | - | 28.83 | - | - | 51.38 | 39.84 |
| Energetic Mix | - | - | - | - | - | 23.78 |
| Lighting | 23.99 | 8.34 | 12.72 | 15.15 | 31.02 | 32.60 |
| Load Management Systems (Tangible) | - | 10.31 | 10.16 | 21.33 | 26.06 | 22.35 |
| Motors and drives | 10.25 | 9.33 | 6.17 | 10.65 | 10.29 | 16.41 |
| Public lighting | - | - | 11.19 | 12.10 | 10.29 | 56.27 |
| Refrigeration and freezing | 24.25 | 15.45 | 3.67 | 6.24 | 11.30 | 39.98 |
| Solar water heating | - | - | 64.84 | - | - | - |
| Thermal insolation | - | - | - | - | 27.84 | 35.64 |
| Traffic lights | - | - | 54.92 | 20.02 | 25.04 | 17.83 |
© 2018 by the authors. Licensee MDPI, Basel, Switzerland. This article is an open access article distributed under the terms and conditions of the Creative Commons Attribution (CC BY) license (http://creativecommons.org/licenses/by/4.0/).
Share and Cite
MDPI and ACS Style
Sousa, J.L.; Martins, A.G. Portuguese Plan for Promoting Efficiency of Electricity End-Use: Policy, Methodology and Consumer Participation. Energies 2018, 11, 1137. https://doi.org/10.3390/en11051137
AMA Style
Sousa JL, Martins AG. Portuguese Plan for Promoting Efficiency of Electricity End-Use: Policy, Methodology and Consumer Participation. Energies. 2018; 11(5):1137. https://doi.org/10.3390/en11051137
Chicago/Turabian StyleSousa, José L., and António G. Martins. 2018. "Portuguese Plan for Promoting Efficiency of Electricity End-Use: Policy, Methodology and Consumer Participation" Energies 11, no. 5: 1137. https://doi.org/10.3390/en11051137
Note that from the first issue of 2016, this journal uses article numbers instead of page numbers. See further details here.