An Optimisation Study on Integrating and Incentivising Thermal Energy Storage (TES) in a Dwelling Energy System


1
Centre for Process Systems Engineering, Department of Chemical Engineering, Imperial College London, London SW7 2AZ, UK
2
Department of Mechanical and Aerospace Engineering, University of Strathclyde, Glasgow G1 1XQ, UK
*
Author to whom correspondence should be addressed.
Energies 2018, 11(5), 1095; https://doi.org/10.3390/en11051095
Submission received: 1 April 2018
/
Revised: 20 April 2018
/
Accepted: 25 April 2018
/
Published: 29 April 2018
(This article belongs to the Special Issue Selected Papers from SDEWES 2017: The 12th Conference on Sustainable Development of Energy, Water and Environment Systems)
Abstract
:In spite of the benefits from thermal energy storage (TES) integration in dwellings, the penetration rate in Europe is 5%. Effective fiscal policies are necessary to accelerate deployment. However, there is currently no direct support for TES in buildings compared to support for electricity storage. This could be due to lack of evidence to support incentivisation. In this study, a novel systematic framework is developed to provide a case in support of TES incentivisation. The model determines the costs, CO2 emissions, dispatch strategy and sizes of technologies, and TES for a domestic user under policy neutral and policy intensive scenarios. The model is applied to different building types in the UK. The model is applied to a case study for a detached dwelling in the UK (floor area of 122 m2), where heat demand is satisfied by a boiler and electricity imported from the grid. Results show that under a policy neutral scenario, integrating a micro-Combined Heat and Power (CHP) reduces the primary energy demand by 11%, CO2 emissions by 21%, but with a 16 year payback. Additional benefits from TES integration can pay for the investment within the first 9 years, reducing to 3.5–6 years when the CO2 levy is accounted for. Under a policy intensive scenario (for example considering the Feed in Tariff (FIT)), primary energy demand and CO2 emissions reduce by 17 and 33% respectively with a 5 year payback. In this case, the additional benefits for TES integration can pay for the investment in TES within the first 2 years. The framework developed is a useful tool is determining the role TES in decarbonising domestic energy systems.
1. Introduction
1.1. Background
Integration of Low-to-Zero Carbon (LZC) technologies in domestic buildings might go a long way in achieving the UK target for 80% reduction in greenhouse emissions by 2050 (from 1990 levels). Major barriers to implementation are: (1) large seasonal variations in space heating and electricity requirements; (2) sporadic nature of renewable energy; and (3) high capital costs. Thermal Energy Storage (TES) allows better integration of heat and electricity systems, and storage of energy for use during peak times, thereby addressing the first two barriers. However, despite these benefits, the penetration rate of TES in buildings in Europe is low [1].
Micro-generation can protect against future end-use energy cost and encourage household self-sufficiency [2]. Due to low penetration rates, a number of fiscal instruments have been introduced for micro-generation in the UK. There is a strong argument that fiscal incentives designed to increase uptake of technologies can in the long run decrease the cost of technologies [3]. An example is the Feed in Tariff (FIT). FITs are fixed electricity prices paid to micro-generation producers per unit of energy produced and injected into the electricity grid. The ability of FIT to stimulate development of less mature LZC technologies in many countries has been established [3,4]. However, the potential of the FIT to increase uptake of TES has not been analysed. In the UK, there is no incentive for homeowners to accommodate TES in their dwellings and communities. Policy makers in the UK have yet to consider storage a critical component of the UK energy future [5]. This could be due to uncertainty about the benefits of TES integration and lack of a reliable cost recovery mechanism for TES. This work seeks to address these challenges through the development of a systematic framework to evaluate the benefits of TES integration in a dwelling energy system, and determine if the additional investment in TES is economically viable. The framework is first mentioned in Oluleye et al. [6], and is extended in this paper.
Modelling and optimisation studies exist to determine the design and dispatch of LZC technologies and TES. However, there are still challenges in: (1) balancing complexity and robustness through the selection of appropriate temporal precision and time bands to represent energy demand and technology characteristics; and (2) representing storage and allowing the TES size to be determined optimally. These challenges are addressed in this work, through the development of a more accurate integrated framework for optimal design and operation of a low carbon dwelling energy system. The framework forms the basis of a case to support incentivising TES in dwellings.
1.2. Literature Review
A high share of micro-generation technology for satisfying the energy demand of the building sector could result in reduction in CO2 emissions, if an optimal operation strategy is pursued [7]. Reduction in primary energy consumption is also possible with a Micro-Combined Heat and Power (CHP) [8], and further reductions when TES is integrated [9]. Fubara et al. [10] records a 6–10% reduction in primary energy from integrating a micro-CHP. Murugan and Horak [11] identify primary energy savings and emissions reduction from micro-CHP, and their large market potential. Further reductions are possible from integrating heat storage with micro-CHP [8]. Improved capacity factor, and reducing low utilisation plant are benefits of generating and storing heat during periods of low demand and regenerating at periods of high demand [12]. Diaz and Moreno [9] records cost improvements when a micro-CHP is supplemented by TES. Storing heat improves the synchronisation of the demand for heat and electricity in buildings [13]. In spite of these benefits, LZC technologies and TES still have a small percentage of the market [14], implying low adoption by homeowners.
Furthermore, it is unclear if the benefits from TES integration make the additional investment worthwhile. The economic viability could be determined by estimating how long it takes to payback the additional investment in TES and if the investment has a positive return. Such analysis has not been done before.
Economic benefits in terms of operational savings are made possible by charging an accumulator when electricity is high, and releasing heat during cheap night hours [15,16]. However, analysis was done on a district scale. An advantage of district heating is that bigger size technologies are required thereby benefitting from economies of scale. This implies, the additional cost of the TES may be less than in an individual home. Even though district heating has been identified as a way of decarbonising domestic heating in the UK, the estimated deployment of district heating in 2030 is 6% of the total heat demand according to the 4th carbon budget [17]. Furthermore, district heating is not economically viable for lower population density areas. There is a need to evaluate the benefits of TES integration in an individual home (considering different dwelling types), as such an analysis has not been done before.
The development of a framework for system design is required before a techno-assessment of the design, and impacts of TES can be determined. These models account for technical and economic parameters, and boundary conditions like heat and electricity demands. Frameworks for system design are based on detailed buildings and technology physics, heuristics and optimisation. A detailed building simulation model is applied by Kelly et al. [18] to determine the amount of thermal storage needed to shift heat pump operation to off-peak periods. Salata et al. [19] also applies a detailed simulation model to evaluate the impact of micro-CHP. Detailed building models determine the potential effect on the end user in terms of comfort; however, technology selection and dispatch determination is not addressed. Furthermore, capturing design trade-off is not done systematically. Therefore, designs obtained are suboptimal in relation to delivery of energy and costs, making them insufficient as a framework to quantify the benefits of TES integration, and determine if the additional investment in TES is worthwhile.
Heuristics based on operational logic have been applied to size thermal stores [20]. A heuristic approach for economic optimisation for a single CHP plant and TES capacity is also applied in Vogelin et al. [21]. Heuristics are often iterative in nature, therefore, solving larger models becomes challenging; making them insufficient to form the basis to provide a case to support incentivizing TES.
Optimisation frameworks are able to capture capital-energy trade-offs systematically, and produce optimal designs. LZC technologies have been modelled to determine capacity and dispatch based on linear models [22,23], non-linear models [24] and mixed integer linear models [25,26]. Linear models underestimate the optimal unit capacity by 15% [27], whilst non-linear models suffer from long solution times and local optima [25]. Furthermore, selection of technologies and their capacities is not addressed in linear and non-linear models. Mixed integer linear models are suitable for solving scheduling problems with binary variables and obtaining a global optimal solution rapidly. Thus providing a useful tool to provide evidence to support TES incentivisation.
Such models are often complex due to the varying nature of energy demand and technology characteristics. To reduce model size and complexity, the size of the thermal store is sometimes predetermined [8,13], resulting in non-optimal designs. However, within the Mixed Integer Linear Program (MILP) modelling framework appropriate use of integer variables can obtain good compromise with model complexity whilst ensuring the designs are optimal. Furthermore, integers have been used in a crude way, that is, only associated with selection of technologies. A compromise with model complexity is possible using integers for operation of technologies, charging/discharging TES, import/export of electricity per temporal precision. The later use of integers ensures the operations do not occur simultaneously. In previous research, charging/discharging the store was only based on excess heat available, neglecting price signals. In this present work, in addition to the heat balance, TES is actively regulated to account for gas and electricity price signals.
A model’s environmental and economic outcome is influenced by the temporal precision [28] and the banding structure used to represent energy demand [16]. Different temporal precisions have been applied by various authors: 1 h [9,13,21,29,30,31,32] and 15 min [25]. Too large temporal precisions could introduce errors in technology sizing and ignore peak demands. Fine temporal precision (5–10 min) is required to adequately capture the characteristics of demand from an economic and environmental viewpoint [28]. Banding structures are used to simplify demand representation; 39 time bands (7 for weekdays, 6 for weekends and 3 seasons in a year) [16], bands of 3 weeks taken from 3 seasons with a time zoom factor for result scale up [25], 3 representative days [9], monthly time bands [33], 3 non-consecutive weeks for 3 seasons and multiplied by a weighing factor [26] and transition and winter days [8]. Choice of technology capacity becomes challenging with large time bands, and they may be errors in the techno-economic assessment [16]. A reduced time slice and band can guarantee a more reliable analysis of the system, as real peaks will be accounted for. The challenge in time slice and band selection is the trade-off between model complexity and accuracy. In the novel framework developed, a temporal precision of 5 min for all the days in the year is used to accurately determine the economic and environmental outcomes. The multi-period MILP model is selected to guarantee a global optimum and prevent the need to iterate when non-linear models are used. In addition to the heat balance, TES is actively regulated to account for gas and electricity price signals.
1.3. Contributions of This Work
A novel systematic framework based on a multi-period MILP model is proposed for the integration and assessment of TES in an existing dwelling. To improve the model accuracy finer temporal precisions are used considering 365 days in the year. The novel model is also able to determine the optimal LZC technology size. The assessment of the benefits of TES considers how long it will take to payback the additional investment compared to the system payback, and if the additional investment in TES has a positive return. Such an analysis of the benefits of TES integration has not been done before. This could provide evidence to support TES incentivisation. The analysis also considers different house types representative of the UK building sector, that is, detached, semi-detached, terrace and flat.
2. Methodology
A techno-economic assessment of the system is required to provide a case to support TES incentivisation. First, the energy system is designed systematically and the results forms the basis for the techno-economic study. A multi-period mixed integer linear program is proposed to design the energy system. Additional binary variables are included to address electricity import/export and TES charging/discharging. The model summary is provided in Figure 1. The scope considers integrating a micro-CHP, an auxiliary boiler and TES into an existing building.
2.1. Design Statement
A more specific definition of the design problem is:
- Given:
- ○
- Set of LZC technologies (different sizes of micro-CHP).
- ○
- The energy demands of a dwelling: space heating, hot water and electricity provided in 5 min temporal precision for all the days in a year. The electricity demand is for combined appliances, electronics and lighting.
- ○
- Energy prices (electricity and fuel), electricity tariff structure, technology costs.
- Determine:
- ○
- Optimal energy system design
- ✧
- Technologies selected, capacities and dispatch strategy
- ✧
- Contribution of technologies to heat and power provision
- ○
- Energy flows, economics and CO2 emissions
- Subject to:
- ○
- Energy (both heat and electricity) balances
- ○
- Technology capacity constraints
- In order to:
- ○
- Minimise the EAC of meeting dwelling energy demand to a residential user
A detailed building model was developed in Environmental Systems Performance - Research (ESP-r) to determine the space heating and hot water demands [34]. The demands are evaluated based on building geometry, thermal characteristics and weather forecasts. The European Electrical Standard profiles, by Annex 42 of the IEA’s ECBCS [35], were used for the electricity load. The micro-CHP applied is the gas engine due to maturity, fuel adaptability, fast responses to load changes and presence in the market [9]. The alternative to these is a gas boiler for meeting the heating demand, and electricity imported from the grid.
2.2. Mathematical Formulation
The optimal design is obtained by minimising the systems Equivalent Annual Cost (EAC), defined as the sum of the annualised capital, fuel and maintenance cost less the net electricity cost (Equation (1)). Breakdown of each component of the objective is provided in Equations (2)–(5), and the annualisation factor in Equation (6).
The annualized capital cost in Equation (2) takes into account the installed capital (IC) of the micro-CHP and TES. The TES size (SizeTES) is a degree of freedom in the model. Several sizes of the micro-CHP are included in the analysis, that is, 1, 2 and 4 kWe, and the binary variable ZCHP selects from the available sizes. The fuel costs (Equation (3)) is a sum of the fuel consumed in the micro-CHP and the boiler. Assumptions of the CHP performance (PerfCHP) and boiler performance (PerfBOI) are in Table A1. t is the time resolution used (5 min) and r is the number of time periods used to represent the annual energy demand and technology characteristics. The net electricity cost (Equation (5)) is the cost of electricity import less the revenue from electricity exported from the micro-CHP. Assumptions of electricity prices are in the Appendix A.
Equality and inequality constraints to describe the feasible region are also defined. Energy balances for heat and electricity is provided in Equations (7) and (8). In Equation (7), the heat produced from the micro-CHP, the boiler, and heat diverted out of storage must satisfy the thermal energy demand. No dumping of heat is allowed. Also in Equation (8), electricity produced from the micro-CHP and any electricity imported less electricity exported must satisfy the electricity demand. The technology operation is constrained in Equations (9) and (10). When YCHP is 1, the unit operates between the minimum and maximum allowed. In Equation (11) if a unit is not selected (determined by the binary variable ZCHP), it does not operate.
In order to define whether electricity is imported or exported, a binary variable, YEI, and a series of constraints are formulated in Equations (12) and (13). Electricity export and import cannot occur together in any time slice. UEI is a number some orders of magnitude larger than electricity import/export. The same formulation is done for charging/ discharging the store in Equations (14) and (15). The heat diverted out of the store, QTES,OUT and heat diverted into the store QTES,IN are degrees of freedom in the model. YTES represents the binary variable for operating the store. Equation (14) and (15) are formulated to ensure charging and discharging the store does not occur simultaneously in any time period r.
In each time slice, the energy content of the store is subject to the below constraint in Equation (16). Where θ is the daily storage loss, ISH is the Initial Store Heat.
Equation (17) states that the heat transferred into the store is equal to the heat recovered from it during 24 h. Therefore, at the end of each day:
After obtaining the optimal design based on Equations (1)–(17), a techno-economic analysis of the design follows. The criteria for assessment are the Equivalent Annual Income (EAI), the designed system payback and Net Present Value (NPV), payback and NPV associated with the additional investment in TES, the total delivered energy (TDE) and the net CO2 emissions (NTCO2).
The EAI is the difference between the cost of energy for a Business as Usual (BAU) system and the EAC in Equation (1). Traditionally, a dwelling space heating and hot water demand is satisfied by a boiler and electricity imported from the grid. The energy cost of a BAU system is calculated using Equation (18). The difference in the energy cost for a BAU system and the EAC for the optimized design with TES, gives the EAI associated with integrating TES. A positive EAI implies the homeowner has some savings from integrating the new system. The payback and the NPV for the additional investment in the TES is calculated using the difference in investment, and savings for design without TES and design with TES. The TDE is the fuel value of energy flows calculated in Equation (19), and the net CO2 emissions is estimated using Equation (20) taking into account CO2 from fuel, electricity import and CO2 displaced when electricity is exported. The model was implemented using the GAMS 24.7.3 software (24.7.3, GAMS Development Corporation, Fairfax, VA, USA) and solved with the CPLEX solver on a 64 bit 3.40 GHz Intel® Core™ i7-6700 CPU with 32 GB RAM machine.
3. Case Study
The case study is on integrating micro-CHP and TES into an existing dwelling with an objective to analyse the benefits from its integration, and determine if the additional investment is economically viable, and how it can be incentivised. Four building types representative of UK housing stock are investigated.
3.1. Design Problem
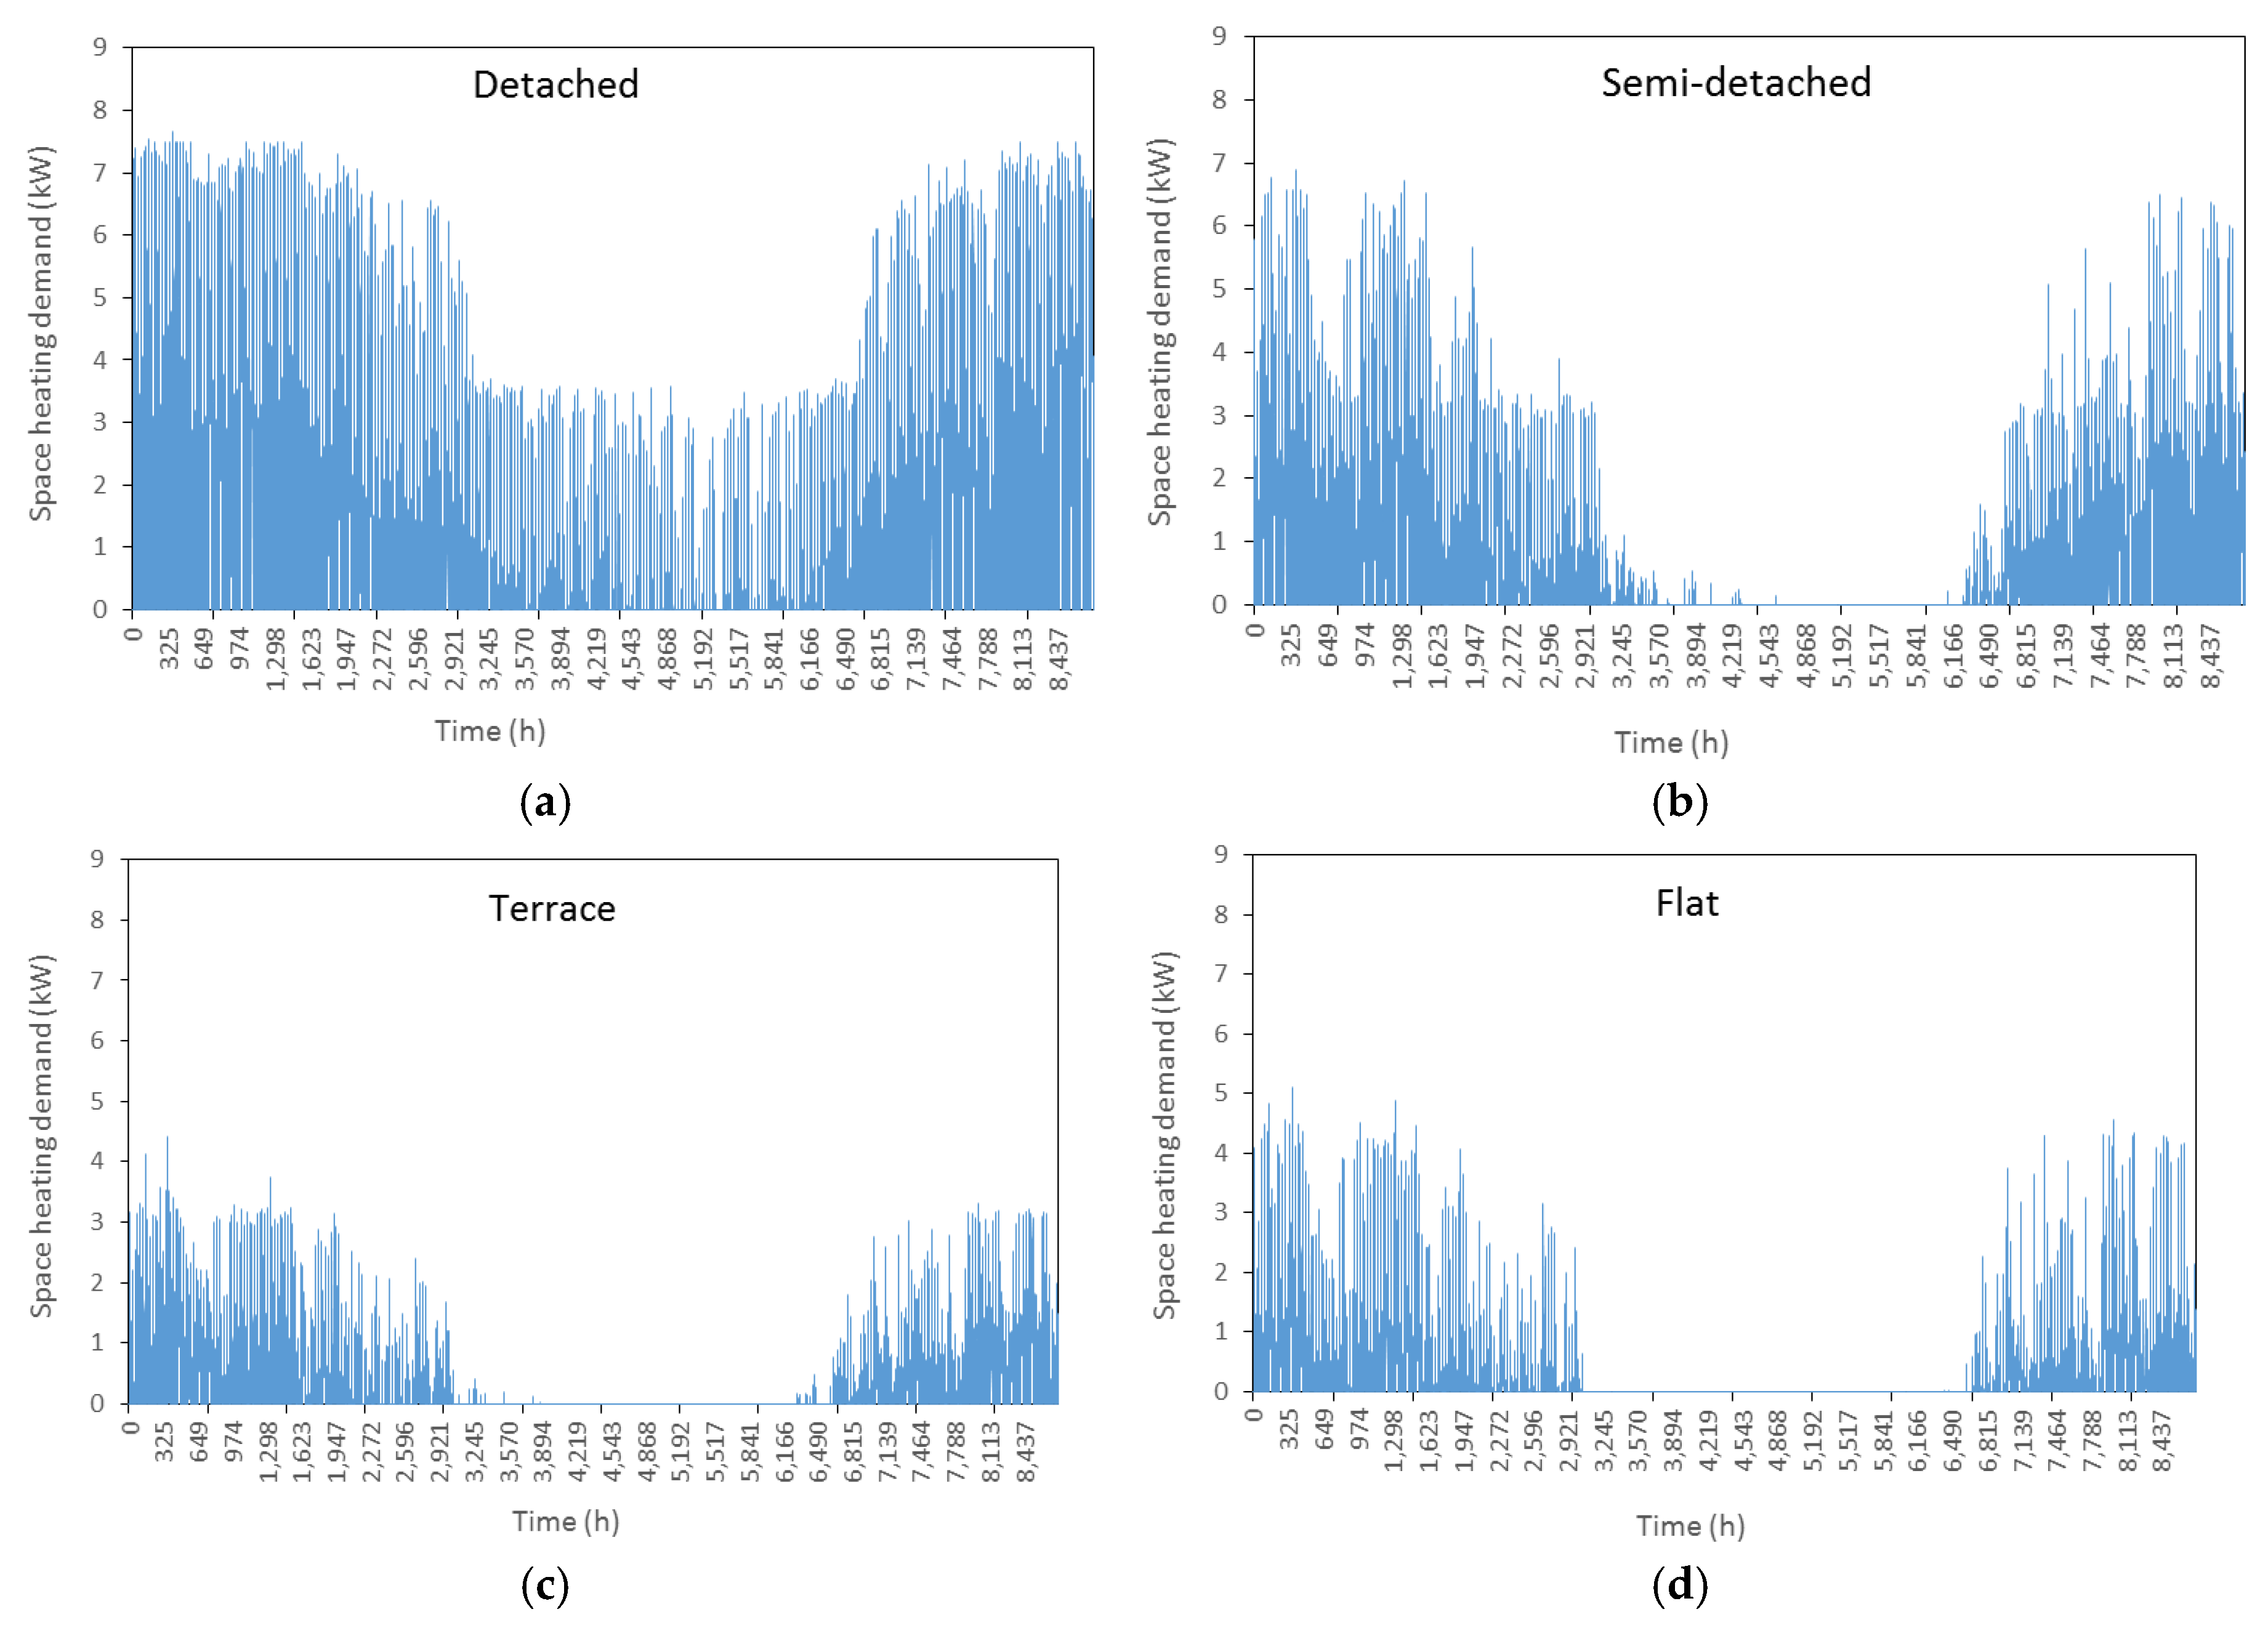
Given the energy demands for different dwelling types, the space heating demand for a detached house, semi-detached house, terrace and flat are presented in Figure 2, associated hot water demand in Figure 3, summary provided in Table 1. Simulation models of four key UK house types is presented in Allison et al. [34]. The simulation models enable the dynamic thermal demand (heating and hot water) of each house to be quantified over a range of different operating conditions. Occupancy, insulation levels, and construction thermal characteristics are defined in the earlier work done in Allison et al. [34]. A micro-CHP, boiler and TES are available to satisfy the energy demand. Different design scenarios were developed and analysed to assess TES integration. They are, design with and without TES, and design with/without incentives. Since TES is not a stand-alone technology, fiscal incentives such as the FIT to support the deployment of micro-CHP is adapted; where the value for production and export are 13.45 and 4.91 p/kWh respectively [36]. Another instrument explored is the exemption from the CO2 levy (current central value is 0.063 £/kg) [37], especially when the CO2 of the system designed is less than the BAU.
3.2. Results and Discussion
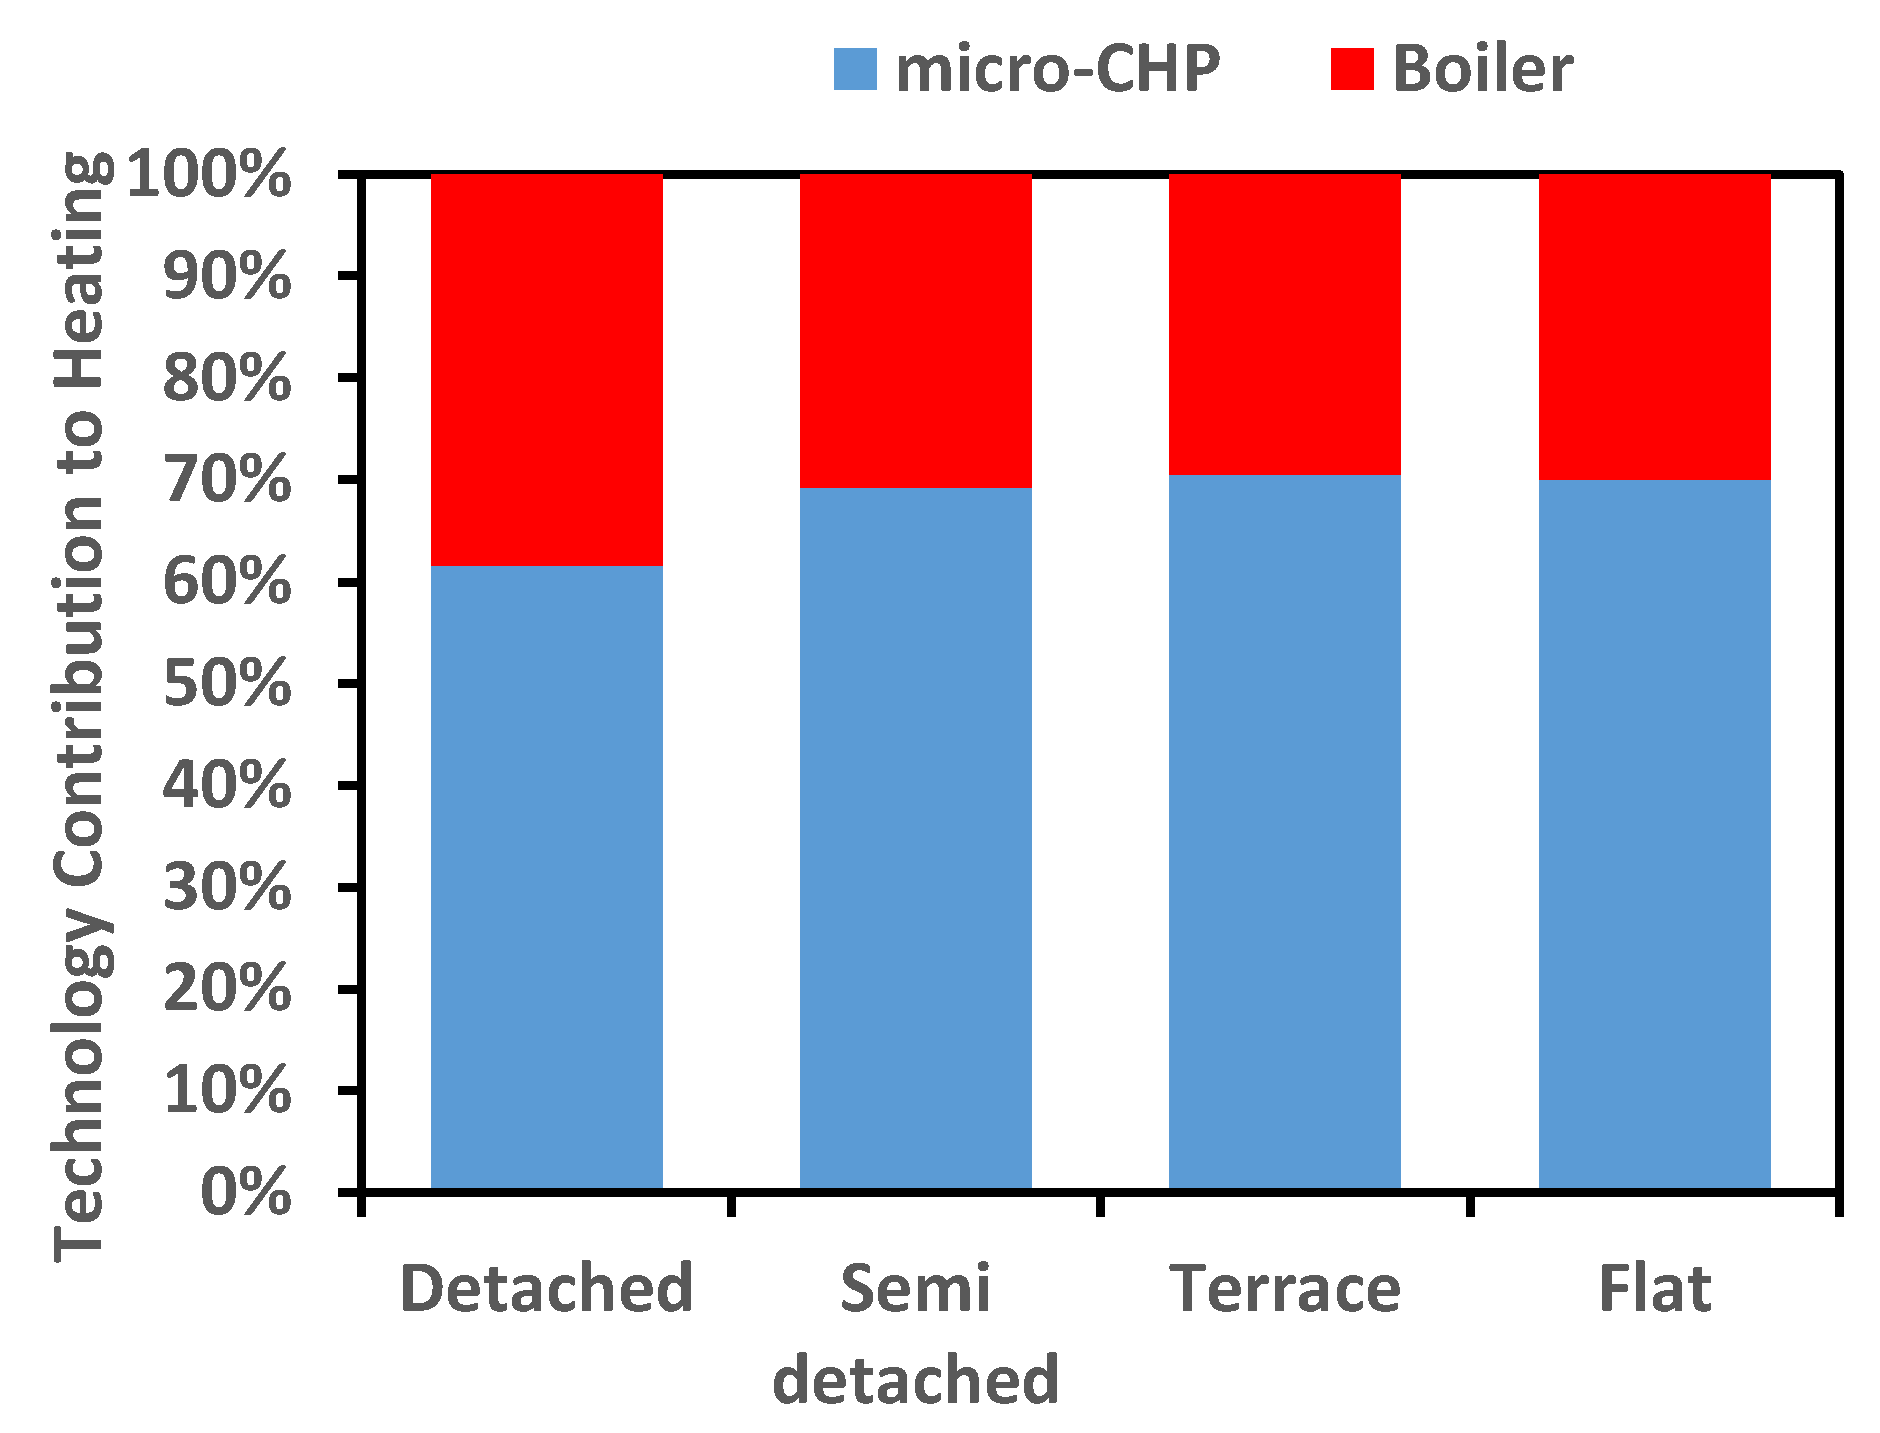
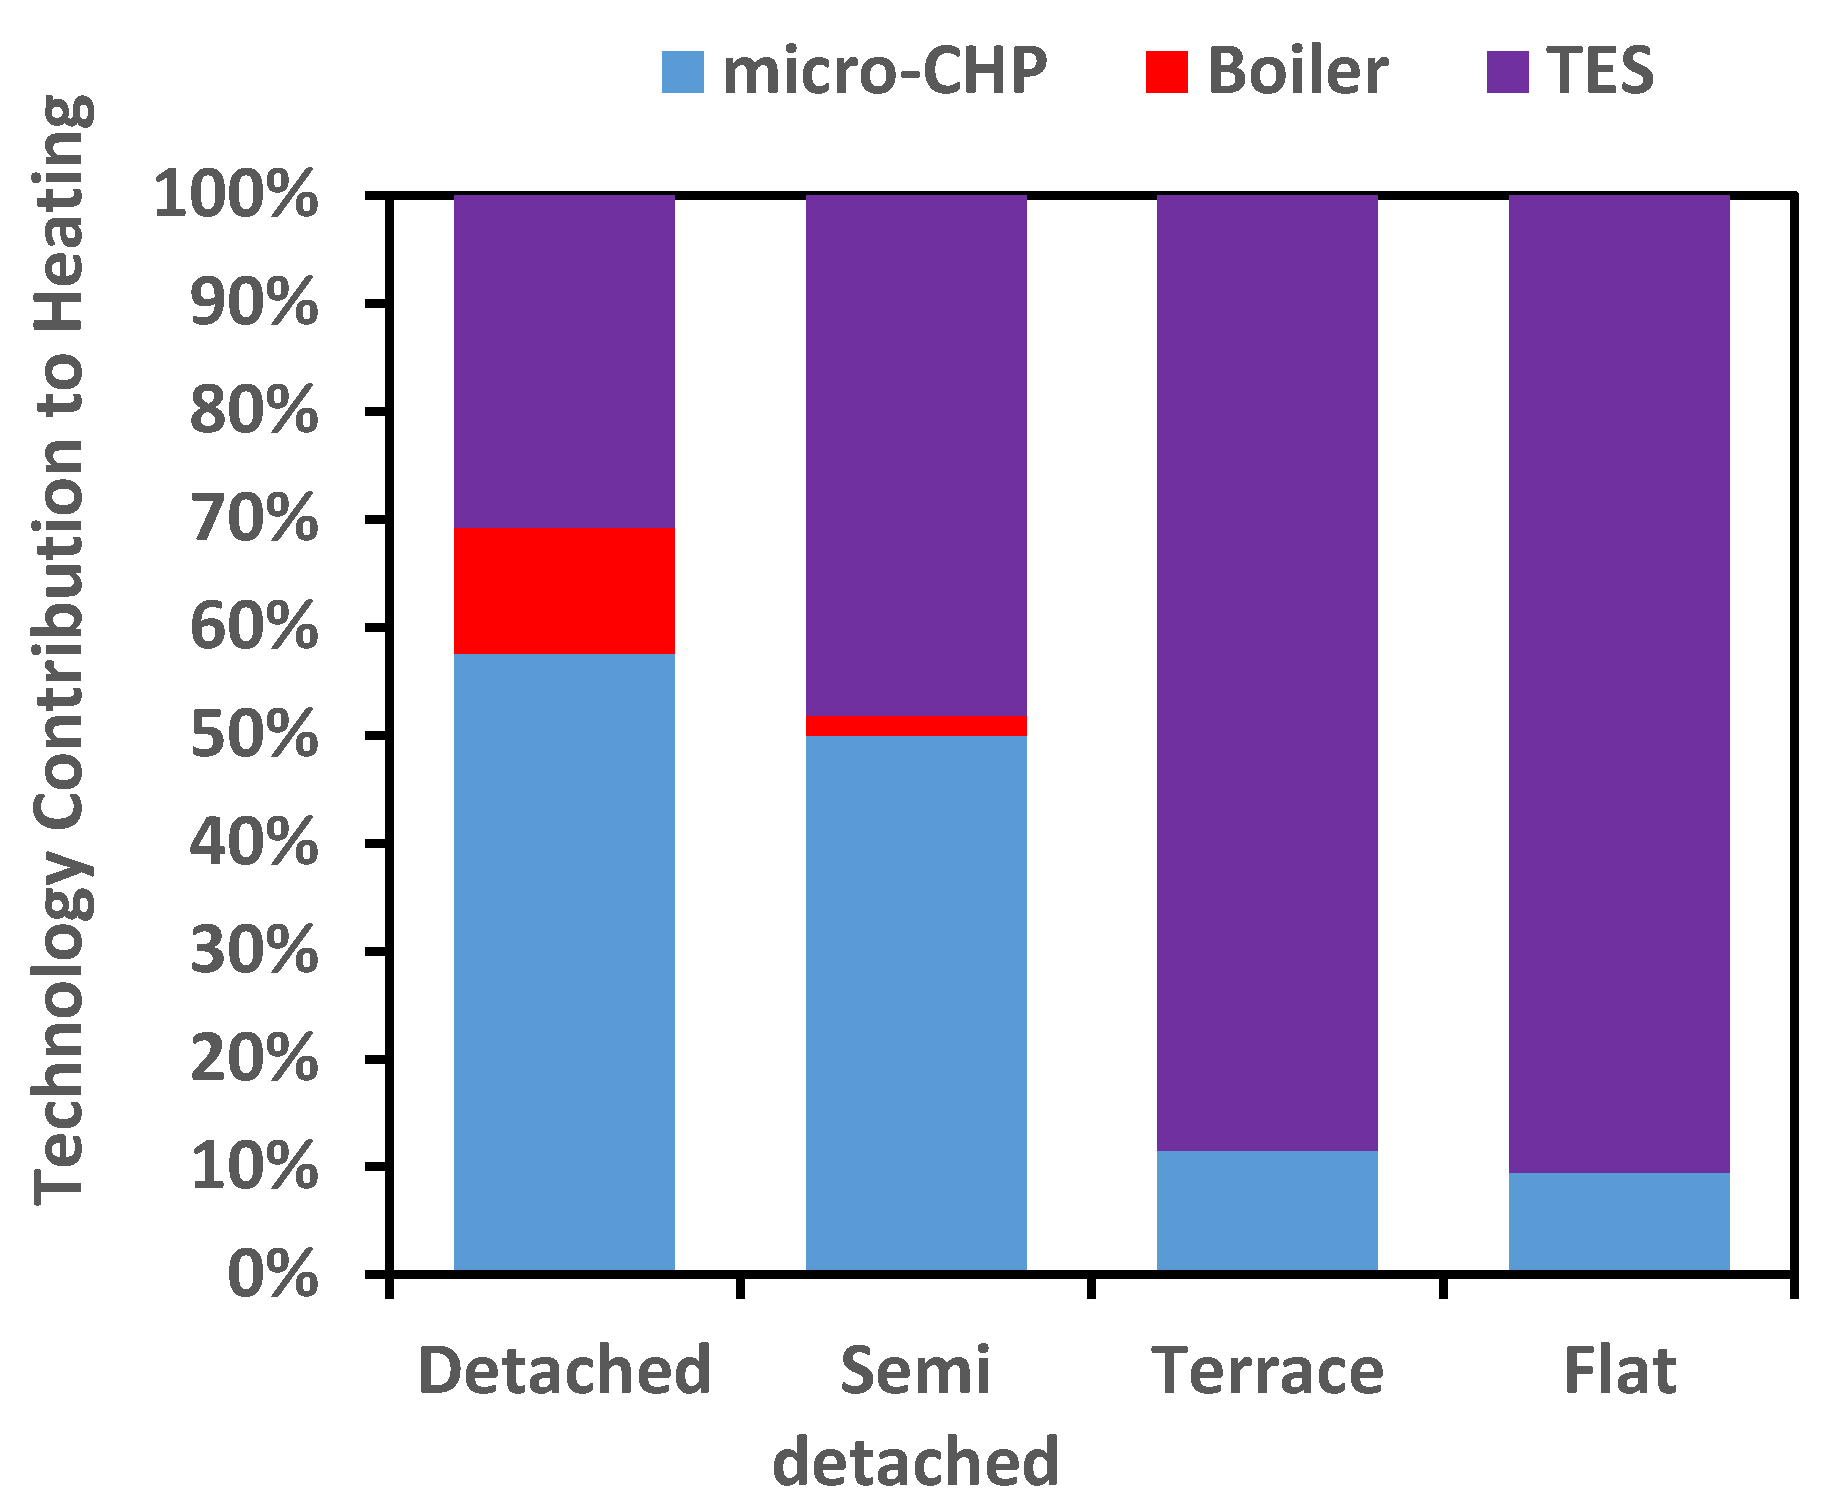
The contribution of each technology to heat produced under different scenarios are presented in Figure 4, Figure 5, Figure 6 and Figure 7. In the absence of incentives, and for design without TES, the micro-CHP contributes more to the heat supply compared to the auxiliary boiler. The contribution depends on the house type, increasing from detached to flats. A micro-CHP is better suited to a house with high demands, hence the EAI is highest for a detached house as shown in Table 2. The optimiser maximises the use of the micro-CHP for the semi-detached, terrace and flat, in order to improve their economics. For design with TES, the boiler contribution reduces to 0% for a flat. The majority of the heat in the store is supplied from the micro-CHP. The TES size for a semi-detached, terrace and flat is higher than for a detached house, because since the design for the other houses are uneconomic, the optimiser will maximise the use of storage to improve the economic viability. This will ensure the micro-CHP does not operate all the time resulting in a decrease in operational costs. Hence the heat diverted to storage increases from detached to flat (Figure 6). The heat diverted to storage is more for a non-incentivised design compared to the design with incentives.
Other benefits of TES integration are reduction in net CO2 emissions, TDE, and in this case more income for the home owner (Table 2 and Table 3). The benefits are dependent on house type, increasing based on the total space heating and hot water demand.
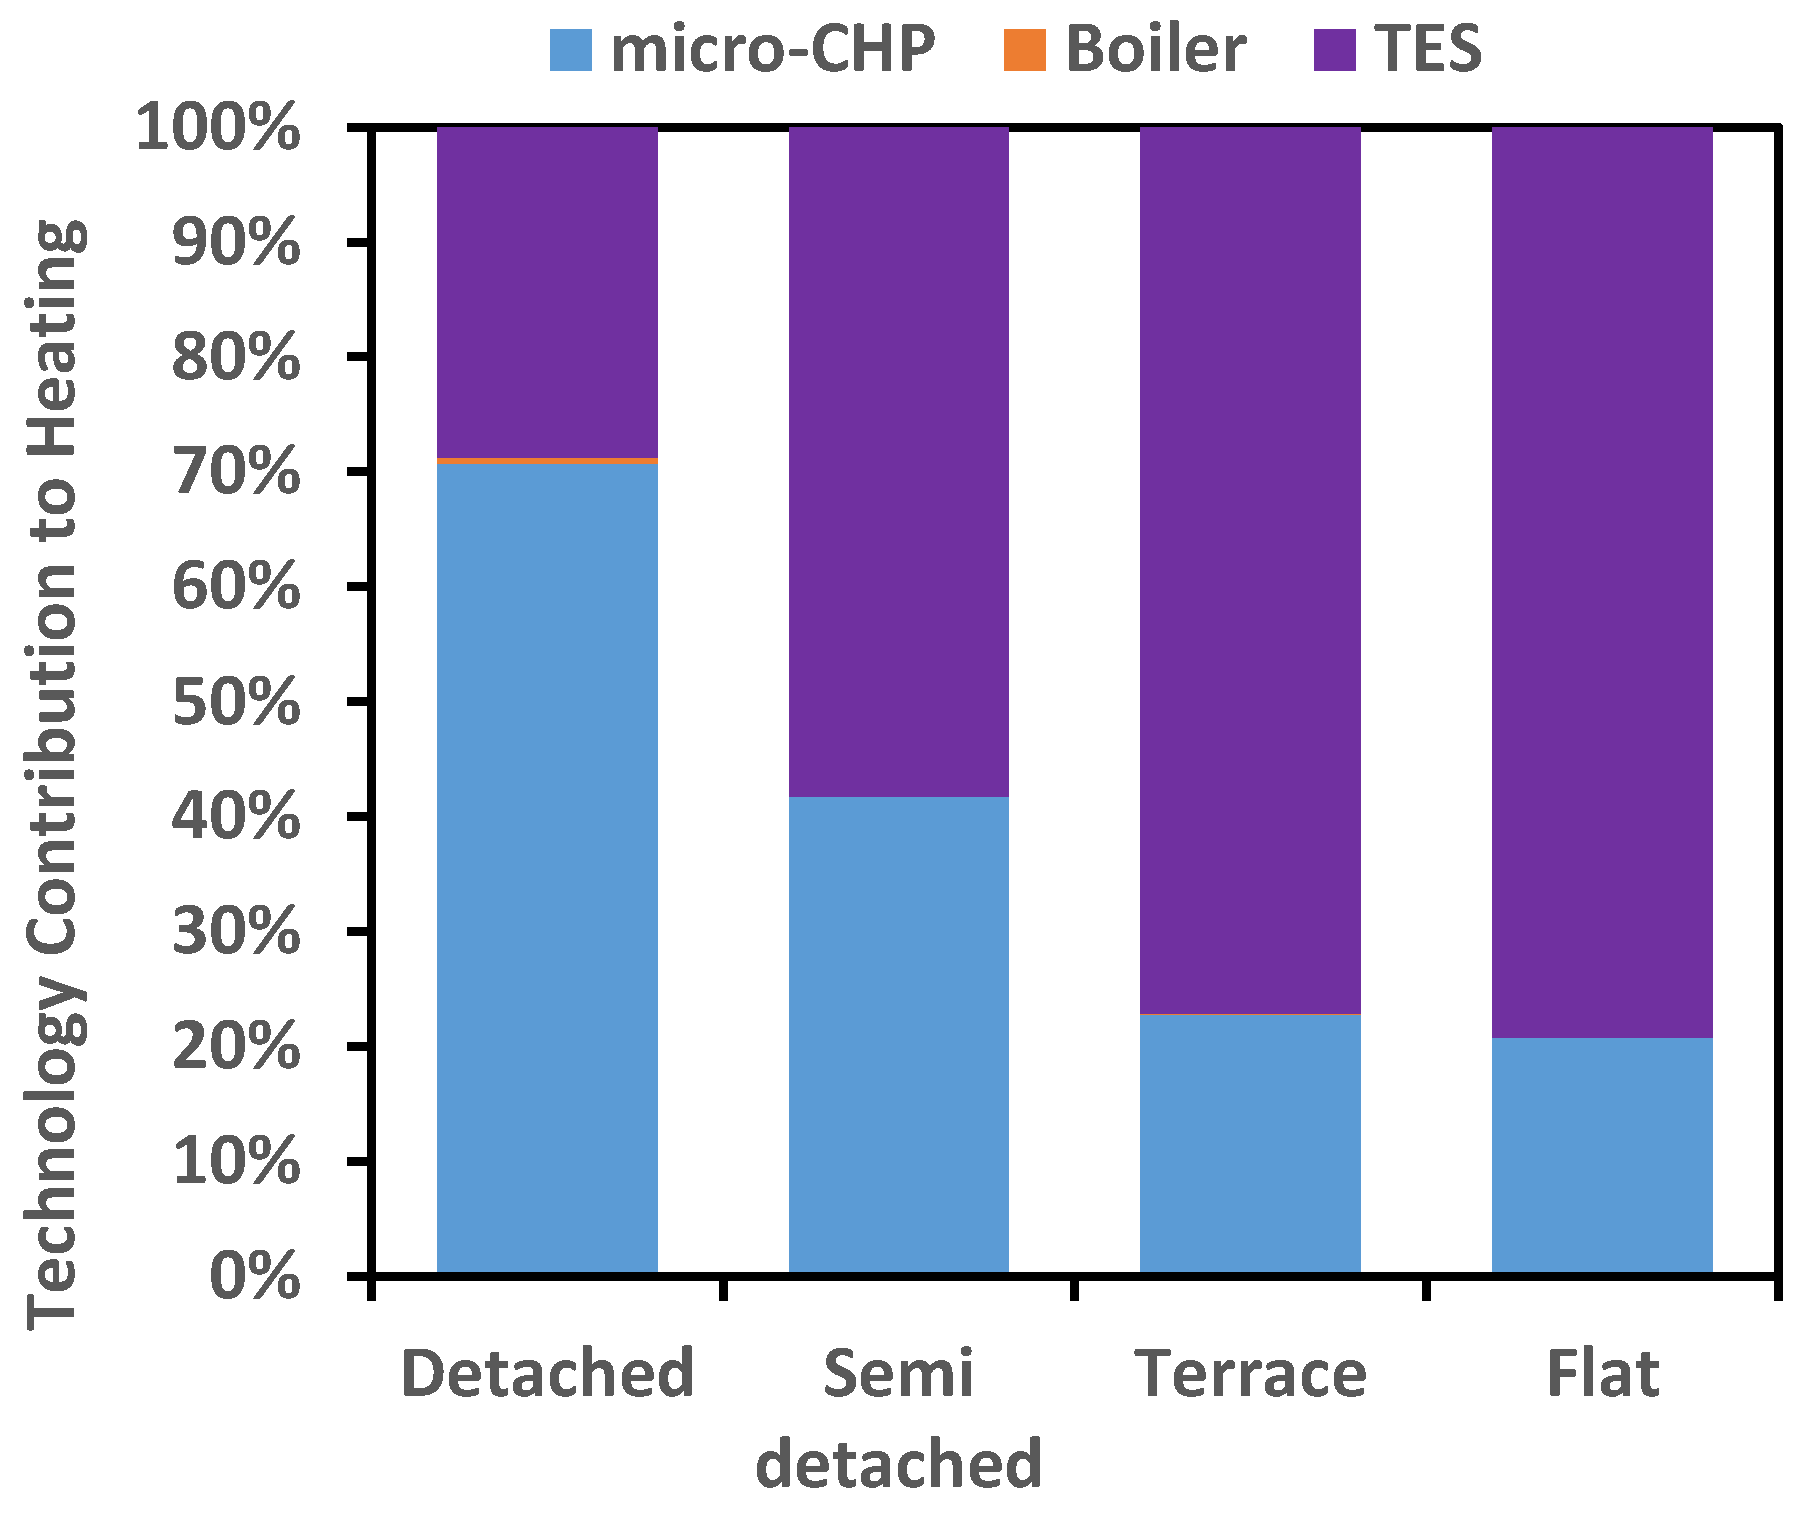
A major barrier to implementing micro generation is cost, when the FIT is introduced in the optimisation, the income for the home owner increases (Table 3). A further increase is possible when TES is integrated. However, for this design the net CO2 emissions and TDE is slightly higher (Table 3) due to an increase in the micro-CHP fuel consumption. For the design without TES, over 90% of the heat is supplied from the micro-CHP. With TES, the boiler’s contribution is negligible for a detached house, and nil for the remaining house types (Figure 7). Grid electricity import increases from detached to flat for the cases, that is, without and with incentives. The contribution from the grid is more when thermal storage is not integrated. Contribution from the grid is less with TES and incentives, however, there is no change for terraces and flats.
Without incentives, the payback of the accompanying system is greater than 10 and has a negative return on investment. A higher payback and lower NPV is observed for design without TES. Additionally, the TES size is greater compared to the incentivised design in Table 3. The TES is also discharged more efficiently (Figure 8 and Figure 9). A higher TES size is selected in order to maximise the use of the micro-CHP for off-setting the increased costs when electricity import tariff is high. Therefore, more heat is diverted to storage (Figure 8) compared to Figure 9. For the incentivised design, it is economic to integrate the micro-CHP, hence the need to reduce the cost becomes less and the TES size reduces (Table 3 and Figure 9). The x-axis in Figure 8 and Figure 9 are the temporal precision of the first 10 days in the year.
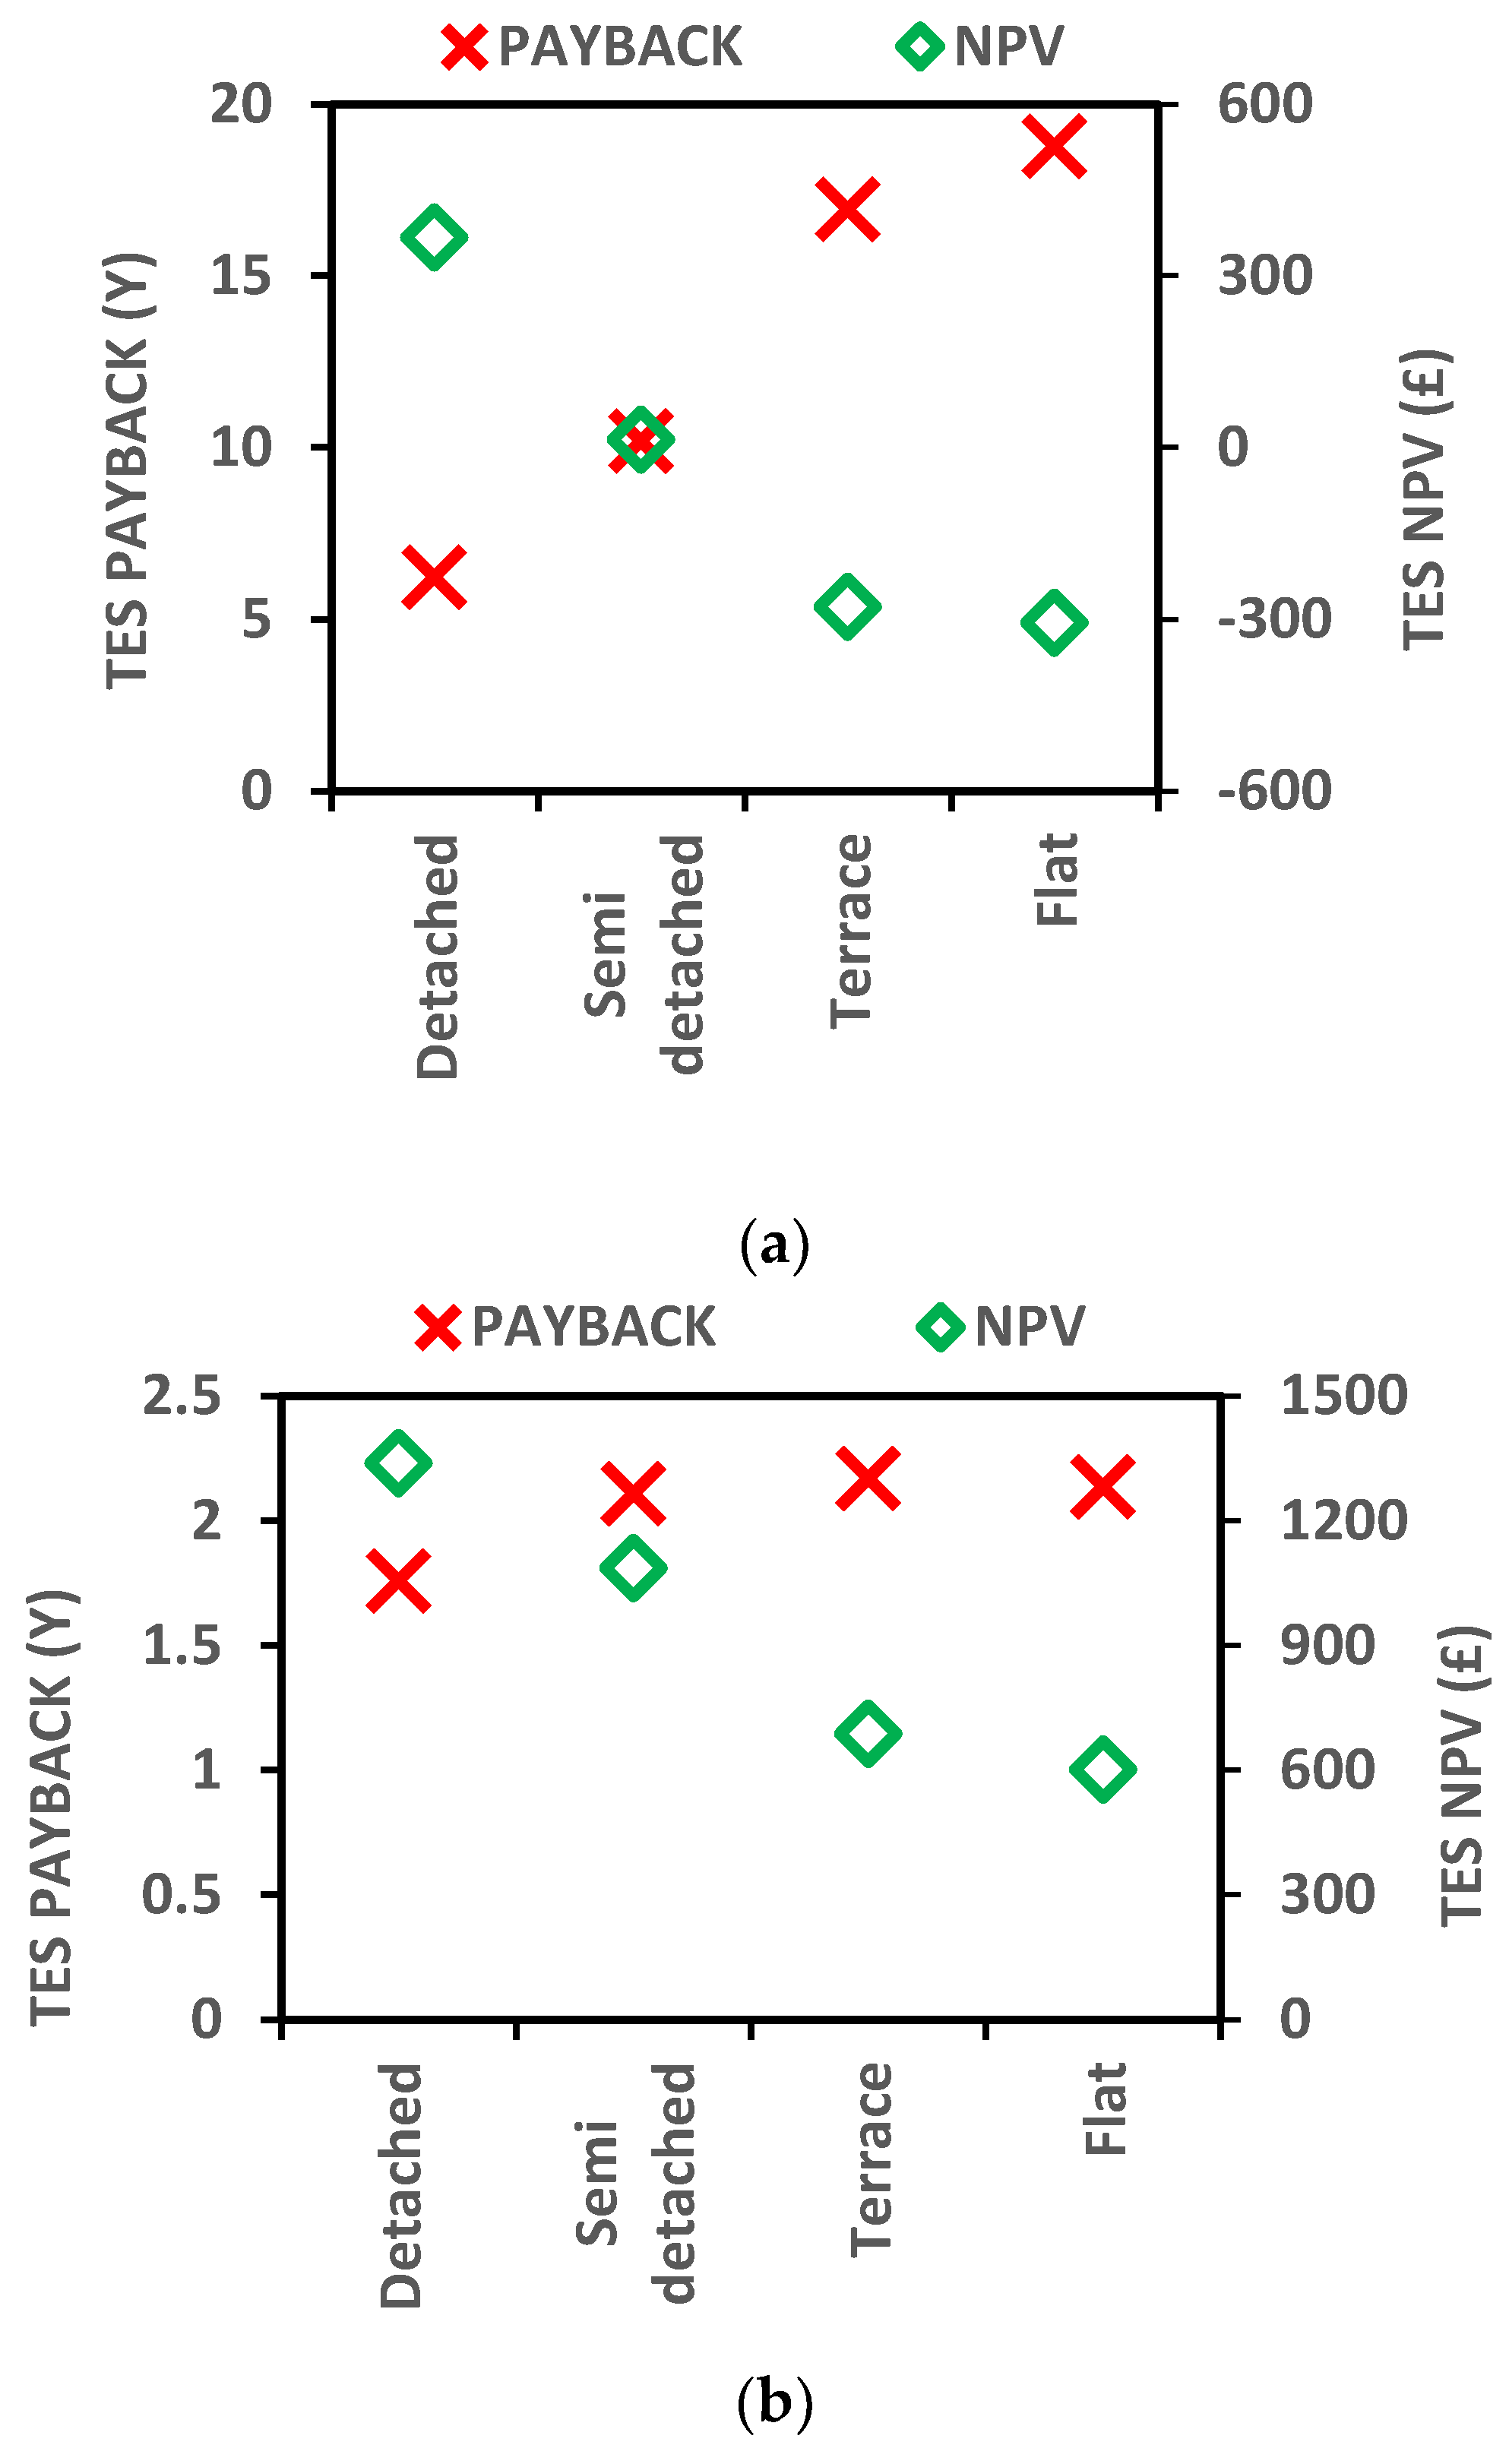
In the non-incentivised scenario with TES, the system payback is 14 years for a detached house; additional benefits from TES integration (i.e., increase in the EAI), can pay for the additional investment in TES within the first 6.24 years, with a positive NPV of £368 (Figure 10a). The TES payback and NPV is different for each house type. Whilst in the incentivised scenario (based on the FIT) TES investment can be paid for during the first 1.78 years for a system payback of 4.9 years. The NPV is £1339 (Figure 10b). Another way to incentivise is savings based on reduced CO2 emissions when TES is integrated (Table 2). In 2016, the CO2 central non-traded levy is 0.063 £/kg [36]. Using the CO2 reduced, the savings for a detached, semi-detached, terrace and flat are £70, £57, £37 and £32. This has potential to reduce the additional investment in TES. When incentivised using the CO2 levy, the TES investment is paid back in the first 5.65 years, with NPV of £463.60 (Figure 10c). There is a clear relationship with the type of house; the payback increases and NPV reduces (negative in some houses). Hence, even when the system is not economically viable, TES integration is economically viable.
3.3. Limitations of This Work
The findings of this work need to be viewed alongside the assumptions on demand, energy prices, and CO2 emission factors. Whilst the assumptions have been taken from reputable sources, they are subject to variations. Furthermore, the support mechanisms mentioned in the report are currently in operation and are also dynamic.
4. Conclusions
A multi-period MILP model is presented and used to provide a case to support incentivising TES. The accuracy of the model is improved through the use of less temporal precision to represent demand and technology characteristics. The introduction of additional binary variables for charging/discharging the store, and import/export of electricity also reduces the model complexity.
The case to support incentivising TES was established based on a techno-economic assessment of the design obtained with and without TES, and with and without incentives. Assessment metrics used were the EAI for a homeowner, net CO2 emissions, the TDE, and the system payback and NPV. A new assessment based on the payback and NPV associated with additional investment in TES was also introduced. Results show the benefit from micro generation and TES integration depend on the house type; in this case highest for a detached house. For a detached house, TES integration reduces the TDE by 792 kWh/r, CO2 by 146 kg/year and the homeowner makes 60 £/year. These additional incomes means TES investment can be paid for in the first 6.24 years during the 14 years of system payback. This provides evidence to support incentivisation. When value is added to CO2 reduction based on CO2 levy, the payback for TES reduces to 5.65 years and NPV also increases. With the FIT scheme, for a system payback of 4.9 years, TES investment can be paid back during the first 1.759 years. In the non-incentivised case, even though investment in micro-CHP is not economically viable, the additional investment in TES is economically viable. Therefore, TES incentivisation needs to receive more attention. The future uptake of LZC technologies will be influenced by financial incentives to encourage end-user investments.
There is need to establish which of the accompanying technologies is more beneficial. This forms the basis of future work. Another area worth investigating is establishing the flexibility potential of thermal storage in domestic houses.
Author Contributions
Gbemi Oluleye and Adam Hawkes defined the research questions, and contextualized the problem statement; Gbemi Oluleye wrote the GAMS code and ran the optimization model; John Allison and Nicolas Kelly developed the simulation models for the four key UK house types considered. Gbemi Oluleye wrote the paper with input from all co-authors.
Acknowledgments
The authors would like to thank the Engineering and Physical Sciences Research Council (EPSRC) for funding the research reported in this paper under grant EP/N021479/1 as part of its Thermal Energy Challenge programme.
Conflicts of Interest
The authors declare no conflict of interest.
Nomenclature
| Sets | |
| r ∈ R | Set of all time periods |
| Independent variables | |
| QCHP | Heat produced from micro-CHP (kW) |
| QBOI | Heat produced from boiler (kW) |
| QTES,IN | Heat diverted into storage, (kW) |
| QTES,OUT | Heat delivered from storage (kW) |
| SizeTES | Total storage capacity (kWh) |
| WIMP | Electricity imported to satisfy demand (kW) |
| WEXP | Electricity exported (kW) |
| Dependent variables | |
| ACC | Annualised capital cost (£/year) |
| EAC | Equivalent Annual Cost (£/year) |
| FC | Fuel cost (£/year) |
| MC | Maintenance cost (£/year) |
| WGRID,NET | Net electricity cost (£/year) |
| Binary variables | |
| YCHP | Binary variable for technology operation |
| YEI | Binary variable for export/import of electricity |
| YTES | Binary variable for charging/discharging the store |
| ZCHP | Binary variable for technology existence |
| Parameters | |
| FEF | Fuel emission factor (kg/kWh) |
| GIMP | Grid electricity import price (£/kWh) |
| GEXP | Grid electricity export price (£/kWh) |
| GEE | Grid energy efficiency (%) |
| GEF | Grid emission factor (kg/kWh) |
| ICCHP | Micro-CHP installed capital (£/kW) |
| ICTES | TES installed capital (£/kW) |
| ISH | Initial store heat (%) |
| IR | Interest rate |
| θ | Storage losses (%) |
| Lo | Lower limit |
| MCCHP | Micro-CHP maintenance cost (£/kWh) |
| MCTES | TES maintenance cost (£/kWh) |
| n | Technology lifetime (years) |
| PerfBOI | Boiler performance |
| PerfCHP | Micro-CHP performance |
| Qdemand | Heat demand (both hot water and space heating) (kW) |
| SizeCHP | Micro-CHP capacity (kW) |
| ts | Time precision |
| UEI | Upper limit for electricity export and import |
| Uo | Upper limit for micro-CHP power |
| Wdemand | Electricity demand (kW) |
| ƞcharge | TES charge efficiency (%) |
| ƞdischarge | TES discharge efficiency (%) |
Appendix A

| Technical Attributes | Natural Gas Boiler | Micro-CHP (1 kW) | Micro-CHP (2 kW) | Micro-CHP (4 kW) | Hot Water Tank |
|---|---|---|---|---|---|
| Turnkey cost (£/kW) | 163 | 3110 | 2400 | 1900 | 20 |
| Maintenance cost (£/kWh) | 0.001 | 0.01 | 0.01 | 0.01 | 0.001 |
| Performance | 0.895 | 0.9 | 0.9 | 0.9 | 2.75 |
| Charge efficiency (%) | - | - | - | - | 90 |
| Discharge efficiency (%) | - | - | - | - | 90 |
| Initial store heat (%) | - | - | - | - | 100 |
The micro-CHP heat to power ratio is 0.385. The design year is 2016. Off-peak and peak electricity import tariffs are 5.5 and 15.29 p/kWh, and fuel price is 3.48 p/kWh [36]. The average CO2 factor associated with natural gas and electricity was assumed to be 0.185 and 0.519 kg/kWh [36]. Technology lifetime is 15 years and discount rate 5%. CEPCI cost factors were applied to adjust the costs from the year provided to 2016.
References
- International Energy Agency; Energy Technology Systems Analysis Program (ETSAP); International Renewable Energy Agency. Thermal Energy Storage, Technology Brief E17. January 2013. Available online: https://www.irena.org/DocumentDownloads/Publications/IRENA-ETSAP%20Tech%20Brief%20E17%20Thermal%20Energy%20Storage.pdf (accessed on 23 March 2017).
- Balcombe, P.; Rigby, D.; Azapagic, A. Investigating the importance of motivations and barriers related to microgeneration uptake in the UK. Appl. Energy 2014, 130, 403–418. [Google Scholar] [CrossRef]
- Cherrington, R.; Goodship, V.; Longfield, A.; Kirwan, K. The feed-in tariff in the UK: A case study focus on domestic photovoltaic systems. Renew. Energy 2013, 50, 421–426. [Google Scholar] [CrossRef]
- EASE/EERA. European Energy Storage Technology Development Roadmap Toward 2030. 2013. Available online: http://www.eera-set.eu/wp-content/uploads/148885-EASE-recommendations-Roadmap-04.pdf (accessed on 8 December 2016).
- Spataru, C.; Kok, Y.C.; Barrett, M.; Sweetnam, T. Techno-economic assessment for optimal energy storage mix. Energy Procedia 2015, 83, 515–524. [Google Scholar] [CrossRef]
- Oluleye, G.; Hawkes, A.D.; Allison, J.; Kelly, N.; Clarke, J. An optimisation study on integrating and incentivising Thermal Energy Storage (TES) in a dwelling energy system. In Proceedings of the Sustainable Development of Energy, Water and Environment Systems Conference, Dubrovnik, Croatia, 4–8 October 2017. [Google Scholar]
- Brandoni, C.; Arteconi, A.; Ciriachi, G.; Polonara, F. Assessing the impact of micro-generation technologies on local sustainability. Energy Convers. Manag. 2014, 87, 1281–1290. [Google Scholar] [CrossRef]
- Sorace, M.; Gandiglio, M.; Santarelli, M. Modelling and techno-economic analysis of the integration of a FC-based micro-CHP system for residential application with a heat pump. Energy 2015, 120, 275–2015. [Google Scholar]
- Díaz, G.; Moreno, B. Valuation under uncertain energy prices and load demands of micro-CHP plants supplemented by optimally switched thermal energy storage. Appl. Energy 2016, 177, 553–569. [Google Scholar] [CrossRef]
- Fubara, T. K.; Cecelja, F.; Yang, A. Modelling and selection of micro-CHP systems for domestic energy supply: The dimension of network-Wide primary energy consumption. Appl. Energy 2014, 114, 327–334. [Google Scholar] [CrossRef]
- Murugan, S.; Horák, B. A review of micro combined heat and power systems for residential applications. Renew. Sustain. Energy Rev. 2016, 64, 144–162. [Google Scholar] [CrossRef]
- Eames, P.; Loveday, D.; Haines, V.; Romanos, P. The Future Role of Thermal Energy Storage in the UK Energy System: An Assessment of the Technical Feasibility and Factors Influencing Adoption—Research Report; REF UKERC/RR/ED/2014/001; UKERC: London, UK, 2014. [Google Scholar]
- Barbieri, E.S.; Melino, F.; Morini, M. Influence of the thermal energy storage on the profitability of micro-CHP systems for residential building applications. Appl. Energy 2012, 97, 714–722. [Google Scholar] [CrossRef]
- Arteconi, A.; Hewitt, N.; Polonara, F. State of the art of thermal storage for demand-side management. Appl. Energy 2012, 93, 371–389. [Google Scholar] [CrossRef]
- Bogdan, Z.; Kopjar, D. Improvement of the cogeneration plant economy by using heat accumulator. Energy 2006, 31, 2285–2292. [Google Scholar] [CrossRef]
- Oluleye, G.; Vasquez, L.; Smith, R.; Jobson, M. A multi-period mixed integer linear program for design of residential distributed energy centres with thermal demand data discretisation’. Sustain. Prod. Consum. 2016, 5, 16–28. [Google Scholar] [CrossRef]
- Committee on Climate Change 2013. Fourth Carbon Budget Review-Part 2: The Cost-Effective Path to the 2050 Target. Committee on Climate Change. Available online: http://www.theccc.org.uk/wp-content/uploads/2013/12/1785a-CCC_AdviceRep_Singles_1.pdf (accessed on 25 July 2017).
- Kelly, N.J.; Tuohy, P.G.; Hawkes, A.D. Performance assessment of tariff-based air source heat pump load shifting in a UK detached dwelling featuring phase change-enhanced buffering. Appl. Therm. Eng. 2014, 71, 809–820. [Google Scholar] [CrossRef] [Green Version]
- Salata, F.; Golasi, I.; Domestico, U.; Banditelli, M.; Lo Basso, G.; Nastasi, B.; de Lieto Vollaro, A. Heading towards the nZEB through CHP+HP systems. A comparison between retrofit solutions able to increase the energy performance for the heating and domestic hot water production in residential buildings. Energy Convers. Manag. 2017, 138, 61–76. [Google Scholar] [CrossRef]
- Mongibello, L.; Capezzuto, M.; Graditi, G. Technical and cost analyses of two different heat storage systems for residential micro-CHP plants. Appl. Therm. Eng. 2014, 71, 636–642. [Google Scholar] [CrossRef]
- Vögelin, P.; Koch, B.; Georges, G.; Boulouchos, K. Heuristic approach for the economic optimisation of combined heat and power (CHP) plants: Operating strategy, heat storage and power. Energy 2017, 121, 66–77. [Google Scholar] [CrossRef]
- Shaneb, O.; Coates, G.; Taylor, P. Sizing of residential μCHP systems. Energy Build. 2011, 43, 1991–2001. [Google Scholar] [CrossRef]
- Hawkes, A.; Leach, M. Modelling high level system design and unit commitment for a microgrid. Appl. Energy 2009, 86, 1253–1265. [Google Scholar] [CrossRef]
- Ren, H.; Gao, W.; Ruan, Y. Optimal Sizing for Residential CHP System. Chall. Power Eng. Environ. 2007, 73–79. [Google Scholar] [CrossRef]
- Merkel, E.; Mckenna, R.; Fichtner, W. Optimisation of the capacity and the dispatch of decentralised micro-CHP systems: A case study for the UK. Appl. Energy 2015, 140, 120–134. [Google Scholar] [CrossRef]
- Mckenna, R.; Merkel, E.; Fichtner, W. Energy autonomy in residential buildings: A techno-economic model-based analysis of the scale effects. Appl. Energy 2017, 189, 800–815. [Google Scholar] [CrossRef]
- Pruitt, K.A.; Braun, R.J.; Newman, A.M. Evaluating shortfalls in mixed-integer programming approaches for the optimal design and dispatch of distributed generation systems. Appl. Energy 2013, 102, 386–398. [Google Scholar] [CrossRef]
- Hawkes, A.; Leach, M. Impacts of temporal precision in optimisation modelling of micro-Combined Heat and Power. Energy 2005, 30, 1759–1779. [Google Scholar] [CrossRef]
- Baeten, B.; Rogiers, F.; Helsen, L. Reduction of heat pump induced peak electricity use and required generation capacity through thermal energy storage and demand response. Appl. Energy 2017, 195, 184–195. [Google Scholar] [CrossRef]
- Fragaki, A.; Andersen, A.N.; Toke, D. Exploration of economical sizing of gas engine and thermal store for combined heat and power plants in the UK. Energy 2008, 33, 1659–1670. [Google Scholar] [CrossRef]
- Renaldi, R.; Kiprakis,, A.; Friedrich, D. An optimisation framework for thermal energy storage integration in a residential heat pump heating system. Appl. Energy 2017, 186, 520–529. [Google Scholar] [CrossRef]
- Hussain, A.; Bui, V.; Kim, H.; Im, Y.; Lee, J. Optimal Energy Management of Combined Cooling, Heat and Power in Different Demand Type Buildings Considering Seasonal Demand Variations. Energies 2017, 10, 789. [Google Scholar] [CrossRef]
- Bianco, V.; Scarpa, F.; Tagliafico, L. Estimation of primary energy savings by using heat pumps for heating purposes in the residential sector. Appl. Therm. Eng. 2017, 114, 938–947. [Google Scholar] [CrossRef]
- Allison, J.; Bell, K.; Clarke, J.; Cowie, A.; Elsayed, A.; Flett, G.; Oluleye, G.; Hawkes, A.; Hawker, G.; Kelly, N.; et al. Assessing domestic heat storage requirements for energy flexibility over varying timescales. Appl. Therm. Eng. 2018, 136, 602–616. [Google Scholar] [CrossRef]
- Standard European Electrical Profiles. IEA/ECBCS Annex 42 The Simulation of Building-Integrated Fuel Cell and Other Cogeneration Systems. 2006. Available online: http://www.buildup.eu/en/practices/publications/iea-ecbes-annex-42-simulation-building-integrated-fuel-cell-and-other (accessed on 19 October 2016).
- Office of Gas and Electricity Markets (Ofgem) Feed-In Tariff (FIT) Rates. 2017. Available online: https://www.ofgem.gov.uk/environmental-programmes/fit/fit-tariff-rates (accessed 10 December 2017.
- Department of Business, Energy and Industrial Strategy, Data tables 1–20 supporting the toolkit and the guidance. Available online: https://www.gov.uk/government/publications/valuation-of-energy-use-and-greenhouse-gas-emissions-for-appraisal (accessed on 15 September 2016).
Figure 1.
Model summary. CHP: Combined Heat and Power; TES: Thermal Energy Storage.
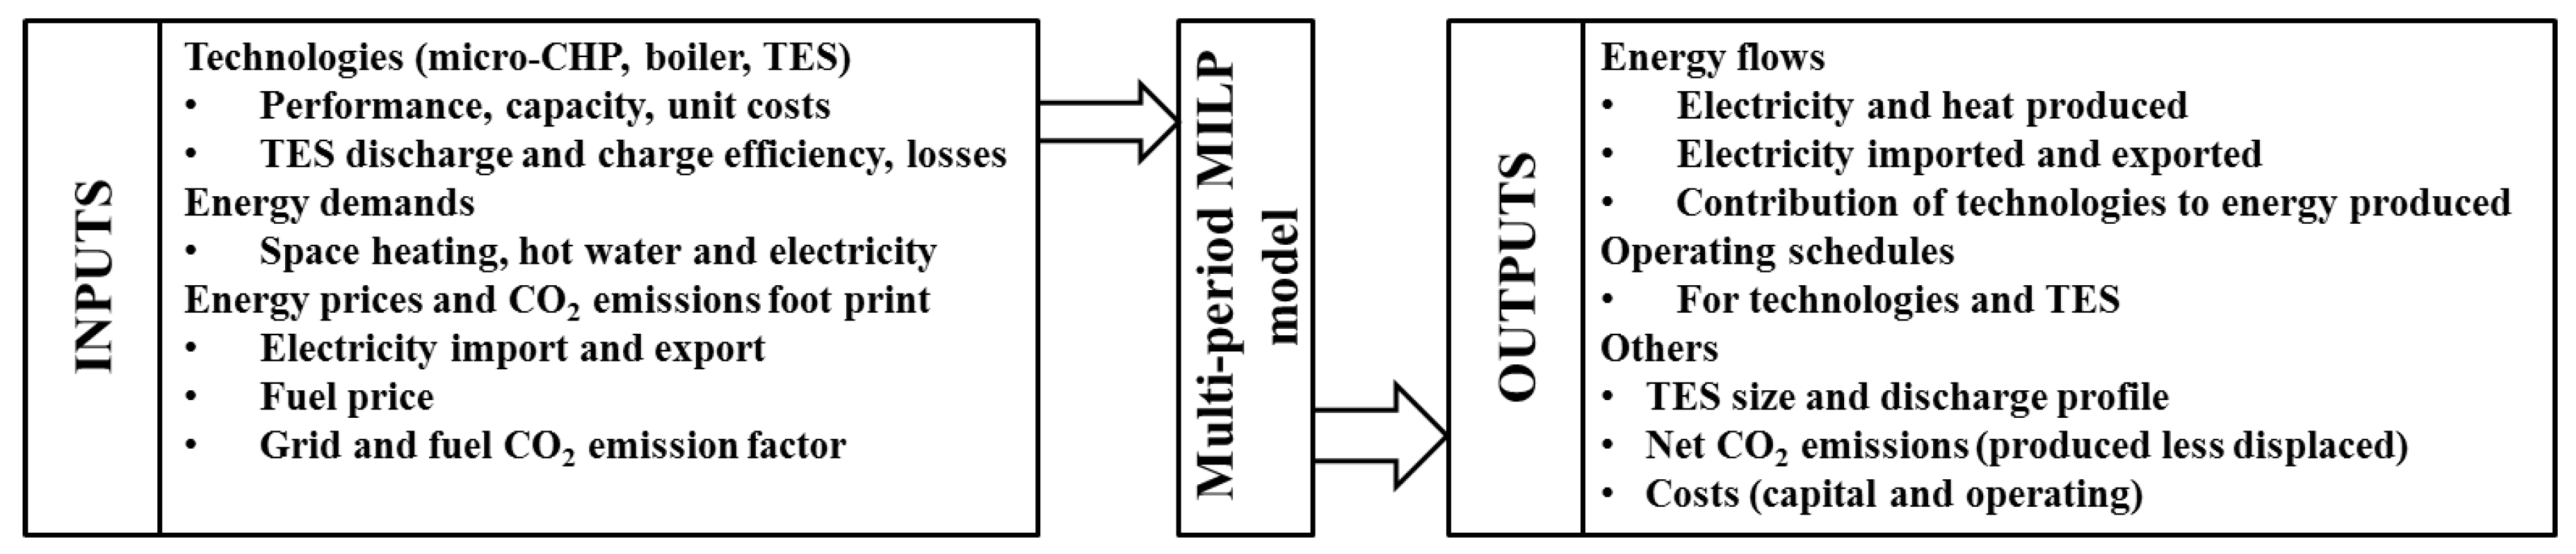
Figure 2.
Space heating demand for all house types: (a) Detached; (b) Semi-detached; (c) Terrace; (d) Flat.
Figure 2.
Space heating demand for all house types: (a) Detached; (b) Semi-detached; (c) Terrace; (d) Flat.

Figure 3.
Hot water demand for all house types: (a) Detached; (b) Semi-detached; (c) Terrace; (d) Flat.
Figure 3.
Hot water demand for all house types: (a) Detached; (b) Semi-detached; (c) Terrace; (d) Flat.

Figure 4.
Non-incentivised design without thermal energy storage (TES).

Figure 5.
Incentivised design (Feed in Tariff (FIT)) without TES.
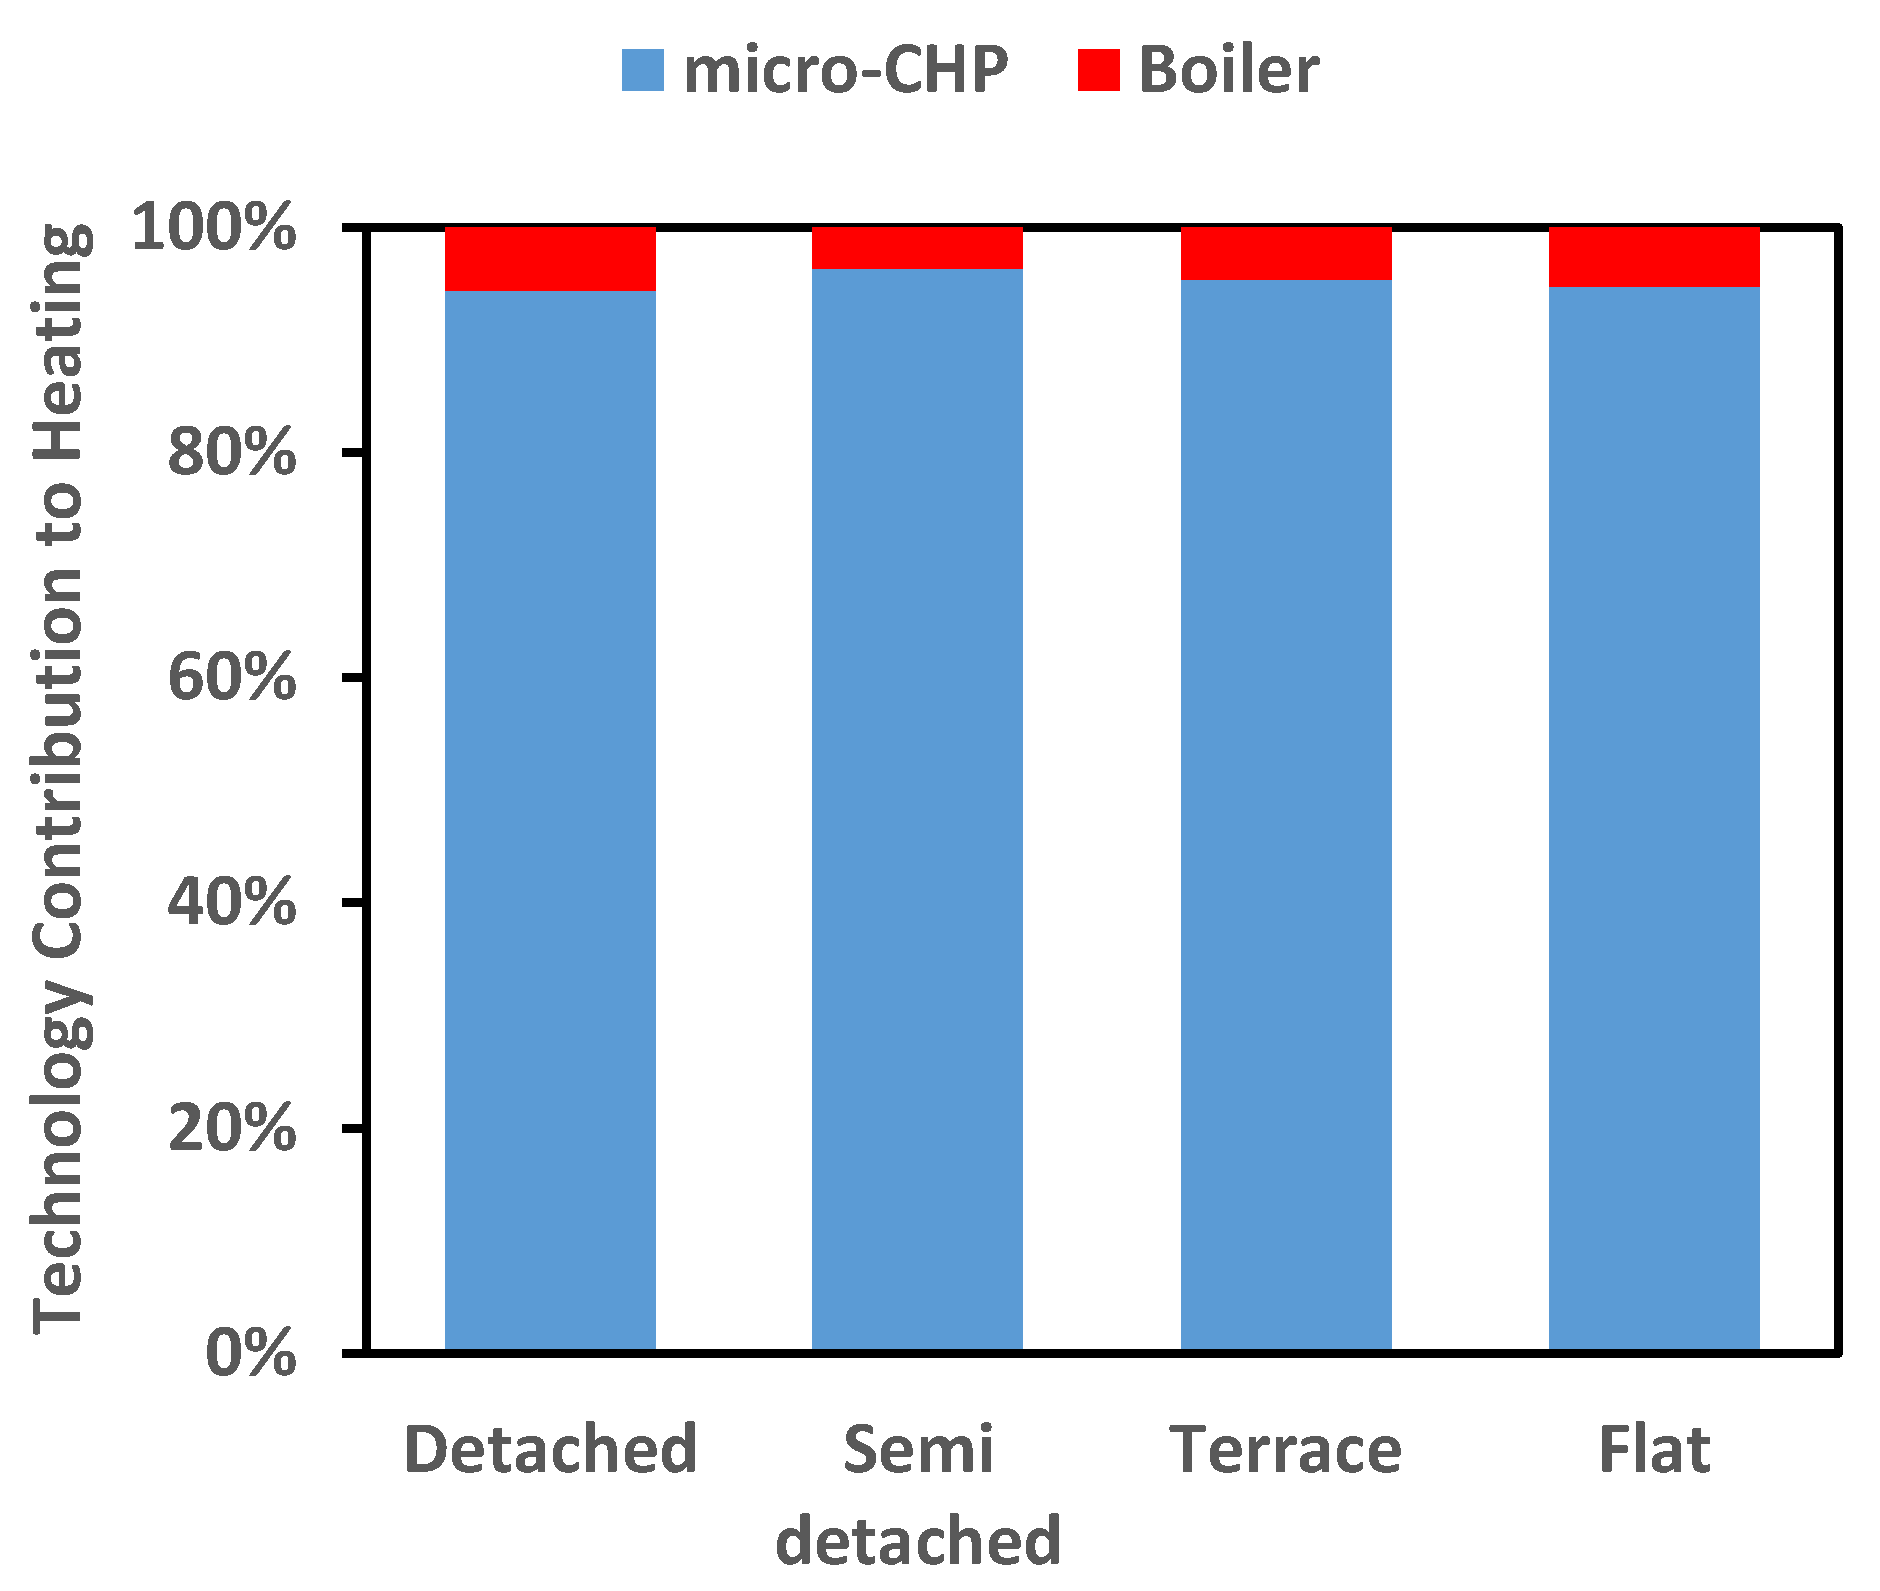
Figure 6.
Non-incentivised design with TES.

Figure 7.
Incentivised design (FIT) with TES.

Figure 8.
TES discharge profile for non-incentivised design: (a) detached house; (b) flat.

Figure 9.
TES discharge profile for incentivised design: (a) detached house; (b) flat.

Figure 10.
Payback and Net Present Value (NPV) associated with TES investment for (a) non-incentivised design; (b) incentivised design (FIT); and (c) incentivised design (CO2 levy exemption).
Figure 10.
Payback and Net Present Value (NPV) associated with TES investment for (a) non-incentivised design; (b) incentivised design (FIT); and (c) incentivised design (CO2 levy exemption).


Table 1.
Energy demand and house characteristics.
| Detached | Semi-Detached | Terrace | Flat | ||
|---|---|---|---|---|---|
| Peak demand (kW) | Space heating | 7.65 | 6.89 | 4.42 | 5.11 |
| Hot water | 27.2 | 34.9 | 34.6 | 34.7 | |
| Total demand (kWh/year) | Space heating | 9904 | 5400 | 2480 | 1940 |
| Hot water | 1712 | 1590 | 1351 | 1304 | |
| Floor area (m2) | - | 121–152 | 74–93 | 66–83 | 45–57 |
Table 2.
Non-incentivised design results.
| Detached | Semi-Detached | Terrace | Flat | ||
|---|---|---|---|---|---|
| EAI (£/year) | Design with TES | 100.9 | −19.2 | −133.84 | −132.48 |
| Design without TES | 41.22 | −52.5 | −138.5 | −156 | |
| System payback (year) | Design with TES | 14 | 20 | 36 | 36 |
| Design without TES | 16 | 24 | 43 | 51 | |
| System NPV (£) | Design with TES | −1348 | −2680 | −3860 | −3830 |
| Design without TES | −1716 | −2690 | −3580 | −3760 | |
| NTCO2 (kg/year) | Design with TES | 6233 | 5416 | 4967 | 4876 |
| Design without TES | 6379 | 5514 | 4984 | 4889 | |
| TDE (kWh/year) | Design with TES | 29,286 | 25,609 | 23,640 | 23,242 |
| Design without TES | 30,078 | 26,161 | 23,788 | 23,367 | |
| TES size | - | 26 | 34 | 34 | 32 |
Table 3.
Incentivised (FIT) design results.
| Detached | Semi-Detached | Terrace | Flat | ||
|---|---|---|---|---|---|
| EAI (£/year) | Design with TES | 751 | 414 | 125 | 91 |
| Design without TES | 610 | 296 | 51 | 4 | |
| System Payback (year) | Design with TES | 4.9 | 7.4 | 12.8 | 14.0 |
| Design without TES | 5.5 | 8.7 | 15.8 | 18.7 | |
| System NPV (£) | Design with TES | 5525 | 2019 | −928 | −1266 |
| Design without TES | 4186 | 933 | −1616 | −2103 | |
| NTCO2 (kg/year) | Design with TES | 6009 | 5407 | 4954 | 4864 |
| Design without TES | 5966 | 5308 | 4881 | 4802 | |
| TDE (kWh/year) | Design with TES | 28,169 | 25,551 | 23,579 | 23,191 |
| Design without TES | 28,025 | 25,138 | 23,275 | 22,933 | |
| TES size | - | 13 | 13 | 9 | 7 |
© 2018 by the authors. Licensee MDPI, Basel, Switzerland. This article is an open access article distributed under the terms and conditions of the Creative Commons Attribution (CC BY) license (http://creativecommons.org/licenses/by/4.0/).
Share and Cite
MDPI and ACS Style
Oluleye, G.; Allison, J.; Kelly, N.; Hawkes, A.D. An Optimisation Study on Integrating and Incentivising Thermal Energy Storage (TES) in a Dwelling Energy System. Energies 2018, 11, 1095. https://doi.org/10.3390/en11051095
AMA Style
Oluleye G, Allison J, Kelly N, Hawkes AD. An Optimisation Study on Integrating and Incentivising Thermal Energy Storage (TES) in a Dwelling Energy System. Energies. 2018; 11(5):1095. https://doi.org/10.3390/en11051095
Chicago/Turabian StyleOluleye, Gbemi, John Allison, Nicolas Kelly, and Adam D. Hawkes. 2018. "An Optimisation Study on Integrating and Incentivising Thermal Energy Storage (TES) in a Dwelling Energy System" Energies 11, no. 5: 1095. https://doi.org/10.3390/en11051095
Note that from the first issue of 2016, this journal uses article numbers instead of page numbers. See further details here.