Experimental Investigation on Flow and Heat Transfer Characteristics of a Needle-Cylinder Type Ionic Wind Generator for LED Cooling

Key Laboratory of Thermo-Fluid Science and Engineering, Ministry of Education, School of Energy and Power Engineering, Xi’an Jiaotong University, Xi’an 710049, China
*
Author to whom correspondence should be addressed.
Energies 2018, 11(5), 1149; https://doi.org/10.3390/en11051149
Submission received: 11 April 2018
/
Revised: 1 May 2018
/
Accepted: 1 May 2018
/
Published: 4 May 2018
(This article belongs to the Special Issue Electric Fields in Energy & Process Engineering)
Abstract
:Ionic wind cooling for electronic elements is a relevant research field. In order to study the cooling performance of ionic wind on a Light Emitting Diode (LED), an ionic wind generator with a needles-ring electrode configuration was set up. A cylindrical heat sink for the heat dissipation of a heating film representing the LED chip was also manufactured. Following this, the effect of the needle number, the distance between the needles and the ring electrode, and the polarity of the corona discharge on the ionic wind velocity were studied. Finally, the optimal distance between the needles and the ring electrode was adopted to attain the maximum wind velocity with different numbers of needles. After this, the ionic wind device was used to cool the heating film at the working power of 10 watts. The surface temperature of the heating film was measured to evaluate the cooling performance of the ionic wind device. The experimental results indicate that the maximum temperature drop in the heating film center reaches 35.6 °C in the five needle-electrode case, which is very effective and can meet the demands of a 10 watts LED heat dissipation.
1. Introduction
Ionic wind is generated when a high electric potential difference is applied between two electrodes with different surface curvature radii. Air molecules around the surface of the electrode with a small radius of curvature are ionized into charged ions, which will be accelerated by the electric field and collide with the neutral molecules. Thus, momentum is transferred among particles and the induced bulk flow between the electrodes is called ionic wind at a macro-level. The equipment that produces an ionic wind is called an ionic wind generator, ionic wind device, or electrohydrodynamic pump (EHD pump). Due to its advantages, which include its noiselessness [1], no vibration, low power [2], rapid response, compact structure, and high heat transfer augmentation [3,4], ionic wind has shown great potential in the field of Light Emitting Diode (LED) cooling [5,6], food drying [7,8,9], and the inactivation of bacteria [10,11].
In recent years, ionic wind has attracted strong interest from many researchers, and many ionic wind devices with a new concept of electrode configurations have been developed for the cooling of LEDs and other electronic equipment [12]. Knap et al. [13] and Chen et al. [14] both developed a needle-grid electrodes configuration and parametrically studied the influence of electrodes’ geometric dimensions and the electrodes’ materials on the heat sink temperature or the heat transfer thermal resistance. Shin et al. [15] developed a new cooling device using wire to parallel-plate-electrodes to produce ionic wind for cooling an LED. The emitting electrode is a wire, and the collector electrodes are two parallel plates. The optimum ionic wind velocity for the developed ionic device is 1.5 m/s. The optimum ionic wind velocity is measured below the wire. However, in the areas that are away from the measured point, the wind velocity is very low, almost close to zero. Xu et al. [16] developed two ionic wind blowers, each one of which has a needle electrode and a grid electrode. The two ionic wind blowers are all inserted into the holes of the bulb to cool the LED filaments. In this study, there is only one electrodes gap in this experiment and the influence of the electrodes gap variation on the cooling performance of the LED filaments is not considered.
The above mentioned studies on the use of ionic wind for LED heat dissipation or the thermal management of electronic equipment all focus on ionic wind devices with a single emitting electrode. Due to the low flow rate of ionic wind generated by a single emitting electrode (also called a corona electrode), it is far from adequate for augmenting the surface heat transfer of an electronic element. Therefore, regarding the application of ionic wind for LED cooling or the cooling of other electronic components, a multiple corona electrodes layout of the ionic device is used to improve the flow rate of ionic wind to achieve a more effective cooling of the electronic components.
The parallel connection of multiple electrodes can cause the interference of ionic wind jets with each other, which degrades the wind velocity in an individual ionic wind jet. In recent years, there have been some studies on ionic wind devices with a parallel connection of multiple electrodes, which can be summarized according to the layout of the electrodes, as follows: multiple needle-ring electrodes, array of needle-grid electrodes, multiple needles-plane electrodes, multiple wires-plane electrodes, and multiple wires-grid electrodes.
The velocity of ionic wind varies with the electrodes layout, such as the number of corona electrodes, the type of electrodes (the shape, the materials, or the geometric parameters), and the gap between the corona electrode and the collector electrode. Ionic wind devices with different electrodes layouts produce different ionic wind flow characteristics, especially in a multiple electrodes layout.
Regarding the flow characteristics of the ionic wind device with multiple corona electrodes, June et al. [17] defined a static efficiency of ionic air moving devices (AMDs), similar to rotary AMDs. The static efficiency of the device with various emitter to collector distances and various ring lengths was evaluated for positive and negative coronas. The emitter electrodes are five needles, while the collector electrode is a ring. This article provides a method for comparing the efficiency of the ionic device with the fan. However, the wind velocity is not studied for various emitter to collector distances and various ring lengths. Drews et al. [18] studied a multiple parallel electrodes corona discharge driven by time oscillating electric fields. By varying the magnitude and frequency of the applied field, the variation of ionic wind velocity was studied and explained via a theoretical model. This work is about a corona discharge under a non-constant frequency voltage, and there are few studies in this area. Lee et al. [19] built an ionic wind generator with an array of 36 needle-to-rings on a single circuit board, which can produce a wind velocity above 2 m/s at an applied voltage of 10 kV. This device produces an enhanced volumetric air flow by virtue of a large cross-sectional area and adds a shielding layer between the corona and collector electrodes to reduce the interference between parallel air jets. The wind velocity produced by different distances between the electrode plates is only measured at an applied voltage of 10 kV. This work would have been more persuasive if measurements at different applied voltages had been conducted.
In the application of ionic wind devices with multiple corona electrodes for thermal management, Shakouri Pour et al. [20] and Alamgholilou et al. [21] experimentally studied, respectively, the heat transfer enhancement from cylindrical heat sources and the cuboid heat sources as electronic components established at the bottom of a rectangular cross-sectional duct with an in-line arrangement. The electrodes configurations are all multiple wires-planes. The air flow is produced in the duct with various Reynolds numbers of the inlet of the test section. There is no velocity measurement of the ionic wind in the test section in the above two articles. Fylladitakis et al. [22] optimized and built an EHD air pump for high-power electronic chip cooling applications. The parametric simulation of the electric field intensity, wind velocity, current flow and power consumption are conducted in both the multiple needles-grid electrodes configuration and in the multiple wires-grid electrodes configuration. The EHD pumps with the two different electrodes configurations were built and experimentally studied. Finally, one of them was selected to cool a high power density electronic chip. The cooling performance was compared with a typical fan. We concluded from the experimental results that increasing the distance between the electrodes allowed the generation of higher wind speeds. Two distances of electrodes gaps were considered in the experiment. If another set of electrodes gaps had been included in the experiment, the results would have been more accurate.
For the application of ionic wind for the heat dissipation of LEDs, Wang et al. [23] built an ionic wind device with a multiple needles-grid electrodes configuration and studied the influence of the number and arrangement of needles, along with the curvature of the needle tip, on the cooling effect of an LED chip attached to a heat sink. Many parameters, including the electrodes distances, were studied in this work, and the cooling performance using the ionic wind was compared with a fan. Wang et al. [24] also made a similar investigation on an ionic wind device with a multiple wires-grid electrodes configuration and made a comparison with the results of the multiple needles-grid electrodes configuration. The above two articles on the application of ionic wind devices with multiple emitting electrodes used for LED heat dissipation were recently published.
With the increase of LED power, especially in high-power LEDs, the byproduct of heat will also increase during its operation. A high temperature will lead to the deterioration of LEDs’ luminescence performance [25]. Therefore, it becomes more important to identify how to dissipate the heat in a timely manner in order to maintain a low temperature of the LED die and to ensure that the LED’s operation is sustained and stable. Since the ionic wind device is compact, noiseless and has a high heat transfer augmentation, it is especially suitable for the heat dissipation of LEDs.
Since less research exists on ionic wind devices with multiple electrodes used for LED heat dissipation, an ionic wind generator with a parallel connection of multiple needles and a ring was developed to cool an LED chip. The needles serve as the corona electrodes. The ring, which is grounded, is taken as the charge collector electrode. It should be note that there is only one ring electrode in this ionic generator and that all needle-electrodes share a single ring as the grounded electrode. This ionic wind generator is quite different from the device built by Lee et al. [19]. In that work, the number of needles and the number of rings are the same. In our work, a circular heating film representing the LED chip is attached to a cylindrical heat sink. In daily life, a circular LED chip or cylindrical heat sink is widely used for night lighting, such as the automobile LED headlamp, the lighting of a tunnel or outdoor construction site and city traffic lights, to name a few. At present, the heat dissipation of these LED chips mainly relied on a fan to drive the air flow, which is more energy consuming when compared with the ionic wind cooling method. Therefore, in terms of this kind of LED heat dissipation problem, a similar model was made and the experimental device in this paper was designed to study the effect of ionic wind on its heat dissipation.
Considering the interference of the multiple needles in the corona discharge, we studied the variation of ionic wind velocity and the chip temperature under different numbers of emitting electrodes and multiple distances between the emitting electrodes and the ring electrode. The ionic wind induced by the two polarity corona discharge was also studied in order to make a comparison. This work can serve as a guide for the design of LED cooling devices with a cylindrical heat sink using ionic wind. In Section 2, the experimental setup and structure of the LED cooling device are introduced. Section 3 relates the experimental results, and their discussions and the conclusions are presented in Section 4.
2. Experimental Setup and Structure of LED Cooling Device
2.1. Structure of LED Cooling Device
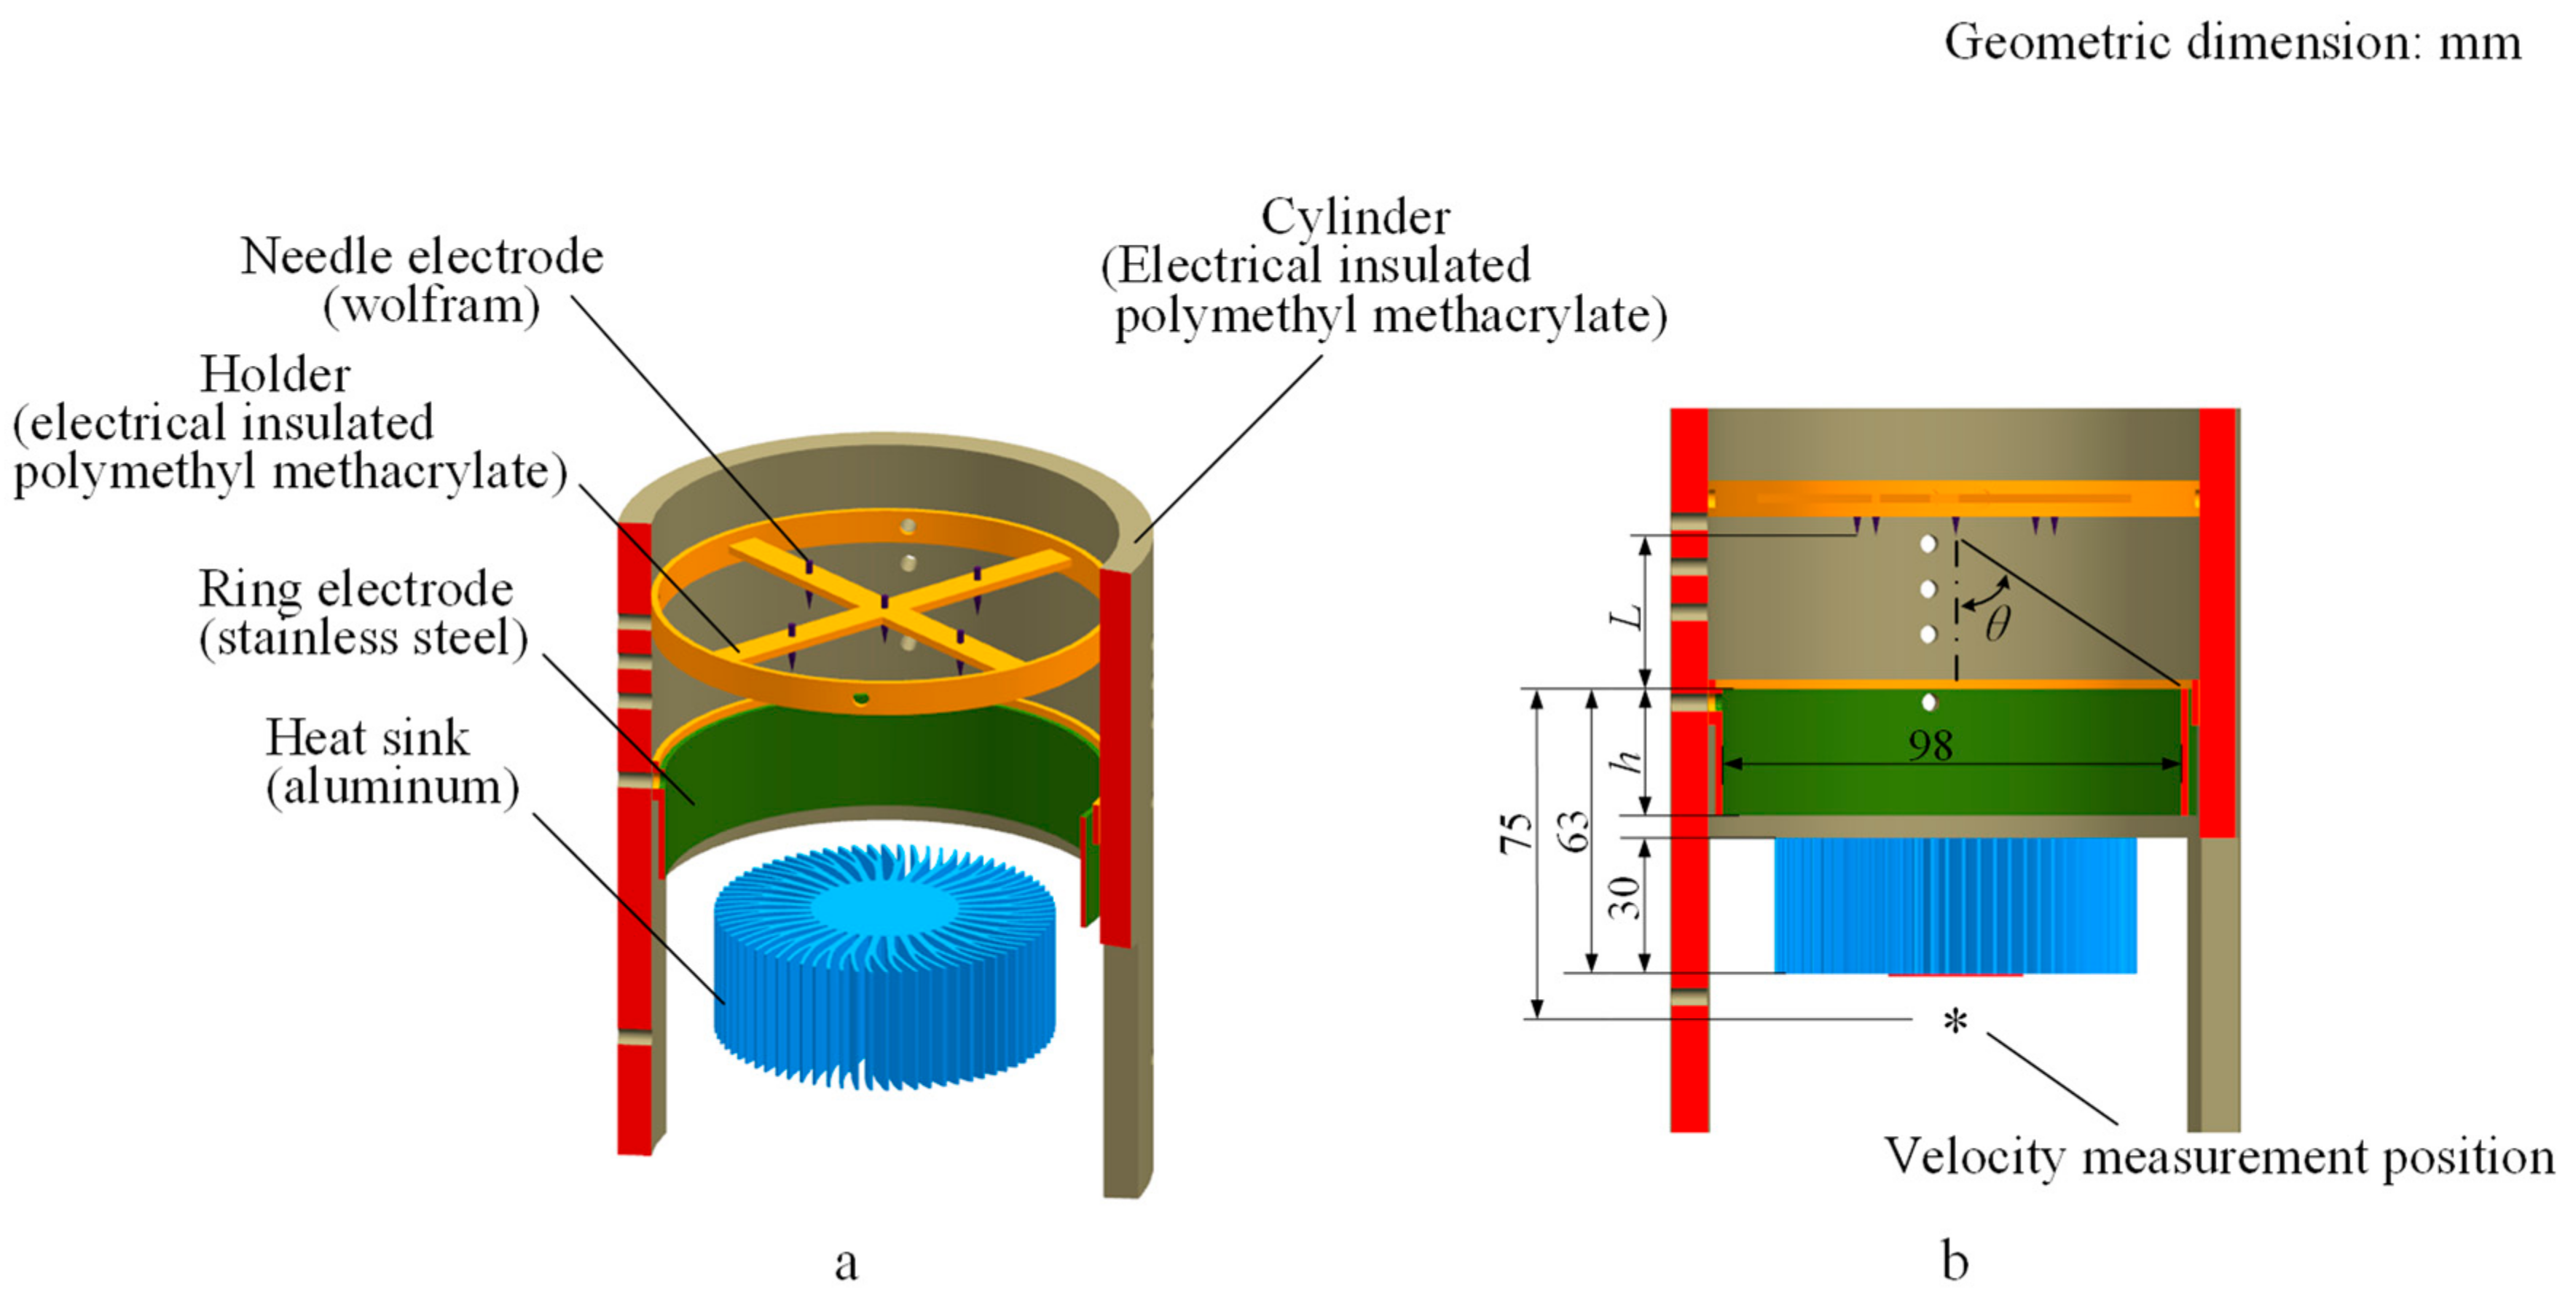
The structure of the LED cooling device is shown in Figure 1a. The needle electrodes are fixed by a holder made of polymethyl methacrylate, which is electrically insulated. The needle electrodes are all made of wolfram. The grounded electrode is a stainless steel ring with an inner diameter of 98 mm. The thickness of the ring is 2 mm, and the height h is 16 mm. The stainless steel rings are embedded in a small polymethyl methacrylate ring and they are all fixed on the polymethyl methacrylate cylinder by nylon screws. The perpendicular distance between the needle electrodes and the ring electrode L (also called electrodes gap in this article) is adjustable by changing the position of the nylon screws used for fixing the holder on the cylinder. The heat sink is located below the stainless steel ring and detailed dimensions are shown in Figure 1b.
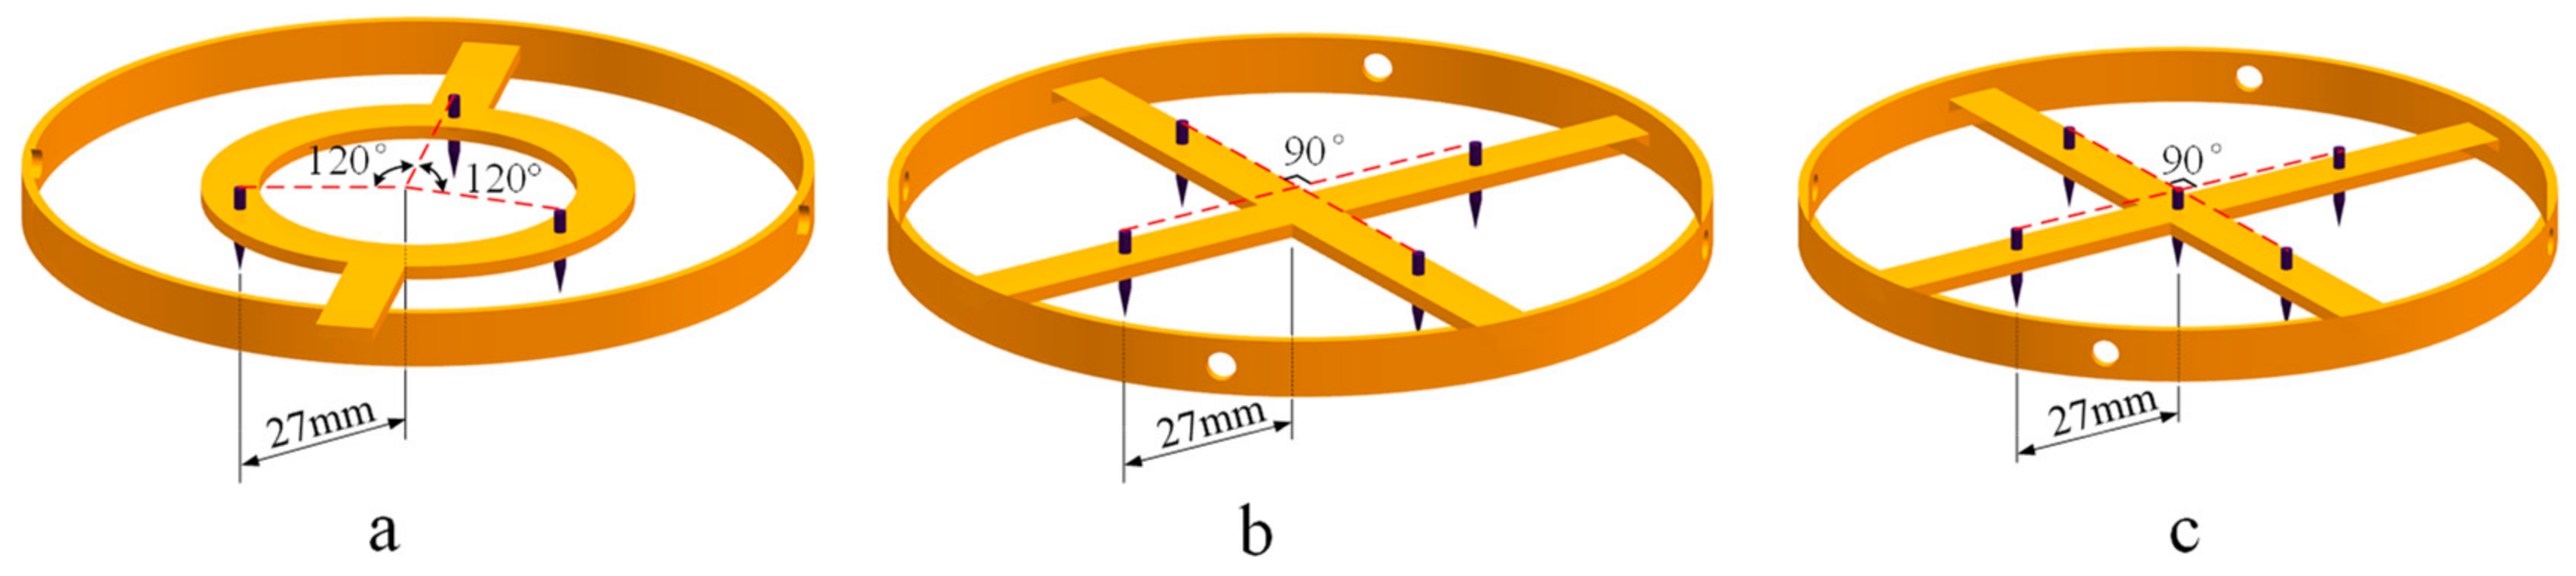
The layout of the needle electrodes and their several detailed dimensions are shown in Figure 2. Three kinds of configurations are investigated here: three needles, four needles, and five needles. Besides a needle electrode in the center position of the five-needle layout, all other needles in the electrode layouts are located on a circle with a radius of 27 mm. Table 1 lists some specifications of the needle electrode and the ring electrode, as well as five different electrodes gaps (L, shown in Figure 1).
The heating film, which is made of polyimide and heating foil, is attached to the heat sink via an adhesive, as shown in Figure 3. The maximum power of the heating film is 50 watts, but the power in this work is kept constant with 10 watts to represent the heating power of a common LED. Table 2 represents some working parameters of the heating film.
2.2. Experimental Setup
The experiment can be divided into two stages: the wind velocity measurement of ionic wind device and the temperature measurement of the heating film when cooled by the ionic wind device. Firstly, the wind velocity of the ionic wind device is measured to optimize the layout of the electrodes, before a relatively high wind velocity is obtained. In the second stage, the heating film is cooled by the ionic wind device with the optimal electrode layout, and the temperature of the heating film is measured to evaluate the cooling performance. In order to compare the positive discharge with the negative discharge in the ionic wind device, both stages are conducted using a positive DC high voltage power supply (output voltage range: 0~+50 kV) and a negative DC high voltage power supply (output voltage range: 0~−50 kV) to power the ionic wind device.
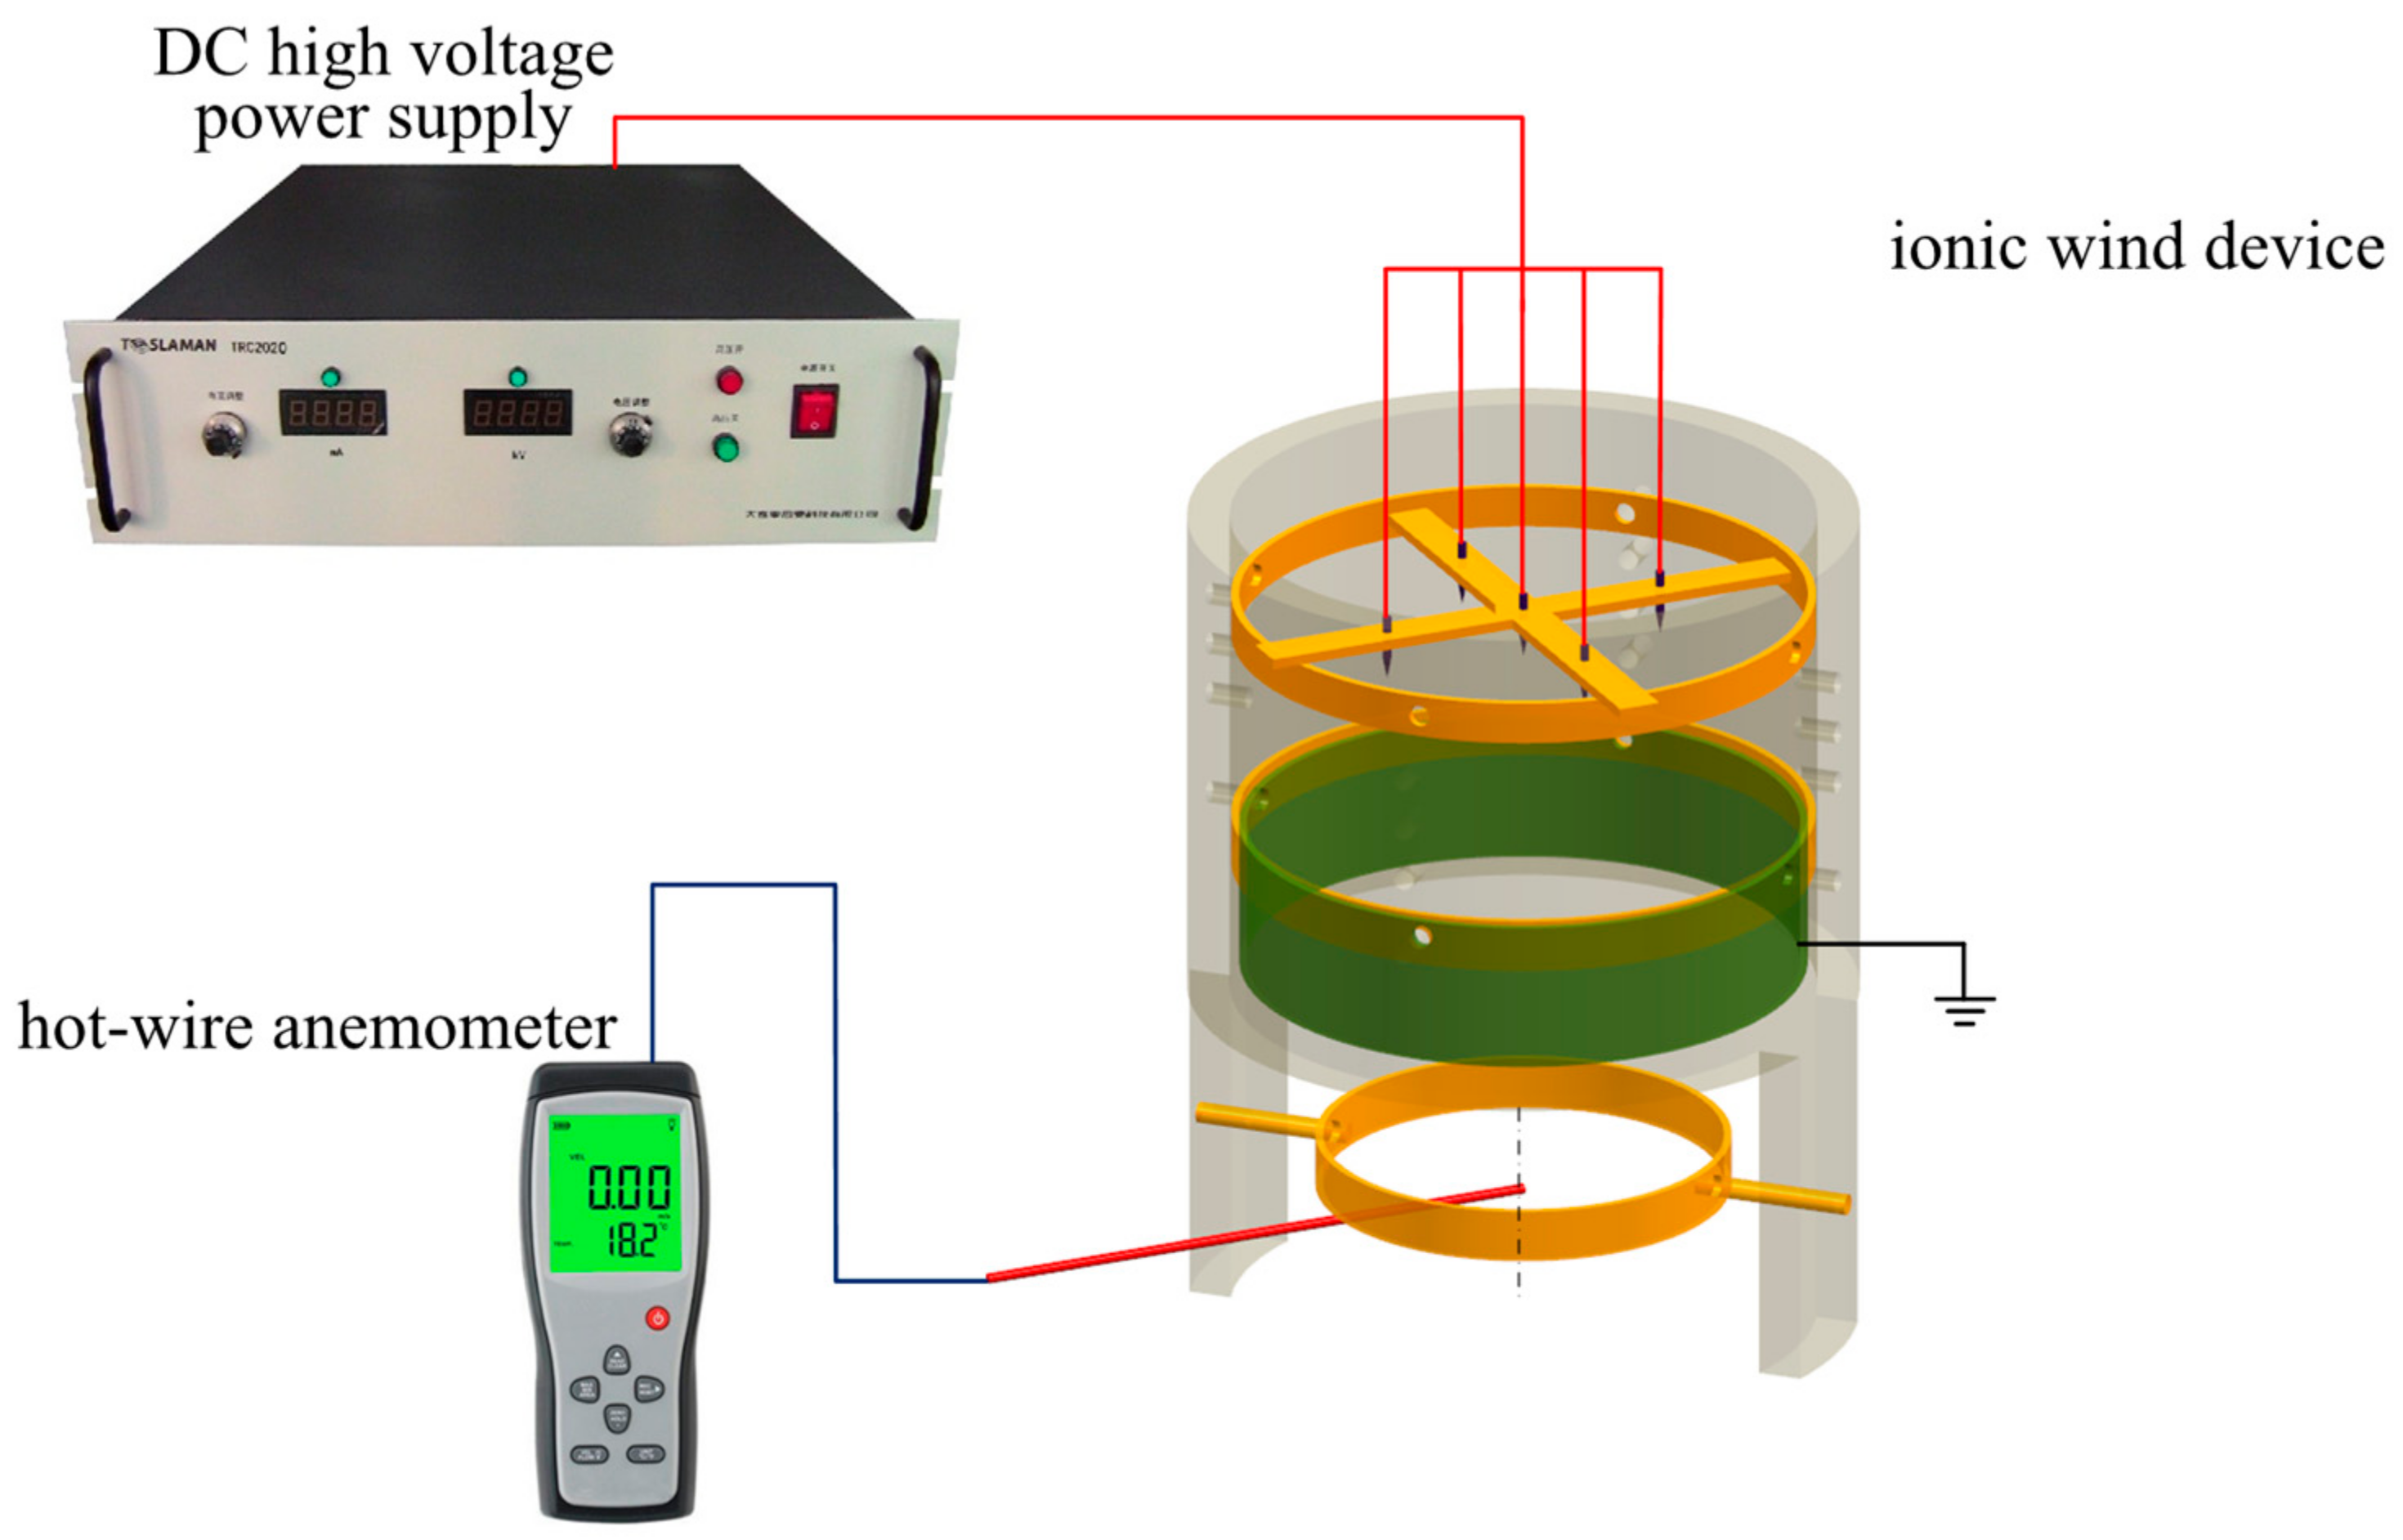
The ionic wind velocity measurement system is composed of a high voltage power supply, a hot-wire anemometer and the ionic wind device, as shown in Figure 4. Considering that the heat sink is located at the center of the ionic wind device, the hot-wire anemometer is placed 75 mm below the upper edge of the ring electrode (shown in Figure 1b) and is located on the axis of the ionic wind device.
The heating film temperature measurement system is shown in Figure 5, which consists of a high voltage power supply, a cylindrical heat sink with a heating film representing the LED chip in the center, an Agilent signal acquisition system, T type thermocouples, a steady voltage power supply and the ionic wind device. The steady voltage power supply is used for powering the heating film. The heating film is round, with a diameter of 30 mm. Thermocouples are fixed both on the surface of the heating film and on the surface of the heat sink facing toward the impingement of the ionic wind, to collect the temperature signals.
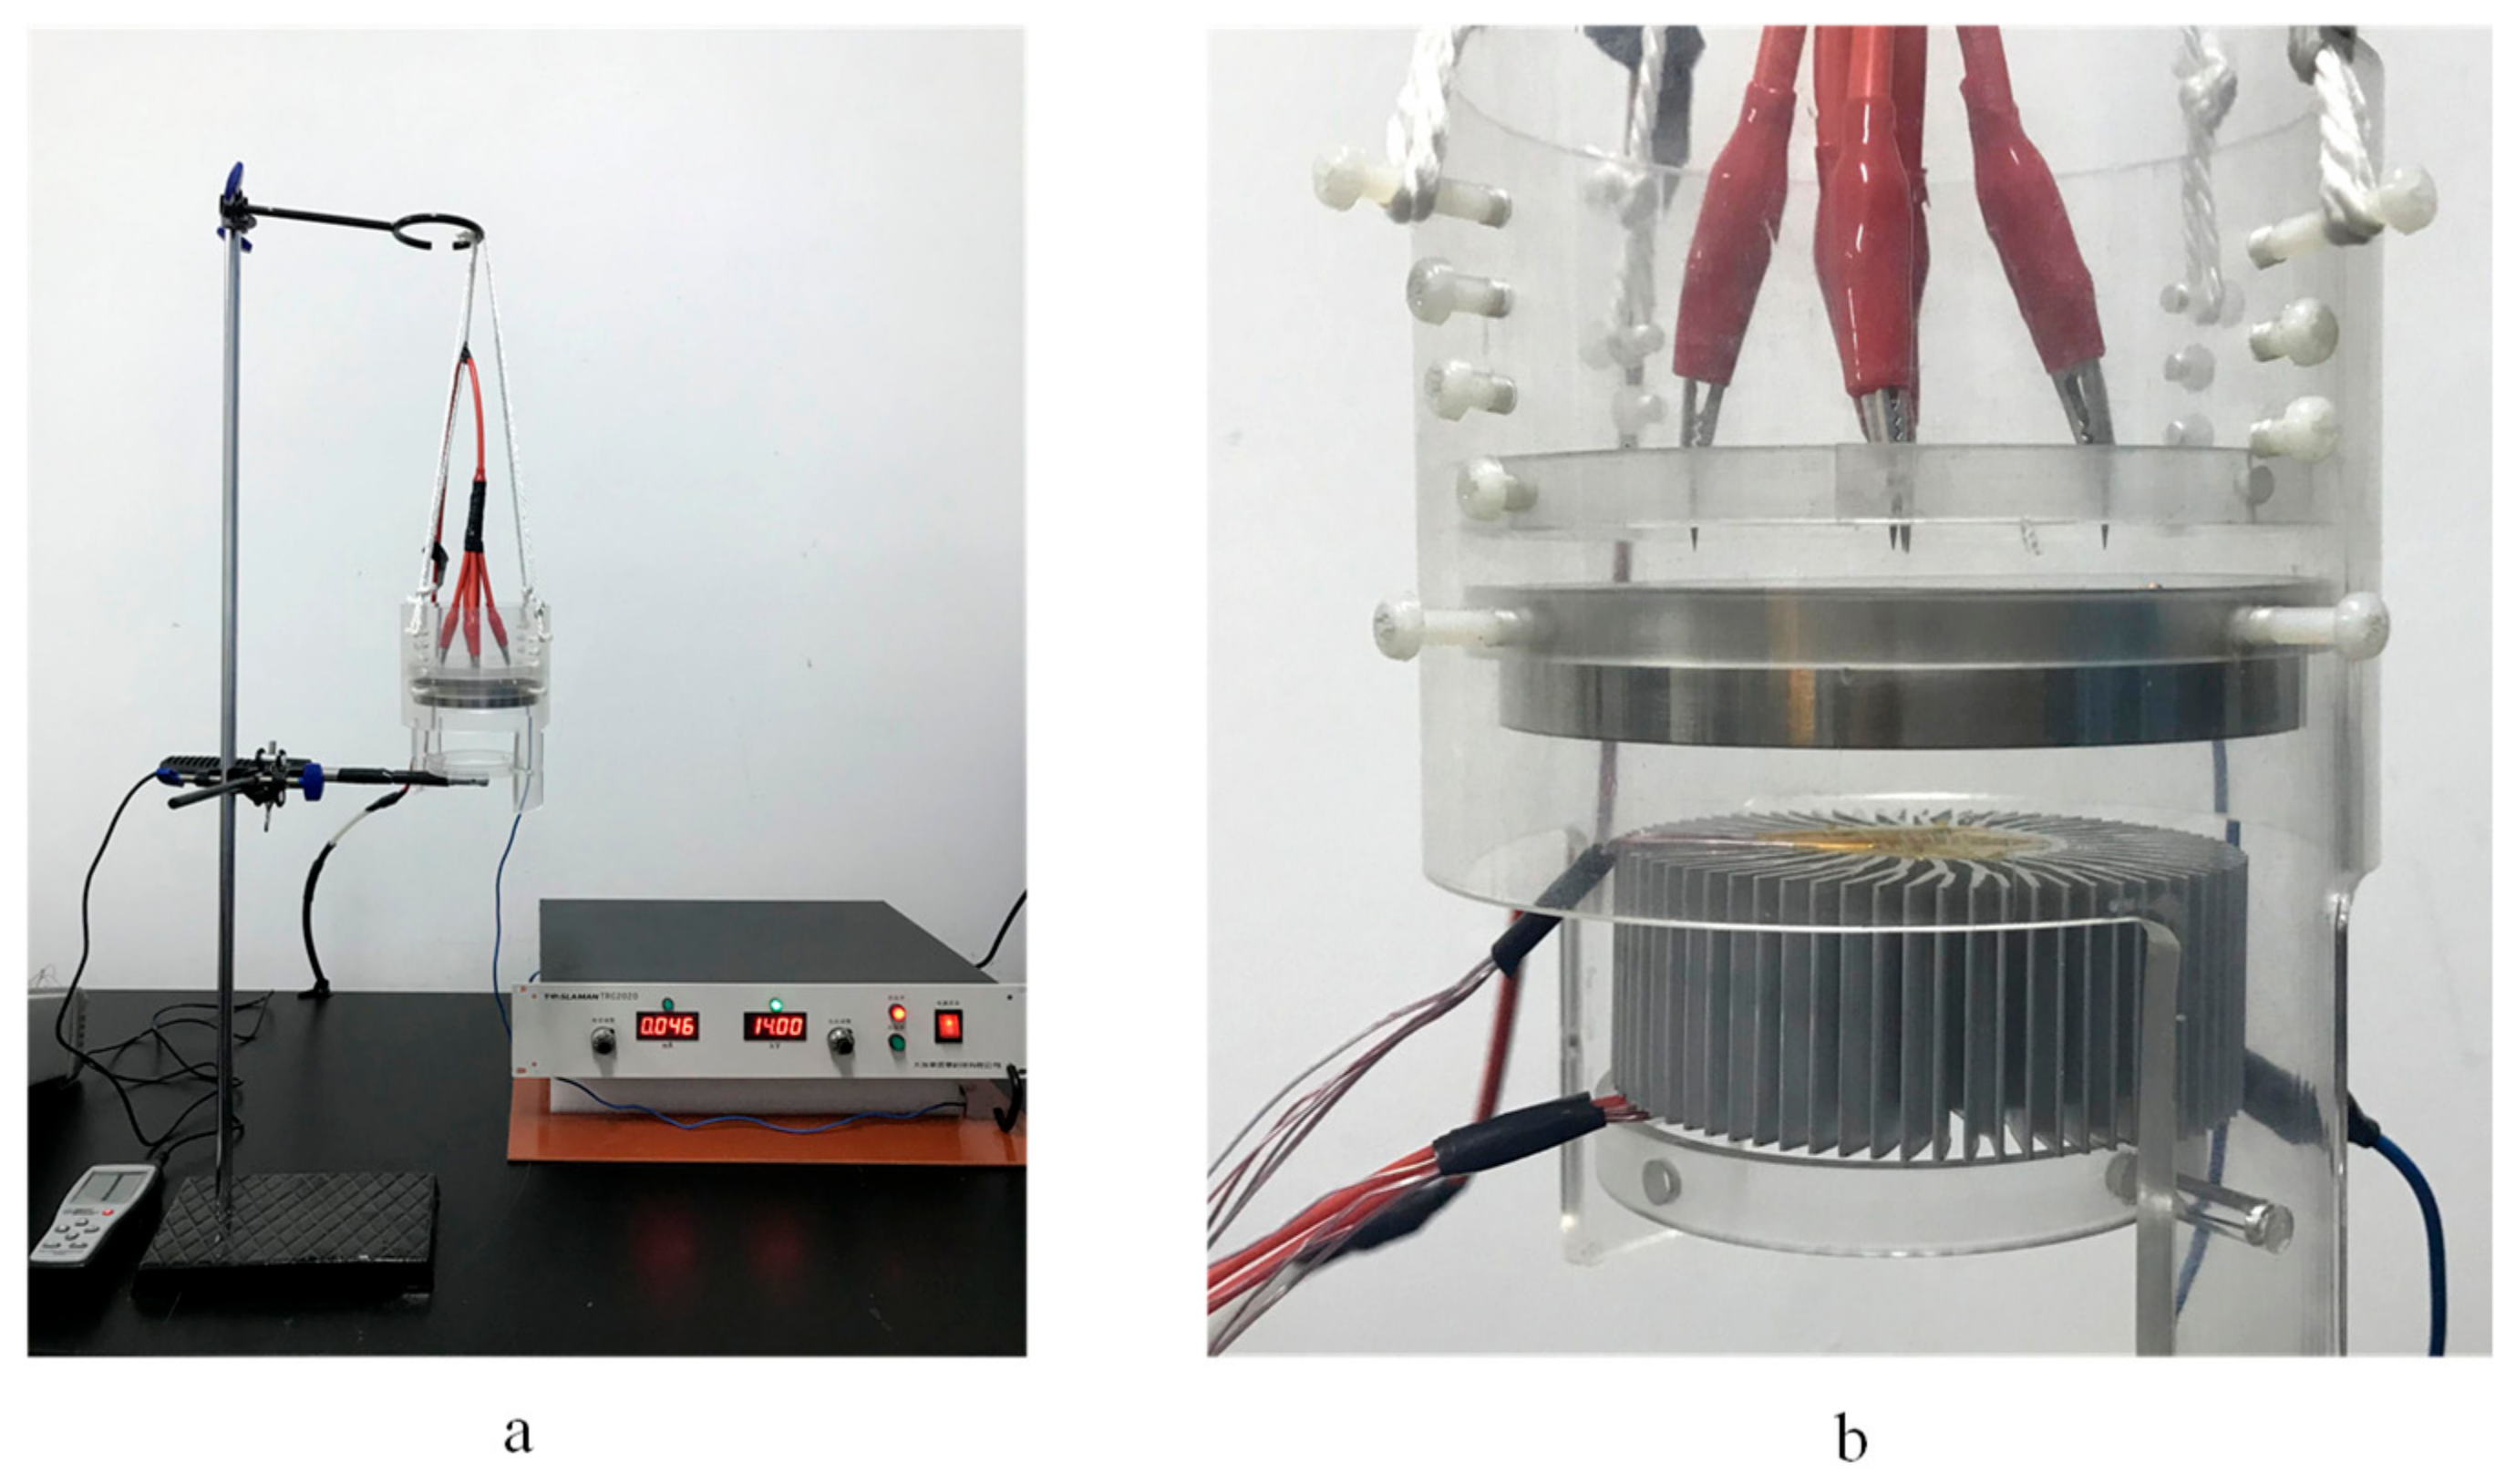
On account of the heating film located at the center of the heat sink, this study is more concerned with the wind velocity on the axis of the ionic wind device and the temperature at the center of the heating film. Heat is transferred from the heating film to the ambient air through the heat sink, so the temperature at the heating film center is the highest. If the temperature at the heat film center meets the requirements, the temperature from the rest of the heating film will also meet the needs for a reliable operation. Therefore, the measurement points of temperature and ionic wind velocity in this work are all located on the axis of the cylindrical ionic wind device. Figure 6 presents photographs of the experimental device.
Table 3 details the name, type, specification, or precision of the instrument used in this experiment. The experimental uncertainty analysis can be found in the Appendix A.
3. Results and Discussion
This section contains the ionic wind velocity measurement results and their analyses under different electrode layouts, as well as under different polarities of the corona discharge. The temperature of the heating film cooled by the ionic wind with different electrode layouts is also presented and analyzed in this section.
3.1. The Current–Voltage Characteristics
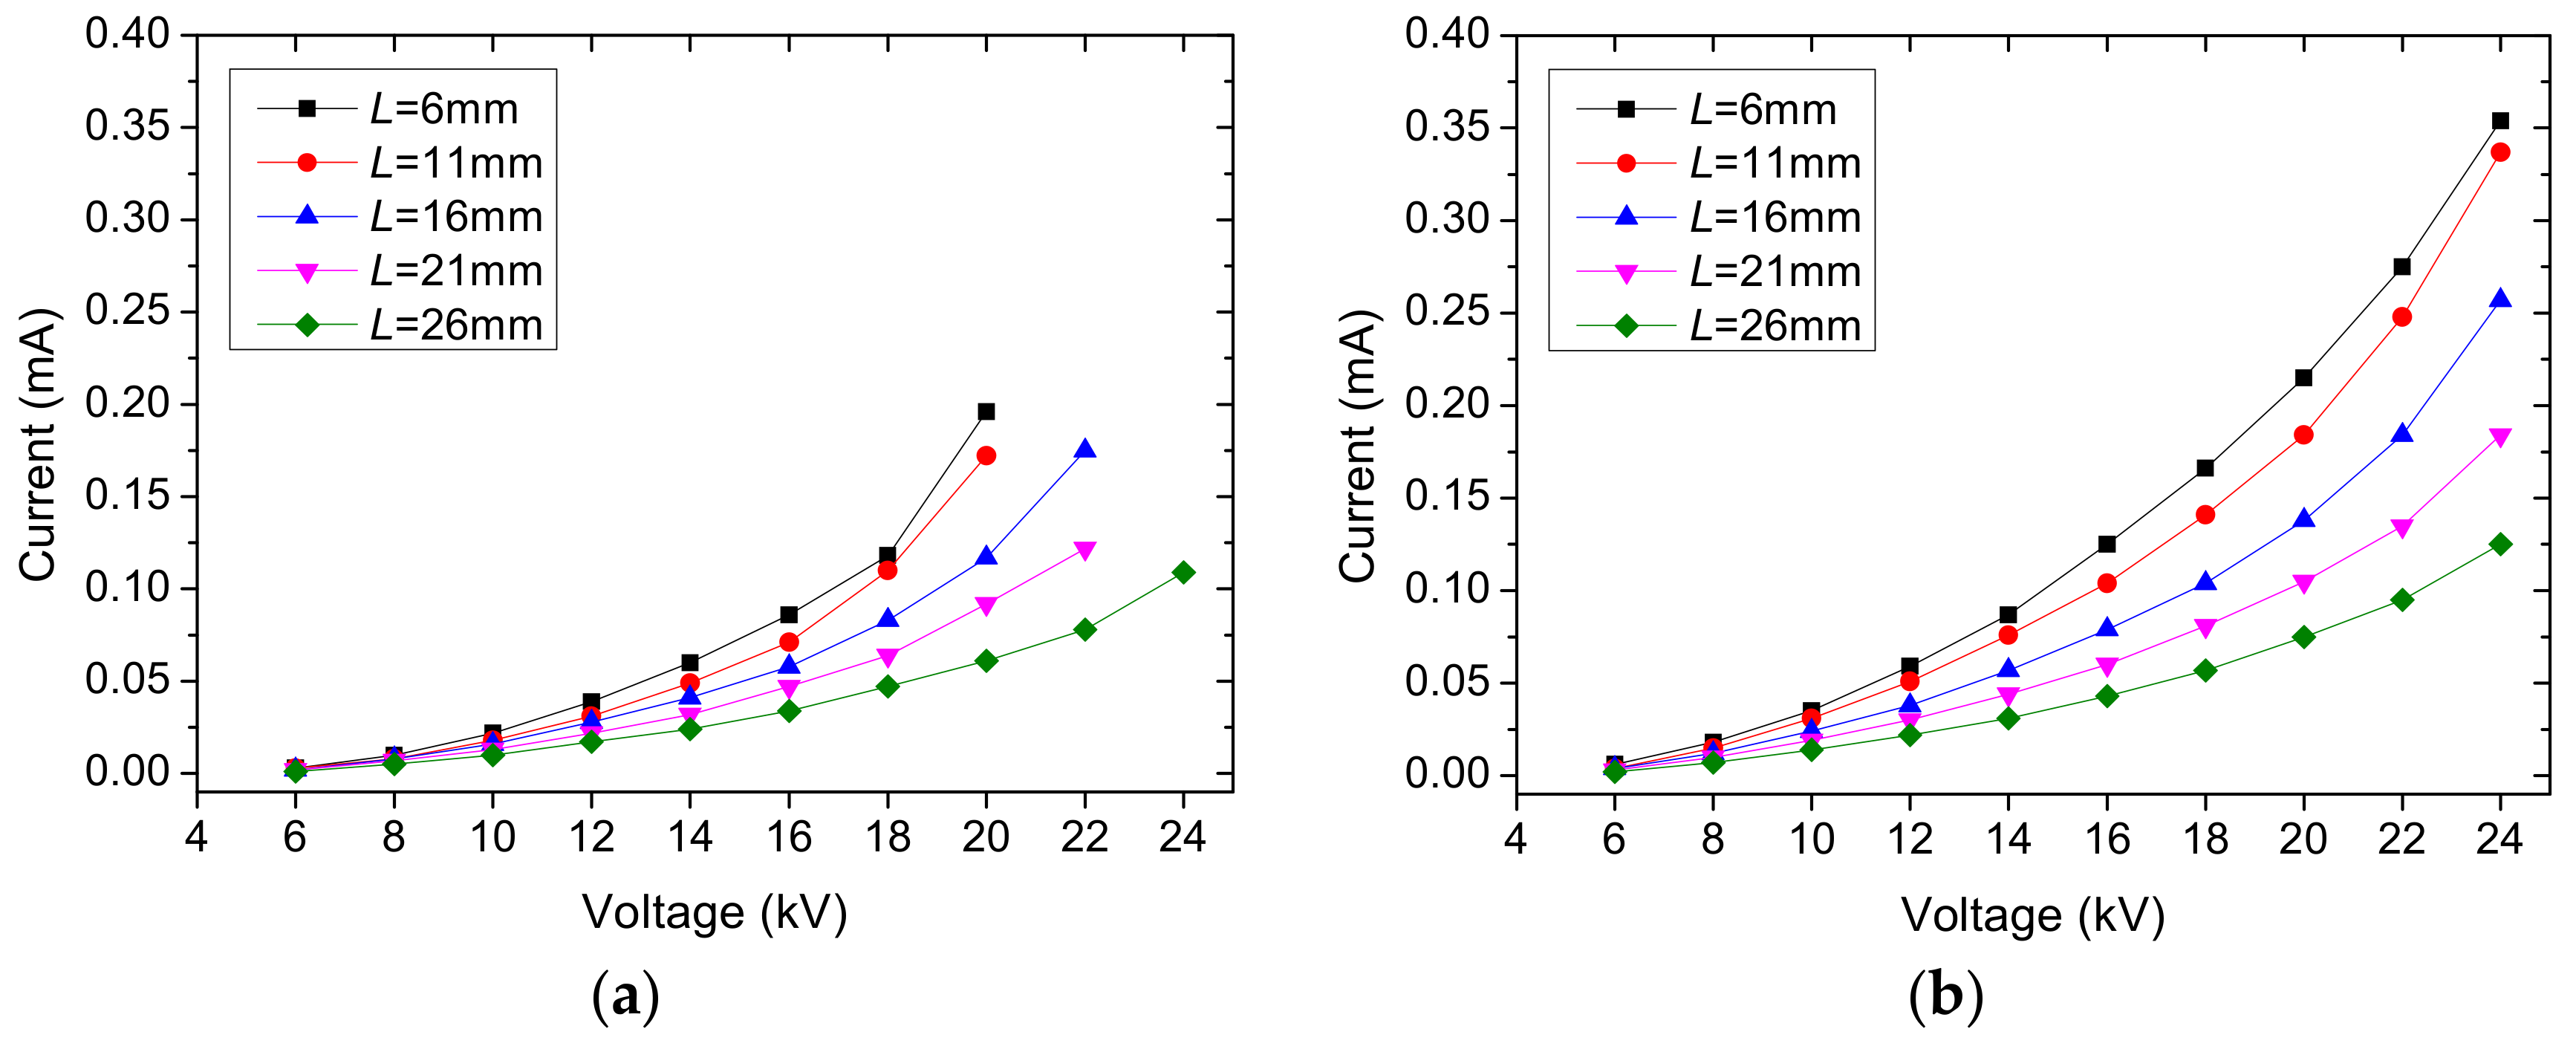
In order to describe the characteristics of the corona discharge, this section presents the current–voltage characteristics of the ionic wind device with different distances between needle and ring electrodes and with three different needle-electrode layouts. It is clear from these figures that the smaller the distance between the needles and the ring electrode is, the larger the current will be at a certain applied voltage. This is because decreasing the electrodes gap will further increase the electric field intensity of the drift zone, which will increase the Coulomb force and increase the ions mobility rate. These factors will eventually lead to an increase in the current. This conclusion is consistent with the results in the literature [26].
In Figure 7, there is a breakdown in the ionic wind device with three needles in the positive discharge, when the applied voltage approaches 24 kV. The smaller the electrodes gap is, the lower the breakdown voltage will be. However, the breakdown does not occur in the negative discharge before the applied voltage reaches 24 kV. A comparison between the two different polarities of discharge shows that the negative discharge is more difficult to break down than the positive discharge. From a microscopic point of view, the negative discharge can attract a large number of positive charged ions in the corona region, weakening the electric field intensity in the corona area, so that the discharge area can withstand a higher voltage. In addition, we also found that the positive corona discharge can produce more noise than the negative discharge, which also supports the results from most of the previous literature. In Figure 7a, a smaller distance between the needles and the ring electrodes results more easily in a breakdown than when there is a larger distance.
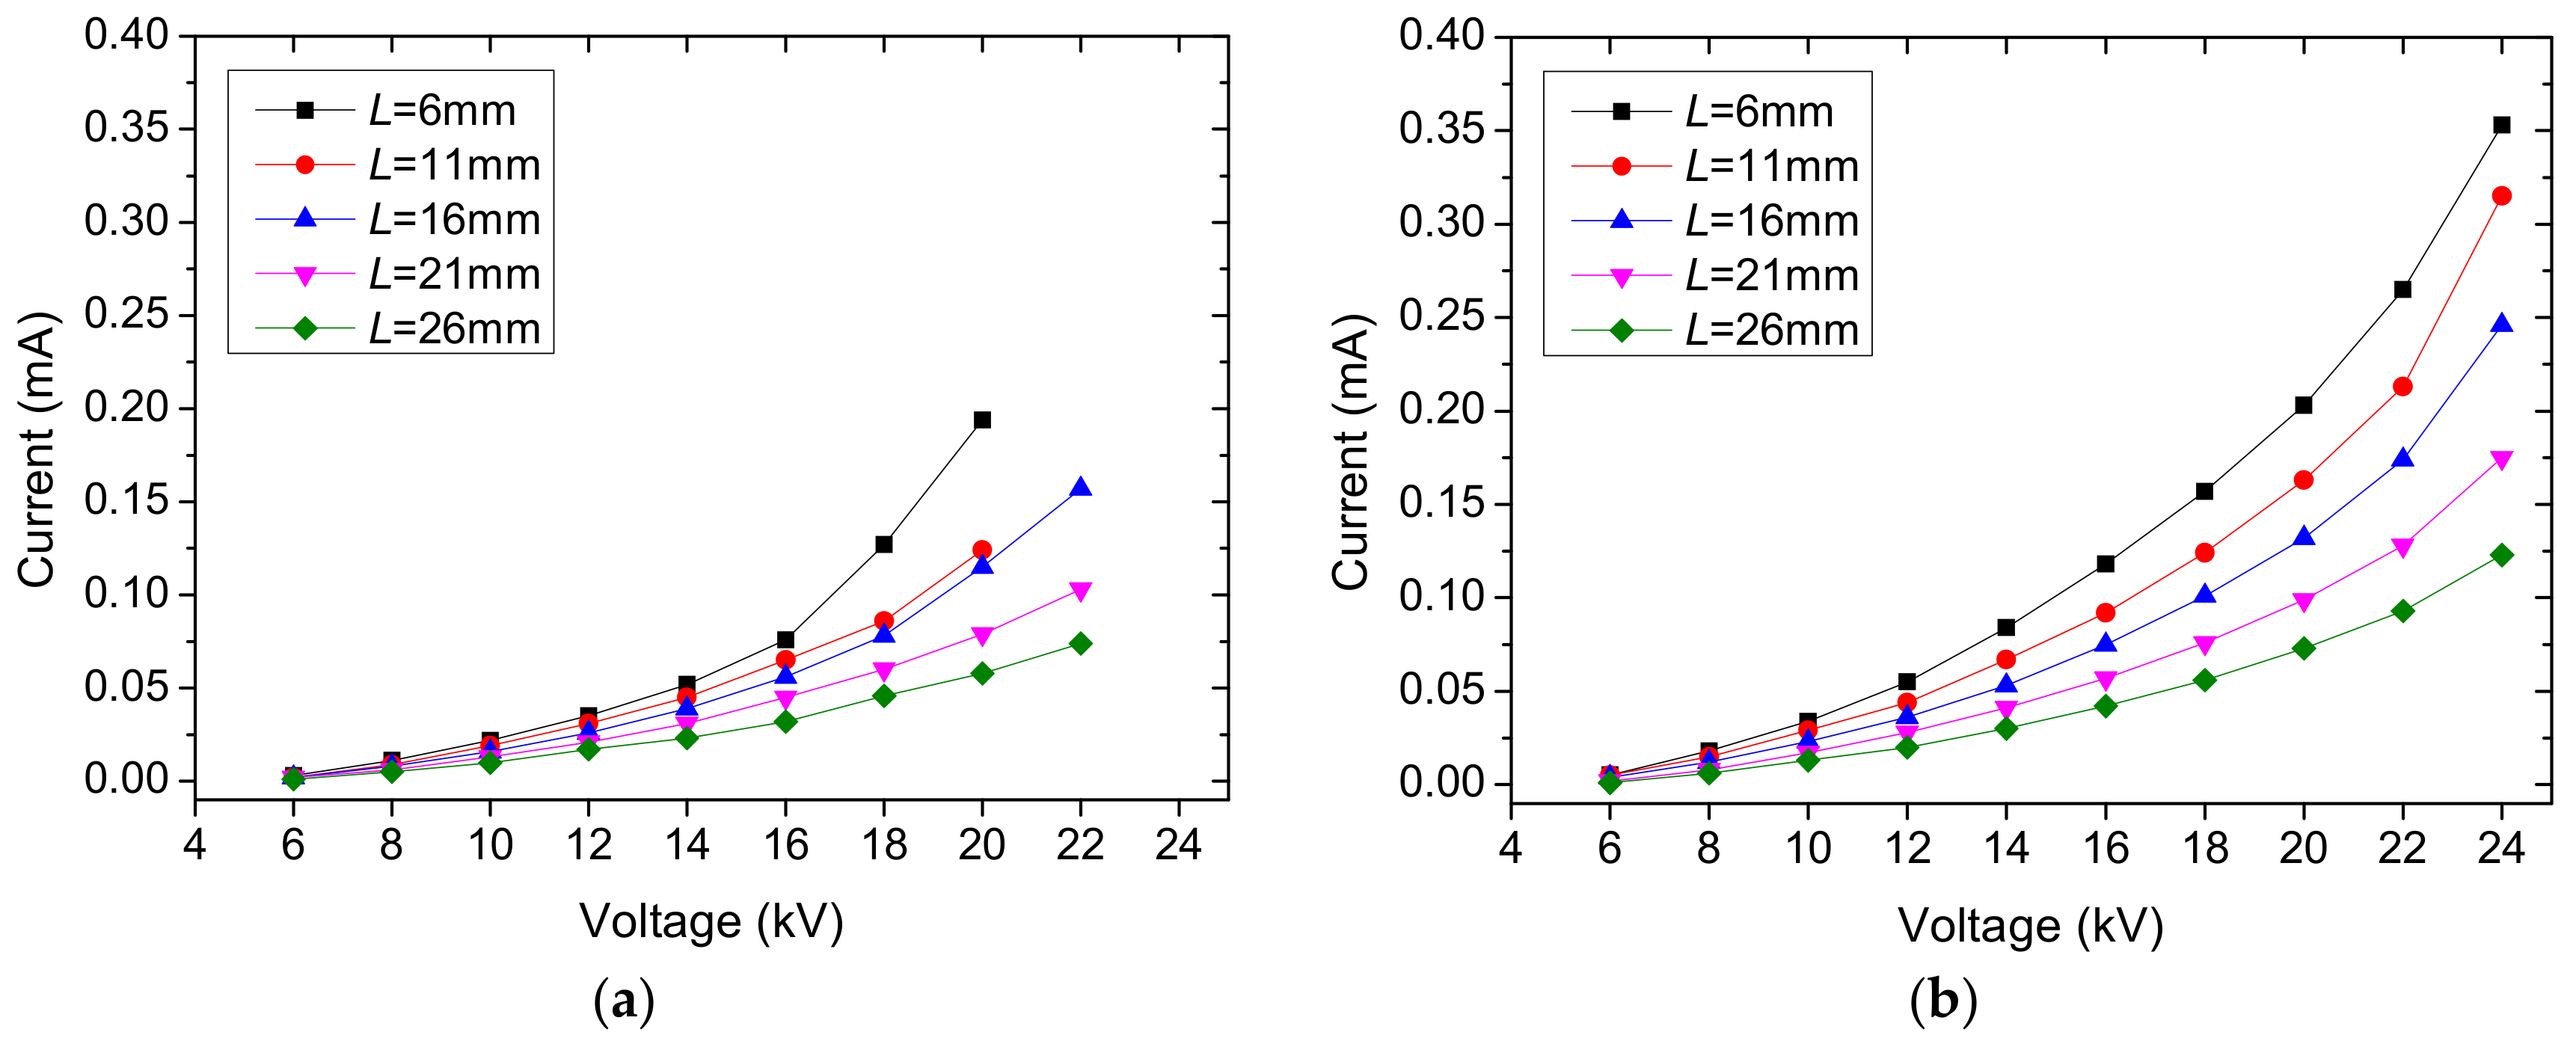
Similar current–voltage characteristics appear in the ionic wind devices with four needles and five needles, as shown in Figure 8 and Figure 9.
However, due to the different number of needles, the current–voltage characteristics are still somewhat different. Additionally, for different numbers of needles with a certain electrode distance in the ionic wind device, the breakdown voltage decreases with the increase of the number of needles in the positive polarity discharge. For example, in the ionic wind device with four needles, when the electrodes gap L is 26 mm (Figure 8a), the breakdown does not occur before the applied voltage reaches 24 kV. On the other hand, in the five needles layout with the same electrodes gap (Figure 9a), the breakdown occurs at the voltage near 22 kV. The reason for this is that the increase of the number of needles or the decrease of the distance between the needles and the ring electrode will increase the electric field intensity in the drift zone, and the breakdown will be induced when the electric field intensity is large enough.
For the negative polarity corona discharge at a constant voltage under a certain electrode gap, the higher the number of needles, the larger the current will be. However, in the case of four needles and of five needles, there is no significant difference in the current, as shown in Figure 8b and Figure 9b.
3.2. Ionic Wind Velocity under Different Electrode Layouts
In order to describe how the measured ionic wind velocity varies with the applied voltage in the ionic wind device with different numbers of needles, we present Figure 10, Figure 11 and Figure 12. The velocity variations in both the positive and the negative discharges are included in these three figures. In general, regardless of the electrode layout, the ionic wind velocity increases with the increase of applied voltage. This can be explained using the figures of current–voltage characteristics from Section 3.1. An increase in the applied voltage results in the increase of the current. The increase in the current indicates that the ion migration has been enhanced. A larger-scale ions migration strengthens the collision between the charged ions and the neutral air molecules. Eventually, the ionic wind velocity is increased.
In Figure 10, the ionic wind velocity produced by the negative polarity discharge is far greater than that produced by the positive polarity discharge in the three needles electrode layout. In Figure 10a, the ionic wind velocity measured in the positive polarity discharge is extremely low, with even no wind velocity values being detected when the electrodes gap is 21 mm or 26 mm. Additionally, compared with the positive discharge, the negative discharge has a larger range of working voltage, as shown in Figure 10b. Since the negative discharge is more difficult to break down, it can therefore produce a larger ionic wind velocity if a higher voltage is applied. When the applied voltage is kept constant, increasing the electrodes gap will reduce the ionic wind velocity in both positive polarity discharge and negative polarity discharge.
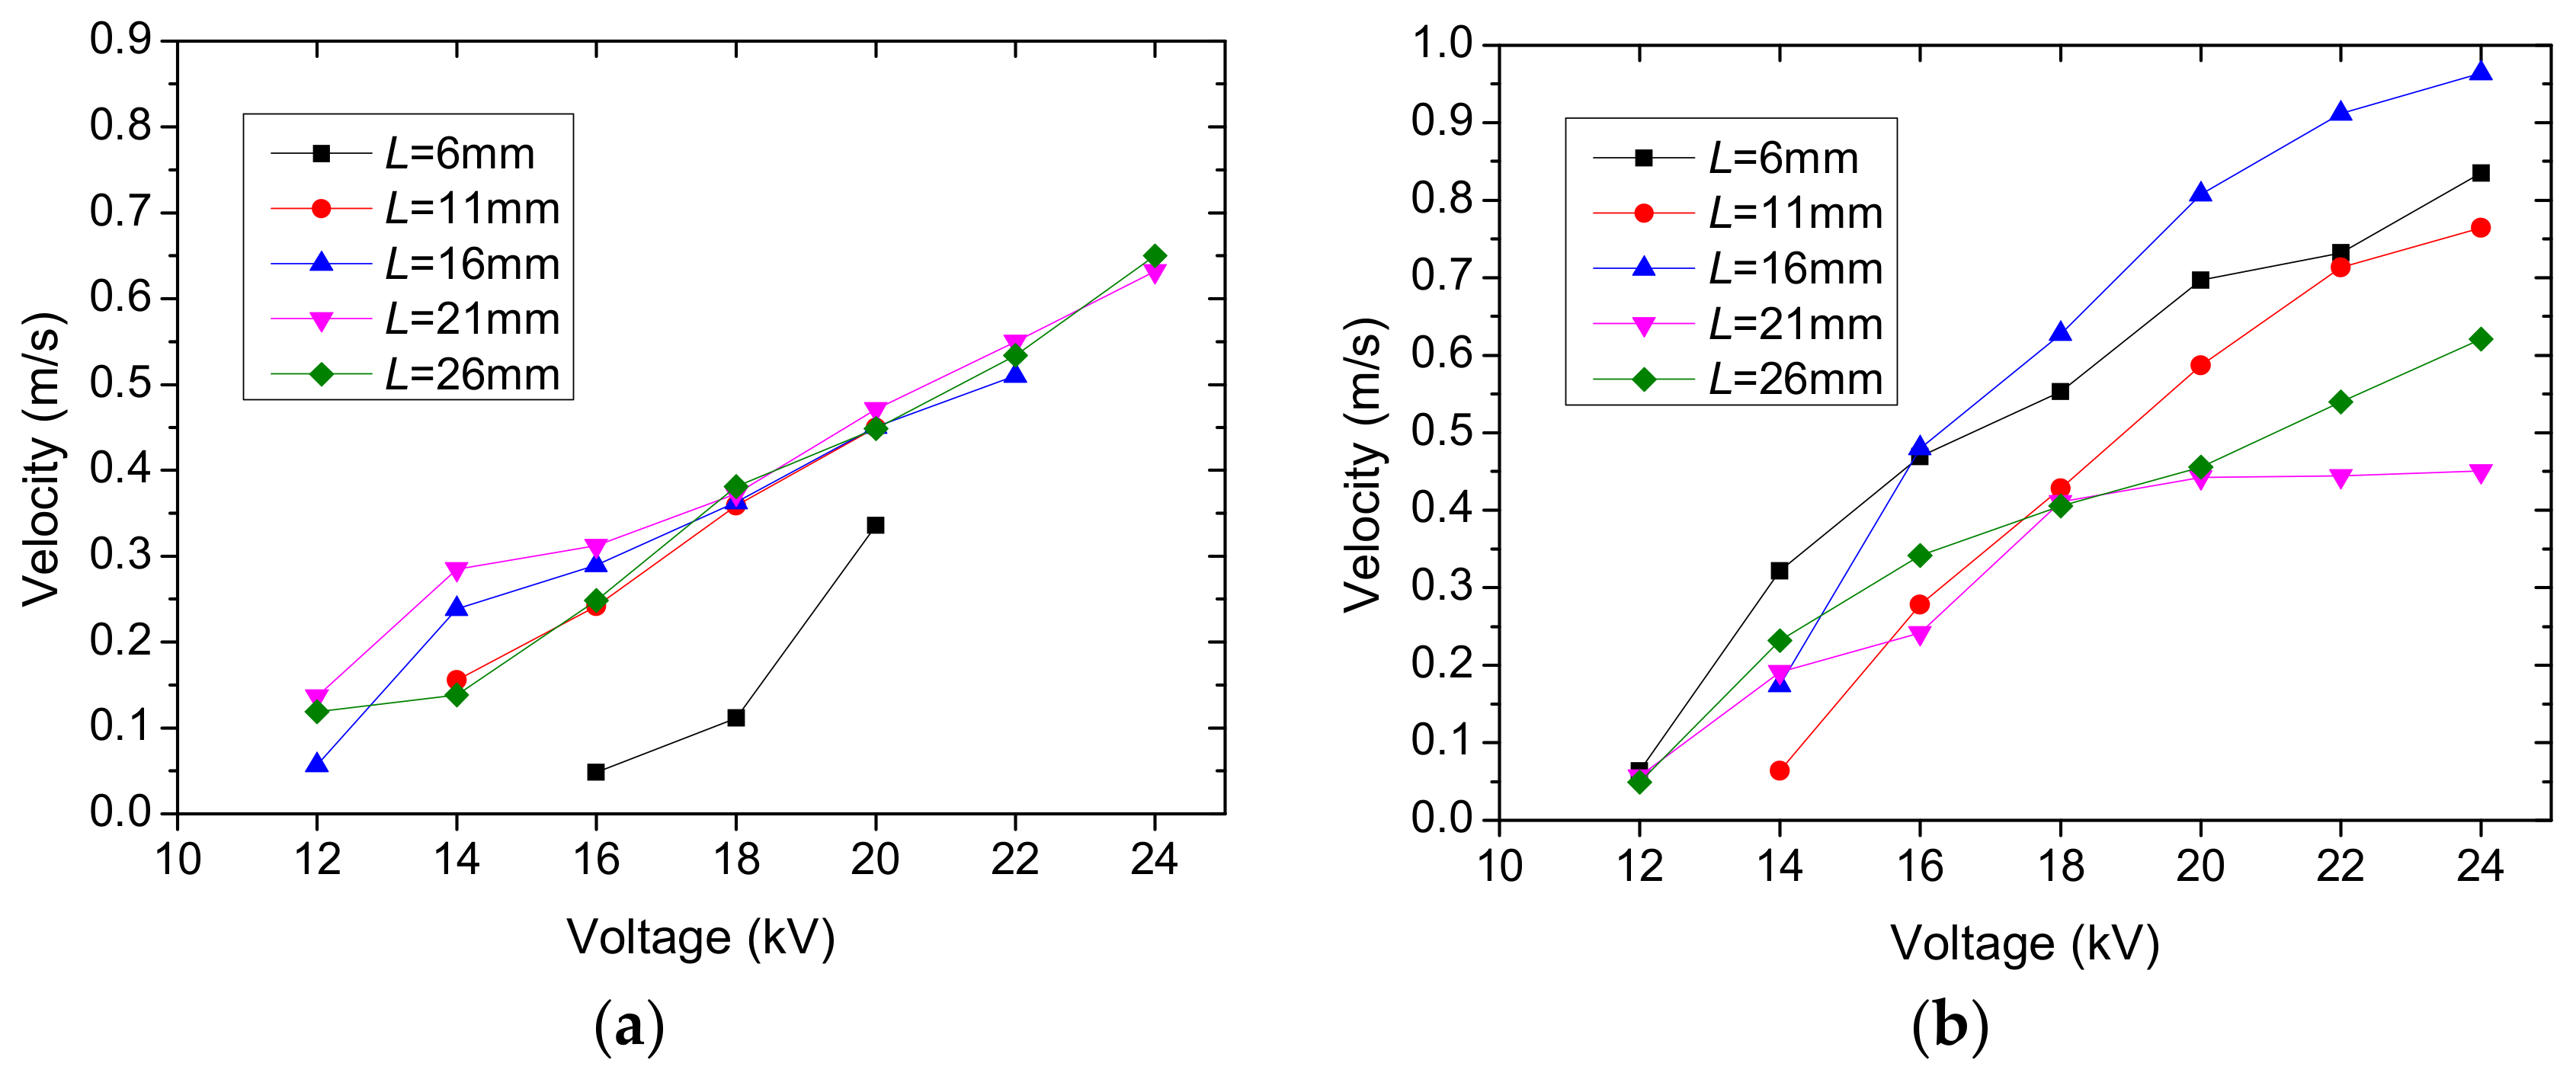
Generally, the wind velocity decreases with the increase of the electrodes gap at the same voltage, but this is not always the case for a multi-electrode structure. For example, in the negative polarity discharge of the four needles electrodes layout, as shown in Figure 11b, the velocity of ionic wind at the certain applied voltage decreases with the increase of the distance between the needles and the ring electrode in the initial stage. However, a further increase of the electrodes gap results in the increase in the ionic wind velocity. The velocity of ionic wind in the case of the minimum distance between the needles and the ring electrode (L = 6 mm) is close to the value of the maximum gap (L = 26 mm).
The appearance of this phenomenon is associated with the electric field distribution caused by different electrode gaps. A smaller electrodes gap leads to an increase in the electric field intensity of the drift zone, which is beneficial to the movement of ions, the collision with air molecules and the generation of a larger wind velocity. However, as the electrodes distance increases, the electric field intensity decreases and the wind velocity will decrease too. But with the further increase of the electrodes gap, the angle between the line, which connects the needle tip and the edge of the ring, and the axis of the ionic wind cooling device (θ, as shown in Figure 1) gradually decreases. The electric field lines gradually incline to the axis direction, which makes the axial velocity component of the charged ions’ motion increase. Therefore, the measured ionic wind velocity becomes larger with the increase of the electrodes gap. This phenomenon also occurs in the case of the corresponding positive polarity discharge, but only if a relatively large voltage is required to enable the anemometer to detect the signal of the wind velocity, as shown in Figure 11a. In terms of the effect of the discharge polarity on the ionic wind velocity, the velocity measured in the negative discharge is far greater than the value measured in the positive discharge. This is the same as in the case of the ionic wind device with three needles.
For the three needles and four-needles electrode layout, the movement of air molecules on the axis of the device relies on the air viscous friction by the ionic wind flow around the axis and the collision by a few parts of the charged ions. Consequently, the ionic wind velocity produced by these two kinds of emitting electrode layouts is lower than that produced by the five needles electrode layout. This phenomenon is more evident in the case of a positive polarity discharge. What is more, when the distance between the needle electrode and the ring electrode changes, the reading on the wind velocity meter at the measured position is potentially zero, as shown in Figure 10a and Figure 11a.
In the case of the five needles electrode layout, the variation of the velocity with the applied voltage in the positive discharge is almost the same when the voltage is larger than 16 kV, except when the electrodes gap is 6 mm, as shown in Figure 12a. On the other hand, the velocity variation in the negative discharge differs slightly with different electrode distances, as shown in Figure 12b.
Given that the wind velocity measurement position is on the axis of the ionic wind device where a needle electrode exists, only the five-needle electrode layout can produce a relatively high wind velocity, no matter what the discharge polarity is.
3.3. Temperature of the Heating Film under Ionic Wind Cooling
On account of the negative corona discharge producing a larger ionic wind velocity, the heating film is cooled by the ionic wind device with three different numbers of needles in a negative discharge. The distance between the needles and the ring electrode is adopted based on the principle of which distance produces the maximum ionic wind velocity at the applied voltage of 22 kV. Thus, except for when the electrodes gap L is 16 mm in the five-needle electrode configuration, all other electrodes gaps in the three-needle electrode configuration and four-needle electrode configuration are the same, namely 6 mm.
Table 4 lists the temperatures of the heating film center and center of the heat sink surface facing the impingement of ionic wind before and after using the ionic wind cooling. Obviously, the cooling effect of ionic wind is significant. The temperature of the heating film center in the three-needle electrode case is 3.8 °C higher than the temperature in the five-needle electrode case. The maximum temperature drop in the heating film center reaches 35.6 °C which is very effective. Studies have shown that most LED chips can work safely and reliably below 65 °C and that the three needle-electrode configurations all meet this demand. Besides, the surface temperature of the heat sink on the ionic wind impingement side is close to the ambient temperature.
The ionic wind generator can therefore augment the heat transfer on the surface of the heating film and can be a good cooling device for a high power LED.
4. Conclusions
In this work, a circular heating film representing the LED chip is fixed on a cylindrical heat sink and cooled by an ionic wind device. The influence of the number of needle electrodes, the distance between the needles and the ring electrode, and the polarity of the corona discharge on the ionic wind velocity and the current–voltage characteristics are experimentally studied. Finally, a temperature measurement of the heating film is conducted under the cooling of the ionic device, in order to quantitatively study the cooling performance of the ionic wind device. Based on the foregoing discussions, the following conclusions are made:
- The negative discharge is more difficult to break down when compared with the positive discharge. There is a breakdown in the positive discharge of three different numbers of needles, when the applied voltage approaches 24 kV. However, the breakdown does not occur in the negative discharge before the applied voltage reaches 24 kV.
- In the ionic wind devices with the same electrode layout, the ionic wind velocity produced by the negative polarity discharge is far greater than that produced by the positive polarity discharge. The ionic wind velocity at the measured point in the emitting electrode layout with three and with four needles is lower than that in the five needles electrode layout.
- The wind velocity decreases with the increase of the distance between the needles and the ring electrode in the three needles electrode layout at a certain applied voltage. On the other hand, in the case of four needles, the velocity of ionic wind decreases with the increase of the distance in the initial stage. However, a further increase of the electrodes distance will result in the increase in the ionic wind velocity.
- In the case of a five-needle electrode, the variation of velocity with the applied voltage is almost the same in the positive discharge when the voltage is larger than 16 kV, except when the electrodes distance is 6 mm, while the velocity variation in the negative discharge shows a slight difference with different electrode distances.
- The temperature of the heating film center in the three-needle electrode case is 3.8 °C higher than the temperature in the five-needle electrode case. The maximum temperature drop in the heating film center reaches 35.6 °C.
Author Contributions
Conceptualization, Jingguo Qu and Jianfei Zhang; Methodology, Jingguo Qu and Jianfei Zhang.; Validation, Jingguo Qu, and Lingjian Kong; Formal Analysis, Jingguo Qu, Lingjian Kong and Jianfei Zhang; Investigation, Jingguo Qu and Lingjian Kong.; Resources, Jianfei Zhang; Data Curation, Jingguo Qu and Lingjian Kong.; Writing-Original Draft Preparation, Jingguo Qu and Lingjian Kong; Writing-Review & Editing, Jianfei Zhang; Visualization, JIngguo Qu.; Supervision, Jianfei Zhang; Project Administration, Jianfei Zhang; Funding Acquisition, Jianfei Zhang.
Funding
This research was funded by National Natural Science Foundation of China (51576155).
Conflicts of Interest
The authors declare no conflict of interest.
Appendix A
Appendix A.1. Experimental Uncertainty Analysis
Appendix A.1.1. Velocity Measurement Error
The experimental error is objective existence, and it cannot be obtained. The uncertainty of measured results is used to evaluate the magnitude of the error.
The ionic wind velocity error can be expressed by the experimental measurement uncertainty. Since the ionic wind velocity is directly read from the hot wire anemometer, the velocity error is mainly induced by the system error of the hot wire anemometer and the accidental error in the measurement.
The system error is associated with the accuracy of the measuring instruments. According to the properties of the experimental facilities listed in Table 3, the system error δvs is
where v is the measured velocity.
In the velocity measurement test, each value of the velocity is repeatedly measured for twenty times. Thus, the accidental error δva is
where is the mean velocity of the twenty repeated values of the tests, n is the number of measurements. Therefore, the total uncertainty of the measured ionic wind velocity is
After calculation, the maximum absolute error of the measured velocity is
Appendix A.1.2. Temperature Measurement Error
The temperature errors are mainly induced by the thermocouples’ measurement error, the display error of the Agilent data acquisition system and the accidental error in the measurement. In order to get the results of temperature with higher accuracy, it is necessary to calibrate the thermocouples before the temperature measurement.
In the temperature calibration, the T type thermocouples, which have all been connected with the Agilent data acquisition system, are placed in a constant temperature tank together with a standard mercurial thermometer (accuracy is ±0.2 °C, resolution is 0.1 °C). The adjustment range of the water temperature in the tank is 0 °C to 98 °C. The calibration points of the temperature are 10 °C, 30 °C, 50 °C, 70 °C, and 90 °C. After calibration, the linear fitting of the results read on the mercurial thermometer with the results measured by the thermocouples are shown in Equations (A5) and (A6).
where Tm is the temperature measured by the mercurial thermometer, and Tt is the temperature measured by the thermocouples. Equation (A5) is the correlation for the thermocouple located at the center of the heating film. Equation (A6) is the correlation for the thermocouple located on the surface of the heat sink facing the impingement of the ionic wind.
Finally, all the measured results are corrected according to the correlation equations. Therefore, the uncertainty of the measured results includes three parts: the linear fitting error δtf, the error of the mercurial thermometer δtm, and the measurement accidental error δta.
For each temperature calibration point, the measured values of thermocouples are taken into the above two equations, and then the calculated results are compared with the readings of the mercurial thermometer to get the linear fitting error. The maximum linear fitting error in this calibration is
The system error of the mercurial thermometer is
The accidental error δta is calculated by
where is the mean temperature of the ten repeated measured values, n is the number of measurements. The maximum accidental error δta,max of the two thermocouples in this experiment is
Therefore, the total uncertainty of the measured temperature is
After calculation, the maximum absolute error of the measured temperature is
References
- O’Brien, R.J.; Shine, A.J. Some effects of an electric field on heat transfer from a vertical plate in free convection. J. Heat Transf. 1964, 89, 114–116. [Google Scholar] [CrossRef]
- Mitchell, A.S.; Williams, L.E. Heat transfer by the corona wind impinging on a plate surface. J. Electrost. 1978, 5, 309–324. [Google Scholar] [CrossRef]
- Owsenek, B.L.; Seyed-Yagoobi, J.; Page, R.H. Experimental investigation of corona wind heat transfer enhancement with a heated horizontal flat plate. J. Heat Transf. 1995, 119, 309–324. [Google Scholar] [CrossRef]
- Sheu, W.J.; Huang, R.T.; Wang, C.C. Heat transfer enhancement by needle arrayed electrodes—An EHD integrated cooling system. Energy Conserv. Manag. 2009, 50, 1789–1796. [Google Scholar]
- Chen, I.Y.; Guo, M.-Z.; Yang, K.-S.; Wang, C.-C. Enhanced cooling for LED lighting using ionic wind. Int. J. Heat Mass Transf. 2013, 57, 285–291. [Google Scholar] [CrossRef]
- Lee, J.R.; Lau, E.V. Enhancement of Forced Convection Heat Transfer on LED by Ionic Wind. In Proceedings of the 4th International Conference on Industrial Engineering Applications, Nagoya, Japan, 21–23 April 2017; pp. 35–38. [Google Scholar]
- Bai, Y.; Qu, M.; Luan, Z.; Li, X.; Yang, Y. Electrohydrodynamic drying of sea cucumber (Stichopus japonicus). LWT Food Sci. Technol. 2013, 54, 570–576. [Google Scholar] [CrossRef]
- Taghian Dinani, S.; Hamdami, N.; Shahedi, M.; Havet, M. Quality assessment of mushroom slices dried by hot air combined with an electrohydrodynamic (EHD) drying system. Food Bioprod. Process. 2015, 94, 572–580. [Google Scholar] [CrossRef]
- Martynenko, A.; Zheng, W. Electrohydrodynamic drying of apple slices: Energy and quality aspects. J. Food Eng. 2016, 168, 215–222. [Google Scholar] [CrossRef]
- Dobrynin, D.; Friedman, G.; Fridman, A.; Starikovskiy, A. Inactivation of bacteria using dc corona discharge: Role of ions and humidity. New J. Phys. 2011, 13, 103033. [Google Scholar] [CrossRef] [PubMed]
- Liang, J.-L.; Zheng, S.-H.; Ye, S.-Y. Inactivation of Penicillium aerosols by atmospheric positive corona discharge processing. J. Aerosol Sci. 2012, 54, 103–112. [Google Scholar] [CrossRef]
- Johnson, M.J.; Go, D.B. Recent advances in electrohydrodynamic pumps operated by ionic winds: A review. Plasma Sources Sci. Technol. 2017, 26. [Google Scholar] [CrossRef]
- Knap, M.; Duga, J.; Lui, T.C. Ionic wind generator on led lighting application. In Proceedings of the 20th International Workshop on Thermal Investigations of Ics and Systems Greenwich, London, UK, 21–23 September 2014. [Google Scholar]
- Chen, I.Y.; Chen, C.-J.; Wang, C.-C. Influence of electrode configuration on the heat transfer performance of a LED heat source. Int. J. Heat Mass Transf. 2014, 77, 795–801. [Google Scholar] [CrossRef]
- Shin, D.H.; Baek, S.H.; Ko, H.S. Development of heat sink with ionic wind for LED cooling. Int. J. Heat Mass Transf. 2016, 93, 516–528. [Google Scholar] [CrossRef]
- Xu, C.; Zhang, Z.; Chu, J.; Wu, J.; Lei, X. Thermal dissipation enhancement of LED filament bulb by ionic wind. In Proceedings of the 17th International Conference on Electronic Packaging Technology, Wuhan, China, 16–19 August 2016; pp. 1212–1215. [Google Scholar]
- June, M.S.; Kribs, J.; Lyons, K.M. Measuring efficiency of positive and negative ionic wind devices for comparison to fans and blowers. J. Electrost. 2011, 69, 345–350. [Google Scholar] [CrossRef]
- Drews, A.M.; Cademartiri, L.; Whitesides, G.M.; Bishop, K.J.M. Electric winds driven by time oscillating corona discharges. J. Appl. Phys. 2013, 114, 143302. [Google Scholar] [CrossRef] [Green Version]
- Lee, S.J.; Li, L; Kwon, K; Kim, W.; Kim, D. Parallel integration of ionic wind generators on PCBs for enhancing flow rate. Microsyst. Technol. 2015, 21, 1465–1471. [Google Scholar] [CrossRef]
- Shakouri Pour, M.; Esmaeilzadeh, E. Experimental investigation of convective heat transfer enhancement from 3D-shape heat sources by EHD actuator in duct flow. Exp. Therm. Fluid Sci. 2011, 35, 1383–1391. [Google Scholar] [CrossRef]
- Alamgholilou, A.; Esmaeilzadeh, E. Experimental investigation on hydrodynamics and heat transfer of fluid flow into channel for cooling of rectangular ribs by passive and EHD active enhancement methods. Exp. Therm. Fluid Sci. 2012, 38, 61–73. [Google Scholar] [CrossRef]
- Fylladitakis, E.D.; Moronis, A.X.; Kiousis, K. Design of a Prototype EHD Air Pump for Electronic Chip Cooling Applications. Plasma Sci. Technol. 2014, 16, 491–501. [Google Scholar] [CrossRef]
- Wang, J.; Cai, Y.-X.; Bao, W.-W.; Li, H.-X.; Liu, Q. Experimental study of high power LEDs heat dissipation based on corona discharge. Appl. Therm. Eng. 2016, 98, 420–429. [Google Scholar] [CrossRef]
- Wang, J.; Cai, Y.-X.; Li, X.-H.; Zhao, X.-D.; Wang, J.; Shi, Y.-F.; Shi, Y.-X. Experimental investigation of high-power light-emitting diodes’ thermal management by ionic wind. Appl. Therm. Eng. 2017, 122, 49–58. [Google Scholar] [CrossRef]
- Steele, R.V. High-brightness LED market overview. Proc. SPIE 2001, 4445, 1–4. [Google Scholar]
- Zhang, Y.; Liu, L.; Chen, Y.; Ouyang, J. Characteristics of ionic wind in needle-to-ring corona discharge. J. Electrost. 2015, 74, 15–20. [Google Scholar] [CrossRef]
Figure 1.
Ionic wind device: (a) structure of the device; and (b) some dimensions of the device.

Figure 2.
Layout of the needle electrodes: (a) three needles; (b) four needles; and (c) five needles.
Figure 2.
Layout of the needle electrodes: (a) three needles; (b) four needles; and (c) five needles.

Figure 3.
Heating film on the heat sink.
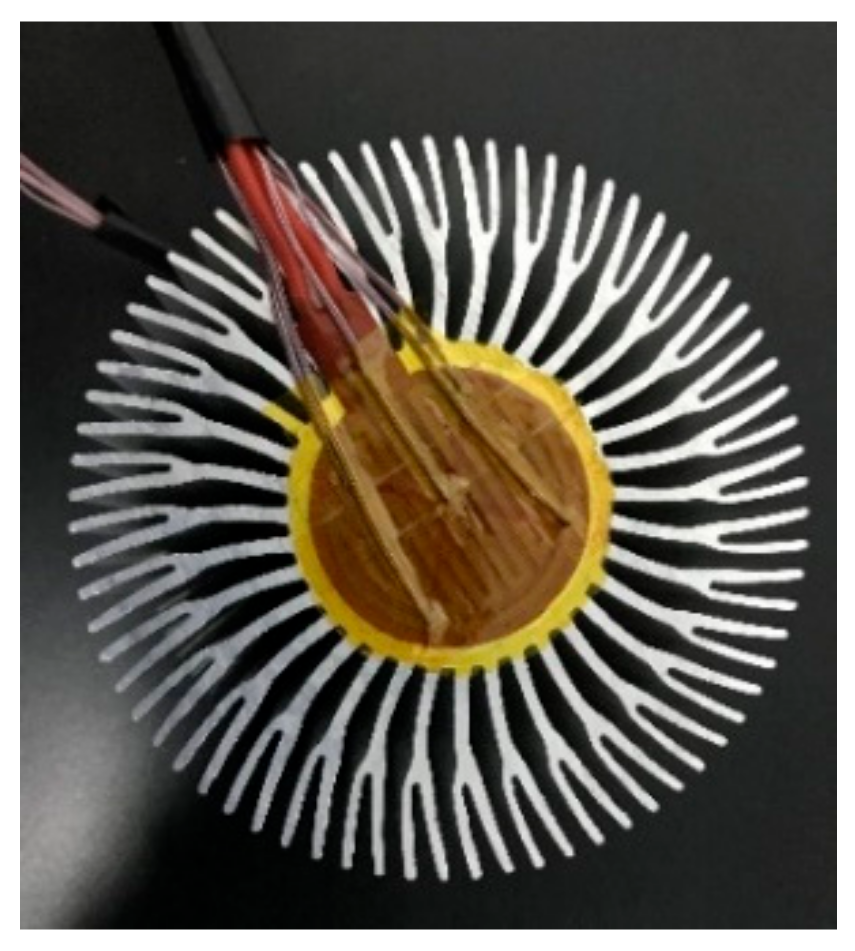
Figure 4.
Schematic of the ionic wind velocity testing system.

Figure 5.
Schematic of the ionic wind velocity testing system.
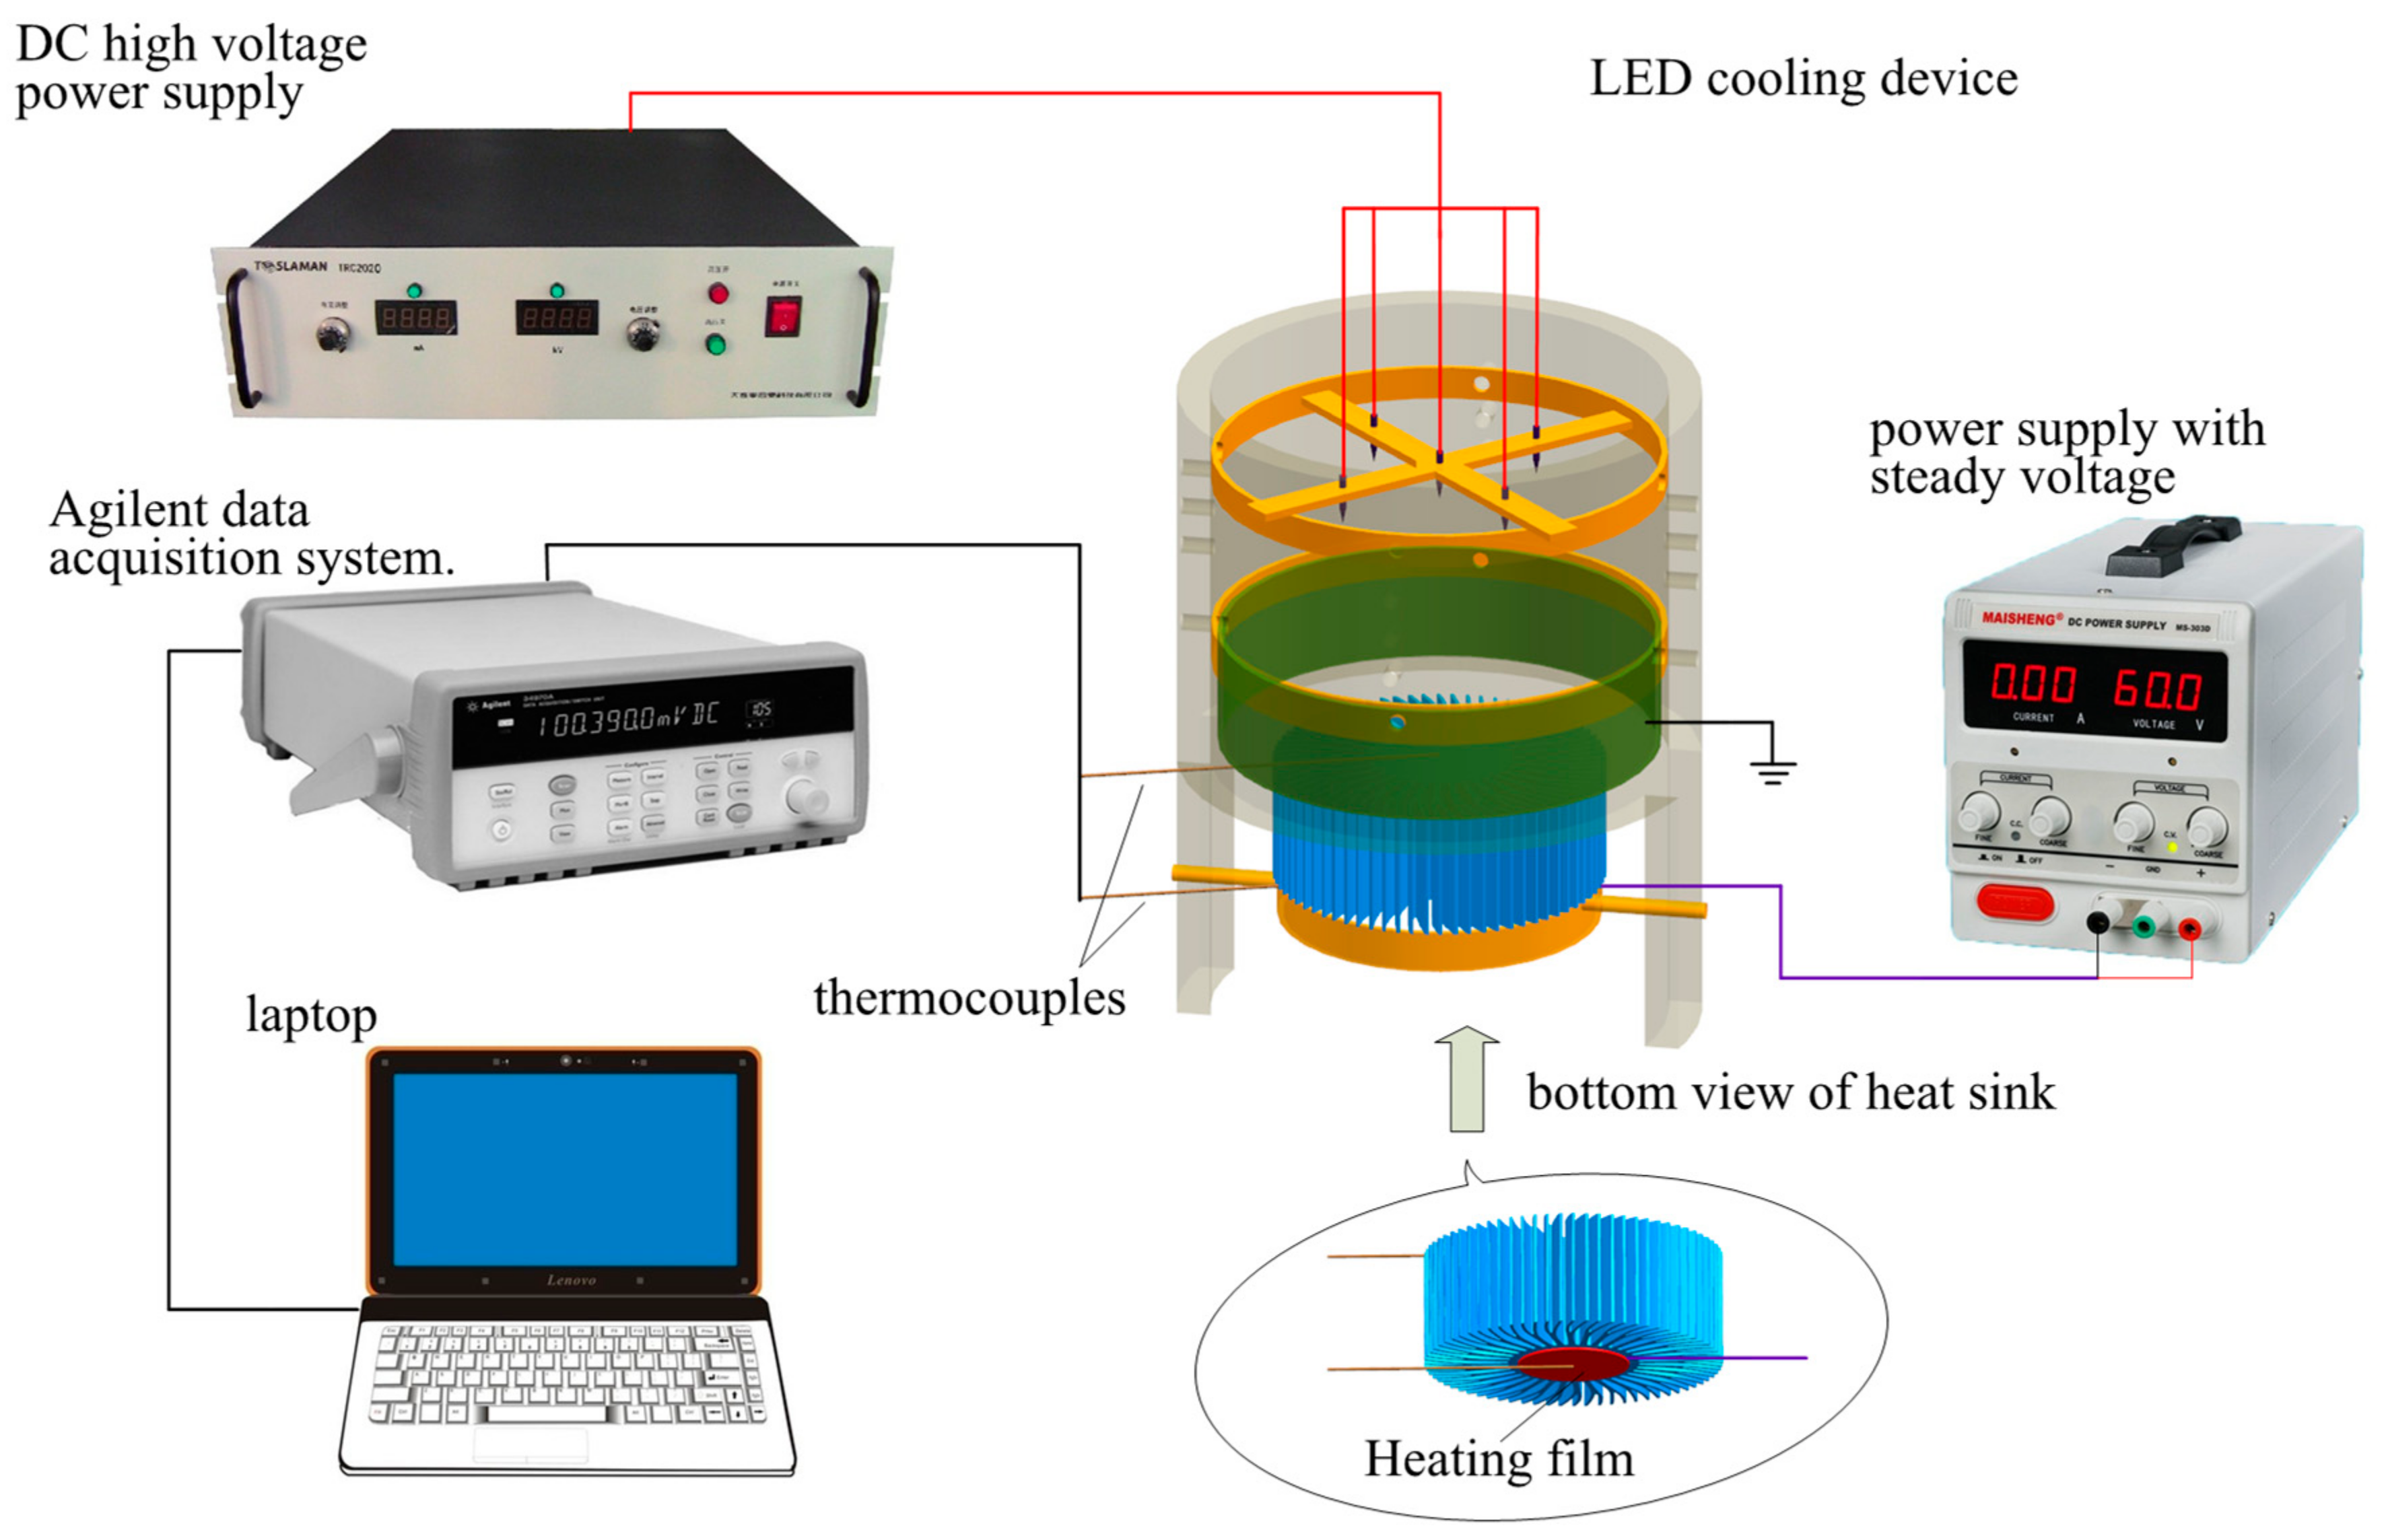
Figure 6.
Photographs of the experimental device: (a) ionic wind velocity measurement; and (b) temperature measurement of the heating film in the LED cooling device.
Figure 6.
Photographs of the experimental device: (a) ionic wind velocity measurement; and (b) temperature measurement of the heating film in the LED cooling device.

Figure 7.
Variation of discharge current with the applied voltage with different needle-ring distances for three needles: (a) positive corona discharge; and (b) negative discharge.
Figure 7.
Variation of discharge current with the applied voltage with different needle-ring distances for three needles: (a) positive corona discharge; and (b) negative discharge.
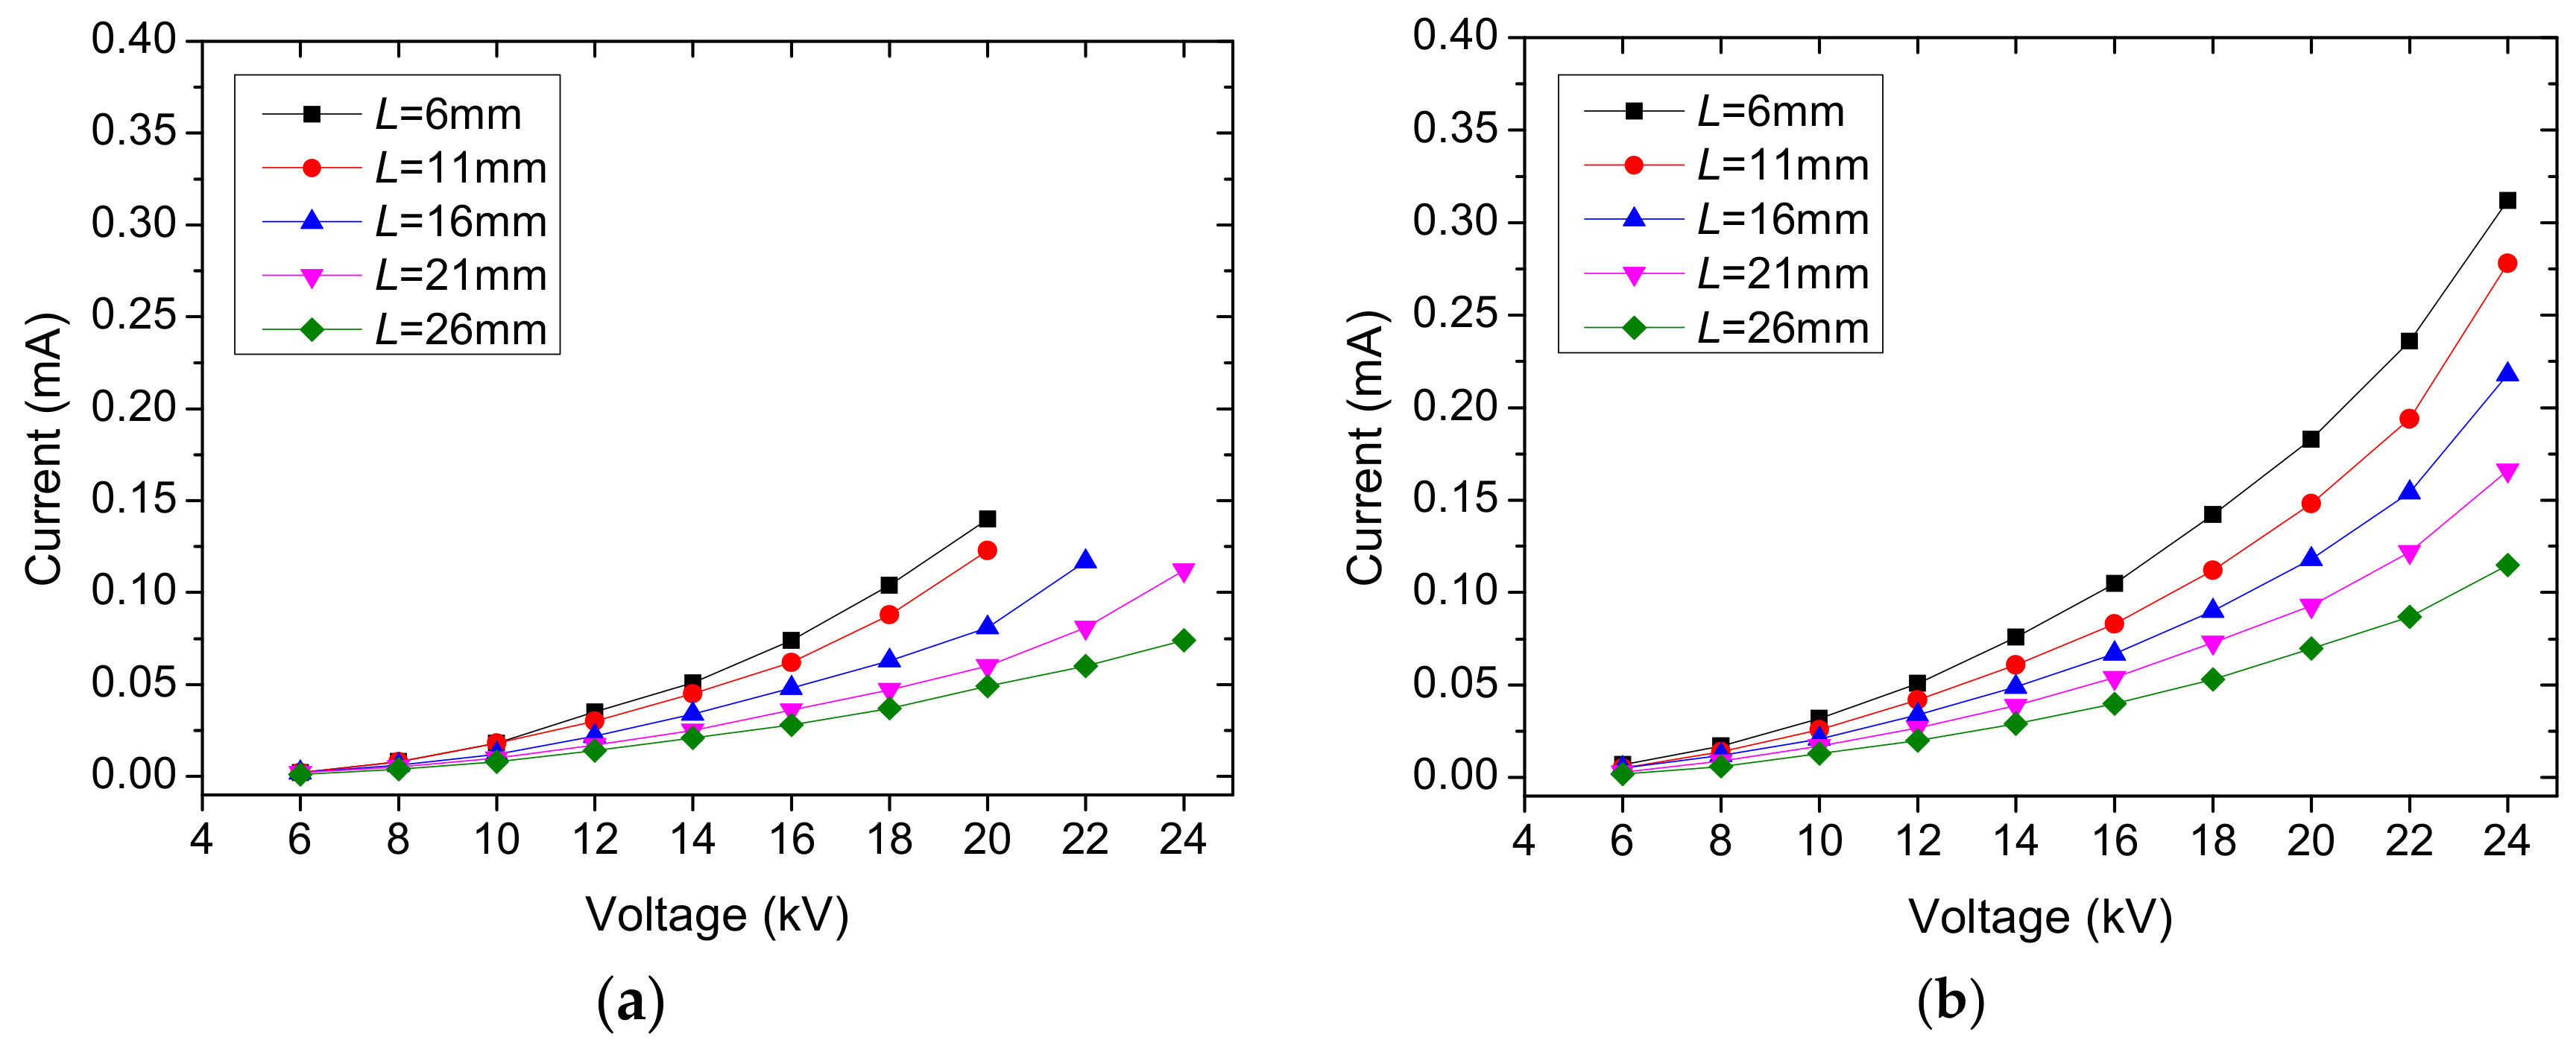
Figure 8.
Variation of discharge current with the applied voltage with different needle-ring distances for four needles: (a) positive corona discharge; and (b) negative discharge.
Figure 8.
Variation of discharge current with the applied voltage with different needle-ring distances for four needles: (a) positive corona discharge; and (b) negative discharge.

Figure 9.
Variation of discharge current with the applied voltage with different needle-ring distances for five needles: (a) positive corona discharge; and (b) negative discharge.
Figure 9.
Variation of discharge current with the applied voltage with different needle-ring distances for five needles: (a) positive corona discharge; and (b) negative discharge.

Figure 10.
Variation of ionic wind velocity with the applied voltage with different needle-ring distances for three needles: (a) positive corona discharge; and (b) negative discharge.
Figure 10.
Variation of ionic wind velocity with the applied voltage with different needle-ring distances for three needles: (a) positive corona discharge; and (b) negative discharge.
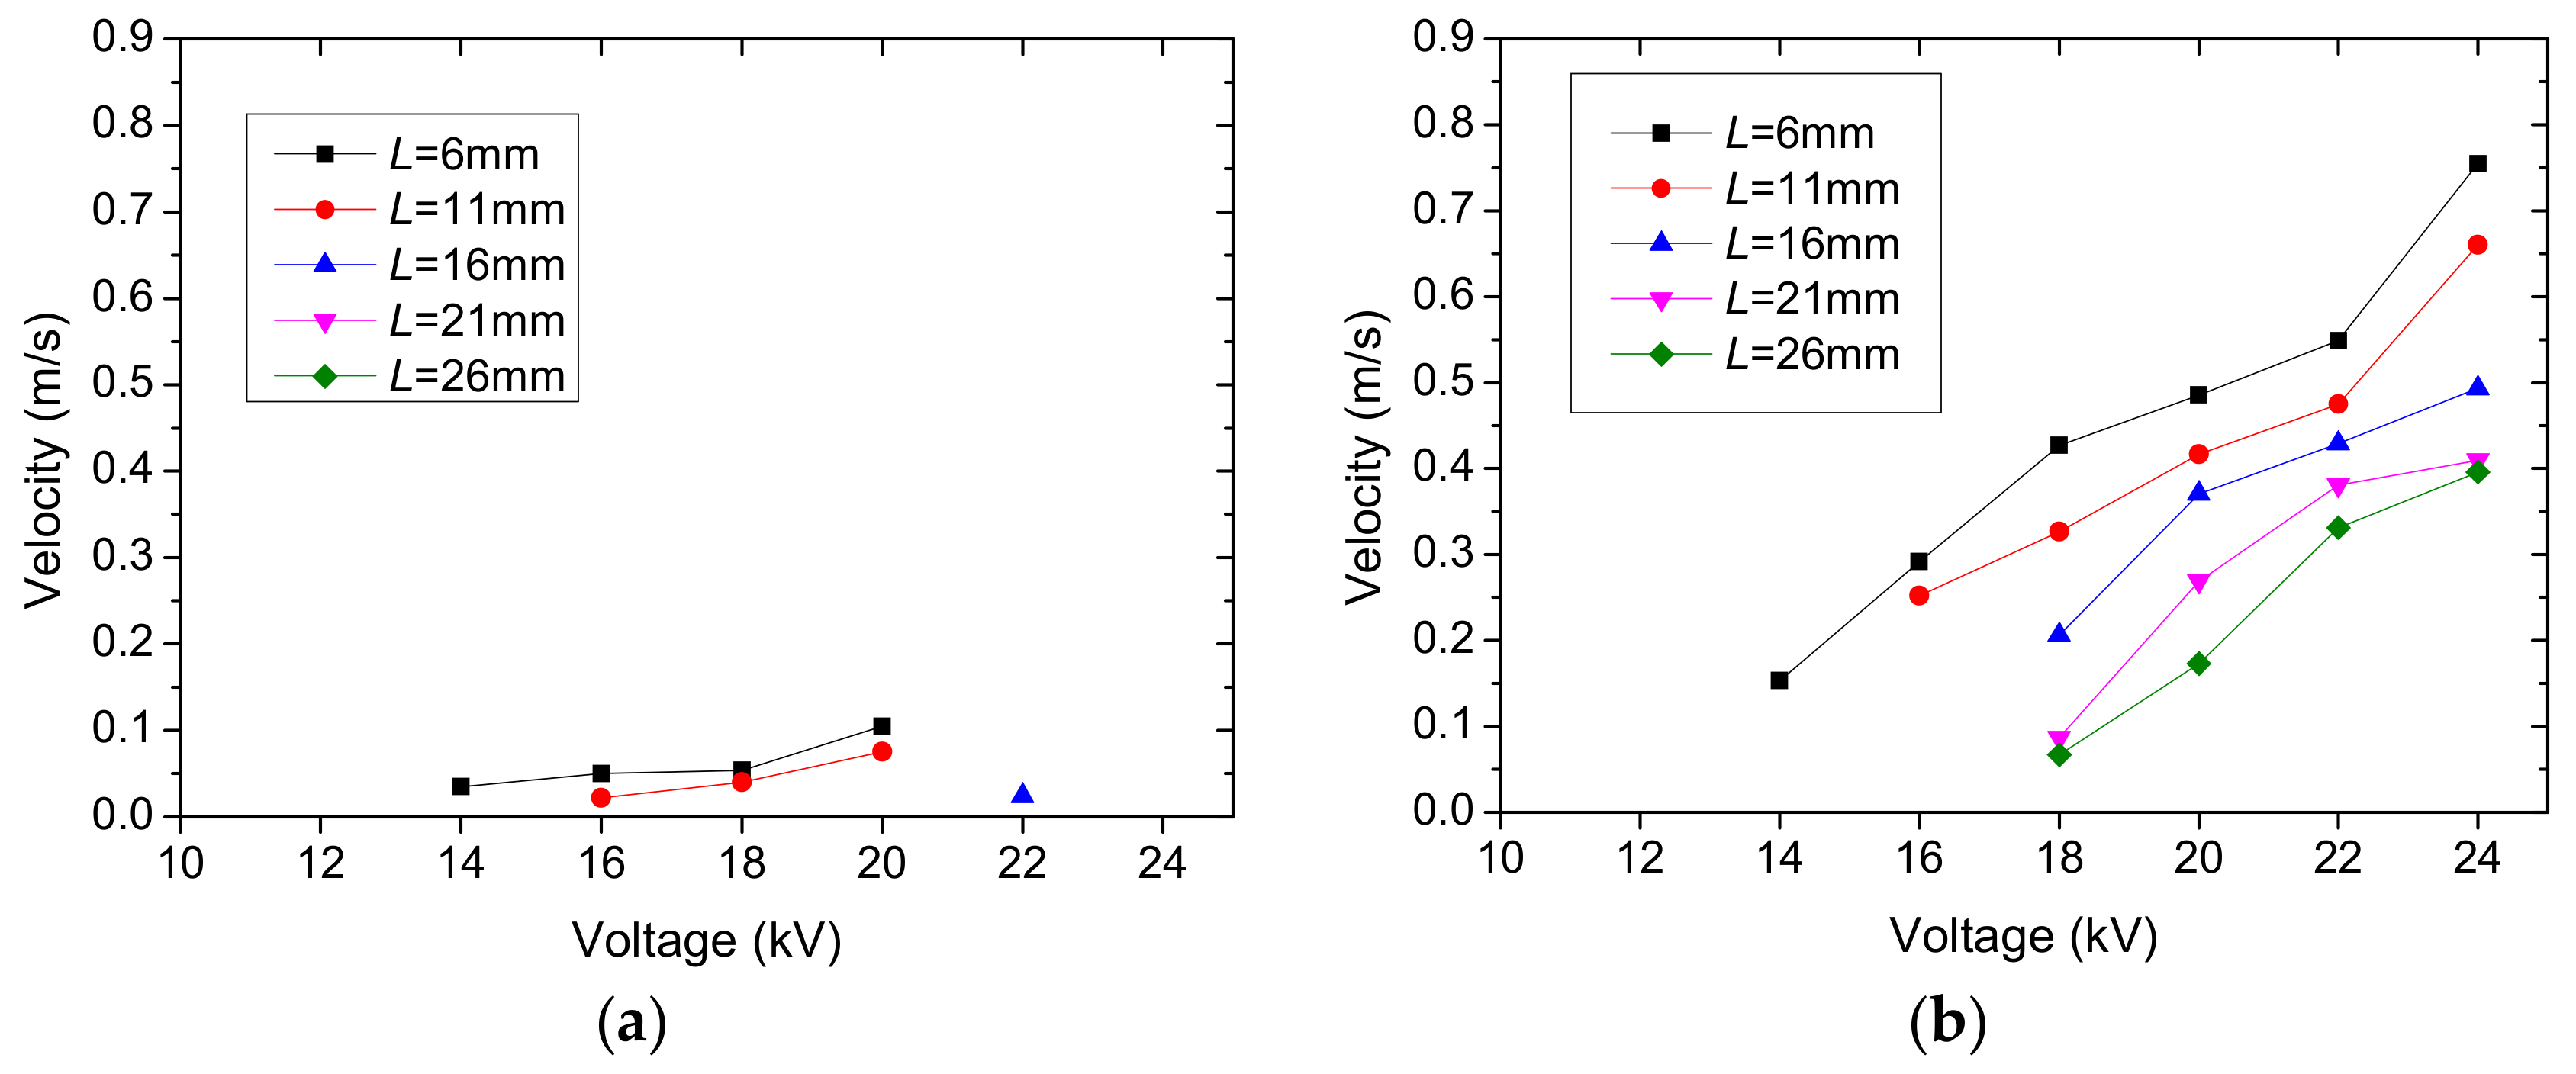
Figure 11.
Variation of ionic wind velocity with the applied voltage with different needle-ring distances for four needles: (a) positive corona discharge; and (b) negative discharge.
Figure 11.
Variation of ionic wind velocity with the applied voltage with different needle-ring distances for four needles: (a) positive corona discharge; and (b) negative discharge.
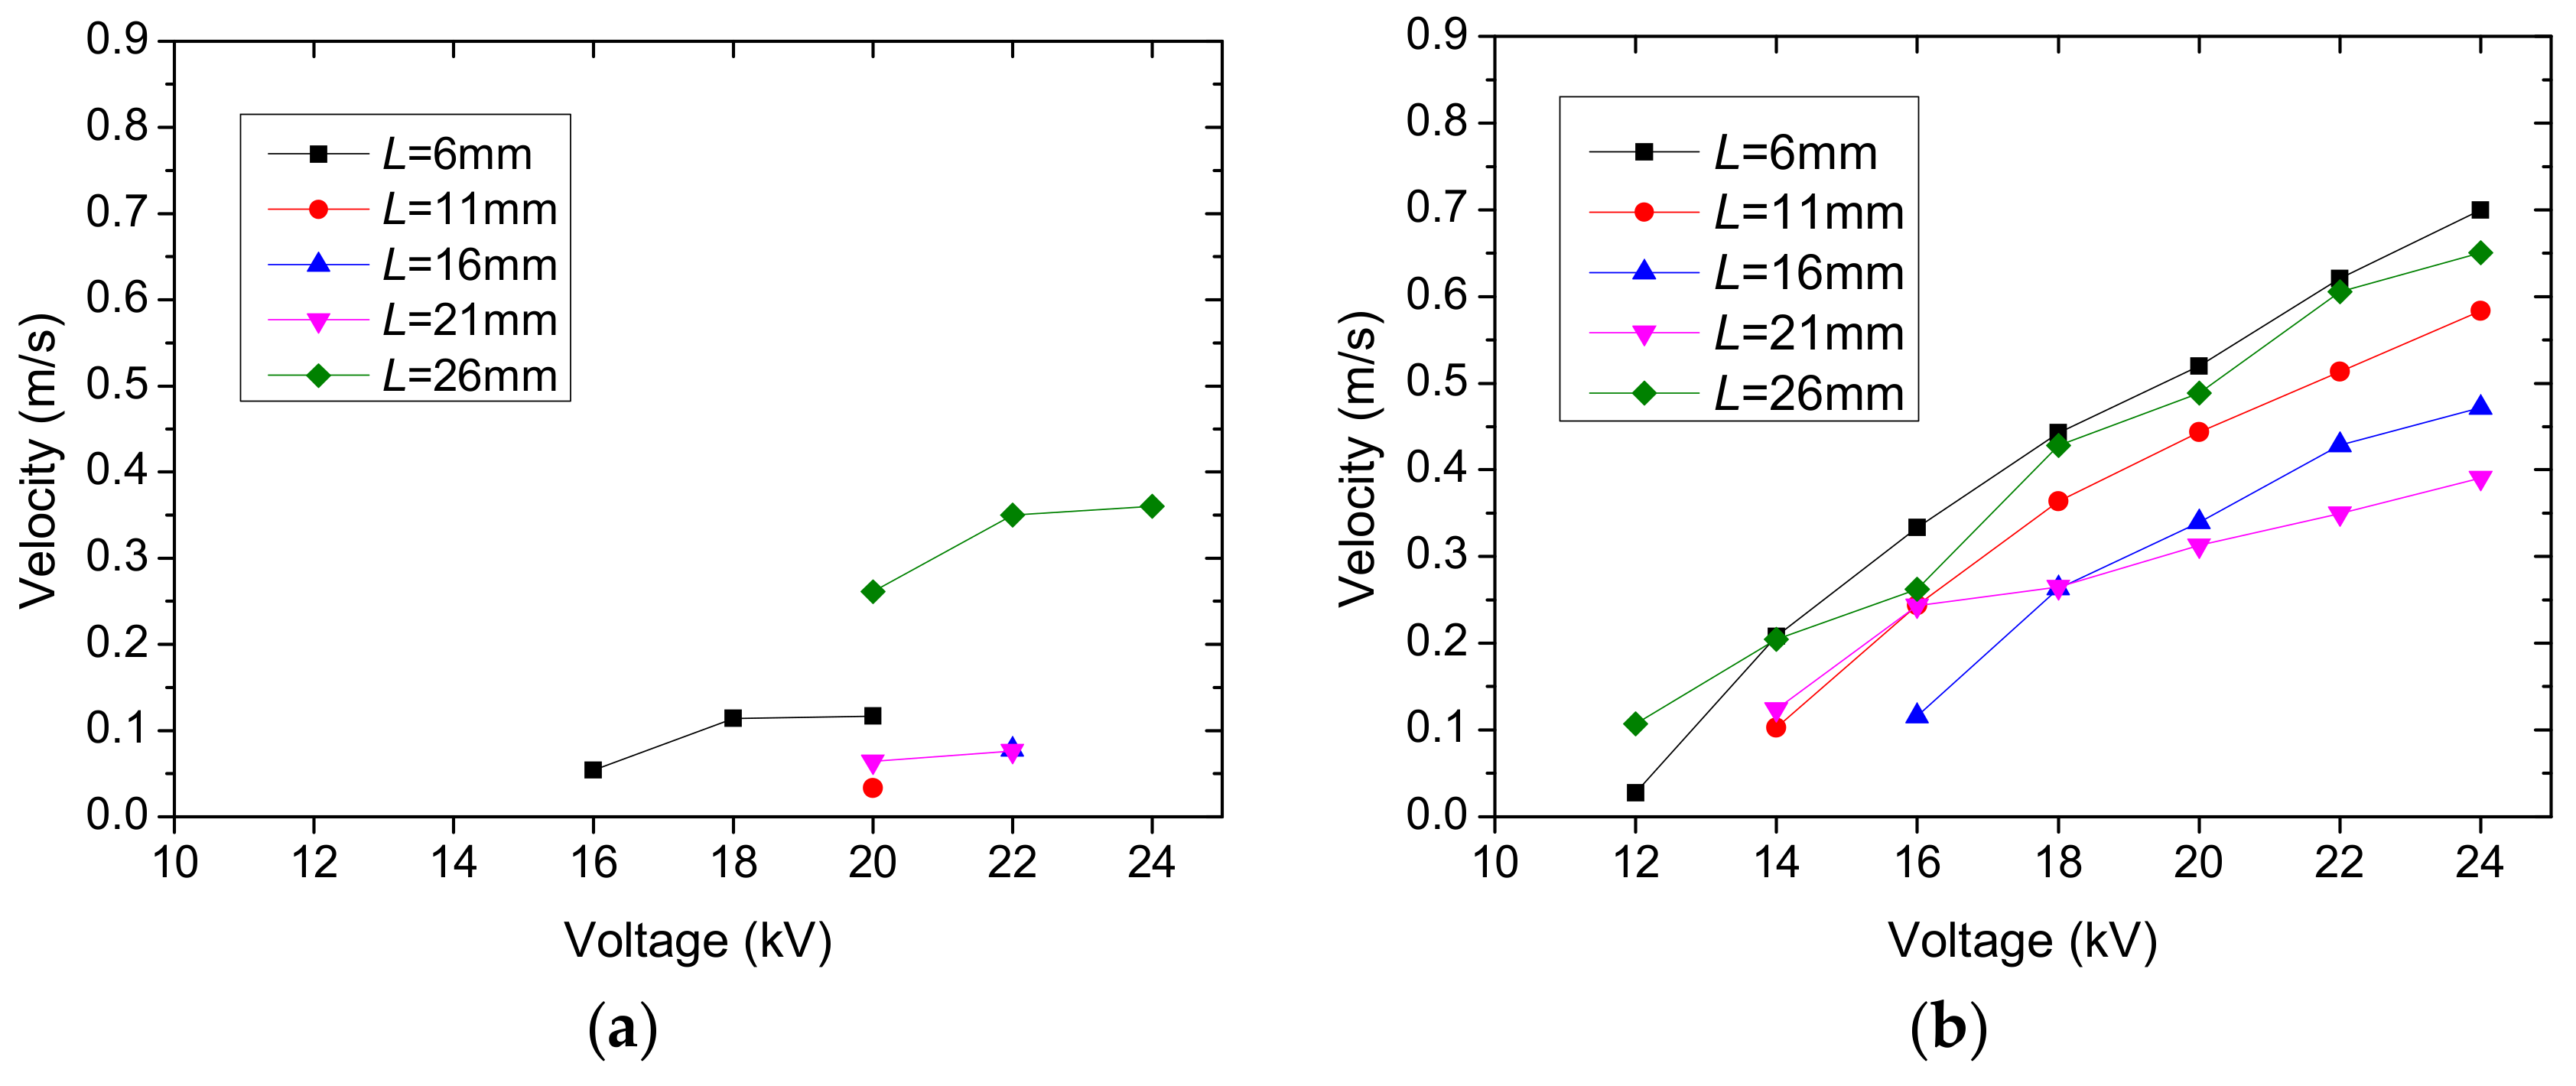
Figure 12.
Variation of ionic wind velocity with the applied voltage with different needle-ring distances for five needles: (a) positive corona discharge; and (b) negative discharge.
Figure 12.
Variation of ionic wind velocity with the applied voltage with different needle-ring distances for five needles: (a) positive corona discharge; and (b) negative discharge.

Table 1.
Specifications of the electrodes.
| Components | Specifications |
|---|---|
| Needle (diameter × length + material) | 1 mm × 11 mm + wolfram |
| Ring (inner diameter × height × thickness+ material) | 98 mm × 16 mm × 2 mm + stainless steel |
| Distances between the needles and the ring, L | 6 mm/11 mm/16 mm/21 mm/26 mm |
Table 2.
Some working parameters of the heating film in this work.
| Working Parameters | Value |
|---|---|
| Voltage | 10.9 V |
| Current | 0.92 A |
| Size (diameter × thickness) | 30 mm × 0.15 mm |
Table 3.
Characteristics of the experimental facilities.
| Experimental Facilities | Properties |
|---|---|
| DC high voltage power supply (Teslaman TRC2020, Dalian Teslaman Technologies Co. Ltd., Dalian, China) | Output voltage range: 0~+50 kV, 0~−50 kV |
| Resolution: 0.001 kV, 0.001 mA | |
| Accuracy: ±0.1% | |
| Stability: less than 0.1% per 8 h after boot up half an hour later | |
| Agilent signal acquisition system (Agilent 34970A, Agilent Technologies Co. Ltd., Santa Clara, CA, USA) | Temperature measurement range: −100~400 °C 1 |
| Accuracy: ±1 °C 1 | |
| Resolution: 0.001 °C | |
| T type thermal couples | Temperature measurement range: −100~400 °C |
| Accuracy: ±0.5 °C | |
| Steady voltage power supply (Maisheng MS-303D, Maihao Electronic Technology Co., Ltd., Dongguan, China) | Output voltage range:0–30 V |
| Accuracy: ±1% ± 1 dgt 2 | |
| Resolution: 0.01 V, 0.01 A | |
| Hot-wire anemometer (Smart-Sensor AR866A, Sigma Technology Inc., Ltd. Hong Kong, China) | Measurement range: 0.1~30 m/s |
| Accuracy: ±1% ± 1 dgt 2 | |
| Resolution: 0.01 m/s |
1 The temperature range and its accuracy are for T type thermal couples. 2 Note: dgt is the resolution.
Table 4.
Temperature of the heating film center and center of the heat sink surface facing the impingement of ionic wind. (Applied voltage of 22 kV in negative corona discharge).
Table 4.
Temperature of the heating film center and center of the heat sink surface facing the impingement of ionic wind. (Applied voltage of 22 kV in negative corona discharge).
| Operation of the Heating Film | Temperature | |
|---|---|---|
| Heating Film Center, °C | Center of the Heat Sink Surface, °C | |
| Without ionic wind | 88.6 | 65.2 |
| Cooled by three-needle electrode | 56.8 | 34.2 |
| Cooled by four-needle electrode | 55.3 | 31.5 |
| Cooled by five-needle electrode | 53.0 | 30.5 |
© 2018 by the authors. Licensee MDPI, Basel, Switzerland. This article is an open access article distributed under the terms and conditions of the Creative Commons Attribution (CC BY) license (http://creativecommons.org/licenses/by/4.0/).
Share and Cite
MDPI and ACS Style
Qu, J.; Kong, L.; Zhang, J. Experimental Investigation on Flow and Heat Transfer Characteristics of a Needle-Cylinder Type Ionic Wind Generator for LED Cooling. Energies 2018, 11, 1149. https://doi.org/10.3390/en11051149
AMA Style
Qu J, Kong L, Zhang J. Experimental Investigation on Flow and Heat Transfer Characteristics of a Needle-Cylinder Type Ionic Wind Generator for LED Cooling. Energies. 2018; 11(5):1149. https://doi.org/10.3390/en11051149
Chicago/Turabian StyleQu, Jingguo, Lingjian Kong, and Jianfei Zhang. 2018. "Experimental Investigation on Flow and Heat Transfer Characteristics of a Needle-Cylinder Type Ionic Wind Generator for LED Cooling" Energies 11, no. 5: 1149. https://doi.org/10.3390/en11051149
Note that from the first issue of 2016, this journal uses article numbers instead of page numbers. See further details here.