Multi-Criteria Decision Analysis for Benchmarking Human-Free Lifting Solutions in the Offshore Wind Energy Environment

 , , and
Abstract
:1. Introduction
2. Wind Turbine Lifting Concepts
2.1. Guidance and Control
2.2. Connections
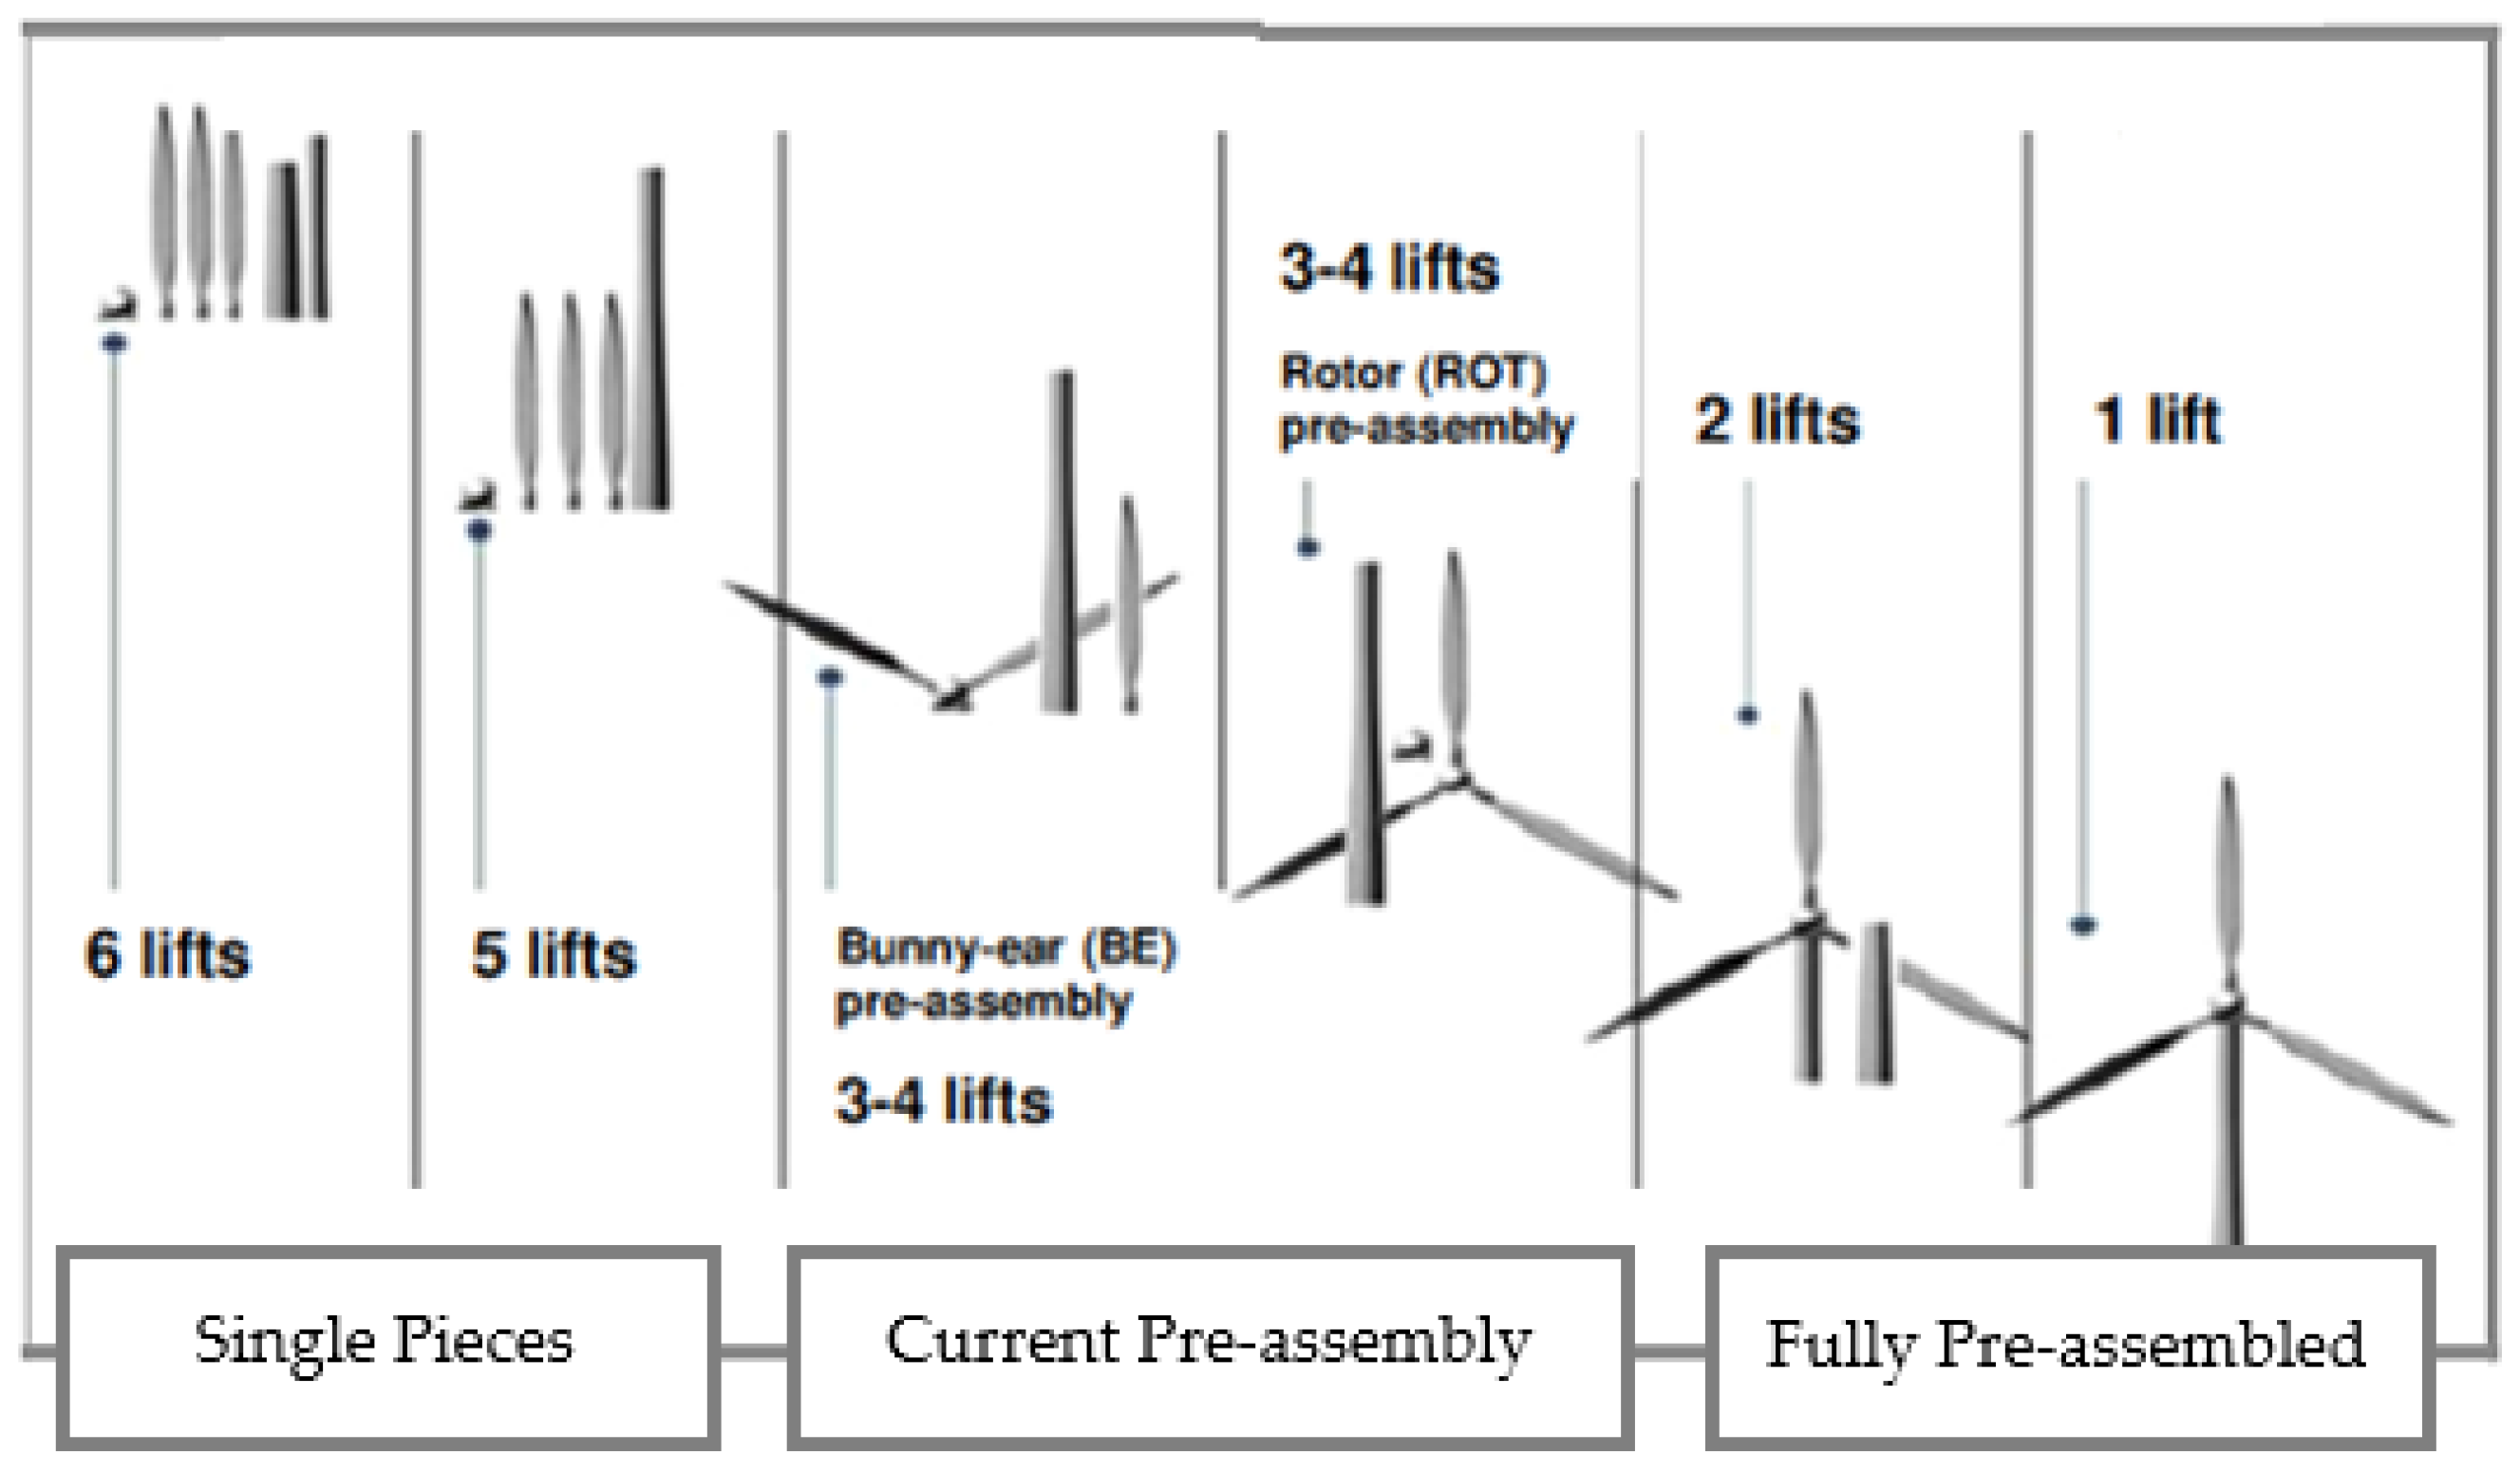
2.3. Assembly
- Six lifting operations, transporting the turbine in single pieces (SP) [21], with the tower being split into two tower elements (2T), pre-assembling only the hub on the nacelle, and lifting each component separately. This solution can be employed where limitations in the design/operating capacity of equipment, or the stability of the installation unit (either vessel or barge) do not allow the entire tower (1T) to be lifted and transported.
- Five lifting operations, performed in the same way as the six-lifts method but without splitting the tower into two tower elements.
- From four to three lifting operations, such as for bunny-ear (BE) and rotor (ROT) pre-assembly methods.
- From two to a single lifting operation.
2.4. Concept Summary
3. Multi-Criteria Framework for Assessment of Human-Free Offshore Lifting Solutions
3.1. Introduction to MCDA
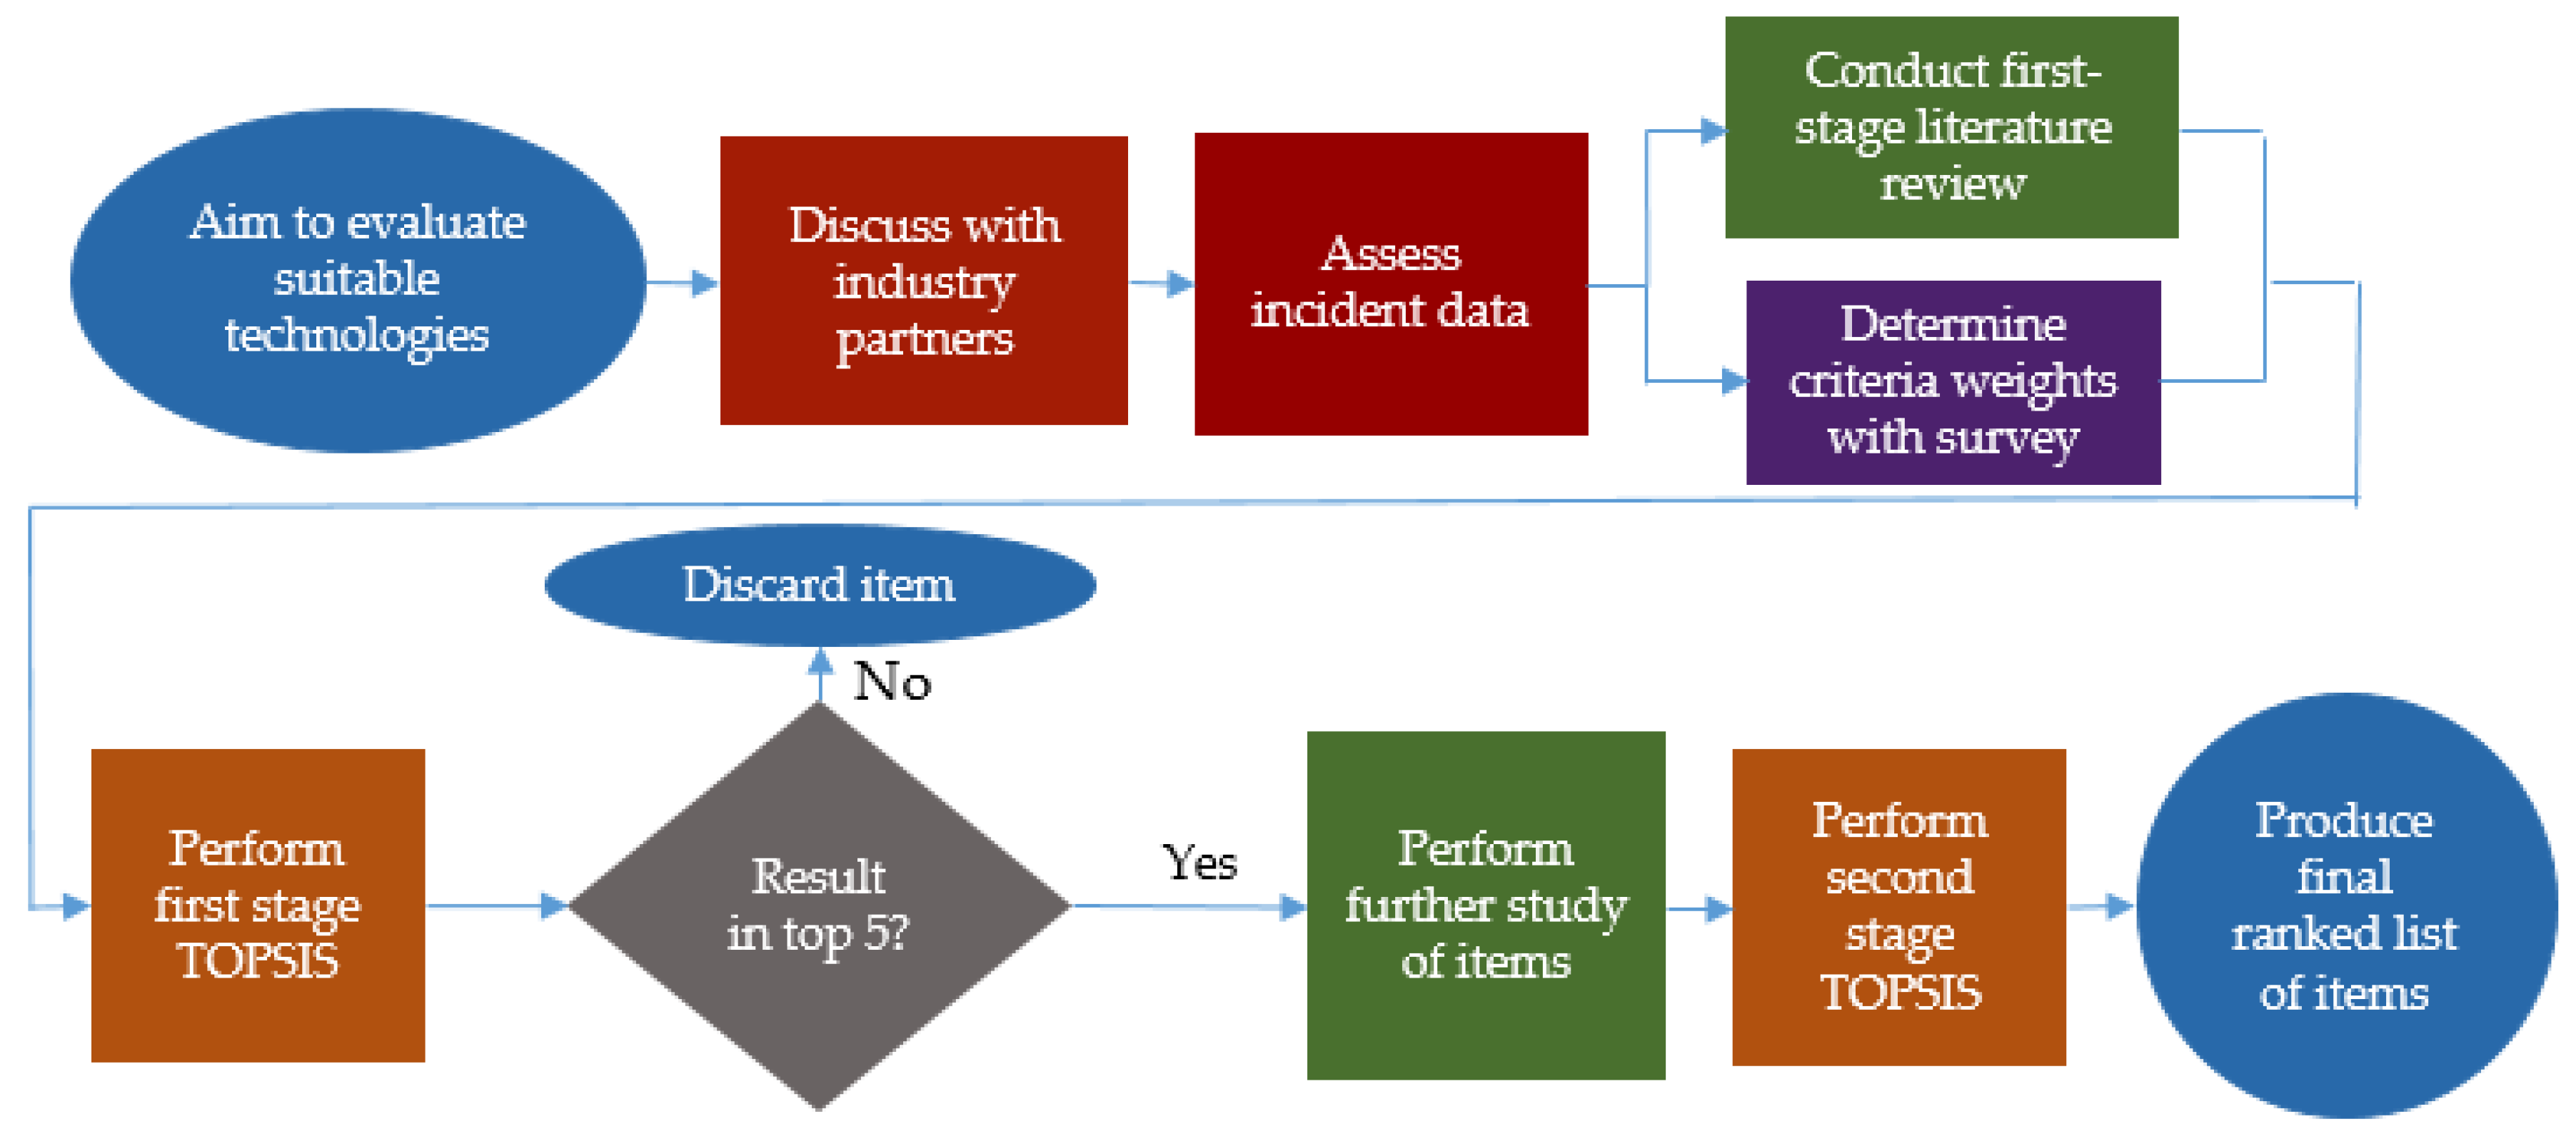
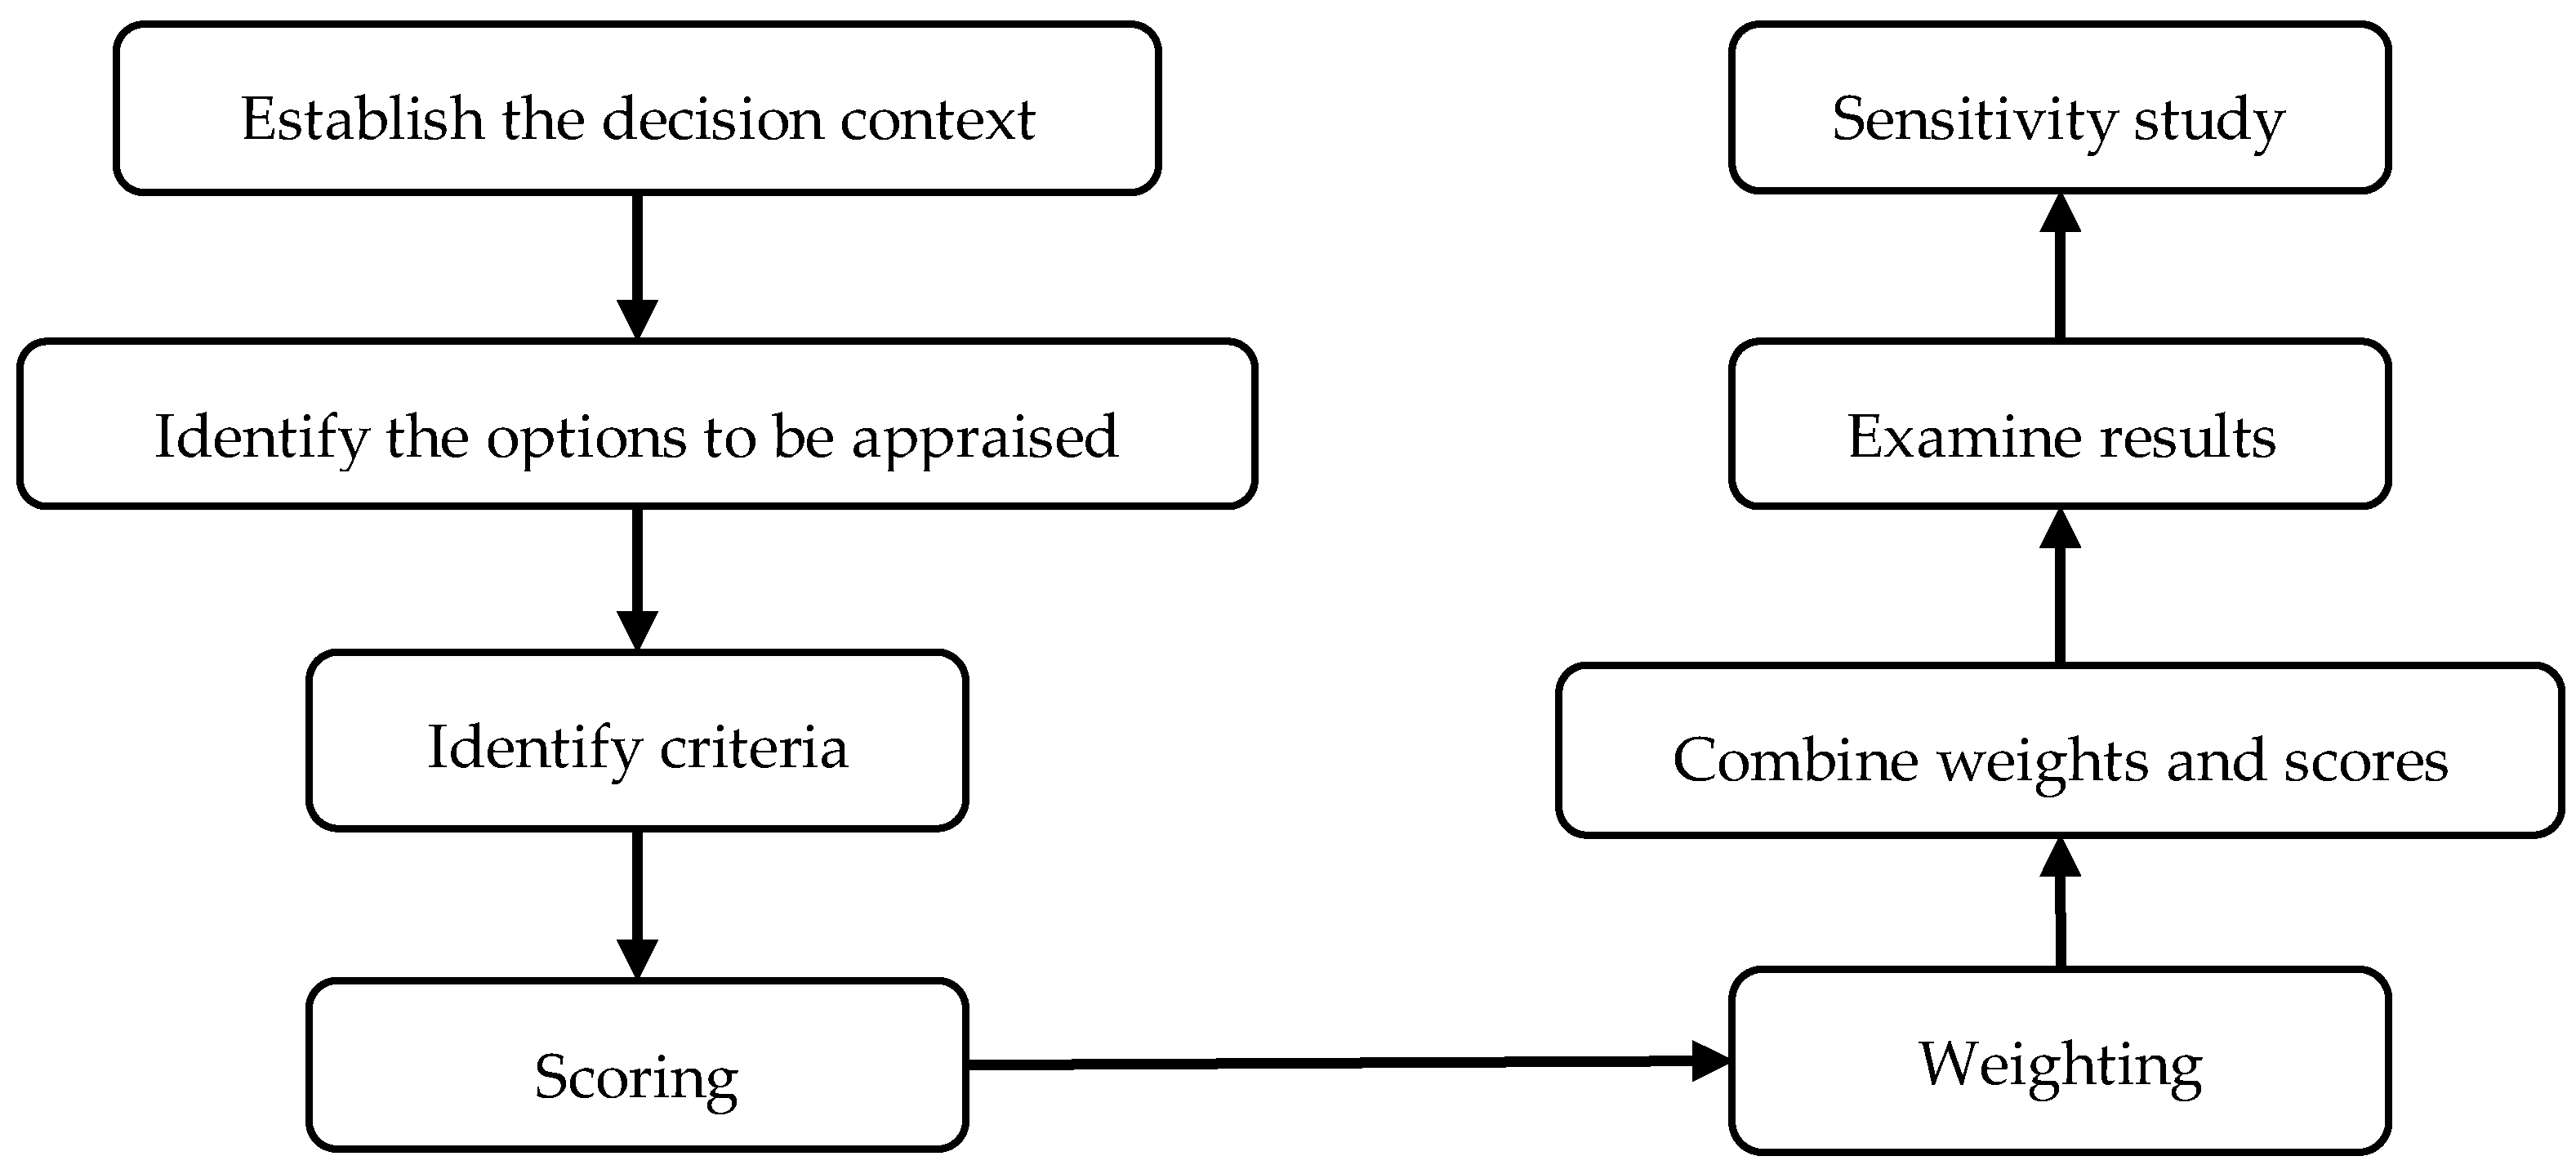
3.2. Methodology
3.3. TOPSIS
- A decision matrix is created holding the values for how well each alternative technology satisfies each criterion .
- The decision matrix is normalised by dividing each value by the square root of the sum of all values in the matrix squared, as shown in the following equation:where is the weighted value in the decision matrix at point and is the original value at that point.
- The decision matrix is weighted by multiplying each value in the matrix by the criterion’s corresponding weighting, as in the following equation:where is the weighted, normalised value and is the weight value for that criterion.
- A Positive Ideal Solution (PIS) and a Negative Ideal Solution (NIS) are created from the decision matrix. The PIS is the maximum of all of the ‘good’ criteria which the decision maker wants to maximise, and the minimum of all of the ‘bad’ criteria. The NIS is the converse of this. These solutions are purely theoretical and are used only for comparison.
- For each alternative, the geometric distance to the PIS and to the NIS, respectively, is determined. This is shown simply in the following equations:where is the distance of the alternative to the PIS, is the distance of the alternative to the NIS, and and are the weighted, normalised values of the criterion for the PIS and NIS respectively.
- How close each alternative is to the PIS relative to the NIS, is evaluated with the following equation:
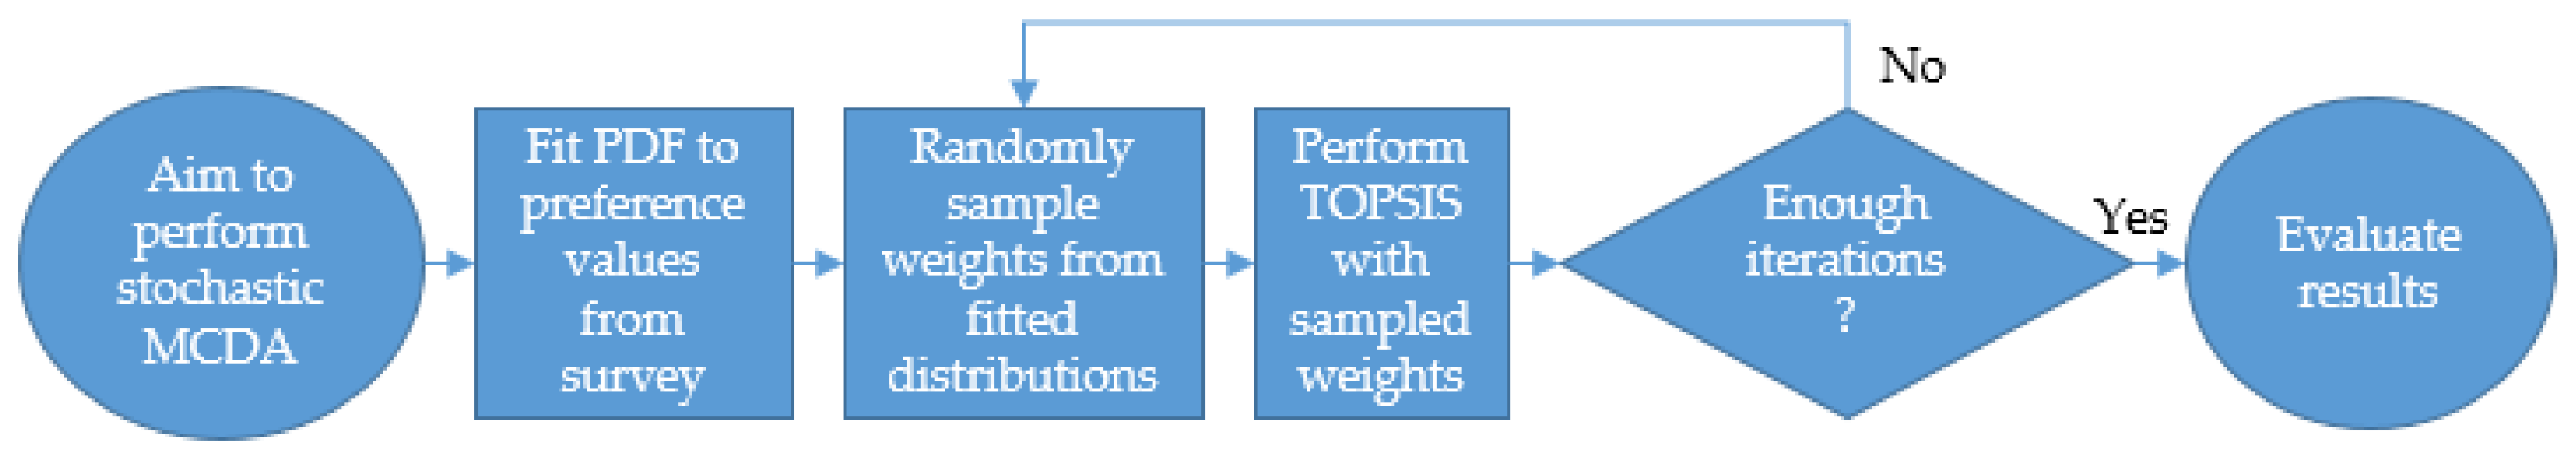
3.4. Stochastic Expansion of TOPSIS
3.5. Industry Survey and Decision Matrix
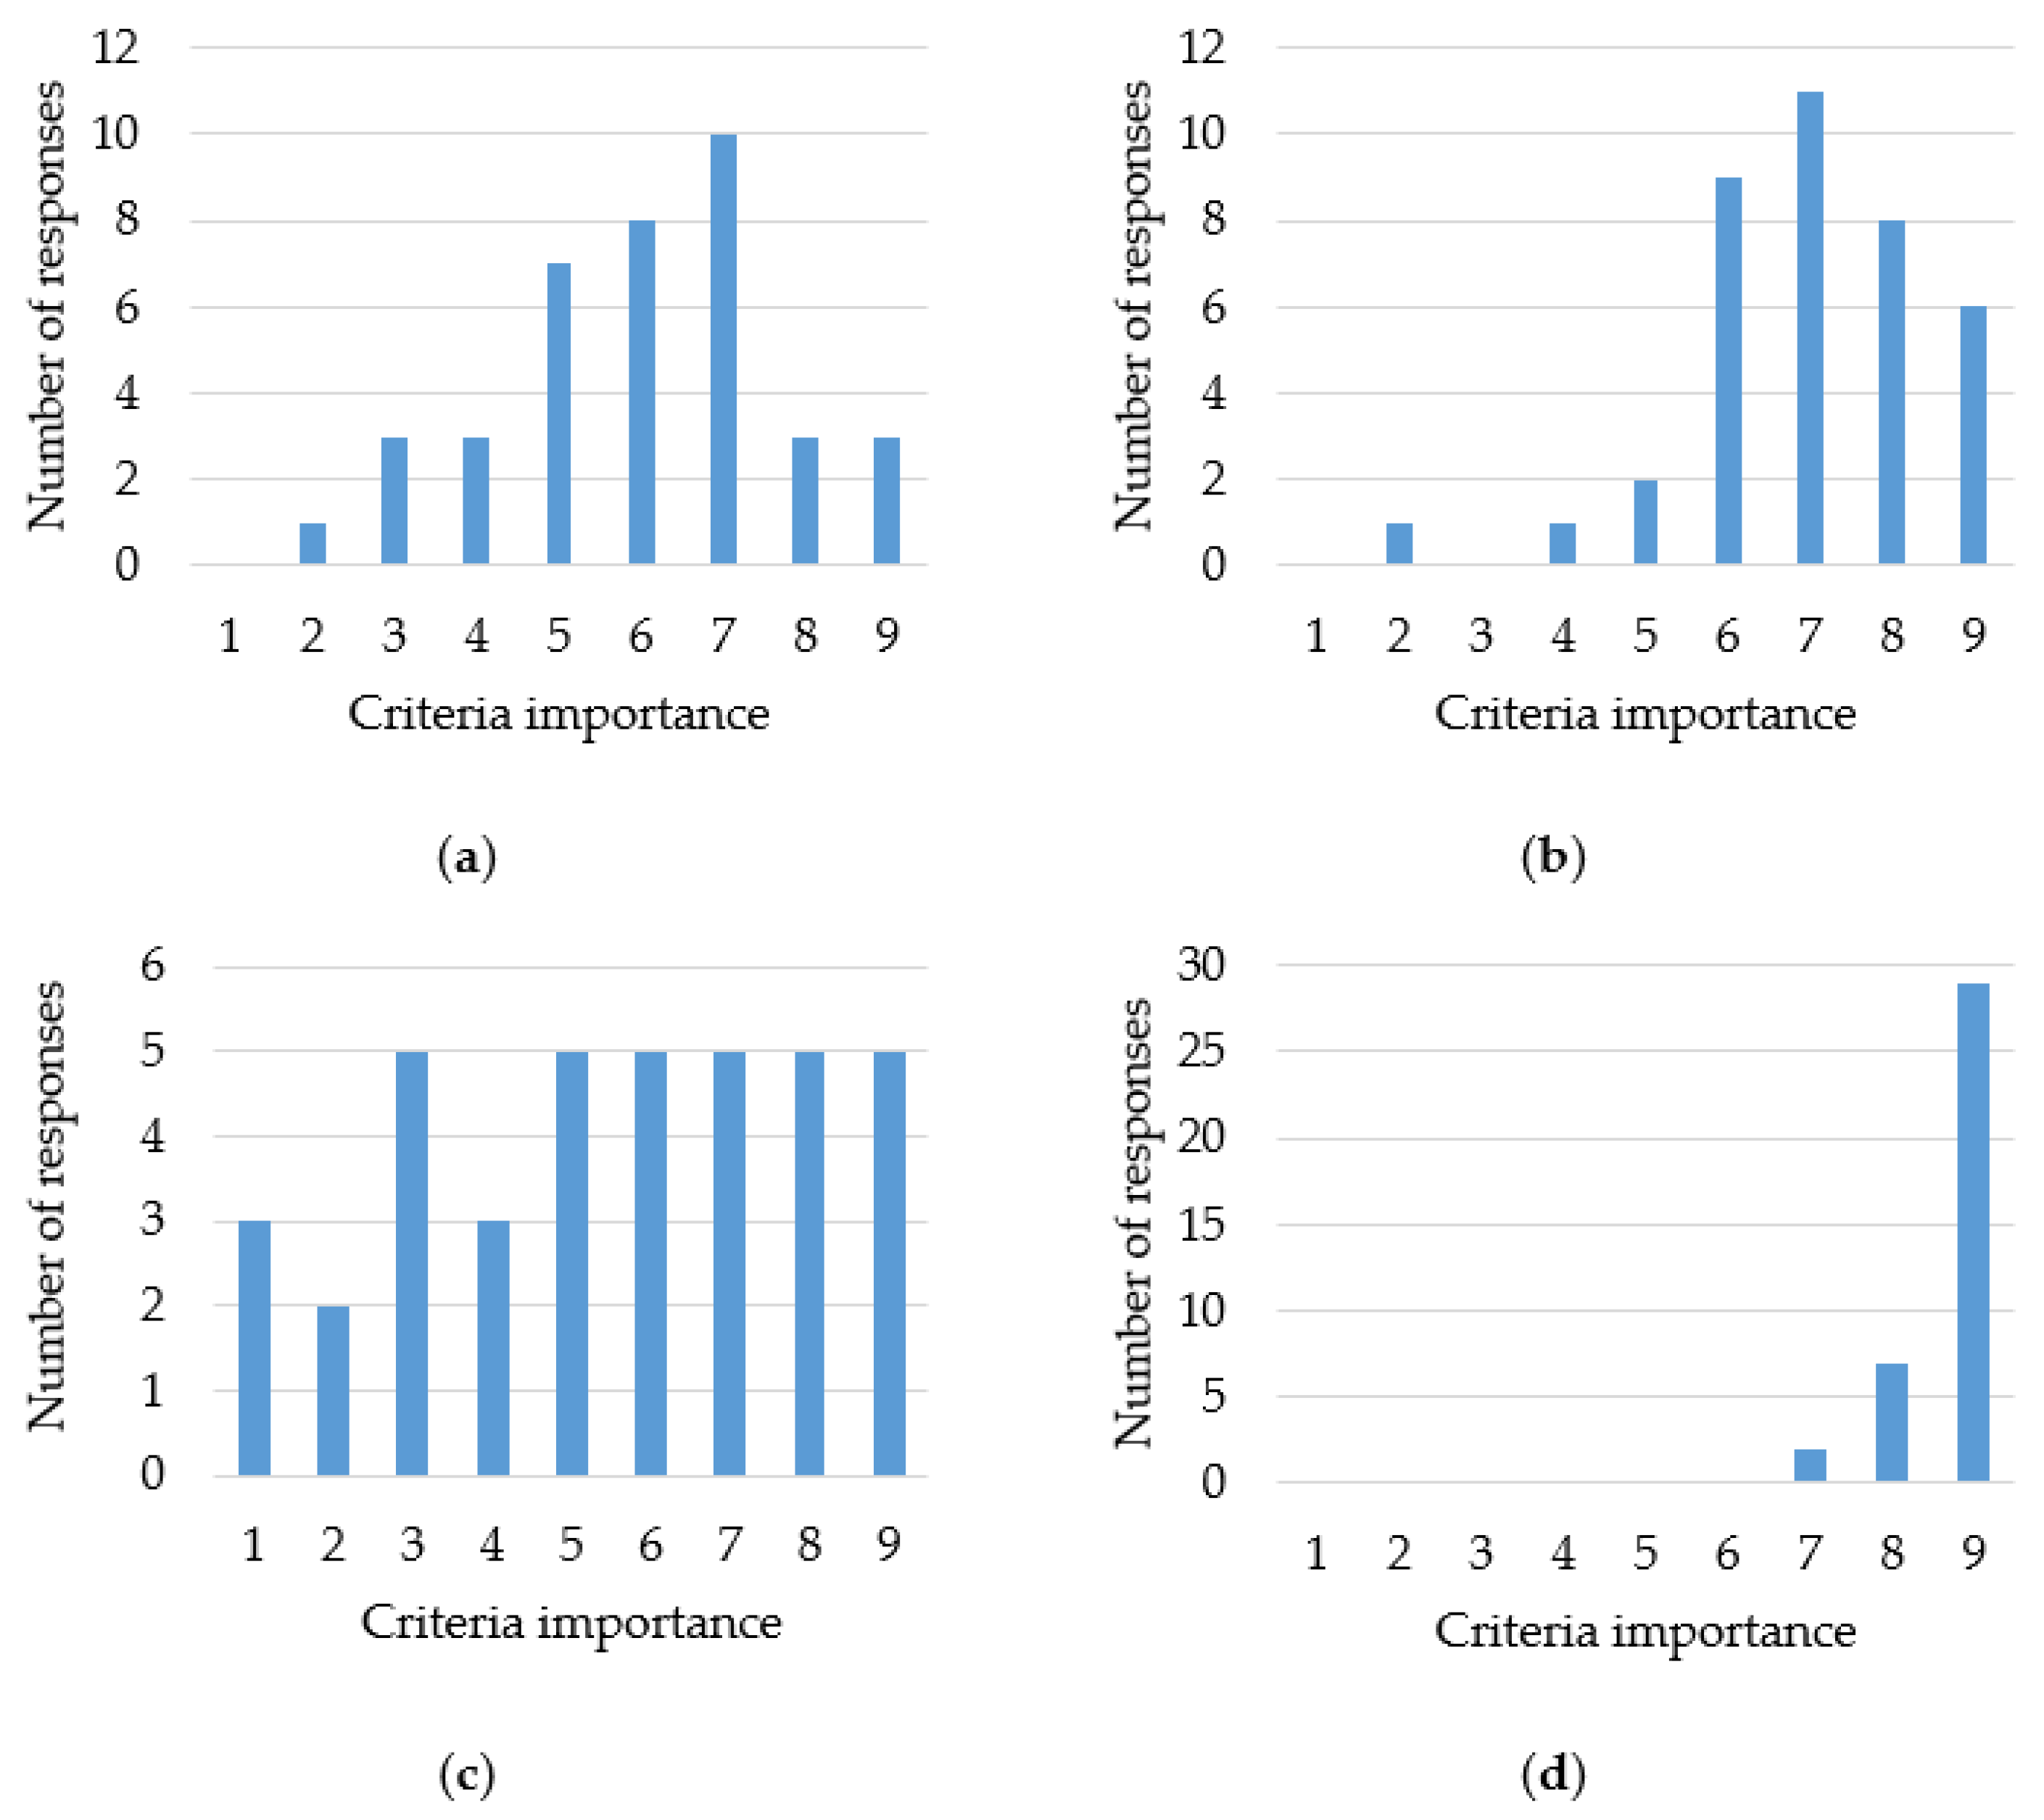
3.5.1. Industry Survey
3.5.2. Response Robustness
4. Industry Survey and Application
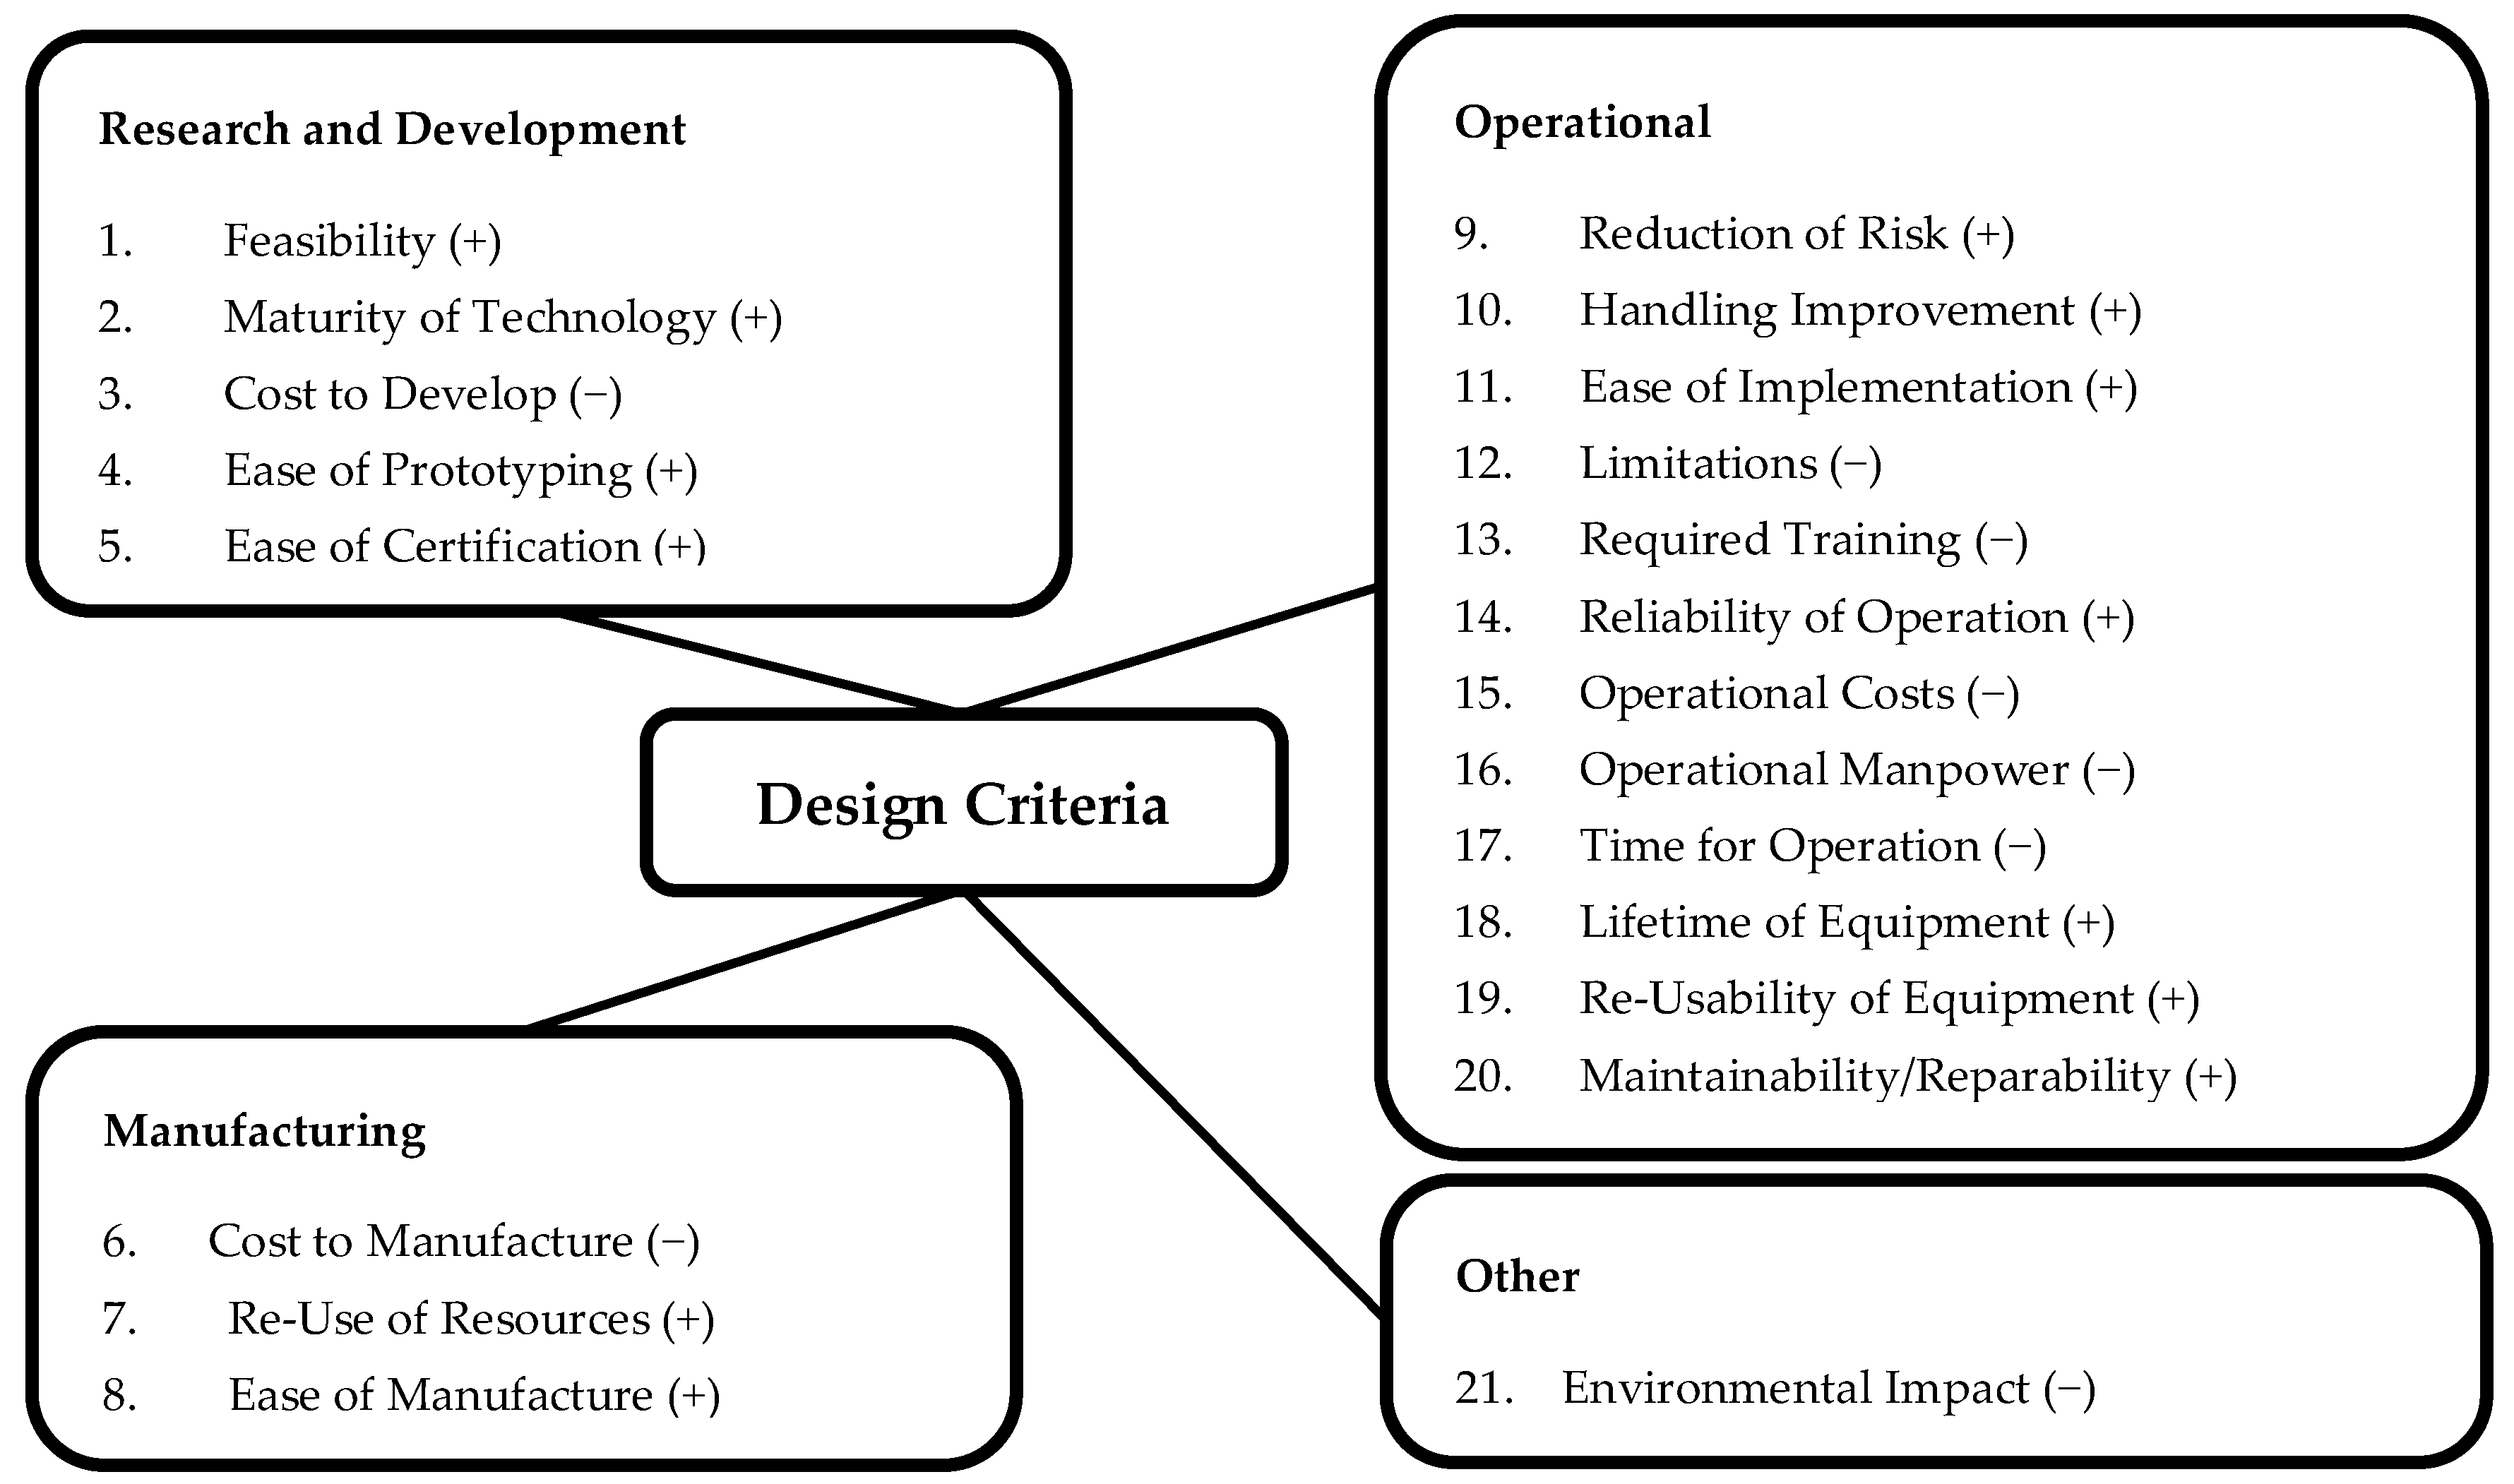
4.1. Criteria Identification
4.2. Scoring
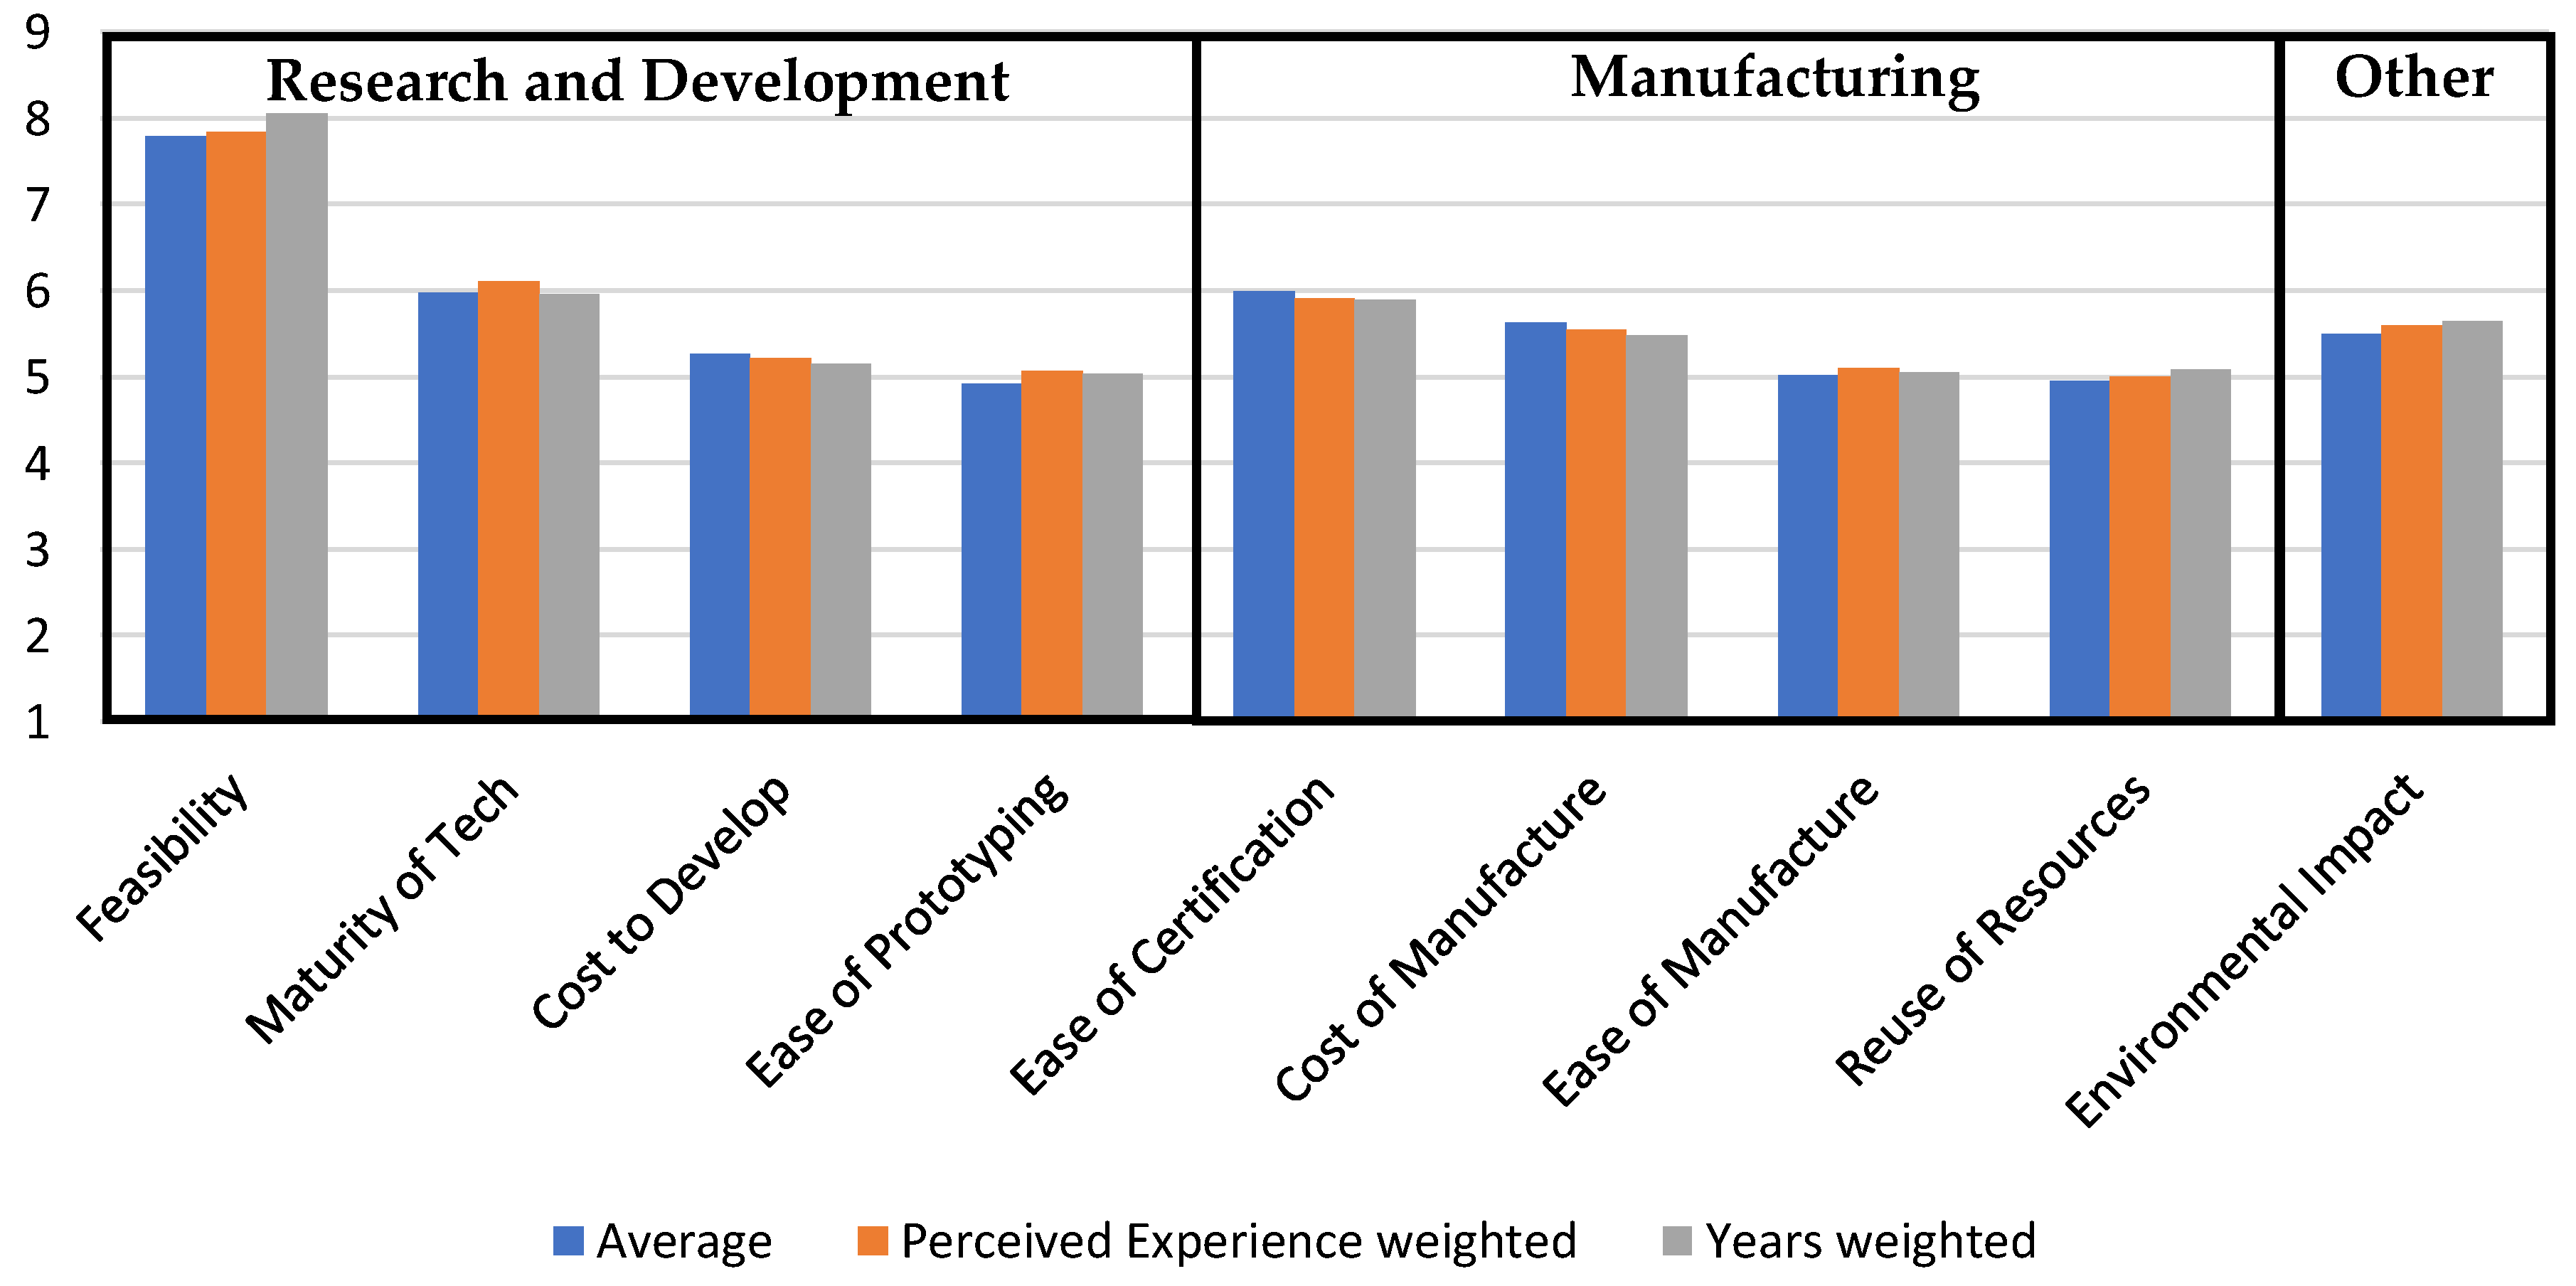
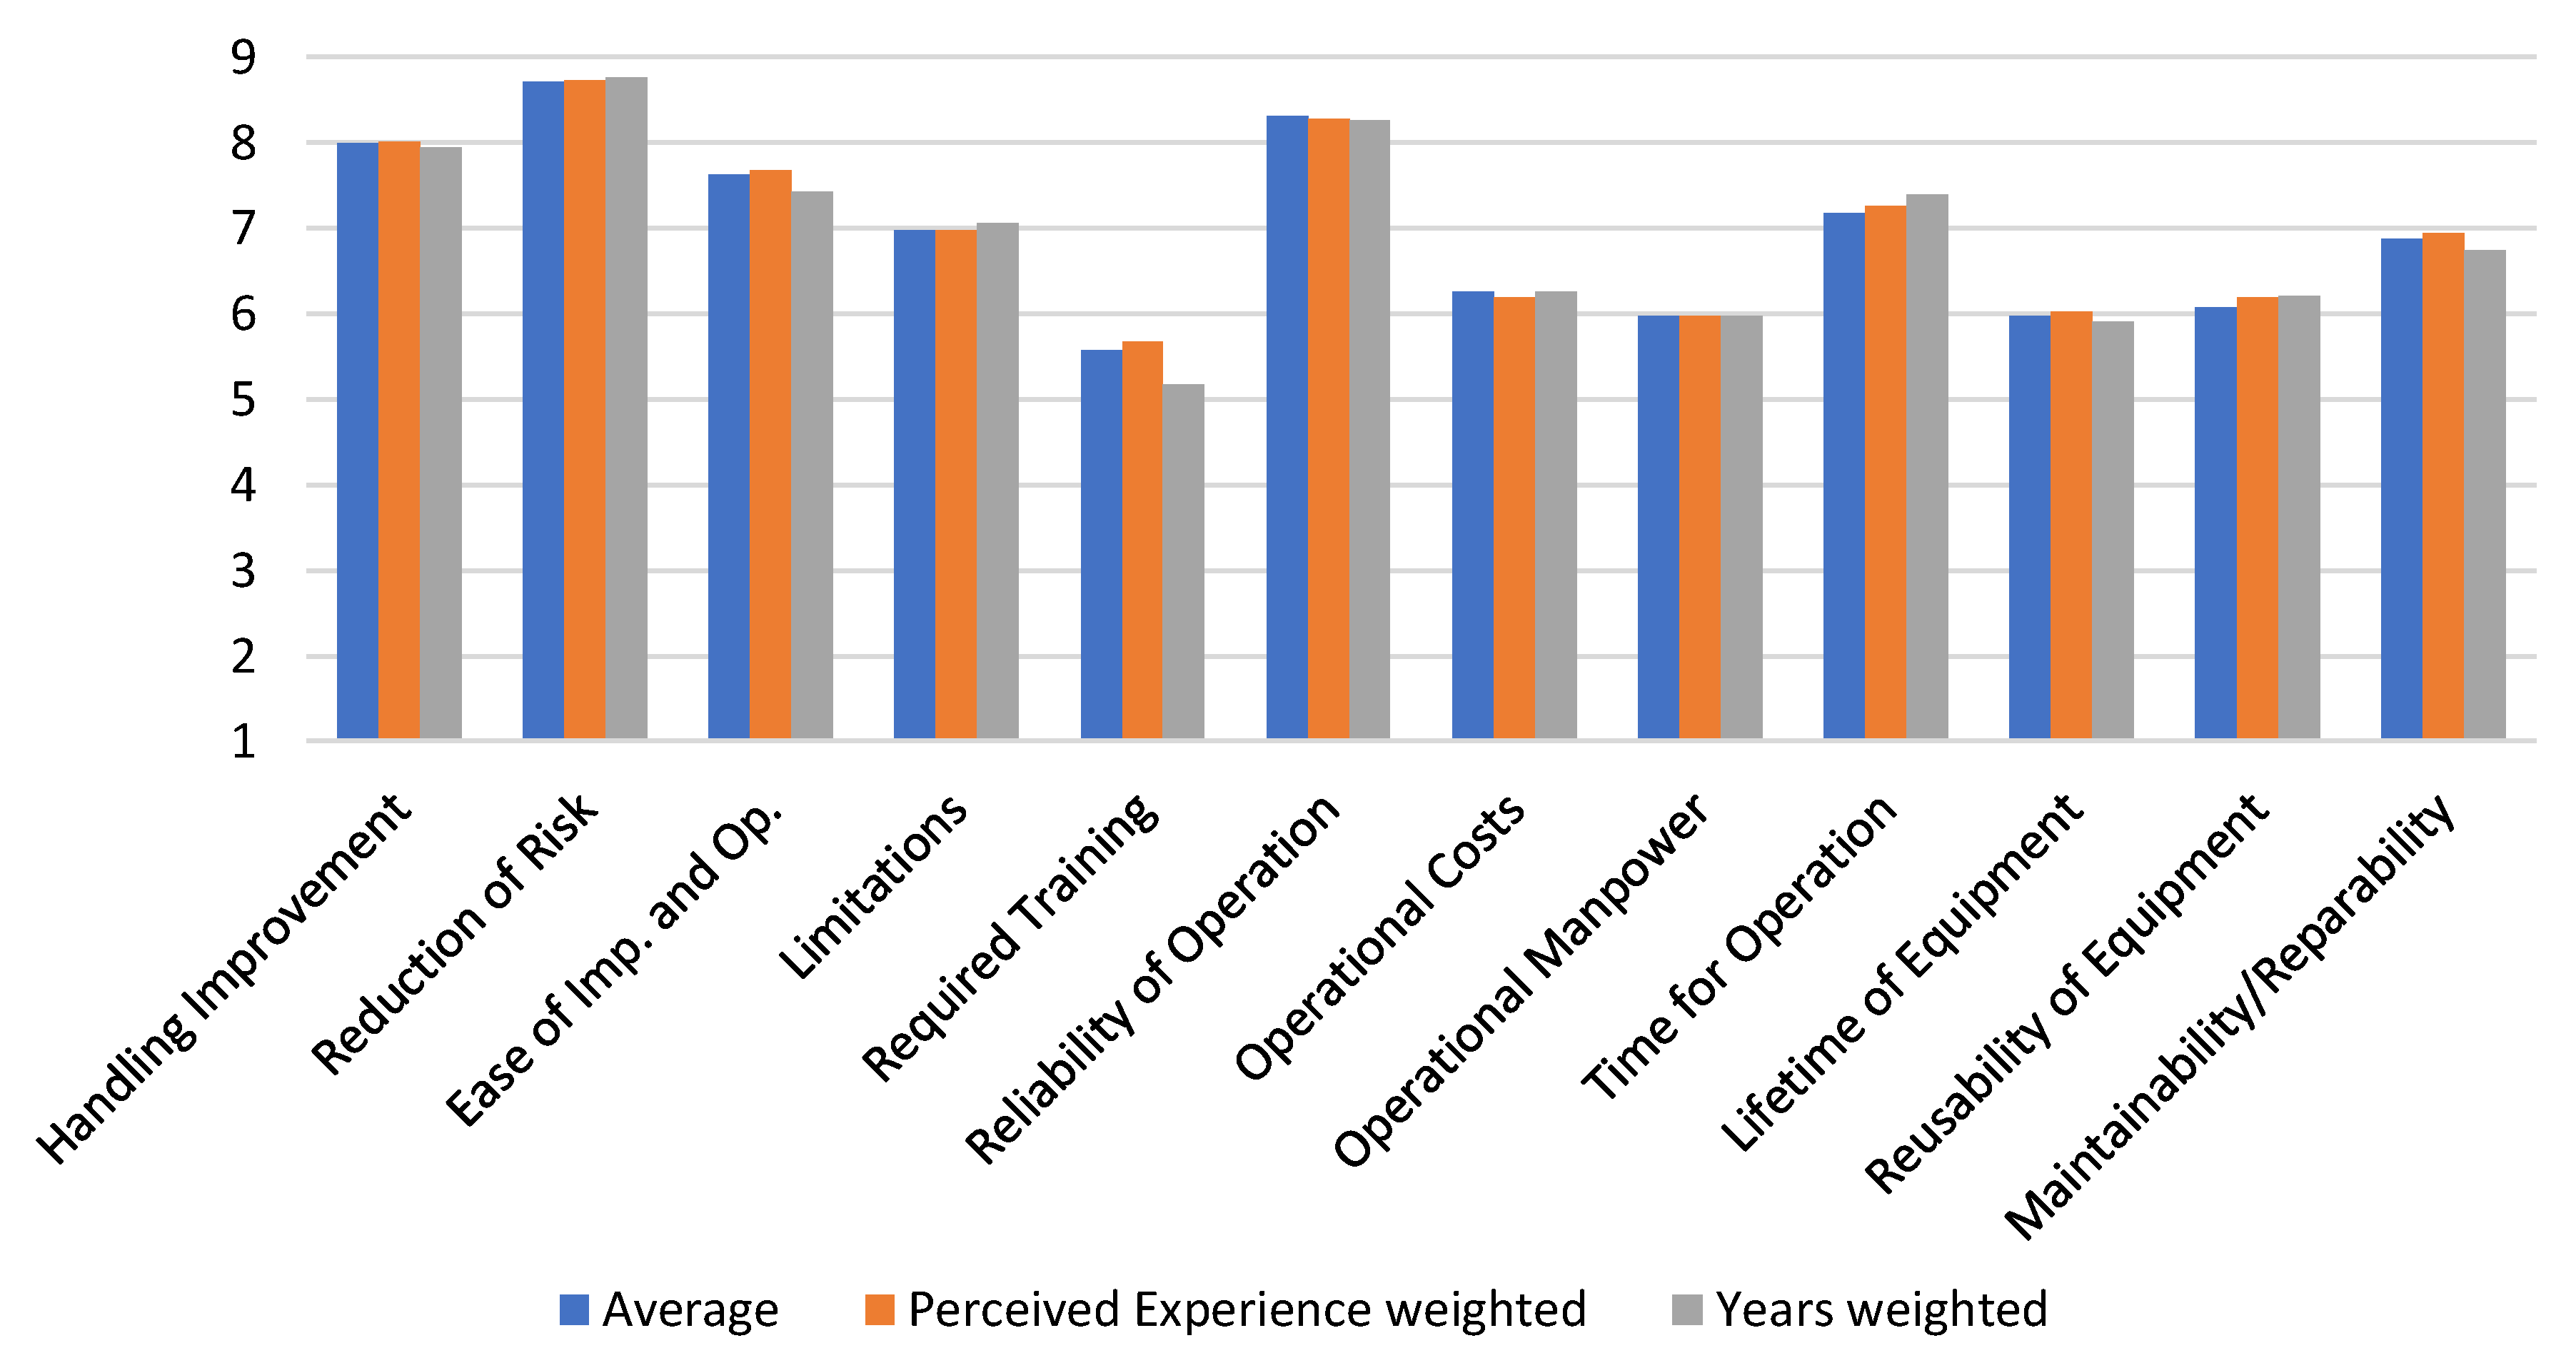
4.2.1. Criteria Weights
4.2.2. Decision Matrix
4.2.3. Stochastic MCDA
5. Results and Discussion
5.1. Results
5.1.1. Stage 1—Streamlining Within Categories
5.1.2. Stage 2—Global Ranking
- Boom Lock and tag lines
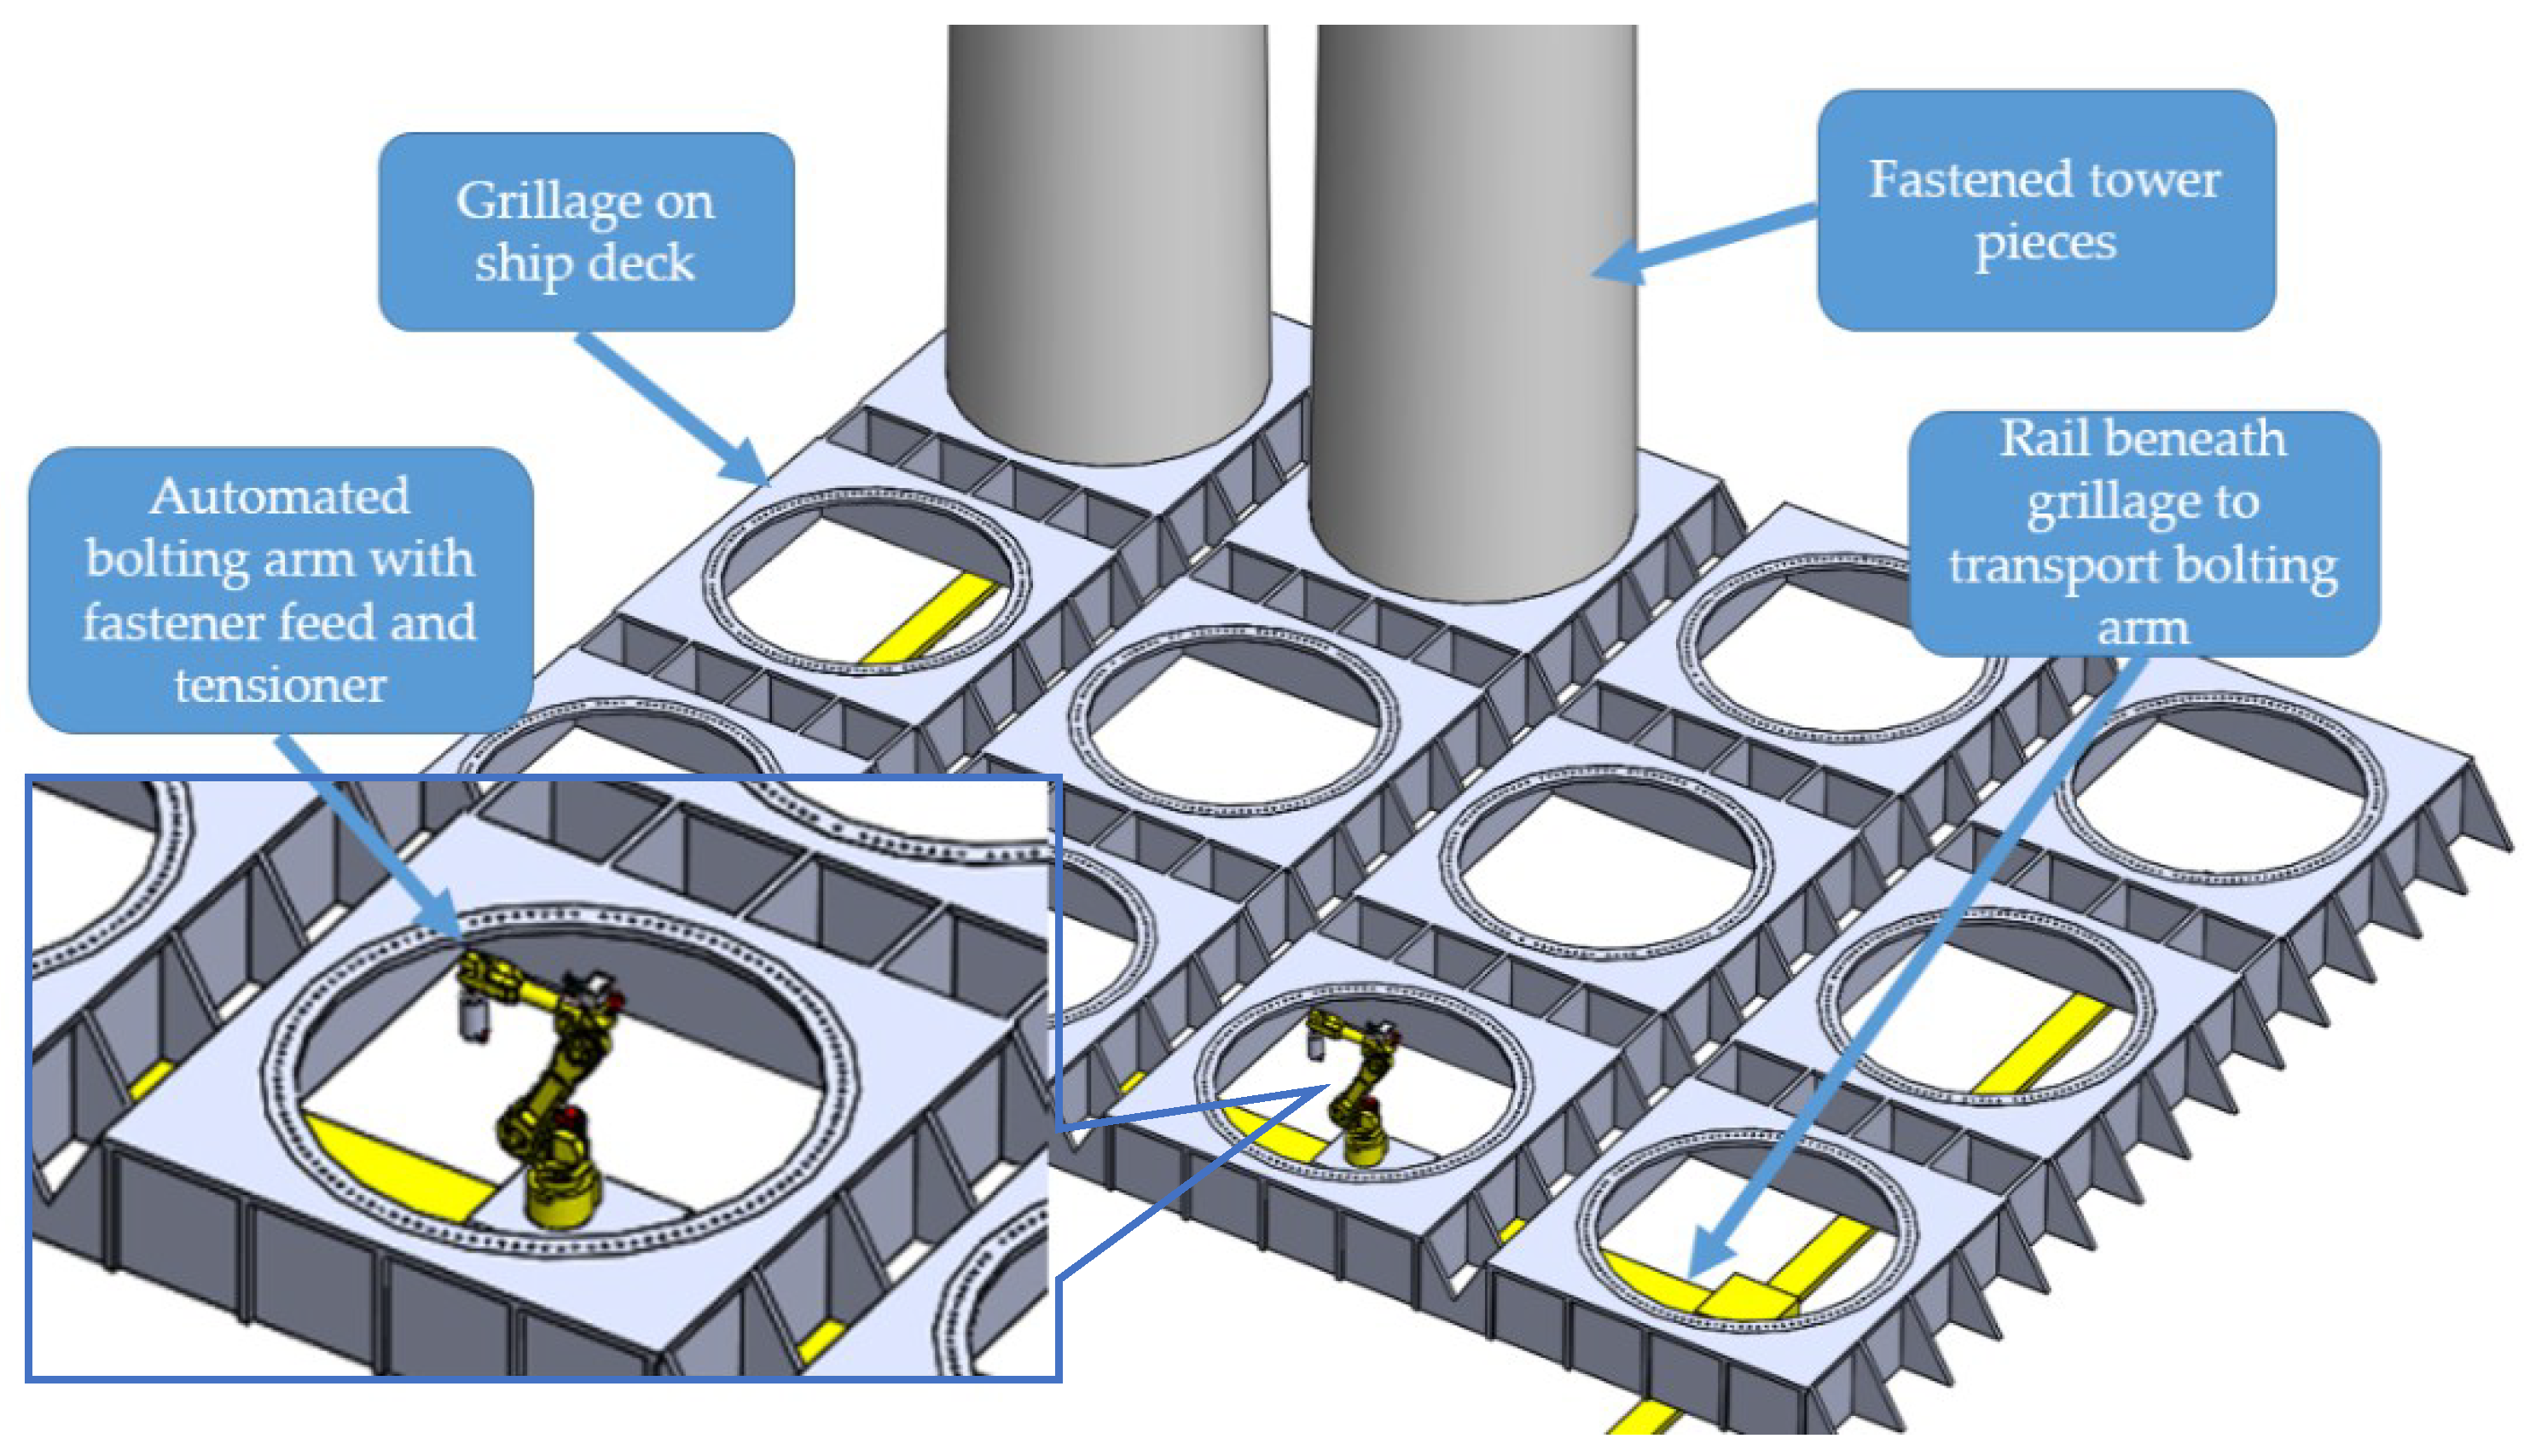
- Automated bolt installation/fastening used for seafastening
- Camera system with mechanical guidance
- Current pre-assembly practice of partially assembled components carried to the site for installation
- Boom Lock, tag lines, mechanical guidance and cameras
5.2. Discussion
6. Conclusions
- Boom Lock and tag lines—These are control elements which improve handling and reduce risk by providing more contact with the load at key points.
- Camera system and mechanical guidance—These give guidance as well as a level of fine control without which it would have required operators to be physically present.
- Robot arm for seafastening—This concept was proposed by the authors and consists of a robot bolting system, a concept used in shop floor construction, for completing the seafastening operation.
- Boom Lock, tag lines, mechanical guidance, and cameras—This is a combination of the first two recommendations. It is lower than both recommendations because using both increases complexity and difficulty in implementation, as well as cost.
- Current pre-assembly practice—This is as opposed to either the ‘single pieces’ or ‘fully pre-assembled’ methods discussed in Section 2.3. However, it has to be kept in mind that other pre-assembly methods can have advantages in the right circumstances.
Author Contributions
Acknowledgments
Conflicts of Interest
References
- Szulecki, K.; Fischer, S.; Gullberg, A.T.; Sartor, O. Shaping the ‘Energy Union’: Between national positions and governance innovation in EU energy and climate policy. Clim. Policy 2016, 16, 548–567. [Google Scholar] [CrossRef]
- Voormolen, J.A.; Junginger, H.M.; van Sark, W.G.J.H.M. Unravelling historical cost developments of offshore wind energy in Europe. Energy Policy 2016, 88, 435–444. [Google Scholar] [CrossRef]
- Wind Europe. The European Offshore Wind Industry—Key Trends and Statistics 2016; Wind Europe: Brussels, Belgium, 2017. [Google Scholar]
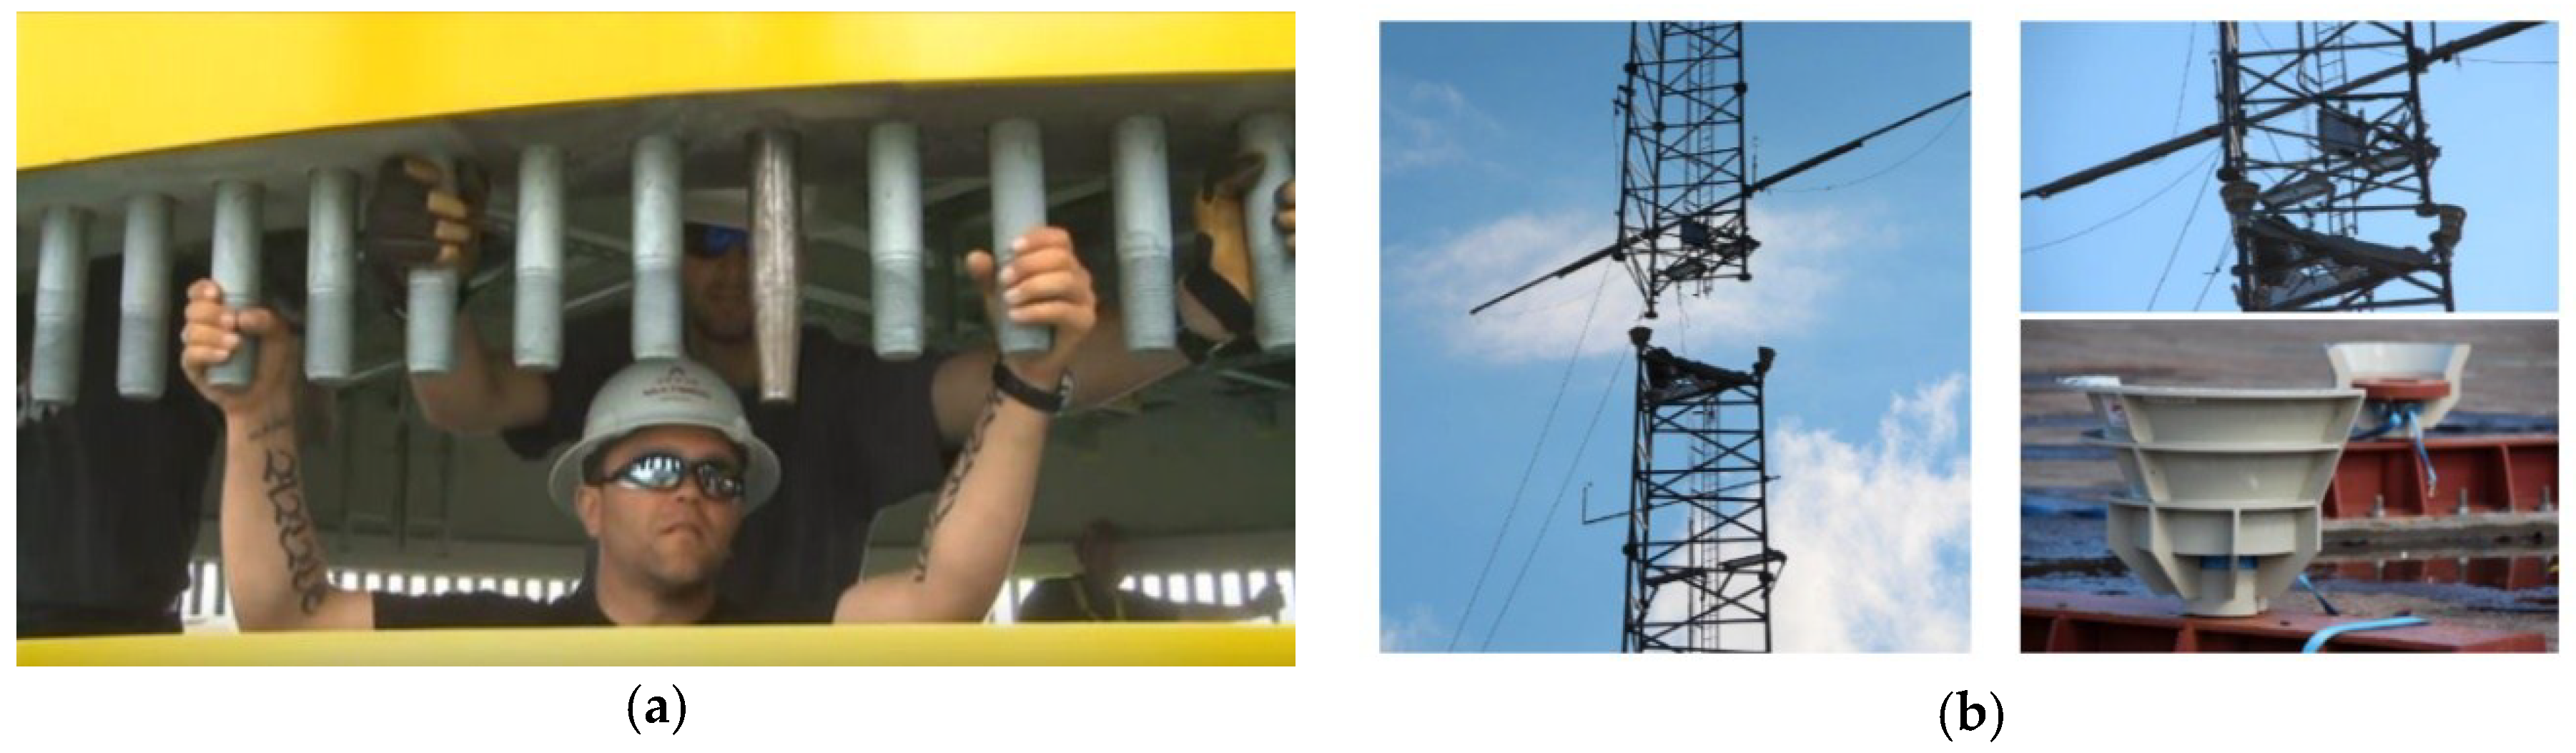
- Forewind. HSE Case Study 2: The ‘Human Free’ Met Mast Installation; Forewind: London, UK, 2013. [Google Scholar]
- G+. Global Offshore Wind Health and Safety Organisation. 2017. Available online: https://www.gplusoffshorewind.com/ (accessed on 21 August 2017).
- G9 Offshore Wind Health & Safety Association. 2014 Incident Data Report; G9 Offshore Wind Health & Safety Association: London, UK, 2014. [Google Scholar]
- G+ Offshore Wind Health & Safety Association. 2016 Incident Data Report; G+ Offshore Wind Health & Safety Association: London, UK, 2016. [Google Scholar]
- G9 Offshore Wind Health & Safety Association. 2015 Incident Data Report; G9 Offshore Wind Health & Safety Association: London, UK, 2015. [Google Scholar]
- Maes, K.; Roeck, G.D.; Lombaert, G. Motion tracking of a wind turbine blade during lifting using RTK-GPS/INS. Eng. Struct. in press.
- Kaur, A.; Watkins, S.E.; Moss, R.H.; Luechtefeld, R.A. Vehicle Positioning Using Image Processing. In Proceedings of the SPIE The International Society for Optical Engineering, San Diego, CA, USA, 3–4 August 2009. [Google Scholar]
- Rahman, M.S. Machine Vision Techniques for Crane Workshop Mapping; University of Louisiana: Lafayette, LA, USA, 2015. [Google Scholar]
- Rinner, B.; Guggi, H. Distributed Smart Cameras for Hard Real-Time Control. In Proceedings of the 2011 Fifth ACM/IEEE International Conference on Distributed Smart Cameras, Ghent, Belgium, 22–25 August 2010; pp. 234–237. [Google Scholar]
- High Wind. The Boom Lock. 2014. Available online: http://www.high-wind.eu/boomlock/ (accessed on 25 January 2017).
- Krabbendam, R. Tag Line Winches—The Capstan Winch and Tag Line Masterwinch. Heavy Lift News. 2015. Available online: http://www.heavyliftnews.com/news/tag-line-winches---the-capstan-winch-and-tag-line-masterwinch (accessed on 28 April 2018).
- Ku, N.; Roh, M., II. Dynamic Response Simulation of an Offshore Wind Turbine Suspended by a Floating Crane; Taylor & Francis: Abingdon, UK, 2015. [Google Scholar]
- Heistermann, C.; Husson, W.; Veljkovic, M. Flange connection vs. friction connection in towers for wind turbines. In Nordic Steel and Construction Conference; Stålbyggnadsinstitutet: Stockholm, Sweden, 2009; pp. 296–303. [Google Scholar]
- Sydenham, M.W.; Brown, T. Robotic Installation of OSI-Bolts; SAE International: Warrendale, PA, USA, 2015. [Google Scholar]
- Video: Fistuca BLUE Wedge Connection. Available online: https://www.youtube.com/watch?v=asDQzEuaCdc (accessed on 5 May 2018).
- Wang, W.; Bai, Y. Investigation on installation of offshore wind turbines. J. Mar. Sci. Appl. 2010, 9, 175–180. [Google Scholar] [CrossRef]
- Kuijken, L. Single Blade Installation for Large Wind Turbines in Extreme Wind Conditions; Technical University of Denmark: Kongens Lyngby, Denmark; TU Delft: Delft, The Netherlands, 2015. [Google Scholar]
- Jiang, Z. The impact of a passive tuned mass damper on offshore single-blade installation. J. Wind Eng. Ind. Aerodyn. 2018, 176, 65–77. [Google Scholar] [CrossRef]
- Ahn, D.; Shin, S.; Kim, S.; Kharoufi, H.; Kim, H. Comparative evaluation of different offshore wind turbine installation vessels for Korean west–south wind farm. Int. J. Nav. Archit. Ocean Eng. 2016, 9, 45–54. [Google Scholar] [CrossRef]
- European Wind Energy Association. Deep Water; European Wind Energy Association: Brussels, Belgium, 2013. [Google Scholar]
- Principle Power. Principle Power’s WindFloat Concept Animation; Principle Power: Emeryville, CA, USA, 2011. [Google Scholar]
- Amate, J.; Sánchez, G.D.; González, G. Development of a Semi-submersible Barge for the installation of a TLP floating substructure. TLPWIND ® case study. J. Phys. Conf. Ser. 2016, 749, 12016. [Google Scholar] [CrossRef]
- Video: offshoreWIND.biz. Mating of Hywind Scotland Floating Turbines. Available online: https://www.offshorewind.biz/2017/06/26/mating-of-hywind-scotland-floating-turbines-video/ (accessed on 5 May 2018).
- Soe-Jensen, A. Method for Establishing a Wind Turbine on a Site, Transport of a Wind Turbine Tower, Wind Turbine Tower and Vessel Suitable for Transporting a Wind Turbine Tower. U.S. Patent 2010/0281820 A1, 9 December 2010. [Google Scholar]
- 4C Offshore. Wind Farm Installation Specification. 2017. Available online: http://www.4coffshore.com/windfarms (accessed on 4 April 2017).
- C-power. Thornton Bank Wind Farm Specification. 2017. Available online: http://www.c-power.be/index.php/project-phase-1/effective-works (accessed on 4 April 2017).
- Uraz, E. Offshore Wind Turbine Transportation & Installation Analyses: Planning Optimal Marine Operations for Offshore wind Turbines. Master’s Thesis, Gotland University, Visby, Sweden, 2011. [Google Scholar]
- RCT. Remote Control Technologies (RCT) GuidanceSystem Testing—Dorothy Drives. 2012. Available online: https://www.youtube.com/watch?v=DDhxZ35ndg0 (accessed on 23 January 2017).
- Ruff, T.M. Development and Testing of a Computer-Assisted Remote-Control System for the Compact Loader-Trammer; United States Department of the Interior: Washington, DC, USA, 1992.
- De Maesschalck, K. Crane Rails: Why They Improve Offshore Lifting Capabilities. The High Wind Challenge. 2016. Available online: https://highwind.editionmanager.com/2016/12/02/crane-rails-why-they-improve-offshore-lifting-capabilities/ (accessed on 7 May 2018).
- Hörauf, L.; Müller, R.; Bauer, J.; Holger, N.; Vette, M. Development of an Intelligent Bolt Tensioning System and Adaptive Process for the Automated Pitch Bearing Assembly of Wind Turbines. In Advances in Sustainable and Competitive Manufacturing Systems; Springer: Berlin, Germany, 2013; pp. 661–663. [Google Scholar]
- Müller, R.; Hörauf, L.; Vette, M.; Martin, J.L.S.; Alzaga, A.; Hohmann, J.; Althoefer, K.; Würdemann, H. Robot guided bolt tensioning tool with adaptive process control for the automated assembly of wind turbine rotor blade bearings. Prod. Eng. 2014, 8, 755–764. [Google Scholar] [CrossRef]
- Møller, J. Siemens: Optimized Concepts for Loading & Installing Offshore wind Turbines. Available online: https://www.slideshare.net/IQPCGermany/siemens-optimized-concepts-for-loading-installing-offshore-wind-turbines (accessed on 5 May 2018).
- Hoeksema, W. Innovative Solution for Seafastening Offshore Wind Turbine Transition Pieces during Transport Innovative Solution for Seafastening Offshore Wind Turbine Transition Pieces during Transport No. February; TuDelft: Delft, Netherlands, 2014. [Google Scholar]
- Bijlaard, F.S.K.; Coelho, A.M.G.; Magalhães, V.J.D.A. Innovative joints in steel construction. Steel Constr. 2009, 2, 243–247. [Google Scholar] [CrossRef]
- Dehlsen, J.G.P.; Mikhail, A.S. Self-Erecting Tower and Method for Raising the Tower. U.S. Patent 6,955,025 B2, 18 October 2005. [Google Scholar]
- Hau, E. Wind Turbines; Springer: Berlin, Germany, 2008. [Google Scholar]
- Theconstructionindex. Blyth Debut for BAM Gravity Base Foundations. Available online: https://www.theconstructionindex.co.uk/news/view/blyth-debut-for-bam-gravity-base-foundations (accessed on 6 April 2017).
- Zhang, P.; Han, Y.; Ding, H.; Zhang, S. Field experiments on wet tows of an integrated transportation and installation vessel with two bucket foundations for offshore wind turbines. Ocean Eng. 2015, 108, 769–777. [Google Scholar] [CrossRef]
- Barker, P. A Flipping Good Idea for Floating Turbines. Available online: http://www.maritimejournal.com/news101/marine-renewable-energy/a-flipping-good-idea-for-floating-turbines (accessed on 5 May 2017).
- Wang, J.J.; Jing, Y.Y.; Zhang, C.F.; Zhao, J.H. Review on multi-criteria decision analysis aid in sustainable energy decision-making. Renew. Sustain. Energy Rev. 2009, 13, 2263–2278. [Google Scholar] [CrossRef]
- Lozano-Minguez, E.; Kolios, A.J.; Brennan, F.P. Multi-criteria assessment of offshore wind turbine support structures. Renew. Energy 2011, 36, 2831–2837. [Google Scholar] [CrossRef] [Green Version]
- Kolios, A.; Mytilinou, V.; Lozano-Minguez, E.; Salonitis, K. A comparative study of multiple-criteria decision-making methods under stochastic inputs. Energies 2016, 9, 566. [Google Scholar] [CrossRef]
- Macharis, C.; Ampe, J. The use of multi-criteria decision analysis (MCDA) for the evaluation of transport projects: A review. In Proceedings of the EURO 2007 Conference, Prague, Czech Republic, 4 September 2007; pp. 1–12. [Google Scholar]
- Vagiona, D.G.; Karanikolas, N.M. A multicriteria approach to evaluate offshore wind farms siting in Greece. Glob. Nest J. 2012, 14, 235–243. [Google Scholar]
- Mateo, J. Multi-Criteria Analysis in the Renewable Energy Industry; Springer: New York, NY, USA, 2012. [Google Scholar]
- Papavasiliou, A.; Oren, S.S. Stochastic Modeling of Multi-Area Wind Power Production. In Proceedings of the 2015 48th Hawaii International Conference on System Sciences, Kauai, HI, USA, 5–8 January 2012. [Google Scholar]
- Wang, Y.; Mai, Y.; He, W. A Quantitative Approach for Benefit-Risk Assessment Using Stochastic Multi-Criteria Discriminatory Method. Stat. Biopharm. Res. 2016, 8, 373–378. [Google Scholar] [CrossRef]
- Saint-Hilary, G.; Cadour, S.; Robert, V.; Gasparini, M. A simple way to unify multicriteria decision analysis (MCDA) and stochastic multicriteria acceptability analysis (SMAA) using a Dirichlet distribution in benefit–risk assessment. Biometr. J. 2017, 59, 567–578. [Google Scholar] [CrossRef] [PubMed]
- Hwang, C.-L.; Yoon, K. Multiple Attribute Decision Making: Methods and Applications; Springer: Berlin/Heidelberg, Germany, 1981. [Google Scholar]
- Kolios, A.J.; Rodriguez-Tsouroukdissian, A.; Salonitis, K. Multi-criteria decision analysis of offshore wind turbines support structures under stochastic inputs. Ships Offsh. Struct. 2016, 11, 38–49. [Google Scholar]
- Kolios, A.; Read, G.; Ioannou, A. Application of multi-criteria decision-making to risk prioritisation in tidal energy developments. Int. J. Sustain. Energy 2016, 35, 59–74. [Google Scholar] [CrossRef]
- Likert, R. A technique for the measurement of attitudes. Arch. Psychol. 1932, 22, 55. [Google Scholar]
- Palisade @risk, software. Available online: https://www.palisade.com/risk/ (accessed on 5 May 2018).


| Area | 2014 | 2015 | 2016 |
|---|---|---|---|
| No. of hours worked (×106) | 23.71 | 21.22 | 21.72 |
| Total incidents—lifting operations | 143 (6.0) | 100 (4.7) | 133 (6.1) |
| Dropped objects—lifting operations | 32 (1.3) | 28 (1.3) | 37 (1.7) |
| Project | MW Class | No. Turbine in the Farm | No. Units to Install | Duration (Days) | Method | No. Lifts per Turb. |
|---|---|---|---|---|---|---|
| Horns Rev.1 | 2 | 80 | 2 | 110 | BE-1T | 3 |
| Prinses Amalia | 2 | 60 | 2 | 330 * | BE-1T | 3 |
| North Hoyle | 2 | 30 | 2 | 90 | BE-2T | 4 |
| Nysted | 2.3 | 72 | 1 | 78 | ROT-2T | 4 |
| Lillgrund | 2.3 | 48 | 1 | 73 | ROT-2T | 4 |
| OWEZ | 3 | 36 | 1 | 67 | BE-2T | 4 |
| Thanet | 3 | 100 | 1 | 197 | SP-1T | 5 |
| Greater Gabbard | 3.6 | 140 | 2 | 515 * | SP-2T | 6 |
| Lynn & Inner Dowsing | 3.6 | 54 | 1 | 122 | SP-2T | 6 |
| Thornton Bank I | 5 | 6 | 2 | 70 * | ROT-2T ** | 6 |
| Guidance | Connections | Lifting Methods |
|---|---|---|
| Remote Control [31,32] Tag lines/Tag line Winches [33] High Wind—Boom Lock [13,33] Funnels/Cones [4] Multiple Cameras Fish Eye lens Lasers, Distance Measurement | Bolting robot arm [17,34,35] Hydraulic Seafastening [36,37] Internal Jack Seafastening [38] Friction Connection [16] External Climbing Bolt Robot ConXtech Connection [39] Bolt Conveyor Rotating Joint Single, Large Thread | Offshore Assembly, Single Pieces [30] Current pre-assembly [30] Bottom Fixed, Partially Self-Erecting Wind Turbines (WTs) [39,40] Bottom Fixed, Fully Self Erecting WTs Bottom Fixed, Fully pre-Assembled Transportation [41,42] Floating WTs, Vertical Transportation [24,25] Floating WTs, Horizontal Transportation [43] |
| Distribution | ‘C1’ | ‘C2’ | ‘C3’ |
|---|---|---|---|
| Binomial | Number of trials | Probability of success | - |
| Uniform | Minimum | Maximum | - |
| Poisson | Rate λ | - | - |
| Extreme Value | a | b | - |
| Normal | Mean | Standard deviation | - |
| Triangular | Minimum | Most likely | Maximum |
| Logistic | Mean α | Scale β | - |
| Criteria | Discrete Dist. | C1 | C2 | Continuous Dist. | C1 | C2 | C3 |
|---|---|---|---|---|---|---|---|
| Feasibility | Binomial | 10 | 0.78 | Extreme value | 8.47 | 0.98 | - |
| Maturity of Tech | Binomial | 11 | 0.54 | Normal | 5.97 | 1.73 | - |
| Cost to Develop | Binomial | 11 | 0.48 | Normal | 5.26 | 1.69 | - |
| Ease of Prototyping | Uniform | 1 | 8 | Uniform | 0.81 | 8.19 | - |
| Ease of Certification | Uniform | 2 | 9 | Uniform | 1.81 | 9.19 | - |
| Handling Improvement | Binomial | 9 | 0.89 | Triangular | 4.66 | 9 | 9 |
| Cost of Manufacture | Binomial | 12 | 0.47 | Logistic | 5.65 | 0.96 | - |
| Ease of Manufacture | Binomial | 11 | 0.46 | Normal | 5.85 | 1.48 | - |
| Reuse of Resources | Uniform | 2 | 8 | Uniform | 1.84 | 8.16 | - |
| Environmental Impact | Uniform | 1 | 9 | Uniform | 0.78 | 9.22 | - |
| Reduction of Risk | Binomial | 9 | 0.97 | Triangular | 6.87 | 9 | 9 |
| Ease of Imp. and Op. | Binomial | 9 | 0.85 | Extreme Value | 8.23 | 0.94 | - |
| Limitations | Binomial | 9 | 0.77 | Logistic | 7.06 | 0.81 | - |
| Required Training | Poisson | 5.58 | - | Logistic | 5.72 | 1.14 | - |
| Reliability of Operation | Binomial | 9 | 0.92 | Triangular | 4.86 | 9 | 9 |
| Operational Costs | Binomial | 12 | 0.52 | Logistic | 6.30 | 1.02 | - |
| Operational Manpower | Poisson | 5.58 | - | Extreme Value | 6.92 | 1.60 | - |
| Time for Operation | Binomial | 10 | 0.72 | Extreme Value | 6.92 | 1.60 | - |
| Lifetime of Equipment | Binomial | 11 | 0.54 | Extreme Value | 6.92 | 1.60 | - |
| Reusability of Equipment | Binomial | 11 | 0.54 | Logistic | 6.20 | 1.09 | - |
| Maintainability/Reparability | Binomial | 10 | 0.69 | Extreme Value | 6.92 | 1.60 | - |
| Concepts | R & D | Man. | Operational | Oth. | |||||||||||||||||
|---|---|---|---|---|---|---|---|---|---|---|---|---|---|---|---|---|---|---|---|---|---|
| 1 | 2 | 3 | 4 | 5 | 6 | 7 | 8 | 9 | 10 | 11 | 12 | 13 | 14 | 15 | 16 | 17 | 18 | 19 | 20 | 21 | |
| Boom Lock and tag lines | 9 | 8 | 2 | 8 | 7 | 4 | 7 | 7 | 6 | 6 | 6 | 3 | 4 | 5 | 3 | 4 | 5 | 6 | 8 | 7 | 2 |
| Camera system + mech. guidance | 7 | 5 | 5 | 7 | 6 | 5 | 6 | 6 | 8 | 7 | 8 | 5 | 5 | 7 | 4 | 4 | 3 | 4 | 7 | 6 | 3 |
| Robot arm for seafastening | 8 | 7 | 6 | 5 | 6 | 6 | 5 | 7 | 7 | 8 | 7 | 4 | 5 | 6 | 5 | 3 | 4 | 7 | 8 | 8 | 3 |
| Boom Lock, tag lines, cameras + mech. guidance | 8 | 6 | 6 | 6 | 6 | 6 | 7 | 6 | 9 | 8 | 7 | 4 | 7 | 8 | 6 | 4 | 3 | 5 | 7 | 6 | 4 |
| Current pre-assembly practice | 7 | 7 | 3 | 7 | 7 | 3 | 8 | 7 | 5 | 6 | 7 | 6 | 4 | 7 | 5 | 4 | 5 | 7 | 7 | 6 | 3 |
| Camera system (3 × fine tune, 1 × 360, + redundancy) | 7 | 7 | 4 | 7 | 6 | 2 | 7 | 7 | 6 | 6 | 5 | 4 | 6 | 5 | 2 | 4 | 6 | 5 | 7 | 6 | 2 |
| Robot arm for bolting during construction | 7 | 6 | 7 | 5 | 6 | 6 | 5 | 6 | 7 | 7 | 6 | 5 | 4 | 7 | 5 | 3 | 4 | 7 | 8 | 8 | 3 |
| Completely hydraulic seafastening | 7 | 6 | 5 | 5 | 6 | 6 | 4 | 6 | 7 | 7 | 6 | 5 | 4 | 6 | 4 | 3 | 4 | 6 | 7 | 6 | 4 |
| Offshore Assembly (single pieces) installation | 9 | 9 | 1 | 8 | 8 | 2 | 8 | 7 | 2 | 4 | 7 | 4 | 3 | 8 | 4 | 5 | 7 | 7 | 7 | 6 | 4 |
| Partially hydraulic seafastening | 8 | 8 | 4 | 7 | 7 | 4 | 4 | 7 | 5 | 6 | 7 | 4 | 4 | 6 | 3 | 6 | 7 | 6 | 8 | 6 | 3 |
| Bottom fixed WTS (Fully pre-assemb. transportation) | 4 | 4 | 6 | 5 | 4 | 8 | 4 | 5 | 7 | 7 | 5 | 7 | 7 | 5 | 9 | 4 | 2 | 7 | 6 | 6 | 5 |
| Bottom fixed WTS (Partially self-erecting) | 4 | 3 | 8 | 5 | 3 | 7 | 3 | 4 | 4 | 6 | 4 | 7 | 6 | 4 | 6 | 5 | 5 | 6 | 5 | 6 | 5 |
| N | Alternative | TOPSIS C | C, Experience Weighted | C, Year Weighted |
|---|---|---|---|---|
| 1 | Guide Pins | 0.7124 | 0.7108 | 0.7126 |
| 2 | Remote Control | 0.7099 | 0.7097 | 0.7077 |
| 3 | Tag lines/Tag line winches | 0.6668 | 0.6681 | 0.6694 |
| 4 | High Wind + Boom Lock | 0.6389 | 0.6409 | 0.64 |
| 5 | Funnels/Cones | 0.6318 | 0.6307 | 0.6297 |
| 6 | Multiple Cameras | 0.6268 | 0.6257 | 0.6299 |
| N | Alternative | TOPSIS C | C, Experience Weighted | C, Year Weighted |
|---|---|---|---|---|
| 1 | Bolting robot arm | 0.6475 | 0.6495 | 0.6489 |
| 2 | Hydraulic Seafastening | 0.6125 | 0.6127 | 0.614 |
| 3 | Internal Jack Seafastening | 0.6125 | 0.6127 | 0.614 |
| 4 | Friction connection | 0.5647 | 0.5645 | 0.5631 |
| N | Alternative | TOPSIS C | C, Experience Weighted | C, Year Weighted |
|---|---|---|---|---|
| 1 | Current pre-assembly practice | 0.7187 | 0.7178 | 0.7203 |
| 2 | Bottom fixed WTS (partially self-erecting WTs) | 0.5277 | 0.5293 | 0.5268 |
| 3 | Bottom fixed WTS (fully pre assembled transportation) | 0.5078 | 0.5087 | 0.5076 |
| 4 | Offshore assembly (single piece) installation | 0.5072 | 0.5069 | 0.5035 |
| Concept | Deterministic | Stochastic | |||||
|---|---|---|---|---|---|---|---|
| Technology | Rank | C | Rank | Mode Rank | % Occ. of Mode | Mean C | Standard Deviation of C |
| Boom Lock and tag lines | 1 | 0.673 | 1 | 1 | 99 | 0.680 | 2.12 |
| Robot arm for seafastening | 3 | 0.616 | 2 | 2 | 32.7 | 0.610 | 3.28 |
| Camera system (3 × fine tune, 1 × 360, + redundancy) | 6 | 0.589 | 3 | 2 | 24.4 | 0.600 | 3.98 |
| Camera system + mechanical guidance | 2 | 0.617 | 4 | 3 | 32.8 | 0.609 | 2.69 |
| Current pre-assembly practice | 5 | 0.592 | 5 | 5 | 24.4 | 0.603 | 2.21 |
| Boom Lock, tag lines, mechanical guidance and cameras | 4 | 0.599 | 6 | 6 | 28.0 | 0.584 | 3.95 |
| Robot arm for bolting during construction | 7 | 0.565 | 7 | 7 | 23.6 | 0.559 | 3.59 |
| Completely hydraulic seafastening | 8 | 0.556 | 8 | 8 | 30.2 | 0.553 | 2.87 |
| Offshore Assembly (single pieces) installation | 9 | 0.546 | 9 | 9 | 21.4 | 0.561 | 4.26 |
| Partially hydraulic seafastening | 10 | 0.545 | 10 | 10 | 34.6 | 0.550 | 3.98 |
| Bottom fixed WTS (fully pre-assembled transportation) | 11 | 0.390 | 11 | 11 | 100.0 | 0.371 | 7.21 |
| Bottom fixed WTs (partially self-erecting) | 12 | 0.236 | 12 | 12 | 100.0 | 0.229 | 6.46 |
© 2018 by the authors. Licensee MDPI, Basel, Switzerland. This article is an open access article distributed under the terms and conditions of the Creative Commons Attribution (CC BY) license (http://creativecommons.org/licenses/by/4.0/).
Share and Cite
Richmond, M.; Balaam, T.; Causon, P.; Cevasco, D.; Leimeister, M.; Kolios, A.; Brennan, F. Multi-Criteria Decision Analysis for Benchmarking Human-Free Lifting Solutions in the Offshore Wind Energy Environment. Energies 2018, 11, 1175. https://doi.org/10.3390/en11051175
Richmond M, Balaam T, Causon P, Cevasco D, Leimeister M, Kolios A, Brennan F. Multi-Criteria Decision Analysis for Benchmarking Human-Free Lifting Solutions in the Offshore Wind Energy Environment. Energies. 2018; 11(5):1175. https://doi.org/10.3390/en11051175
Chicago/Turabian StyleRichmond, Mark, Toby Balaam, Paul Causon, Debora Cevasco, Mareike Leimeister, Athanasios Kolios, and Feargal Brennan. 2018. "Multi-Criteria Decision Analysis for Benchmarking Human-Free Lifting Solutions in the Offshore Wind Energy Environment" Energies 11, no. 5: 1175. https://doi.org/10.3390/en11051175