Is District Heating Combined Heat and Power at Risk in the Nordic Area?—An Electricity Market Perspective

1
Department of Mechanical Engineering, School of Engineering, Aalto University, Otakaari 4, 02150 Espoo, Finland
2
Sustainable Energy Planning, Department of Planning, Aalborg University, A. C. Meyers Vænge 15, 2450 Copenhagen, Denmark
*
Author to whom correspondence should be addressed.
Energies 2018, 11(5), 1256; https://doi.org/10.3390/en11051256
Submission received: 5 April 2018
/
Revised: 9 May 2018
/
Accepted: 10 May 2018
/
Published: 14 May 2018
(This article belongs to the Special Issue District Heating)
Abstract
:The Nordic power market has exceptionally low carbon emissions. Energy efficient combined heat and power (CHP) plays an important role in the market, and also produces a large share of Nordic district heating (DH) energy. In future Nordic energy systems, DH CHP is often seen as vital for flexibility in electricity production. However, CHP electricity production may not be profitable in the future Nordic market. Even currently, the prevailing trend is for CHP plants to be replaced with heat-only boilers in DH production. In this work, we aim to describe the future utilisation of CHP in the Nordic area. We use an electricity market simulation model to examine the development of the Nordic electricity market until 2030. We examine one main projection of electricity production capacity changes, and based on it we assess scenarios with different electricity demands and CO2 emission prices. Differences between scenarios are notable: For example, the stalling or increasing of electricity demand from the 2014 level can mean a difference of 15 €/MWh in the average market price of electricity in 2020. The results of this paper underline the importance of considering several alternative future paths of electricity production and consumption when designing new energy policies.
1. Introduction
Increasing shares of variable renewable energy (VRE) together with an economic recession have pushed the market price of electricity down in the Nordic countries. As the current price level causes diminished new investment in power production, combined heat and power (CHP) has the role of a miner’s canary on the mission to decarbonize the energy system.
In the Nordic countries (Finland, Sweden, Norway, and Denmark), many long-term visions for the future rely on CHP (and hydro power) to supply controllable electricity production when VRE availability is low [1,2,3,4]. However, there are already issues with the profitability of thermal power production due to the low market price of electricity [5,6,7]. Should CHP lose its profitability even with more recent VRE capacities, the premise of the described future visions would need to be revised for them to be viable as market-based action. With this in mind, we investigate the role of CHP on the Nordic electricity market in 2030, assuming market-based operation and forecasts of future power production capacities with other technologies.
In the Nordic countries combined, and especially in Finland and Denmark, CHP is an important part of the energy system. Plants of this type can utilise a variety of fuels, offer very high total energy efficiencies (over 90%), and flexibility in operation similar to that of condensing power plants. Because the produced heat is often utilised in district heating (DH) networks, and the demands of electricity and heat coincide, CHP plants make for a proven alternative to condensing power plants.
Due to the many favourable qualities of CHP, a common view is that it should be kept in use. For example, CHP-DH systems are seen to have value in VRE integration through optimal production [8], balancing services [9], and the interlinkage of the heat and power sectors [10,11].
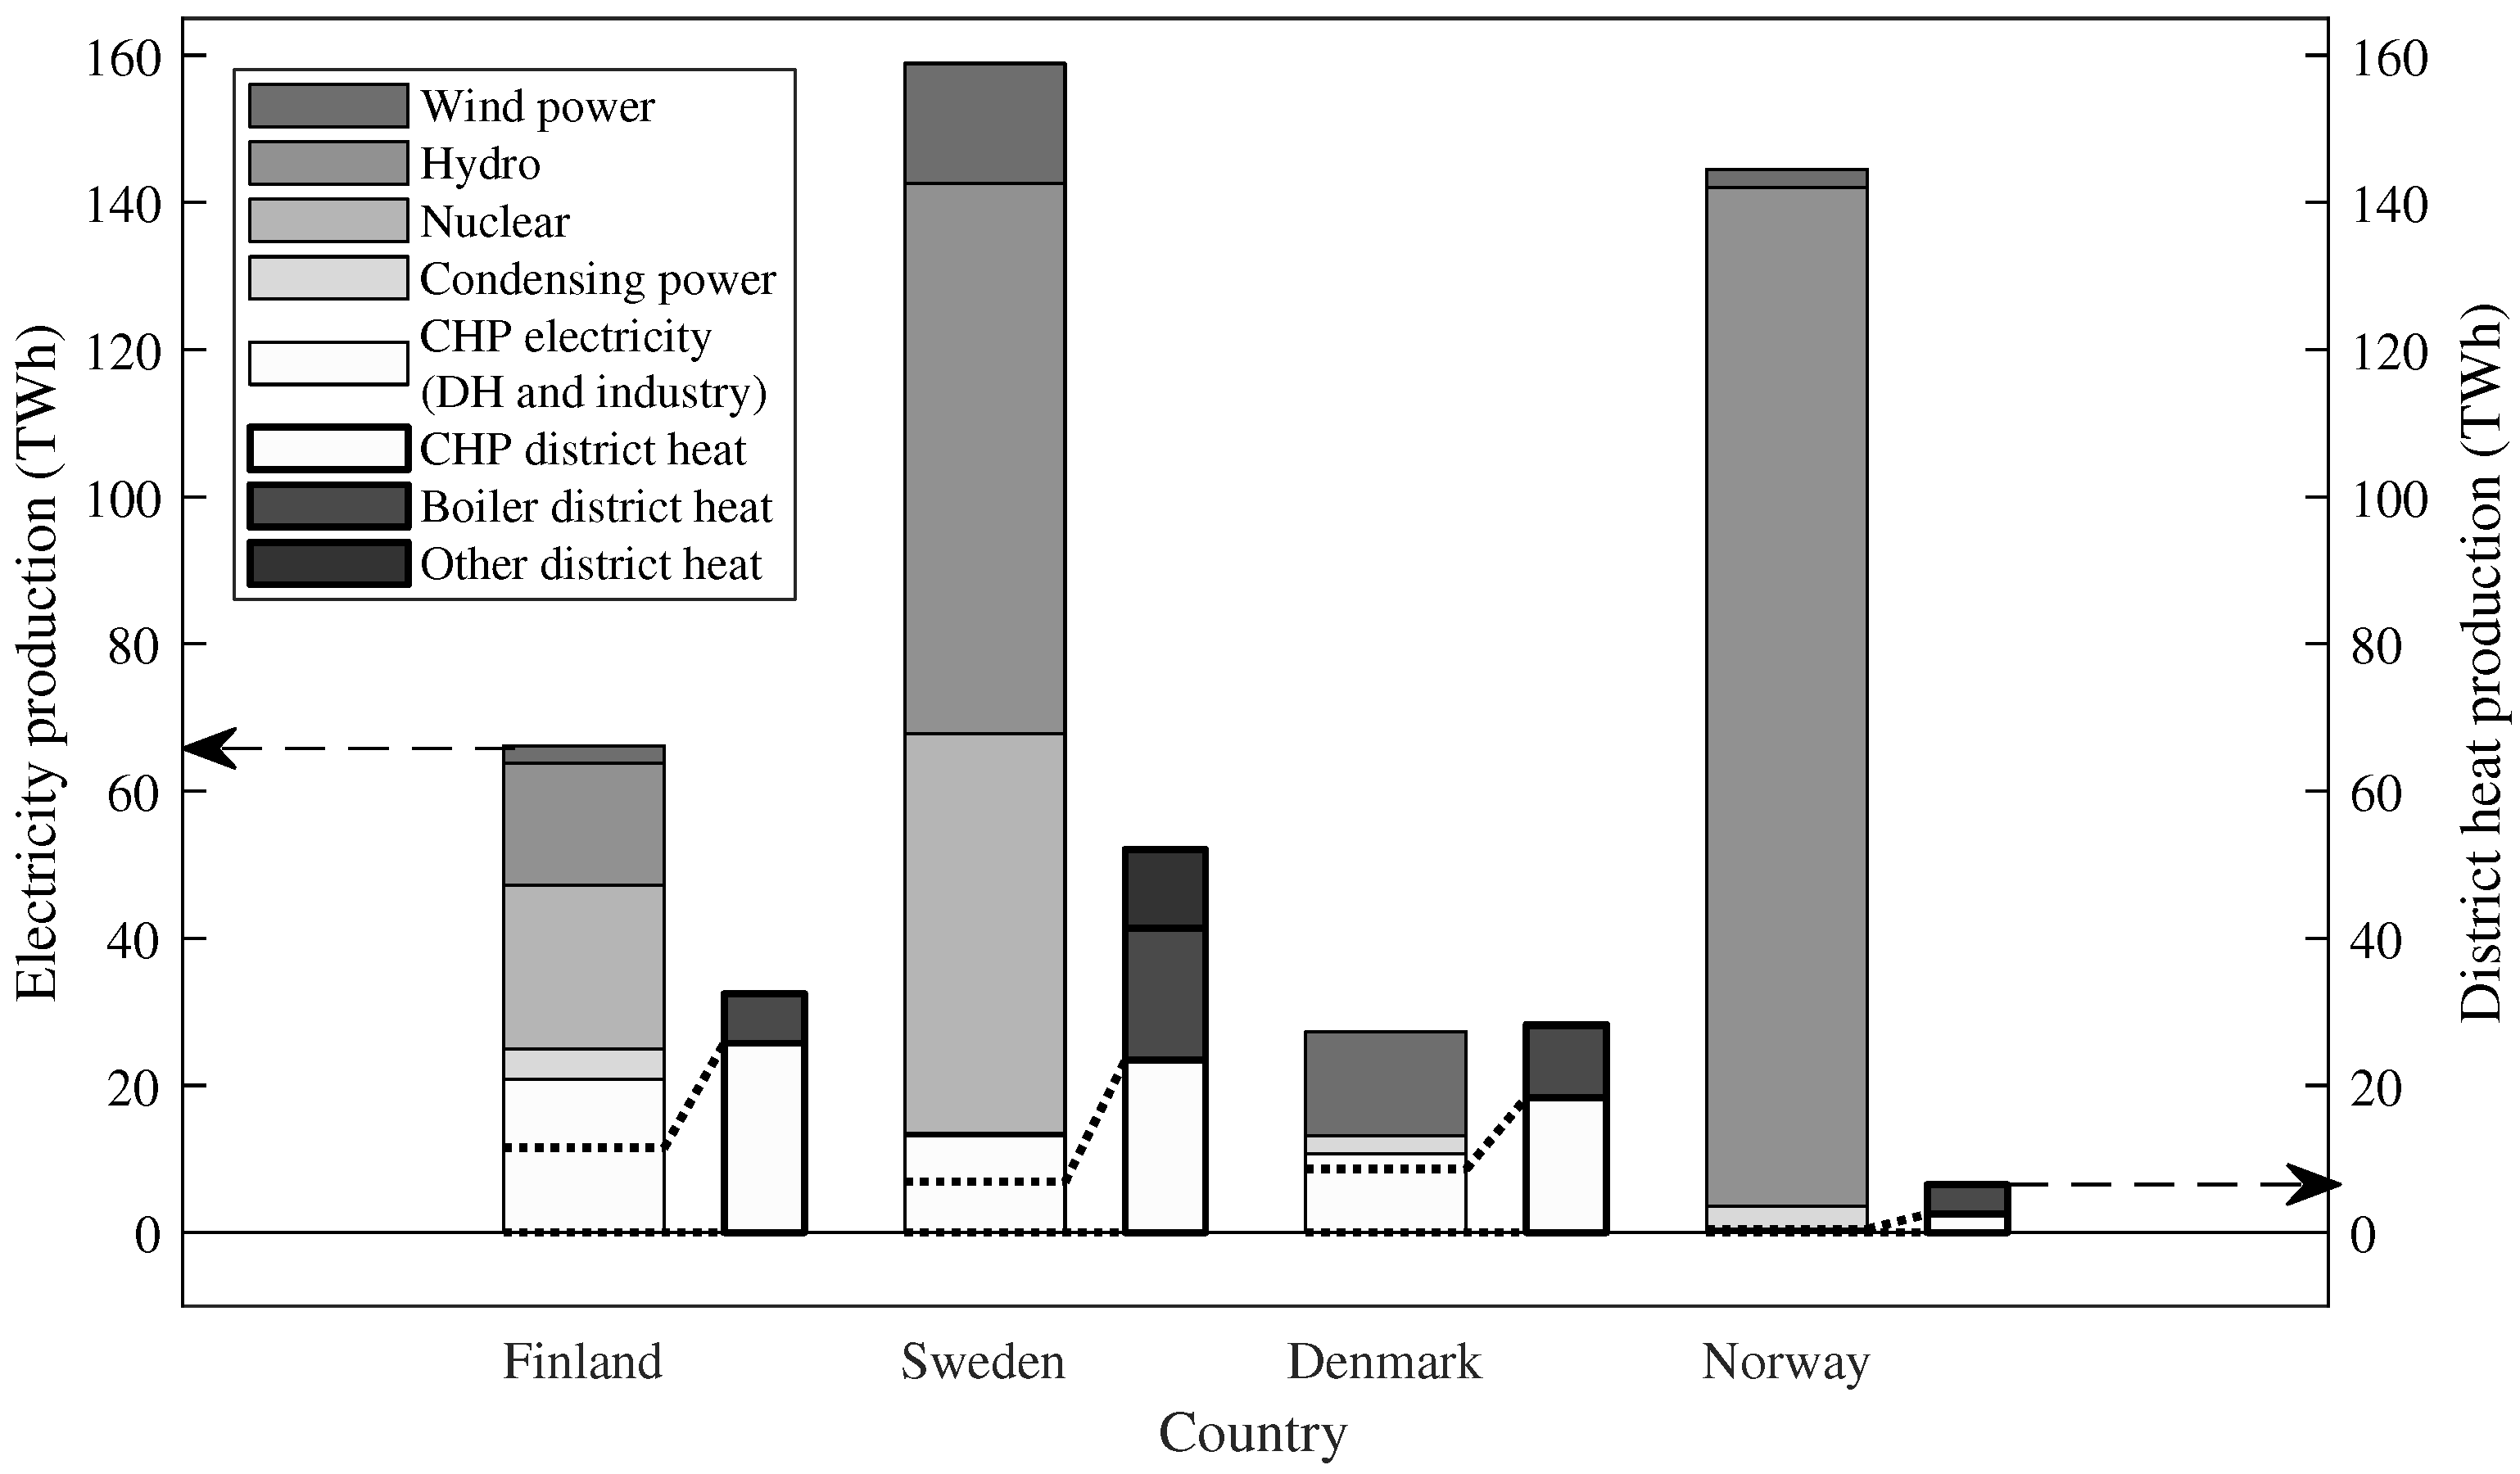
Currently, CHP electricity production in the Nordic countries amounts to 11% of total electricity production. Individually, the shares are 32%, 8%, and 38% in Finland, Sweden and Denmark, respectively, and a very small share in Norway [12,13,14,15]. Additionally, CHP plants cover a large share of total DH production in the countries. An overview of Nordic electricity and DH production is shown in Figure 1.
Regardless of its importance for the current or future electric system, CHP is not irreplaceable for DH networks. As a heat production technology, it competes with heat-only boilers (HOBs) and heat pumps. A current trend is to replace and supplement existing CHP capacity with cheaper HOBs. Many DH networks have several plant types and fuels, in which case cost-optimisation determines hourly productions of CHP, HOB, and heat pump plants. If the operating hours of a CHP plant are not deemed sufficient based on this optimisation (in the long term), the plant is removed from operation. In this work, we cover industrial CHP only shallowly, as it is operated under a different set of business related constraints.
The Nordic power market faces potential issues that are closely linked to the problems of CHP producers. The current market is an energy-only market, where produced energy is compensated, and not the upheld capacity. Historically, the Nordic area has been a forerunner of creating a liberalised multinational electricity market already in the mid-1990s [18]. The current market, Nordpool, functions well and has so far had strong support in the form of both direct political decisions and informal industry commitment [19]. However, this support may suffer from changes in the economic and energy security aspects of the market. If the profitability issues described earlier can not be rectified, political will may arise to change the market–setting back a long history of international commitment in the market.
The competitiveness of CHP in both the heating and electricity markets requires a combination of operating hours and electricity prices that allows market-based maintenance investment for the long term. Since the Nordic electricity market works on a highest marginal price basis (and compensation can thus differ from the marginal price of the CHP producer), market price is the main factor from the point of view of a single producer.
The Nordic power market price level is expected to increase in the next decade by well established authorities. Increases are indicated in the IEA Nordic Energy Technology Perspectives 2016 (NETP 2016) [1] (55 €/MWh by 2030), the Finnish government [20] (60–65 €/MWh by 2030), Norwegian transmission system operator Statnett [21] (above 40 €/MWh by 2030), and the Finnish research centre VTT [22] (55 €/MWh by 2035). Among the scenarios presented in these resources, the majority indicate that the market price will increase, and CHP will maintain a role on the market. Recently, however, the yearly average market price has been below 30 €/MWh from 2014 to 2017 [23], with futures prices indicating similarly low market prices for the next few years [24]. This is well below the levelised cost of electricity production for nearly all thermal power production. Thus, there is room for doubt in the economic situation of CHP (and other thermal) power production in the next decade.
In the energy production industry, there has been worry of a subsidy-driven oversupply situation [25]. Supply of low marginal cost electricity draws the market price down through a “merit-order effect”, which has been confirmed in the literature [26,27,28]. The penetration of intermittent renewable energy will reduce the average electricity prices but intensify the price volatility in short term [29]. However, the latter effect is not very strong in the Nordic countries with a lot of hydro power, which dampens the short-term price volatility [30]. This volatility could be a source of revenue for thermal generation, but Nordic producers have not enjoyed it like producers in other markets. In addition to VRE and hydro, factors that make the future price level and power production mix of Nordic countries uncertain include developments in nuclear power, emission price, industry exports, and other electricity demand [31]. The estimation of such variables as those mentioned is difficult in a long-term forecast. For example, forecasts of Nordic countries’ future electricity demands were presented in 2009 in [32]. The presented forecasts for 2030 are notably different from current national forecasts (presented in this work). This shows clearly how expectations of the future can change drastically in a matter of years. This dynamic must be admitted in any study involving future scenarios.
Despite the uncertainties of the electricity market, many studies (such as [2,4]) on future energy systems task CHP plants with balancing VRE production without regard for the electricity market around the envisioned energy system. In a similar fashion, CHP capacity may be suggested to increase, such as in [33], as part of a low total cost energy system. The uncertainty of the economic environment of investments in CHP is not properly considered in these types of analyses. After all, energy investments are based on profits rather than on the common good. Gils et al. [34], on the other hand, take a clear stance on this issue and suggest that if the market structure (of a VRE based energy system) does not allow maintaining the necessary peak capacity, the market should be changed.
Above, it has been shown that the future of the price of electricity is not certain on the market, and that the role of CHP is often studied with little regard to the economic constraints of the energy business. In this study, we show how specific projections of electricity market developments (such as increases of nuclear and VRE electricity) would reflect on the viable role of CHP on the electricity market by 2030. For this, we utilise an electricity market simulation model.
Among the existing models, Enerallt has been chosen for this analysis. Enerallt is a multi-area electricity market model that analyses future scenarios regarding for example production and interconnection capacities, emission price, and fuel prices. As an hourly model it allows modelling on the day-ahead market level, as opposed to TIMES (used in [35] for Norway and Sweden), which is used on a longer time horizon. Enerallt differs from other hourly models (such as EnergyPLAN (used for Finland in [33]), Wilmar [36], and Balmorel (used for Norway in [37])) in that it does not optimise production, but models the producers’ market operations, which may produce different results especially regarding hydro production. Important proprietary models include EMPS (described in [38]), which does not consider local DH markets, and Plexos [39]. The variant of Enerallt used in this work is suitable for analysing the operation of the hydro-dominated Nordic market with future capacities and marginal prices. Moreover, unlike for example EnergyPLAN, Enerallt is able to realistically model the operation of an interconnected multinational electricity market on an hourly basis.
In this work, we use Enerallt with a hydro power modelling method that is different from the original. Hydro power modelling is one of the key tasks of future scenarios of the Nordic countries, as 60% of current electricity production is hydro based. Production characteristics of hydro power can be econometrically analysed post-operation [40]. However, determining (from the outside) the logic of decision making in retrospect is difficult [41] and especially so beforehand. After all, producers have several (theoretical) options for scheduling strategies [42]. In this paper we utilise an algorithm that focuses on the hydro producers’ adaptation to the changing market price of electricity.
As discussed, there are many uncertainties regarding the future of the Nordic electricity market. Known factors such as new nuclear plants and transmission lines will interact with unknown factors such as electricity consumption. With this in mind, the research question of this paper is: Can CHP still be competitive on the Nordic power market in 2030, considering the coming changes?
The structure of this paper is as follows. In Section 2, the Enerallt model is described. In Section 3 the modelled scenarios are presented. The marginal price estimates for the model are given in Section 4. The model results are described in Section 5, and discussed in Section 6. Section 7 concludes. The main conclusion of this paper is that it is well possible that electricity prices on the Nordic market will remain too low for profitable CHP production until 2030.
2. Enerallt Model
Enerallt is an electricity market model for the Nordic countries. It has been developed at the Aalto University in Finland. Detailed information about the model can be found in [43]. Here we describe the overall operation of the model, along with alterations for this work.
2.1. Basic Operation of the Model
Enerallt models the Nordic market by simulating the decisions of electricity suppliers and the operation of international grid connections. The model simulates the market operation with dynamic hourly supply curves and predetermined, price-independent demand profiles. Market price and realised production of electricity is determined by the rules of the Nordpool spot market. In the market, a common system price is determined from the buy and sell bids of all market participants without considering inter-area transmission capacity restrictions. The actual price for each area (the area price) is then determined considering the congested transmission lines.
In practice, the model creates simulated hourly electricity supply curves for each modelled country or price area. The supply curves for CHP capacity are made considering the heating demand. The demand of both electricity and heat is price-independent. Knowing the supply curves and the demand of electricity, the model simulates the Nordpool Spot market, determining the market outcome, e.g., the system and area prices of electricity, power flows between the areas, carbon emissions, and the power producing technologies in each area. The simulation is done separately for each hour of a year consequtively.
2.2. CHP Modelling
The sizing of the bids of CHP capacity to the electricity market is based on the district heating demand in the same area (country or price area). We refer to this as heat following CHP electricity. Some plant and network designs allow electricity production beyond the current demand of heat (due to e.g., heat storage or removal). In the context of this paper, this is non-heat following electricity production, which we count as a part of condensing production, because the waste heat is not necessarily utilised. Thus, CHP plants produce “CHP electricity” and “condensing electricity”. Utilisation of heat storage is not modelled beyond its indirect inclusion in the possibility for condensing CHP electricity production.
2.3. Modification of Hydro Power Modelling
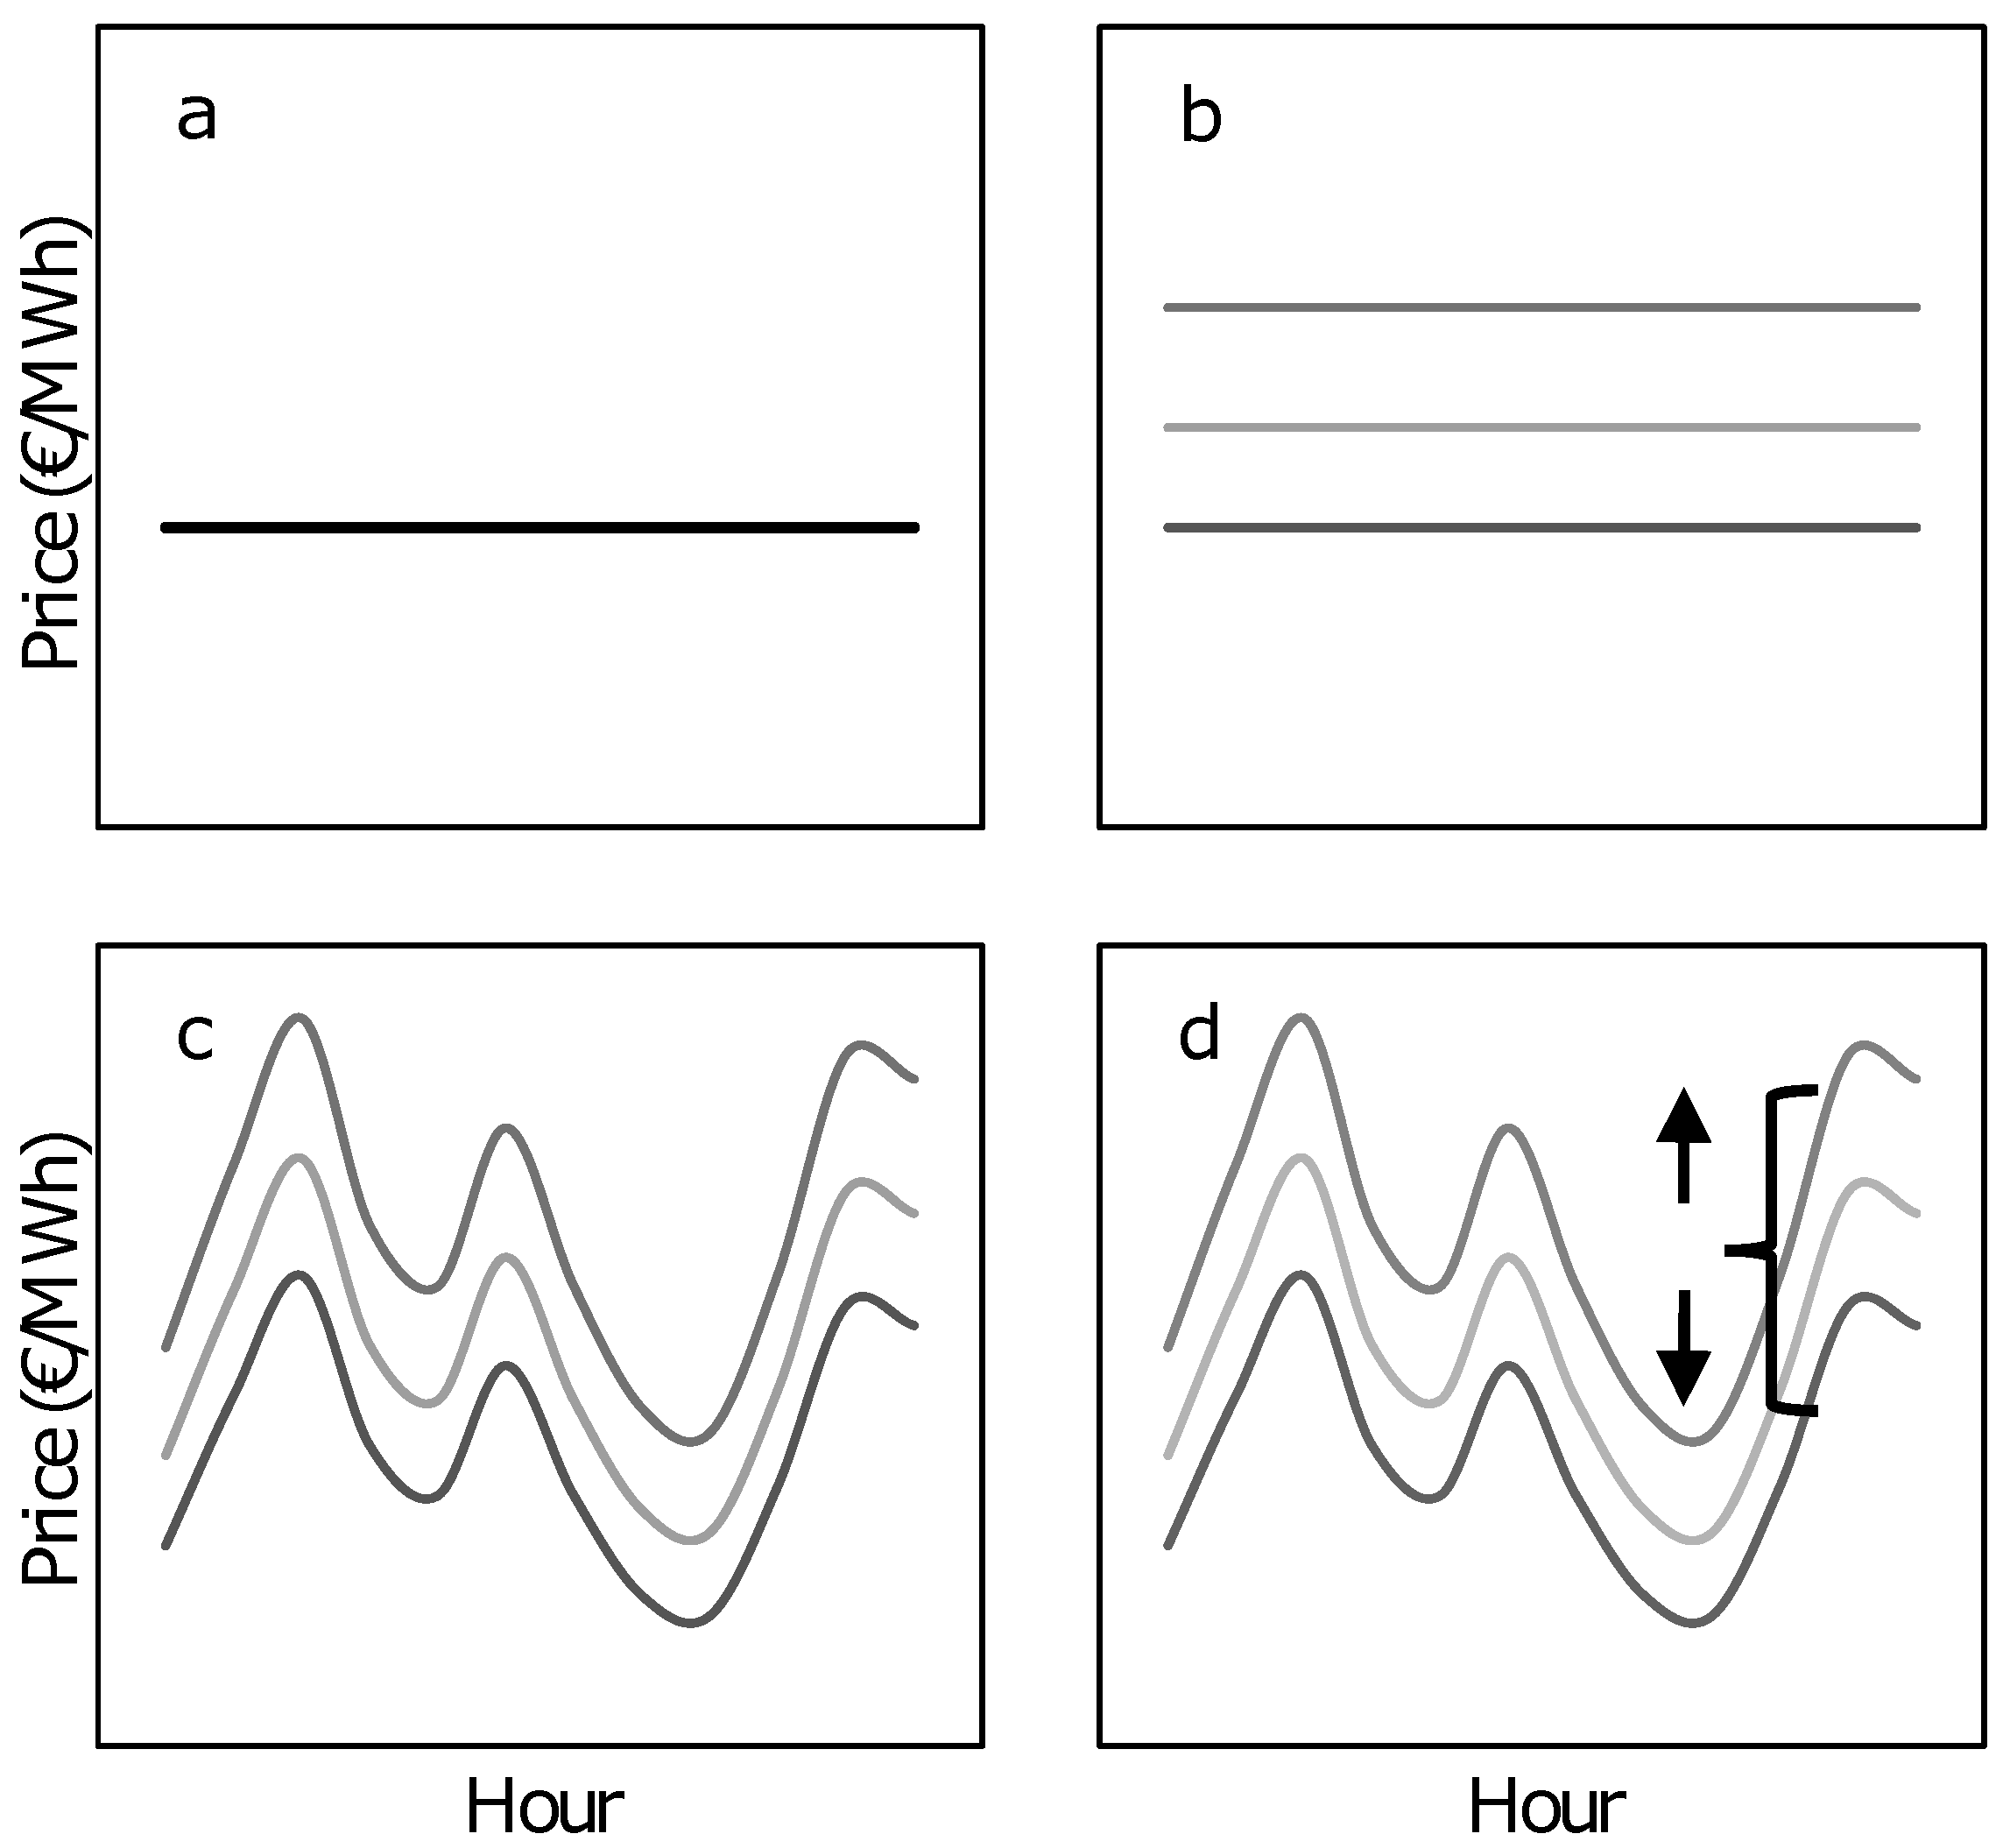
Because in the scenarios of this work the market price changes markedly, we modify the original Enerallt hydro power model with one that we believe more accurately represents hydro producers adjusting to changing market price expectations. The producers should adjust their marginal prices to produce as much electricity as possible during the year, with the highest possible price. The marginal price profile in the model is myopic, but adjusted between model run iterations. The pricing process is explained next. Figure 2 is meant to illustrate the explanation for a single country.
Like in the original model, we divide the hydro power capacity in each area into segments based on their characteristics (see Figure 2a,b). For example, plants with small reservoirs must generally settle for lower prices than those with large reservoirs, due to inability to wait for a better price. Run-of-river plants are modelled separately as VRE.
After the initial pricing, we make an hourly marginal price profile for each hydro segment by multiplying them with the normalised system price profile of the reference year (see Figure 2c). This leads to the yearly average price to be the same as before multiplication, but the price profile reflecting the reference year.
Next, we run the model iteratively, checking the resulting yearly totals of hydro production in each country. If the total production is smaller or larger than it is expected to be, the model is rerun with that country’s hydro marginal price adjusted (see Figure 2d). This process is continued (largest difference first) until all countries are modelled to produce approximately the expected yearly total amount of hydro electricity. The expected total yearly production is the total production in the reference year plus the forecast increase in yearly production.
We find this modelling method to produce a realistic representation of the role of hydro power in any price level scenario (all hydro is sold with the highest possible price while following the reference year market price profile). We find following the reference year price profile an agreeable simplification, given the large amount of hydro power in the Nordic system.
An unavoidable negative consequence of the hydro adjustment method is that the modelled electricity market system price becomes very similar to the hydro marginal price profile. This dampens the seasonal variations in modelled hydro power production. For this reason, the model results are best analysed on the annual or quarterly level to avoid misinterpretation.
3. Scenarios
We present five future scenarios, two for 2020 and three for 2030. With the scenarios, we aim to capture the probable range of effects of a high VRE penetration on the Nordic electricity market. Our future projections include expected developments also in other electricity production technologies than VRE. Only CHP and DH are not changed to understand the implications of the overall changes on them. Two of our scenarios (2020A and 2030A) depict a future where the projected power production capacity changes happen, but electricity demand stays at the 2014 level. Two other scenarios (2020B and 2030B) depict an identical future as the “A” scenarios, except that electricity demand in the Nordic countries increases according to national forecasts [20,44,45,46] (see Table 1). Since the national forecasts can be expected to be optimistic, the “A” and “B” futures capture a wide range of potential developments between them. The fifth scenario, 2030C, is identical to 2030B except for a smaller nuclear power capacity.
The emission prices used in the main scenarios in this work are 5, 10, and 20 €/tCO2 (tonne of CO2 equivalent) in 2014, 2020, and 2030, respectively. We consider the published changes in the transmission capacities between the Nordic countries (300 MW increase between Finland and Sweden in 2030 [47]), but not to and from other countries. Distribution loss estimates are considered based on national statistics [12,48,49,50].
In addition to the future scenarios, we validate the model with scenarios for the years 2014 and 2015. Year 2014 is the basis (and reference year) for the future scenarios. Where not stated otherwise, we use data from [43], which has been collected for 2014. The 2015 modelling is also based on 2014 data, except for non-CHP power plant capacities and year-specific input time series. In the next subsections we describe the (base and future) scenarios per technology.
3.1. Combined Heat and Power and District Heating
The estimated capacities of DH CHP plants and the shares of small plants are presented in Table 2. The per-country total capacities are taken from national statistics [12,48,49,50], and the CHP total fuel shares are from [43]. The shares of small plants (under 100 MW) are the total capacities deducted with the large plant capacities from [51], corrected for outdated information. The fuel shares of small plants are the authors’ own estimation based on scattered data. For Finland, the Energy Authority power plant registry is used for cross-checking [52].
The CHP capacities are held constant between all scenarios, at the level of 2014. Later in this work, CHP means DH CHP in heat-following or condensing mode. Industrial CHP is modelled separately as fixed production following a common profile and national total amounts from 2014.
The demand of DH is expected to be relatively stagnant towards 2030 in Finland, Sweden, and Denmark, the more notable users of DH of the Nordic countries [20,44,46]. Because the demand changes additionally depend heavily on the electricity and fuel markets (through competing heating technologies), and since DH demand and heat-following CHP capacity on the market are interrelated, the DH demand (along with the fuel shares) is kept at the 2014 level in the scenarios.
3.2. Condensing Power
We use capacities estimated in [43] for condensing power capacities in 2014. The future capacities of condensing power are highly uncertain. However, there is a clear trend of decreasing capacity. We present scenarios where all condensing power capacity is closed by 2030. As a downward step, we assume a 500 MW capacity for each of the four countries in 2020. The fuel shares of 2014 are kept over the scenarios. In addition to condensing plants, condensing production is offered by large CHP plants.
3.3. Hydro Power
The hydro power production capacity of the Nordic system is expected to increase slightly by 2030. In Table 3 we list the increases expected to the capacities of each country. The Finnish and Danish capacities remain constant due to low growth potential. Swedish capacity is expected to increase due to refurbishments and modernisations [53]. The Norwegian capacity is expected to increase steadily [21]. The 2020 capacities for each country are from the National Renewable Energy Action Plans (NREAPs) [54] of each country, that were published around 2010. For Finland, the 2015 capacity is higher than the 2020 estimate, and the higher capacity is used.
3.4. Nuclear Power
The total nuclear capacity is currently 11,200 MW, with 2800 MW in Finland and 8400 MW (8800 MW in 2014) in Sweden. In 2020 the capacity is expected to be 11,100 MW in total, 4400 MW in Finland and 6700 MW in Sweden. In 2030 a total of 12,300 MW is expected with 5600 MW in Finland and the unchanged 6700 MW in Sweden, assuming the Finnish Loviisa plants continue running past 2030. Details of the nuclear situation can be found for Finland in [55] and for Sweden in [56].
In the low-nuclear Scenario 2030C, the Finnish Hanhikivi 1 plant (scheduled to start in 2024), will not be built, and the Swedish Ringhals 3 is decommissioned earlier than currently estimated, before 2030. The nominal capacities of the plants are 1200 MW and 1060 MW, respectively.
3.5. Solar Electricity
In the beginning of 2014 the solar power capacities were 11 MW in Finland [57], 43 MW in Sweden [58], 571 MW in Denmark [49], and 13 MW in Norway [59]. From the Norway capacity, 11 MW is known not to be connected to the grid, and will be excluded from the analysis.
There are few estimates of the future development of solar PV capacity in the Nordic countries. All countries have surpassed their NREAP estimates of 2020 solar electric capacity, and we keep the capacities constant from 2014 to 2020. For 2030, the European Ten-Year Network Development Plan (TYNDP) 2016 [60] report assumes capacities of 100 MW for Finland and 840 MW for Denmark in their Vision 2 “Constrained progress”, and zero capacities for other countries. The reader should be aware that the Visions in the TYNDP report are not forecasts of the future. However, we take the values as an educated guess of the progress by 2030 in Finland and Denmark. For Norway and Sweden we use the 2014 capacity values.
3.6. Wind Power
The Nordic wind power capacity in the beginning of 2014 was 10,600 MW, most of it in Sweden (4500 MW [48]) and Denmark (4800 MW [14]). By 2020, capacity is expected to grow in every country to a total of 15,500 MW [14,54], aided by national subsidies. The total capacity is assumed to increase to 28,800 MW by 2030, based on the NETP 2016 Carbon Neutral Scenario [1].
4. Pricing of Electricity Production
In Table 4, the marginal prices of electricity in the model for 2014 are presented for each country and technology. The prices of condensing, wind and solar power production are based on data in [43]. The carbon emission price is 5 €/tCO2.
The marginal price of CHP is here that price, with which it is more economical to produce a MWh of heat with CHP (considering revenue from electricity sales) than a heat-only boiler with the same fuel. This assumption is made to constrain the fuels used in the DH networks, because the networks can not be simulated case-by-case. The method used is consistent with the simulation methods of DH networks elsewhere in the Enerallt model. In reality, DH networks often utilise different fuels for CHP and HOB heat production. The CHP fuel prices of peat and oil are from [43], and other CHP fuels from [12].
Information used for the marginal price estimation of CHP with different fuels is presented in Table 5. Different features of the typical plants and fuels are shown. The three lowest rows represent (i) the total cost of production of heat without considering the revenue from electricity sales; (ii) the CHP marginal price as described above; and (iii) a typical plant’s revenue from electricity sales at the marginal price. The marginal pricing of CHP used in this work is easily understood by noting that (in Table 5) for each fuel, the CHP heat production cost minus electricity sales revenue is equal to, or less than, the heat production cost of HOB. Waste fuel is not included in the table, and its marginal price is estimated to be 20 €/MWh in all countries as an educated guess, because reliable data is not readily available.
5. Results
In this section, the results of 2014 (reference case) and 2015 are presented first, followed by the future scenarios and finally a sensitivity analysis for the emission price. The implications and significance of the results are analysed in Section 6.
5.1. Validation with Years 2014 and 2015
We first validate the model results by analysing the results from modelling years 2014 and 2015. The latter year is modelled to validate the method of modelling. The realised and modelled system prices of electricity for the two years are characterised in Table 6. The mean value and standard deviation (from the mean) are shown for both profiles. The differences between the modelled and realised yearly prices are 4% for 2014 and 22% for 2015. The modelled prices are higher in both scenarios, as well as in most single quarters. The standard deviations, which depict the volatilities of the price profiles (around the respective means), are generally greater for the realised profiles. The reader should note that here the standard deviation is used as a measure of price variation within a year, and not as a measure of error.
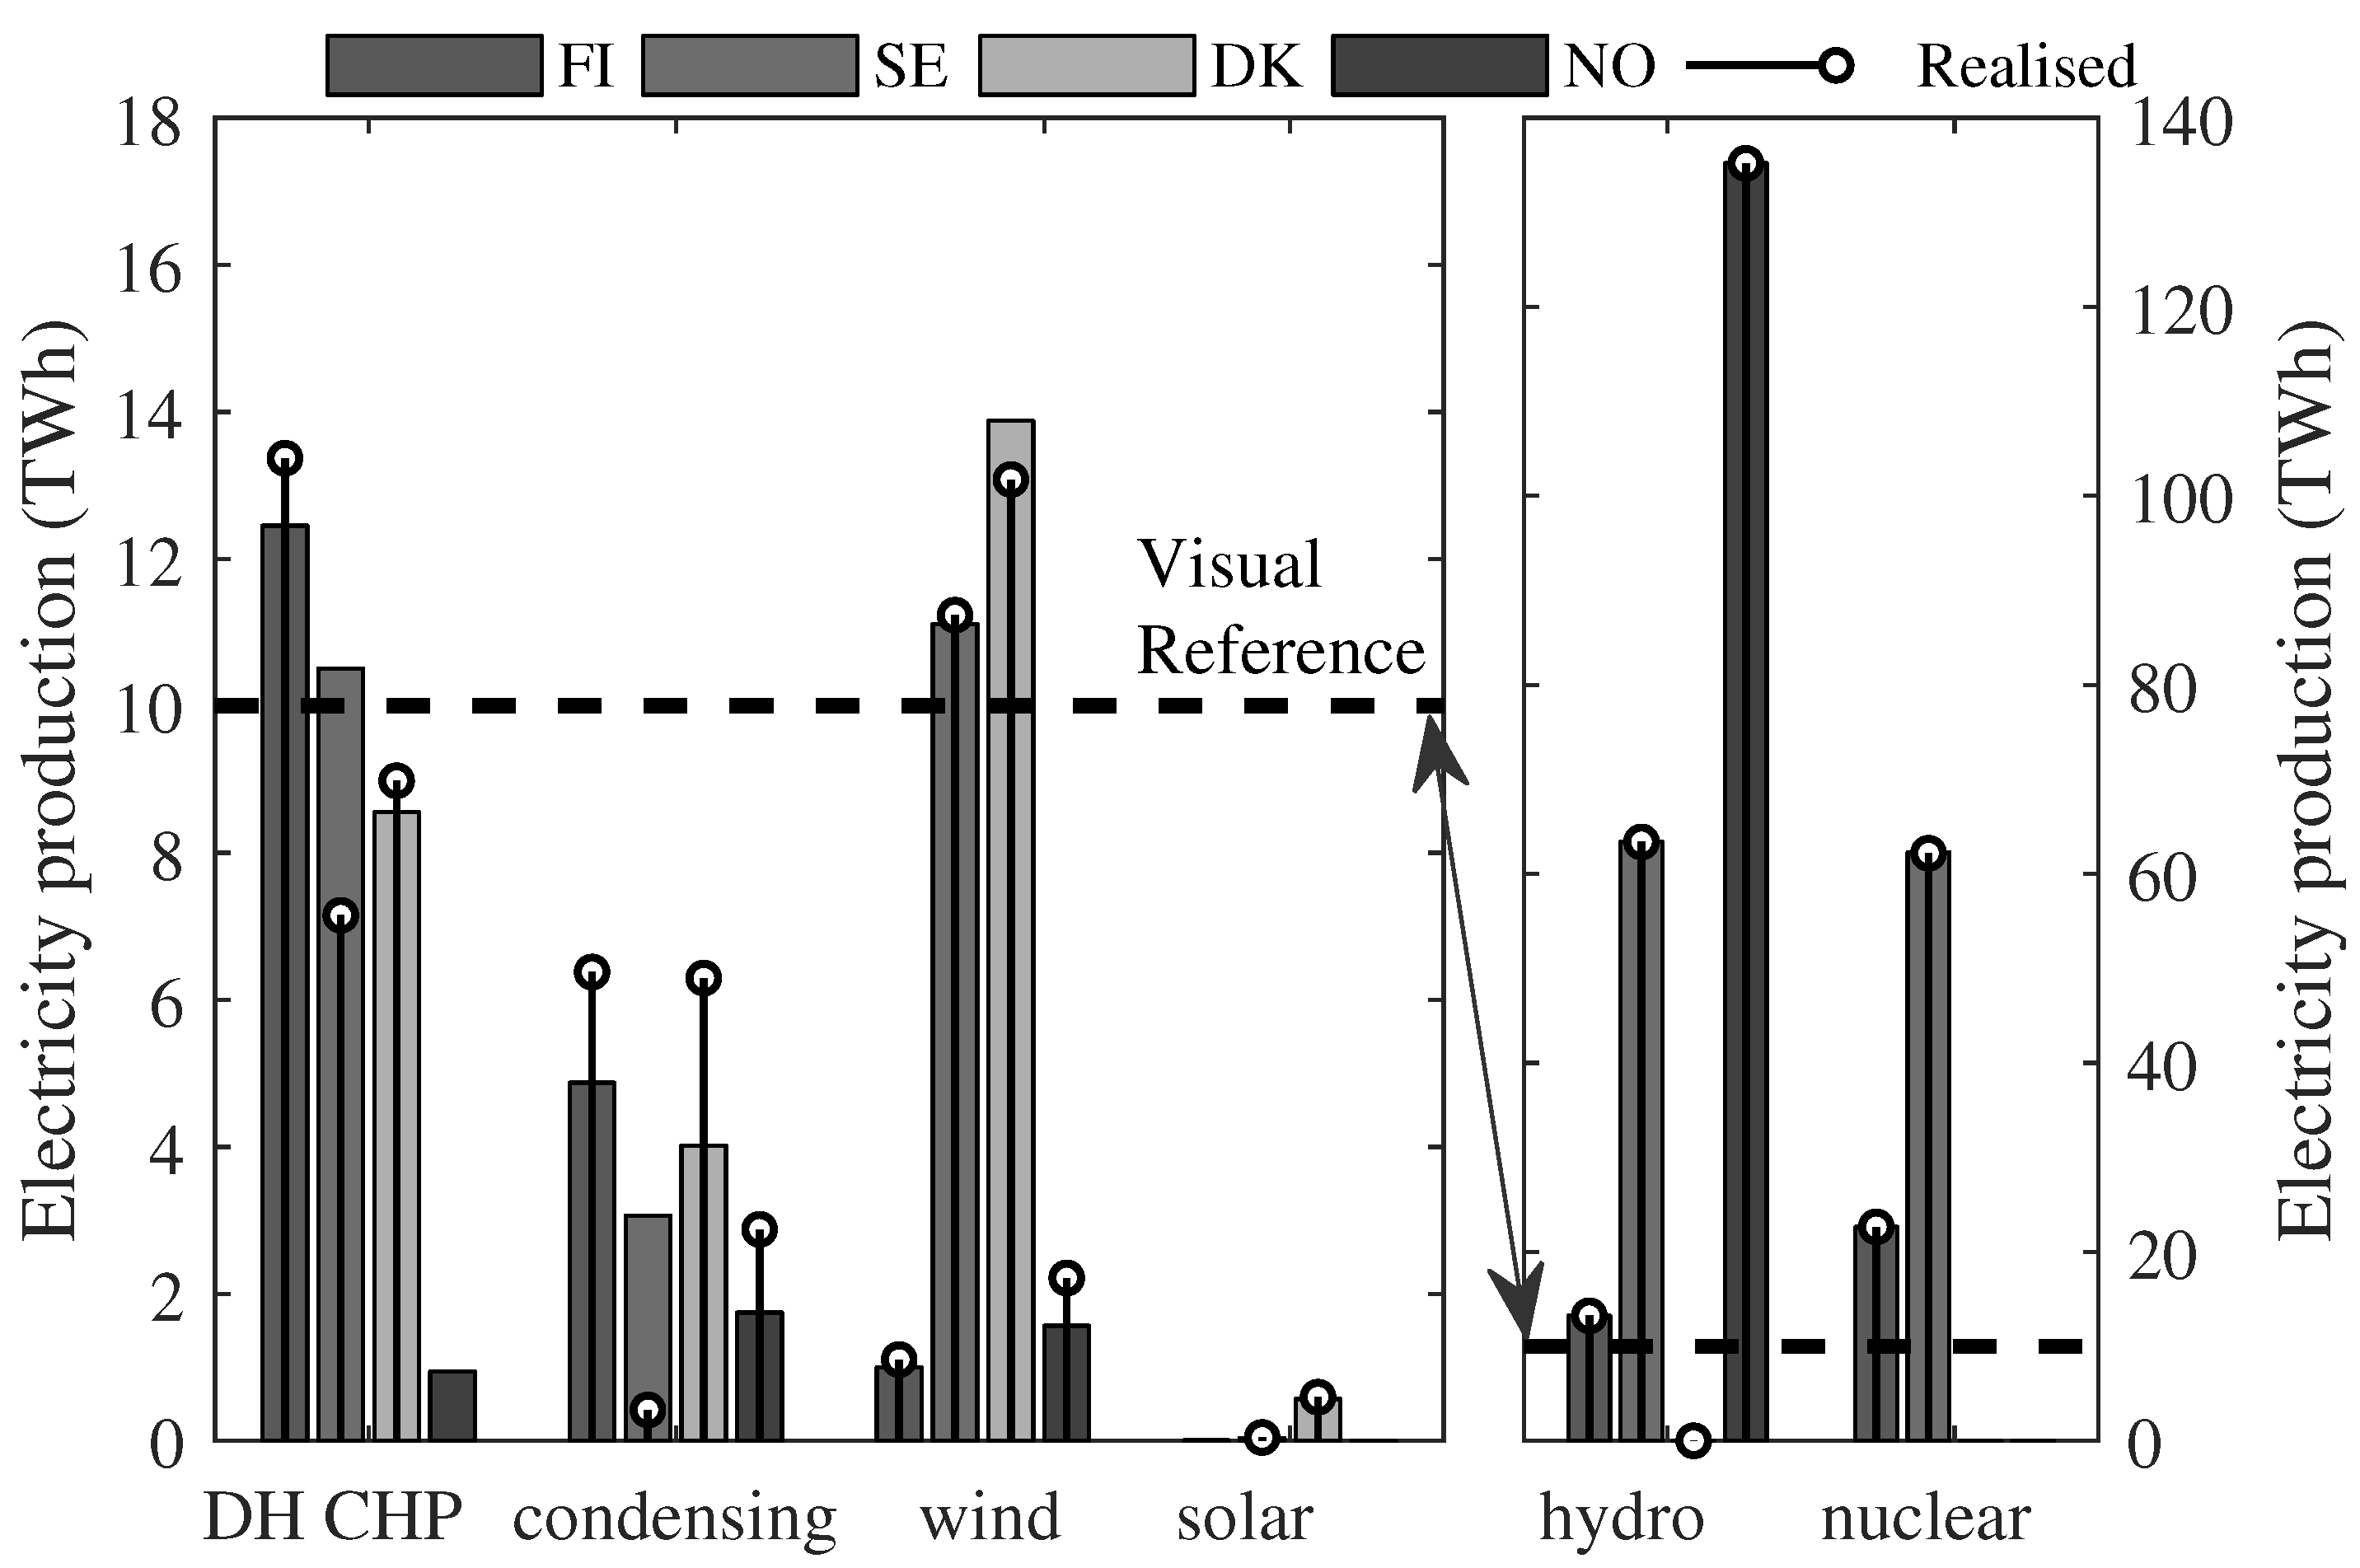
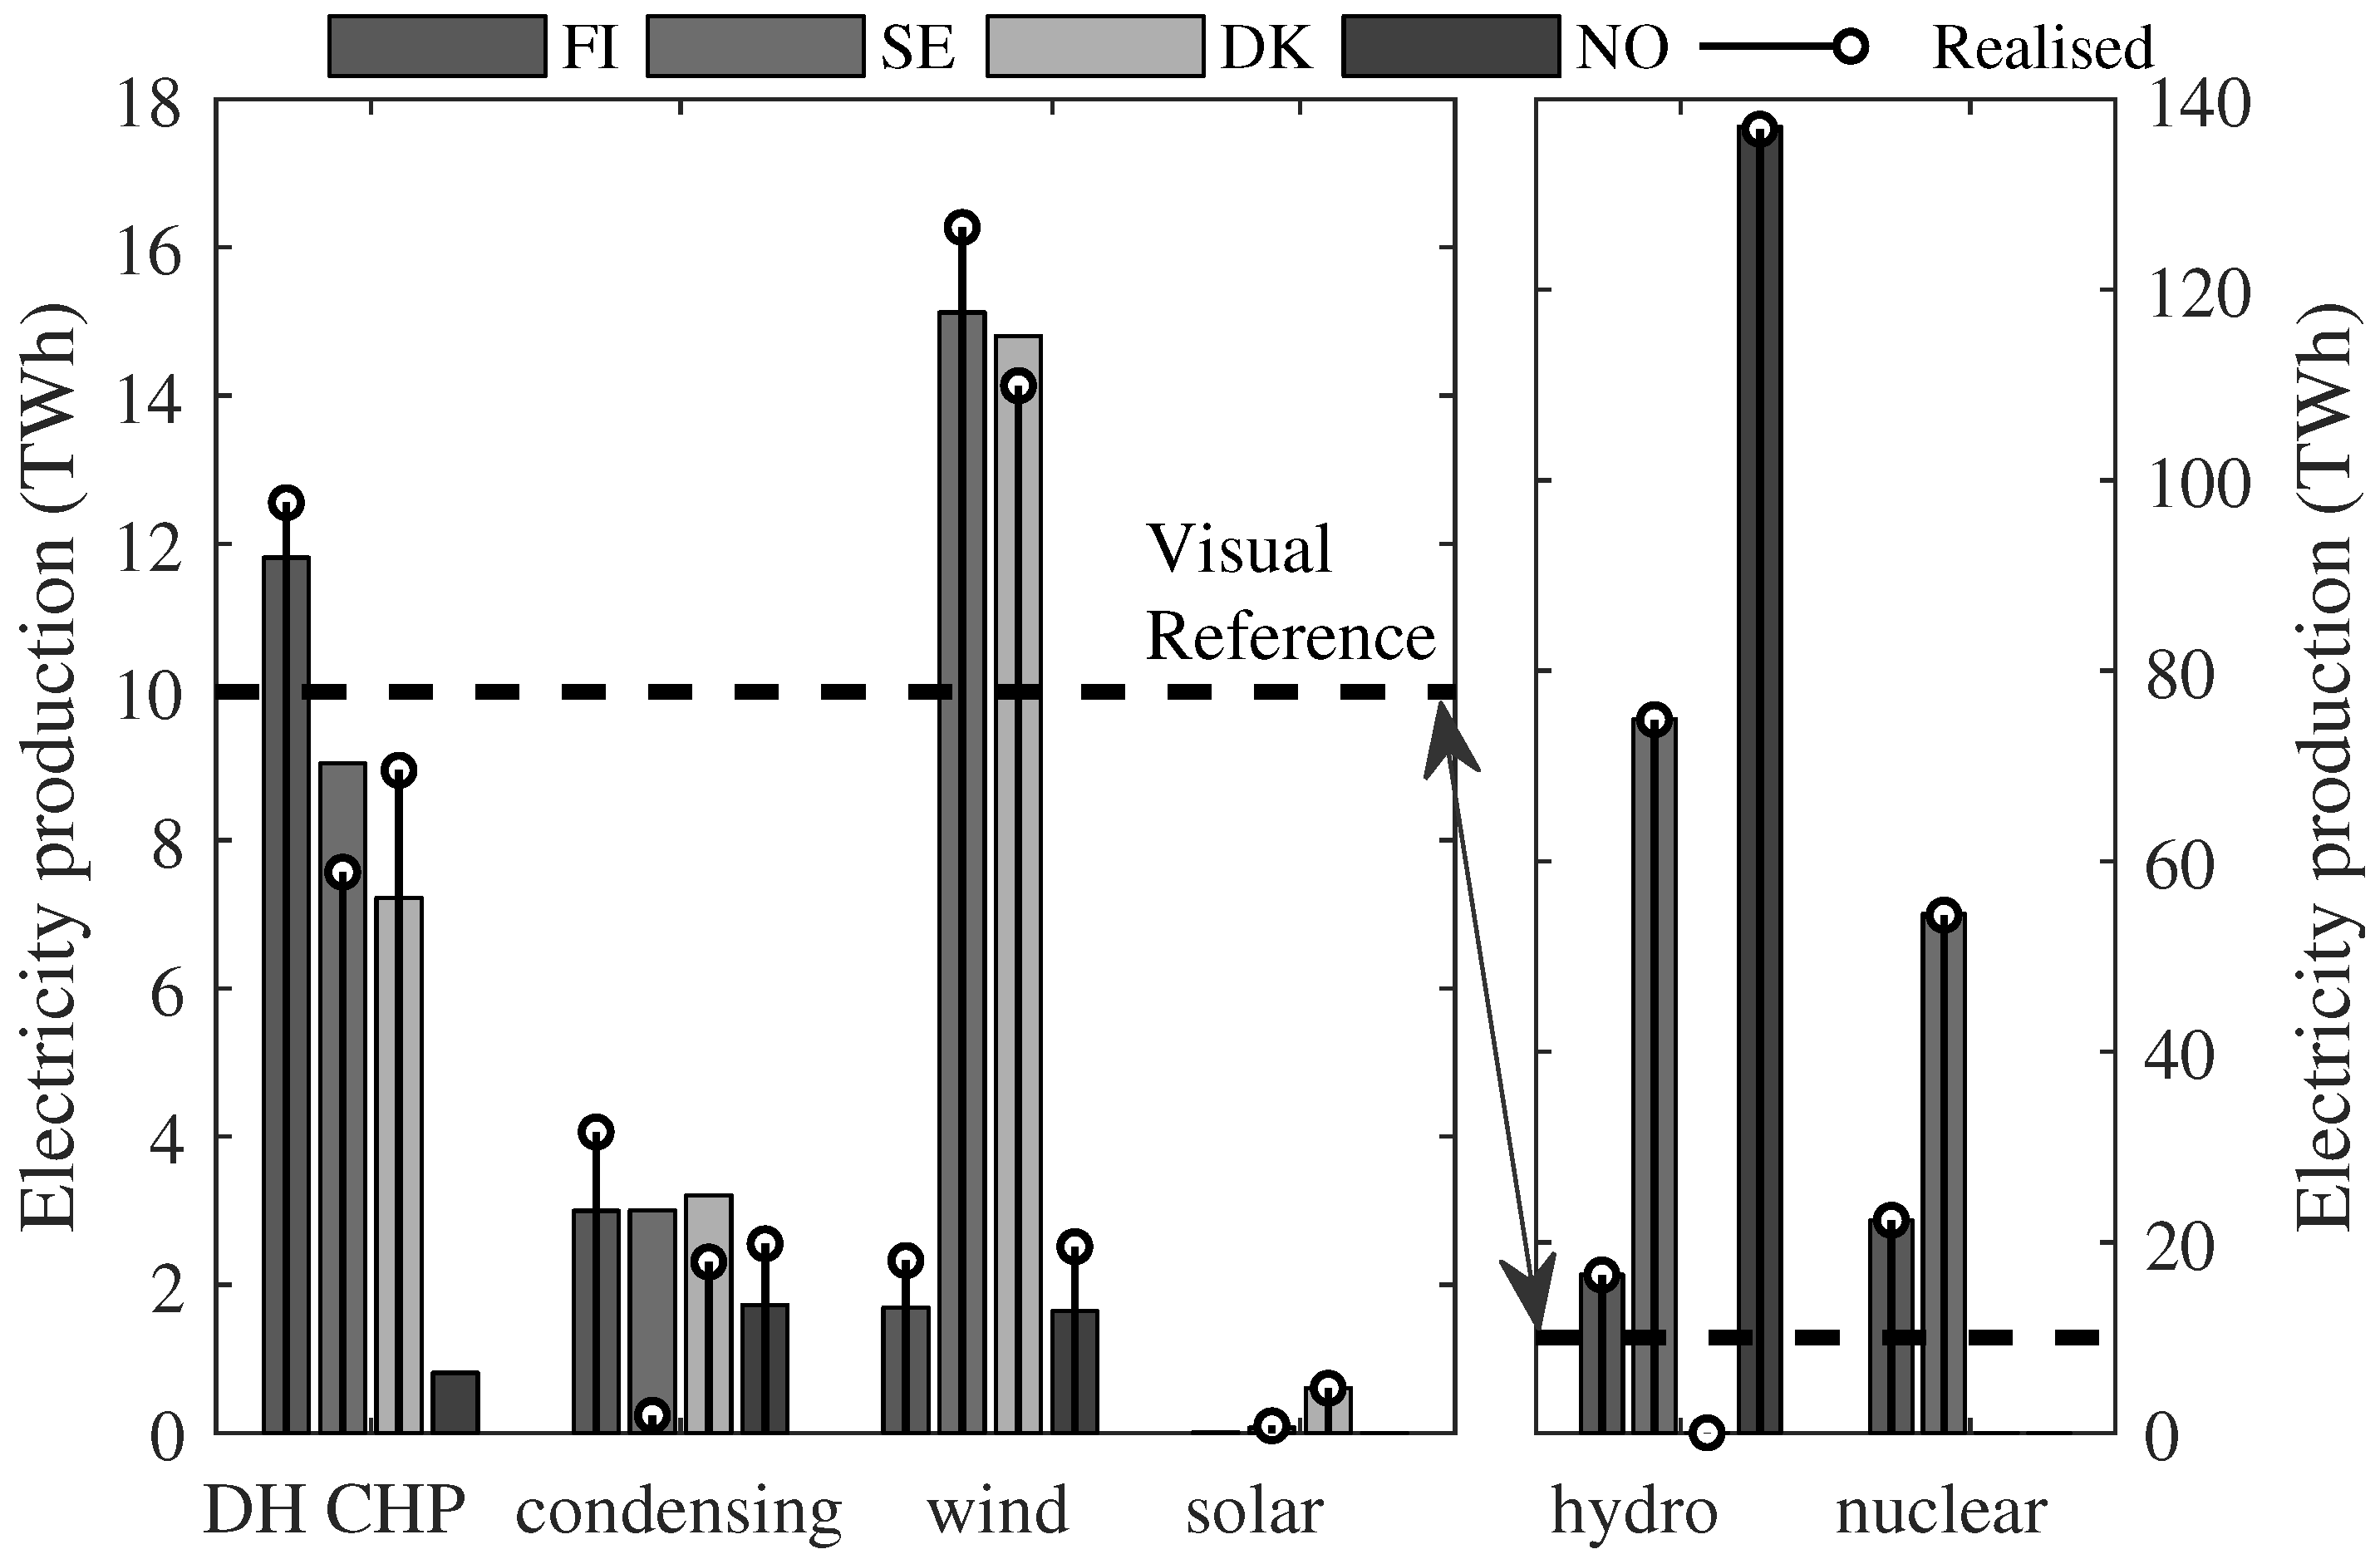
The modelled and real electricity production technologies for 2014 are shown in Figure 3. The corresponding figure for 2015 is shown in Figure 4. Modelled productions are shown by bars, and corresponding real amounts are shown with stems where available. The right and left side plots are separated because they have different y-axes. A dashed line is drawn at 10 TWh in each plot for clarity. For Norway, the stem of “condensing production” also includes CHP production. In both Figure 3 and Figure 4, the per-country differences between modelled and real electricity productions are under 0.25% for hydro and nuclear power (except for hydro in Denmark, 10 GWh (modelled) and 15–18 GWh (real)). For wind and solar power the differences are under 1 TWh and 30 GWh, respectively. For condensing and CHP production there is variation in each case due to lack of country-level detail in available input data to the model. For 2014, the Nordic total modelled and real productions are 32 and 29 TWh for CHP, and 14 and 16 TWh for condensing power, respectively. Corresponding productions for 2015 are 29 and 29 TWh for CHP and 11 and 9 TWh for condensing power.
5.2. Future Scenarios
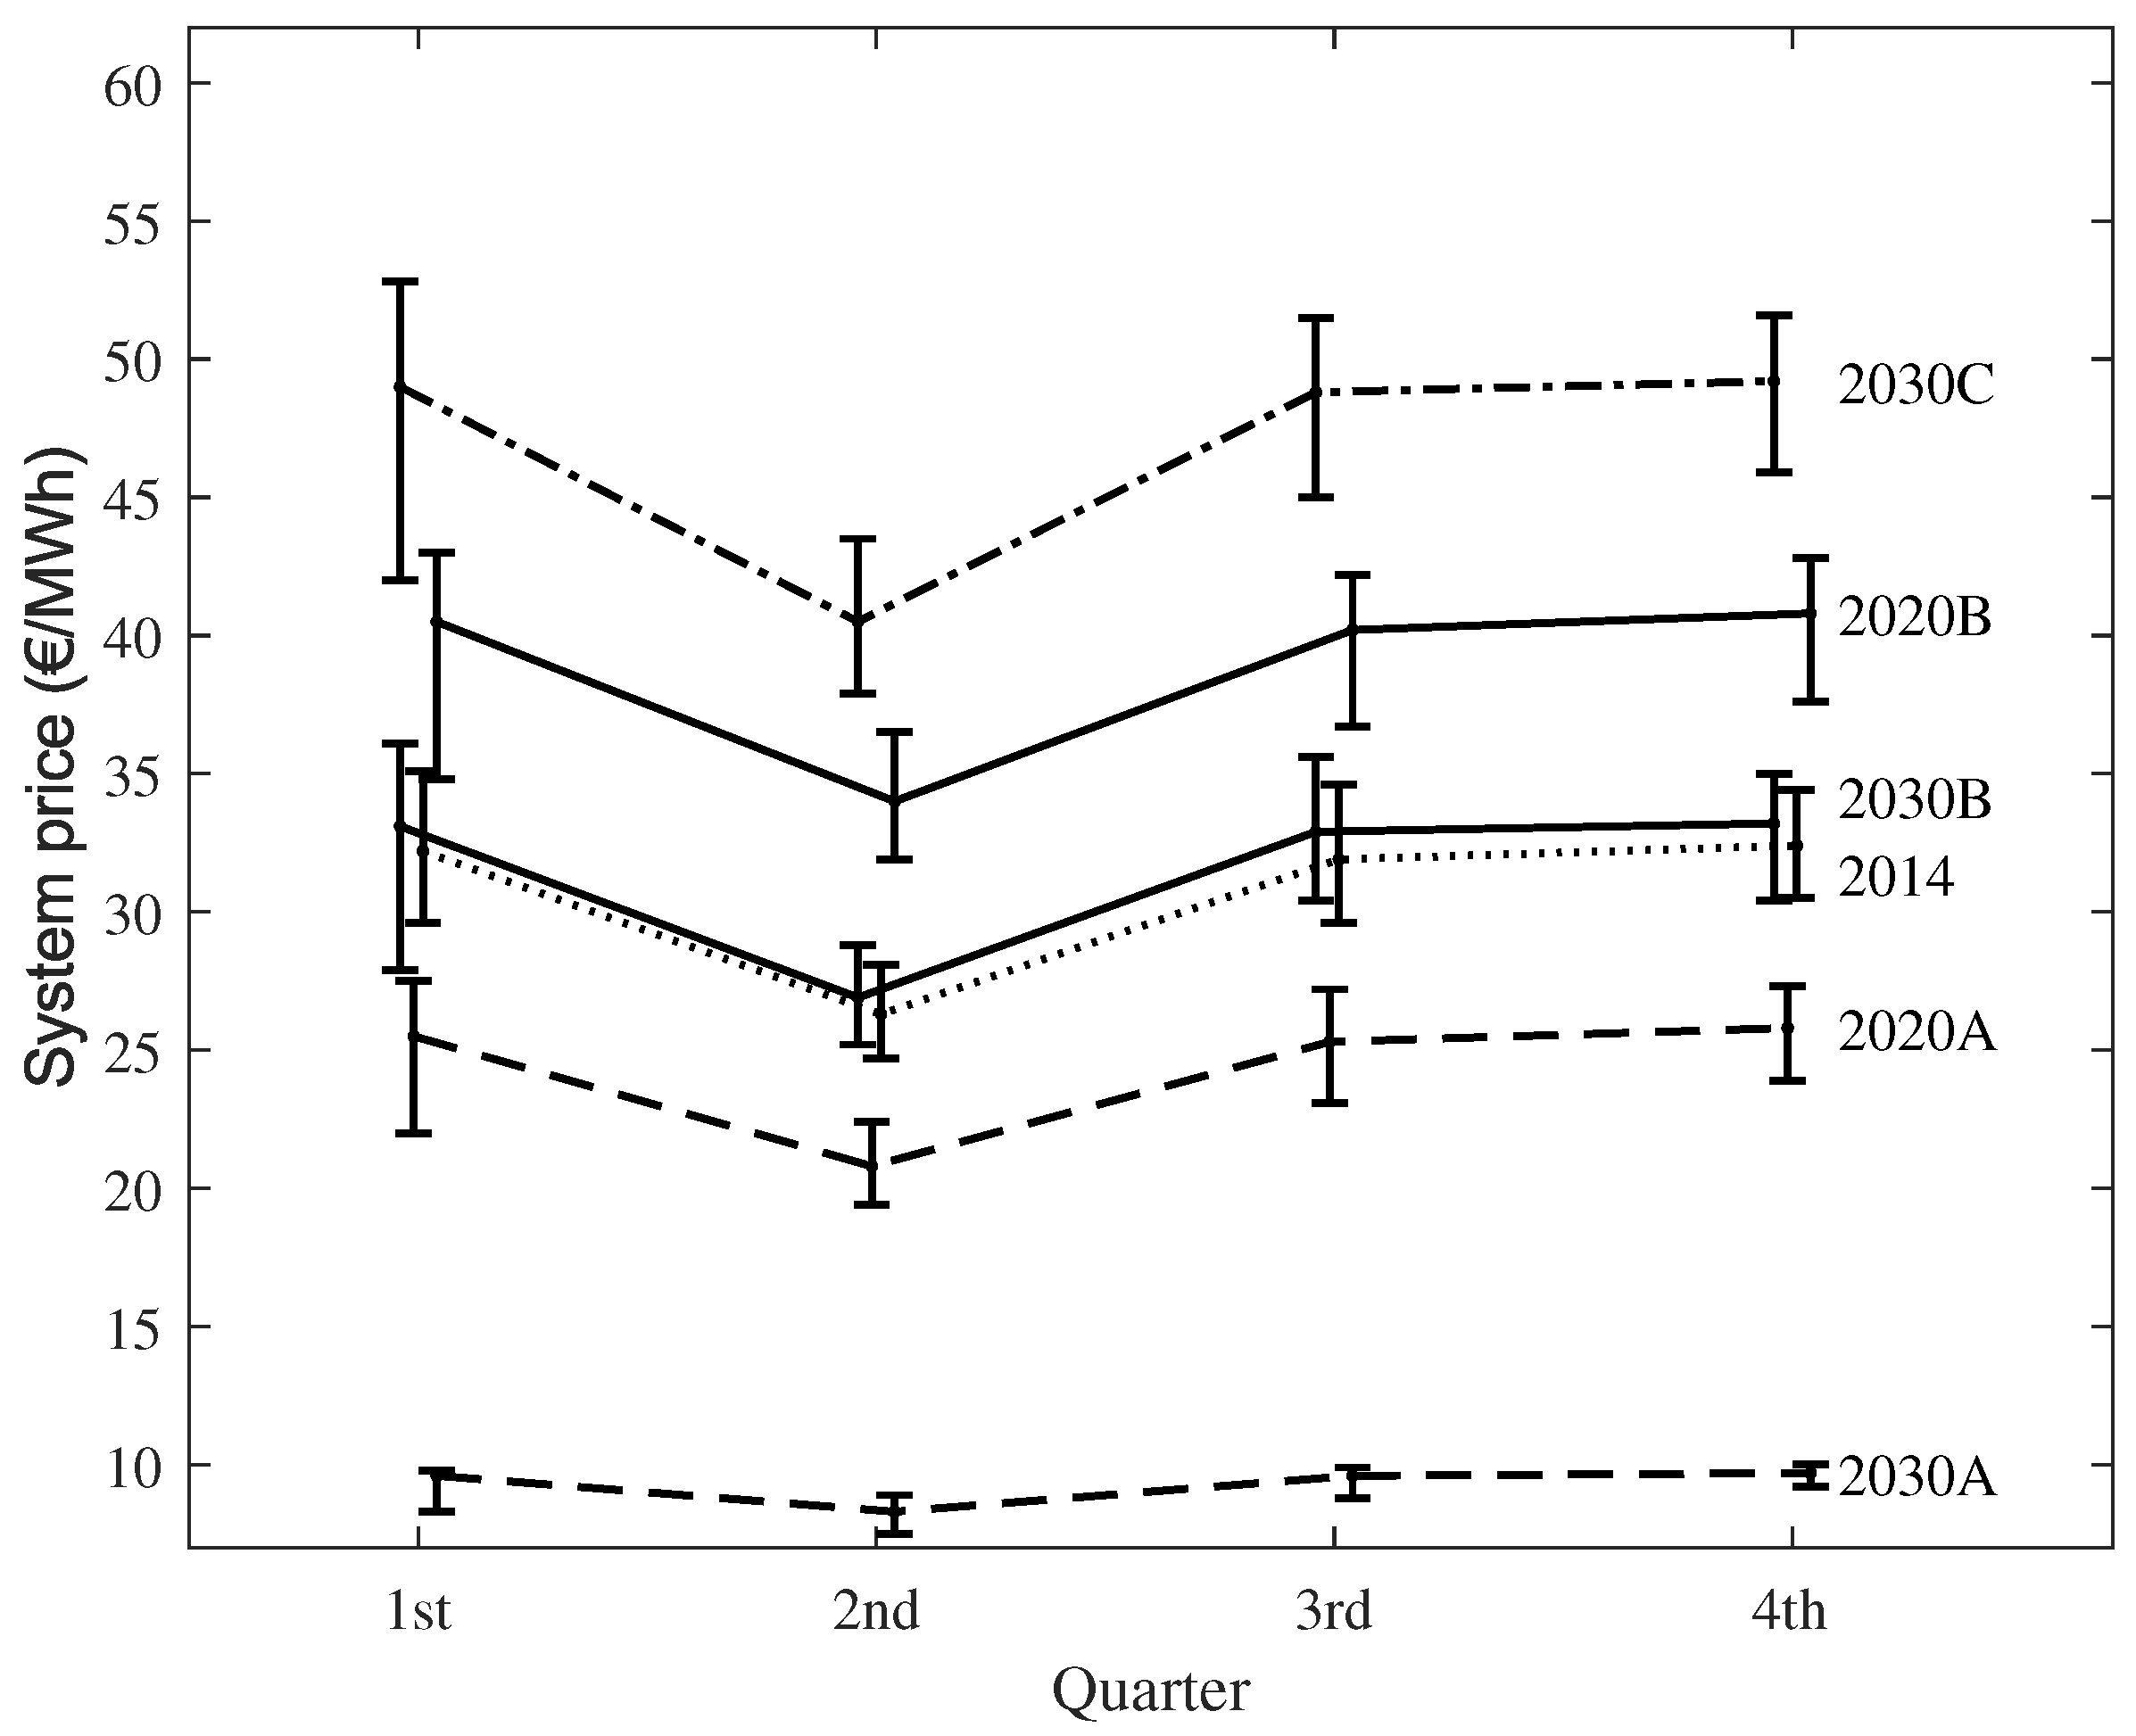
The quarterly median system price profile of electricity in the base and future scenarios is presented in Figure 5. It is seen that in the Scenarios 2020A and 2030A the price of electricity is very low. In 2020B the price level increases from 2014, lowering again in 2030B. The price level of Scenario 2030C is the highest.
In Table 7, the power production capacities of technologies in the Nordic countries are summarised. The capacities are the maximum capacities offered to the market in the modelled year.
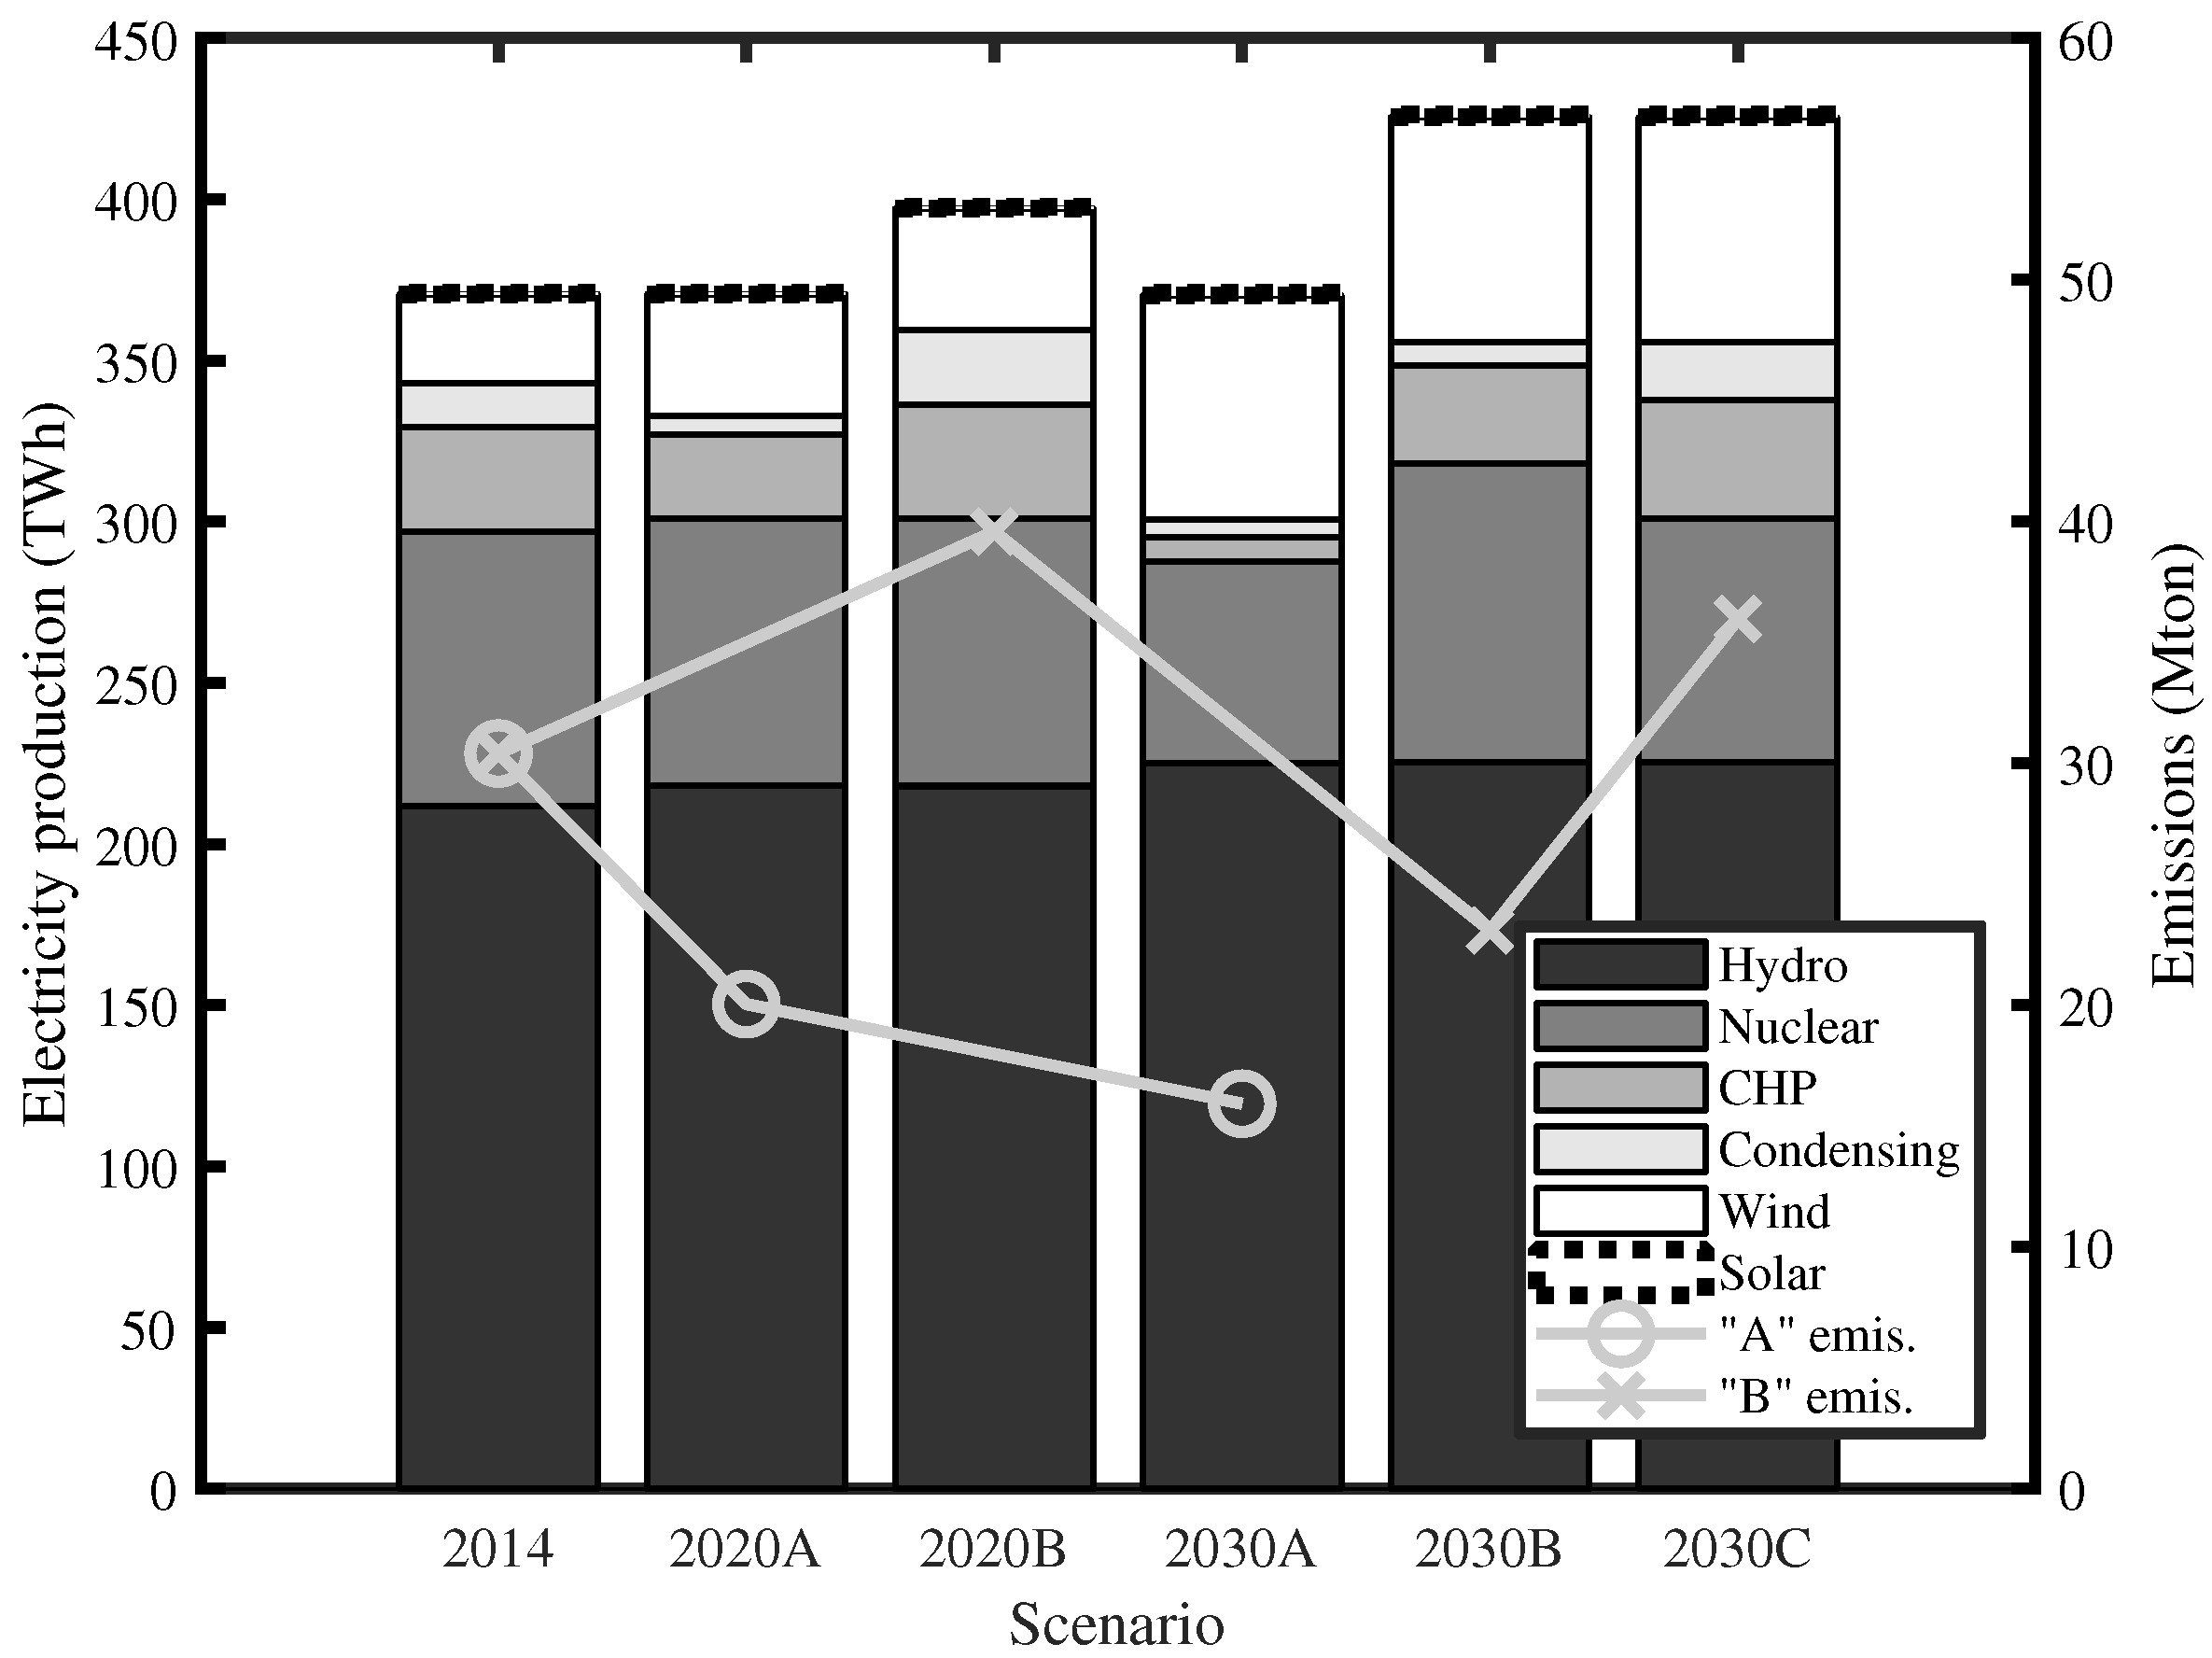
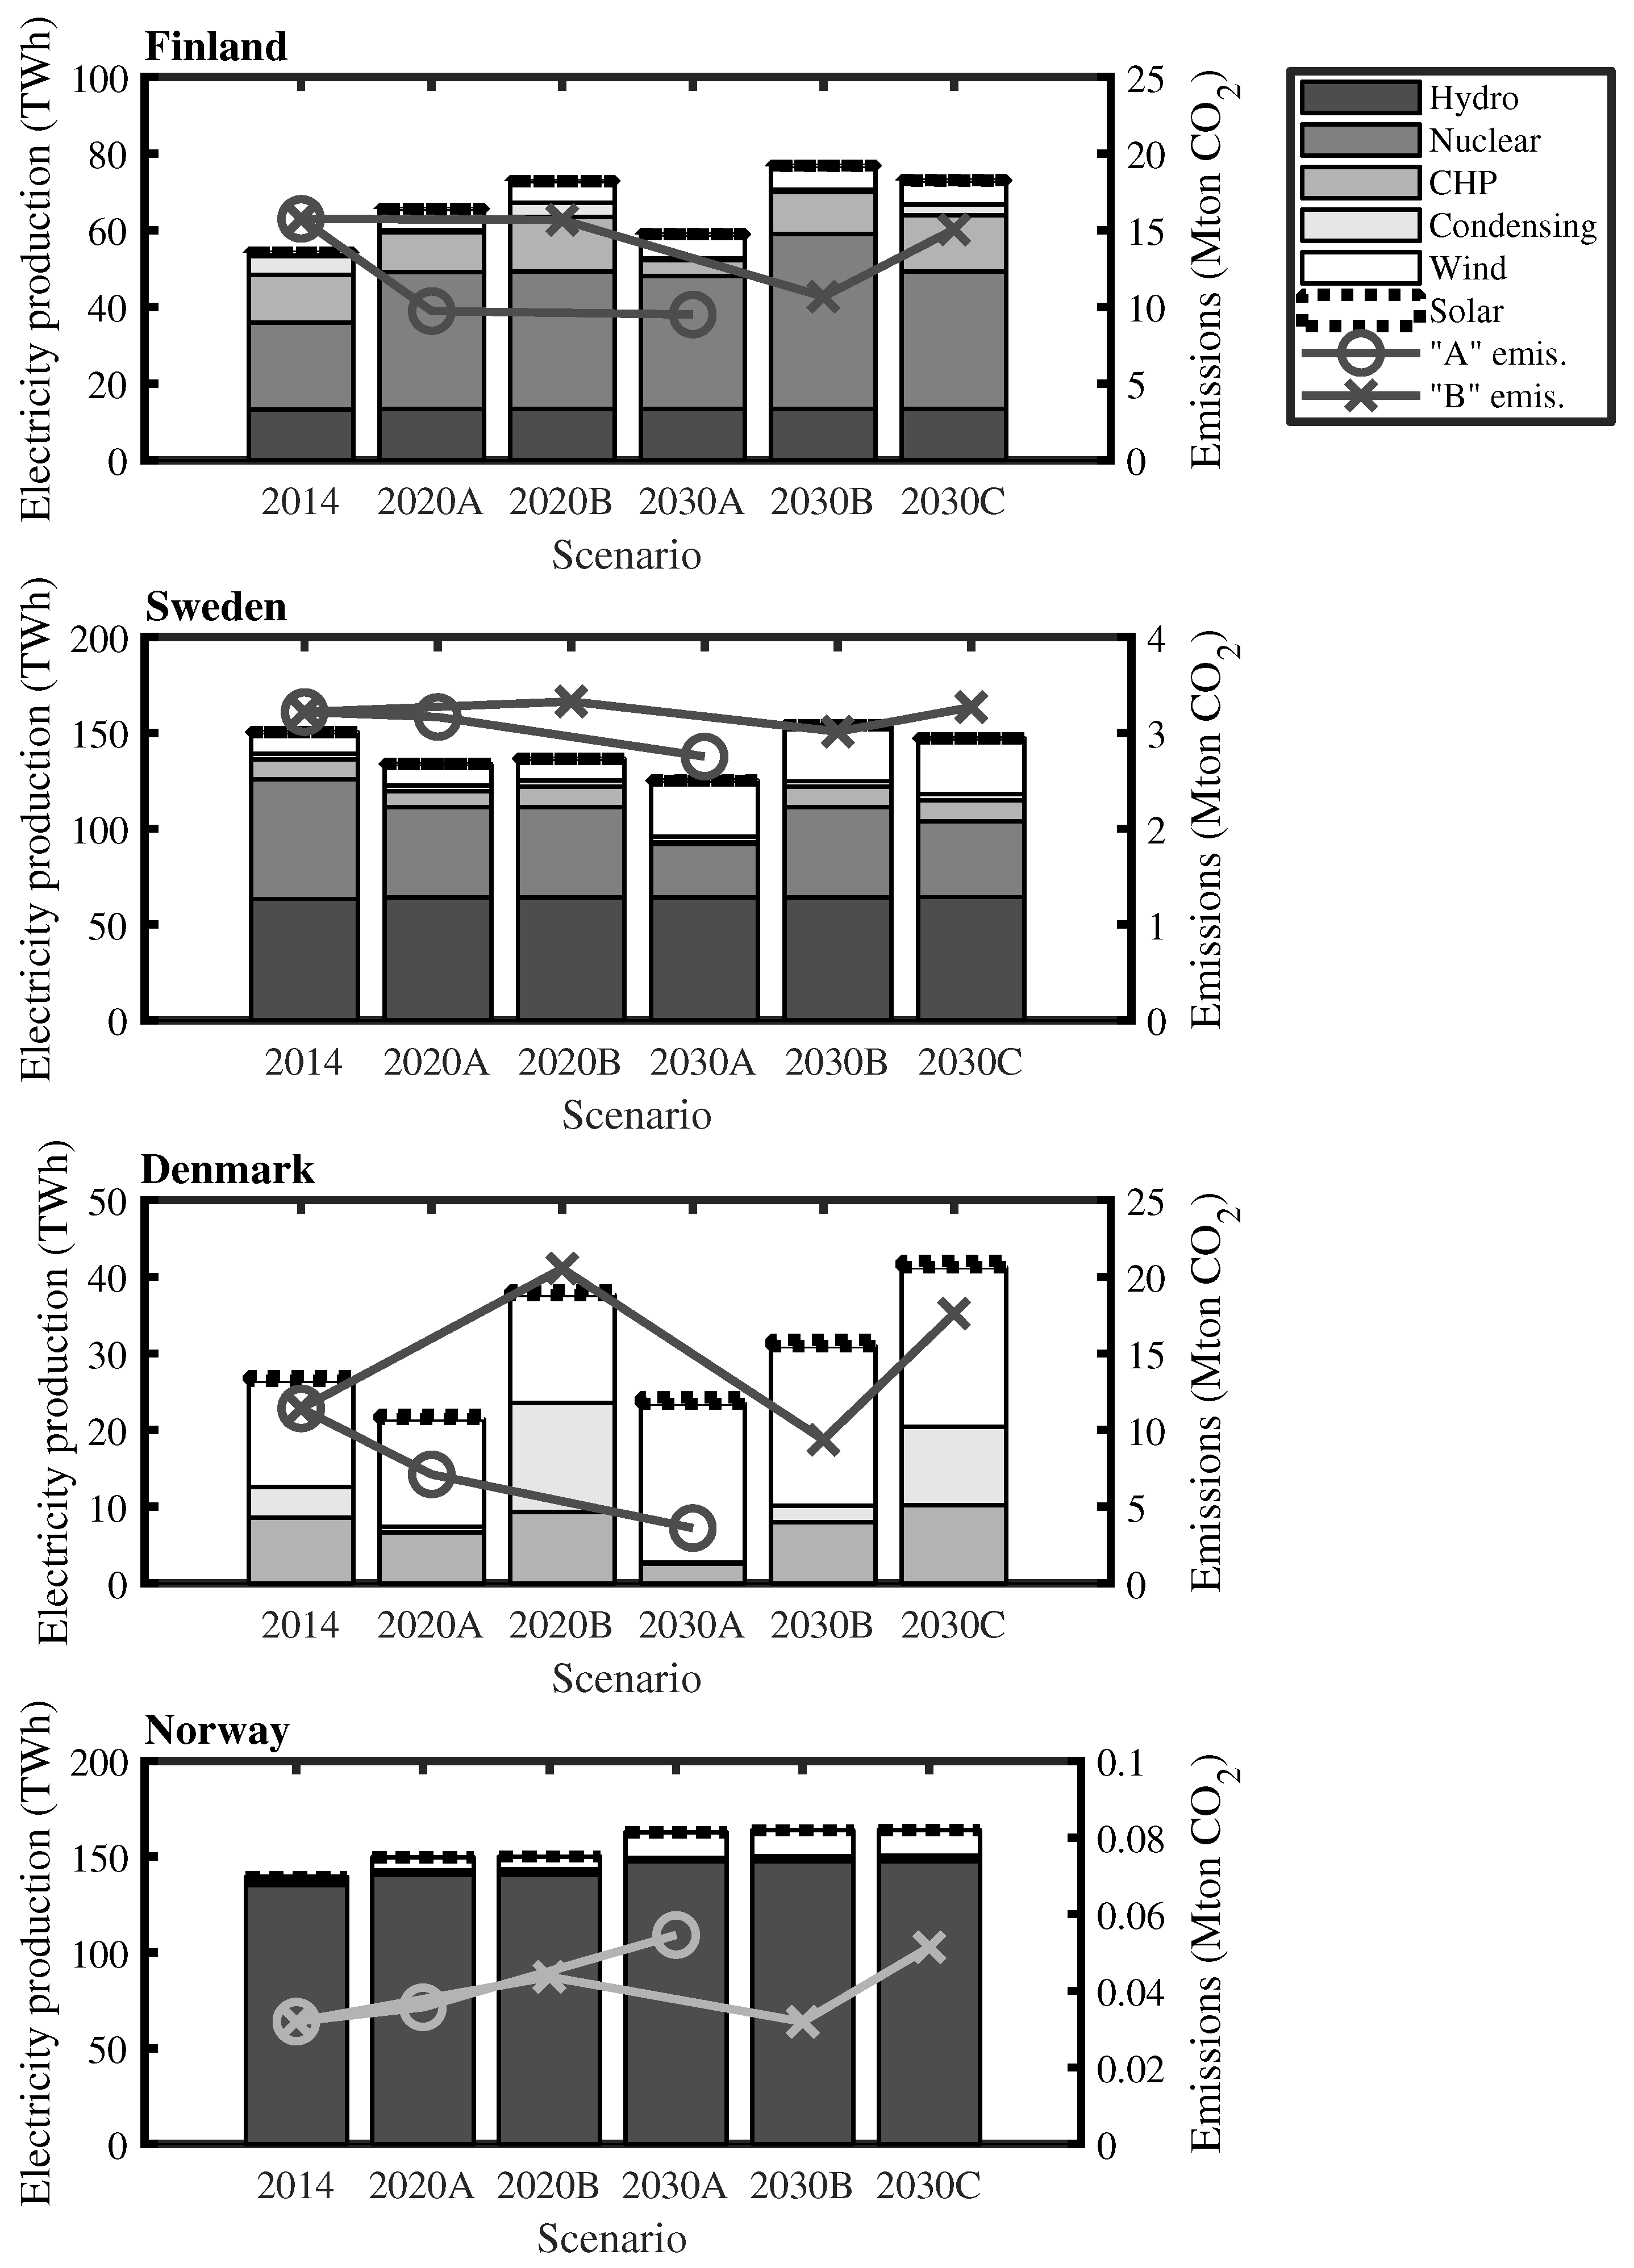
The total electricity production in the scenarios is summarised in Figure 6. In the figure, a simple estimation of yearly emissions is also shown from the production of DH and electricity, including HOB production. The emissions are shown separately for two different paths to illustrate the differences between the “A” and “B” scenarios. The emissions in the “A” scenarios with a stalling electricity consumption are consistently smaller than in 2014. In the “B” scenarios, the emissions increase between 2014 and 2020, but decrease again before 2030, despite the increase in electricity demand. This same dynamic can be seen by following the combined height of the bars of CHP and condensing production. In Scenarios 2030B and 2030C, wind production covers a large part of the demand increase from Scenario 2014. The corresponding figure to Figure 6 for each of the four countries separately is presented in the Appendix in Figure A1 for more detailed insight.
The changes across the scenarios have a large impact on the utilisation of CHP power production. In Table 8 the produced amounts of heat following CHP production in each country is presented. The last row, sold share, is the sum of the heat following CHP production divided by the production offered to the market, sold or not. The sold share decreases from Scenario 2014 level in 2020A, and further in 2030A. In 2020B the production increases noticeably from 2014, decreasing to below the 2014 level in 2030B. In 2030C, CHP production is somewhat higher than in 2020B.
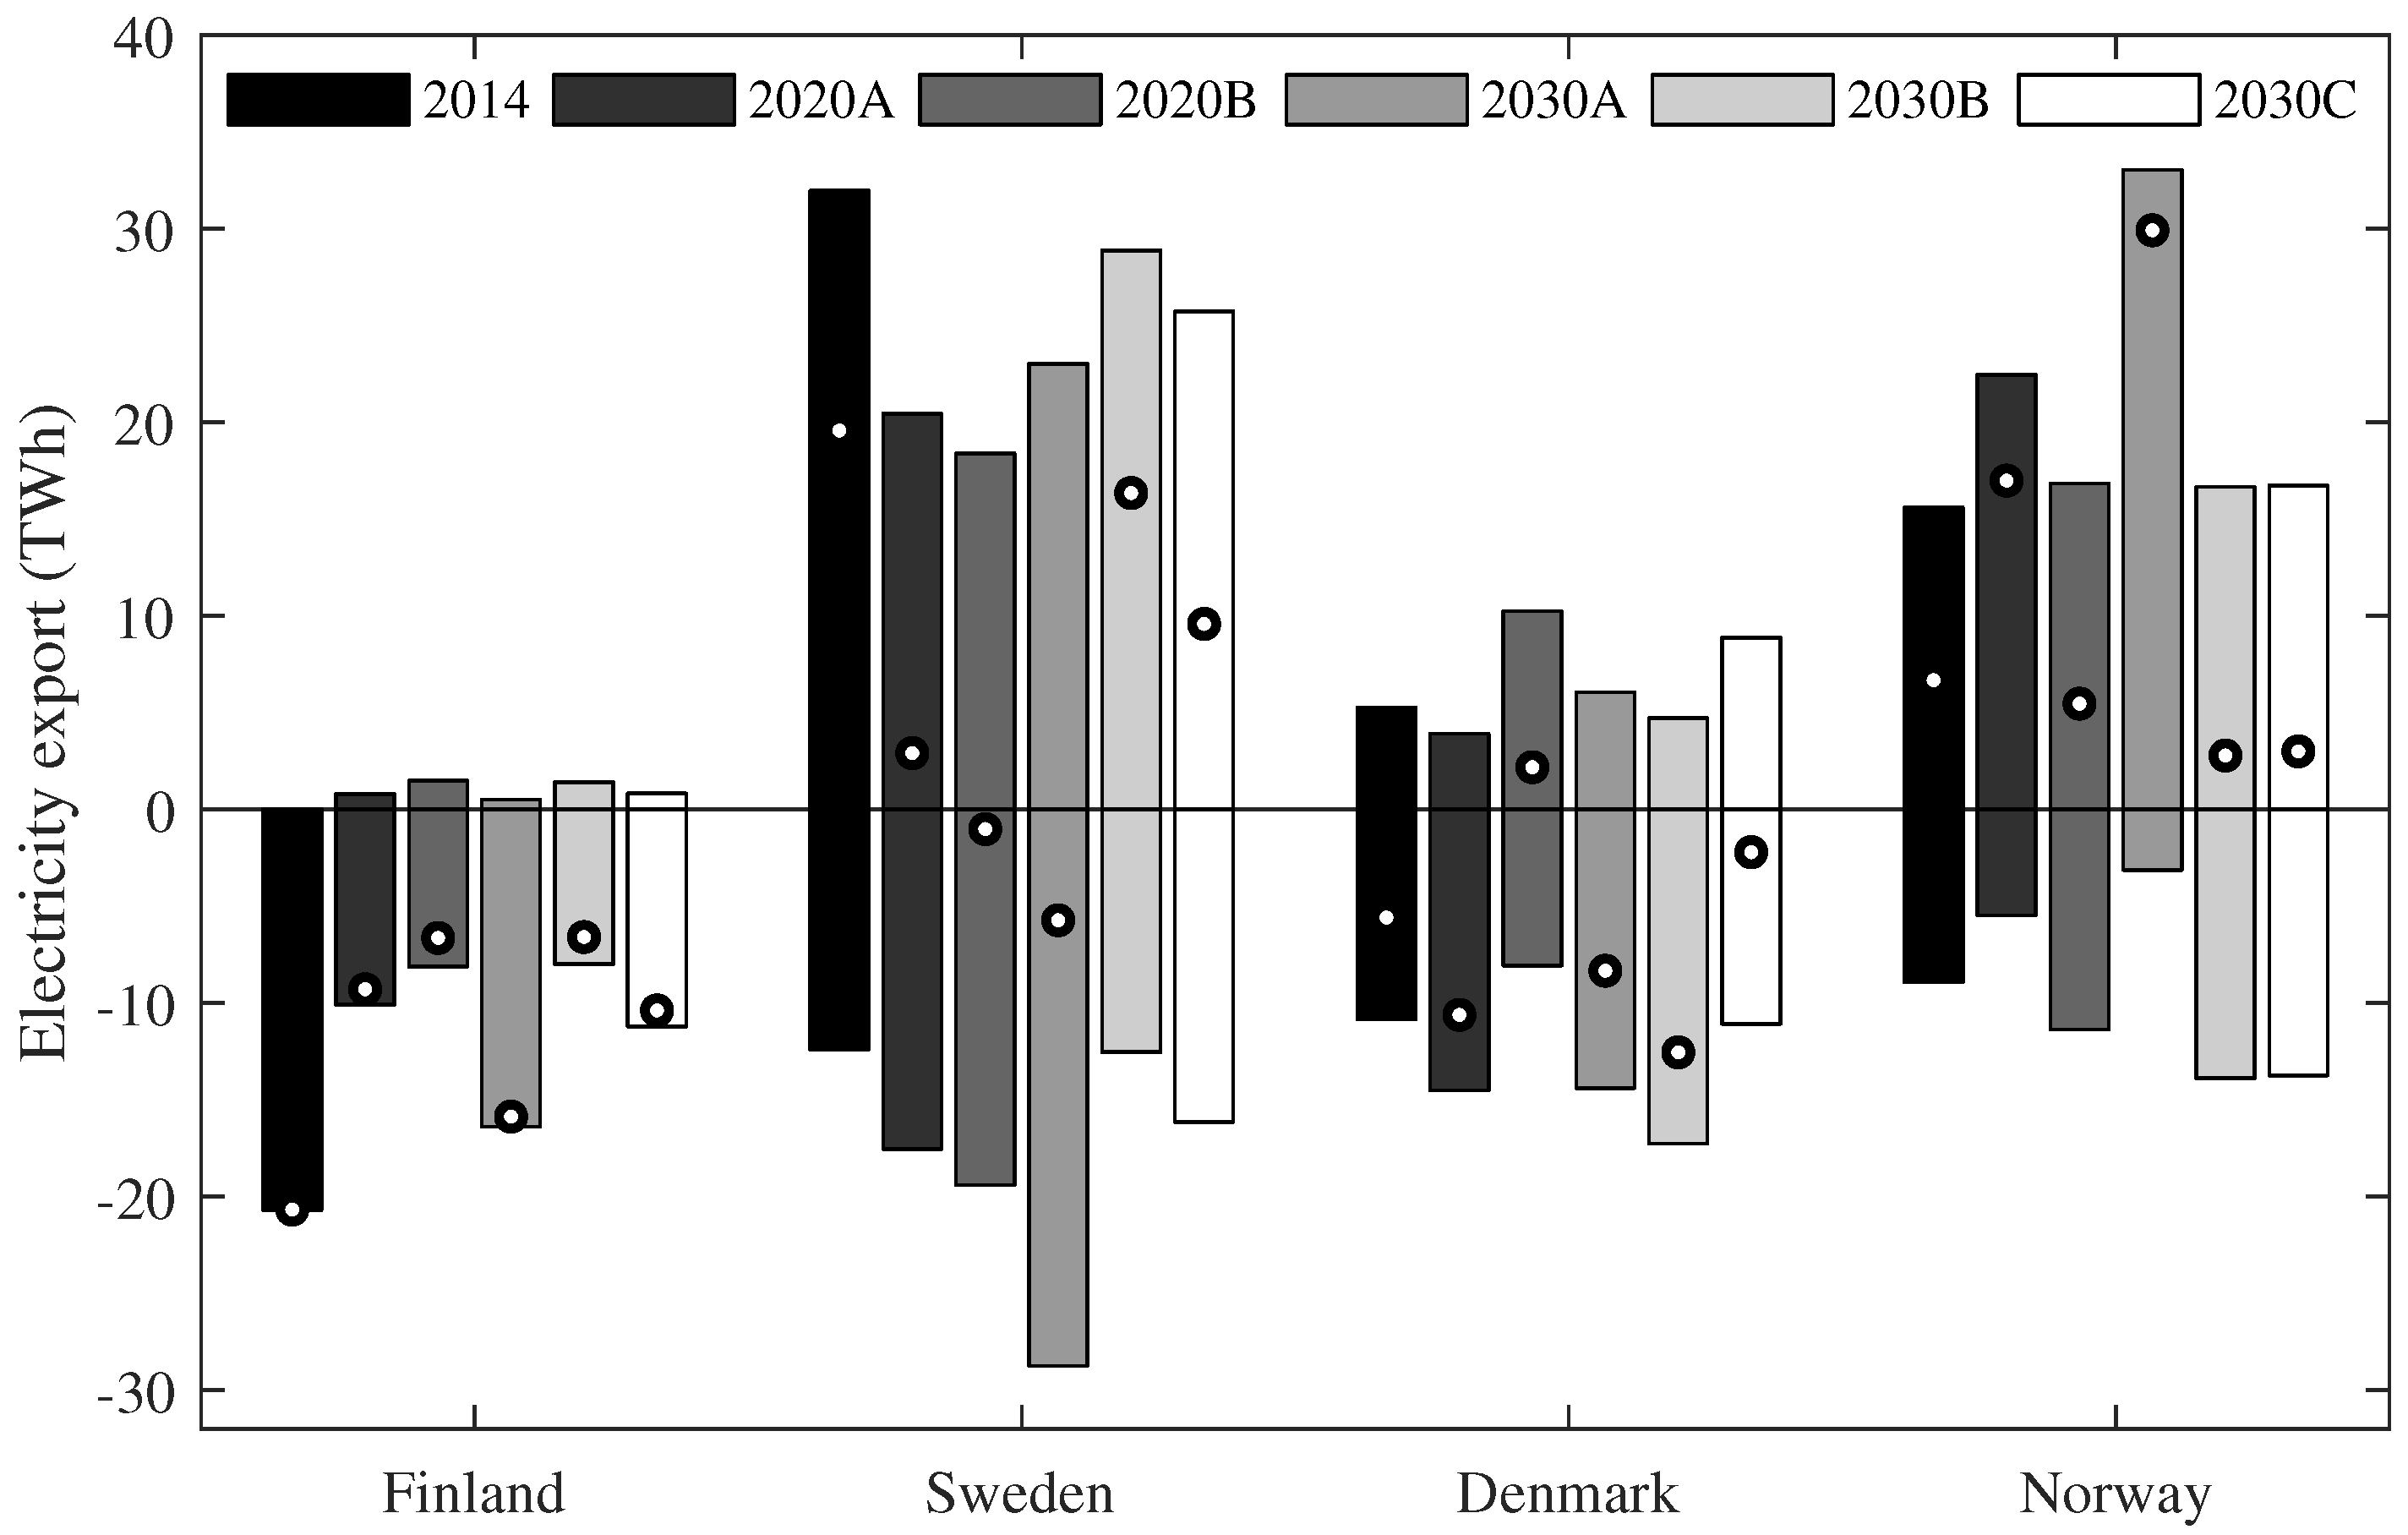
The imports and exports between the Nordic countries in each scenario are shown in Figure 7. The net export is indicated by a white circle. The net importer/exporter status of Sweden varies significantly between the scenarios. Other countries’ status is mostly stable over the scenarios.
We make a sensitivity analysis with the model by considering Scenario 2030B with CO2 emission prices of 30 and 50 €/tCO2, the original being 20 €/tCO2. Some key values of the results in the three scenarios are presented in Table 9. The system price increases with the increase of the emission price, and there is also a total CO2 emission reduction of 2.7 Mt between Scenario 2030B with the lowest and highest emission price.
6. Discussion
The model runs for the years 2014 and 2015 showed a realistic representation of the operation of the electricity market. For 2015 the real and modelled price profiles differed noticeably. This is most likely due to the low-priced third quarter of the year (see Table 6), where both the real and modelled system prices often went below the modelled marginal price of nuclear power. Modelling situations like this is difficult, because producers may respond to them in several alternative ways, such as by running on financial deficit for short periods of time to avoid shutdowns.
The development of electricity demand is critical for the stability and price level of the Nordic power market. Comparing our scenarios in the “A” and “B” futures, we see that they capture a wide range of price levels. In the “A” future, the price level decreased consistently, being 31, 25, and 10 €/MWh in scenarios of 2014, 2020 and 2030, respectively. Such a steep price decrease would without doubt be detrimental to the competitive operation of the Nordic energy-only market. On the other hand, the existing market would most probably adapt, causing some level of price increase.
With respect to DH, adaptation of the electricity market to very low prices would mean increased individual heat production with heat pumps and electricity. Additionally, heat pumps and HOBs in DH systems would become relatively more profitable, while CHP plants would lose profitability and eventually be retired. The quantitative effects of these and other adaptations of the heating and electricity markets are not known. For DH, changes will most likely take a long time to be realised.
In the “B” future, the average price increased to 40 €/MWh in 2020, which is a promising direction for CHP plants, but decreased to 33 €/MWh in 2030. Even though a price increase is indicated, either price level may not be sufficient for long term investment in all CHP plants [22]. However, the price level may increase due to unmodelled adaptation such as decommissioning of unprofitable plants. The modelled price levels should be reviewed with the knowledge that in 2010–2013 the highest yearly average price on the Nordpool Spot market was 53 €/MWh and the lowest was 31 €/MWh [23].
The utilisation of CHP in the scenarios is consistent with the price level of the scenario, in the sense that production is high in scenarios with a high system price level, which is expected due to the relatively high marginal price of CHP both as heat-following and as condensing production.
In Scenario 2030C we modified Scenario 2030B to assess a low-nuclear situation. The results suggest that the unused capacity of CHP (in Scenario 2030B) would be able to cover the lost nuclear power production. The average system price in the scenario was 51 €/MWh.
The difference between the Scenarios 2030B and 2030C is qualitatively analogous to any decrease (or increase, the other way around) of electricity production capacity with a low marginal price, be it VRE or nuclear, or something else. Thus, comparing the two mentioned scenarios helps in estimating effects of comparable changes to other scenarios. Such variations could be for example a lower wind power capacity or a higher run-of-river hydro power capacity.
The imports and exports between the Nordic countries varied notably between the scenarios. The smallest differences appeared for Denmark and Finland, which were indicated to remain as net importers in almost all scenarios. The low electricity demand scenarios seem to especially boost the (low priced) exports of Norway.
A sensitivity analysis with two alternative emission prices was conducted with Scenario 2030B. In this scenario, CHP is the technology with the highest marginal price. The emission price increase caused merit order changes between the CHP fuels, resulting in fuel distribution changes towards lower total emissions. Especially biomass CHP gained a lower price relative to other fuels.
7. Conclusions
The Nordic electricity market was analysed in this paper in the years 2014, 2020 and 2030 to assess the expected role of DH CHP in different scenarios. A total of five future scenarios were presented, differing in electricity demand and in nuclear capacity.
Our results indicate that if the projected capacity increases happen while electricity demand stalls (the “A” future), the system price of 2030 will be very low, around 10 €/MWh (25 €/MWh in 2020). This price level would be unsustainable for any investment in electricity production, including CHP. Developments leading to such prices would most likely be balanced well before 2030 with increased electricity demand, decreased production capacity, or political measures. In any case, the key message is that the total electricity production capacity would be oversized for the demand, and CHP capacity could diminish notably.
If the projected capacity changes happen along with nationally estimated increases in electricity demand (the “B” future), the model results indicate that the system price level of 2030 is around the 2014 price level. The price level peaks at 40 €/MWh in 2020, returning to just above the 2014 level in 2030 (2014: 31 €/MWh, 2030: 33 €/MWh). This price level may indicate potential to maintain the current Nordic electricity market (without e.g., capacity market), considering market adaptation such as the decommissioning of some power plants and an increasing electricity consumption. In the “B” future results, utilisation of CHP is indicated to remain at the 2014 level, which is positive for DH networks that largely rely on CHP heat production.
In our low-nuclear scenario results the decreased nuclear production is replaced with heat-following and condensing mode CHP production, and the average system price increases to 51 €/MWh. This effect is also qualitatively analogous to a lower VRE capacity in 2030.
We made an analysis of the effect of emission price on the results in the 2030 scenario of the “B” future. An increase of the emission price from 20 to 50 €/tCO2 resulted in the median system price increasing from 32 to 41 €/MWh. Total CO2 emissions from electricity and DH production fell from 23 to 20 Mton CO2 at the same time, due to changes in the merit order of fuels in CHP production. This result underlines the potential role of emission trading in initialising market-based emission reductions.
The scenarios in this work should not be seen as forecasts of the future. They were chosen to represent one main path of development in electricity production capacities, and to find out how electricity demand, emission price and nuclear power capacity affect the projected system. We were especially interested in the market price of electricity and the utilisation of CHP in the scenarios. We found that the development of electricity demand is an important factor for the market, and also for the utilisation of CHP capacity.
The key take-away of this paper is that the development of electricity demand in the four Nordic countries has a marked impact on the viability of maintaining CHP capacity. A wider conclusion is that decision makers should be careful to account for energy market trends in all neighbouring countries as well as their own, when creating systems such as VRE support mechanisms. Political changes in the economic environment of different power production technologies in an energy-only market such as the Nordpool Spot can cause serious multinational consequences to current market participants.
Author Contributions
K.H. collected the required data, performed the modelling work and wrote the manuscript. B.Z. supported model development and result validation, and participated in the literature review. S.S. actively guided the modelling and writing processes. All authors contributed significantly to the design of the scenarios and the presented analyses, and to reviewing the manuscript.
Acknowledgments
This work has been completed partially with a scholarship from Fortum Foundation, with funding by the STEEM (Sustainable Transition of European Energy Markets) project of Aalto University, and by the RenewFIN project of the Academy of Finland. The contribution by Behnam Zakeri has been also supported by the RE-INVEST project “Renewable Energy Investment Strategies—A two-dimensional interconnectivity approach” funded by Innovation Fund Denmark.
Conflicts of Interest
The authors declare no conflict of interest.
Abbreviations
The following abbreviations are used in this manuscript:
| CHP | Combined heat and power |
| DH | District heating |
| HOB | Heat-only boiler |
| VRE | Variable renewable energy |
Appendix A
Figure A1.
The modelled electricity production technologies in each Nordic country separately. Electricity production technologies in each scenario are shown as bars. The marks represent the corresponding yearly CO2 emissions from the production of district heat and electricity. The lines visualise the scenarios as two paths for clarity.

References
- International Energy Agency. Nordic Energy Technology Perspectives 2016; IEA Publications: Paris, France, 2016. [Google Scholar]
- Mathiesen, B.; Lund, H.; Connolly, D.; Wenzel, H.; Østergaard, P.; Möller, B.; Nielsen, S.; Ridjan, I.; Karnøe, P.; Sperling, K.; et al. Smart Energy Systems for coherent 100% renewable energy and transport solutions. Appl. Energy 2015, 145, 139–154. [Google Scholar] [CrossRef]
- Zakeri, B.; Syri, S.; Rinne, S. Higher renewable energy integration into the existing energy system of Finland–Is there any maximum limit? Energy 2015, 92, 244–259. [Google Scholar] [CrossRef]
- Rinne, S.; Syri, S. The possibilities of combined heat and power production balancing large amounts of wind power in Finland. Energy 2015, 82, 1034–1046. [Google Scholar] [CrossRef]
- Fingrid Oyj. Electricity Market Needs Fixing—What Can We Do? 2016. Available online: https://www.fingrid.fi/globalassets/dokumentit/en/electricity-market/development-projects/fingrid-electricity-market-needs-fixing-2016-web.pdf (accessed on 22 January 2018).
- European Network of Transmission System Operators. Mid-Term Adequacy Forecast—2017 Edition. 2017. Available online: https://www.entsoe.eu/Documents/SDC%20documents/MAF/MAF_2017_report_for_consultation.pdf (accessed on 7 November 2017).
- Nordic Transmission System Operators. Challenges and Opportunities for the Nordic Power System. 2016. Available online: http://www.fingrid.fi/fi/ajankohtaista/Ajankohtaista%20liitteet/Ajankohtaisten%20liitteet/2016/Report%20Challenges%20and%20Opportunities%20for%20the%20Nordic%20Power%20System.pdf (accessed on 7 October 2017).
- Rong, A.; Lahdelma, R. Role of polygeneration in sustainable energy system development challenges and opportunities from optimization viewpoints. Renew. Sustain. Energy Rev. 2016, 53, 363–372. [Google Scholar] [CrossRef]
- Kumbartzky, N.; Schacht, M.; Schulz, K.; Werners, B. Optimal operation of a CHP plant participating in the German electricity balancing and day-ahead spot market. Eur. J. Oper. Res. 2017, 261, 390–404. [Google Scholar] [CrossRef]
- Brange, L.; Englund, J.; Lauenburg, P. Prosumers in district heating networks—A Swedish case study. Appl. Energy 2016, 164, 492–500. [Google Scholar] [CrossRef]
- Gils, H.C. Balancing of intermittent renewable power generation by demand response and thermal energy storage. 2015. Available online: https://elib.uni-stuttgart.de/handle/11682/6905 (accessed on 18 March 2018).
- Statistics Finland. Official Statistics of Finland. Available online: http://www.stat.fi/til/index_en.html (accessed on 20 June 2017).
- Statistics Sweden. Annual Energy Statistics. Available online: http://www.statistikdatabasen.scb.se/pxweb/en/ssd/START__EN__EN0105/ElProdAr (accessed on 22 January 2018).
- Danish Energy Agency. Energy Statistics 2015. Available online: https://ens.dk/sites/ens.dk/files/Statistik/energy_statistics_2015.pdf (accessed on 22 January 2018).
- Statistics Norway. Statistics Norway—Electricity. Available online: https://www.ssb.no/en/energi-og-industri/statistikker/elektrisitet/aar/ (accessed on 22 January 2018).
- Statistics Sweden. Sveriges Officiella Statistik: Statistiska Meddelanden (Official Statistics of Sweden: Statistical Communication). Available online: https://www.scb.se/contentassets/32c099cd9dab4db8999acc5e4401c871/en0105_2016a01_sm_en11sm1701.pdf (accessed on 26 March 2018).
- Statistics Norway. Production and Consumption of Energy, Energy Balance, 2014–2015, Final Figures. Available online: https://www.ssb.no/en/energi-og-industri/statistikker/energibalanse/aar-endelige/2016-10-18?fane=tabell&sort=nummer&tabell=280916 (accessed on 26 March 2018).
- Bergman, L.; von der Fehr, N.H. The Nordic experience: Diluting market power by integrating markets. In A European Market for Electricity? Vaitilingam, R., Ed.; Centre for Economic Policy Research: London, UK, 2000; Chapter 7; pp. 116–146. [Google Scholar]
- Amundsen, E.S.; Bergman, L. Why has the Nordic electricity market worked so well? Util. Policy 2006, 14, 148–157. [Google Scholar] [CrossRef]
- Finnish Ministry of Economic Affairs and Employment. Taustaraportti Kansalliselle Energia-ja Ilmastostrategialle Vuoteen 2030 (Background Report for the National Energy and Climate Strategy Until Year 2030). 2017. Available online: http://tem.fi/strategia2016 (accessed on 19 Septemper 2017).
- Statnett. Long-Term Market Analysis–The Nordic Region and Europe 2016–2040. 2016. Available online: http://www.statnett.no/Documents/Nyheter_og_media/Nyhetsarkiv/2016/Long-term%20Market%20Analysis%20The%20Nordic%20Region%20and%20Europe%202016-2040.pdf (accessed on 15 Septemper 2017).
- VTT. The Capacity Question in European Power Markets 2035. 2015. Available online: http://sgemfinalreport.fi/files/SGEM-7.2-2015-Final.pdf (accessed on 6 March 2017).
- Nord Pool. Market Data. Available online: http://nordpoolspot.com/Market-data1 (accessed on 14 Septemper 2017).
- Nasdaq. Market Prices. Available online: http://www.nasdaqomx.com/commodities/market-prices (accessed on 23 March 2018).
- Fortum. Building an Efficient Nordic Power Market; Fortum: Espoo, Finland, 2016. [Google Scholar]
- Würzburg, K.; Labandeira, X.; Linares, P. Renewable generation and electricity prices: Taking stock and new evidence for Germany and Austria. Energy Econ. 2013, 40, S159–S171. [Google Scholar] [CrossRef]
- Sensfuß, F.; Ragwitz, M.; Genoese, M. The merit-order effect: A detailed analysis of the price effect of renewable electricity generation on spot market prices in Germany. Energy Policy 2008, 36, 3086–3094. [Google Scholar] [CrossRef]
- Ballester, C.; Furió, D. Effects of renewables on the stylized facts of electricity prices. Renew. Sustain. Energy Rev. 2015, 52, 1596–1609. [Google Scholar] [CrossRef]
- Ketterer, J.C. The impact of wind power generation on the electricity price in Germany. Energy Econ. 2014, 44, 270–280. [Google Scholar] [CrossRef]
- NordREG. Nordic Market Report 2014—Development in the Nordic Electricity Market. 2014. Available online: http://www.nordicenergyregulators.org/wp-content/uploads/2014/06/Nordic-Market-Report-2014.pdf (accessed on 18 March 2018).
- Kallabis, T.; Pape, C.; Weber, C. The plunge in German electricity futures prices—Analysis using a parsimonious fundamental model. Energy Policy 2016, 95, 280–290. [Google Scholar] [CrossRef]
- VTT. Future Development Trends in Electricity Demand. 2009. Available online: http://www.vtt.fi/inf/pdf/tiedotteet/2009/T2470.pdf (accessed on 31 January 2018).
- Child, M.; Breyer, C. Vision and initial feasibility analysis of a recarbonised Finnish energy system for 2050. Renew. Sustain. Energy Rev. 2016, 66, 517–536. [Google Scholar] [CrossRef]
- Gils, H.C.; Scholz, Y.; Pregger, T.; de Tena, D.L.; Heide, D. Integrated modelling of variable renewable energy-based power supply in Europe. Energy 2017, 123, 173–188. [Google Scholar] [CrossRef]
- Seljom, P.; Tomasgard, A. The impact of policy actions and future energy prices on the cost-optimal development of the energy system in Norway and Sweden. Energy Policy 2017, 106, 85–102. [Google Scholar] [CrossRef]
- Sørensen, P.; Norheim, I.; Meibom, P.; Uhlen, K. Simulations of wind power integration with complementary power system planning tools. Electr. Power Syst. Res. 2008, 78, 1069–1079. [Google Scholar] [CrossRef]
- Kirkerud, J.G.; Trømborg, E.; Bolkesjø, T.F.; Tveten, Å.G. Modeling the Power Market Impacts of Different Scenarios for the Long Term Development of the Heat Sector. Energy Procedia 2014, 58, 145–151. [Google Scholar] [CrossRef] [Green Version]
- SINTEF. EMPS–Multi Area Power-Market Simulator. 2017. Available online: https://www.sintef.no/en/software/emps-multi-area-power-market-simulator/ (accessed on 18 October 2017).
- Energy Exemplar. PLEXOS Integrated Energy Model. 2017. Available online: https://energyexemplar.com/software/plexos-desktop-edition/ (accessed on 18 October 2017).
- Birkedal, M.; Bolkesjø, T.F. Determinants of Regulated Hydropower Supply in Norway. Energy Procedia 2016, 87, 11–18. [Google Scholar] [CrossRef]
- Sandsmark, M.; Tennbakk, B. Ex post monitoring of market power in hydro dominated electricity markets. Energy Policy 2010, 38, 1500–1509. [Google Scholar] [CrossRef]
- Kopsakangas-Savolainen, M.; Svento, R. Hydropower Production Profiles: Impacts on Capacity Structure, Emissions, and Windfall Profits. J. Energy 2014, 2014. [Google Scholar] [CrossRef]
- Zakeri, B.; Virasjoki, V.; Syri, S.; Connolly, D.; Mathiesen, B.V.; Welsch, M. Impact of Germany’s energy transition on the Nordic power market—A market-based multi-region energy system model. Energy 2016, 115, 1640–1662. [Google Scholar] [CrossRef]
- Danish Energy Agency. Basisfremskrivning 2017 (Basic Projection 2017). 2017. Available online: https://ens.dk/service/fremskrivninger-analyser-modeller/basisshyfremskrivninger (accessed on 19 September 2017).
- Norwegian Ministry of Petroleum and Energy. Kraft til Endring–Energipolitikken mot 2030 (Power for Change –Energy Policy Towards 2030). 2016. Available online: https://www.regjeringen.no/no/dokumenter/meld.-st.-25-20152016/id2482952/ (accessed on 19 September 2017).
- Swedish Energy Agency. Scenarier över Sveriges Energisystem 2016 (Scenarios of the Energy System of Sweden 2016). 2017. Available online: https://energimyndigheten.a-w2m.se/FolderContents.mvc/Download?ResourceId=5636 (accessed on 19 September 2017).
- Fingrid Oyj. Cross-Border Capacity Upgrade between Finland and Sweden [press release]. 2016. Available online: http://www.fingrid.fi/en/news/announcements/Pages/Cross-border-capacity-upgrade-between-Finland-and-Sweden.aspx (accessed on 14 September 2017).
- Svensk Energi. Elåret & Verksamheten 2013 (Electricity Year and Business 2013). Available online: http://www.svenskenergi.se/Global/Statistik/El%C3%A5ret/Sv%20Energi_el%C3%A5ret2013_versJUNI2014.pdf (accessed on 22 June 2017).
- Danish Energy Agency. Energy Statistics 2014. Available online: https://ens.dk/sites/ens.dk/files/Statistik/energystatistics2014.pdf (accessed on 7 June 2017).
- Statistics Norway. Statistics Norway. Available online: https://www.ssb.no/en/ (accessed on 22 June 2017).
- European Network of Transmission System Operators. ENTSO-E Transparency Platform. 2017. Available online: https://transparency.entsoe.eu/generation/r2/installedCapacityPerProductionUnit/show (accessed on 15 May 2017).
- Energy Authority of Finland. Voimalaitosrekisteri (Power Plant Registry). Available online: https://www.energiavirasto.fi/en/voimalaitosrekisteri (accessed on 23 February 2017).
- World Energy Council. Hydropower in Sweden. Available online: https://www.worldenergy.org/data/resources/country/{S}weden/hydropower/ (accessed on 22 June 2017).
- European Commission. National Action Plans. Available online: https://ec.europa.eu/energy/en/topics/renewable-energy/national-action-plans (accessed on 8 June 2017).
- World Nuclear Association. Nuclear Power in Finland. 2017. Available online: http://www.world-nuclear.org/information-library/country-profiles/countries-a-f/finland.aspx (accessed on 23 January 2018).
- World Nuclear Association. Nuclear Power in Sweden. 2017. Available online: http://www.world-nuclear.org/information-library/country-profiles/countries-o-s/sweden.aspx (accessed on 23 January 2017).
- International Renewable Energy Agency. Renewable Capacity Statistics 2016. 2016. Available online: http://www.irena.org/DocumentDownloads/Publications/IRENA_RE_Capacity_Statistics_2016.pdf (accessed on 9 June 2017).
- Swedish Energy Authority. Energiläget i Siffror 2016 (Energy Situation in Numbers 2016). 2016. Available online: http://www.energimyndigheten.se/nyhetsarkiv/2016/nu-finns-energilaget-i-siffror-2016/ (accessed on 6 June 2017).
- Norsk Solenergiforening. Solar Energy Use and Regulations in Norway. 2015. Available online: http://solenergi.no/wp-content/uploads/2015/08/Solar-energy-use-and-regulations-in-norway-IEA-SHC.pdf (accessed on 7 June 2017).
- European Network of Transmission System Operators. TYNDP 2016 Scenario Development Report–For public Consultation. 2015. Available online: https://www.entsoe.eu/Documents/TYNDP%20documents/TYNDP%202016/150521_TYNDP2016_Scenario_Development_Report_for_consultationv2.pdf (accessed on 7 June 2017).
- Motiva. Polttoaineiden Lämpöarvot, Hyötysuhteet ja Hiilidioksidin Ominaispäästökertoimet sekä Energian Hinnat (The Heating Values, Efficiencies and Carbon Dioxide Emissions of Fuels and Prices of Energy). 2010. Available online: https://www.motiva.fi/files/3193/Polttoaineiden_lampoarvot_hyotysuhteet_ja_hiilidioksidin_ominaispaastokertoimet_seka_energianhinnat_19042010.pdf (accessed on 8 June 2017).
- VTT. Yhdistetyn Sähkön-ja Lämmöntuotannon Hiilidioksidiveron Puolituksen Poiston Vaikutukset (The Effects of the Removal of the Halving of the Carbon Dioxide Tax in Combined Heat and Power Production). 2016. Available online: https://tem.fi/documents/1410877/2772829/VTT+Yhdistetyn+s%C3%A4hk%C3%B6n-+ja+l%C3%A4mm%C3%B6ntuotannon+hiilidioksidiveron+puolituksen+poiston+vaikutukset+.pdf/ (accessed on 8 June 2017).
Figure 1.
Electricity and district heat production by technology in the four Nordic countries in 2015 [12,13,14,15,16,17].

Figure 2.
A schematic visualisation of the process of creating a marginal price profile of hydro production for one country. (a) base price; (b) division into segments; (c) price profile applied; (d) price level adjusted iteratively
Figure 2.
A schematic visualisation of the process of creating a marginal price profile of hydro production for one country. (a) base price; (b) division into segments; (c) price profile applied; (d) price level adjusted iteratively

Figure 3.
Modelled and realised yearly electricity production in 2014. The bars and stems represent modelled and actual prodution, respectively.
Figure 3.
Modelled and realised yearly electricity production in 2014. The bars and stems represent modelled and actual prodution, respectively.

Figure 4.
Modelled and realised yearly electricity production in 2015. The bars and stems represent modelled and actual prodution, respectively.
Figure 4.
Modelled and realised yearly electricity production in 2015. The bars and stems represent modelled and actual prodution, respectively.

Figure 5.
Modelled quarterly median system price of electricity in different scenarios. The vertical ticked lines represent the variability (the 25th and 75th percentiles) of the prices during each quarter.
Figure 5.
Modelled quarterly median system price of electricity in different scenarios. The vertical ticked lines represent the variability (the 25th and 75th percentiles) of the prices during each quarter.

Figure 6.
The modelled electricity production technologies in the Nordic countries in each scenario are shown as bars. The marks represent the corresponding yearly CO2 emissions from the production of district heat and electricity. The lines visualise the scenarios as two paths for clarity.
Figure 6.
The modelled electricity production technologies in the Nordic countries in each scenario are shown as bars. The marks represent the corresponding yearly CO2 emissions from the production of district heat and electricity. The lines visualise the scenarios as two paths for clarity.

Figure 7.
The total exports (positive) and imports (negative) between the Nordic countries in the modelled scenarios. The total net export for each case is indicated by a white circle.
Figure 7.
The total exports (positive) and imports (negative) between the Nordic countries in the modelled scenarios. The total net export for each case is indicated by a white circle.


Table 1.
Electricity demand estimates for the scenarios. The percentage in parentheses is the increase relative to 2014.
Table 1.
Electricity demand estimates for the scenarios. The percentage in parentheses is the increase relative to 2014.
| TWh | 2014 | 2020A 2030A | 2020B | 2030B 2030C |
|---|---|---|---|---|
| Finland | 83 | 83 | 88 (+6%) | 92 (+11%) |
| Sweden | 134 | 134 | 141 (+5%) | 141 (+5%) |
| Denmark | 34 | 34 | 36 (+6%) | 44 (+29%) |
| Norway | 126 | 126 | 128 (+2%) | 143 (+13%) |
Table 2.
Estimated district heating CHP electric capacities. In parentheses is the share of small plants (under 100 MW) of the shown total capacity. Data is based on [43,51]. The underlying division of small plant capacity by fuel is an estimation of the authors.
| MW | Finland | Sweden | Denmark | Norway | ||||
|---|---|---|---|---|---|---|---|---|
| Coal | 1596 | (0%) | 264 | (56%) | 3849 | (0%) | 0 | |
| Gas | 1051 | (14%) | 186 | (91%) | 2025 | (78%) | 551 | (43%) |
| Peat | 997 | (45%) | 126 | (13%) | 0 | 0 | ||
| Waste | 107 | (100%) | 251 | (92%) | 279 | (70%) | 85 | (82%) |
| Biomass | 167 | (100%) | 2070 | (76%) | 834 | (38%) | 0 | |
| Oil | 3 | (100%) | 783 | (42%) | 47 | (75%) | 12 | (83%) |
Table 3.
Hydro power increases per scenario year in megawatts (increase from previous).
| Country | 2014 | 2015 | 2020 | 2030 |
|---|---|---|---|---|
| Finland | 3125 | +28 | +0 | +0 |
| Sweden | 16,150 | +5 | +205 | +0 |
| Denmark | 9 | +0 | +1 | +0 |
| Norway | 31,033 | +207 | +1067 | +1526 |
| Total | 50,317 | +240 | +1273 | +1526 |
Table 4.
The marginal prices of electricity used in the model for 2014. The CHP prices are those prices at which a MWh of heat is more economically produced by CHP than by heat-only boiler with the same fuel, considering the revenue from electricity sales. Hydro price is the average for the modelling period. Marginal prices excepting hydro power and CHP are based on data in [43].
| €/MWh | Finland | Sweden | Denmark | Norway |
|---|---|---|---|---|
| CHP | ||||
| Coal | 0 | 0 | 20 | 16 |
| Gas | 34 | 16 | 41 | 41 |
| Peat | 23 | 18 | - | 23 |
| Waste | 20 | 20 | 20 | 20 |
| Biomass | 12 | 25 | 6 | 30 |
| Oil | 89 | 58 | 155 | 104 |
| Condensing | ||||
| Coal | 34 | 34 | 34 | 34 |
| Gas | 76 | 76 | 76 | 76 |
| Peat | 59 | 59 | - | - |
| Waste | 6 | 6 | 6 | 6 |
| Biomass | 65 | 65 | 65 | 65 |
| Oil | 92 | 92 | 92 | 92 |
| Wind | 0.6 | 0.6 | 1.1 | 0.6 |
| Solar | 0.1 | 0.1 | 0.1 | 0.1 |
| Hydro | 31 | 27 | 0 | 27 |
| Nuclear | 9 | 9 | - | - |
Table 5.
The basis for the marginal price of CHP electricity production in Finland in 2014. The marginal price is that price at which a MWh of heat is more economically produced by CHP than by heat-only boiler (HOB) with the same fuel, considering the revenue from electricity sales. Emission factors are from [61], other data adapted from [62]. MP = marginal price
| Fuel | Coal | Gas | Peat | Biomass | Oil | |||||
|---|---|---|---|---|---|---|---|---|---|---|
| CHP | HOB | CHP | HOB | CHP | HOB | CHP | HOB | CHP | HOB | |
| Fuel consumption 1 | 1.8 | 1.1 | 2.5 | 1.1 | 1.8 | 1.1 | 1.8 | 1.1 | 3.6 | 1.1 |
| Elec. efficiency (%) | 30 | 0 | 48 | 0 | 28 | 0 | 28 | 0 | 22 | 0 |
| Total efficiency (%) | 86 | 90 | 88 | 90 | 84 | 90 | 84 | 90 | 50 | 90 |
| Fuel cost 2 | 9 | 9 | 33 | 33 | 14 | 14 | 21 | 21 | 30 | 30 |
| Emissions (kg/kWh) | 0.34 | 0.34 | 0.20 | 0.20 | 0.38 | 0.38 | 0 | 0 | 0.28 | 0.28 |
| Fuel tax 1 | 16 | 28 | 11 | 19.5 | 1.9 | 1.9 | 0 | 0 | 13 | 25 |
| Other prod. costs 2 | 1.9 | 1.9 | 0.8 | 0.8 | 1.3 | 1.3 | 1.1 | 1.1 | 1.9 | 1.9 |
| Production support 3 | 0 | 0 | 0 | 0 | 0 | 0 | 18.6 | 0 | 0 | 0 |
| Heat prod. cost 1 | 38 | 42 | 99 | 58 | 33 | 21 | 31 | 25 | 132 | 62 |
| CHP MP 3 | 0 | 34 | 23 | 12 | 89 | |||||
| Revenue at MP 1 | 0 | 40 | 12 | 6 | 70 | |||||
1 (€/MWhheat); 2 (€/MWhfuel); 3 (€/MWhelectricity).
Table 6.
The means and standard deviations of the modelled and realised system prices for 2014 and 2015. The values are presented during each quarter and for the whole year separately. The standard deviation quantifies the volatility of the price, or the dispersion of the prices around the mean of the time period. The unit of all values is €/MWh.
| €/MWh | 2014 | 2015 | ||||||||
|---|---|---|---|---|---|---|---|---|---|---|
| Q1 | Q2 | Q3 | Q4 | Year | Q1 | Q2 | Q3 | Q4 | Year | |
| Modelled | ||||||||||
| Mean | 32.8 | 26.5 | 31.6 | 32.2 | 30.8 | 34.8 | 24.6 | 16 | 27.4 | 25.7 |
| Std | 4.7 | 2.3 | 2.7 | 2.8 | 4.1 | 4.2 | 5.7 | 4.5 | 4.7 | 8.3 |
| Realised | ||||||||||
| Mean | 30.2 | 25.7 | 31.9 | 30.7 | 29.6 | 28.1 | 20.5 | 13.3 | 22 | 21 |
| Std | 5.4 | 5 | 3.8 | 4.9 | 5.4 | 5.2 | 6.3 | 5.3 | 6.7 | 7.9 |
Table 7.
The power production capacity maximums that are offered to the market in the modelled scenarios.
Table 7.
The power production capacity maximums that are offered to the market in the modelled scenarios.
| GW | Hydro | Nuclear | CHP | Condensing | Wind | Solar |
|---|---|---|---|---|---|---|
| 2014 | 41.9 | 11.5 | 11.1 | 18.3 | 9.6 | 0.5 |
| 2020A | 43.3 | 11 | 11.1 | 11.2 | 13.3 | 0.5 |
| 2020B | 43.3 | 11 | 11.1 | 11.2 | 13.3 | 0.5 |
| 2030A | 44.9 | 12.2 | 11.1 | 9.2 | 25.1 | 0.8 |
| 2030B | 44.9 | 12.2 | 11.1 | 9.2 | 25.1 | 0.8 |
| 2030C | 44.9 | 10 | 11.1 | 9.2 | 25.1 | 0.8 |
Table 8.
Production of heat following CHP electricity in the scenarios per country in TWh. Sold share is the sum of the electricity produced divided by the production that was offered to the market.
Table 8.
Production of heat following CHP electricity in the scenarios per country in TWh. Sold share is the sum of the electricity produced divided by the production that was offered to the market.
| TWh | 2014 | 2020A | 2020B | 2030A | 2030B | 2030C |
|---|---|---|---|---|---|---|
| Finland | 12.5 | 10.3 | 14.2 | 4.0 | 10.9 | 14.7 |
| Sweden | 10.5 | 8.2 | 10.8 | 1.0 | 10.5 | 10.8 |
| Denmark | 8.6 | 6.7 | 9.3 | 2.5 | 8.0 | 10.2 |
| Norway | 0.9 | 0.8 | 1.1 | 0.0 | 1.0 | 1.1 |
| Nordic | 32.5 | 25.9 | 35.4 | 7.6 | 30.4 | 36.8 |
| Sold share | 83% | 66% | 91% | 19% | 78% | 94% |
Table 9.
Key results for a sensitivity analysis, where Scenario 2030B is repeated with emission prices of 20 (the original), 30 and 50 /tCO2.
Table 9.
Key results for a sensitivity analysis, where Scenario 2030B is repeated with emission prices of 20 (the original), 30 and 50 /tCO2.
| 2030B (20€) | 2030B (30€) | S2030B (50€) | |
|---|---|---|---|
| Emission price (€/tCO2) | 20 | 30 | 50 |
| Median system price (€/MWh) | 31.6 | 35.4 | 41.4 |
| Total emissions (million tonnes) | 23.1 | 22.9 | 20.4 |
| CHP production (TWh) | 30.4 | 30.3 | 30.3 |
| Condensing production (TWh) | 7.4 | 7.3 | 7.3 |
| Hydro production (TWh) | 225.2 | 225.3 | 225.3 |
| Finland net import (TWh) | 6.6 | 6.9 | 6.4 |
| Sweden net import (TWh) | −16.4 | −16.5 | −16.5 |
| Denmark net import (TWh) | 12.5 | 12.6 | 13.1 |
| Norway net import (TWh) | −2.8 | −2.9 | −2.9 |
© 2018 by the authors. Licensee MDPI, Basel, Switzerland. This article is an open access article distributed under the terms and conditions of the Creative Commons Attribution (CC BY) license (http://creativecommons.org/licenses/by/4.0/).
Share and Cite
MDPI and ACS Style
Helin, K.; Zakeri, B.; Syri, S. Is District Heating Combined Heat and Power at Risk in the Nordic Area?—An Electricity Market Perspective. Energies 2018, 11, 1256. https://doi.org/10.3390/en11051256
AMA Style
Helin K, Zakeri B, Syri S. Is District Heating Combined Heat and Power at Risk in the Nordic Area?—An Electricity Market Perspective. Energies. 2018; 11(5):1256. https://doi.org/10.3390/en11051256
Chicago/Turabian StyleHelin, Kristo, Behnam Zakeri, and Sanna Syri. 2018. "Is District Heating Combined Heat and Power at Risk in the Nordic Area?—An Electricity Market Perspective" Energies 11, no. 5: 1256. https://doi.org/10.3390/en11051256
Note that from the first issue of 2016, this journal uses article numbers instead of page numbers. See further details here.