Experimental Validation of Peer-to-Peer Distributed Voltage Control System
by
 , , , ,
Hamada Almasalma
1,2,* ,
,
Sander Claeys
1,2,
Konstantin Mikhaylov
3,
Jussi Haapola
3,
Ari Pouttu
3 and
Geert Deconinck
1,2 1
Departement Elektrotechniek, KU Leuven, Kasteelpark Arenberg 10, 3001 Leuven, Belgium
2
EnergyVille Research Center, Thor Park 8310, 3600 Genk, Belgium
3
Centre for Wireless Communications (CWC), University of Oulu, 90014 Oulu, Finland
*
Author to whom correspondence should be addressed.
Energies 2018, 11(5), 1304; https://doi.org/10.3390/en11051304
Submission received: 18 April 2018
/
Revised: 8 May 2018
/
Accepted: 16 May 2018
/
Published: 20 May 2018
(This article belongs to the Special Issue Methods and Concepts for Designing and Validating Smart Grid Systems)
Abstract
:This paper presents experimental validation of a distributed optimization-based voltage control system. The dual-decomposition method is used in this paper to solve the voltage optimization problem in a fully distributed way. Device-to-device communication is implemented to enable peer-to-peer data exchange between agents of the proposed voltage control system. The paper presents the design, development and hardware setup of a laboratory-based testbed used to validate the performance of the proposed dual-decomposition-based peer-to-peer voltage control. The architecture of the setup consists of four layers: microgrid, control, communication, and monitoring. The key question motivating this research was whether distributed voltage control systems are a technically effective alternative to centralized ones. The results discussed in this paper show that distributed voltage control systems can indeed provide satisfactory regulation of the voltage profiles.
1. Introduction
Over the last decade, there has been a clear focus in the European Union (EU) on promoting low-carbon generation technologies and renewables. To ensure the EU meets its climate and energy goals, the 20-20-20 targets aim to cut the emission of greenhouse gasses by compared to the 1990 level, achieve a share of renewables in the total energy consumption, and improve the energy efficiency by . In many countries, feed-in tariffs for eligible technologies have guaranteed returns for investors, and this along with other forms of market support have contributed to a reduction in technology costs and an increasing penetration of renewable energy resources (RESs) into distribution networks across Europe. This growth of renewable energy is expected to maintain since by 2030 the EU aims for of the final energy consumption to come from renewable sources. The progress of the EU and its member states towards 2020 climate and energy targets are summarized in [1].
These trends are impacting the operation of distribution networks, making the Distribution System Operators’ (DSOs) mission of providing secure electricity supply and high quality of service increasingly challenging. The historical “fit-and-forget” strategy of distribution networks was consistent with the unidirectional power flows from substations to end consumers and their predictable load profiles. When connecting significant amounts of RESs to the network, the assumption of unidirectional power flows is not always valid anymore. The generated power of RESs can reverse the power flows in the grid, what could lead to a rise of the voltage profiles beyond the allowed limits. Moreover, intermittent and unpredictable nature of renewables increases the complexity of controlling the distribution networks. A comprehensive overview of the impacts of the renewable energy and information and communications technology (ICT) driven energy transition on distribution networks is presented in [2]. To maintain a high security of supply and quality of service, DSOs have to find new strategies to control their networks.
A transition towards active management strategies would be capable of maintaining the voltage profiles of distribution networks within acceptable limits to comply with the European standard EN 50160 [3] while minimizing, deferring, or even avoiding any capacity upgrades. Additionally, valuable flexibility of prosumers can be embedded in the operational management of the networks, to allow the prosumers to participate in supporting the grid as kind of ancillary service. Details of the most effective and efficient ways for managing the future active distribution networks, to address the 21st century challenges of transitioning to low-carbon electricity, are discussed in [4].
The need for managing distribution networks actively by employing smart grid solutions and creating innovative investments and business models are the reasons for launching the EU funded Peer-to-Peer Smart Energy Distribution Networks (P2P-SmarTest) project. The project was launched in 2015 and continued until the end of 2017. The idea of the project consists in developing intelligent control, trading, and communication algorithms through a “Peer-to-Peer” concept; to facilitate the integration of demand side flexibility and to ensure optimal operation of RESs within the network while maintaining quality and security of supply. The deliverables of the project can be found on the website of the project [5]. In [6], the view to Peer-to-Peer (P2P) approach for smart grid operation adopted in P2P-SmarTest project is presented. The P2P control paradigm used in the project is presented in [7].
The approach adopted in P2P-SmarTest project to regulate voltage profiles of active distribution networks is based on distributed optimization techniques and P2P communication. Distributed optimization, as an alternative approach to solve challenges of the centralized optimization mechanism, has attracted increasing attention recently [8]. A Distributed optimization-based control system is characterized by the complete absence of a central controller. Every RES is considered to be an autonomous control agent where all agents are equally important. To overcome the absence of the central decision making controller, the agents communicate with each other in a P2P fashion. With communication, they are able to make the correct control decisions in every particular situation. Failure of one controller in distributed control system does not lead to an inability to control the system. The work in [9] describes fundamental concepts and approaches within the field of distributed control systems that are appropriate to power engineering applications.
Centralized control systems often suffer from serious computation, robustness, and communication issues for power networks with many controllable devices. Distributed control is perhaps the only viable strategy for such networks. Nevertheless, these centralized systems can achieve high performance. In a centralized control system, there is only one controller, which receives all necessary data, and based on all available information the multi-objective controller can achieve a globally optimal performance. An interesting question is whether P2P distributed control systems can achieve a comparable good performance to the centralized one. Most research studies appearing in the literature attempt to answer this question by means of simulators, as reviewed in [10,11,12]. For instance, in [13] a gradient descent method has been used to distribute a centralized optimization problem over agents participating in the voltage control, a push-sum gossip algorithm is implemented to enable P2P communication between the agents. Simulink (MATLAB, version R2016a, The MathWorks, Inc, Natick, MA, USA) has been used to model a 5-bus microgrid and to validate the performance of the proposed algorithm. In [14], a dual decomposition technique is used to design a P2P-based voltage control system. A backward/forward sweep power flow calculation algorithm, coded in MATLAB, has been used to model a low voltage, 62-bus, semiurban feeder and to test the ability of the algorithm to control the voltage effectively within limits. In [15], openDSS simulator (version 2017, EPRI, Palo Alto, CA) has been used to validate the effectiveness and robustness of a fully distributed voltage control algorithm that has been developed based on the Alternating Direction Method of Multipliers and consensus protocol (consensus ADMM). The same method has been used in [16] and validated using CVX software (version 2014, CVX Research, Inc., Stanford, CA, USA) (convex programming). Distributed Energy Storage Systems (DESSs) are used in [17] to control the voltage profiles of active distribution networks in a distributed way. The proposed methodology is based on network partitioning strategy. Linear programming and voltage sensitivities are used to define the areas for which each DESS maximizes its influence. To study the performance of the proposed algorithms, MATLAB has been used to code the algorithms and to model an IEEE 123 nodes test system. The concept of network partitioning is also used in [18] to implement a decentralized voltage control system that regulates reactive power of photovoltaic (PV) inverters. The proposed methodology of [18] is based on Lyapunov theory and has been validated via Matlab/Simulink environment.
The concepts of transactive energy (TE), home microgrids (H-MGs) and coalition formation are used in [19] to design an algorithm for optimal use of electrical/thermal energy distribution resources, while maximizing profit of H-MGs. The algorithm is based on an optimization problem in which an objective function is based on economic strategies, distribution limitations and the overall demand in the market structure. MATLAB was used to solve the optimization problems of the proposed algorithm. The same concepts have been used in [20] to design an optimal, autonomous, and distributed bidding-based energy optimization scheduling algorithm to maximize profit and energy balancing efficiency of H-MGs under residential loads. A comprehensive simulation study was carried out to reveal the effectiveness of the proposed method in lowering the market clearing price, increasing H-MG responsive load consumption, and promoting local generation. Optimal management system of battery energy storage is proposed in [21] to enhance the resilience of a PV-based commercial building while maintaining its operational cost at a minimum level. The methodology is based on linear optimization programming problem with Conditional Value at Risk (CVaR) incorporated in the objective function. CVaR is used to account for the uncertainty in the intermittent PV system generated power and that in the electricity price. MATLAB simulation studies were carried out to evaluate the performance of the proposed method.
There are few studies in existing literature addressing the experimental validation of distributed control algorithms. Experimental evaluations of real deployments are thus lacking. In [22], a gossip- based P2P voltage control has been tested in a pilot site, the work is part of the European Commission FP7 DREAM project. Six households were equipped with smart control agents, which measure the households’ consumption and control the households’ flexible loads. Each agent is connected to a local Wi-Fi router (internet gateway) and a virtual private network is then used to enable P2P communication between the neighboring agents. In [23], a multi-agent platform has been implemented and used to test a dual-decomposition-based optimization method for controlling the prosumers’ flexibility. The distributed agents are implemented in Raspberry Pi computers. The agent-based control algorithm of each agent is implemented in Python and executed via Matlab calls. The setup is part of Local Intelligent Networks and Energy Active Region (LINEAR) project [24]. In [25], a gossiping P2P semantic overlay network is implemented by a toolbox, Agora+, enabling P2P communication between agents. The toolbox has been used to implement a distributed tertiary control algorithm, which allows groups of generators to operate at an economical optimum. In [26], distributed reactive power control has been implemented and tested using real power inverters. Each inverter is considered to be an agent where coordination between the agents is obtained by exchanging information via an IP-based communication network.
This paper discusses the results of the experimental validation of a dual-decomposition-based P2P voltage control algorithm developed within the P2P-SmarTest project. A simulation already demonstrated the effectiveness of this algorithm [14] and this paper demonstrates it experimentally. The voltage control problem is formulated as an optimization problem. The proposed method calculates the minimum change in reactive power and active power needed to maintain the voltages within the limits. The dual-decomposition method decomposes an optimization problem (with separable cost functions and coupled constraints) into sub-problems, suitable for distributed control. Dual-decomposition applies the theory of Lagrangian multipliers and duality to convert a centralized constraint optimization problem into a fully distributed constraint optimization problem. The proposed dual-decomposition method differs from the classical dual-decomposition. In classical dual-decomposition [27], there is a need for a central agent to calculate the Lagrangian multipliers (control signals), whereas in the proposed dual-decomposition method, the Lagrangian multipliers are calculated locally and each agent communicates its Lagrangian multipliers to the other agents in a P2P fashion.
Our main contributions can be summarized as follows. (1) We present the design, development and hardware setup of a laboratory-based P2P voltage control testbed; (2) Secondly, we propose the use of a fully distributed dual-decomposition method to design a P2P voltage control system; (3) Thirdly, we propose the use of Long Range Wide-area network (LoRaWAN) technology to design a device-to-device communication system. The device-to-device communication is used to enable P2P data interchange between agents of the proposed voltage control system; (4) Finally, we validate experimentally that the proposed P2P voltage control system can indeed provide satisfactory regulation of the voltage profiles.
The testbed presented in this paper provides realistic and pragmatic solution for evaluating P2P smart grid applications. The testbed is used to evaluate the performance of the proposed dual-decomposition-based voltage control system. It can also be used to evaluate other distributed applications for grid management. The testbed allows for re-using of the existing simulator code, while still facilitating accurate integration of power and communication effects on a real hardware platform.
The rest of this paper is organized as follows. The laboratory-based P2P voltage control testbed is described in Section 2. Section 3 presents the P2P-based voltage control algorithm. Drive of the inverters is presented in Section 4. The Device-to-Device (D2D) communication modules used to enable P2P communication between the agents are described in Section 5. Section 6 presents the experimental results and the key performance indicators. Finally, the paper is concluded in Section 7 with future work.
2. Testbed Architecture
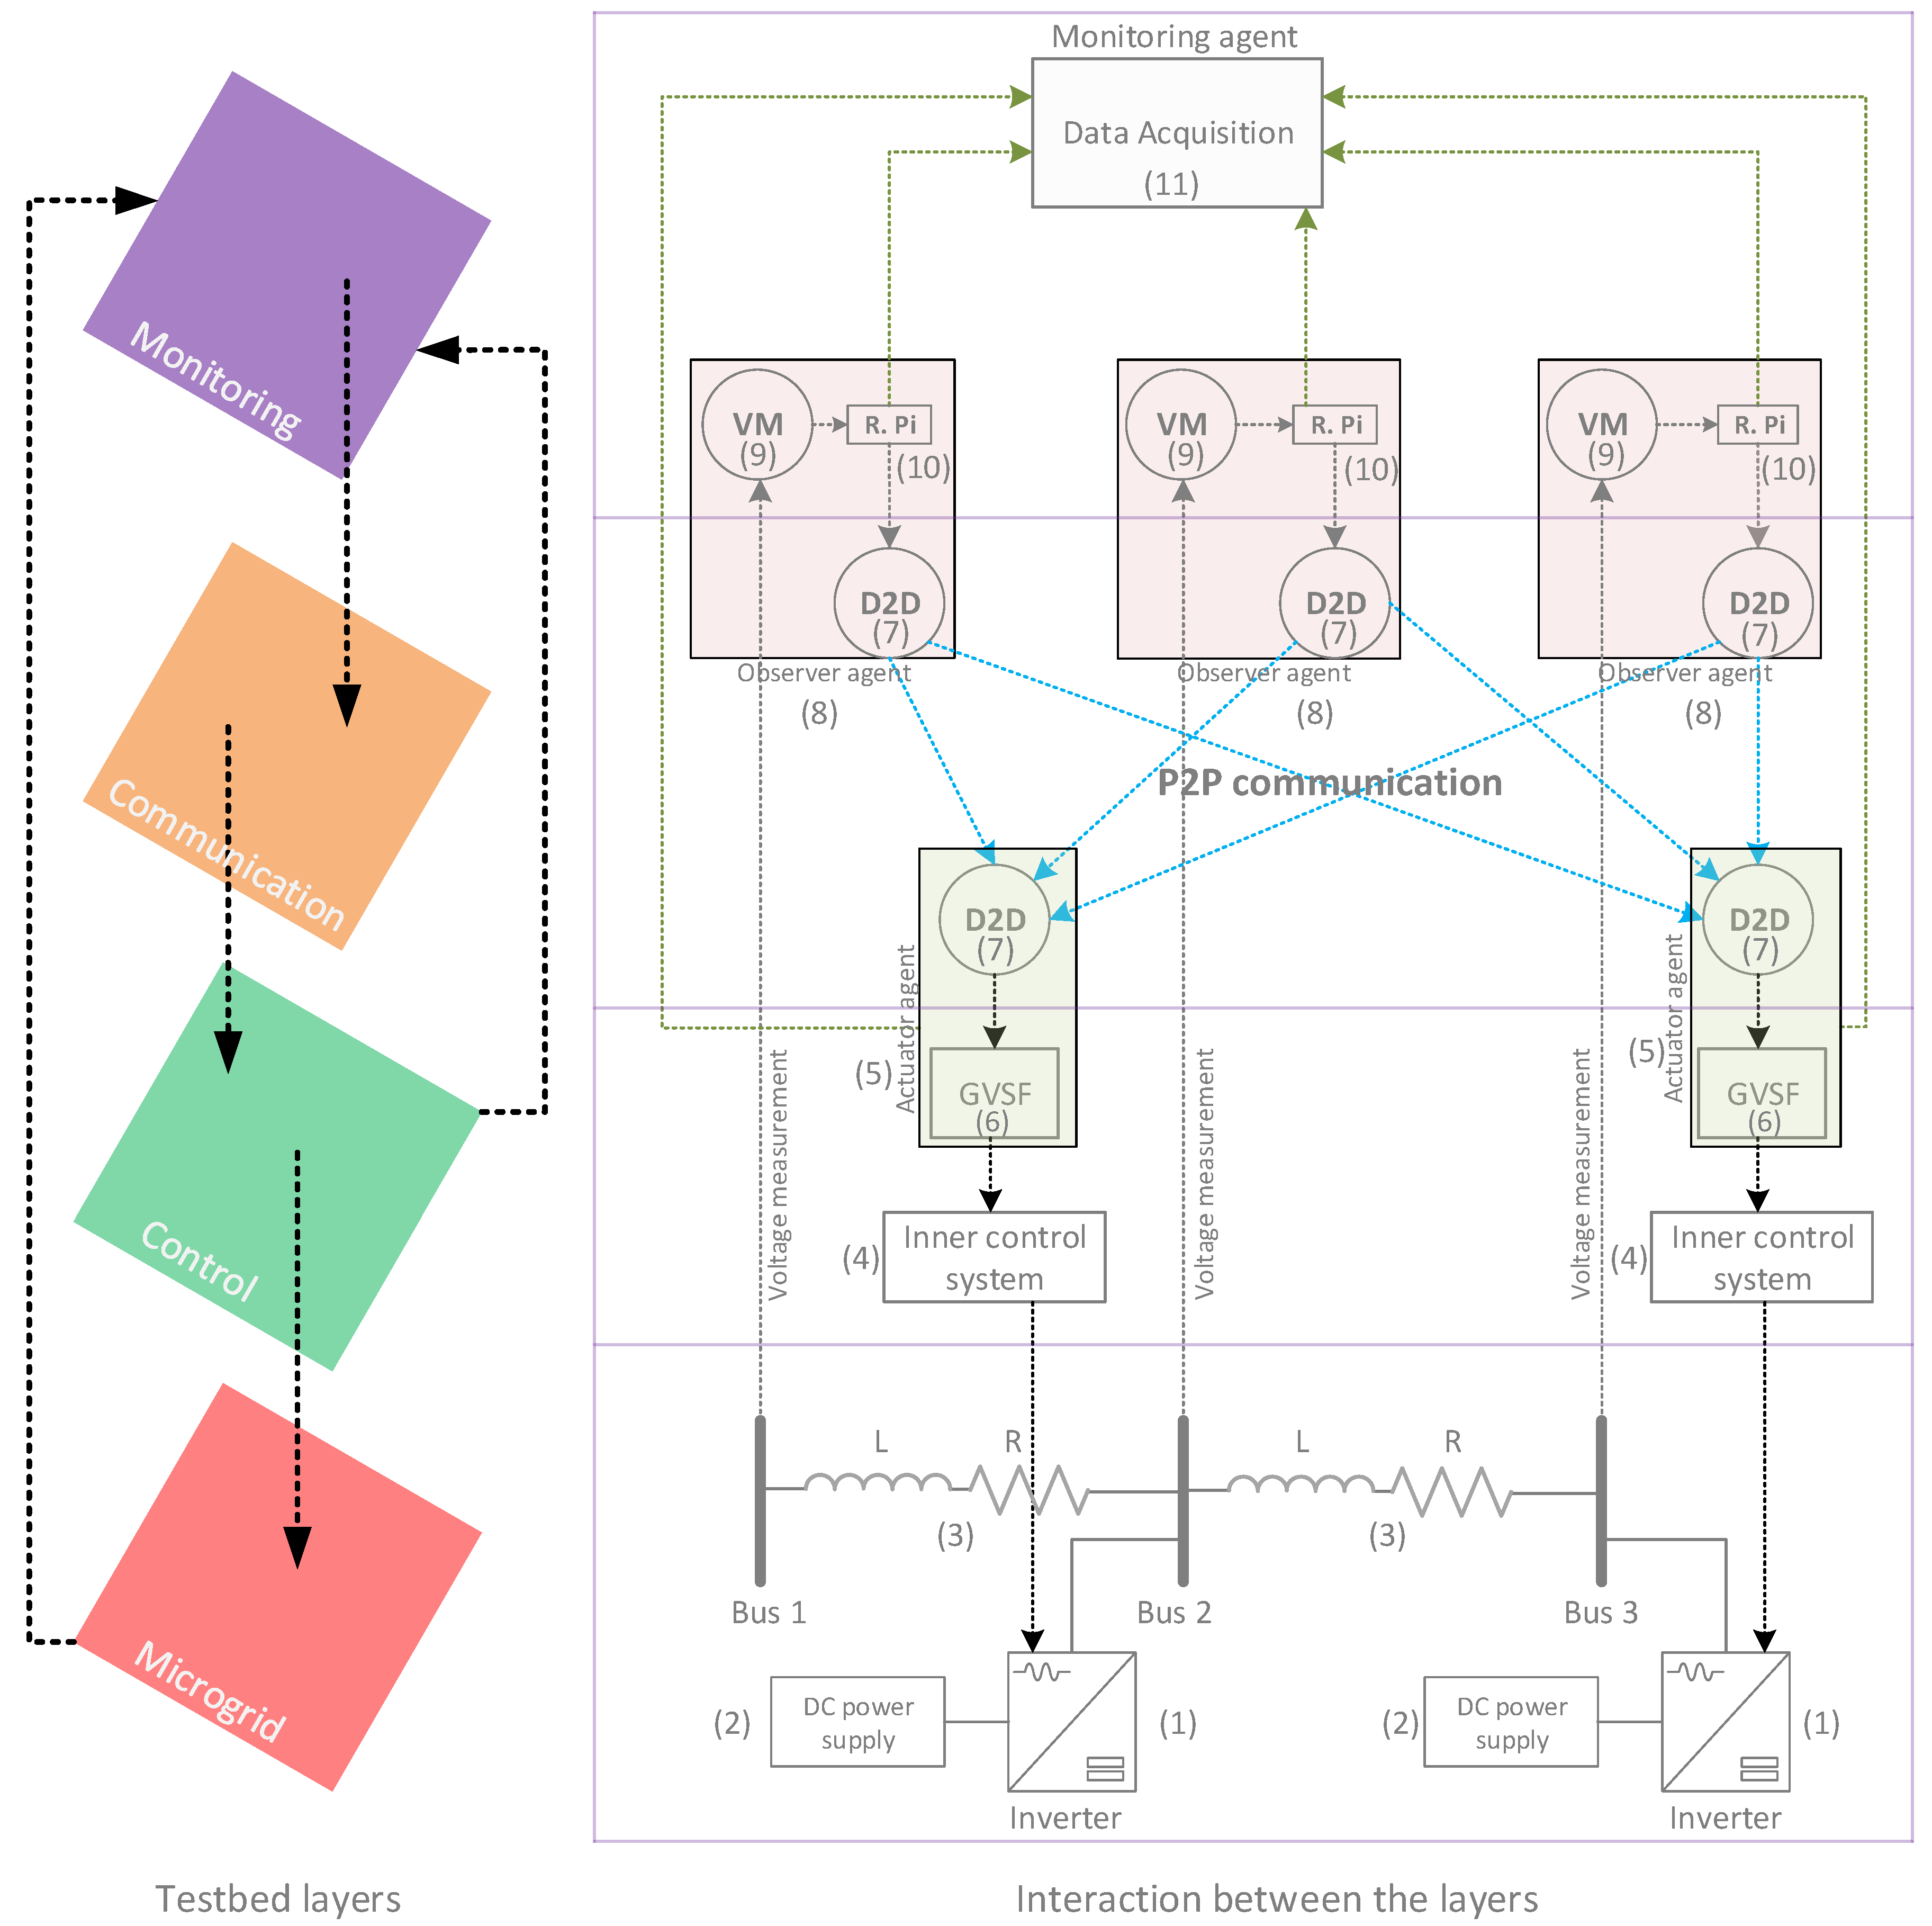
The architecture of the P2P voltage control testbed is depicted in Figure 1. The testbed consists of four different layers which interact with each other: (1) microgrid layer; (2) control layer; (3) communication layer; and (4) monitoring layer. The microgrid layer consists of programmable inverters (label 1 in Figure 1); connected to DC power supplies (label 2). The inverters emulate prosumers with photovoltaic (PV) installations, they are connected to the grid by resistors in series with inductors (label 3). The resistors and inductors are used to emulate a low voltage feeder. The control layer consists of inner control systems (label 4) that drive the power inverters, and grid voltage support functions (GVSFs) that control the voltage profiles of the micogrid (label 6). The communication layer consists of D2D communication modules (label 7) that are used to disseminate the status of the voltage profiles in a P2P fashion. The monitoring layer consists of voltmeters (label 9) and data acquisition platform (label 11).
The P2P voltage control testbed consists of three types of agents: (1) actuators; (2) observers; and (3) a monitor. Each GVSF is connected to a D2D communication module and together they form an actuator agent (label 5). The actuator agents are connected to the programmable inverters through the inner control systems (control loops) and participate actively in voltage control by calculating the change in reactive power and active power that each inverter should follow to maintain the voltage profiles within specified limits. The set-points of the change in reactive and active power of the inverters are determined based on an optimization problem solved in a fully distributed way.
The observer agent (label 8) consists of a voltmeter connected to a D2D communication module through a Raspberry Pi (R.Pi) computer (label 10). The voltmeter periodically measures the voltage of its bus, and the R.Pi fetches the latest reading. The R.Pi of each voltmeter hosts a software that was developed for interfacing with both the communication module and the voltmeter. The R.Pi calculates the control signals (further referred to as Lagrangian multipliers) based on the latest voltage measurement, according to a procedure described later. These control signals are broadcasted through the D2D modules. The actuators communicate with the observers in a P2P fashion to receive the control signals. The actuators then determine how to react based on these control signals and based on their impact on the observed voltages (the impact on the voltages is expressed by voltage sensitivities). They also take into account the cost of dispatching a change in active and reactive power.
The third type of agent, the monitoring agent (label 11), represents a data acquisition platform. This additional agent is not required for the operation of the P2P voltage control algorithm. The observers and actuators record several variables from the algorithm that they execute, together with timestamps. These recordings are cached locally. Periodically, the observers and actuators transfer the cached recordings to the monitoring agent in a robust way. Therefore, even if the data acquisition network is temporarily offline, no data will be lost. The monitoring agent hosts a web service, through which all recorded data is visualized in several dashboards.
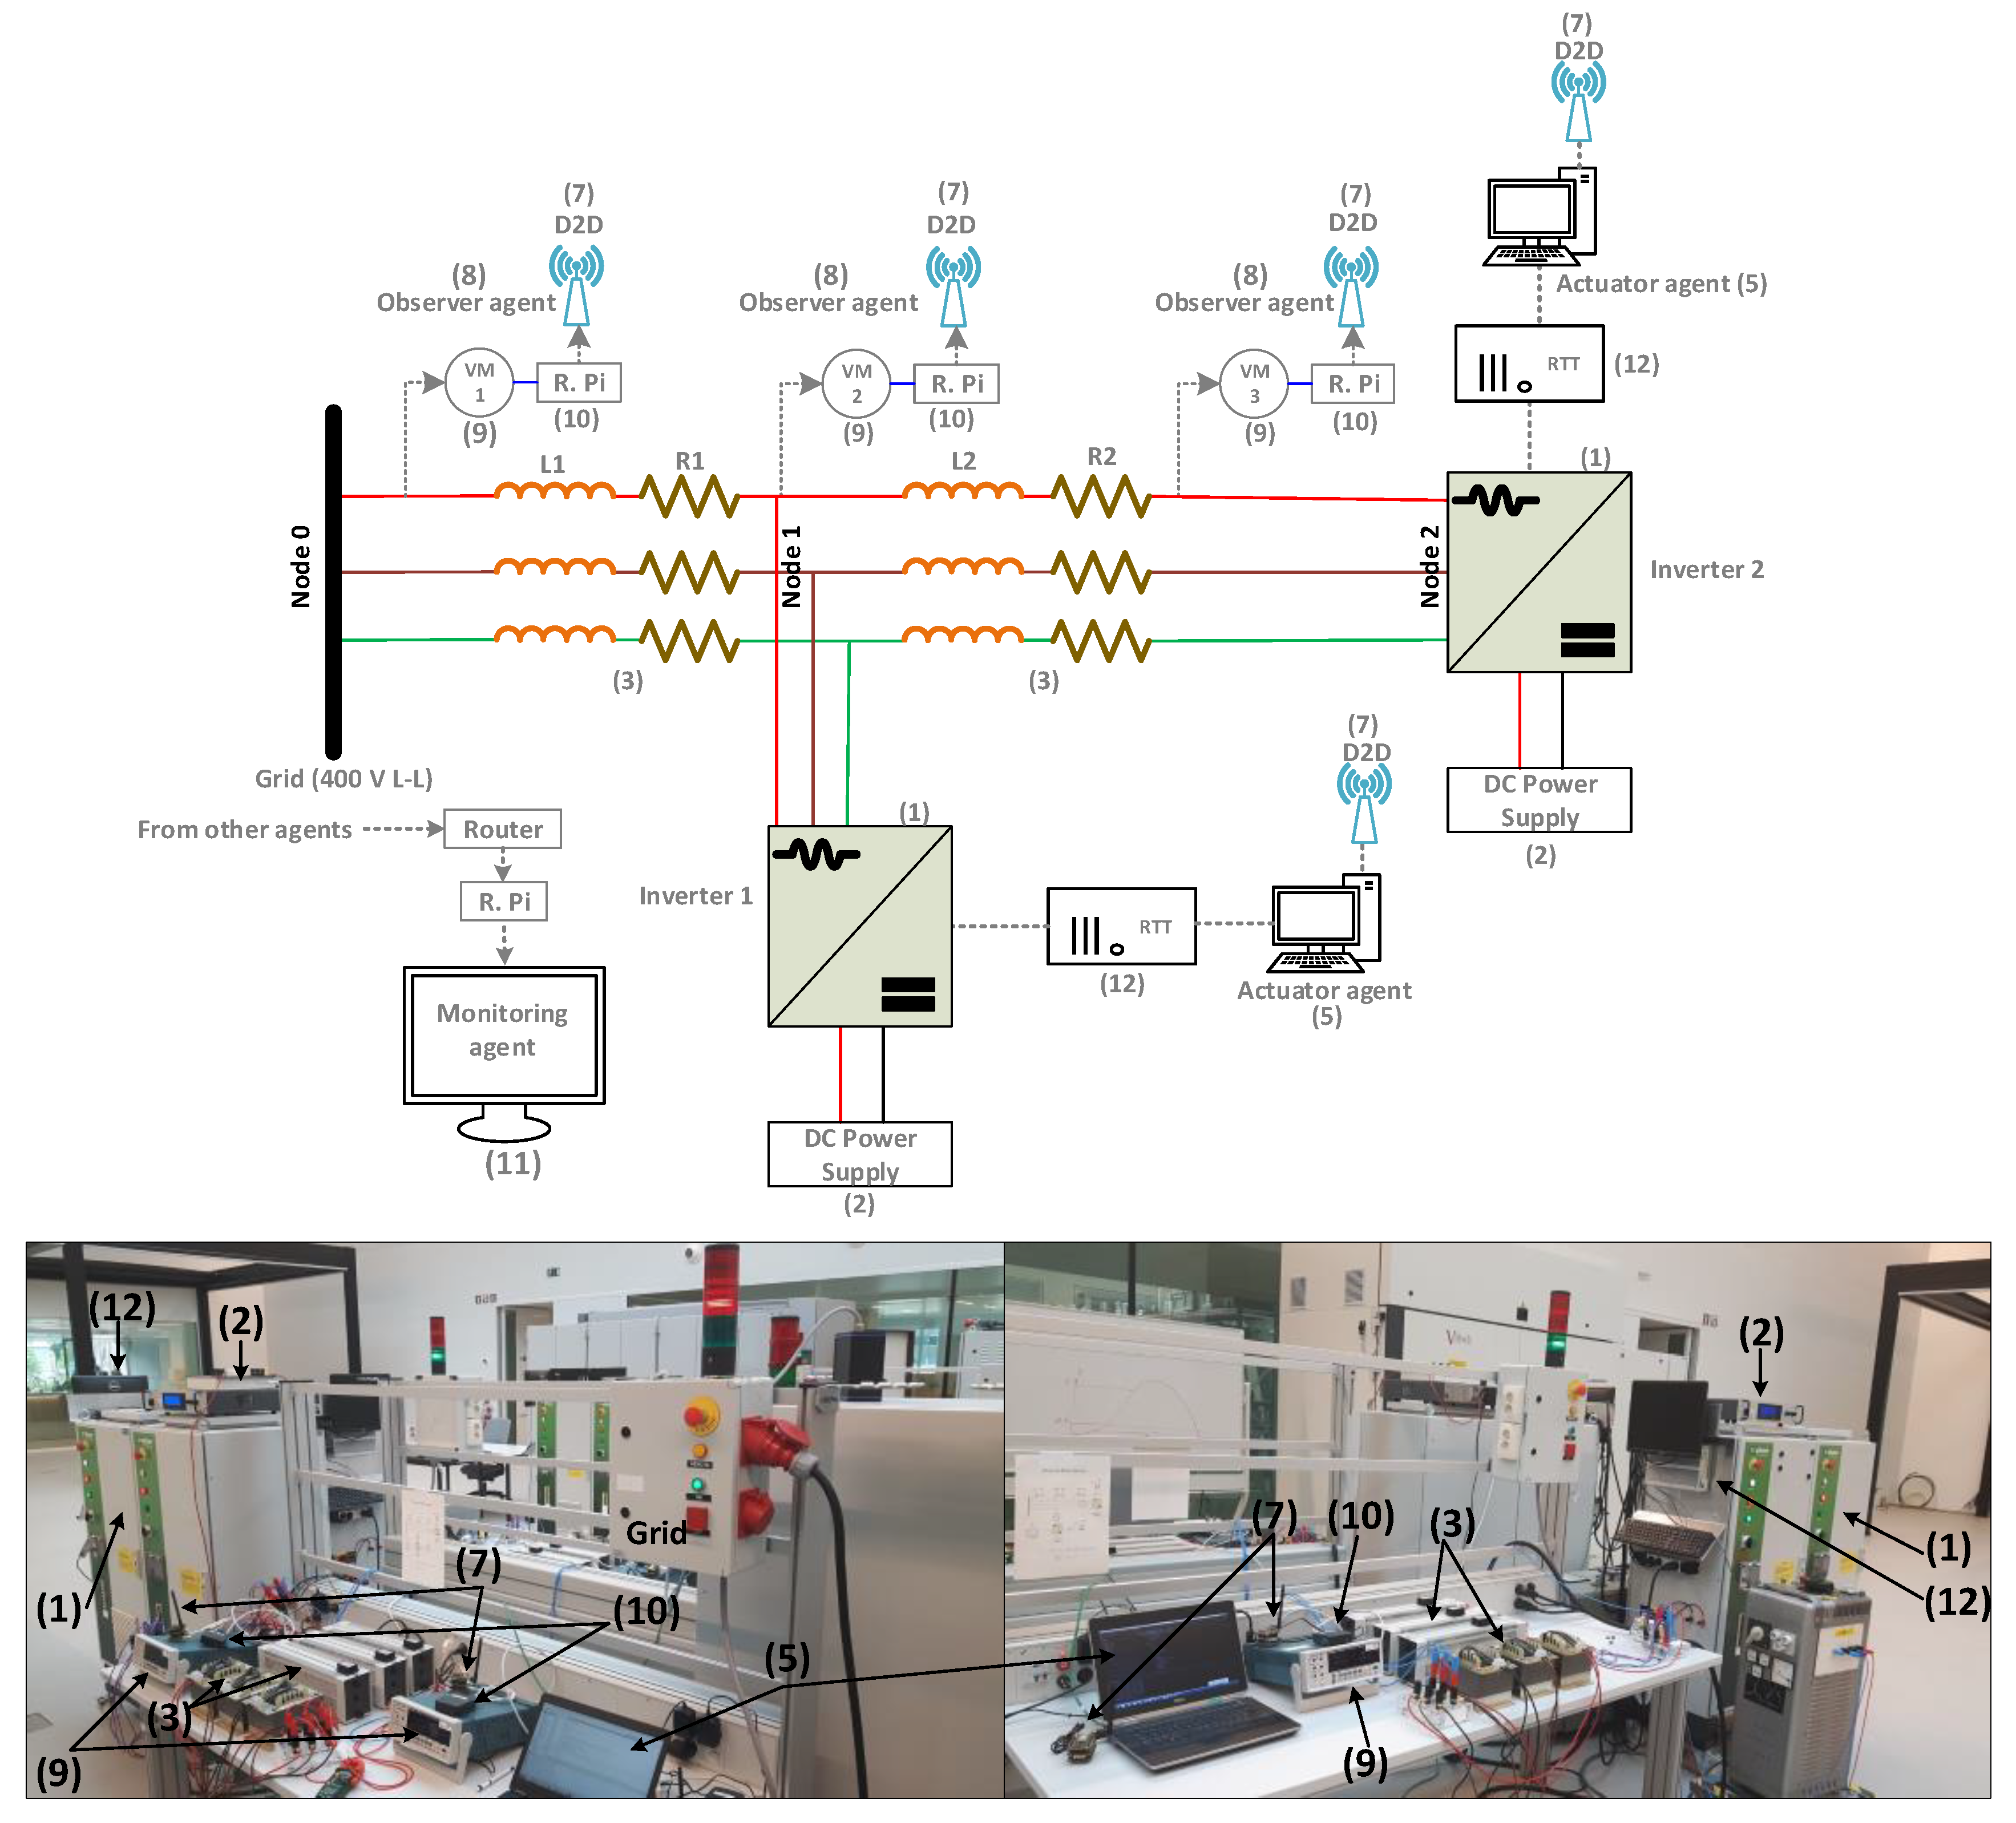
The overall schematic of the testbed is depicted in Figure 2. The microgrid is connected to the main grid through 400 V (line-to-line voltage (L-L)), 64 Amps (A) busbar.
3. Dual-Decomposition-Based P2P Voltage Control Algorithm
The proposed P2P voltage control algorithm regulates the voltage within allowed limits based on an optimization problem. The algorithm uses a minimum change in reactive and active power consumption or injection of some participating inverters installed in the microgrid to control the voltage. The derivation of the algorithm is presented in [14] and here we present the algorithm in a more practical way.
Without compensation, each inverter injects a certain amount of active power into the system. In reality, this active power originates from the solar energy received by the photovoltaic cell. The inverter can additionally inject reactive power, as long as the total apparent power does not exceed the inverter rating. The inverter has an additional degree of freedom; it can curtail a fixed percentage of the active power. Therefore, the actuator agent can take two actions: reducing the active power (by an amount ) and injecting or absorbing reactive power (by an amount ).
Each actuator agent solves the following optimization problem to find and :
where is the number of the actuator agent ( is the set of actuators participating in the voltage control). is the number of the observer agent ( is the set of observers participating in the voltage control). represents the quadratic cost of a change in active power of inverter d with an amount at time step t, while represents the quadratic cost of a change in reactive power of inverter d with an amount at time step t. and are constant factors used to penalize the control variables and . These factors define the priorities for the control actions. It is supposed that reactive power control of the inverter is cheaper than cutting its active power. Therefore, should be greater than in a sense that gives priority of the control action to the reactive power. When the reactive power of the inverter is not sufficient, active power curtailment of the inverter will be used to regulate the system voltages. In our control system, we set and . Active power curtailment can be penalized more to minimize its use, but having higher would decrease the speed of convergence when the curtailment is used to return the voltages back to the limits. It is worth mentioning that the factor can be calculated to incorporate losses on the network (related to reactive power compensation) and other costs. In reality, reactive power provision can lead to some additional losses in the network. An approximate cost factor can include the additional losses in the inverter [28]. Incorporating the grid losses however would require a more complete network model.
and are the sensitivity of the voltage at bus i (observer i) to the change in the active power and reactive power (respectively) of inverter d. is the curtailment factor. In this paper, is set to . In reality, can be set based on how much the prosumer would like to curtail the active power. is the active power generated by inverter d at time step t. is the rated apparent power of inverter d.
and are the control signals of violating the maximum and minimum (respectively) allowed voltage at bus i. They are calculated at the previous time step and considered in the optimization of time step t. Mathematically speaking, they represent the Lagrangian multipliers. Each observer measures the voltage at its bus and updates these control signals based on the following equations:
where and are the updated control signals calculated at time step t and considered in the optimization of time step . is the measured voltage at bus i after applying the decisions and . and are the maximum and minimum allowed voltage, respectively. We set p.u. (per unit) and p.u. according to the European standard EN50160. The parameter is the step size of the dual decomposition method. Because of the Karush-Kuhn–Tucker conditions (KKT), the Lagrangian multipliers cannot be smaller than zero. This explains the use of maximum operator in (2).
The control algorithm goes through the following steps:
- Each observer agent measures the voltage. If the voltage exceeds the upper voltage limit, it will increase . If the voltage is lower than the upper limit, it will decrease , at most until it reaches zero. A similar procedure applies to . The parameter determines how large the updates to the control signals will be.
- The actuator agents receive updates of and periodically. They will adjust their compensation to take the new values of the control signals into account.
- The voltage changes due to the actions of the actuator agents. The observer agents update again their and , and the whole process repeats. The communication from observer to actuator takes place through the D2D communication modules, while the feedback path goes through the electrical network.
From this explanation, it is clear that this process is based on feedback. As long as the voltage problem persists, the observer agents will increase the control signals to get more compensation from the actuator agents. The effect of is similar to a gain in control theory. The trade-off in its selection is similar: a low value can lead to slow convergence, while a too large value can lead to instability.
4. Drive of the Rapid Prototyping Inverter with Voltage Support Function
4.1. PM15FM30C Triphase Module
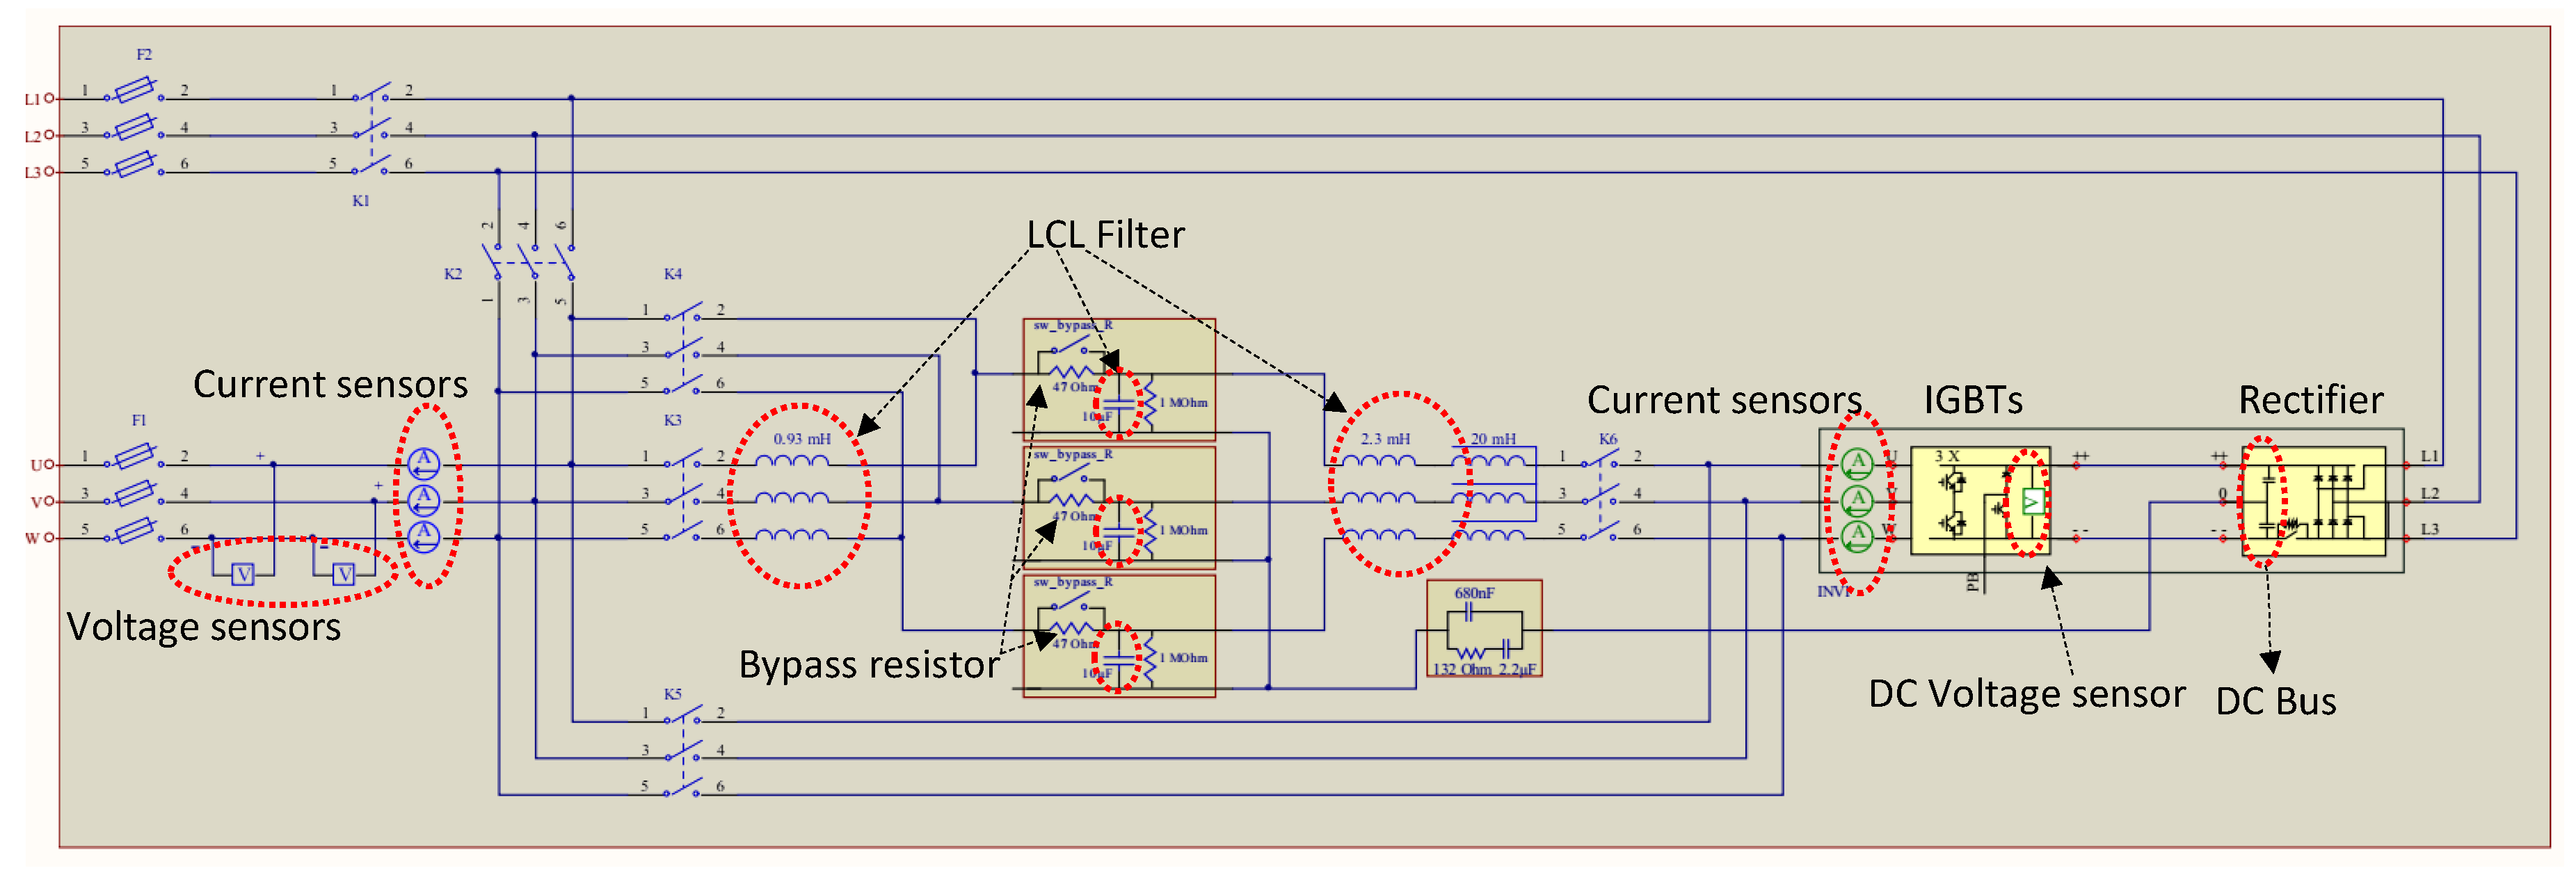
DC/AC PM15FM30C Triphase rapid prototyping inverter modules are used in the testbed to emulate prosumers with PV installations. A schematic diagram of the PM15FM30C circuit is depicted in Figure 3. The PM15FM30C module mainly consists of:
- A 15 kVA three phase inverter, consisting of three half-bridges with insulated-gate bipolar transistors (IGBTs).
- A rectifier that can be connected directly to the AC voltage of the microgrid; it can be used to charge the DC bus in case one does not want to use a DC source.
- An inductor-capacitor-inductor filter (LCL filter).
- Three bypass resistors to limit the inrush current at the beginning of operation; these resistors are bypassed with a relay when the rapid prototyping module is running.
- Current sensors to measure the current before and after the LCL filter.
- Voltage sensors to measure the DC bus voltage and the AC voltage after the LCL filter at the grid side.
- Control board to drive the IGBTs, control the switches K1-K6, and the fan of the module.
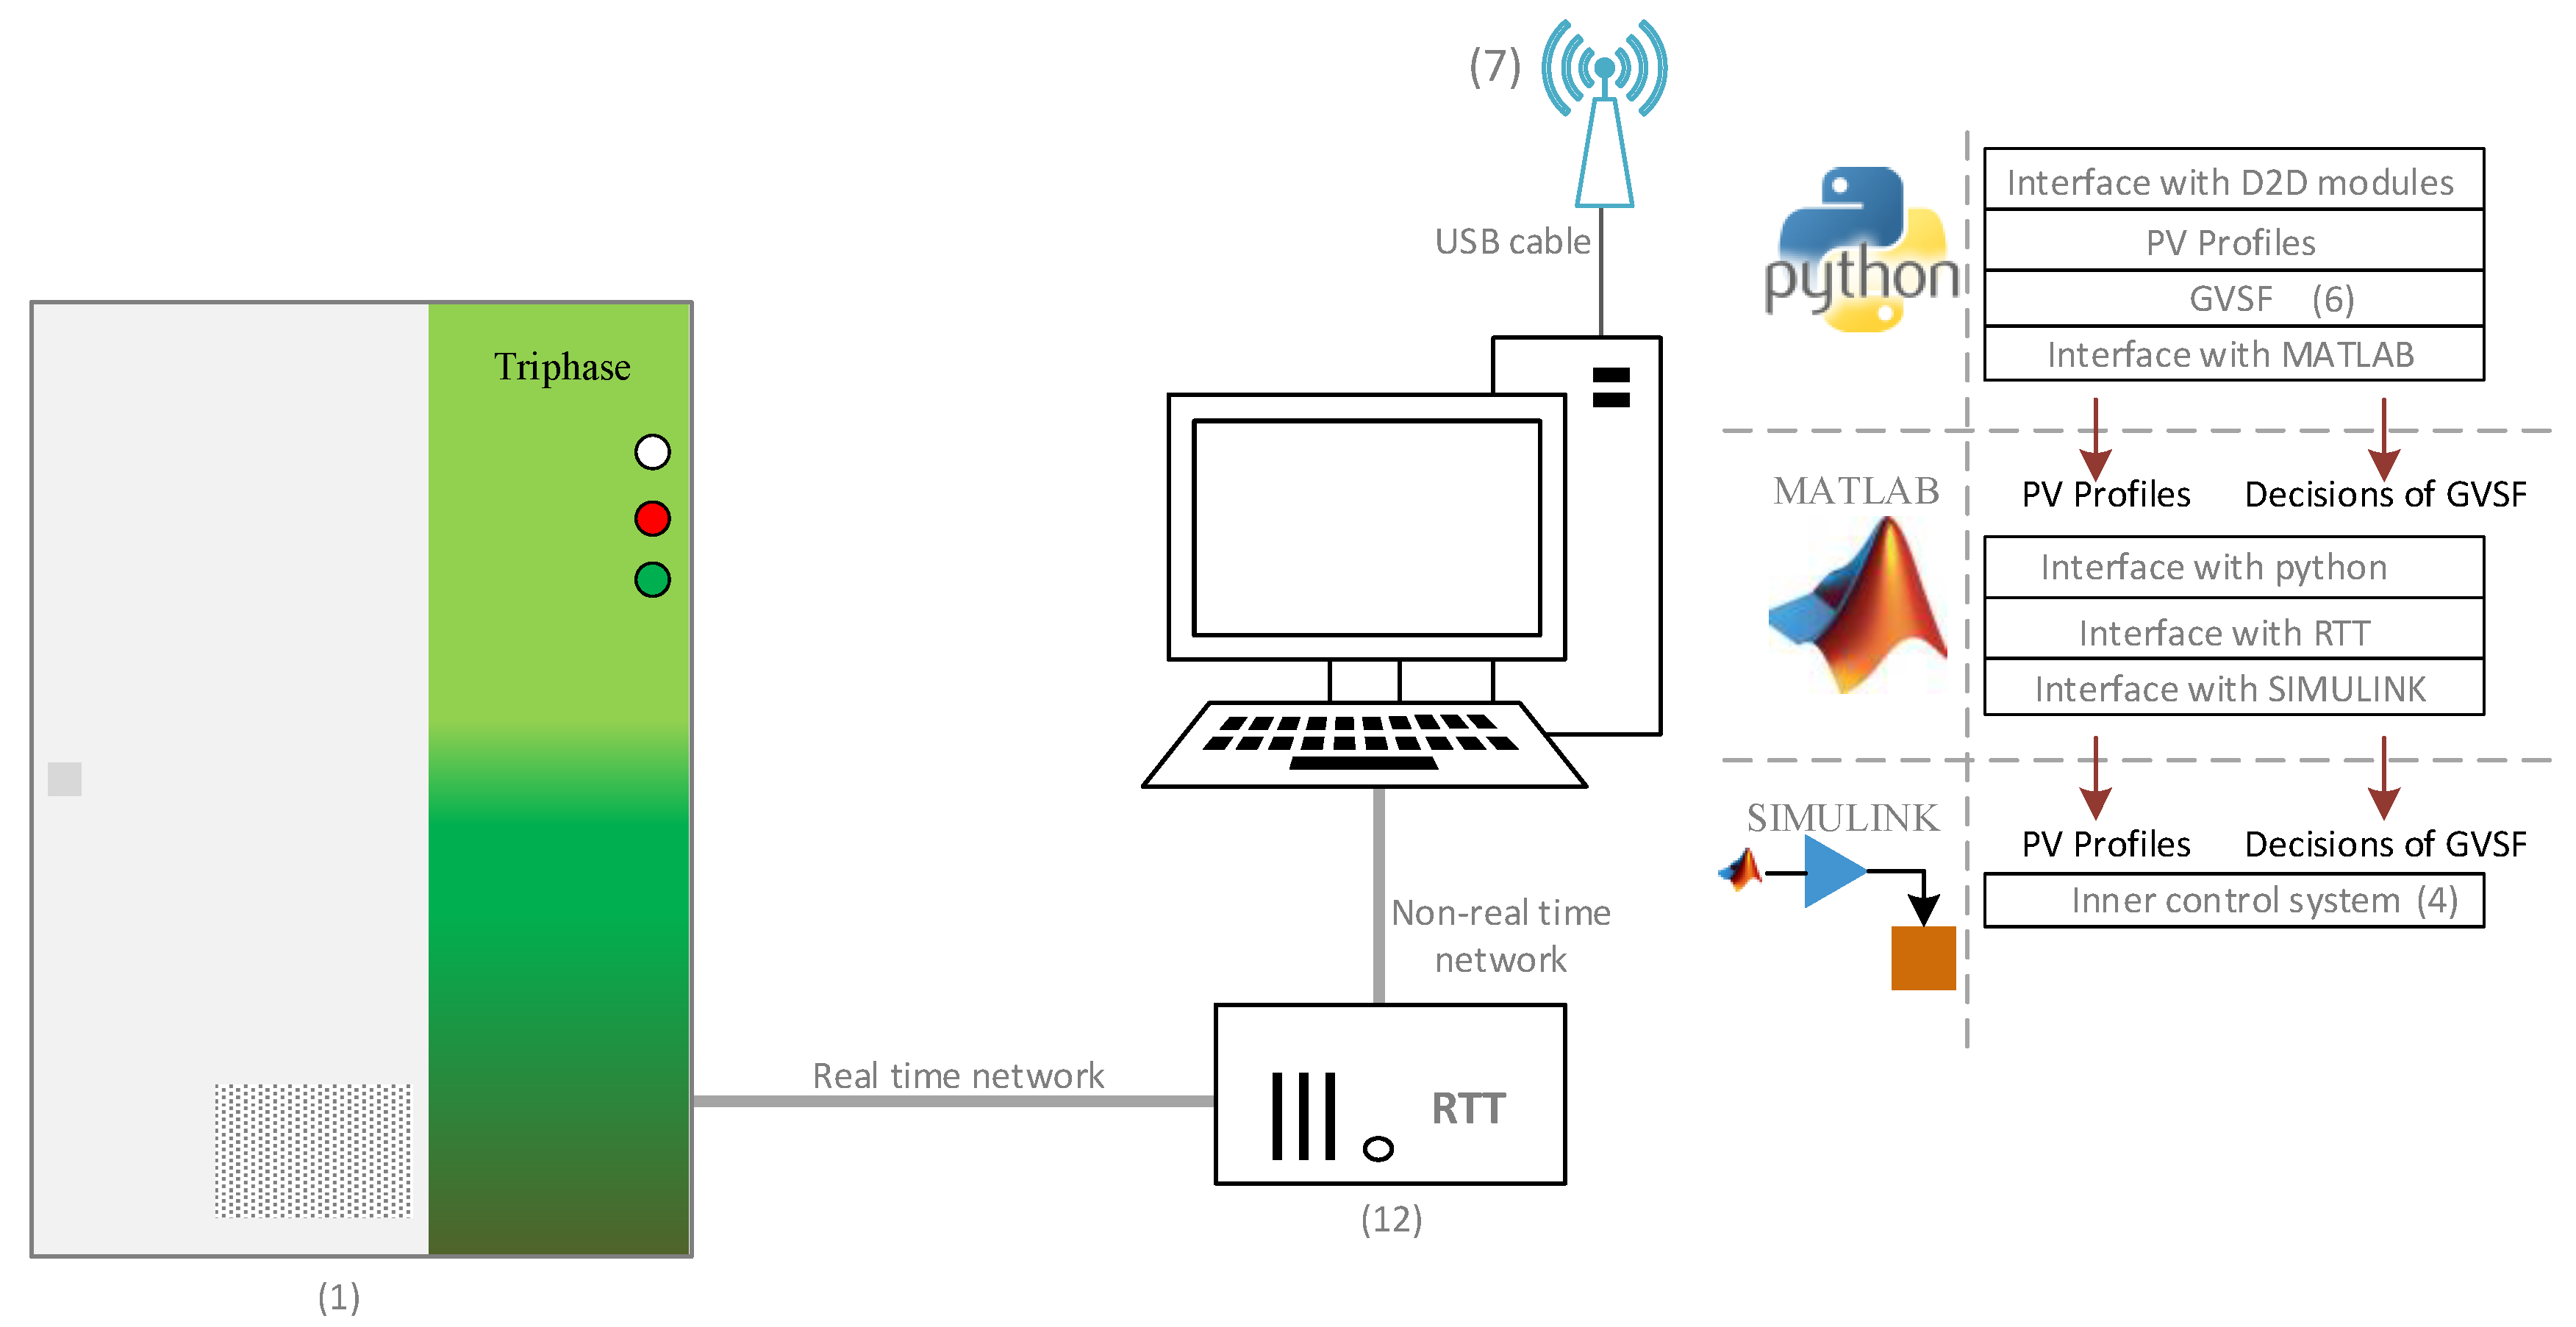
The PM15FM30C inverter is programmed and operated through MATLAB/Simulink running on a computer. The computer communicates over Ethernet with an on-board PC-based Real-Time Target (RTT), which controls the Triphase power electronics as shown in Figure 4. Python (version 3.3, Python Software Foundation, Wilmington, DE, USA) has been used to code a software that manages the interface with the D2D communication module, fetches the Lagrangian multipliers from the D2D modules, stores the PV profiles, and solves a quadratic optimization problem with respect to local constraints as in (1). The software also manages the interface with MATLAB.
MATLAB exposes an interface to the Python software, which allows the Python software to directly execute scripts in MATLAB. The Python software uses a MATLAB script to push updates on the PV profiles and and set-points to Simulink. MATLAB also manages the interface with RTT to control the switches and fan of the PM15FM30C.
4.2. Drive of PM15FM30C Triphase Module
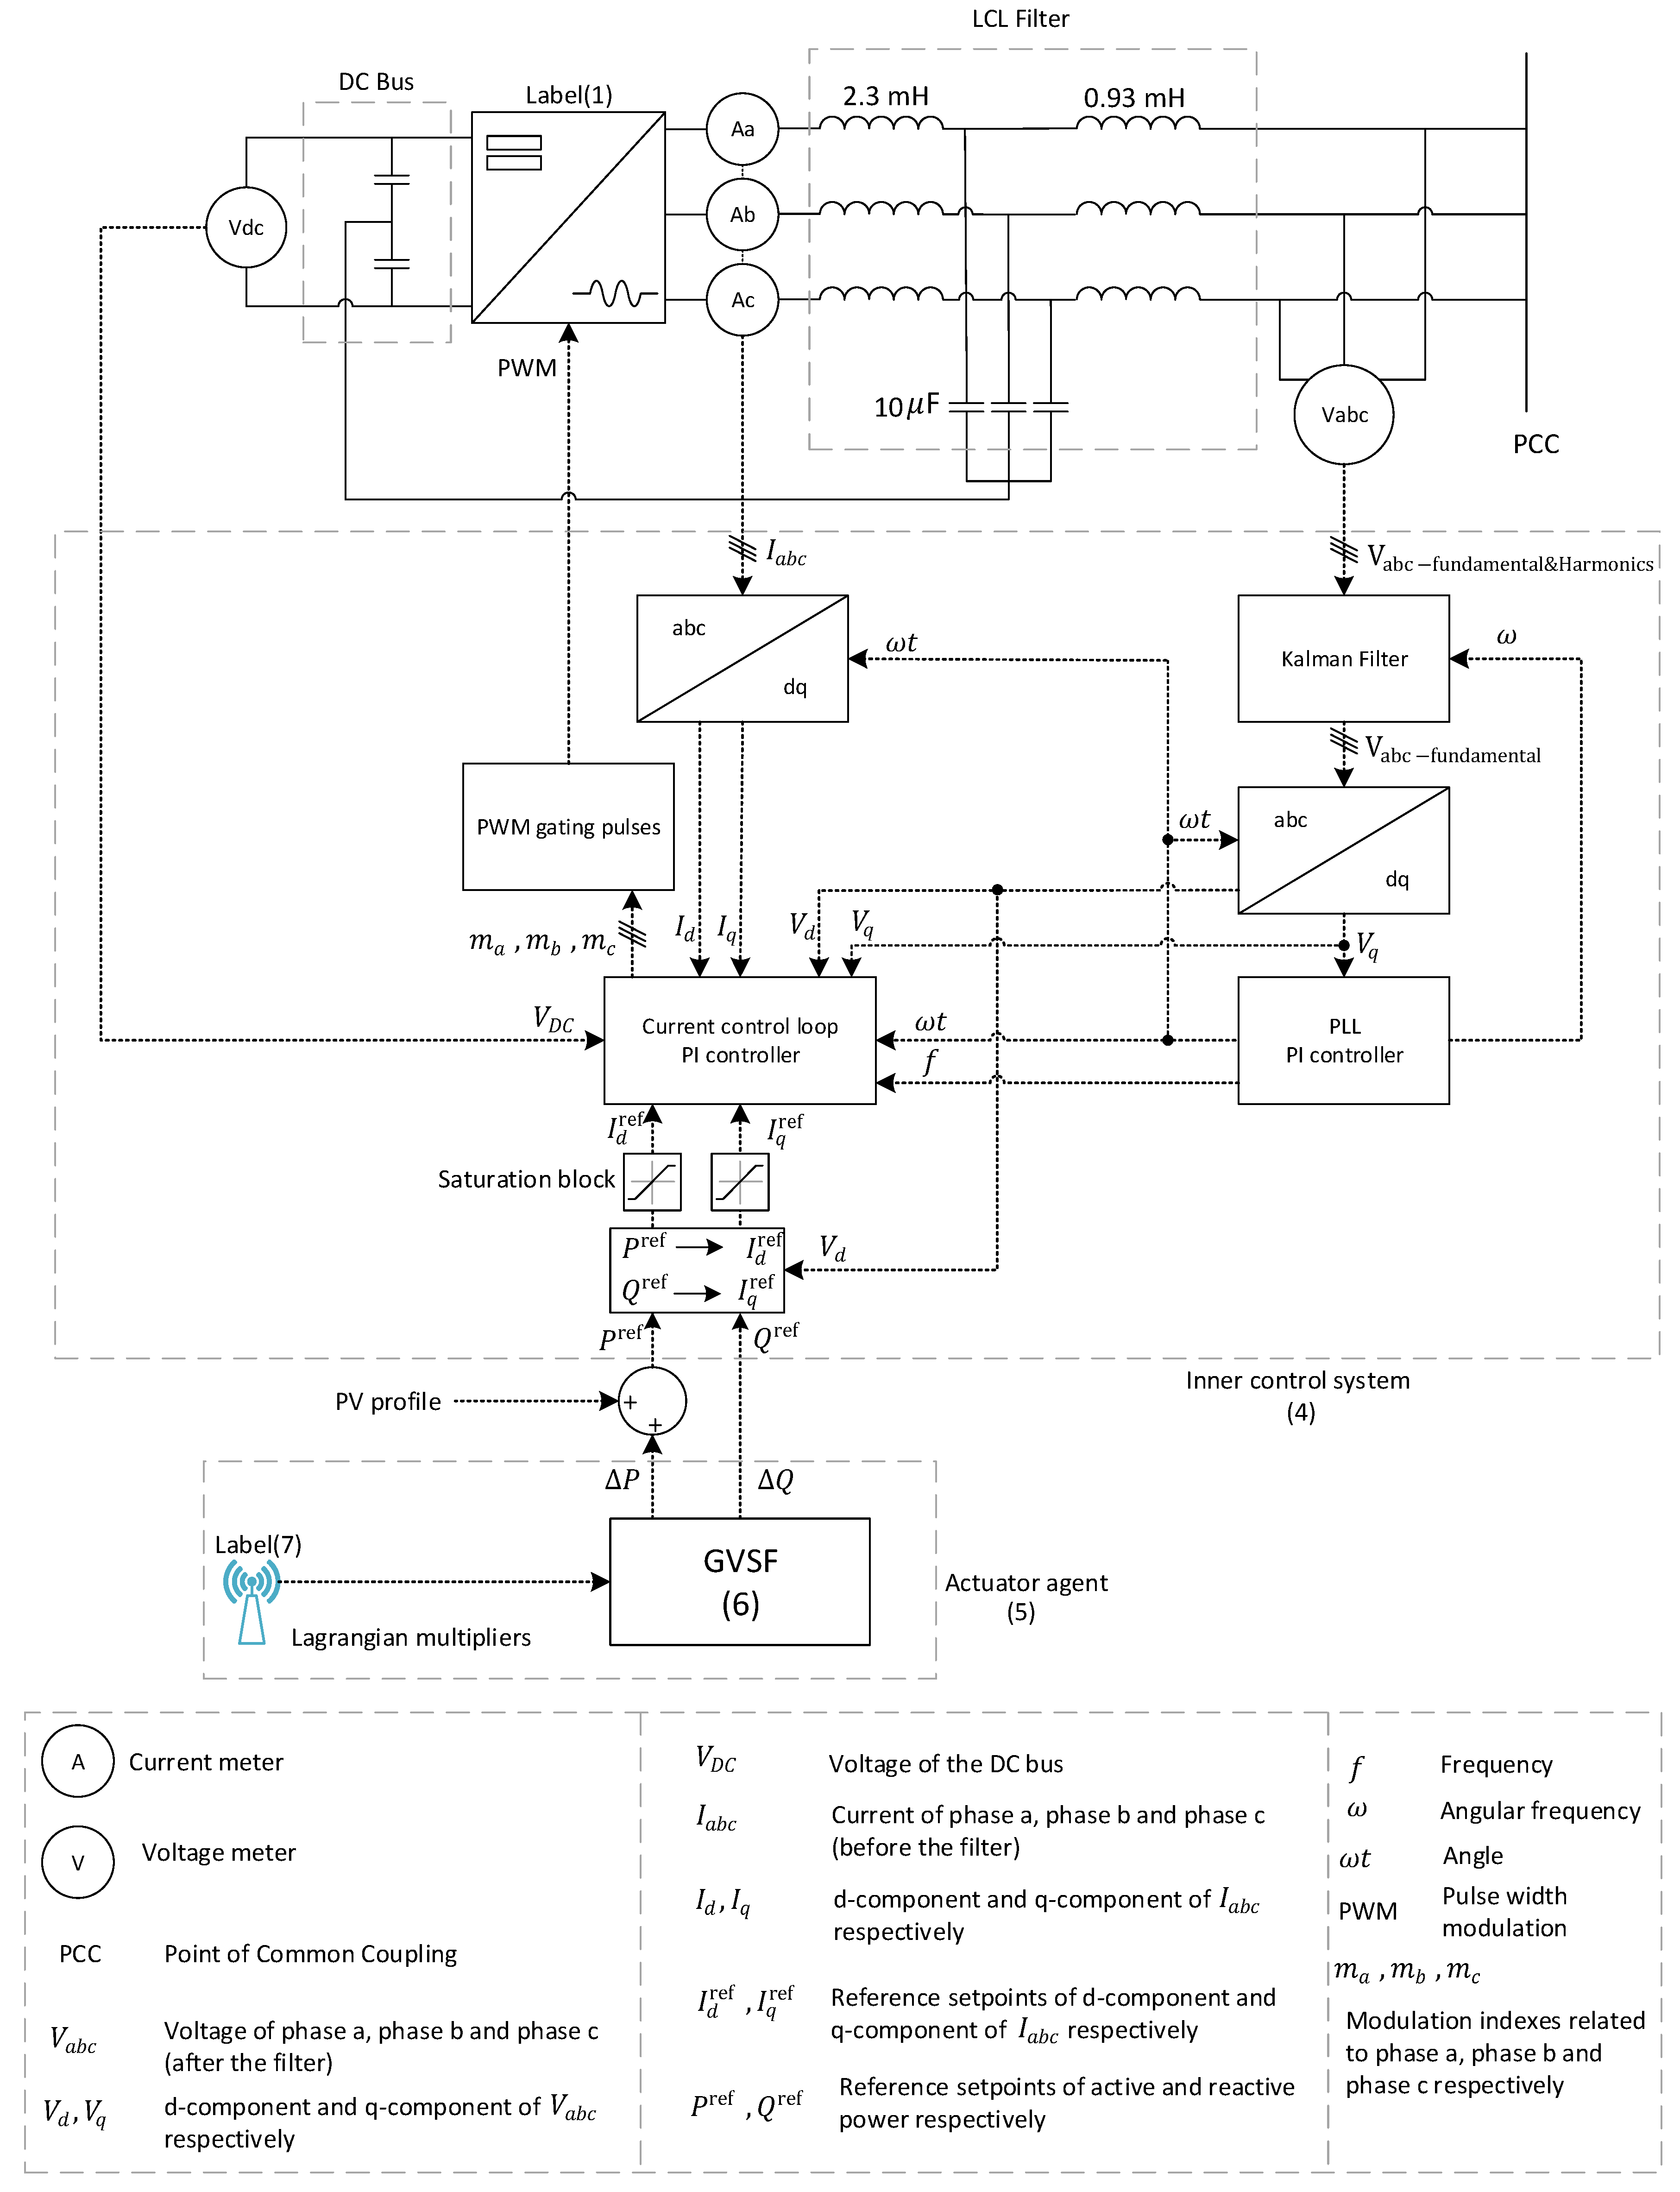
The P2P voltage control algorithm represents a high level control system to coordinate the inverters in a distributed way aiming at regulating the voltages within the accepted limits. For the inverter to be able to follow the regulation of the P2P control algorithm, an internal control system has to be implemented and integrated with the GVSF. We have implemented a state-of-the-art current control loop, Phase-Locked-Loop (PLL), and Kalman filter to drive the inverter. The inner control system of the inverter is depicted in Figure 5.
The inverter uses current-mode control to control the active and reactive power. The line current is tightly regulated by the current control loop, through the inverter AC-side terminal voltage. Then, the active and reactive power are controlled by the phase angle and the amplitude of the inverter current with respect to a rotating frame that is synchronized with the point of common coupling (PCC) voltage using PLL. A Kalman filter is placed in front of the PLL in order to ensure that the PLL input at all times matches an ideal sinusoidal waveform as closely as possible, even when the voltage is highly distorted by the presence of harmonics. This ensures fast and low distortion operation of the PLL. Kalman filter is used in this work because it efficiently deals with the uncertainty of tuning its parameters.
The reference set-points of active and reactive power are calculated based on the PV profiles and the decisions of the GVSF as shown in Figure 5; then the reference set-points of active and reactive power are converted into d-q (direct-quadrature) reference set-points of the three phase current and these d-q set-points are used by the current control loop as a reference to control the d-component and q-component of the three phase current in order to follow the reference set-points of active and reactive power.
The details of the design and tuning of Kalman filter are presented in [29]. Chapter 8 in [30] presents the details of the design and tuning of the proportional-integral(PI) controllers used by the current control loop and PLL. The d-q transformation (of the current, voltage and power) can be also found in the same chapter.
It is worth mentioning that we have not used a voltage control loop, because the voltage of the DC bus is fixed by the DC source. For the inverter to be able to inject power from the DC side to the AC side, the DC bus has to be charged to a DC voltage higher than 650.6 V, which is the peak-to-peak voltage (phase to neutral) of the grid connection ().
5. Device-to-Device Communication
5.1. Background
Device-to-device communications typically refer to cellular communications technologies enabling direct transmission between proximate devices, without relaying information through the cellular base station [31]. However, D2D communications is not the exclusive domain of cellular networks and generally relates to the ability of peer devices to directly communicate with one another without having to relay the actual data through a central coordinator device, as e.g., used in [32,33]. The paper [31] presents a survey of the current state of the art for cellular D2D communications and points out that cellular D2D communications are much more efficient than communications on unlicensed spectrum as the communication interference is controllable at the licensed spectrum. The paper categorizes cellular D2D communications into four categories based on the level of control the base station has on them. The first category is device relaying with base station assisted controlled link. Here the base station allocates the channel resources for user equipment communications so that user equipment in poor coverage can maintain connectivity with the network. Direct communication between devices with base station assisted controlled link is the second category, where user equipment exchange data directly and some of these features have already been standardized by 3rd Generation Partnership Project (3GPP) release 13 proximity services and in release 14 for cellular vehicle-to-everything (C-V2X) communications (mode 3). The C-V2X uses outband communications as the actual data communications occur at the intelligent transportation system licensed radio frequency band and not on the cellular bands. The third category is relaying device with device assisted controlled link, where the user equipment communicate with one another using relays and without base station control. The fourth category is direct D2D with device assisted controlled link, where the user equipment communicate directly with one another without base station provision of control links. The paper [34] proposes a solution combining categories three and four for smart grid demand response scenarios for increased resiliency of smart grid operations.
The D2D communications required for P2P voltage control need not be based on cellular technologies and currently, no commercial-of-the-shelf cellular D2D chipsets are available. The key criteria for the selection of appropriate communication technology to adopt arise from the distances and placement of the observer and actuator agents. Common unlicensed band communication technologies like the IEEE 802.11 family (WiFi) or the IEEE 802.15.4 family (low rate personal area network) can be utilized if the distances between agents are within a few hundred meters and they have been installed outdoors or inside buildings near the exterior walls. Even then mesh type network where devices communicate in ad hoc fashion are required to ensure reliable connectivity. In other cases low power wide area (LPWA) communication technologies need to be utilized. Raza et al., [35] provide a survey on LPWA networks and claim that they represent a novel communication paradigm, which will complement traditional cellular and short range wireless technologies in addressing diverse requirements of Internet of Things (IoT) applications. This applies to smart grids in particular as LPWA technologies offer unique sets of features including wide-area connectivity for low power and low data rate devices, not provided by legacy wireless technologies. As an example, [33] proposes a gateway assisted D2D communications solution utilizing Long Range Wide-area network (LoRaWAN) technology and the work is a basis for the D2D communications scheme used in this paper. The work in [33] and the communications solution of this paper are not the same though; the work in [33] is similar to the second category whereas the solution applied in this paper is similar to the fourth category of cellular D2D communications, both using LoRaWAN technology.
5.2. D2D Communication Modules
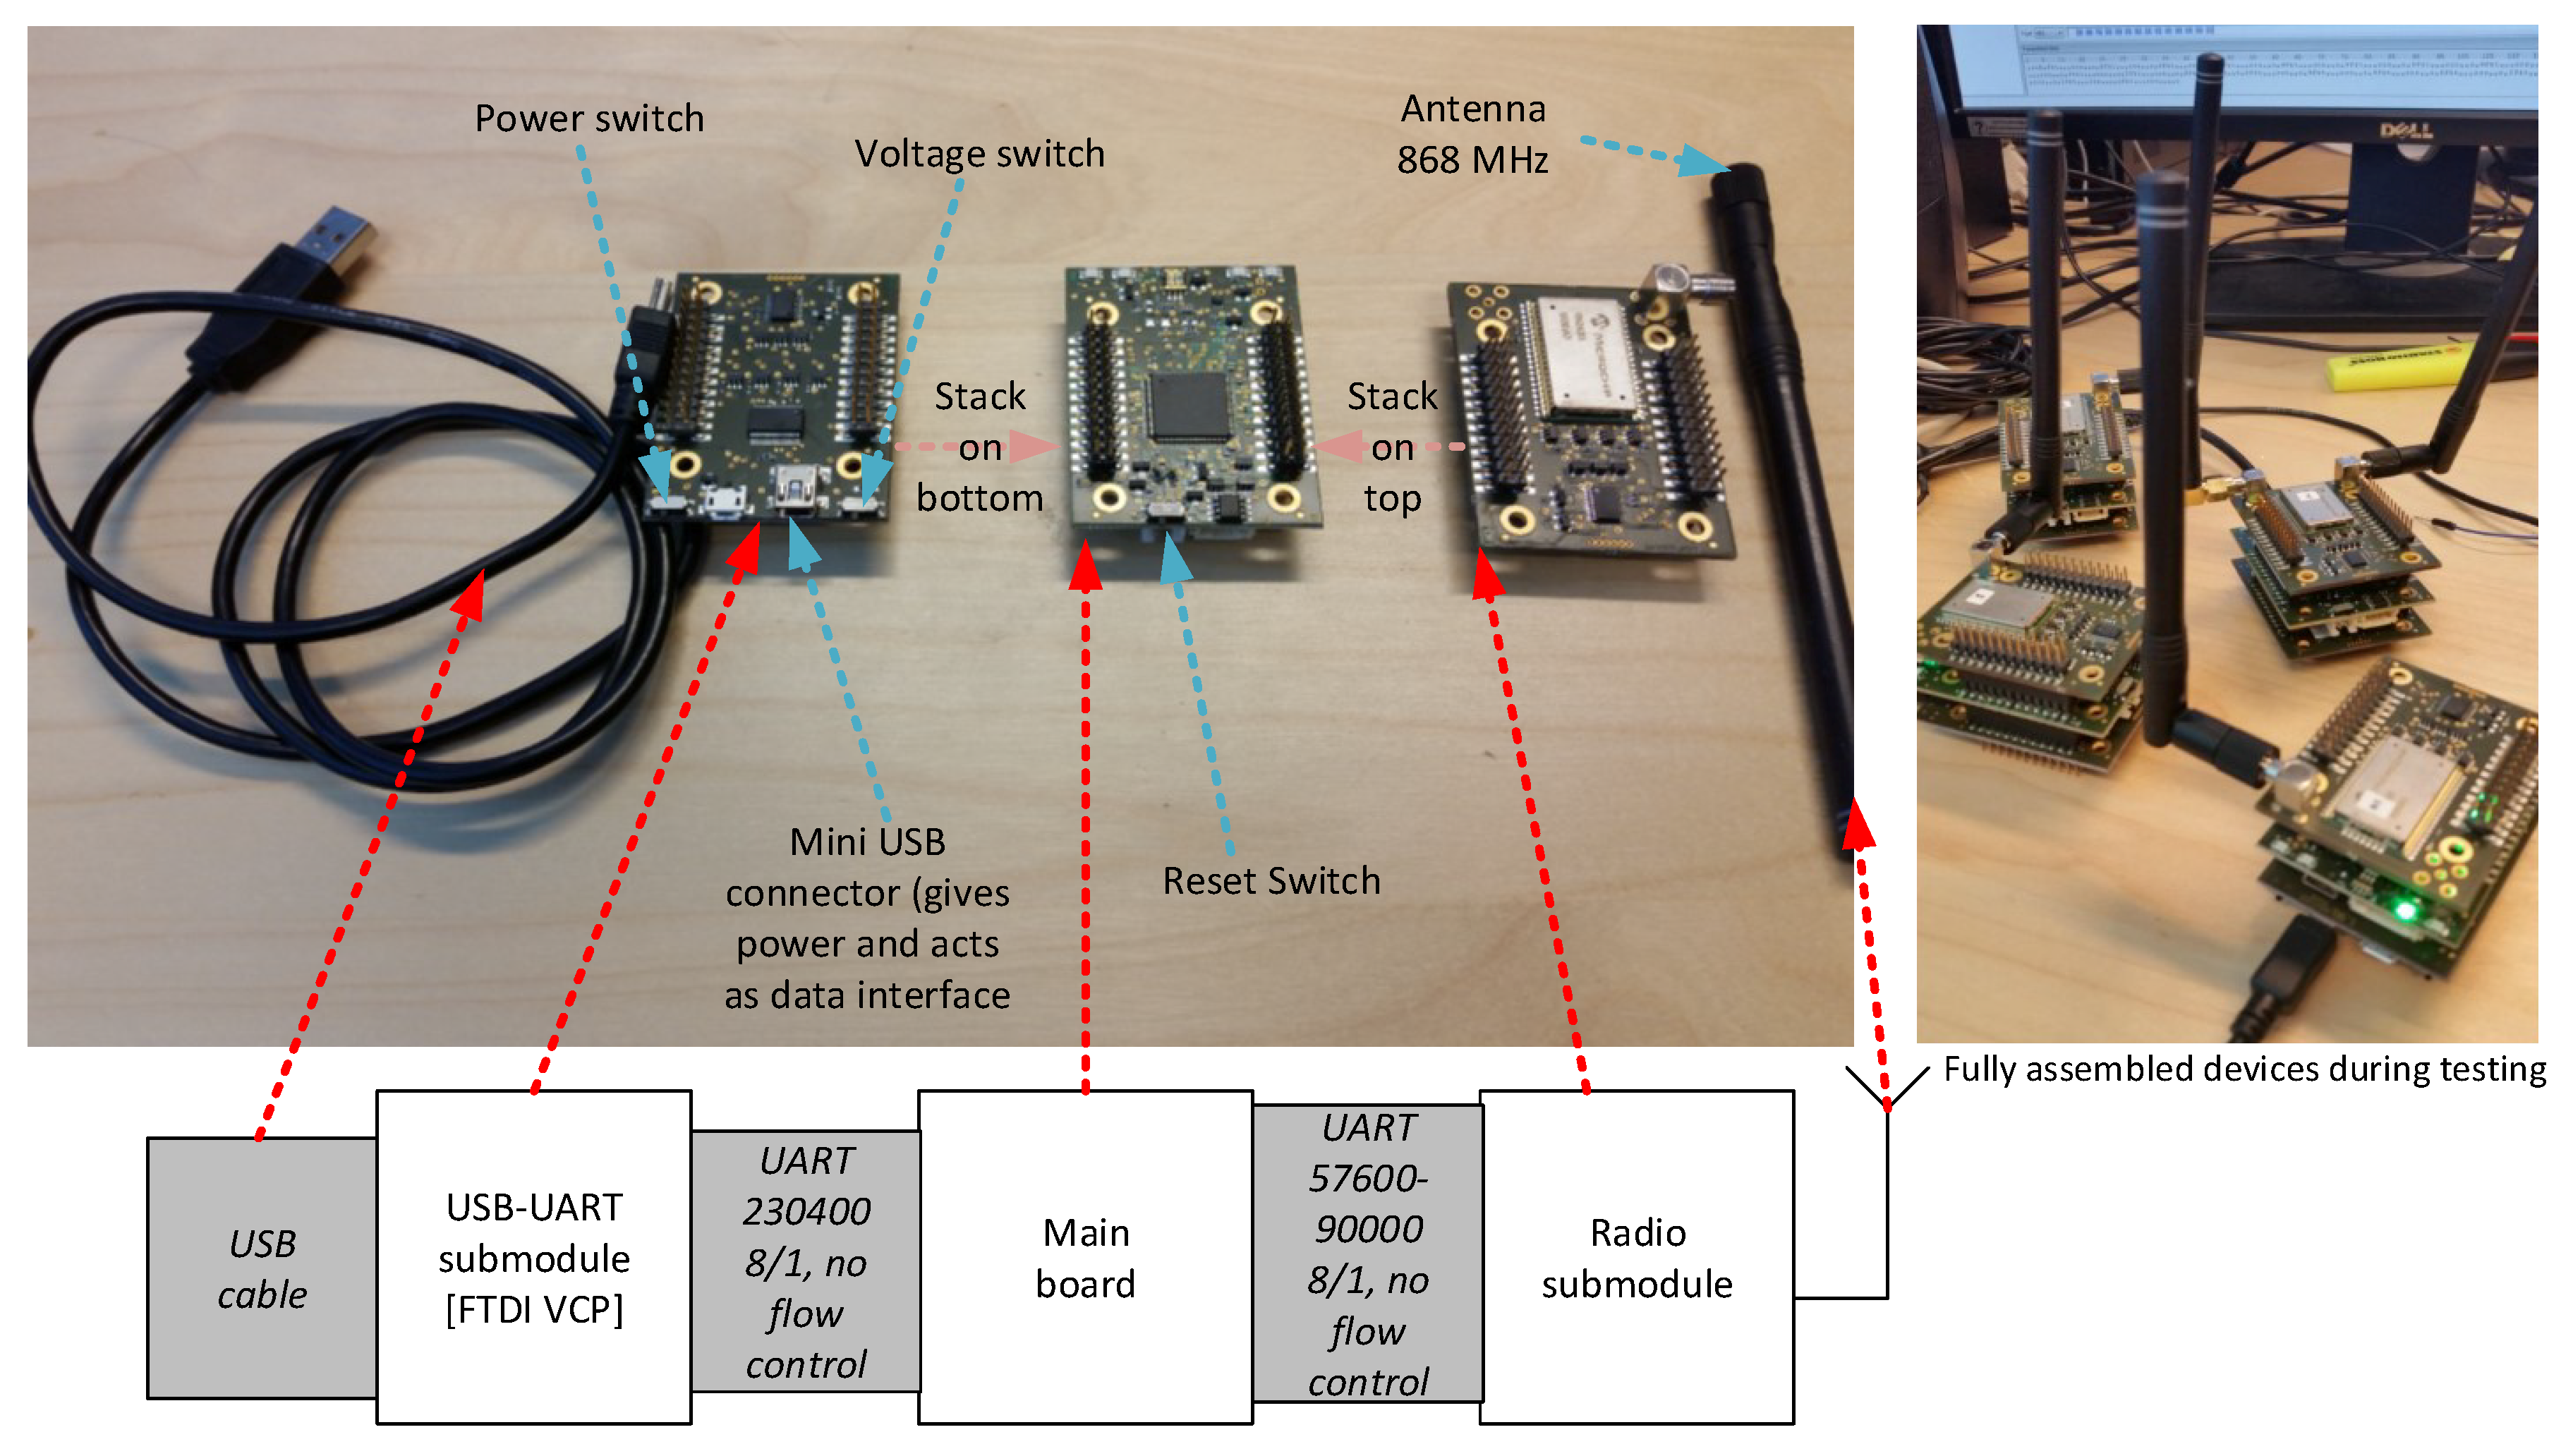
The D2D communication modules are implemented based on a modular WSAN/IoT platform (wireless sensor and actuator network/Internet of Things) [36]. Each module is composed of three submodules stacked on top of each other, as shown in Figure 6. The radio submodule (the top submodule) hosts the RN2483 LoRaWAN radio transceiver (Microchip Technology, Chandler, AZ, USA). The main submodule (the middle submodule) includes the microcontroller (ST32F217, STMicroelectronics, Geneva, Switzerland), the power circuitry, and other peripherals. The USB submodule (the lower submodule) hosts an FTDI USB-UART chip (FT8U232AM, FTDI, Glasgow, UK) (FTDI: future technology devices international (semiconductor device company), USB: universal serial bus, UART: universal asynchronous receiver-transmitter). Additionally, each D2D module needs to have an 868 MHz SMA (SubMiniature version A) antenna. Also a mini or micro USB cable (any of these two, but only one at a time) should be connected to the USB submodule to interface with the agents (actuators and observers). The power required for the module’s operation is also provided via the USB interface (maximum consumption is in the order of 200–300 mW).
5.2.1. Implemented Embedded Firmware
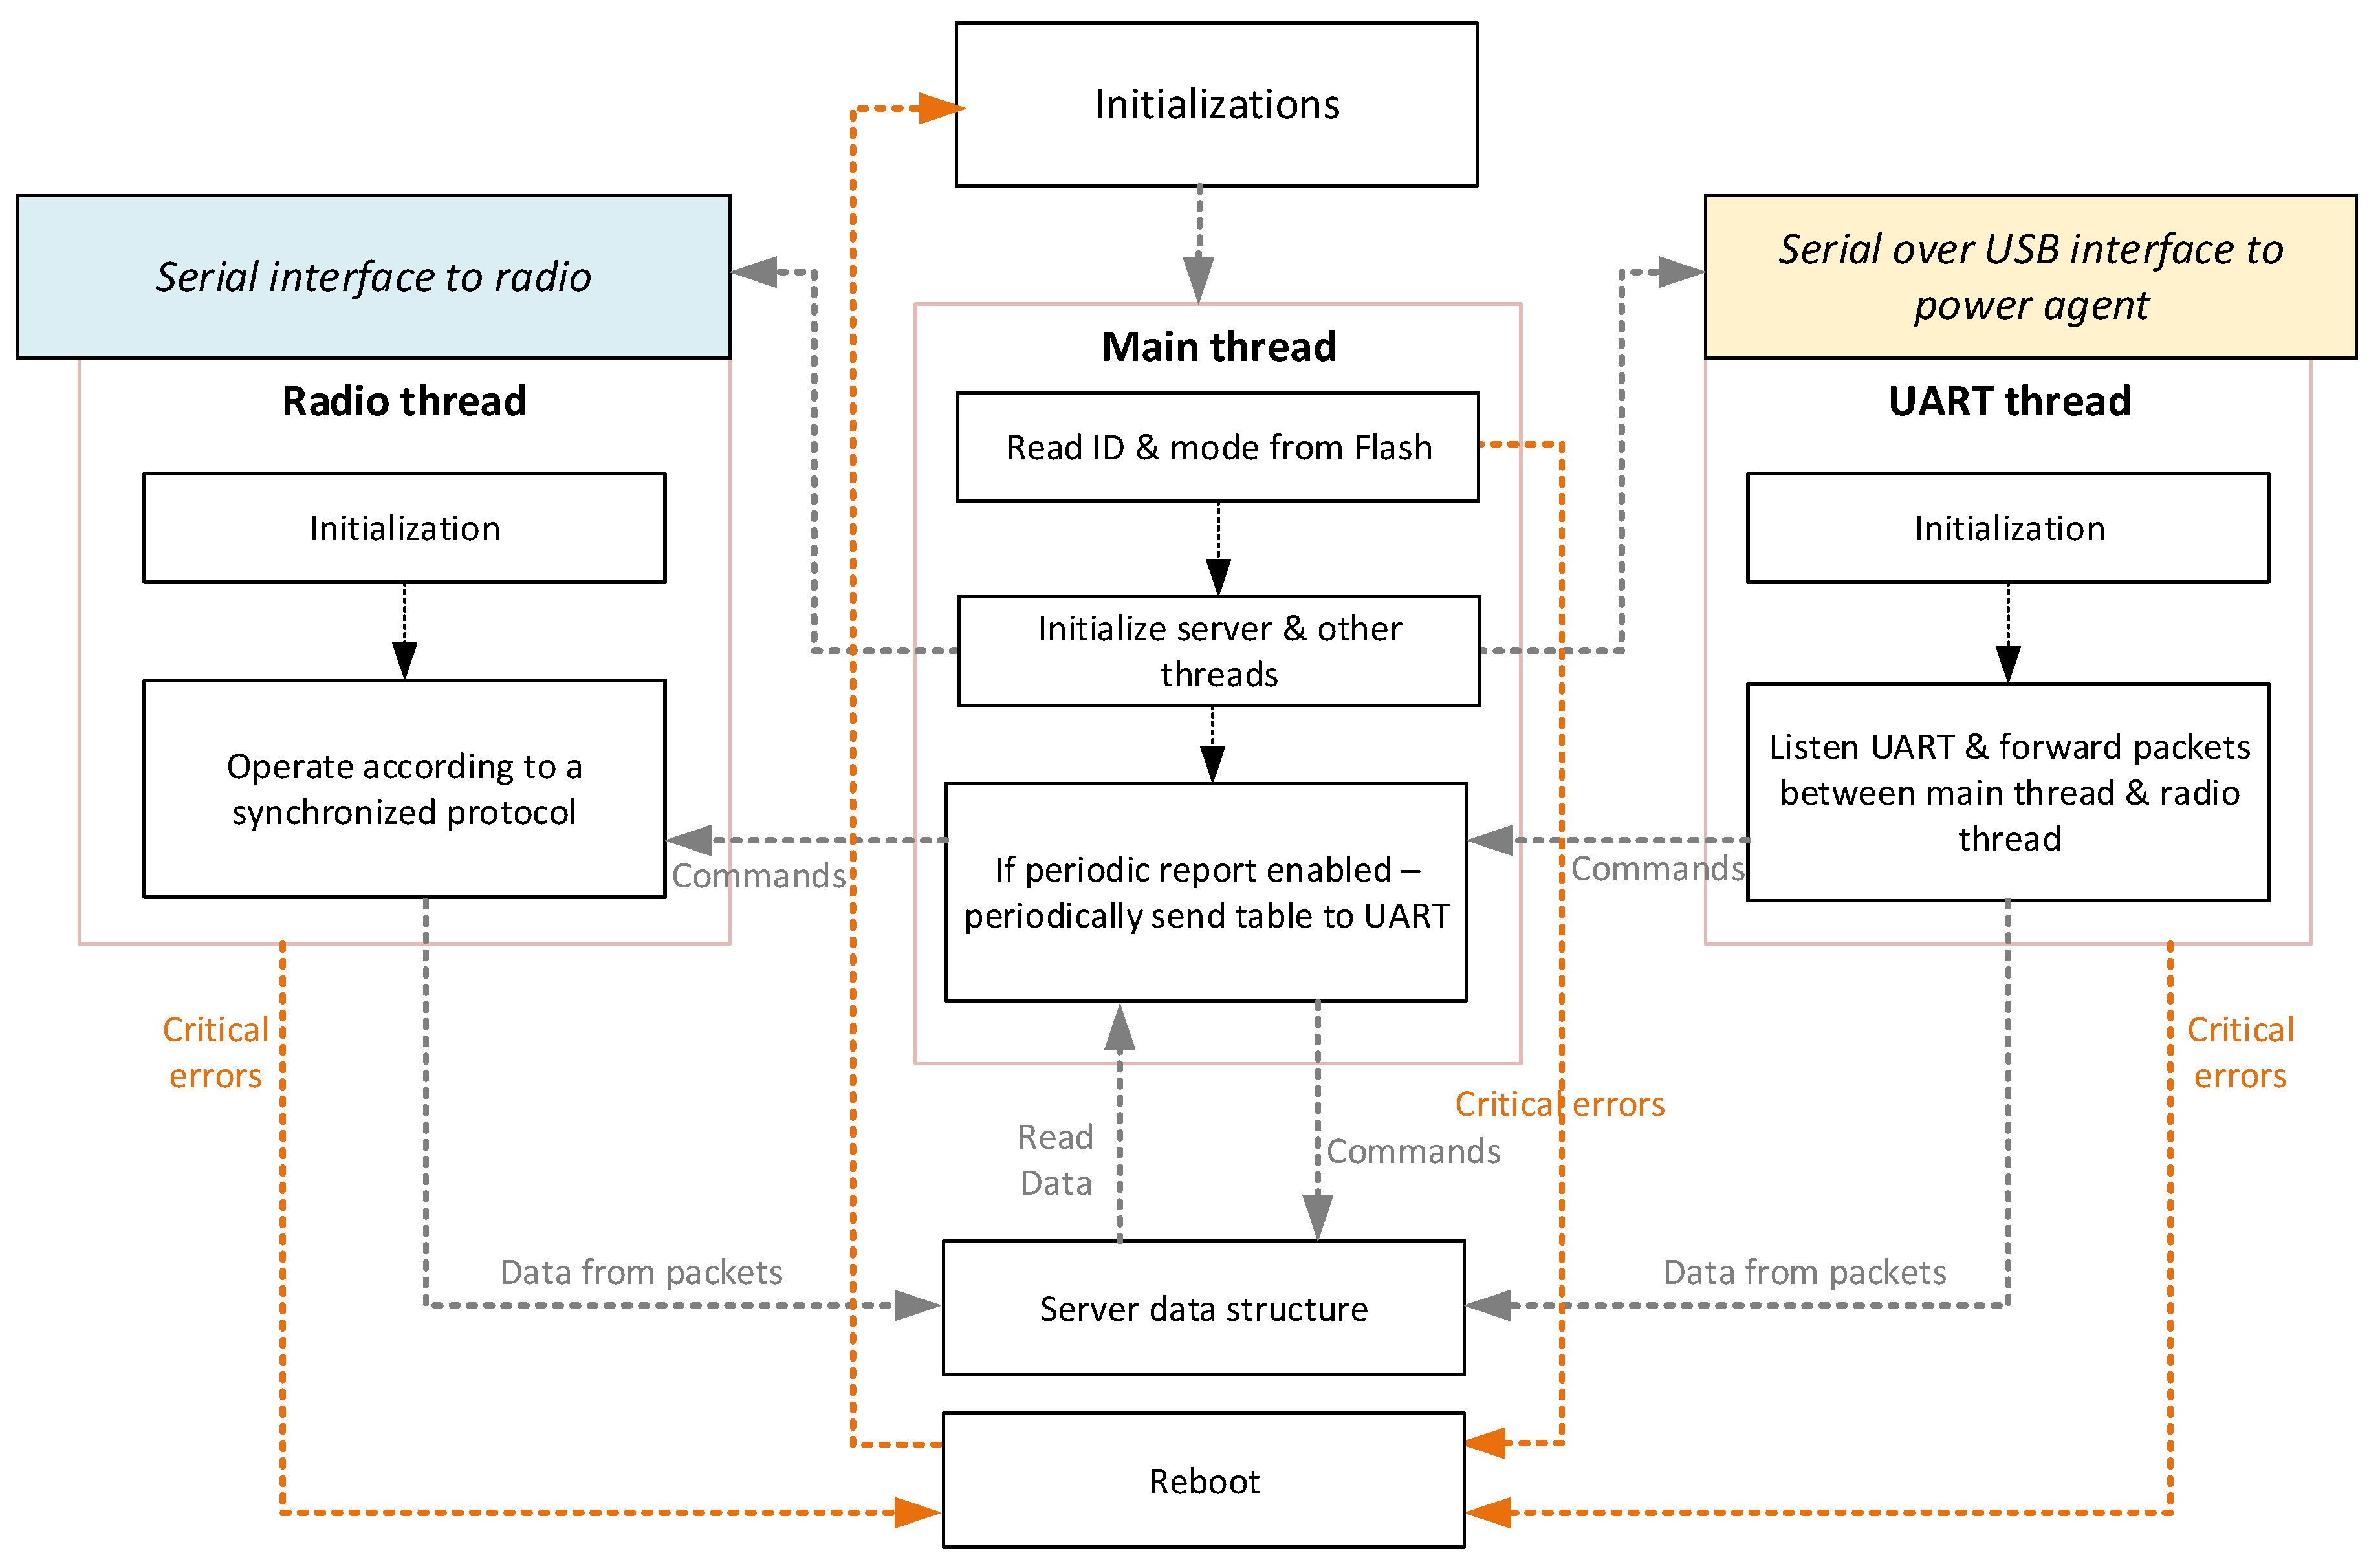
The application software is written in C (Dev-C++, Cambridge, MA, USA) and operates on top of the FreeRTOS embedded operation system (10.0.1, Real Time Engineers Ltd., Bristol, UK). The software has been developed using Eclipse (Kepler Service Release 2, Eclipse Foundation, Inc., Ottawa, ON, Canada) and compiled with GNU Compiler Collection (GCC) (7.1, Free Software Foundation, Boston, MA, USA) for Advanced RISC Machine (ARM) processors (ARMv8.3-A, Acorn, Cambridge, England, UK). The high level structural diagram of the embedded firmware is depicted in Figure 7 and it is composed of the three threads: main thread, radio thread, and UART thread. The main thread is initialized after the basic initialization procedures (setting clock, checking the module and configuring the peripherals, blinking LEDs). The main thread initializes the UART thread for communicating with the physically connected agent, the radio thread for controlling the radio transceiver, and the server data structure for storing the data from the agents. The UART drivers are implemented based on direct memory access (DMA) and use a timer to detect end of a packet. Due to this reason, agents should enable for at least a 5 ms idle time between the sequential UART packets.
The server data structure is implemented as a table listing the identifiers of the agents and the most recent data from them. The server structure is accessed and can be modified by either the radio thread or the UART thread. The D2D module can be configured to periodically report the complete table (i.e., the data from all other agents) to its agent.
The developed firmware implements a multi-stage error detection and correction system. In case of noncritical errors (e.g., wrong format of UART commands from the physically connected agent) the module recovers automatically. In case of severe mistakes (detected by the software or if the software hangs), the module reset procedure is initiated. After reset, the most recent state of the module is recovered. The restored data does not include the calculations made by the connected agent.
5.2.2. Synchronized Protocol
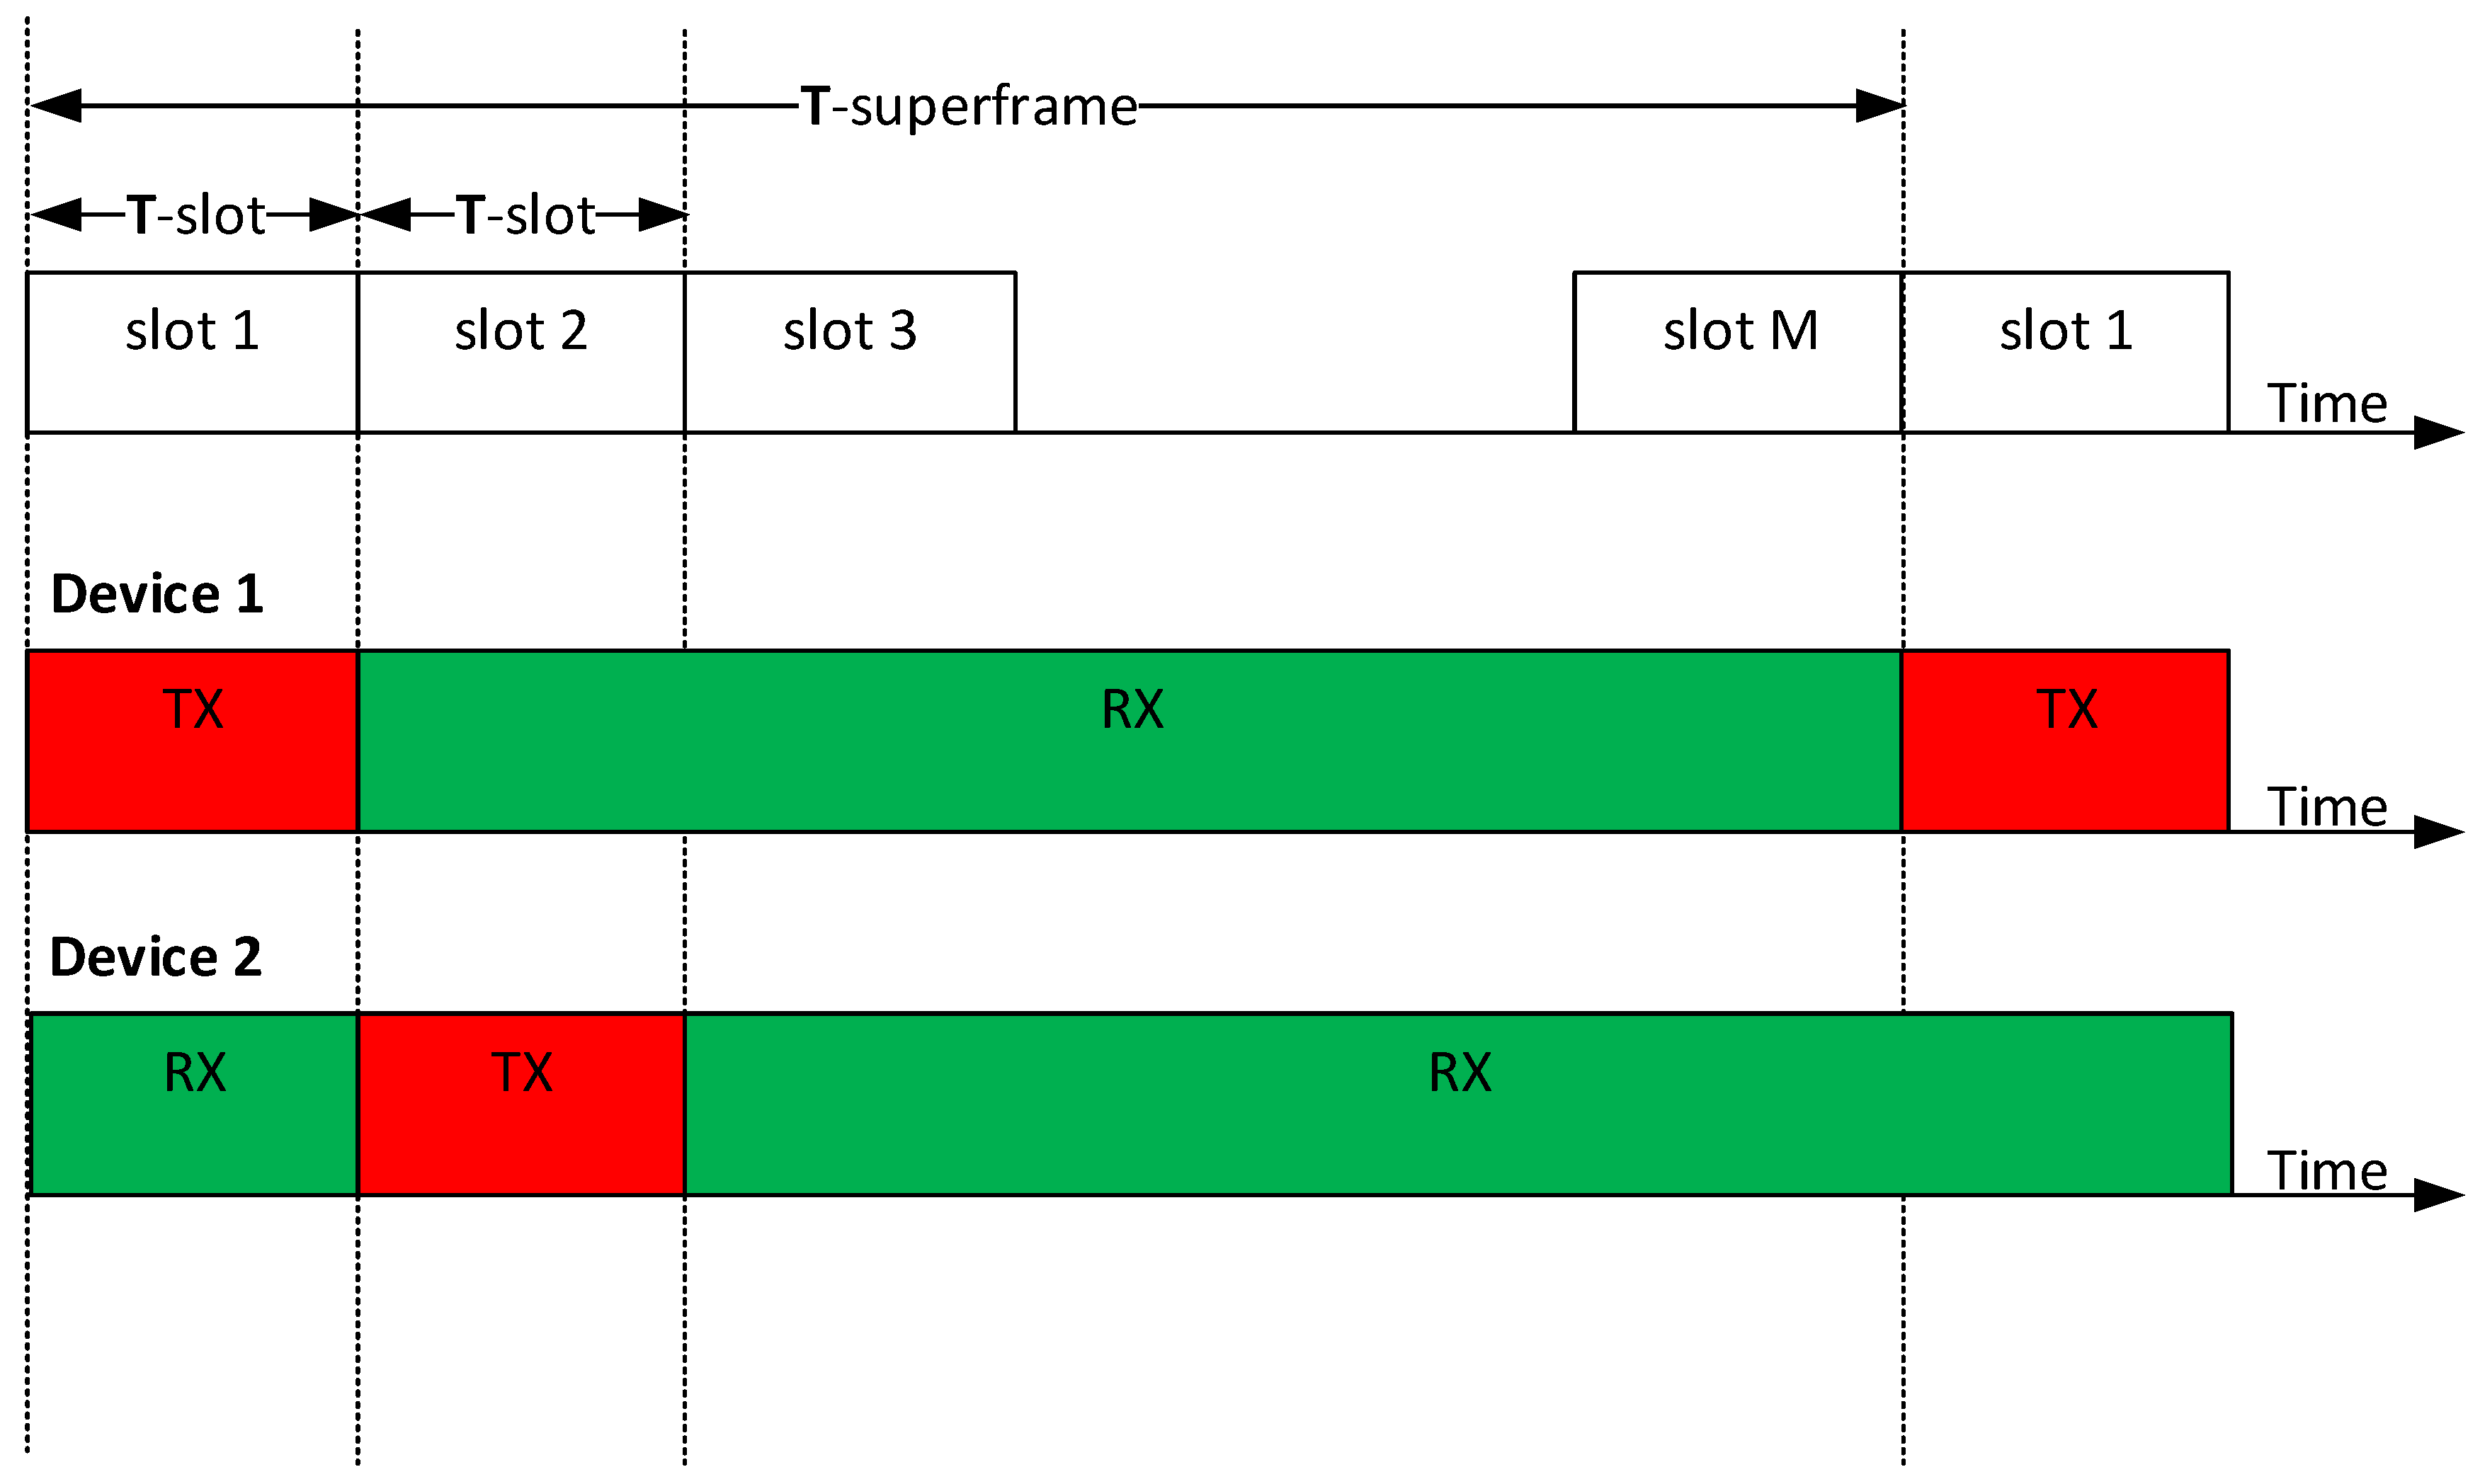
The radio thread handles control over the radio transceiver and implements a synchronized radio protocol. The synchronized protocol is a simple slotted protocol, where each of the D2D modules is assigned a periodic time slot for transmission of its data and receiving the transmissions from the other modules in their respective slots, as shown in Figure 8.
The parameters of the protocol, namely the number of slots (M) in the superframe and the duration of each slot (T-slot) are hardcoded in the firmware and cannot be changed without reprogramming the module. Each module uses for its transmission the slot with the number equaling to its programmed identifier (i.e., a module with ID 1 will send in slot 1, etc.). Empirically it was found out that the need of using low-speed UART interface between the main module and the radio transceiver chipset and the slow operation of the chipset itself introduces substantial overheads (e.g., packet transmission, switching between transmit and receive, etc.). Due to this reason, the duration of one slot cannot be set below 150 ms.
When enabled the first time, the D2D module based on this protocol first scans the radio channel for several superframe periods. If it does no-t find any transmissions and it has data to send, it will start the transmission right away. If during scanning a module finds some transmissions ongoing, it will use this transmission as a reference for defining its designated slot. After each superframe, a module adjusts its synchronization. As a reference point for adjusting the synchronization, each module uses the timestamp of the packet with minimum identifier not exceeding the identifier of the module. If such a reference is not available, no compensation is applied. As a practical example, module 1 transmitting in slot 1 never adjusts its synchronization. If modules 2, 3 and 4 hear transmission of module 1, they will adjust their synchronization based on it. If module 5 does not hear module 1 but hears modules 2 and 3, it will adjust its synchronization based on the transmission of module 2.
6. Results of the Experiment
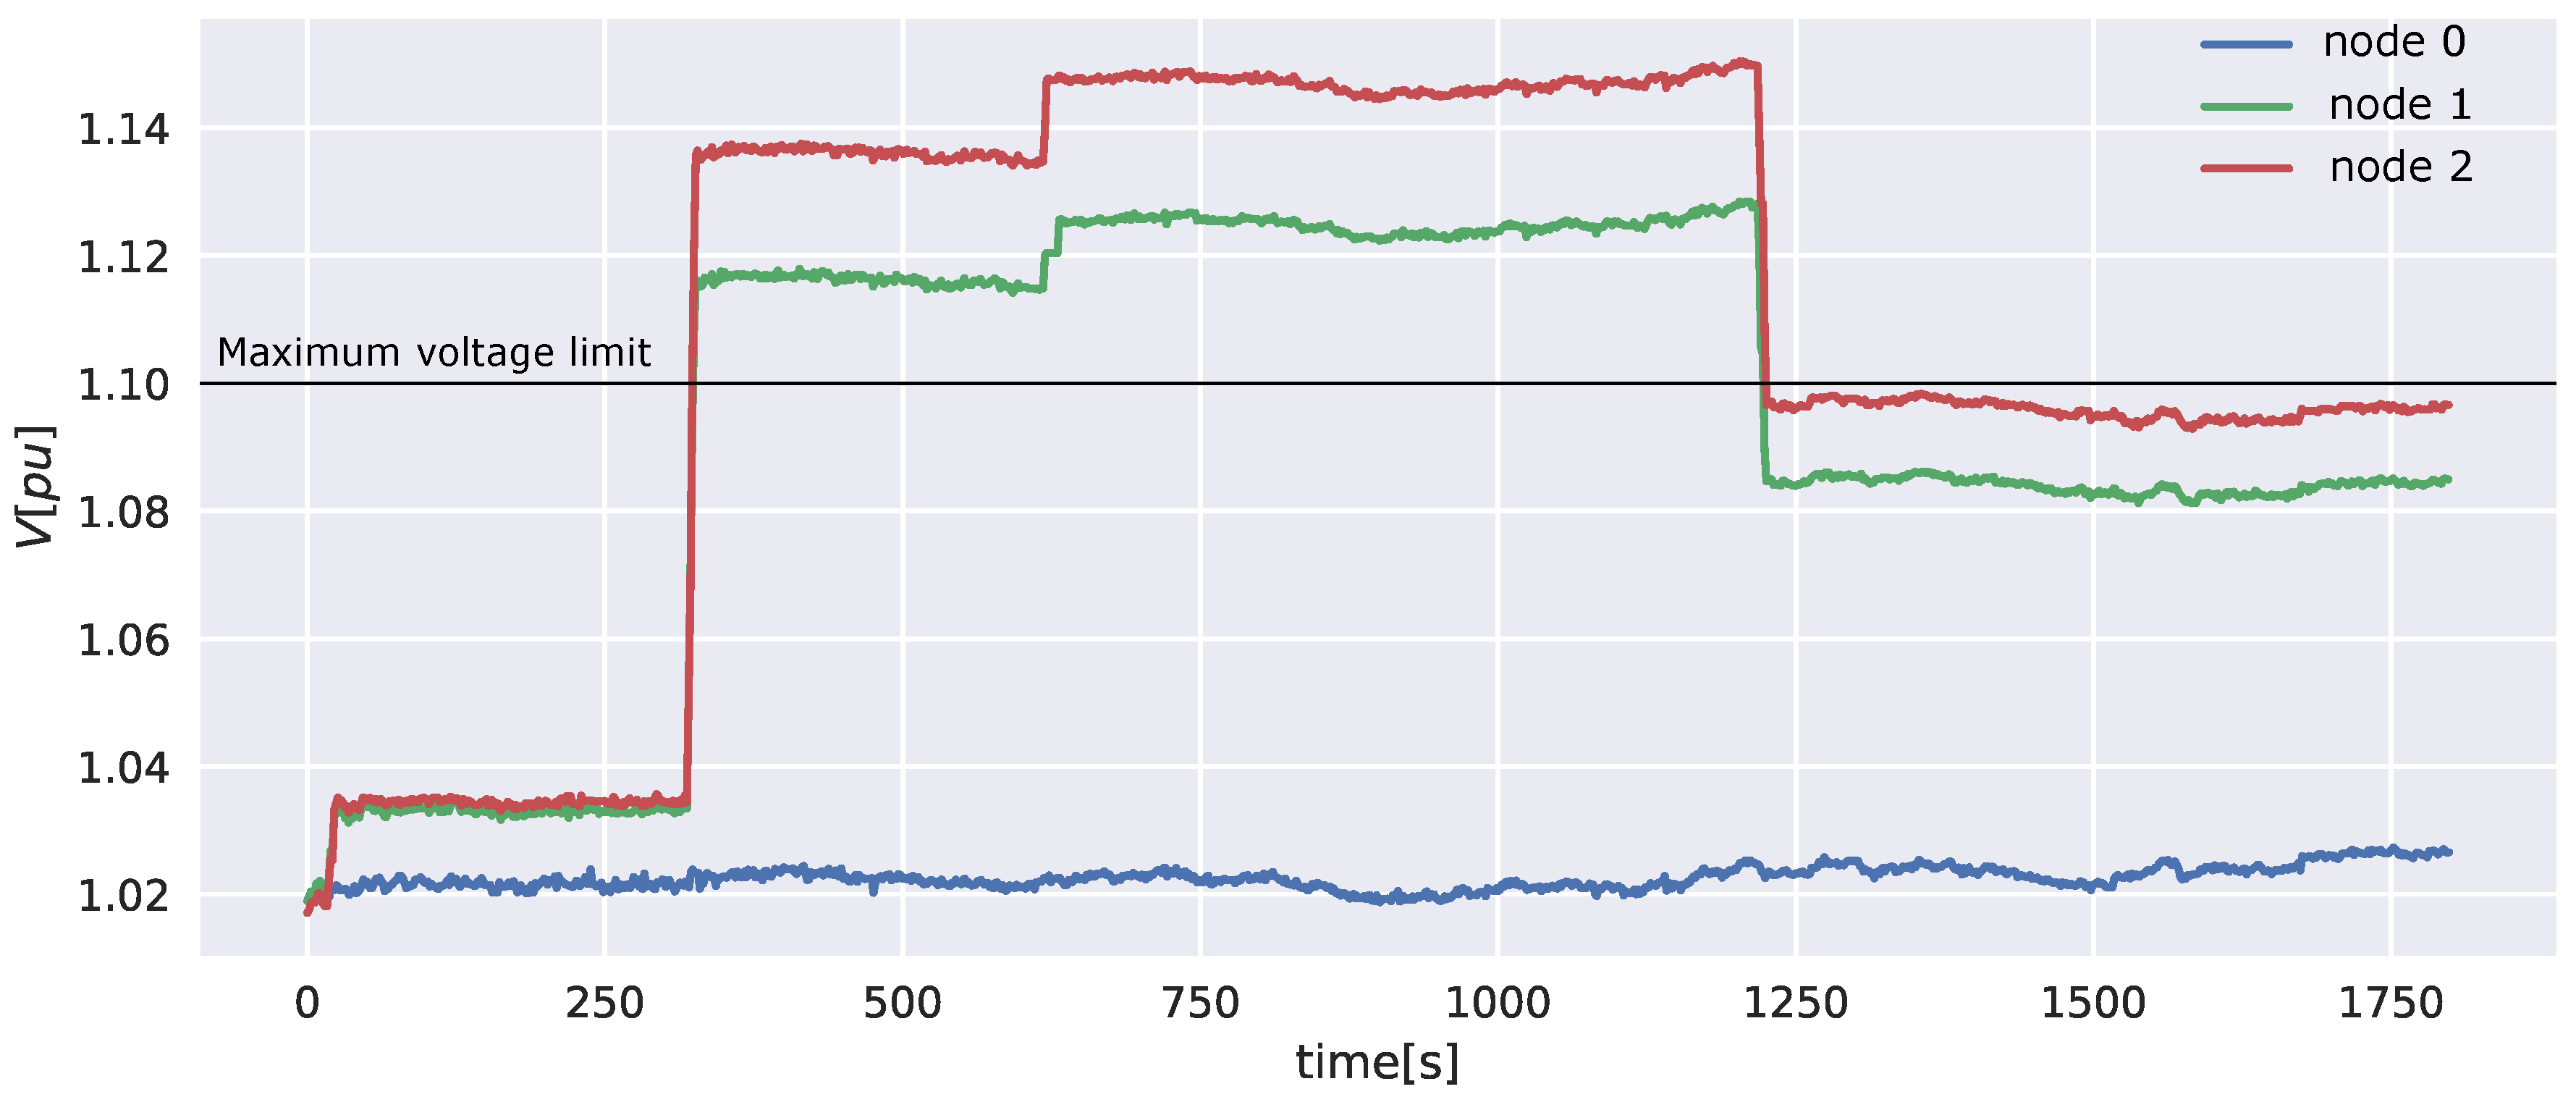
To test the performance of the P2P distributed voltage control system, one needs to create a voltage rise (or drop) problem and solve it in a P2P fashion. To create a voltage rise problem in a laboratory-based microgrid, a high-power injection from the inverters back to the grid can be used. Alternatively, the impedance of the feeder depicted in Figure 2 can be oversized to create such a problem with low-power injection. In the following experiments, R1 and R2 are set to 8 , L1 and L2 are set to 5 mH. Figure 9 shows the generation profile applied at both inverters. The active power generation starts at zero, and increases to a maximum of 1200 W. At the higher generation, the voltage is expected to rise above the maximum voltage limit. To comply with the European standard EN 50160, the voltage limits and are enforced to be of the nominal phase voltage.
Two experiments are carried out to compare the voltage profiles with and without voltage control. The comparison helps in quantifying the performance of the P2P voltage control.
6.1. First Experiment: Without P2P Voltage Control
6.2. Second Experiment: With P2P Voltage Control
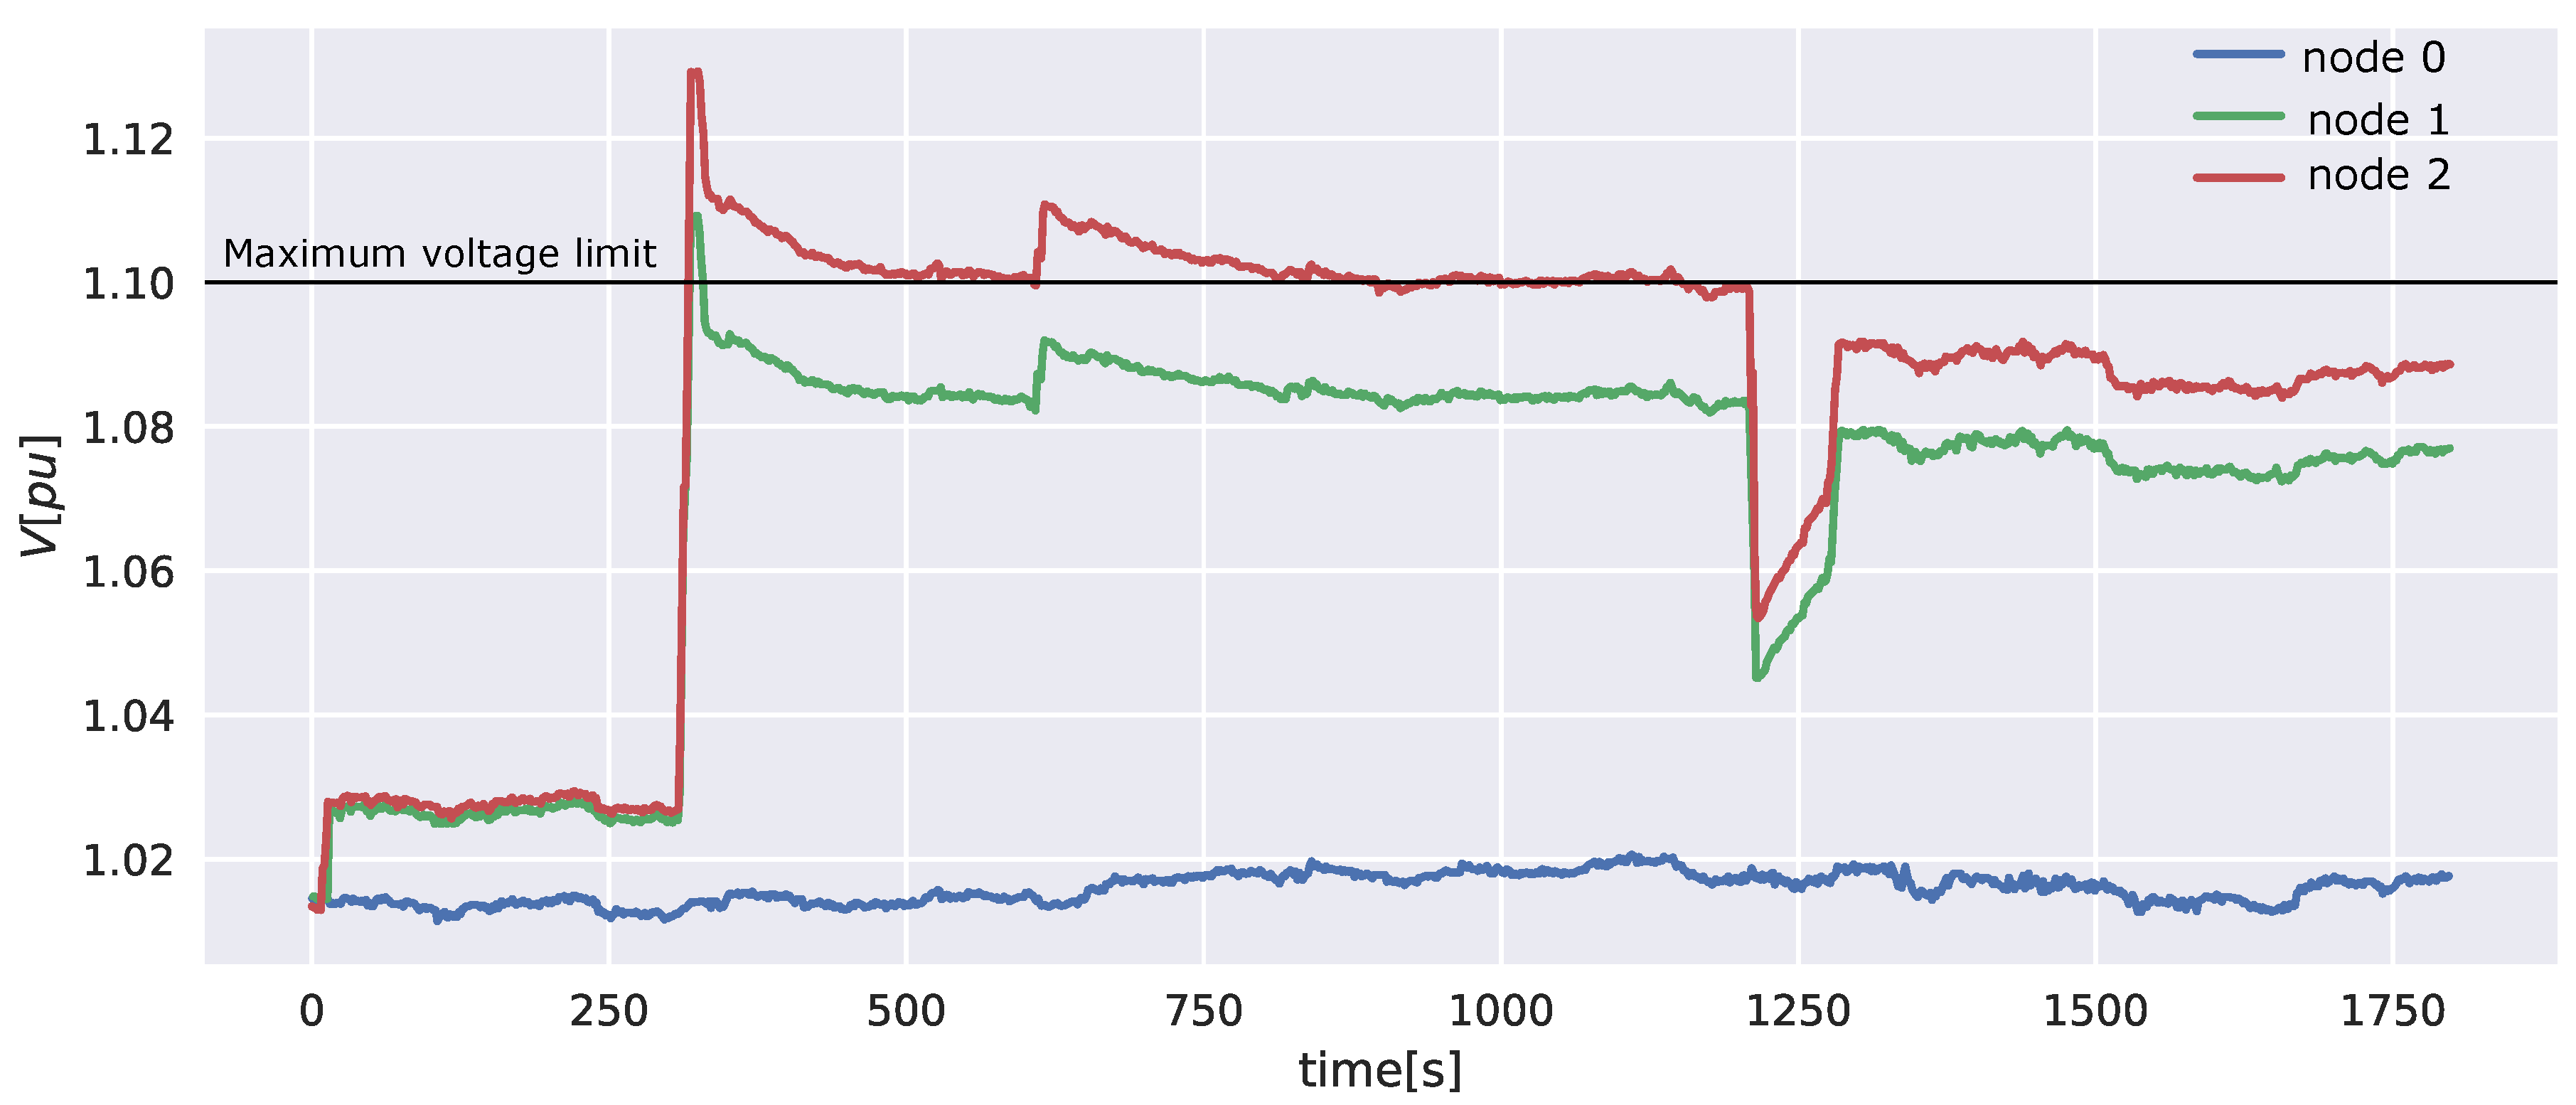
The inverters apply the same generation profile, but now the agents execute the distributed voltage control algorithm. This leads to the voltage profile shown by Figure 11. When an increase in generation causes an over-voltage issue, the agents bring the voltages back to the defined limits () within 3 min.
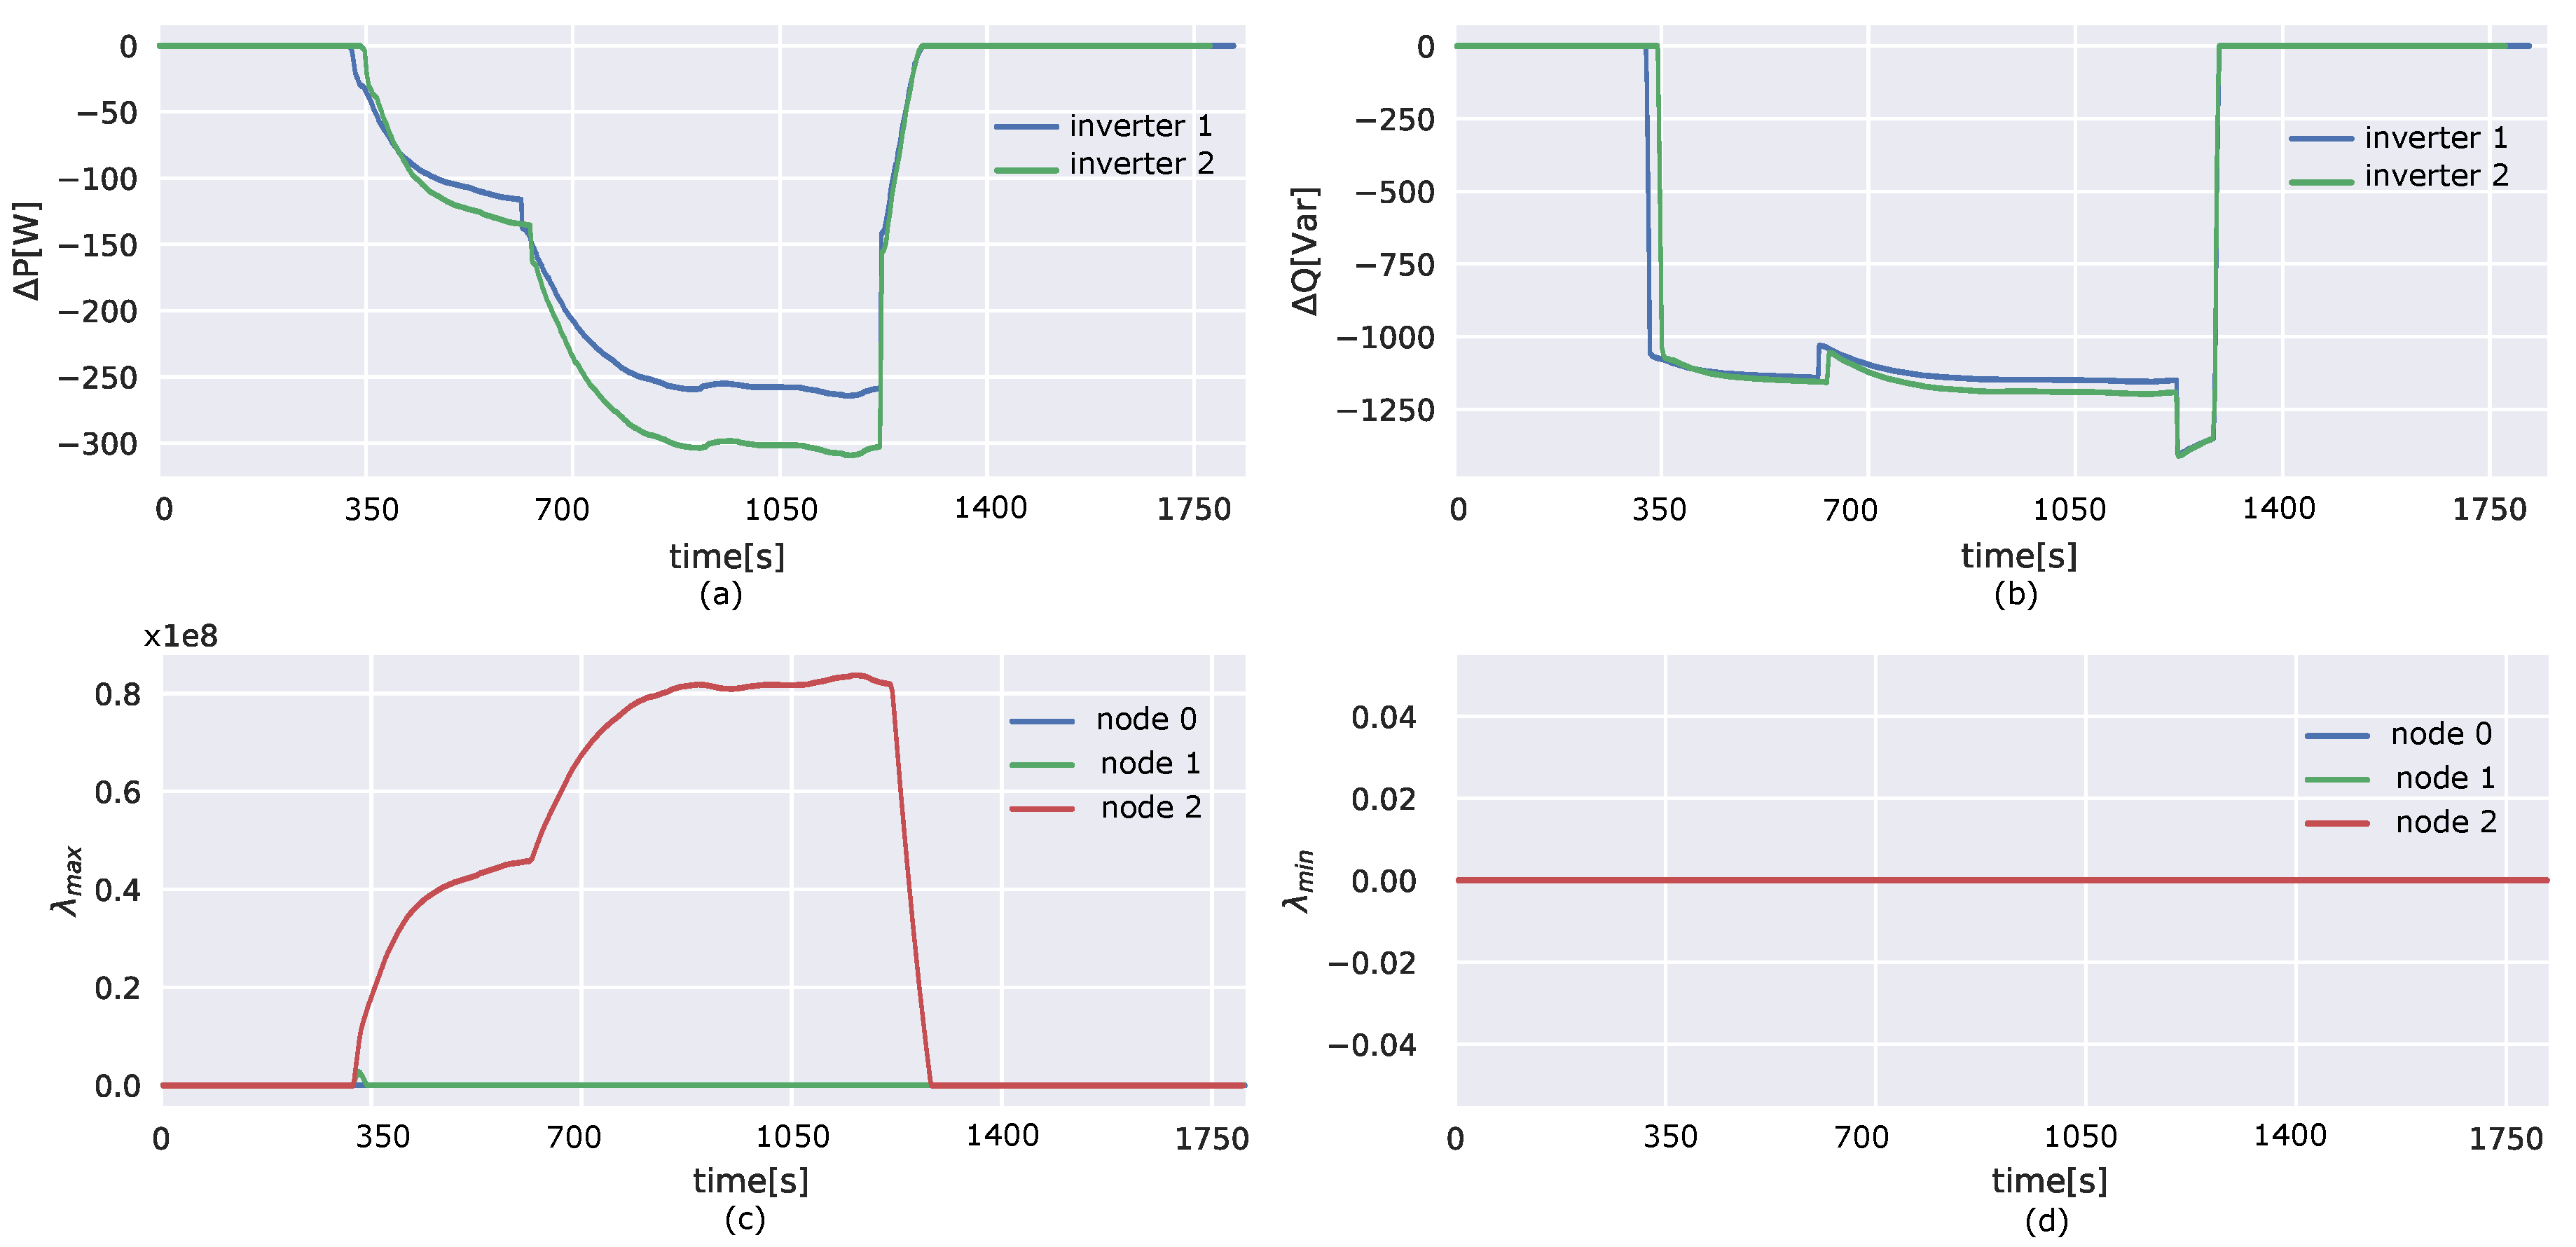
The actions of the observer and actuator agents are reflected in Figure 12. The evolution of the control signals over time are presented in Figure 12c,d. The control signals for under-voltages () are zero, because no under-voltages beyond the limits occur during this experiment. The control signals for over-voltages () however, increase sharply after an increase in the voltages above . One can notice that the control signals return back to zero when the voltages return back to normal values without compensation, due to a decrease in the generation profiles.
Figure 12a,b shows the actions taken by the actuator agents. As soon as an over-voltage occurs, nearly all reactive power is dispatched. This behaviour depends on the values of , and . The step size controls mainly how fast the control signals will increase, and hence how fast compensation is dispatched. Since the cost of active power is set to be a lot higher than the cost of reactive power, the algorithm will dispatch first the available reactive power. is set high enough to get a fast response in the active power dispatch. However, this causes the dispatch of reactive power to be nearly instantaneous. and return back to zero when the voltages return back to normal values without compensation.
When the measured voltage is less than , starts to decrease till it reaches zero. One can explain this based on Equation (2). The Lagrangian multipliers drop back to zero because the underlying profile of the inverters change. The active power injection drops, and the voltage drops with it. The Lagrangian multipliers adapt to the new situation. When both and are zero at each observer, problem (1) can be written as:
One can notice that the solution of the above optimization problem is: and . Hence, a stop mechanism can be designed to stop the solver of the optimization problem whenever the Lagrangian multipliers are zero at each observer. This should decrease the computational burden of the algorithm.
6.3. Key Performance Indicators
There are three key performance indicators (KPIs) considered in this work: (1) Convergence time; (2) Voltage quality; and (3) Communication delays.
The first KPI, convergence time, is a measure for how long it takes the algorithm to solve the voltage problem. Voltage quality reflects how well the control algorithm can mitigate the voltage rise (or drop) problems. Finally, the communication delays depend on the communication infrastructure. Below follows an explanation of how each of these KPIs is quantified in practice.
6.3.1. Convergence Time
The voltage control algorithm is online and adjusts itself continuously. When a change in the generation profile occurs, there are two possibilities: either there is a voltage problem or not. If there is no voltage problem, the control algorithm stays idle. However, if there is a voltage problem, then the agents start to undertake action. The observer agents change the control signals until the voltage problems are resolved. If they succeed, then the control signals converge to a stable value, and the voltages converge to a value within the limits. In this paper, we define the convergence time as the time it takes from a moment when the voltage exceeds the limits until the moment when the voltage is restored within the limits. As demonstrated in Figure 11, it takes the algorithm around 3 min to regulate the voltages within the defined limits, which is an acceptable time for voltage problems.
It is worth mentioning that the intervention time of the interface protection relay of Triphase inverter is much less than the convergence time. The intervention time of the interface protection relay of Triphase inverter is less than 1 ms. The Triphase inverter is configured to trip at 280 V. This means that there is 27 V as voltage margin, since the algorithm starts regulating the voltage when the PCC voltage is higher than 253 V. Hence, the inverter in our setup is able to correct the voltages before reaching 280 V. If an inverter trips at 253 V (maximum voltage defined by the standard EN 50160), then of the proposed algorithm should be set to a value lower than 253 V (i.e., 240 V), in a way to make sure that the convergence time is sufficient to correct the PCC voltages before reaching the maximum voltage at which the inverter trips.
6.3.2. Voltage Quality
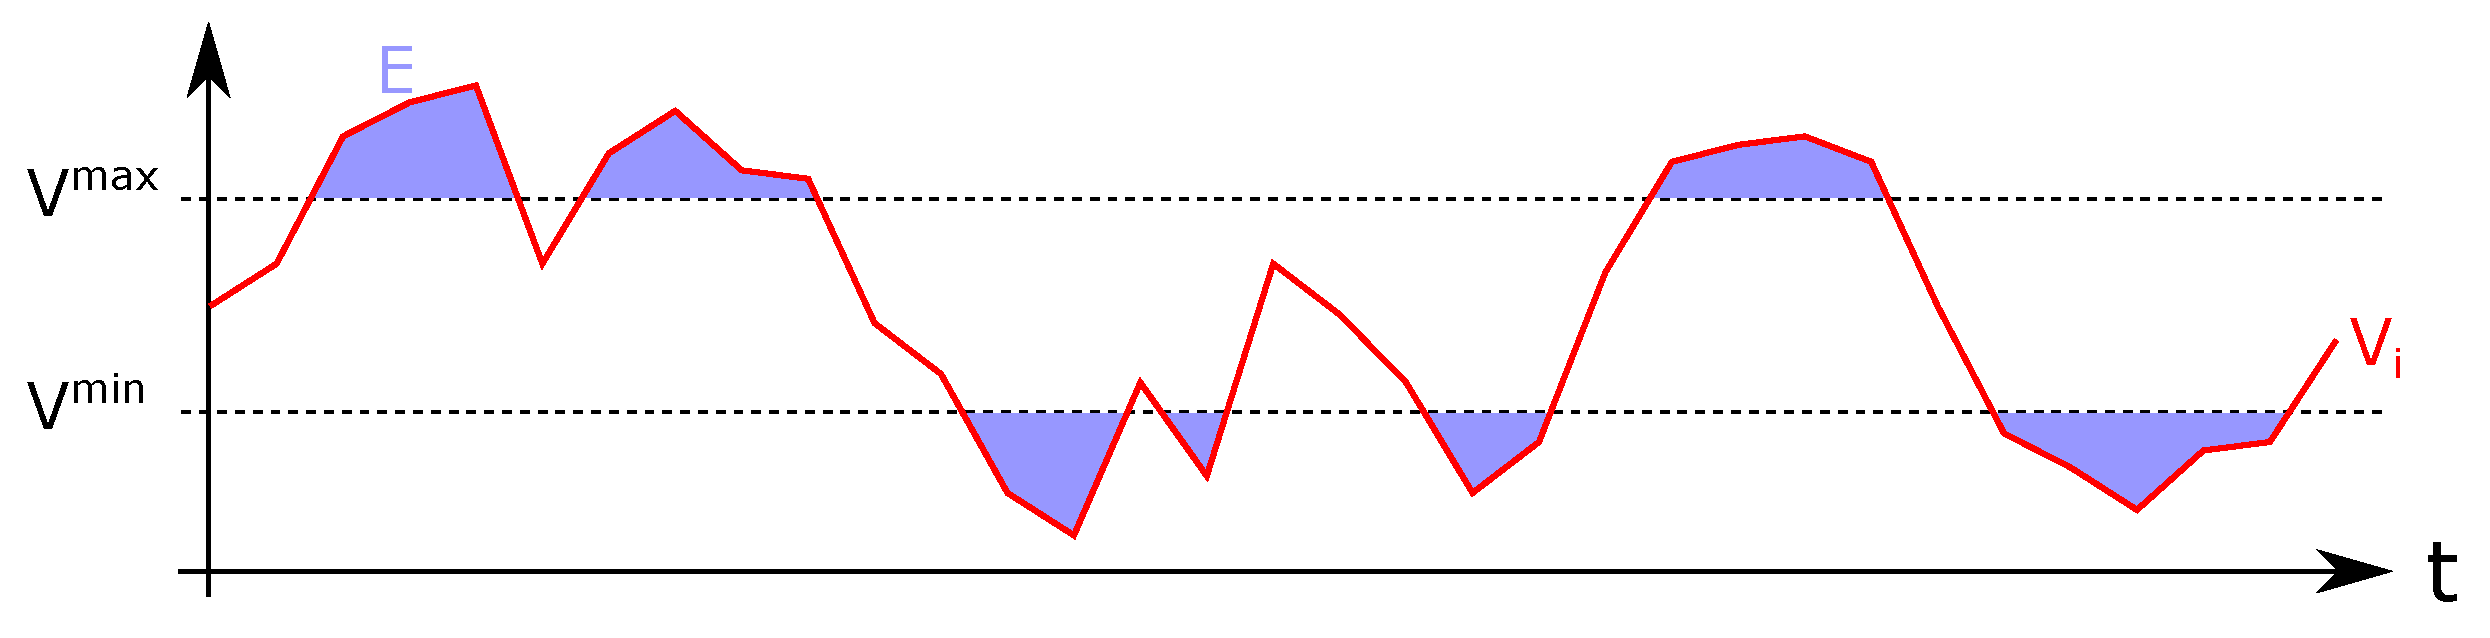
The voltage quality is quantified by the metric defined by Equation (4). The metric E integrates the over and under voltages as shown in Figure 13. This means that both the duration of a voltage problem and its severity will increase the metric E. A value of zero is the best possible value and indicates that there are no over or under voltage issues: the higher the E, the worse the voltage problem.
Table 1 shows a comparison between the regulated and the unregulated voltage profiles based on the voltage quality metric. E is the sum of the metrics , and of the nodes 0, 1, and 2, respectively. The P2P voltage control reduced the metric E from 58.724 to 2.633. E of the regulated voltage profiles is slightly higher than zero, because it takes the algorithm some time until it has resolved the voltage issues.
6.3.3. Communication Delays
For the observer agents, the delay is defined as the time between consecutive updates of their control signals, which they broadcast periodically to the actuator agents. For the actuator agents, the delay is defined as the time between consecutive updates of the set-points which are sent to the Triphase power hardware.
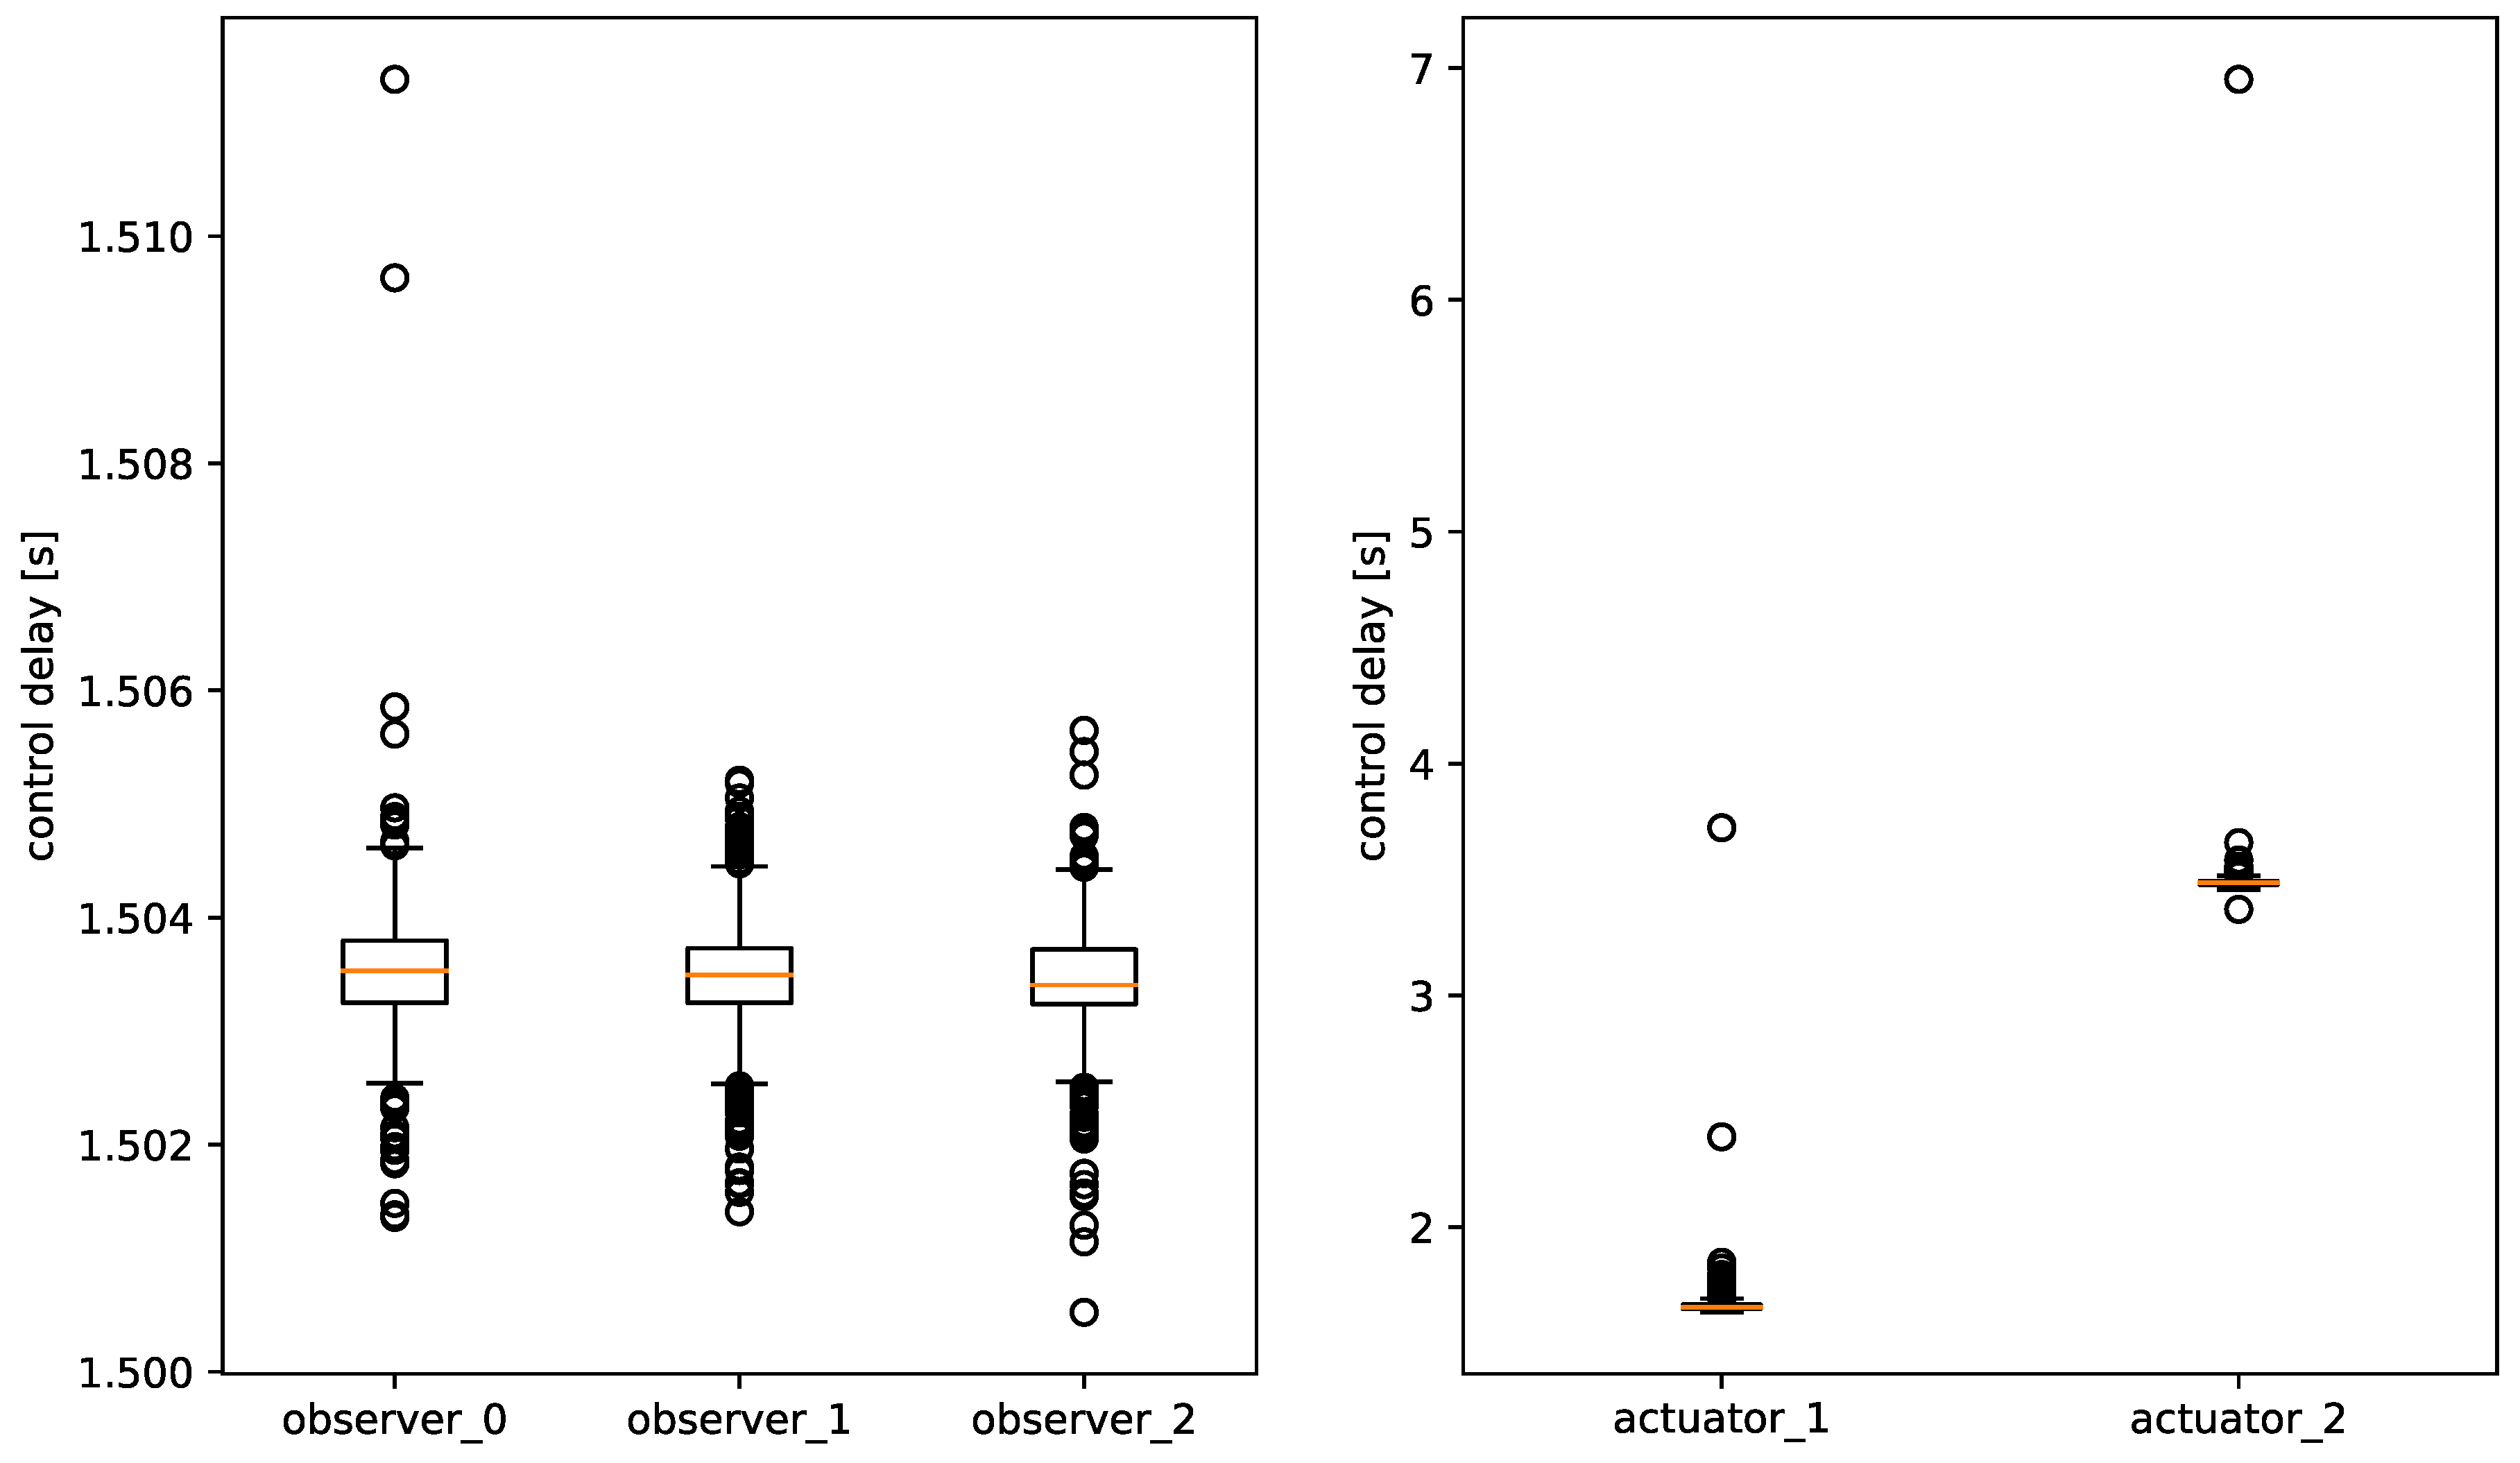
Figure 14 shows the delays between the iterations of the control algorithm, for each agent individually. The observer agents are implemented by dedicated single-board computers with few other processes running in the background. They manage to update the control signals every 1.5 s, with little deviation. The actuator agents however experience longer control delays, with large differences between both actuators. There are two main causes for these additional delays. Firstly, the actuator agents solve an optimization problem at each iteration. Secondly, the actuator agents are implemented by laptops. These laptops run additionally control software for the Triphase Rapid Prototyping Inverter System, which requires rather heavy processing. The laptop running actuator 2 is older, which shows in the performance. Adapting the implementation of the algorithm for the actuator agents can lower the delays. The lower limit for the delays is 1.5 s, which is the period with which the observer agents send updates of the control signal.
Overall, the delays are as expected. Only the delays for actuator 2 could be shorter to be in line with the other devices. Upgrading actuator 2 to hardware similar to actuator 1, should resolve these additional delays.
6.4. Discussion
The proposed P2P voltage control system managed to increase the voltage quality of the voltage profiles. Some over-voltage issues remain, because the control algorithm needs around 3 min to bring back the voltages within the limits. However, it is in line with the European standard EN50160 as all 10 min mean rms values of the voltages are within the range , where p.u.
The key question motivating this research, was whether fully distributed voltage control systems are a technically effective alternative to centralized ones. The results discussed in this paper show that fully distributed P2P voltage control systems can indeed provide satisfactory regulation of the voltage in distribution networks.
Technically, the P2P approach has shown good characteristics to be considered by DSOs to deliver high quality power to customers. The proposed P2P system could help in delivering easier access to prosumers’ flexible supply and demand by making their active participation in the grid possible. This can be used to alleviate grid stress and defer or avoid grid upgrades, and consequently will help the DSOs to host more RESs.
7. Conclusions and Future Work
The dual-decomposition method and LoRaWAN D2D communication modules are used in this paper to design a P2P optimization-based voltage control system. A multi-agent, multi-layer microgrid testbed has been constructed at the EnergyVille premises to validate the performance of the proposed P2P system. Experimental results show the ability of the proposed system to solve the voltage rise problem within 3 min.
Future work includes expanding the P2P setup, by connecting the microgrid to a virtual network. The virtual network can be modelled using the Real-Time Digital Simulator (RTDS) [37]. Power Hardware-in-the-Loop (PHIL) can be used to connect the real inverters to virtual ones, and Control Hardware-in-the-Loop (CHIL) can be used to connect the real agents to virtual agents. The setup will be used to test distributed control algorithms that have faster convergence. As demonstrated in [16], the Alternating Direction Method of Multipliers (ADMM) has a much faster convergence than the dual decomposition.
Author Contributions
H.A. conceived and designed the dual-decomposition-based peer-to-peer voltage control system. H.A. and S.A. designed the laboratory testbed, performed the experiments, and analyzed the data. K.M., J.H. and A.P. designed and implemented the device-to-device communication modules. H.A. wrote the paper. G.D. oversaw the work and proofread the paper.
Acknowledgments
This work is partially supported by: (1) P2P-SmarTest project (European Commission-Grant number 646469); and (2) an SB PhD fellowship from FWO-Vlaanderen.
Conflicts of Interest
The authors declare no conflict of interest.
References
- European Environment Agency (EEA). Trends and Projections in Europe 2017: Tracking Progress towards Europe’s Climate and Energy Targets for 2020; Publications Office of the European Union: Luxembourg, 2017. [Google Scholar]
- Nijhuis, M.; Gibescu, M.; Cobben, J. Assessment of the impacts of the renewable energy and ICT driven energy transition on distribution networks. Renew. Sustain. Energy Rev. 2015, 52, 1003–1014. [Google Scholar] [CrossRef]
- Carlo, M. Revision of European Standard EN 50160 on power quality: Reasons and solutions. In Proceedings of the 2010 14th International Conference on Harmonics and Quality of Power (ICHQP), Bergamo, Italy, 26–29 September 2010. [Google Scholar] [CrossRef]
- Markets, R. Market Design and Regulation During the Transition to Low-Carbon Power Systems; International Energy Agency: Paris, France, 2016. [Google Scholar]
- Website of P2P-SmarTest Project. Available online: www.p2psmartest-h2020.eu (accessed on 1 April 2018).
- Pouttu, A.; Haapola, J.; Ahokangas, P.; Xu, Y.; Kopsakangas-Savolainen, M.; Porras, E.; Matamoros, J.; Kalalas, C.; Alonso-Zarate, J.; Gallego, F.D.; et al. P2P model for distributed energy trading, grid control and ICT for local smart grids. In Proceedings of the 2017 European Conference on Networks and Communications (EuCNC), Oulu, Finland, 12–15 June 2017; IEEE: Piscataway, NJ, USA, 2017; pp. 1–6. [Google Scholar]
- Almasalma, H.; Engels, J.; Deconinck, G. Peer-to-peer control of microgrids. In Proceedings of the 8th IEEE Benelux PELS/PES/IAS Young Researchers Symposium, Eindhoven, The Netherlands, 12–13 May 2016; pp. 1–6. [Google Scholar]
- Molzahn, D.K.; Dörfler, F.; Sandberg, H.; Low, S.H.; Chakrabarti, S.; Baldick, R.; Lavaei, J. A survey of distributed optimization and control algorithms for electric power systems. IEEE Trans. Smart Grid 2017, 8, 2941–2962. [Google Scholar] [CrossRef]
- McArthur, S.D.; Davidson, E.M.; Catterson, V.M.; Dimeas, A.L.; Hatziargyriou, N.D.; Ponci, F.; Funabashi, T. Multi-agent systems for power engineering applications—Part I: Concepts, approaches, and technical challenges. IEEE Trans. Power Syst. 2007, 22, 1743–1752. [Google Scholar] [CrossRef] [Green Version]
- Antoniadou-Plytaria, K.E.; Kouveliotis-Lysikatos, I.N.; Georgilakis, P.S.; Hatziargyriou, N.D. Distributed and decentralized voltage control of smart distribution networks: models, methods, and future research. IEEE Trans. Smart Grid 2017, 8, 2999–3008. [Google Scholar] [CrossRef]
- Wang, Y.; Wang, S.; Wu, L. Distributed optimization approaches for emerging power systems operation: A review. Electr. Power Syst. Res. 2017, 144, 127–135. [Google Scholar] [CrossRef]
- Yazdanian, M.; Mehrizi-Sani, A. Distributed control techniques in microgrids. IEEE Trans. Smart Grid 2014, 5, 2901–2909. [Google Scholar] [CrossRef]
- Engels, J.; Almasalma, H.; Deconinck, G. A distributed gossip-based voltage control algorithm for peer-to-peer microgrids. In Proceedings of the 2016 IEEE International Conference on Smart Grid Communications (SmartGridComm), Sydney, NSW, Australia, 6–9 November 2016; IEEE: Piscataway, NJ, USA, 2016; pp. 370–375. [Google Scholar]
- Almasalma, H.; Engels, J.; Deconinck, G. Dual-decomposition-based peer-to-peer voltage control for distribution networks. CIRED-Open Access Proc. J. 2017, 2017, 1718–1721. [Google Scholar] [CrossRef]
- Liu, H.J.; Shi, W.; Zhu, H. Distributed Voltage Control in Distribution Networks: Online and Robust Implementations. IEEE Trans. Smart Grid 2017. [Google Scholar] [CrossRef]
- Šulc, P.; Backhaus, S.; Chertkov, M. Optimal distributed control of reactive power via the alternating direction method of multipliers. IEEE Trans. Energy Convers. 2014, 29, 968–977. [Google Scholar] [CrossRef]
- Bahramipanah, M.; Cherkaoui, R.; Paolone, M. Decentralized voltage control of clustered active distribution network by means of energy storage systems. Electr. Power Syst. Res. 2016, 136, 370–382. [Google Scholar] [CrossRef]
- Cagnano, A.; De Tuglie, E. A decentralized voltage controller involving PV generators based on Lyapunov theory. Renew. Energy 2016, 86, 664–674. [Google Scholar] [CrossRef]
- Marzband, M.; Fouladfar, M.H.; Akorede, M.F.; Lightbody, G.; Pouresmaeil, E. Framework for smart transactive energy in home-microgrids considering coalition formation and demand side management. Sustain. Cities Soc. 2018, 40, 136–154. [Google Scholar] [CrossRef]
- Marzband, M.; Azarinejadian, F.; Savaghebi, M.; Pouresmaeil, E.; Guerrero, J.M.; Lightbody, G. Smart transactive energy framework in grid-connected multiple home microgrids under independent and coalition operations. Renew. Energy 2018, 126, 95–106. [Google Scholar] [CrossRef]
- Tavakoli, M.; Shokridehaki, F.; Akorede, M.F.; Marzband, M.; Vechiu, I.; Pouresmaeil, E. CVaR-based energy management scheme for optimal resilience and operational cost in commercial building microgrids. Int. J. Electr. Power Energy Syst. 2018, 100, 1–9. [Google Scholar] [CrossRef]
- Kouveliotis-Lysikatos, I.; Koukoula, D.; Vlachos, I.; Dimeas, A.; Hatziargyriou, N.; Makrynikas, S. Decentralised distribution system operation techniques: Results from the Meltemi community smart grids pilot site. CIRED-Open Access Proc. J. 2017, 2017, 1673–1677. [Google Scholar] [CrossRef]
- Iacovella, S.; Vingerhoets, P.; Deconinck, G.; Honeth, N.; Nordstrom, L. Multi-Agent platform for Grid and communication impact analysis of rapidly deployed demand response algorithms. In Proceedings of the 2016 IEEE International Energy Conference (ENERGYCON), Leuven, Belgium, 4–8 April 2016; IEEE: Piscataway, NJ, USA, 2016; pp. 1–6. [Google Scholar]
- Dupont, B.; Vingerhoets, P.; Tant, P.; Vanthournout, K.; Cardinaels, W.; De Rybel, T.; Peeters, E.; Belmans, R. LINEAR breakthrough project: Large-scale implementation of smart grid technologies in distribution grids. In Proceedings of the 2012 3rd IEEE PES International Conference and Exhibition on Innovative Smart Grid Technologies (ISGT Europe), Berlin, Germany, 14–17 October 2012; IEEE: Piscataway, NJ, USA, 2012; pp. 1–8. [Google Scholar]
- Vanthournout, K.; De Brabandere, K.; Haesen, E.; Van den Keybus, J.; Deconinck, G.; Belmans, R. Agora: Distributed tertiary control of distributed resources. In Proceedings of the 15th Power Systems Computation Conference (PSCC’05), Liège, Belgium, 22–26 August 2005; pp. 1–7. [Google Scholar]
- Macken, K.J.; Vanthournout, K.; Van den Keybus, J.; Deconinck, G.; Belmans, R.J. Distributed control of renewable generation units with integrated active filter. IEEE Trans. Power Electron. 2004, 19, 1353–1360. [Google Scholar] [CrossRef]
- Palomar, D.P.; Chiang, M. A tutorial on decomposition methods for network utility maximization. IEEE J. Sel. Areas Commun. 2006, 24, 1439–1451. [Google Scholar] [CrossRef]
- Efkarpidis, N.; De Rybel, T.; Driesen, J. Optimization control scheme utilizing small-scale distributed generators and OLTC distribution transformers. Sustain. Energy Grids Netw. 2016, 8, 74–84. [Google Scholar] [CrossRef]
- De Brabandere, K.; Loix, T.; Engelen, K.; Bolsens, B.; Van den Keybus, J.; Driesen, J.; Belmans, R. Design and operation of a phase-locked loop with Kalman estimator-based filter for single-phase applications. In Proceedings of the IECON 2006—32nd Annual Conference on IEEE Industrial Electronics, Paris, France, 6–10 November 2006; IEEE: Piscataway, NJ, USA, 2006; pp. 525–530. [Google Scholar]
- Yazdani, A.; Iravani, R. Voltage-Sourced Converters in Power Systems: Modeling, Control, and Applications; John Wiley & Sons: Hoboken, NJ, USA, 2010. [Google Scholar]
- Gandotra, P.; Jha, R.K.; Jain, S. A survey on device-to-device (D2D) communication: Architecture and security issues. J. Netw. Comput. Appl. 2017, 78, 9–29. [Google Scholar] [CrossRef]
- Huang, P.K.; Stacey, R.J.; Li, Q.; Yang, R. Wireless Device, Method, and Computer Readable Media for Spatial Reuse for Device-to-Device Links; Technical Report US9794790B2; United States Patent and Trademark Office: Alexandria, VA, USA, 2017. [Google Scholar]
- Mikhaylov, K.; Petäjäjärvi, J.; Haapola, J.; Pouttu, A. D2D Communications in LoRaWAN Low Power Wide Area Network: From Idea to Empirical Validation. In Proceedings of the 2017 IEEE International Conference on Communications Workshops (ICC Workshops), Paris, France, 21–25 May 2017. [Google Scholar]
- Markkula, J.; Haapola, J. Ad Hoc LTE Method for Resilient Smart Grid Communications. Wirel. Personal Commun. 2018, 98, 3355–3375. [Google Scholar] [CrossRef]
- Raza, U.; Kulkarni, P.; Sooriyabandara, M. Low Power Wide Area Networks: An Overview. IEEE Commun. Surv. Tutor. 2017, 19, 855–873. [Google Scholar] [CrossRef]
- Mikhaylov, K.; Petäjäjärvi, J. Design and implementation of the plug&play enabled flexible modular wireless sensor and actuator network platform. Asian J. Control 2017, 19, 1392–1412. [Google Scholar]
- Kotsampopoulos, P.C.; Kleftakis, V.A.; Hatziargyriou, N.D. Laboratory education of modern power systems using PHIL simulation. IEEE Trans. Power Syst. 2017, 32, 3992–4001. [Google Scholar] [CrossRef]
Figure 1.
Multi-layer multi-agent architecture of the Peer-to-Peer (P2P) voltage control testbed ( VM stands for voltmeter, Device-to-Device (D2D): device-to-device communication module, grid voltage support function (GVSF): grid voltage support function, Raspberry Pi (R.Pi): raspberry pi computer, Right: resistor, Left: inductor, labels 1 to 11 indicate the different parts of the testbed).

Figure 2.
Schematic of the P2P voltage control testbed (VM stands for voltmeter, D2D: device-to-device communication module, Right: resistor, Left: inductor, Real-Time Target (RTT): real time target computer, R.Pi: raspberry pi computer, V: volt, L-L: line to line, labels (1)–(12) indicate the different parts of the testbed, labels (1)–(11) same as in Figure 1).

Figure 3.
Circuit diagram of Triphase PM15FM30C rapid prototyping inverter.


Figure 5.
Inner control system of the inverter integrated with the GVSF (labels same as in Figure 1 and Figure 2).

Figure 6.
Structure of the D2D communication module (USB: universal serial bus, UART: universal asynchronous receiver-transmitter, FTDI: future technology devices international (semiconductor device company), VCP: virtual communication port).
Figure 6.
Structure of the D2D communication module (USB: universal serial bus, UART: universal asynchronous receiver-transmitter, FTDI: future technology devices international (semiconductor device company), VCP: virtual communication port).

Figure 7.
Structure of the embedded software.

Figure 8.
Illustration of the implemented synchronized protocol operation (TX: transmission, RX: reception).
Figure 8.
Illustration of the implemented synchronized protocol operation (TX: transmission, RX: reception).

Figure 9.
30 min generation profiles of inverter 1 and inverter 2 (both inverters apply the same generation profile).
Figure 9.
30 min generation profiles of inverter 1 and inverter 2 (both inverters apply the same generation profile).

Figure 10.
Voltage profiles without voltage control for the 3 nodes in the microgrid (the generation profile causes over-voltages up to 1.145 p.u.)
Figure 10.
Voltage profiles without voltage control for the 3 nodes in the microgrid (the generation profile causes over-voltages up to 1.145 p.u.)

Figure 11.
Voltage profiles with voltage control for the 3 nodes in the microgrid.

Figure 12.
(a) Active power curtailment of inverter 1 and inverter 2; (b) Reactive power compensation of inverter 1 and inverter 2; (c) The control signals for over-voltages; (d) The control signals for under-voltages.
Figure 12.
(a) Active power curtailment of inverter 1 and inverter 2; (b) Reactive power compensation of inverter 1 and inverter 2; (c) The control signals for over-voltages; (d) The control signals for under-voltages.

Figure 13.
Voltage quality metric: sum of the surfaces above and below the voltage limits.

Figure 14.
Communication delays: The observer agents update the control signals every 1.5 s, with very little deviation. The actuator agents issue their updates more slowly, with a significant difference between both actuator agents.
Figure 14.
Communication delays: The observer agents update the control signals every 1.5 s, with very little deviation. The actuator agents issue their updates more slowly, with a significant difference between both actuator agents.


Table 1.
Voltage quality metrics of the regulated and unregulated voltage profiles.
| E | ||||
|---|---|---|---|---|
| Node 0 | Node 1 | Node 2 | ||
| without control | 0 | 19.719 | 39.005 | 58.724 |
| with control | 0 | 0.081 | 2.552 | 2.633 |
© 2018 by the authors. Licensee MDPI, Basel, Switzerland. This article is an open access article distributed under the terms and conditions of the Creative Commons Attribution (CC BY) license (http://creativecommons.org/licenses/by/4.0/).
Share and Cite
MDPI and ACS Style
Almasalma, H.; Claeys, S.; Mikhaylov, K.; Haapola, J.; Pouttu, A.; Deconinck, G. Experimental Validation of Peer-to-Peer Distributed Voltage Control System. Energies 2018, 11, 1304. https://doi.org/10.3390/en11051304
AMA Style
Almasalma H, Claeys S, Mikhaylov K, Haapola J, Pouttu A, Deconinck G. Experimental Validation of Peer-to-Peer Distributed Voltage Control System. Energies. 2018; 11(5):1304. https://doi.org/10.3390/en11051304
Chicago/Turabian StyleAlmasalma, Hamada, Sander Claeys, Konstantin Mikhaylov, Jussi Haapola, Ari Pouttu, and Geert Deconinck. 2018. "Experimental Validation of Peer-to-Peer Distributed Voltage Control System" Energies 11, no. 5: 1304. https://doi.org/10.3390/en11051304
Note that from the first issue of 2016, this journal uses article numbers instead of page numbers. See further details here.