ICT Based HIL Validation of Voltage Control Coordination in Smart Grids Scenarios


1
Department of Electronic Systems, Aalborg University, 9220 Aalborg, Denmark
2
Department of Energy Technology, Aalborg University, 9220 Aalborg, Denmark
*
Author to whom correspondence should be addressed.
Energies 2018, 11(6), 1327; https://doi.org/10.3390/en11061327
Submission received: 21 March 2018
/
Revised: 16 May 2018
/
Accepted: 18 May 2018
/
Published: 23 May 2018
(This article belongs to the Section A: Sustainable Energy)
Abstract
:This paper aims to validate the capability of renewable generation (ReGen) plants to provide online voltage control coordination ancillary service to the system operators in smart grids. Simulation studies about online coordination concepts from ReGen plants have already been identified in previous publications. However, here, the results are validated through a real-time Hardware-In-the-Loop framework using an exemplary benchmark grid area in Denmark as a base case that includes flexible renewable power plants providing voltage control functionality. The provision of voltage control support from ReGen plants is verified on a large-scale power system against the baseline scenario, considering the hierarchical industrial controller platforms used nowadays in power plants. Moreover, the verification of online voltage control support is carried out by taking into account a communication network as well as the associated data traffic patterns obtained from a real network. Based on the sets of recordings, guidelines and recommendations for practical implementation of the developed control algorithms for targeted ancillary service are made. This provides a deep insight for stakeholders, i.e., wind turbine and photo-voltaic system manufacturers and system operators, regarding the existing boundaries for current technologies and requirements for accommodating the new ancillary services in industrial application.
1. Introduction
Currently, in Denmark a large part of the power from Wind Power Plants (WPPs) (i.e., 3799 MW) is coming from onshore wind turbines [1,2]. These wind turbines are distributed either individually or in small-scale clusters. Conversely, the power from Photovoltaic (PV) production primarily consists of small dispersed residential units up to 6 kW [3]. Additionally, the Danish Government targets achieving 50% of the total power production from renewable energy by the end of 2020 and 100% by 2050 [4]. In the coming years, this anticipated trend will lead to the integration of huge concentration of not only offshore and onshore WPPs but also a large scale concentration of PV Plants (PVP) in transmission as well as distribution system, respectively [5]. This foreseen huge penetration of ReGen plants into the Danish electricity supply may possibly create several challenges, as discussed in [1,2,6]. A simple solution proposed in [1,6] is the provision of online reactive power support from the existing ReGen plants in the distribution grid. The provision of online voltage/reactive power support will allow down regulating the entire voltage profile in the distribution system, and also keep the voltage within the limits at the given nodes. Moreover, this capability is also required by today’s grid codes and has already been implemented in modern ReGen plants. Nevertheless, owing to the lack of technical infrastructure for communication and control, this capability is not yet utilized by the Distribution System Operators (DSOs). Considering the increasing number of dispersed units, an effective coordination between these units along with local control of voltage on a distribution grids is required to provide reactive power support. The DSOs in Denmark have already started to install a Supervisory Control and Data Acquisition (SCADA) system for this purpose that will be employed in the near future [6]. On the other hand, in the absence of a regulatory framework, controlling the ReGen plants for reactive power support may not be reasonable in short term.
It is also pertinent to note that Networked Control Systems (NCSs) are known to be sensitive to the changing communication network properties, such as end-to-end delay and information loss rate, which can cause serious control performance degradations. Communication disruptions in control loops may in turn have serious consequences on the physical systems that are being controlled over communication networks. In SG, these disruptions can manifest themselves as over-voltages, physical damages in the power grid and in worst-case can lead to blackouts. Similarly, relying on the underlying communication networks to address voltage stability challenges (e.g., related to volatile voltage excursions in distribution systems) in power systems with large penetration of ReGen plants will put high responsibility on these networks. The authors have demonstrated the impact of using public network communication (i.e., cellular networks) for voltage control coordination from ReGen plants in [7,8], and also highlighted the challenges and risks associated to the use of Information and Communication Technologies (ICT) in the said scenario.
The integration of ICT into the electrical energy infrastructure is shifting from a phase of demonstration to large-scale deployment [9]. This will not only have a strong impact on system architectures but it will also raise concerns about the issues related to cyber-security. The integration of ReGen plants (such as PVP, WPP, etc.) as well as the communication technologies in power grid has made it a cyber-physical energy system, also termed as Smart Grid (SG). A general framework for SG is therefore required for the validation that takes into account the mutual interactions and interdependencies between ICT and ReGen. However, today, lack of design and validation tools that are capable of analyzing power systems in combination with the ICT in a holistic manner is one of the main barriers.
Incorporating power system simulation tools with that of ICT requires collaboration among experts of both areas. This is because of a significant difference in both communication as well as electrical related equipment (including but not limited to messaging protocols, information models, reliability requirements, temporal consistency, hierarchy, etc.) [9]. Here, a co-simulation platform for the integration analysis of both domains helps in understanding the impact of different ICT based solutions used for the operation of power systems. After solving the subsystems independently by their corresponding domain specific simulators [10], co-simulation allows a joint and simultaneous investigation of models based on different tools, where intermediate results are exchanged during the execution of the simulations [9,10]. Therefore, co-simulation makes it possible to have a comprehensive view of the network behavior in connection with the physical energy system states. Further, before the implementation and roll out of the simulation studies, these should pass through a Real-Time (RT) simulation environment to test the controller design. This RT simulation shows how the designed controller responds, in real time, to realistic virtual stimuli. It can also be used to determine if the designed physical system model is valid or not.
It can be ascertained from the above discussion that there are several stages in the design and implementation of a SGs related concepts, which should be carried out in a sequential and hierarchical fashion. Thus, as a first contribution, this paper introduces a Model-Based Design (MBD) approach in SGs that proves to be an important methodology in the design, implementation and roll out of SG technologies, solutions and corresponding products. In addition to the several benefits, this approach will offer collaboration among different laboratories at international level, which, in turn, has a positive impact on interoperability and confidence in the applicability of the research under different grid conditions. Additionally, as a part of MBD, this paper demonstrates the provision of online voltage control coordination support from ReGen plants via a Real-Time Hardware-In-the-Loop (RT-HIL) framework. This RT-HIL framework is available in Smart Energy Systems Laboratory (SES Lab) [11] at the Department of Energy Technology, Aalborg University, Denmark. It uses hierarchical industrial controller platforms, e.g., Bachmann’s M1 controller [12], that are used nowadays in power plants. This testbed has been used for several projects in the past, such as [13,14,15].
The concept and design of online voltage support from ReGen plants has already been published [1,6,16], while the authors in [7,8] have illustrated the impact and associated risks (such as cyberattacks) of using existing public network communication infrastructure on the online voltage control coordination from ReGen plants in distributed grids, respectively. Since the work presented in [1,6,7,8,16] is mainly based on offline or non-Real-Time (non-RT) co-simulation framework, the authors in this paper prove through real-time set of recordings that the control concepts developed in [1,6,16] are valid. The validation is done by first verifying and validating the proposed ICT model for non-RT studies in [7,8] through different test cases against the complete network model and related data traffic implemented in the SES Lab. Based on the results, the validation of coordinated voltage control for ReGen plants in Medium Voltage (MV) grids is achieved.
Hence, the scope of this paper is two-fold: (1) its introduces an MBD approach in SGs as an important methodology in design, implementation and roll out of SG technologies; and (2) as a part of MBD approach, it validates the already presented concepts and results related to the provision of online voltage control coordination support from ReGen plants via RT-HIL framework. The remainder of this paper is organized as follows: Section 2 introduces MBD and explains the different stages involved in this approach. A brief description related to the concept of distributed online voltage control concept that was presented in previous publications along with its RT-HIL setup implementation description is presented in Section 3. The details and challenges related to ICT simulation model in providing the online voltage control support from ReGen plants are outlined in Section 4. Section 5 provides the assessment and validation of both ICT simulation model as well as the RT voltage control coordination concept. Finally, the study is concluded with future research directions in Section 6.
2. Model Based Design in Smart Grids
Today’s control capabilities for power systems and SGs are more and more demanding, especially with high share of power generation from renewable sources. Design and tuning of control algorithms is typically based on dedicated simulation tools, e.g., MATLAB/Simulink, while control verification may require other power system tools. Translation of control schemes between tools may be time consuming and the typical iterations in control development may increase the time even more. Once the control schemes are verified in a power system tool under various operating conditions and test cases, an implementation phase on the actual target hardware is required. Another series of tests are then required to validate the implementation. Finally, the controller is tested in a real environment. Some of the measurements are later used to validate the designed control performance but also the models used in the design process. It is worth mentioning that site testing may not involve specific tests that require measurements of real events in the power grid. Thus, typically, open loop testing is performed. Some of these events, e.g., large frequency excursion, may not occur during the limited testing period of controllers.
To overcome some of the drawbacks encountered during the design and testing of control schemes for power systems and SGs, an MBD approach is employed. The MBD approach was initially used by automotive industry and then for motor drives [17]. A brief history of MBD can be found in [18]. The different stages used in designing and testing of control schemes for power systems while employing the MBD approach are shown in Figure 1. An overview of these stages from development to testing is presented in the following subsections.
2.1. Desktop Simulations
Initially, the control development and tuning process uses simplified/reduced order models of power system and assets. Either continuous or discrete time models can be used according to the tuning methodology [17]. However, a continuous time domain tuning is preferred at this stage [17] because the dynamics in the power system applications involve a wide range of time constants as well as various sampling times for the related subsystems. Further, considerations about translation of models in discrete models are made in respect to the actual expected sampling time of various control platform used.
2.2. Rapid Control Prototyping
In this stage, the entire model is implemented in discrete domain with the proper sampling time for various subsystems. This model is implemented in a RT discrete simulator, e.g., Opal-RT. The control algorithms are tested intensively under various operating conditions to identify the robustness of the design. Based on the executed tests and their results, iterations of the control design and tuning may be necessary. It is worth mentioning that information exchange between different subsystems, i.e., plant controller, aggregator, assets, etc., is also captured at this stage with a dedicated model that is able to simulate the communication networks and their traffic (see Section 4). By using dedicated communication models for information exchange, it can be identified if specific ICT can meet the requirements imposed by control response. Moreover, this helps to specify minimum requirements (or boundaries) for ICT to provide a specific control function. This will allow the selection of the ICT for the deployment. Finally, the control is ready for implementation on the target hardware when the control design verification is finalized.
2.3. Automatic Coding Implementation
Typically, target hardware requires coding of control algorithms in different software, specific to manufacturers of the platforms e.g., structured text, C/C++, etc. This process can be shortened if the simulation tools used for control design are capable of generating the code automatically, such as MATLAB/Simulink. Since, SES Lab already uses the MATLAB/Simulink platform to design and simulate controllers as well as to translate to the required code, this step can be skipped when using the facilities in this lab.
2.4. RT-HIL Co-Simulation
Verifying control algorithms on large-scale power systems requires testing of the controller platform connected to a RT model of the power system including assets i.e., WPP, PVP, energy storage devices, etc. Moreover, for a realistic testing, RT model of the communication networks is used. Thus, the controller platform including the developed algorithms in the first phase is tested in realistic conditions close to daily operation. Moreover, power system events that cannot be measured in real life can also be replicated in a controlled environment, for instance, during extreme weather conditions for both WPP and PVP. Similarly, the normal data traffic associated to specific network technologies as well as with failure conditions (e.g., due to cyber-attacks) is captured without actually involving the real technologies. The advantage of this approach can be summarized as:
- Extensive testing and verification of control algorithms under operating conditions which cannot be encountered during the field-test trials.
- Accounting for impact of communication technologies, protocols and traffic on the developed control algorithms in a unified and consistent without being constraint by the physical systems.
The developed control algorithms including physical implementation on target hardware is then ready for site testing. This stage corresponds to a Technology Readiness Level (TRL) of 6. According to HORIZON 2020—Work Programme 2014–2015 [19], TRL-6 stands for the demonstration of technology in a relevant environment, i.e., industrially relevant environment in the case of key enabling technologies [19].
2.5. Validation
Once the designed controller is passed through all aforementioned stages, it has to be validated using actual plant hardware in real-life situations. The main goal for this process is to ensure that no physical equipment will be damaged during the tests. For this, the actual controller platform should be tested on-site under operating conditions allowed by the physical power grid and assets. Typically, the targeted tests have to be reported and documented to power system operator (DSO or Transmission System Operator) as well as to the plant operator or owner before execution. However, this process becomes complicated in terms of coordination, etc. when different owners/operators are involved. Moreover, the testing campaign is typically limited in time and power system events in scope for the developed algorithms and, therefore, large voltage and frequency excursions may not occur in the system during the testing period. Thus, an open loop approach is used. This means that the controller is fed with pseudo-measurements and the output of the plants is recorded. However, the actual impact on the power grid cannot be evaluated as well as possible control interactions between assets. These recordings may be used to validate some of the developed models including modeling assumptions used in the previous stages. This is where a RT-HIL again plays its role and allows tests and validation without even involving the physical power grid and assets. By allowing to use the designed model to represent the real-life scenario, RT-HIL platform offers benefits in terms of cost and practicality [20].
The existing facilities in SES Lab [11] allow all of the above design and verification procedure being a powerful environment for achieving high TRLs. Therefore, in the following section, we first present a brief overview of the distributed online voltage coordination concept from ReGen plants, established in [16], and subsequently the implementation of this concept in the RT-HIL setup in SES Lab is described.
3. Distributed Online Voltage Coordination Concept and RT-HIL Framework
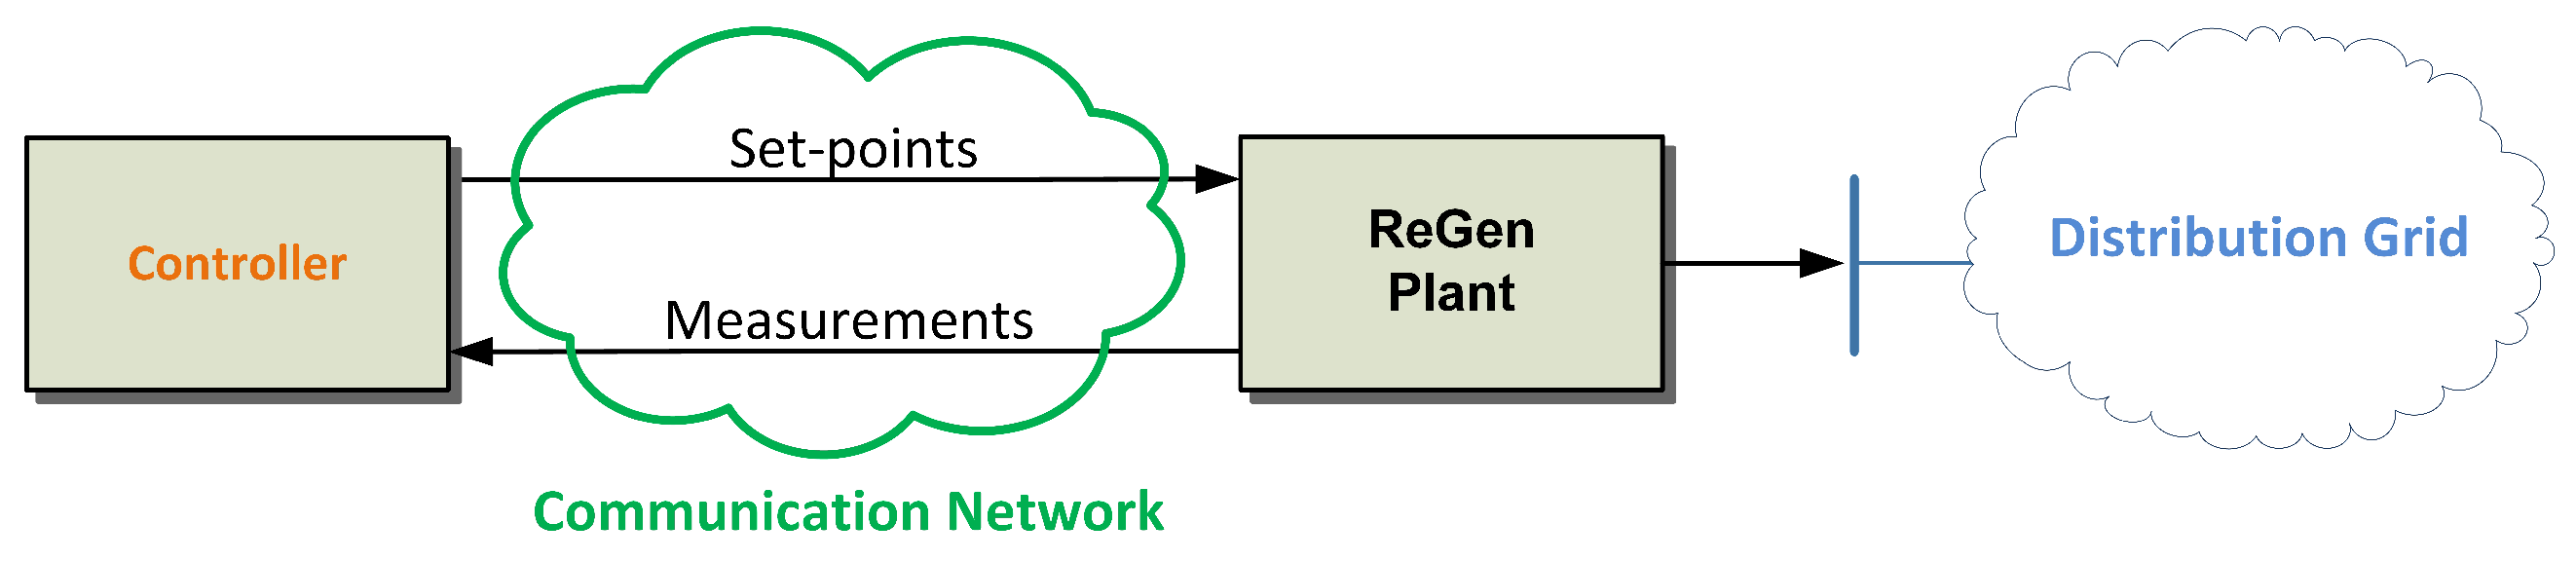
According to the Grid Code requirements, the voltage profile in a power system should remain within the desired tolerance band. For instance, in MV distribution grids, the voltage should remain within of its nominal value [16]. This challenge has to be fulfilled by each generation unit connected to the power system. The violation of this limit at certain points within the grid may possibly lead to severe stability problems and damage to the entire power system [6]. Although each ReGen plant can contribute to voltage regulation, as ascertained in [7,16], there can be additional control objectives required by the DSO, for example to reduce the grid power losses caused by reactive power provision. This objective can be accomplished by optimizing the control settings in the distributed online coordination scheme, as defined in [16], which constitutes an NCS of the SG developed on top of a communication network. The basic NCS architecture for distributed online voltage coordination is given in Figure 2.
This control architecture requires a grid layout and parameters provided by the DSOs, measurements from secondary side of primary substations as well as measurements from each of the controlled ReGen plants. It provides voltage setpoints and droop values for each ReGen plant considered in the asset’s portfolio. Since the power output of ReGen plants continuously varies and thus the voltages in the distribution grid, it is foreseen that an aggregator of grid support services may take over the task in future. This aggregator will be responsible for continuously updating the controller settings of the ReGen plants in real-time according to the actual operating point. The detailed NCS architecture for distributed online voltage coordination is given in Figure 3. The aggregator (indicated as Distributed Online Coordination block in Figure 3) receives measurement signals i.e., voltage, active power, reactive power (, , ) and the available reactive power () from all ReGen plants () and in return dispatches the droop settings (, ) for the voltage controllers.
Further, a Benchmark Distribution Grid (BDG) was developed in [16] to identify voltage stability challenges in distribution systems with large penetration of ReGen and to assess the voltage control functionalities shown in Figure 3. The BDG is based on a real MV grid operated by Himmerland Elforsyning (HEF) near Aalborg City in North Jutland, Denmark, and is considered as starting point for the definition of the BDG. To account for realistic scenarios regarding the current and future penetration of renewable power plants in Danish distribution grids, the BDG has been supplemented by the following ReGen plants providing voltage control functionality, i.e., one WPP with type-4 (full-scale converter connected) wind turbines and three PVPs:
- WPP (18 MW) representing 6 WTs of 3 MW each
- PVP 1 (10 MW) representing remotely located ground-mounted system
- PVP 2 and PVP 3 (2.5 MW each) representing typical rooftop systems mounted on top of large industrial plants and shopping centers
The BDG represents a typical radial feeder topology with primary substation ( kV) as shown in Figure 4, where the ReGen plants are shown as WPP, PVP 1, PVP 2 and PVP 3 (the BDG model is presented in detail in [16]). Based on the control architecture shown in Figure 3, this BDG is used to analyze voltage control in time domain for a volatile power profile of the ReGen plants, used as a benchmark test scenario that covers the crucial operating points with high solar irradiation and high wind speed (for details, see [16]).
The authors have demonstrated in [16] that, using the NCS architecture shown in Figure 3, the overall performance of online coordination for voltage profile management, control stability and the present voltage fluctuations remained satisfactory. The power losses within the distribution grid have also been shown to reduce to a measurable extent. Concerning the intervals at which the voltage set-points are to be updated, the authors demonstrate it via several test scenarios in [16] that the aggregator should dispatch set-point signals to ReGen plants in time intervals of 10 s to few minutes. However, it has also been recommended that power losses need to be evaluated for longer time periods (such as months or years) to provide meaningful recommendations for the controller specifications, taking into account the economic benefits for a DSO.
The following subsection elaborates on the implementation of the described distributed voltage control coordination concept along with the BDG in the RT-HIL setup.
3.1. RT-HIL Setup
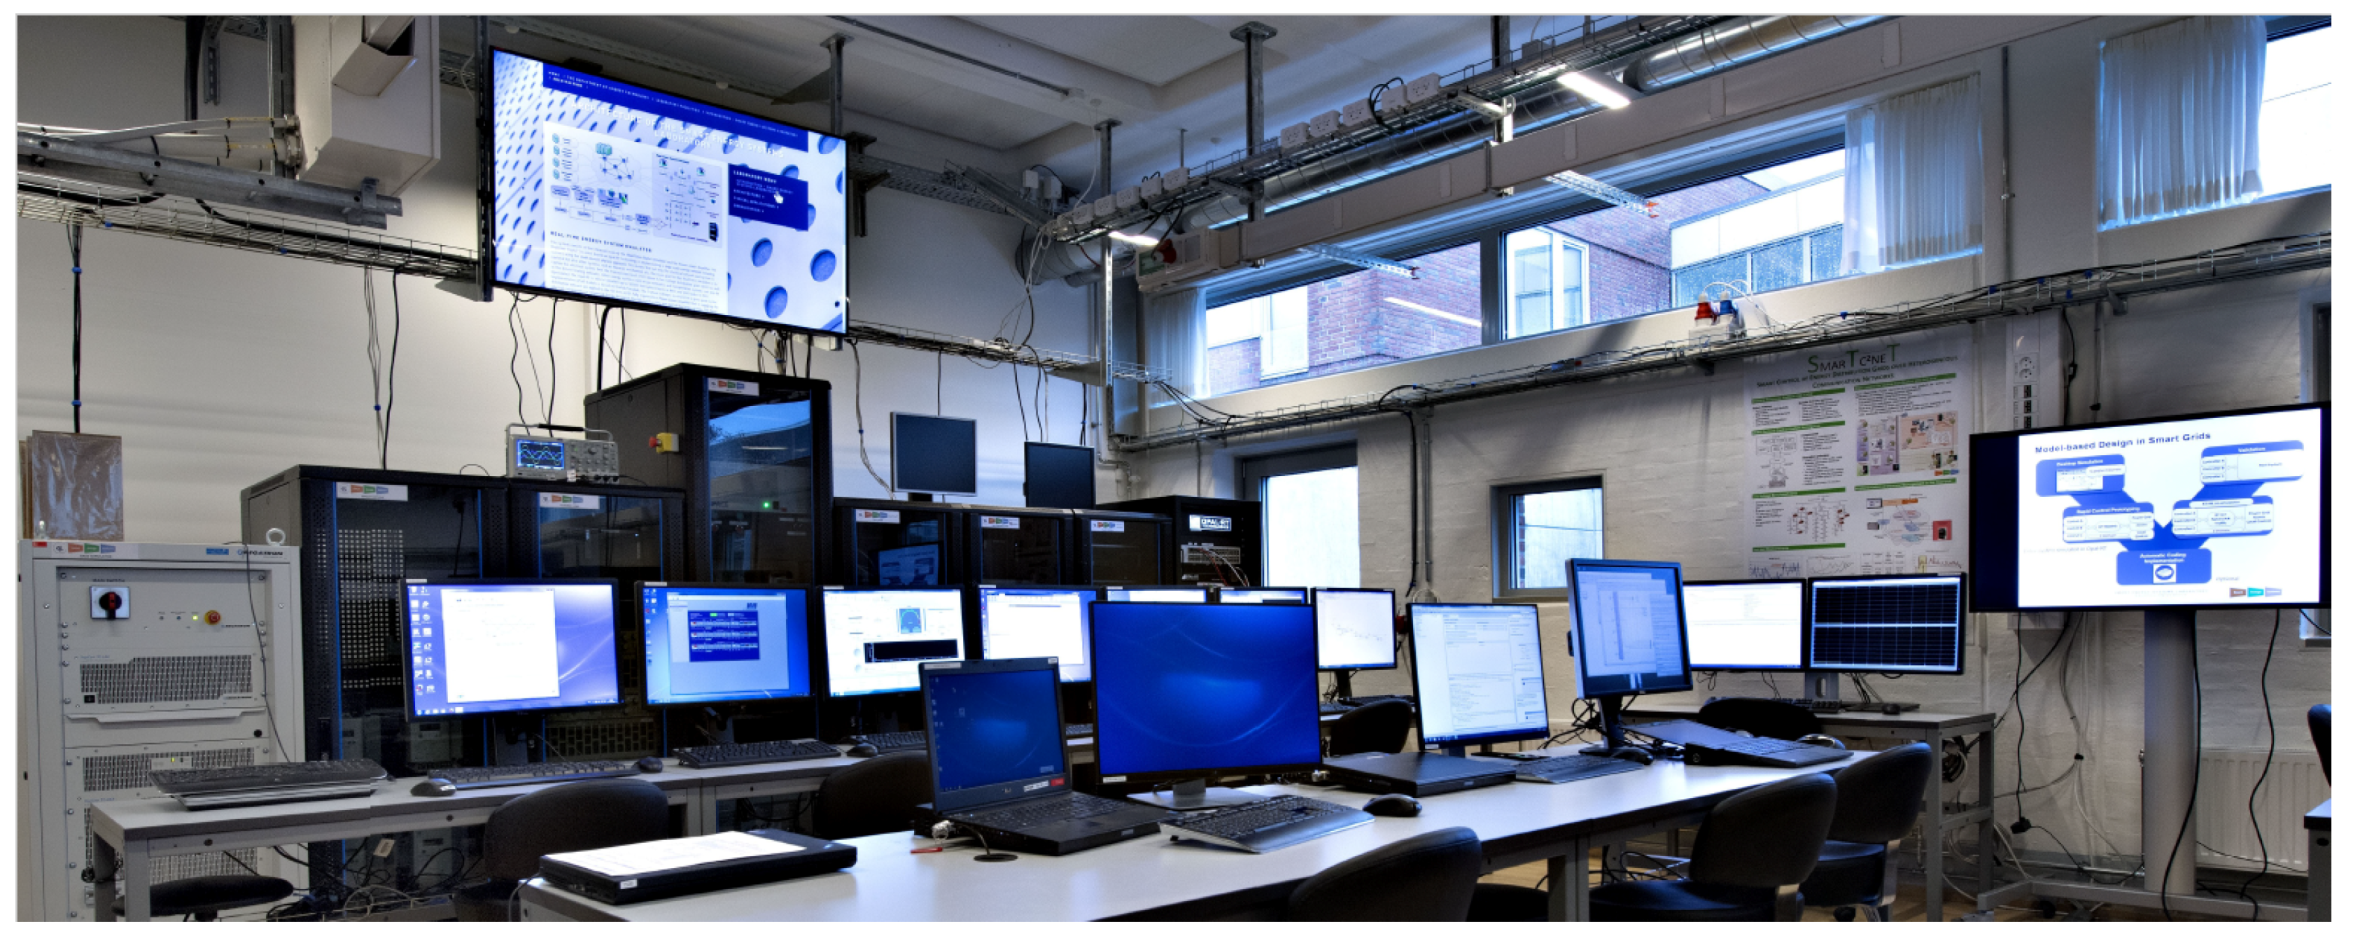
SES Lab was used to implement the control architecture for distributed online voltage coordination in the RT-HIL framework. Figure 5 shows the front view of this lab with various subsystems and workstations involved in the RT-HIL setup.
Figure 6 illustrates the setup used for the implementation of control architecture for distributed online voltage coordination in the RT-HIL framework seen in the lab. Before presenting the overview of each subsystem shown in Figure 6, it should be noted that in the near future an ancillary market is also expected for the provision of grid support services [21]. It is foreseen that in close collaboration with local DSOs, the aggregators of ReGen plants will take the charge for hosting voltage control capabilities besides energy trading [6]. Therefore, at this stage, it is assumed that the aggregator control unit is in charge of providing reactive power support along with controlling voltage locally on the distribution grid. In the following, a brief overview of each subsystem shown in Figure 6 is presented (for detailed description, see [17]):
- Aggregator Hardware Platform is based on the M1 controller hardware provided by Bachmann Electronics Gmbh [12]. One reason for choosing this platform is that it supports the MBD approach using MATLAB/Simulink. Moreover, it is widely used in the renewable energy industry and hence considered as a benchmark system. In the context of research applications of SG scenarios, this controller platform offers the possibility of utilizing open communication protocols (e.g., User Datagram Protocol (UDP) /Internet Protocol (IP)) for the data exchange. In this way, the obtained results for RT-HIL validation are not affected by any manufacturer specific protocols, which may introduce additional delays, etc. In the current setup, the M1 controller receives measurements from primary substation and ReGen plants (implemented in Opal-RT System), and provide voltage set-points and the droop values, respectively, through the RT ICT Emulator. It is important to note that the distributed online voltage coordination scheme presented in [16] is used as such. The only modifications are related to Transmission Control Protocol/Internet Protocol i.e., TCP/IP interfaces between different hardware platforms.
- Host PC—Aggregator Hardware is a dedicated Professional Computer (PC) used for developing the initial controller schemes in MATLAB/Simulink. It is also hosting the dedicated software to communicate with the controller for setting up the configuration of the controller.
- Opal-RT System [22] hosts the BDG. It sends measurements to and receives set-points from the Aggregator Hardware through RT ICT Emulator. The grid layout and ReGen plants RT models are developed using ePHASORsim tool from RT-Lab [23,24]. The wind power plant and solar PV plant models defined in [19] are directly implemented in the Opal-RT System.
- Host PC—Opal RT is a PC dedicated for the development, control and monitoring of the RT model. Automatic code generation of the RT Model is included in the RT-Lab suite [24] provided with the Opal-RT system. The Monitoring and Control Module is sending the following signals to the Opal-RT System:
- (a)
- Meteorological data: wind speeds, solar irradiation
- (b)
- External grid voltage setpoint
- (c)
- Load profiles in terms of active and reactive values
This module also receives selected signal from the Opal-RT System for monitoring the model performance during simulations. - RT ICT Emulator. The RT network emulator is based on KauNet [25] that provides pattern based network emulation by enabling ingoing as well as outgoing data packets to pass a queue configured with a buffer length and service time according to a given stochastic model of a network. KauNet provides control on bit errors, packet losses, bandwidth, and delay changes. Using KauNet, reproducible behavior of network along with an exact control on network traffic over Internet can be provided [26]. The traffic using KauNet is routed through a set of buffers, where each buffer emulates specific network characteristics in terms of delay, packet losses, etc. [26]. The network capacity can also be emulated by shaping the buffer sizes, such that packet losses can be efficiently emulated. The idea behind this setup is to have flexibility to assess any types of networks as well as the power control systems networks that generally are more deterministic in nature. Further, it is meant to illustrate the strength of being able to assess control over third party stochastic-networks which is highly relevant for operators to assess their possibility to support connectivity services to DSOs.
All the data exchange between aggregator hardware and Opal-RT system is executed through the RT ICT Emulator. This means that only these signals are prone to delays, packet drop and cyber security threats. The data exchange between host PCs and corresponding hardware is not affected.
3.2. Considerations on Real Time Implementation
The various subsystems presented in Figure 6 are running with different sampling times to capture the realistic behavior of such a system used in real applications. The following considerations are made regarding specific sampling time.
- (i)
- Host PC-Opal RT: The Monitoring and Control Module uses a 200 ms sampling time for sending the meteorological data as well as for monitoring of the internal variables from Opal-RT System. The reason for this fast sampling is the available time resolution of meteorological data (i.e., wind speed and solar irradiation).
- (ii)
- Opal-RT System: The power grid and the ReGen plants are running with 10 ms sampling time as a standard value for Root Mean Square (RMS) simulations (half cycle of 50 Hz system). The feedback signals from ReGen plants and primary substation to Aggregator Hardware are updated every second. This sampling rate is chosen to exchange steady-state signals, as the typical time response value for the active power control loop of Wind Turbine Generators (WTGs) is below 1 s [16].
- (iii)
- Aggregator Hardware: The sampling time for distributed online voltage control coordination algorithm depends on the sending of set-point values as per the update rate [16].
3.3. Summary of Involved Hardware/Software Platforms
Given a variety of hardware/software environments used in this work, Table 1 summarizes the involved suites, indicating their role to facilitate the understanding of interconnected functions and to provide the whole perspective about the presented approach.
4. Information and Communication Technologies (ICT) Model
An essential feature of the distributed online voltage coordination is the use of ICT for gathering and acting on information collected from various ReGen plants in an automated fashion. To enable bi-direction information flow for this purpose, various communication technologies can be used. These technologies include wired (such as copper cable and fiber optics) and wireless (such as WiMAX and cellular networks) public/private networks. Utilizing existing Internet access networks is a viable and cost-effective solution offering a good coverage in most European countries [27]. However, networks providing Internet access have time-varying network properties. This particularly creates a problem for NCS, where the main issue that causes degradation of control performance are network induced time-varying delays and packet losses [27]. Furthermore, as the communication systems (specifically wireless Internet access communication networks) are becoming more and more complex with decreasing time-to-market, accurate simulations models of upcoming standards are essential. The accuracy of these models becomes even more significant when used in combination with critical systems such electrical power systems. It requires to have more detailed view of the communication system and considering extra details when designing the controllers. For instance, when designing a communication system model, the several features to be taken into account are the offered load, traffic patterns, information loss, end-to-end delay, etc. Thus, communication models that reflect real life scenarios (in terms of end-to-end quality of service) should be considered even during the designing phase to depict true impact on the system’s performance.
The simulations related to power system controllers (such as, the voltage controller in this paper) are often done using the Simulink toolbox for MATLAB, where MATLAB/Simulink is based on vectors of bits/symbols/samples. The majority of such MATLAB implementations usually deal with equivalent symbol timing and bypass network aspects beside interference within physical frames. According to [20], network protocols (TCP, IP), network topology and queuing are rarely considered due to the complexity issues, because each time a new random parameter (such as queue length, etc.) is introduced, the computational complexity increases (at least) linearly (). Similarly, the computational complexity of the simulations increases as a polynomial function () or even exponentially () [20] with respect to the number of assets. This requires a higher level of abstraction as in the network simulators (such as ns-3, OPNET, OMNET++, etc.). Since there are no built-in libraries that allow networking considerations, MATLAB/Simulink (or similar tools) is not suitable for complex network simulations. In such a situation, indirect methods [20] can be used, i.e., creating interface between a network simulators and simulators like MATLAB/Simulink. Although MATLAB can be used via an interface (e.g., from C code) with the network simulators, the interfacing is not particularly easy to handle nor is it quite fast [20]. Moreover, since such interfacing methods require very detailed modeling, for larger and complex deployments, the methodology does not scale with regard to complexity. The simulation run time becomes so large that even for moderately complex topologies there is no (or very little) advantage left from the detailed simulation model. Likewise, evaluating simulation results becomes much more difficult because of a large number of parameters influencing the performance. Therefore, implementing a network simulation tool that supports control simulations with ease of handling should be highly preferred, especially for testing complex and critical systems.
Further, the tools used to simulate communication networks usually do not reflect the real life scenario, i.e., those are based on very low and deterministic latency without considering the geographical distances between communicating entities. However, in real scenarios the long geographic distance between different networked devices as well as the amount of traffic on the link may cause unexpected delays in transmission and even signal drops that result in unexpected and faulty control behavior. Specifically, while considering public network infrastructures for implementation, constant delays or packet loss probabilities do not depict the actual scenario. Therefore, dedicated communication network simulation tools are required that not only reflect real networks but also, in combination with the power system tools, assist in analyzing the effects of realistic latencies, packet losses or failures in the communication. Such communication simulators should also facilitate investigations related to cyber-security, such as Denial-Of-Service (DOS) protection, confidentiality and integrity testing.
4.1. Non-RT Communication Network Model
To comply with the rapid control prototyping stage described in MBD (see Section 2), a network emulator was developed in Simulink that provides pattern-based network emulation. This network emulator, being implemented directly in Simulink, removes many complications such as time synchronization and interfacing between two different simulation tools. The patterns that describe the desired changes in the traffic can be created from analytical expressions or traces collected through a real network and are matched with traffic packets to required behavior in time driven mode. Thus, providing a user with a reasonable estimate of what end-to-end performance can be expected from a communication network. In this work, the patterns (based on end-to-end delays and packet loss) are obtained using NetMap [28,29] (for details, see Section 4.2). In addition to the pattern based network emulation, other relevant features of this network emulator are as follows:
- Selection of transport layer protocols
- Control over the sampling time (update rate) of information
- Ability to introduce packet loss probabilities
- Selection of information access schemes (reactive or proactive [30]) with control over the related parameters
4.2. RT Communication Network Model
The online coordination between ReGen plants and the aggregator highly relies on the underlying ICT infrastructure. This imposes huge responsibility on ICT to make sure that the connection is reliable and meet other requirements for the said purpose. At this stage, implementing a dedicated fiber optics connection to all ReGen plants in the grid seems the best possible option. However, using fiber optic communication in this case will be a highly expensive option considering the huge penetration of ReGen plants in the distribution grids. There are a number of other options too, as detailed in [31,32,33], but the authors propose to use an existing ICT infrastructure that could offer low operating costs, faster deployment, high speeds and flexibility along with the provision of full expertise and manning to operate the network. For instance, cellular networks (with technologies such as Universal Mobile Telecommunications System (UMTS), Third-Generation Cell-Phone Technology (3G), Fourth-Generation Cell-Phone Technology (4G), Long Term Evolution (LTE), etc.) are already extensively deployed by the telecom operators throughout Europe with high coverage [34]. Therefore, in their previous work [7], the authors demonstrated (via offline simulations) on the use of the existing cellular network communication infrastructure and showed how it effects the provision of online voltage control and coordination functionalities from ReGen plants in distributed grids. Through non-RT simulation results, it is shown in [7] that, under normal network conditions, the cellular networks support the proposed online voltage control and coordination functionalities for ReGen plants in distribution grids.
To validate the results obtained in [7] via RT-HIL setup, it is essential to get a realistic and accurate model of the cellular networks that reflect the true network behavior especially within the area having BDG (hereafter referred to as Benchmark Grid Area (BGA)). As KauNet has been opted in the RT-HIL setup as a RT network emulator that provides patterns based network emulation, the pattern files were captured from BGA using NetMap [28,29]. The NetMap patterns are useful as they provide realistic performance under realistic conditions from networks that are normally hard to obtain information from/about, and are relevant, e.g., for operators to assess their possibility to provide connectivity service to control systems. Figure 7 shows the map of BGA where the pattern files were collected. The map also shows Google map based locations of all ReGen plants in BDG along with the location of communication masts surrounding the area. Thus, the NetMap pattern files reflect the current nature of the access network in the relevant area.
It is pertinent to mention here that NetMap is a performance measurement system for mobile-networks that is based on crowd sourcing. It employs end user smart devices to automatically measure and gather network performance metrics from mobile networks. The obtained metrics comprise of throughput, round trip times, packet loss rates, connectivity, and signal strength, supplemented by a wide range of context information about the device state [28]. NetMap also offers a Network Performance Map (NPM) based on actual measurements on existing networks using actual end user devices in real end user scenarios. The measurements obtained via NPM are beneficial in the sense that these provide a more realistic image of what the end system can expect if the measurements are performed with similar devices [28]. According to the obtained measurements [28], the existing public network infrastructure can sufficiently fulfill throughput requirements to support the amount of data in said scenario. Therefore, the analysis in this paper is based on the end-to-end delay along with the packet losses a signal might experience while travelling between ReGen plants and aggregator controller to understand the impact on the performance of voltage controller.
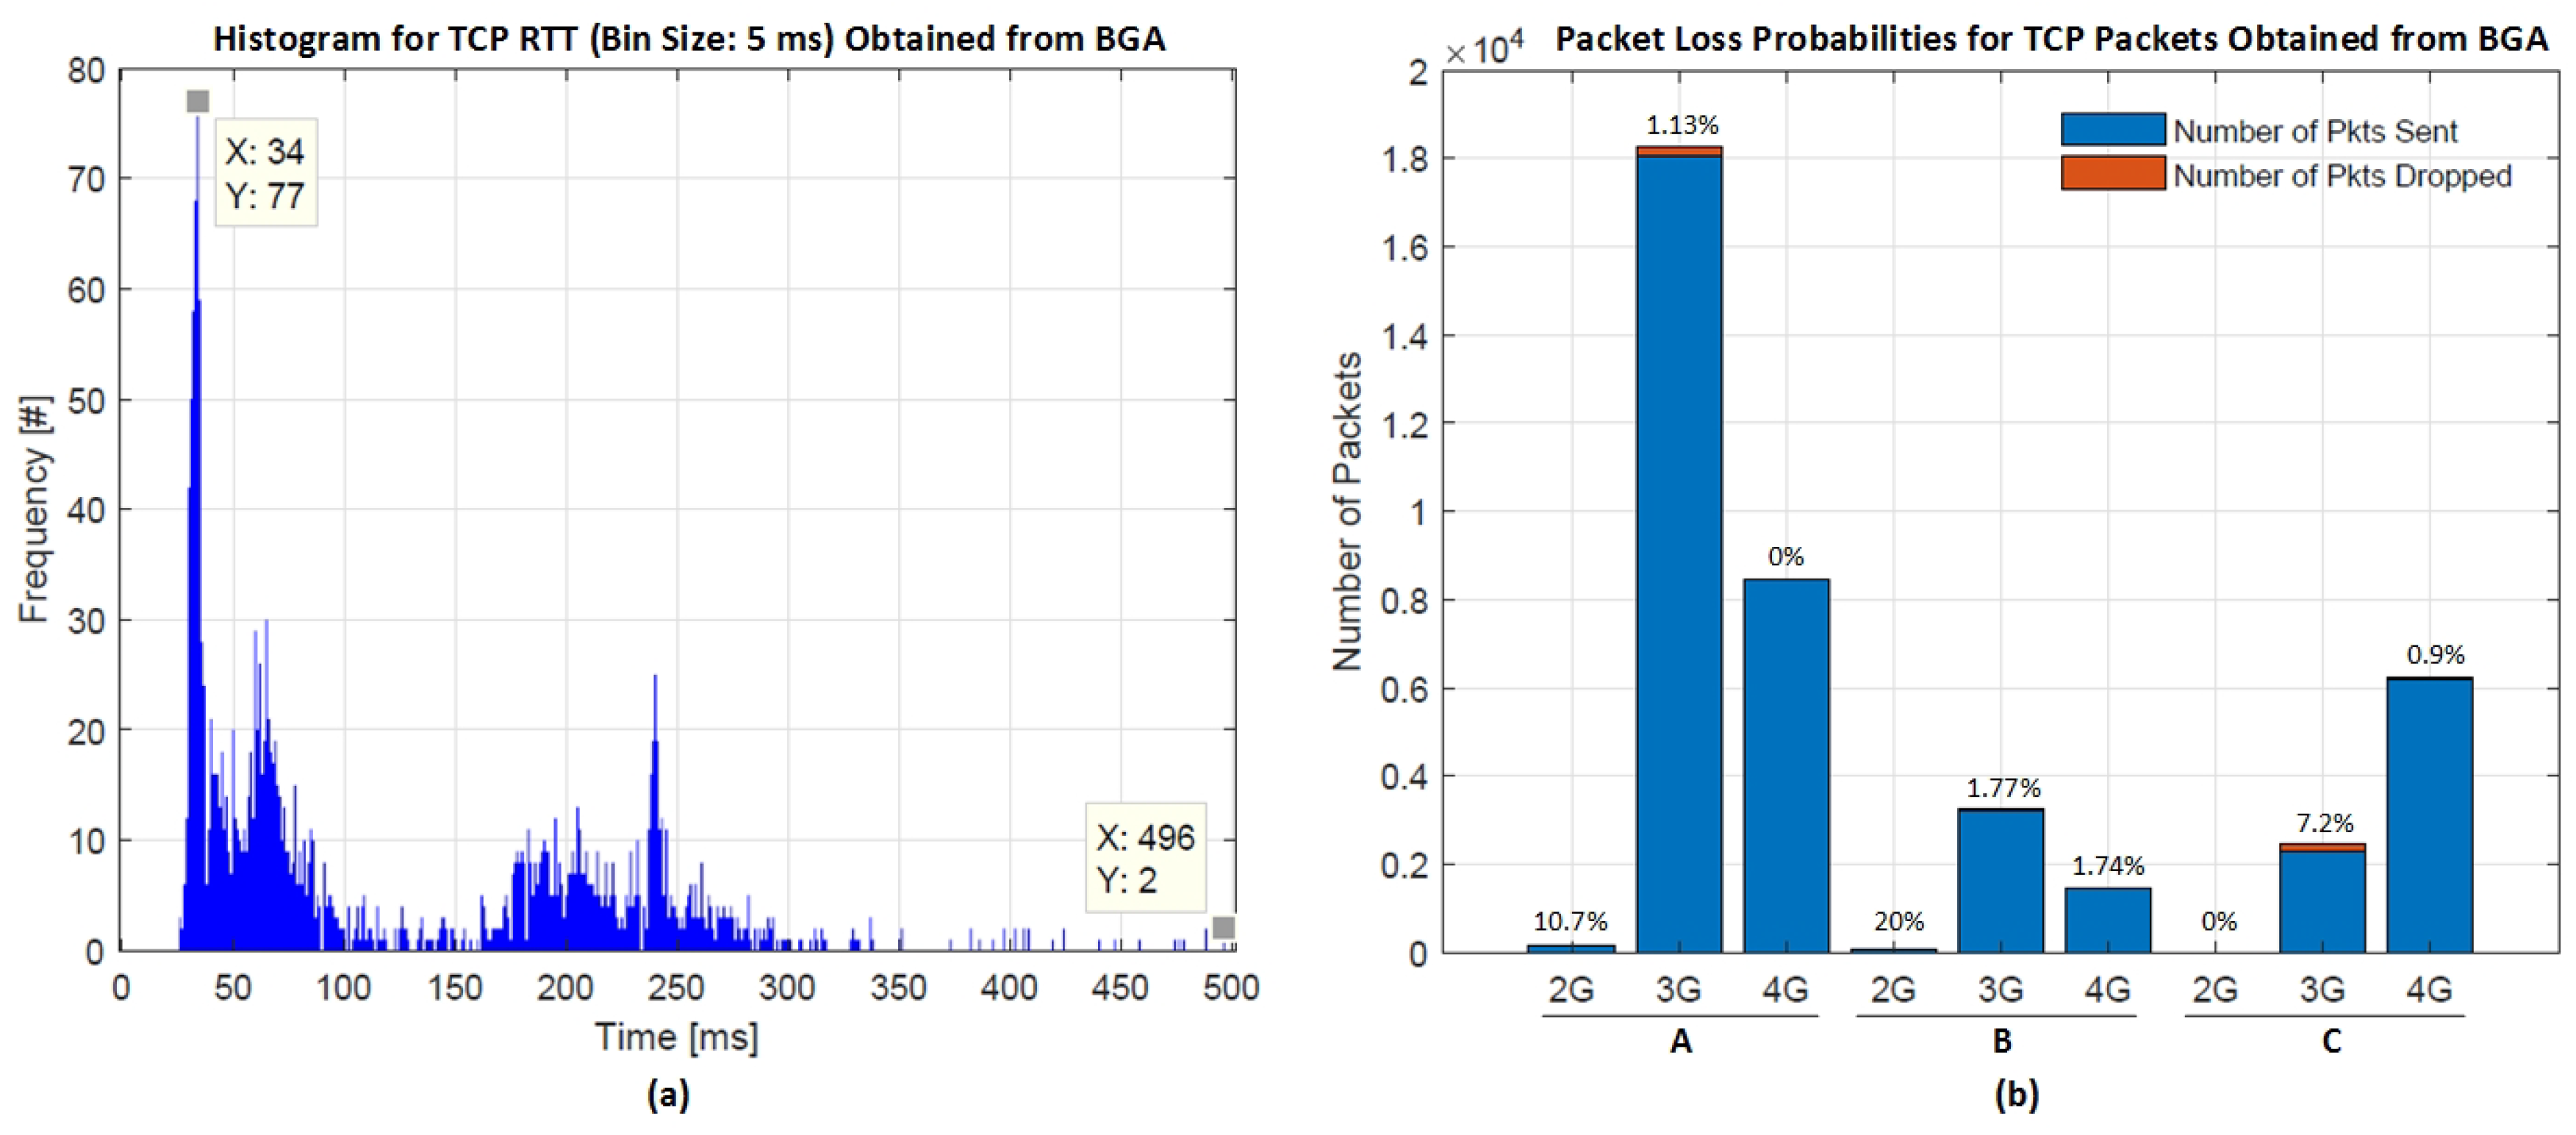
The pattern files obtained from BGA via NetMap include delay traces (in terms of Round Trip Times (RTT)) as well as packet losses measured using many end devices located at different distances from the aggregator control unit (which is assumed to be located in the primary substation, as shown in Figure 7). The measurements in pattern files are based on around 3500 TCP-RTT measurement sequences at different distances/locations of the end devices from the aggregator control unit using three different Internet Service Providers (ISPs) available in Denmark. The three ISPs are referred as A, B and C in Figure 8. Moreover, these measurements are based on 2G, 3G and 4G technologies. (Note: Since the data were collected via cell phones, they are not what a non-mobile electrical unit would accurately achieve in terms of network performance. However, it gives a reasonable estimate of what an asset can expect in terms of end-to-end performance from a communication network.)
Figure 8a shows the combined histogram of RT-RTT measurements, while Figure 8b shows the packet loss probabilities captured from BGA using several devices. It is important to note that the measurements shown in Figure 8 have been obtained over a period of 1.5 years with varying number of end devices. In Figure 8a, it can be observed that, for majority of the cases, RTT lies around 30 ms approximately. This means that for a transfer of information update, a minimum of 15 ms delay (half of RTT—assuming the same route for request and reply to/from the server) can be expected for the maximum times in daily operations. However, as this network is heterogeneous (and shared by many users), the delay continuously varies depending on the network conditions and number of users using the network. The worst case for end-to-end delay is observed as high as 500 ms (RTT) (see Figure 8a). Further, Figure 8b shows a varying number of packets sent along with the number of drop packets via different ISPs based on 2G, 3G and 4G technologies. Here, the number of packets sent through a particular technology depends on its available service within the BGA. 2G has the minimum number of sent packets because of its limited service available around BGA. However, according to Figure 8b, the packet losses observed while capturing these measurements were observed as high as 20% for 2G and as low as 0% in 4G technology.
5. Validation of ICT and Voltage Control Models
The network simulator defined in Section 4.1 was used as a non-RT communication network model for testing purposes. Generally, a non-RT communication network model is used in the design phase of any control algorithm as well as for verification purposes under a wide range of delays and packet drops. In this way, the simulation time for each test case is reduced and a complete view on the impact of ICT for a given control functionality is achieved. Selected test cases are then validated by using a RT communication network model in the RT-HIL framework. The main advantage of the RT-HIL approach is that the actual control platform is used with a RT model of the power grid and corresponding assets, i.e., ReGen plants, and also selected ICT including data traffic. These RT-HIL studies are mainly targeted to get confidence before actual site-test trials, as HIL simulations tend to be less expensive for design changes [35]. Moreover, specific power system phenomena can be replicated in this controlled environment that may not be detected in normal operation of the power grid. Therefore, in the following subsections, first the performance of non-RT communication network model will be validated via RT communication model and then selected cases from the distributed online voltage coordination will be validated via RT-HIL setup.
5.1. Validation of ICT Models
This section addresses the validation of the two communication network models defined in Section 4. As a validation process, it is expected that both test setups show the same performance in terms of processing the signals. However, during the HIL based validation process, several faults can be expected, such as transient faults, intermittent faults or even permanent faults [36]. Here, the transient faults are induced by environmental conditions (e.g., noise, engine ignition, lightening, etc.) and are known to be less intense because such faults occur once and disappear. The intermittent faults are usually caused by non-environmental conditions (e.g., loose connection, etc.) and keep on repeating. The permanent faults are stable faults and continue to exist until the faulty components are fixed/replaced. All such faults may end up in adding bottlenecks to the communication link thereby saturating the network rapidly and resulting in: (a) increased delay in information transmission/reception; (b) increased information loss; or even (c) modification in the input signal. Therefore, it is important to keenly observe the results in the validation process of ICT models and make sure that the two communication network models show same performance.
5.1.1. Characterization of Test Setups
To validate the non-RT ICT simulation model (see Section 4.1) with its RT counterpart (KauNet) (see Section 4.2), two test simulation setups (non-RT and RT) are implemented at this stage. With selected network parameters (based on delay and packet loss rates), identical signals were sent and received via both setups for comparison. The test setups are as follows:
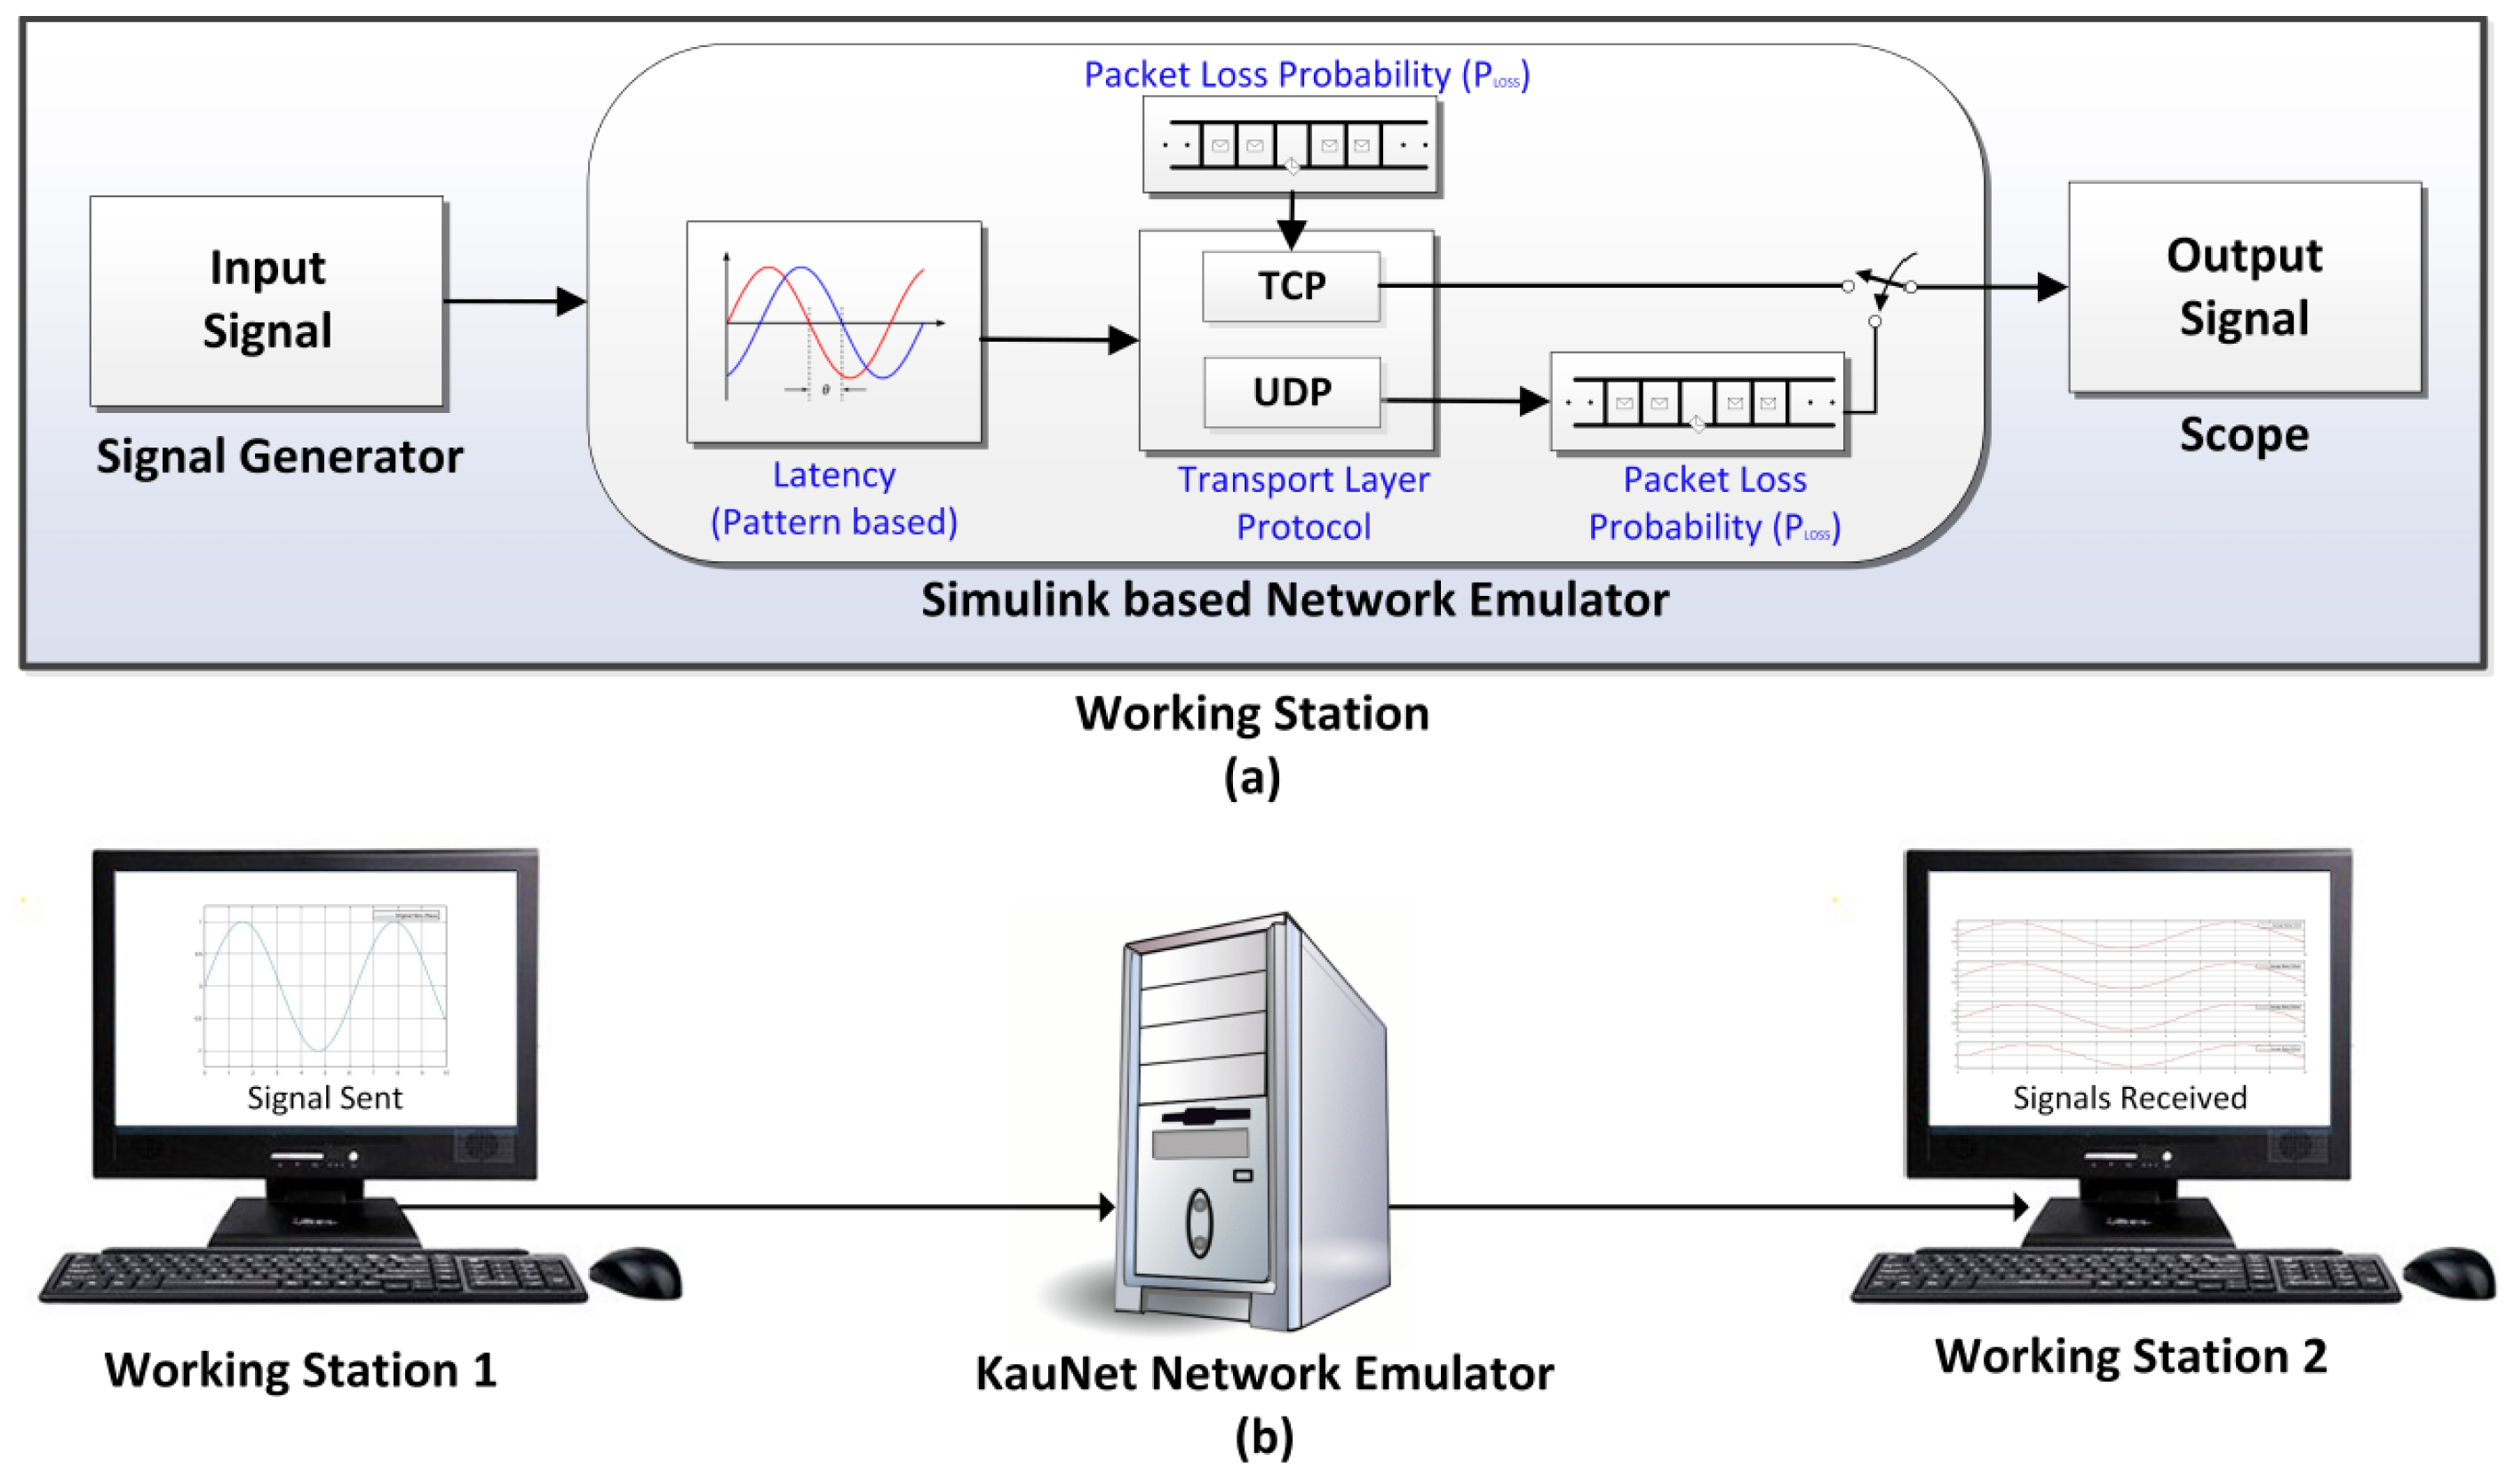
Setup 1—Non-RT Model. In this setup, the non-RT network simulator is used between a signal generator and the receiver (scope) to send signals under different selected network parameters, i.e., varying end-to-end delays and packet loss rates. The three components (i.e., signal generator, network emulator and a scope to capture output) reside in the same workstation in MATLAB/Simulink, as shown in Figure 9a.
Setup 2—RT Model. In this setup, a signal generated at one working station was sent to the second working station through KauNet network emulator, as shown in Figure 9b, with the same network parameters as in non-RT test setup. The original signal as well as the delayed signals were captured and recorded on working station 2 using MATLAB/Simulink. Connecting two workstations via KauNet requires defining IP addresses, port numbers, creating pipes between these ports, etc.
5.1.2. Test Cases for Validation of ICT Model
Two Quality-of-Service (QoS) parameters were considered in the test cases, i.e., delay and packet loss. Delay and packet loss are important QoS parameters as (in client/server communication) delay in data transmission can cause a server to make decision based on old data, or a client to change behavior based on old control messages, while packet loss in communication might mean that a server/client tries to make decision based on incomplete data.
Further, typically, to understand the impact of delay on information, a constant transport delay is used. However, in reality, data packets containing information might undergo variable delay based on the traffic on a link, number of users using the network, etc. For instance, in the case of public networks, where a huge number of people are using the same network, a constant delay cannot be guaranteed [28]. Thus, the delays in communication considered for test cases in this section are not constant delays. These delays are rather based on self-generated patterns with a specific average (mean) value. Therefore, it is expected from both test setups to shift each packet within the signal according to the generated delay patterns. Based on the average delays and packet drop rates, there are four test cases defined for both test setups (non-RT + RT), as shown in Table 2.
5.1.3. Signal Characterization for Validation of ICT Model
As described in Section 2, the models in desktop simulation can be continuous time or discrete time; thus, two signals were selected to validate the non-RT ICT model with its RT counterpart: (a) a pure sine wave representing a continuous time signal; and (b) a square wave representing a discrete time signal. Selecting a square wave signal is important, especially in the case where set-point values are sent (instead of a continuous-time signal, as in the case of ReGen plants coordinating with the system operator). The signals and parameters used are shown in Table 3.
It is important to note that the purpose of selecting these signal parameters, i.e., much lower frequency for sine wave while very high frequency for square wave, is to visualize the impact of delay as well as packet loss in the signals, respectively. Complex signals could have been selected for this purpose but these simple yet useful signals were opted to serve the main purpose, i.e., the validation of ICT models. Figure 10 shows the original (Figure 10a) sine wave and (Figure 10b) square wave signals used for non-RT as well as RT tests with the specified parameters. Similarly, it is worth mentioning that, although both signals were used to test the impact of added delays and packet loss probabilities in communication, not all results are added in this paper. Latency in a network is only shown for the sine wave, while packet losses are shown for the square wave (for detailed results, see [17]).
5.1.4. Simulation Results and Comparison
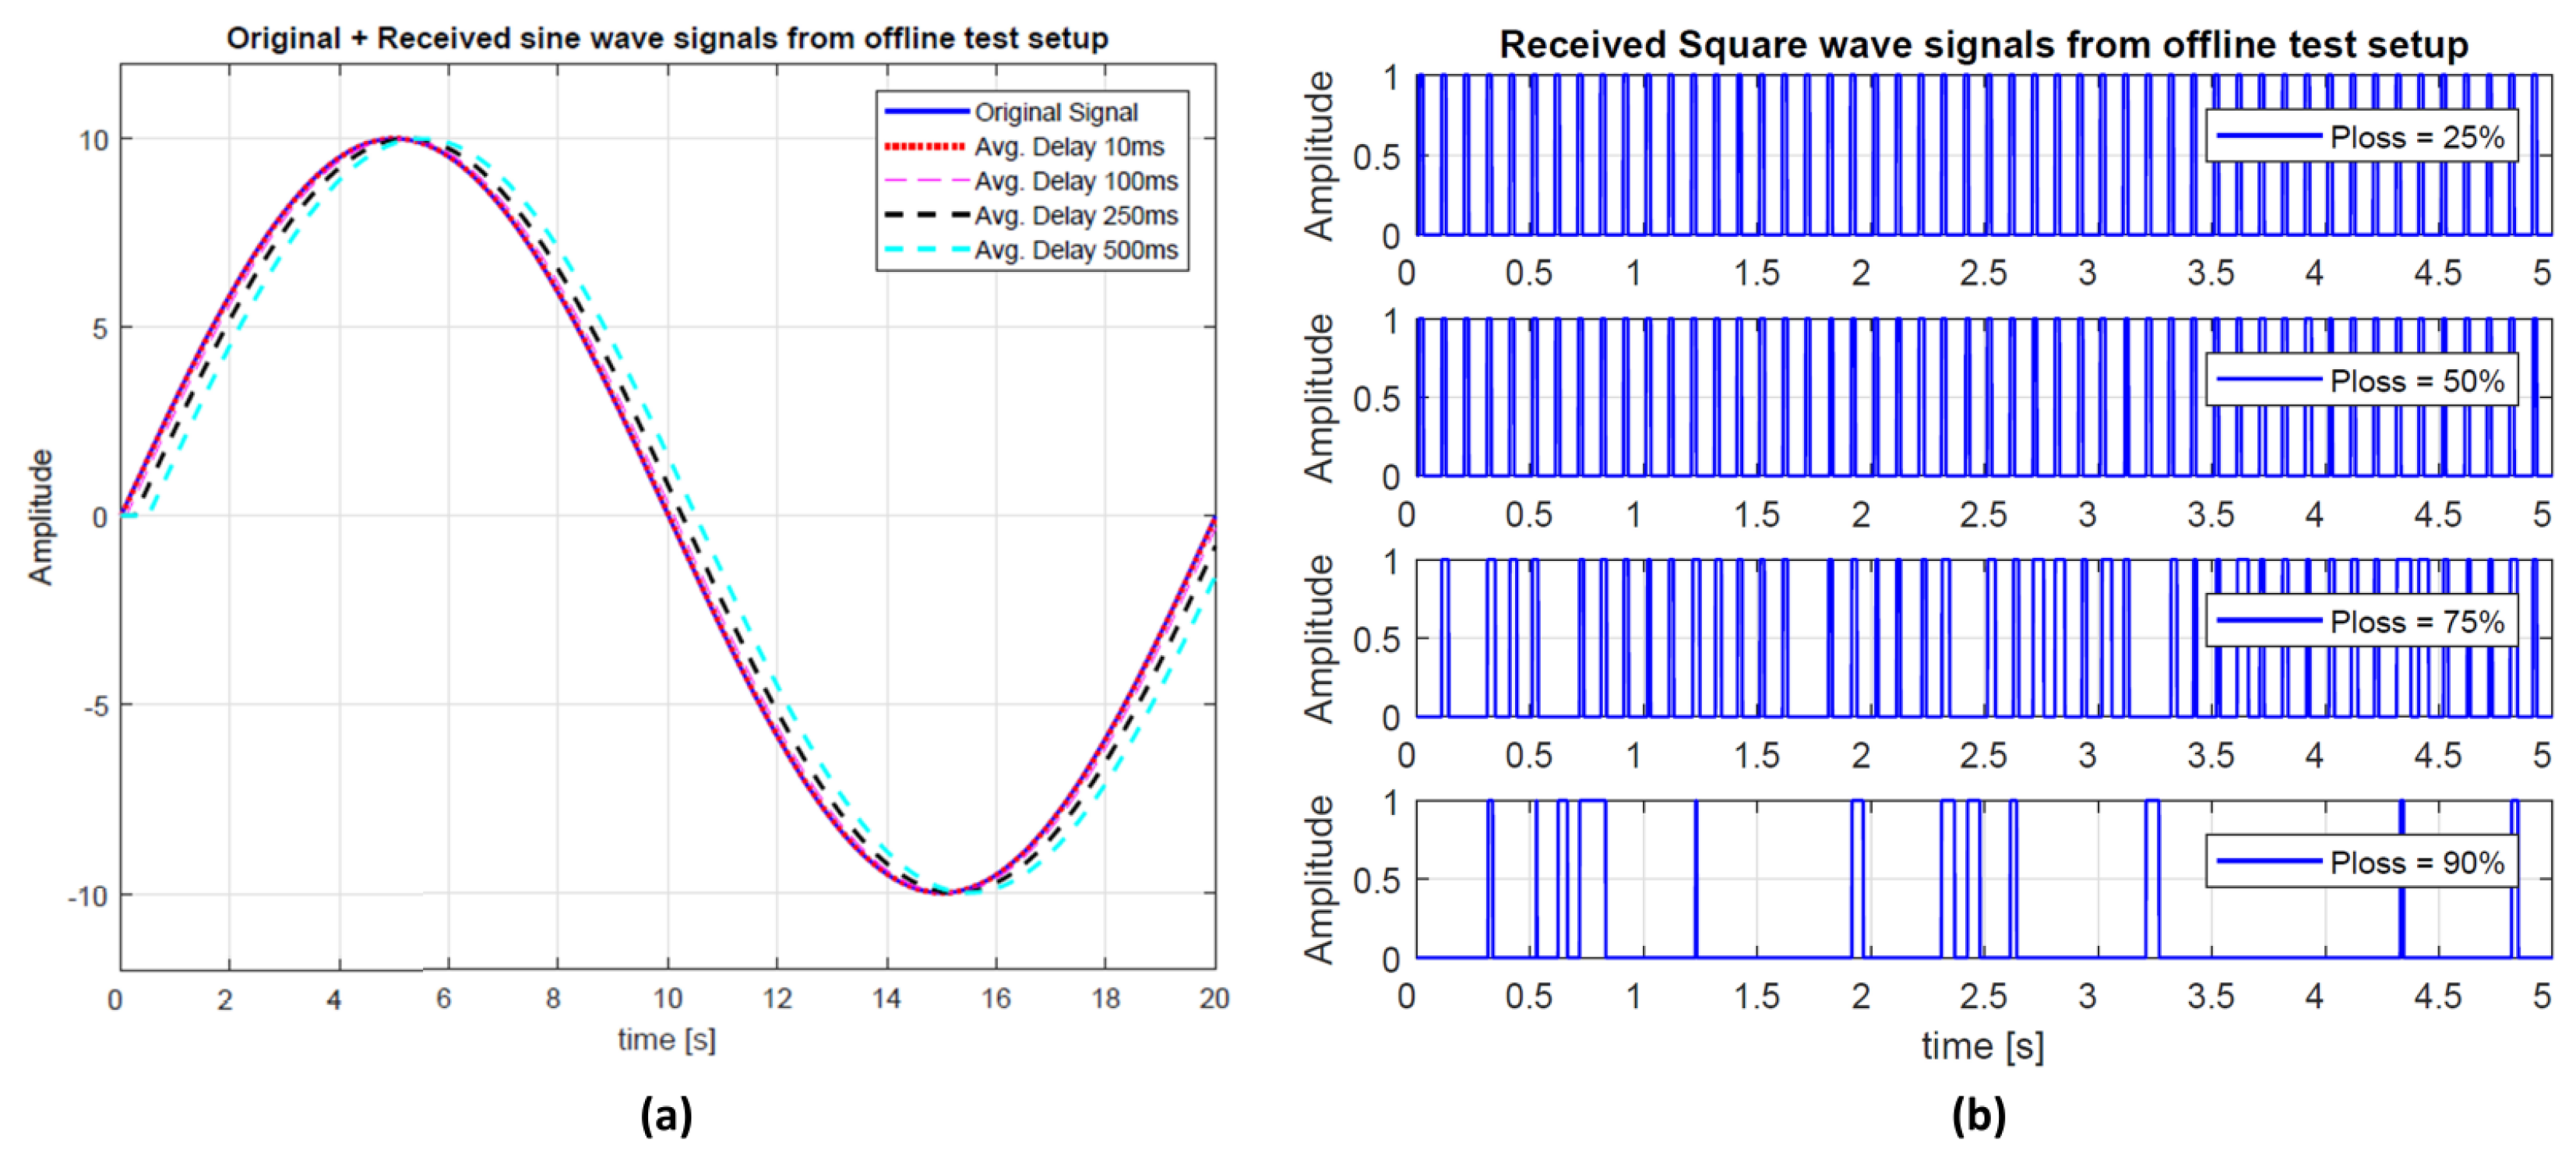
Non-RT Setup—Test Results. Figure 11a shows the original sine signal compared to the ones received from network emulator under four delay based test cases. It can be observed how a signal can be affected due to different (average) delays in a network. It can be noticed that all received sine waves are steady state waveforms. This is because of a very high sampling rate selected (i.e., 1 ms). However, if the sampling rate is reduced, this will influence the shape of the incoming signal with each added average delay patterns. Figure 11b shows the received square wave signals from network emulator under increasing packet loss rates in a network. It can be observed how a signal is affected with increased packet loss rates.
RT Setup—Test Results. Figure 12a shows the original signal compared to the ones received from working station 1 through KauNet network emulator under the four delay based test cases. As in non-RT results, it can be clearly observed how the sent signal is affected due to different (average) delays in a network. Similarly, Figure 12b shows the received square wave signals from network emulator under four packet loss based test cases. It is worth mentioning here that the signals sent and received via the RT Setup were fully synchronized and started at the same time. However, since these signals were directly captured from a RT simulation setup, the signals in Figure 12a seem shifted.
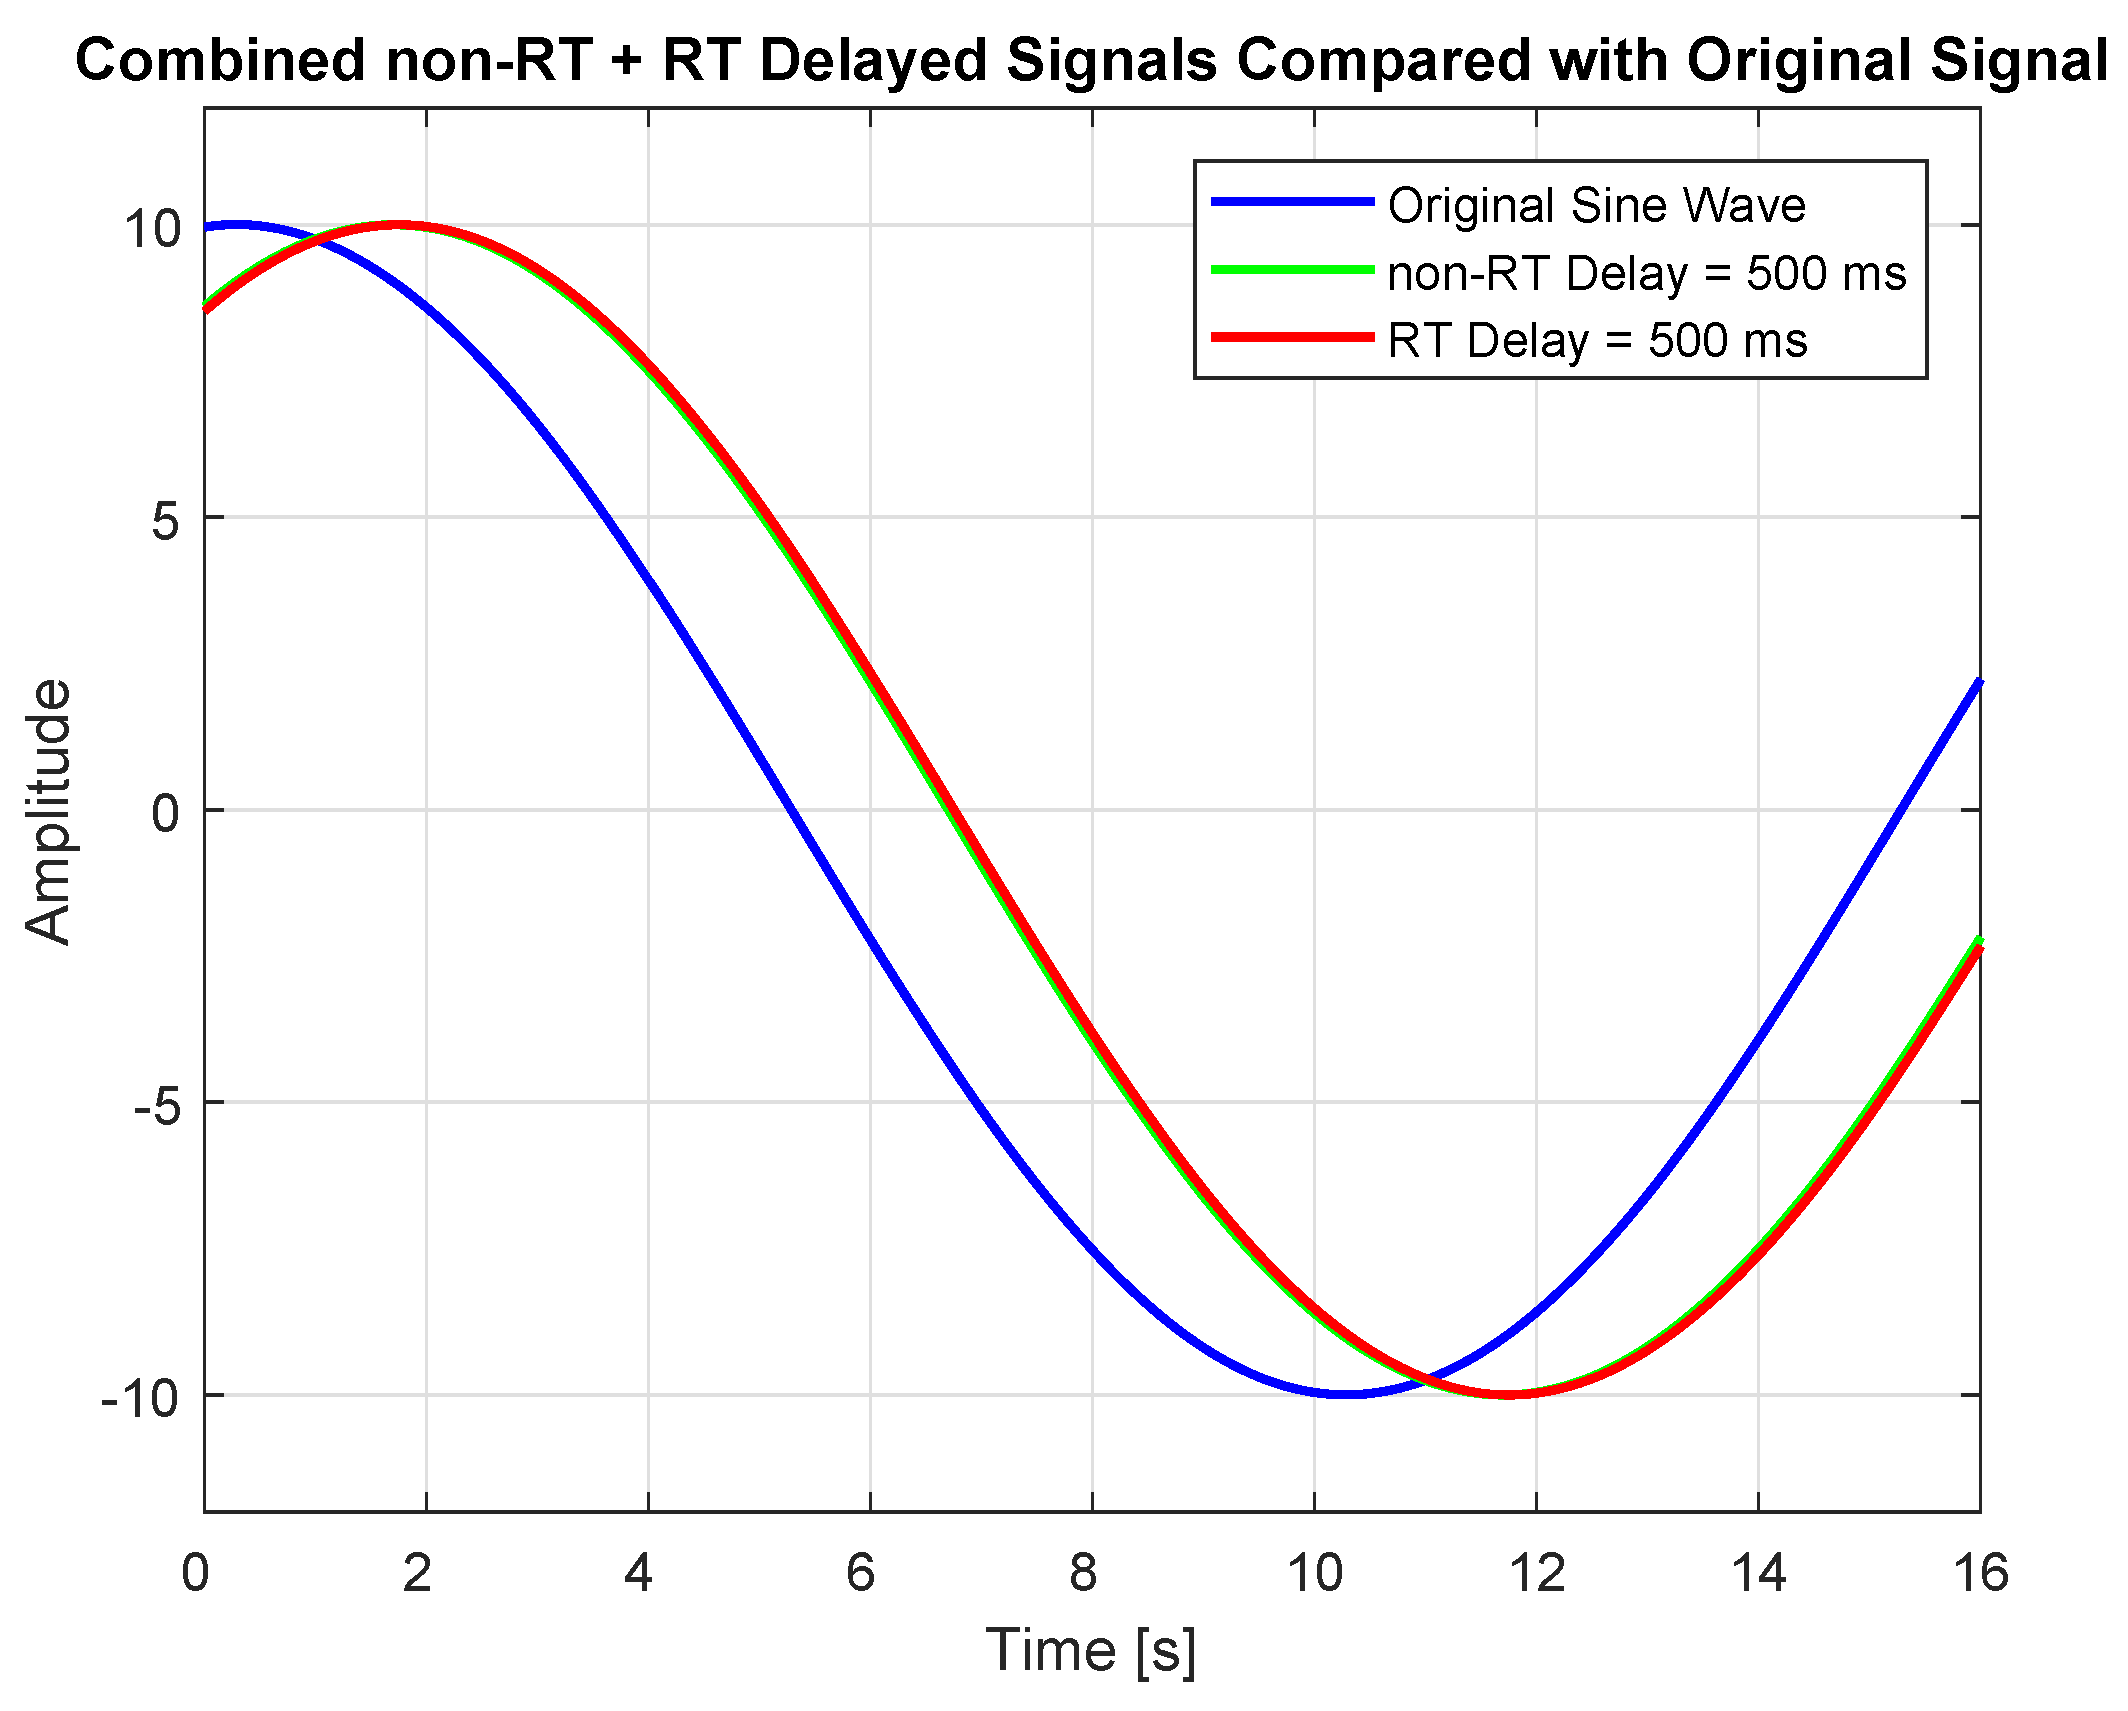
Figure 13 captures the original sine wave with the ones received from non-RT as well as RT test setups (with average delay = 500 ms.) to show that the results obtained from both test setups are comparable.
5.1.5. Results Discussion and Summary
It can be observed from the test results that network delay in each case has the same effect on the signals. The faults discussed in Section 5.1 have not been observed, i.e., no additional delay or packet loss has been observed in either test setup. The impact of delay patterns with a specific average delay was not visible in any case due to the high sampling rate of 1 ms, while in the case of packet loss in square wave, it was expected that, with each packet loss rate, equivalent percent of bars will be seen to have dropped. However, it was revealed from the test results that each bar in a square wave comprised of several packets. Although the impact of packet loss was not apparent at 25% and 50% loss rates, it was observed (by magnifying) that, in each case, the shape of several bars in a square wave was deteriorated due to packet losses. Nevertheless, the overall response of non-RT ICT model matches the one provided by the RT network emulator under the same input and parameters. Thus, the non-RT communication network model proved to be a powerful yet simple representations of the communication networks and their traffic, especially for non-RT multi-run studies focusing on verification of control design. However, to gain complete confidence, selected test cases will go to a validation stage in the RT-HIL framework. Notice that in this case longer simulation time is expected as the entire system is running in real-time.
5.2. Validation of Distributed Online Voltage Coordination
This section addresses the validation of distributed online voltage coordination concept by considering selected cases from the work done in [16].
5.2.1. Test Cases for Validating Online Voltage Coordination
Two options for online coordination were considered in [16]:
- Updating the voltage droop values
- Updating the voltage set-point of the ReGen plants
However, it was ascertained in [16] that updating the droop settings according to the actual operating point of ReGen plants did not significantly reduce the power losses within the distribution grid, while updating the voltage set-points according to the actual operating point of ReGen plants reduced the power losses within the distribution grid to a measurable extent. Moreover, it decreased the reactive power utilization rate of the ReGen plants, in comparison to distributed off-line coordination in [16]. Therefore, this paper only considers the case of updating voltage set-points of the ReGen plants.
In [16], four different update rates (10 s, 1 min, 5 min, and 15 min) were considered in simulations for adjusting the voltage set-point of each ReGen plant to evaluate their impact on the power losses within the grid. Since it has already been shown in Section 5 that the non-RT communication model performs the same as the RT communication setup (with KauNet), two update rates are considered as test cases to validate the non-RT simulations via RT setup i.e., 10 s and 1 min. Further, as in [16], a time frame of one hour is considered sufficient to represent a volatile power profile covering the extreme operational points at high wind speed and solar irradiation.
5.2.2. Test Results
Figure 14 shows, for each ReGen plant in the BDG, the active power (P), reactive power (Q) and voltage (V) profile both for non-RT simulation and RT communication setup throughout the considered time-frame of 1 h according to the specified test cases. It can be observed in Figure 14 that no significant differences are observed for the specified test cases in the RT test setup as compared to the non-RT tests. However, since there is a little difference seen in the some results, it is worth calculating the percentage error in each case. The percentage error in case of V and P is calculated based on the difference between non-RT and RT results, keeping non-RT results as reference (see Equation (1)). The same applies for P, while, for Q, it can be observed that the signal includes zero, which will give infinitely large errors once divided by the reference signal (non-RT). Therefore, for Q, a delta signal () is plotted which is the difference between the Q obtained by both the setups i.e., non-RT and RT (see Equation (2)). The results based on Equations (1) and (2) are shown in Figure 15.
5.2.3. Results Discussion and Summary
As discussed in Section 3, to reduce the grid power losses being raised by reactive power compensation, the voltage set-points of individual ReGen plants should be updated in regular intervals with an update rate of reference signals to be in the time interval of 10 s to few minutes. With these recommendations, the authors have elaborated on the impact of using general-purpose public network communication infrastructure on on-line voltage control coordination in [7]. Communication aspects related to the network infrastructure and related protocols were evaluated in [7] with respect to the related latency and validity of the signals being exchanged between Aggregator and ReGen plants, resulting in deviating voltage control performance in the distribution grid. However, it was ascertained in [7] that, with an update rate in the range of seconds to minutes (10 s–15 min), latencies incurred by using those public networks do not affect the delivery and coordination of voltage service with respect to stable voltage profile management.
The results obtained in Figure 14 confirm that the exchange of V, P and Q from all ReGen plants via RT-HIL setup are approximately the same as those obtained via non RT setup. This clearly indicates that the resulting power losses calculated based on the signals obtained via non RT setup will also remain the same in the current RT-HIL setup. However, a collective error of less than 1% approximately has been observed in Figure 15 which could be imposed by the Ethernet or other real-time effects in the link. Moreover, the relatively higher error seen initially in each case is expected due to the HIL initialization setup, which requires a detailed sensitivity analysis for this setup in the future.
5.2.4. Challenges in HIL Setup and Future Directions
Although HIL-based simulations offer a wide range of possibilities for testing and validation of SG solutions (one of which is described in this paper), there are several faults and challenges that may restrict its operation (see Section 5.1). For instance, the transient values in Figure 15 show relatively higher errors that suggest some unexpected operations due to the HIL initialization setup. This initial higher error (and even the <1% error for rest of the test case) might not be significant enough to make any difference for time frame of one-hour. However, for the tests with longer durations, these errors may not always be easy to handle, especially in the case of RT HIL setup while taking into account the impact of ICT. For an ICT based HIL validation process, it is crucial to ensure a synchronous data flow among each component, along with the concurrency of simulators in use. These synchronous data flows are required for both software-to-software and software-to-hardware interfaces [37]. Moreover, when it involves the co-simulation of power system and communication network for an integrated analysis of both domains, it is necessary to synchronize both simulation tools properly at runtime.
Secondly, one of the most important considerations while carrying out HIL based simulations with power system interface is the closed-loop stability. The occurrence of any instability may not only lead to erroneous results but can also cause expensive damage to testing facilities, controllers and other hardware under test [37]. According to Ren et al. [37], the natural inaccuracies, for instance time delay, limited bandwidth, harmonic injections of the interface amplifier, etc., make a power HIL simulation prone to instability. For high power applications, these instabilities can even be more severe. Therefore, understanding and addressing the different types of errors/faults as well as the causes of instabilities is mandatory, so that the RT-HIL framework can be applied as a reliable testing system. This requires a detailed sensitivity analysis along with the fault analysis for the current setup in the future.
6. Conclusions
The main goal of this paper is to validate coordinated online voltage control algorithms via RT-HIL framework that were proposed in previous publications. A model based design approach in SGs has also been introduced as an important methodology in the design and implementation of SG technologies, solutions and corresponding products. Based on this approach, the paper addressed the validation of the proposed ICT model for off-line studies. The proposed ICT model is verified and validated through different test cases against the complete network model and related data traffic implemented in the SES Lab. It has been shown that the performance and characteristics of the non-RT ICT model matches with the detailed RT-HIL model. However, the non-RT model should be used for preliminary control studies, while, for validation purposes, the detailed RT-HIL model should be used to achieve a high TRL. Further, the validation of coordinated online voltage control for ReGen plants in MV grids is achieved. Two test cases, based on the results from validation of the ICT model as well as the main findings in previous publication were implemented in the RT-HIL setup. Deviations below 1% were obtained for the main variables involved from both off-line and RT studies. These results confirm that the main assumptions regarding ICT behavior considered in previous studies are valid.
The proposed methodology offers a systematic approach in tuning and design of voltage control coordination applicable in distribution grids with high penetration of ReGen plants. Classical control design and reliable operation of distribution grids are combined with ICT aspects that are of crucial importance in these applications. The presented MBD approach not only simplifies but also shortens the time-to-market for SG applications. Thus, confidence in new control approaches along with high TRLs (up to 6) can be obtained in early stages of the development with realistic emulation of real power grid and communication networks including the respective data traffic. The proposed method will ultimately support the DSOs in stability and security of the power supply.
As part of future activities, the network parameters such as packet loss rates, delay components and various update rates along with the laboratory hardware will be considered for sensitivity analysis. Moreover, validation of the following ancillary services from ReGen plants will be considered: (1) frequency restoration reserve (FRR, also known as secondary control) using a detailed model of the power grid e.g., modified 12-bus systems; and (2) frequency containment reserve (FCR, also known as primary control).
Author Contributions
K.S. and L.P. conceived, designed and performed the experiments; R.L.O. and F.I. helped in analyzing the data; L.P. contributed to the analysis tools; and K.S. wrote the paper.
Funding
This research was funded by Energinet.dk in contract number: PSO project 2015 No. 12347, for the project named “Ancillary Services from Renewable Power Plants (RePlan)”, www.replanproject.dk.
Acknowledgments
This work was carried out by the Department of Electronic Systems in cooperation with the Department of Energy Technology at AAU. Energinet.dk is acknowledged for funding this project in contract number: PSO project 2015 No. 12347, “Ancillary Services from Renewable Power Plants (RePlan)”, www.replanproject.dk. University of the Punjab, Pakistan is acknowledged for funding the Ph.D. of Author 1 (Kamal Shahid).
Conflicts of Interest
The authors declare no conflict of interests.
References
- Petersen, L.; Iov, F.; Hansen, A.D.; Altin, M. Voltage Control Support and Coordination between Renewable Generation Plants in MV Distribution Systems. In Proceedings of the 15th Wind Integration Workshop, Vienna, Austria, 15–17 November 2016. [Google Scholar]
- The Danish Market: Danish Wind Industry Association. Available online: http://www.windpower.org/en/knowledge/statistics/the_danish_market.html (accessed on 19 April 2018).
- Sorknaes, P.; Maeng, H.; Weiss, T.; Andersen, A.N. Overview of the Danish Power System and RES Integration; Technical Report. Intelligent Energy Europe (European Union), 2013. Available online: https://www.store-project.eu/documents/target-country-results/en_GB/energy-needs-in-denmark-executive-summary (accessed on 19 April 2018).
- The Danish Government. Our Future Energy; Technical Report; The Government of Denmark: Copenhagen, Denmark, 2011. Available online: https://stateofgreen.com/files/download/387 (accessed on 19 April 2018).
- Altin, M.; Hansen, A.D.; Cutululis, N.A.; Bindner, H.W.; Iov, F.; Olsen, R.L. Ancillary Services from Renewable Power Plants—RePlan Project. In Proceedings of the 14th Wind Integration Workshop, Brussels, Belgium, 20–22 October 2015. [Google Scholar]
- Petersen, L.; Iov, F. Distributed voltage control coordination between renewable generation plants in MV distribution grids. In Proceedings of the 24th International Conference & Exhibition on Electricity Distribution (CIRED), Glasgow, UK, 12–15 June 2017. [Google Scholar]
- Shahid, K.; Petersen, L.; Iov, F.; Olsen, R.L. On the Impact of Using Public Network Communication Infrastructure for Voltage Control Coordination in Smart Grid Scenario. In Smart Grid Inspired Future Technologies; Springer International Publishing: Cham, Switzerland, 2017; pp. 3–14. [Google Scholar]
- Shahid, K.; Kidmose, E.; Olsen, R.L.; Petersen, L.; Iov, F. On the impact of cyberattacks on voltage control coordination by ReGen plants in smart grids. In Proceedings of the 2017 IEEE International Conference on Smart Grid Communications (SmartGridComm), Dresden, Germany, 23–26 October 2017; pp. 480–485. [Google Scholar]
- Nguyen, V.H.; Besanger, Y.; Tran, Q.; Boudinnet, C.; Nguyen, T.L. Using Power-Hardware-in-the-Loop Experiments together with Co-simulation for the Holistic Validation of Cyber-Physical Energy Systems. In Proceedings of the IEEE PES International Conference of Innovative Smart Grid Technologies ISGT Europe, Torino, Italy, 26–29 September 2017. [Google Scholar]
- Faschang, M.; Kupzog, F.; Widl, E.; Rohjans, S.; Lehnhoff, S. Requirements for real-time hardware integration into cyber-physical energy system simulation. In Proceedings of the 2015 Workshop on Modeling and Simulation of Cyber-Physical Energy Systems (MSCPES), Seattle, WA, USA, 13 April 2015; pp. 1–6. [Google Scholar]
- Smart Energy Systems Laboratory. Available online: http://www.et.aau.dk/laboratories/power-systems-laboratories/smart-energy-systems/ (accessed on 19 April 2018).
- Bachmann. System Overview 2017; Technical Report; Bachmann Electronics: Feldkirch, Austria, 2017. [Google Scholar]
- Kemal, M.; Petersen, L.; Iov, F.; Olsen, R.L. A Real-Time Open Access Platform towards Proof of Concept for Smart Grid Applications. J. Commun. Navig. Sens. Serv. (CONASENSE) 2017, 2017, 49–74. [Google Scholar] [CrossRef]
- Kemal, M.S.; Pedersen, R.; Iov, F.; Olsen, R. DiSC-OPAL: A simulation framework for real-time assessment of distribution grids. In Proceedings of the 2017 Workshop on Modeling and Simulation of Cyber-Physical Energy Systems (MSCPES), Pittsburgh, PA, USA, 21 April 2017; pp. 1–5. [Google Scholar]
- Bessler, S.; Kemal, M.S.; Silva, N.; Olsen, R.L.; Iov, F.; Drenjanac, D.; Schwefel, H.P. Distributed flexibility management targeting energy cost and total power limitations in electricity distribution grids. Sustain. Energy Grids Netw. 2018, 14, 35–46. [Google Scholar] [CrossRef]
- Petersen, L.; Shahid, K.; Altin, M.; Olsen, R.L.; Iov, F.; Hansen, A.D.; Han, X. Deliverable D2—Voltage Control Support and Coordination between ReGen Plants in Distribution Systems; Technical Report, Energinet.dk; Aalborg University (AAU): Aalborg, Denmark; Technical University of Denmark (DTU): Copenhagen, Denmark, 2016. [Google Scholar]
- Iov, F.; Shahid, K.; Petersen, L.; Olsen, R.L. Deliverable D5—Verification of Ancillary Services in Large Scale Power System; Technical Report, Energinet.dk; Aalborg University (AAU): Aalborg, Denmark; Technical University of Denmark (DTU): Copenhagen, Denmark, 2018. [Google Scholar]
- Dickerson, C.E.; Mavris, D. A Brief History of Models and Model Based Systems Engineering and the Case for Relational Orientation. IEEE Syst. J. 2013, 7, 581–592. [Google Scholar] [CrossRef]
- European Commission. General Annexes. In HORIZON 2020—WORK PROGRAMME 2014–2015; Part 19—Commission Decision C(2014)4995 G. Technology readiness levels (TRL); European Commission: Brussels, Belgium, 2014; p. 1. [Google Scholar]
- De Baynast, A.; Bohge, M.; Willkomm, D.; Gross, J. Physical Layer Modeling. In Modeling and Tools for Network Simulation; Wehrle, K., Güneş, M., Gross, J., Eds.; Springer: Berlin/Heidelberg, Germany, 2010; pp. 135–172. [Google Scholar]
- Hulle, F.V.; Pineda, I. Economic Grid Support Services by Wind and Solar PV. Technical Report, REserviceS Project. 2014. Available online: https://windeurope.org/fileadmin/files/library/publications/reports/REserviceS.pdf (accessed on 19 April 2018).
- OPAL-RT Release Notes. Available online: https://www.opal-rt.com/wp-content/themes/enfold-opal/pdf/L00161_0103.pdf (accessed on 19 April 2018).
- EMS SCADA—Electromechanical Real-Time Simulation. Available online: https://www.opal-rt.com/systems-ephasorsim/ (accessed on 19 April 2018).
- Software Simulation—Real Time Applications—RT Labs. Available online: https://www.opal-rt.com/software-rt-lab/ (accessed on 19 April 2018).
- KauNet in Launchpad. Available online: https://launchpad.net/kaunet (accessed on 19 April 2018).
- Garcia, J.; Hurtig, P.; Brunstrom, A. KauNet—A Versatile and Flexible Emulation System. In Proceedings of the Swedish National Computer Networking Workshop (SNCNW08), Karlskrona, Sweden, 31 May–1 June 2008. [Google Scholar]
- Findrik, M. Network-Aware Adaptation Framework and Its Applications to Smart Grid Controllers. Ph.D. Thesis, Aalborg University, Aalborg, Denmark, 2016. Dissertation not published. [Google Scholar]
- Mikkelsen, L.M.; Thomsen, S.R.; Pedersen, M.S.; Madsen, T.K. NetMap—Creating a Map of Application Layer QoS Metrics of Mobile Networks Using Crowd Sourcing. In Internet of Things, Smart Spaces, and Next Generation Networks and Systems; Springer International Publishing: Cham, Switzerland, 2014; pp. 544–555. [Google Scholar]
- NetMap Website. Available online: http://netmap.aau.dk/ (accessed on 19 April 2018).
- Bogsted, M.; Olsen, R.L.; Schwefel, H.P. Probabilistic models for access strategies to dynamic information elements. Perform. Eval. 2010, 67, 43–60. [Google Scholar] [CrossRef]
- Altin, M.; Han, X.; Hansen, A.D.; Olsen, R.L.; Cutululis, N.A.; Iov, F. Deliverable D1.2—Technical Feasibility of Ancillary Services Provided by ReGen Plants; Technical Report; Aalborg University (AAU): Aalborg, Denmark; Technical University of Denmark (DTU): Copenhagen, Denmark, 2015. [Google Scholar]
- Kuzlu, M.; Pipattanasomporn, M.; Rahman, S. Communication network requirements for major smart grid applications in HAN, NAN and WAN. Comput. Netw. 2014, 67, 74–88. [Google Scholar] [CrossRef]
- Kalalas, C.; Thrybom, L.; Alonso-Zarate, J. Cellular Communications for Smart Grid Neighborhood Area Networks: A Survey. IEEE Access 2016, 4, 1469–1493. [Google Scholar] [CrossRef]
- Limited, I.G.; Associati, V.V. Broadband Coverage in Europe 2014—Mapping Progress Towards the Coverage Objectives of the Digital Agenda; Technical Report; European Commission: Brussels, Belgium, 2015. [Google Scholar]
- What Is Hardware-in-the-Loop Simulation?—MATLAB & Simulink—MathWorks Nordic. Available online: https://se.mathworks.com/help/physmod/simscape/ug/what-is-hardware-in-the-loop-simulation.html (accessed on 19 April 2018).
- Raghunath, K.M.K.; Rengarajan, N. Investigation of Faults, Errors and Failures in Wireless Sensor Network: A Systematical Survey. Int. J. Adv. Comput. Res. 2013, 3, 151–163. [Google Scholar]
- Ren, W.; Steurer, M.; Baldwin, T.L. Improve the Stability and the Accuracy of Power Hardware-in-the-Loop Simulation by Selecting Appropriate Interface Algorithms. In Proceedings of the 2007 IEEE/IAS Industrial Commercial Power Systems Technical Conference, Edmonton, AB, Canada, 6–11 May 2007; pp. 1–7. [Google Scholar]
Figure 1.
Model-based design approach for power system and SG applications.

Figure 2.
Basic NCS architecture for distributed online voltage coordination.

Figure 3.
Control architecture for distributed online voltage coordination.

Figure 4.
Structure of the MV benchmark grid.

Figure 5.
The various subsystems and workstations involved in the RT-HIL setup available in SES Lab at the Department of Energy Technology, Aalborg University, Denmark [11].
Figure 5.
The various subsystems and workstations involved in the RT-HIL setup available in SES Lab at the Department of Energy Technology, Aalborg University, Denmark [11].

Figure 6.
RT-HIL setup used for validation of distributed online voltage coordination.

Figure 7.
Map of BGA showing the locations of all ReGen plants in BDG and communication masts surrounding the area.
Figure 7.
Map of BGA showing the locations of all ReGen plants in BDG and communication masts surrounding the area.

Figure 8.
(a) Distribution of TCP RTT traces; and (b) packet loss probabilities measured around BGA using NetMap.
Figure 8.
(a) Distribution of TCP RTT traces; and (b) packet loss probabilities measured around BGA using NetMap.

Figure 9.
Test Setup: (a) non-RT network simulation; and (b) RT network emulation.

Figure 10.
(a) Original sine wave; and (b) original square wave used in non-RT and RT tests to validate impact of delay on a signal.
Figure 10.
(a) Original sine wave; and (b) original square wave used in non-RT and RT tests to validate impact of delay on a signal.

Figure 11.
Test Results from off-line setup showing received: (a) sine wave signals obtained through a network with four different average delay patterns; and (b) square wave signals obtained through a network with four different packet loss rates with a Mean Squared Error (MSE) of around .
Figure 11.
Test Results from off-line setup showing received: (a) sine wave signals obtained through a network with four different average delay patterns; and (b) square wave signals obtained through a network with four different packet loss rates with a Mean Squared Error (MSE) of around .

Figure 12.
Test Results captured from RT setup showing received: (a) sine signals obtained through a network with four different average delay patterns; and (b) square wave signal obtained through a network with four different packet loss rates with MSE of around .
Figure 12.
Test Results captured from RT setup showing received: (a) sine signals obtained through a network with four different average delay patterns; and (b) square wave signal obtained through a network with four different packet loss rates with MSE of around .

Figure 13.
Original sine wave signal compared with delayed signals received from non-RT and RT test setups with MSE of .
Figure 13.
Original sine wave signal compared with delayed signals received from non-RT and RT test setups with MSE of .

Figure 14.
P, Q, V of PVP 1, PVP 2, PVP 3 and WPP over one hour for: (a) 10 s update rate; and (b) 1 min update rate.
Figure 14.
P, Q, V of PVP 1, PVP 2, PVP 3 and WPP over one hour for: (a) 10 s update rate; and (b) 1 min update rate.

Figure 15.
Error in V, P and Q of PVP 1, PVP 2, PVP 3 and WPP sent via non-RT and RT communication models over one hour with: (a) 10 s update rate; and (b) 1 min update rate.
Figure 15.
Error in V, P and Q of PVP 1, PVP 2, PVP 3 and WPP sent via non-RT and RT communication models over one hour with: (a) 10 s update rate; and (b) 1 min update rate.


Table 1.
Summary of involved suites and their role description.
| Hardware/Software Platform | Description |
|---|---|
| M1 Controller | Used to implement RT aggregator control unit via MATLAB/Simulink |
| Opal-RT | Used to model BDG, ReGen plants and external grid via RT-Lab/ePHASOR |
| KauNet | Software used to emulate communication network for point-to-point communication via real network based data traffic |
| MATLAB/Simulink | Used for design and verification of controllers |
Table 2.
Test cases for evaluation in non-RT and RT test setups.
| Test Cases | Network Condition | Average Delay (ms) | Packet Loss (%) |
|---|---|---|---|
| 1 | Normal | 10 | 25 |
| 2 | Average | 100 | 50 |
| 3 | Below Average | 250 | 75 |
| 4 | Worst | 500 | 90 |
Table 3.
Signal Characterization.
| Signal 1: Sine Wave | Signal 2: Square Wave |
|---|---|
| Amplitude: 10 | Amplitude: 1 |
| Frequency: | Duty Cycle: 20% |
| Phase (rad): 0 | Period: 0.1 s |
| Sampling time: 1 ms | Sampling Time: 1 ms |
© 2018 by the authors. Licensee MDPI, Basel, Switzerland. This article is an open access article distributed under the terms and conditions of the Creative Commons Attribution (CC BY) license (http://creativecommons.org/licenses/by/4.0/).
Share and Cite
MDPI and ACS Style
Shahid, K.; Petersen, L.; Olsen, R.L.; Iov, F. ICT Based HIL Validation of Voltage Control Coordination in Smart Grids Scenarios. Energies 2018, 11, 1327. https://doi.org/10.3390/en11061327
AMA Style
Shahid K, Petersen L, Olsen RL, Iov F. ICT Based HIL Validation of Voltage Control Coordination in Smart Grids Scenarios. Energies. 2018; 11(6):1327. https://doi.org/10.3390/en11061327
Chicago/Turabian StyleShahid, Kamal, Lennart Petersen, Rasmus Løvenstein Olsen, and Florin Iov. 2018. "ICT Based HIL Validation of Voltage Control Coordination in Smart Grids Scenarios" Energies 11, no. 6: 1327. https://doi.org/10.3390/en11061327
Note that from the first issue of 2016, this journal uses article numbers instead of page numbers. See further details here.