Waterflooding Huff-n-puff in Tight Oil Cores Using Online Nuclear Magnetic Resonance
by
 , and
, and
Ting Chen
1,2,3,* ,
,
Zhengming Yang
2,3,
Yunhong Ding
2,3,
Yutian Luo
1,2,3,
Dan Qi
1,2,3,
Wei Lin
1,2,3 and
Xinli Zhao
1,2,3 1
School of Engineering Sciences, University of Chinese Academy of Sciences, Beijing 100049, China
2
Institute of Porous Flow and Fluid Mechanics, Chinese Academy of Sciences, Langfang 065007, China
3
PetroChina Research Institute of Petroleum Exploration & Development, Beijing 100083, China
*
Author to whom correspondence should be addressed.
Energies 2018, 11(6), 1524; https://doi.org/10.3390/en11061524
Submission received: 10 May 2018
/
Revised: 1 June 2018
/
Accepted: 7 June 2018
/
Published: 12 June 2018
(This article belongs to the Section L: Energy Sources)
Abstract
:Given the difficulty in developing waterflooding in tight oil reservoirs, using waterflooding huff-n-puff is an effective method to improve oil recovery. Online nuclear magnetic resonance (NMR) can detect the change in internal oil and water during the core displacement process, and magnetic resonance imaging (MRI) in real time. To improve the tight oil reservoir development effectiveness, cores with different permeability were selected for a waterflooding huff-n-puff experiment. Combined with online NMR equipment, the fluid saturation, recovery rate, and residual oil distribution were studied. The experiments showed that, for tight oil cores, more than 80% of the pores were sub-micro- and micro-nanopores. More than 77.8% of crude oil existed in the sub-micro- and micropores, and movable fluids mainly existed in the micropores with a radius larger than 1 μm. The NMR data and the MRI images both demonstrated that the recovery ratio of waterflooding after waterflooding huff-n-puff was higher than that of conventional waterflooding, and, therefore, residual oil was lower. Choosing two cycles’ of waterflooding, huff-n-puff was more suitable for tight oil reservoir development. The production of crude oil increased by 22.2% in the field pilot test, which preliminarily proved that waterflooding huff-n-puff was suitable for tight oil reservoirs.
1. Introduction
With the increasing demand for oil, tight oil reservoirs have gradually become an important field in oilfield exploration and development, given their future potential [1,2,3,4]. Because of the very low permeability and non-Darcy flow in tight oil reservoirs [5,6,7], a starting pressure gradient exists during waterflooding development, which leads to difficulties during injection, a rapid production decline [8,9,10], and insufficient formation energy challenges [11]. The development of tight oil reservoirs has mainly focused on the combination of horizontal wells and volume fracturing [12,13,14]. A large number of cracks occurs after reservoir volume fracturing [15,16,17,18], and waterflood development often results in a rapid outlet of water from the oil wells [19]. Therefore, the current volume transformation is mainly based on natural energy development [20]. The initial oil production using this process is high, but it decreases rapidly, which leads to low accumulative oil production and poor economic performance [21]. Therefore, studying economically feasible methods of supplementary formation energy for tight oil reservoirs is urgently necessary.
The tight oil reserves in the Changqing oil field have been proven to be 1 billion tons. Compared with the North American marine tight oil, the tight oil of the Yanchang Formation in the Ordos Basin is mainly composed of lacustrine sediments, with small single sand bodies, thin effective thickness, natural fracture development, low rock brittleness, and a low-pressure coefficient [11,22,23]. Therefore, exploration and development are difficult. A tight oil pilot test was performed in the Changqing Oilfield in 2010. In the early stage, according to the advanced low-permeability low-pressure reservoir water injection development model, the cluster well rectangle and diamond reverse nine-point well pattern were used for advanced waterflooding development. The average oil production of a single well in the first year was 1.0 t/day and, in the second year, decreased to 0.47 t/day. The annual rate of decline was 53%. The water content increased from 35.3 to 53.5% within one year, and the ratio of waterflooded wells was 37.8% in the first year, with a poor effect of waterflooding. In 2012, a horizontal well volume fracturing test was performed. The average initial production of waterflooding in a five-point well network was 12.1 t/day. The initial production at the seven points of the interlaced well network was 9.2 t/day, which was about 10 times the output of the single well in the vertical well. However, after a half-yearly production, the horizontal wells with a waterflooding development pattern were partially flooded. In 2013, the development test scale of the tight oil horizontal wells was further expanded. The complex fracture network system, composed of artificial fractures and natural fractures of reservoirs, increased the contact volume between the fractures and the reservoir matrix and increased the output of the single well. The retention fluid played a role in supplementing the formation energy, and the pressure coefficient was close to one. At this time, no waterflooding was needed to replenish the energy, and quasi-natural energy exhaustion development was adopted at the initial stage of the horizontal well volume fracturing. In 2014, the tight oil of Changqing Oilfield entered the scale development stage, which mainly used quasi-natural energy development in the horizontal wells. The average daily yield of oil was 10.0 t/day, and the water content was 39.1%. After half a year, the well oil production was 4.9 t/day, and the water content was 44.7%. After one year’s production, the formation energy was obviously insufficient, the production capacity declined to 35.5%, and the recovery rate was low (7–8%). Therefore, supplementary energy methods are urgently needed in the late development of quasi-natural energy exhaustion. Further exploring the rational development mode of tight oil under volume fracturing is also required to efficiently develop tight oil.
From the beginning of the 1960s, researchers have studied potential applications of the huff-n-puff process [24,25,26,27], which mainly focused on the field application for carbonate rock and sandstone reservoirs, and carbon dioxide (CO2) was mainly used as the injection medium [28,29,30,31]. Although the recovery rate of CO2 injection was higher, the cost was much higher than that of waterflooding [32]. In the CO2 injection process, the blockage of the oil reservoir and a decrease in the oil production rate occur [33]. In fractured reservoirs, CO2 may directly flow from injectors to producers through fractures without sweeping through the matrix, thereby reducing the sweep efficiency [34]. Given the problems arising in the development of tight oil reservoirs, waterflooding huff-n-puff has received renewed attention because of its economy and effectiveness [20]. Waterflooding huff-n-puff is suitable for well groups with low production and low formation energy. The depletion development in the early stage of tight oil reservoirs leads to the accumulation of oil at the supply boundary to the oil well under the action of elastic energy or water drive energy. A greater resistance exists around the production well, which leads to reduced production. [35]. In the process of huff-n-puff waterflooding, the formation energy is supplemented by waterflooding, the oil and water are replaced by imbibition, and the replacement crude oil flows into the bottom of the well under differential pressure. The period of waterflooding huff-n-puff is similar to CO2 huff-n-puff, which is divided into three stages: water injection, soak, and oil recovery [30,31,36].
Micro-cracks develop in tight oil reservoirs, and artificial crack networks form during volume fracturing, so tight oil reservoirs are generally regarded as a dual-pore system. The system is composed of two different mediums: a matrix and a fracture. The matrix is characterized by high porosity and low permeability, and the fracture has high permeability and low porosity [37]. This combination means that oil and gas are mainly stored in the matrix, and cracks provide the main channel for fluid flow. The oil field development process involves crude oil extraction from the matrix. Because of the imbibition replacement between the matrix and the crack, the fluid flow in the tight oil reservoir is different than that of a traditional reservoir [19]. Imbibition is a complex physical and chemical phenomenon. It is a process where the wetting phase enters the porous medium spontaneously and replaces the non-wetting phase through capillary force action [38]. In the process of imbibition, water first contacts the porous medium. Next, water enters the matrix through capillary force and moves along the wall of the porous medium, replacing part of the immovable oil. Imbibition oil recovery has become an important method used to improve oil production in tight oil reservoirs [39]. The effectiveness of the imbibition process depends on several parameters, including the size of the matrix block, the porosity and permeability of the rock, the viscosity of the fluid, the interfacial tension, the wettability of the rock, and the contact area between the wetting fluid and the matrix. A tight oil reservoir rich in micro-cracks is beneficial to imbibition oil recovery because natural fractures considerably increase the contact area of the fluid and the matrix [38].
Because of a lower fluid content inside the tight oil core, the experimental results of the common huff-n-puff in cores have large measurement errors that are influenced by the change in the external temperature [5]. During the huff-n-puff process, the distribution of fluid in different pores inside the core cannot be obtained in time. If the core is removed from the core holder for NMR detection, the change in the confining pressure and temperature and the fluid evaporation redistribute the fluid in the core, resulting in a larger measurement error [40]. Online NMR equipment can effectively solve the above problems. Online NMR is a core detection technique combining low-field NMR with displacement equipment. Compared with traditional experiments, online NMR can measure the T2 spectrum and scan with magnetic resonance imaging during high-temperature and high-pressure displacement experiments without core removal [41]. This technology effectively avoids the dissipation of oil and gas and the change in rock pores after pressure change, the experimental temperature is constant, and the measured data is closer to the actual situation.
This work was performed to study the effect of waterflooding huff-n-puff on the development of tight oil reservoirs and determine the appropriate huff-n-puff cycles. In this study, online NMR technology was used on tight oil cores to compare the waterflooding huff-n-puff and the conventional waterflooding experiment. The NMR data and MRI images were measured at different stages in the experiment. By analyzing the NMR data, the pore structure, oil saturation, and movable fluid saturation of the cores were obtained, and the effects of waterflooding huff-n-puff on oil recovery and residual oil distribution were studied. Through MRI images, the effect of waterflooding huff-n-puff on the development of tight oil reservoir was analyzed. Finally, the field pilot test also confirmed that waterflooding huff-n-puff is a feasible and economic process for tight oil reservoirs.
2. Fundamental Theory
2.1. Nuclear Magnetic Resonance and Magnetic Resonance Imaging Theory
The NMR rock sample analyzer has an external static magnetic field on its core. The hydrogen nucleus contained in the fluid of the core generates NMR signals for their own nuclear magnetic moment. The NMR signal intensity is proportional to the number of hydrogen protons contained in the sample tested. This principle is used to test the amount of fluid contained in the pores of a rock. Usually, the core NMR test method is used to measure the transverse relaxation time T2, which is the time from the hydrogen proton running out of the equilibrium state laterally until the equilibrium state is restored. The amplitude distribution corresponding to the relaxation time T2 reflects the size of the specific surface in the rock pores and the strength of the molecular action on their inner surface [40,42,43]. The relaxation time of a hydrogen nucleus in each rock pore can be expressed by the following equation:
where T2 is the fluid transverse relaxation time (ms), ρ2 is relaxation rate (μm/ms), and S/V is the pore specific surface (1/μm).
From Equation (1), as larger pores have corresponding smaller specific surfaces, their T2 relaxation time is longer, and vice versa: the smaller the pores, the shorter their relaxation time.
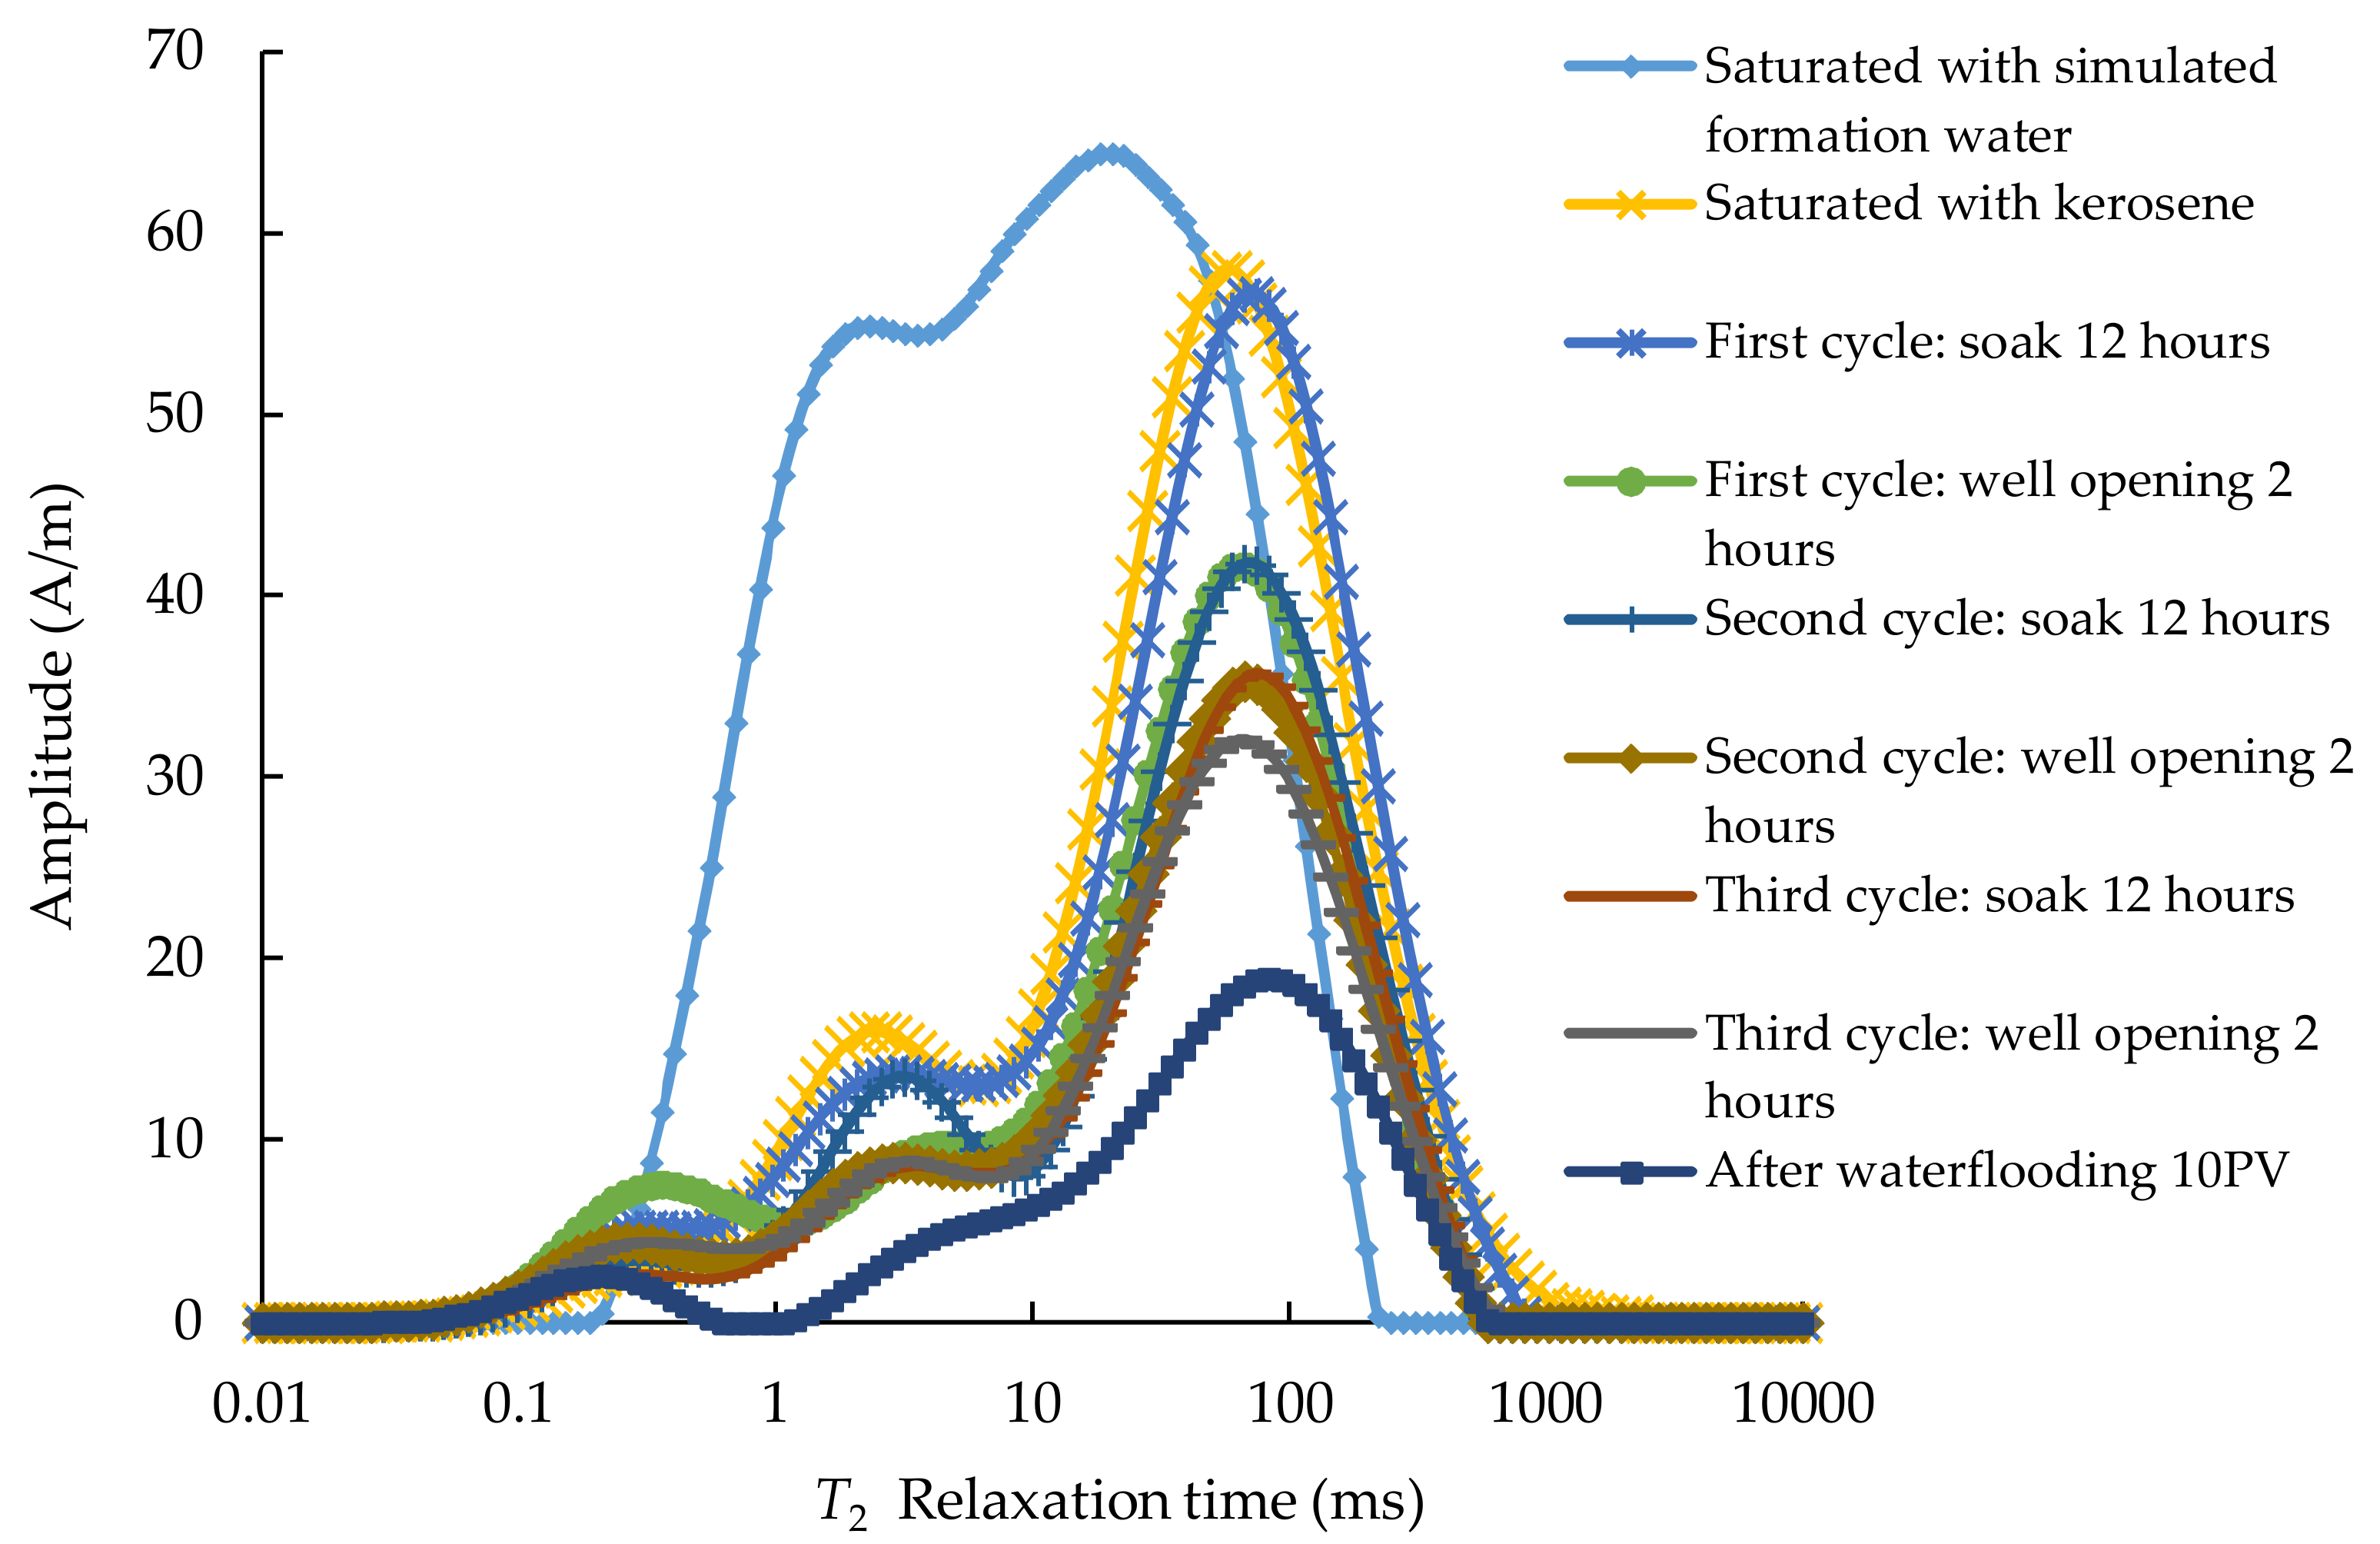
A tight oil sandstone core with a permeability of 1.85 × 10⁻³ μm2 was used for the waterflooding huff-n-puff experiment as an example. The NMR T2 spectra are shown in Figure 1 after saturation with simulated formation water, kerosene, and three cycles of huff-n-puff experiment and after waterflooding.
MRI was used to image the different layers of the core by processing the reception, space coding, and image reconstruction of the NMR signals. MRI could visualize the change in oil content inside the core during the displacement process.
2.2. Detection of Various Parameters in the Core by NMR
NMR testing started with the cores saturated with crude oil. Using the measured NMR data, the initial oil saturation Soi was calculated as follows:
where Soi is the initial oil saturation of the core (%); T2,min and T2,max are the minimum and maximum T2 relaxation time, respectively (ms); and Ai,o and Ai,w are the corresponding amplitude values of the T2 time points on the NMR spectrum curves of saturated oil and saturated water, respectively (A/m).
The computing equation for movable fluid saturation in cores is:
where Som is the movable fluid saturation in the core (%) and Ai,a is the corresponding amplitude value of T2 time points on the NMR spectrum curves after flooding (A/m).
Using the NMR data measured after flooding, the computing equation for the recovery ratio from the cores is as follows:
where ER is the recovery ratio of the core (%).
Using the NMR technique, the oil phase micro distribution characteristics, both before and after flooding, can be quantitatively studied [44]. The equation for calculating residual oil saturation in the cores is as follows:
where Sor is the residual oil saturation of the core (%).
3. Experimental
3.1. Geological Survey and Experimental Samples
The tight oil reservoirs of a block in Ordos Basin, China, studied in this paper have poorly developed natural fractures. The average permeability was 0.78 × 10⁻³ μm2, and the average porosity was 13.2%. The main pore type was residual intergranular pore. The pore structures were mainly small pore throats. The average pore throat radius was around 0.19 μm, and the main pore throat radius values ranged from 0.35 to 1.03 μm. The reservoirs had poor throat distribution concentration and uniformity. They had strong heterogeneity and obvious non-Darcy seepage flows.
The experimental cores had an average porosity of 17.36% and an average air permeability of 1.19 × 10⁻³ μm2. A total of four pieces of core were selected and divided into two groups. The specific physical characteristics of the tight oil core samples used in the experiments are listed in Table 1.
The concentration of the brine for simulated formation water was 80 g/L. To shield the NMR signals, Deuterium water was chosen as the injection medium, and the concentration of salt in Deuterium water was 80 g/L. Kerosene was chosen as the saturated oil. At 25 °C, the viscosity of kerosene was 1.67 mPa·s, and the density was 0.8 g/cm3. Each fluid was filled in an intermediate container with a piston.
3.2. Experimental Equipment
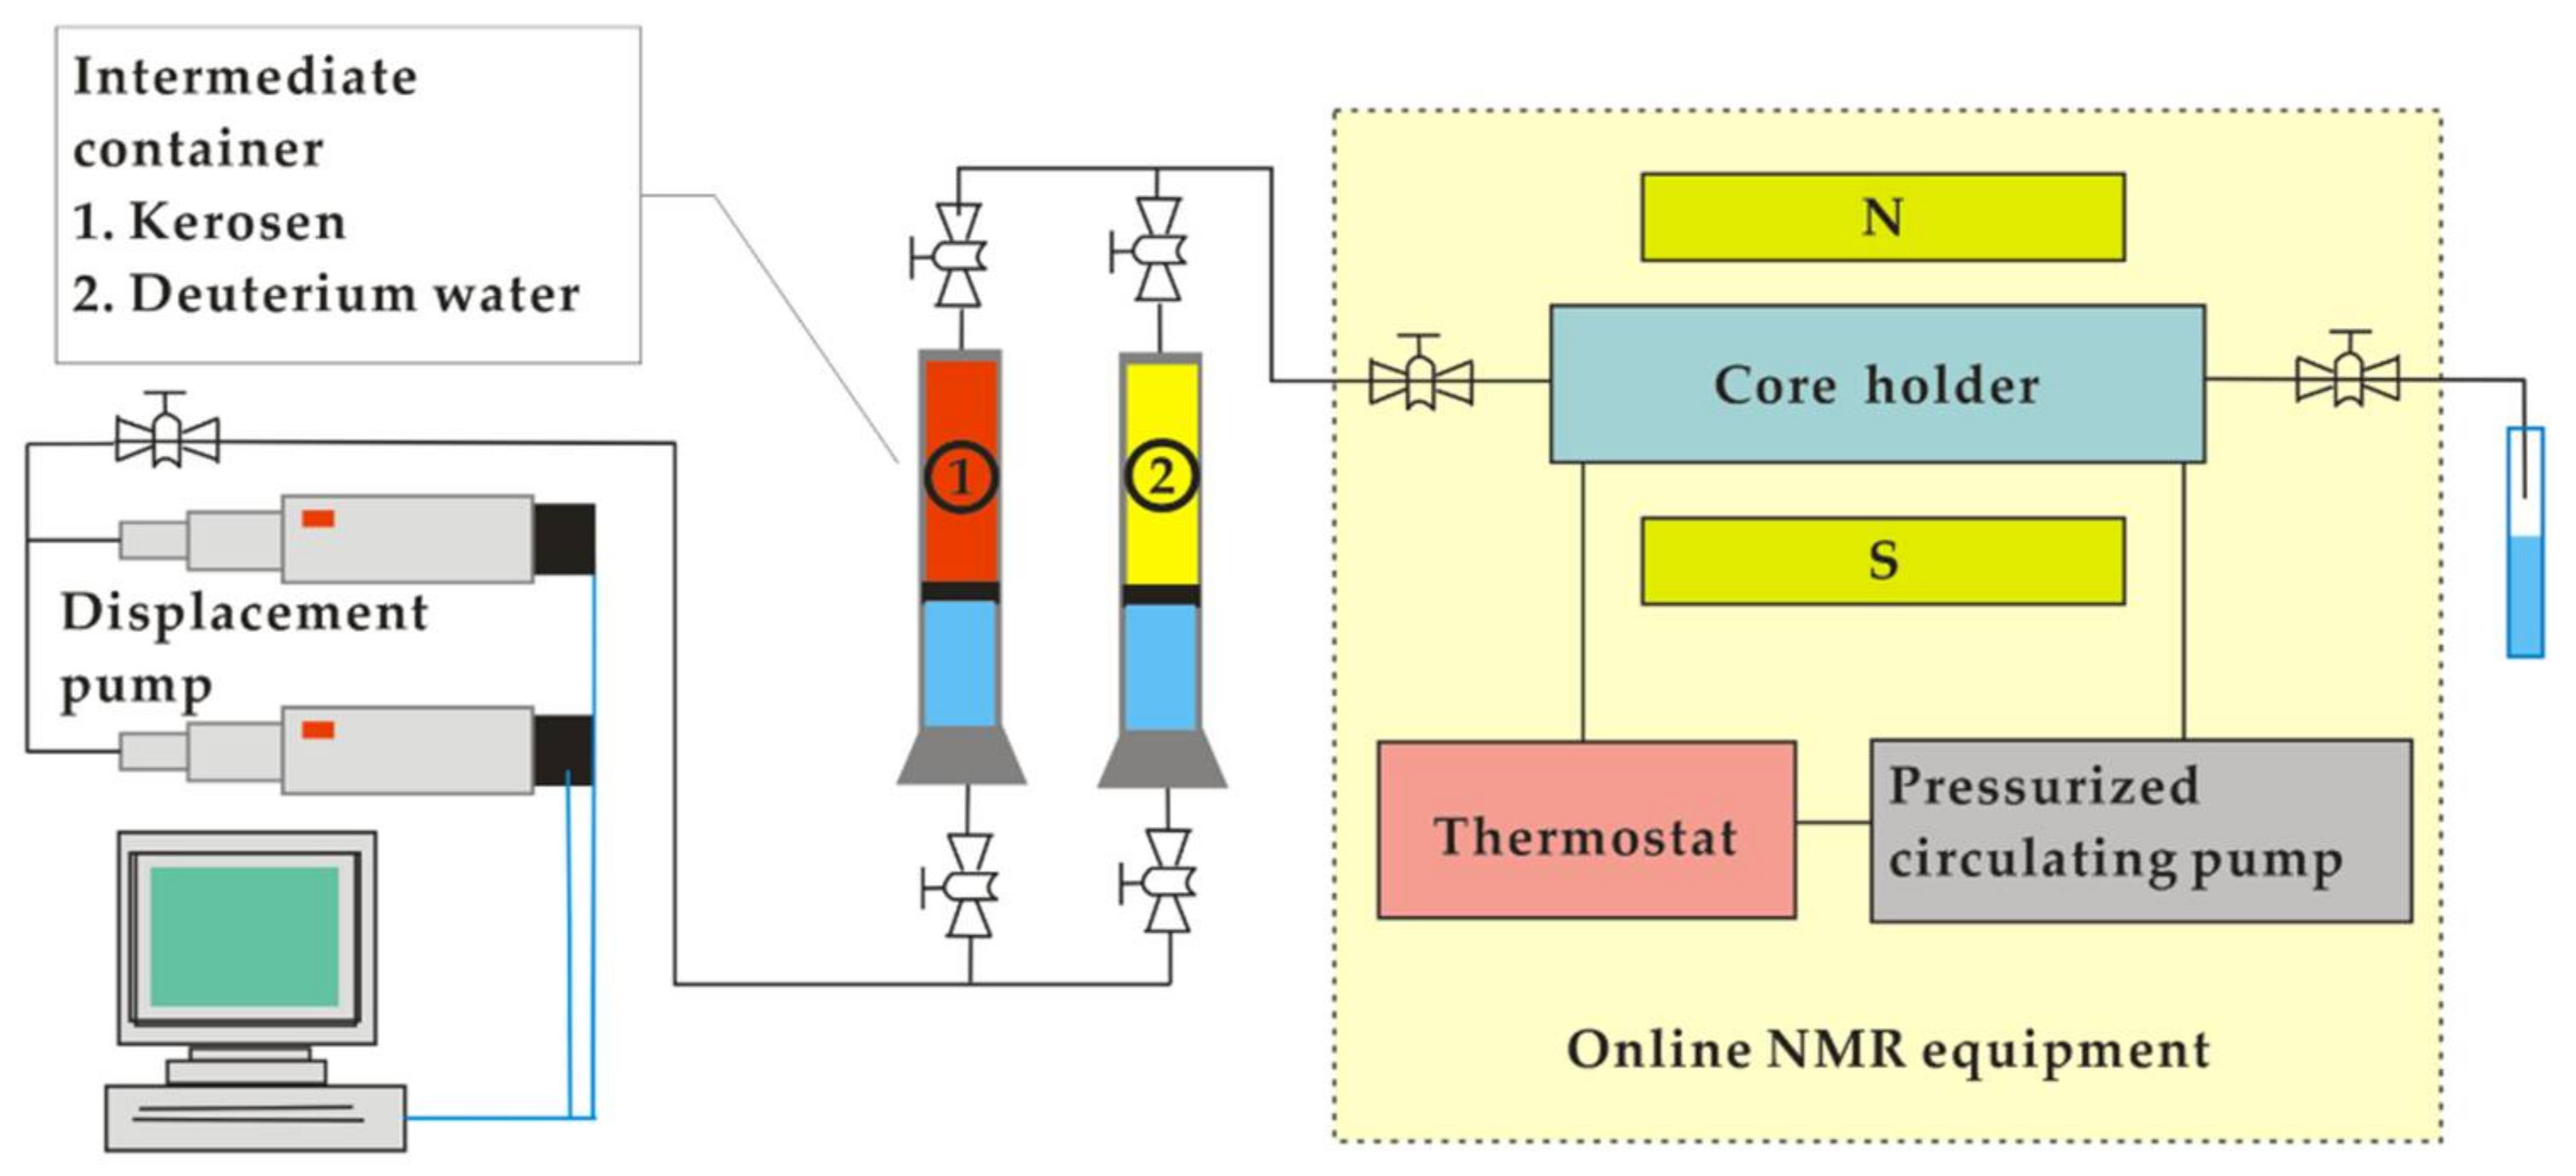
The flow chart of the experimental equipment is shown in Figure 2. Two displacement pumps were used together to pressurize the test fluid. Two intermediate containers were used for kerosene and Deuterium water. A thermostat and a pressurized circulating pump were used to provide the same formation temperature and peripheral pressure for the core holder. An online NMR equipment was used to record the NMR T2 data and MRI images of the cores during the experiment.
3.3. Experimental Procedure
The basic steps of the experiment were as follows. Four pieces of core were selected for labeling, oil washing, and drying, then their dry weight was obtained; the basic parameters were measured, such as diameter, length, air permeability, and porosity. Then, the cores were vacuumed and saturated with simulated formation water. Their NMR T2 data and MRI images under saturated water were recorded using the online NMR equipment. The cores were then dried, vacuumed, and saturated with Deuterium water to eliminate the NMR signals of the water phase. A 10 MPa pressure condition was set to saturate each piece of core with kerosenel and the displacement volume was 10 pore volume (PV). After each piece of core was saturated, NMR T2 data were recorded using the online NMR equipment. To prevent the introduction of a nuclear magnetic signal, Deuterium water was used to perform waterflooding and the huff-n-puff experiment. Two cores were chosen for the waterflooding experiment. The displacement pressure was 10 MPa, and the displacement volume was 10 PV. After flooding was completed, NMR T2 data and MRI images of the cores were recorded by the online NMR equipment. Other two cores were used for the waterflooding huff-n-puff experiment, for which three cycles were completed at an injection pressure of 10 MPa. In each cycle, the soak time was 12 h with a well opening time of 2 h. After the huff-n-puff experiment, without removing the core, the displacement pressure was set to 10 MPa, and the waterflooding experiment was completed at a displacement volume of 10 PV. NMR T2 data and MRI images of the cores in each cycle and after completing flooding were recorded with the online NMR equipment. The NMR data and MRI images were used to study the core pores, oil saturation, movable fluid saturation, oil displacement effect, and residual oil distribution.
4. Results and Discussion
4.1. NMR Measuring Results of the Core Pores
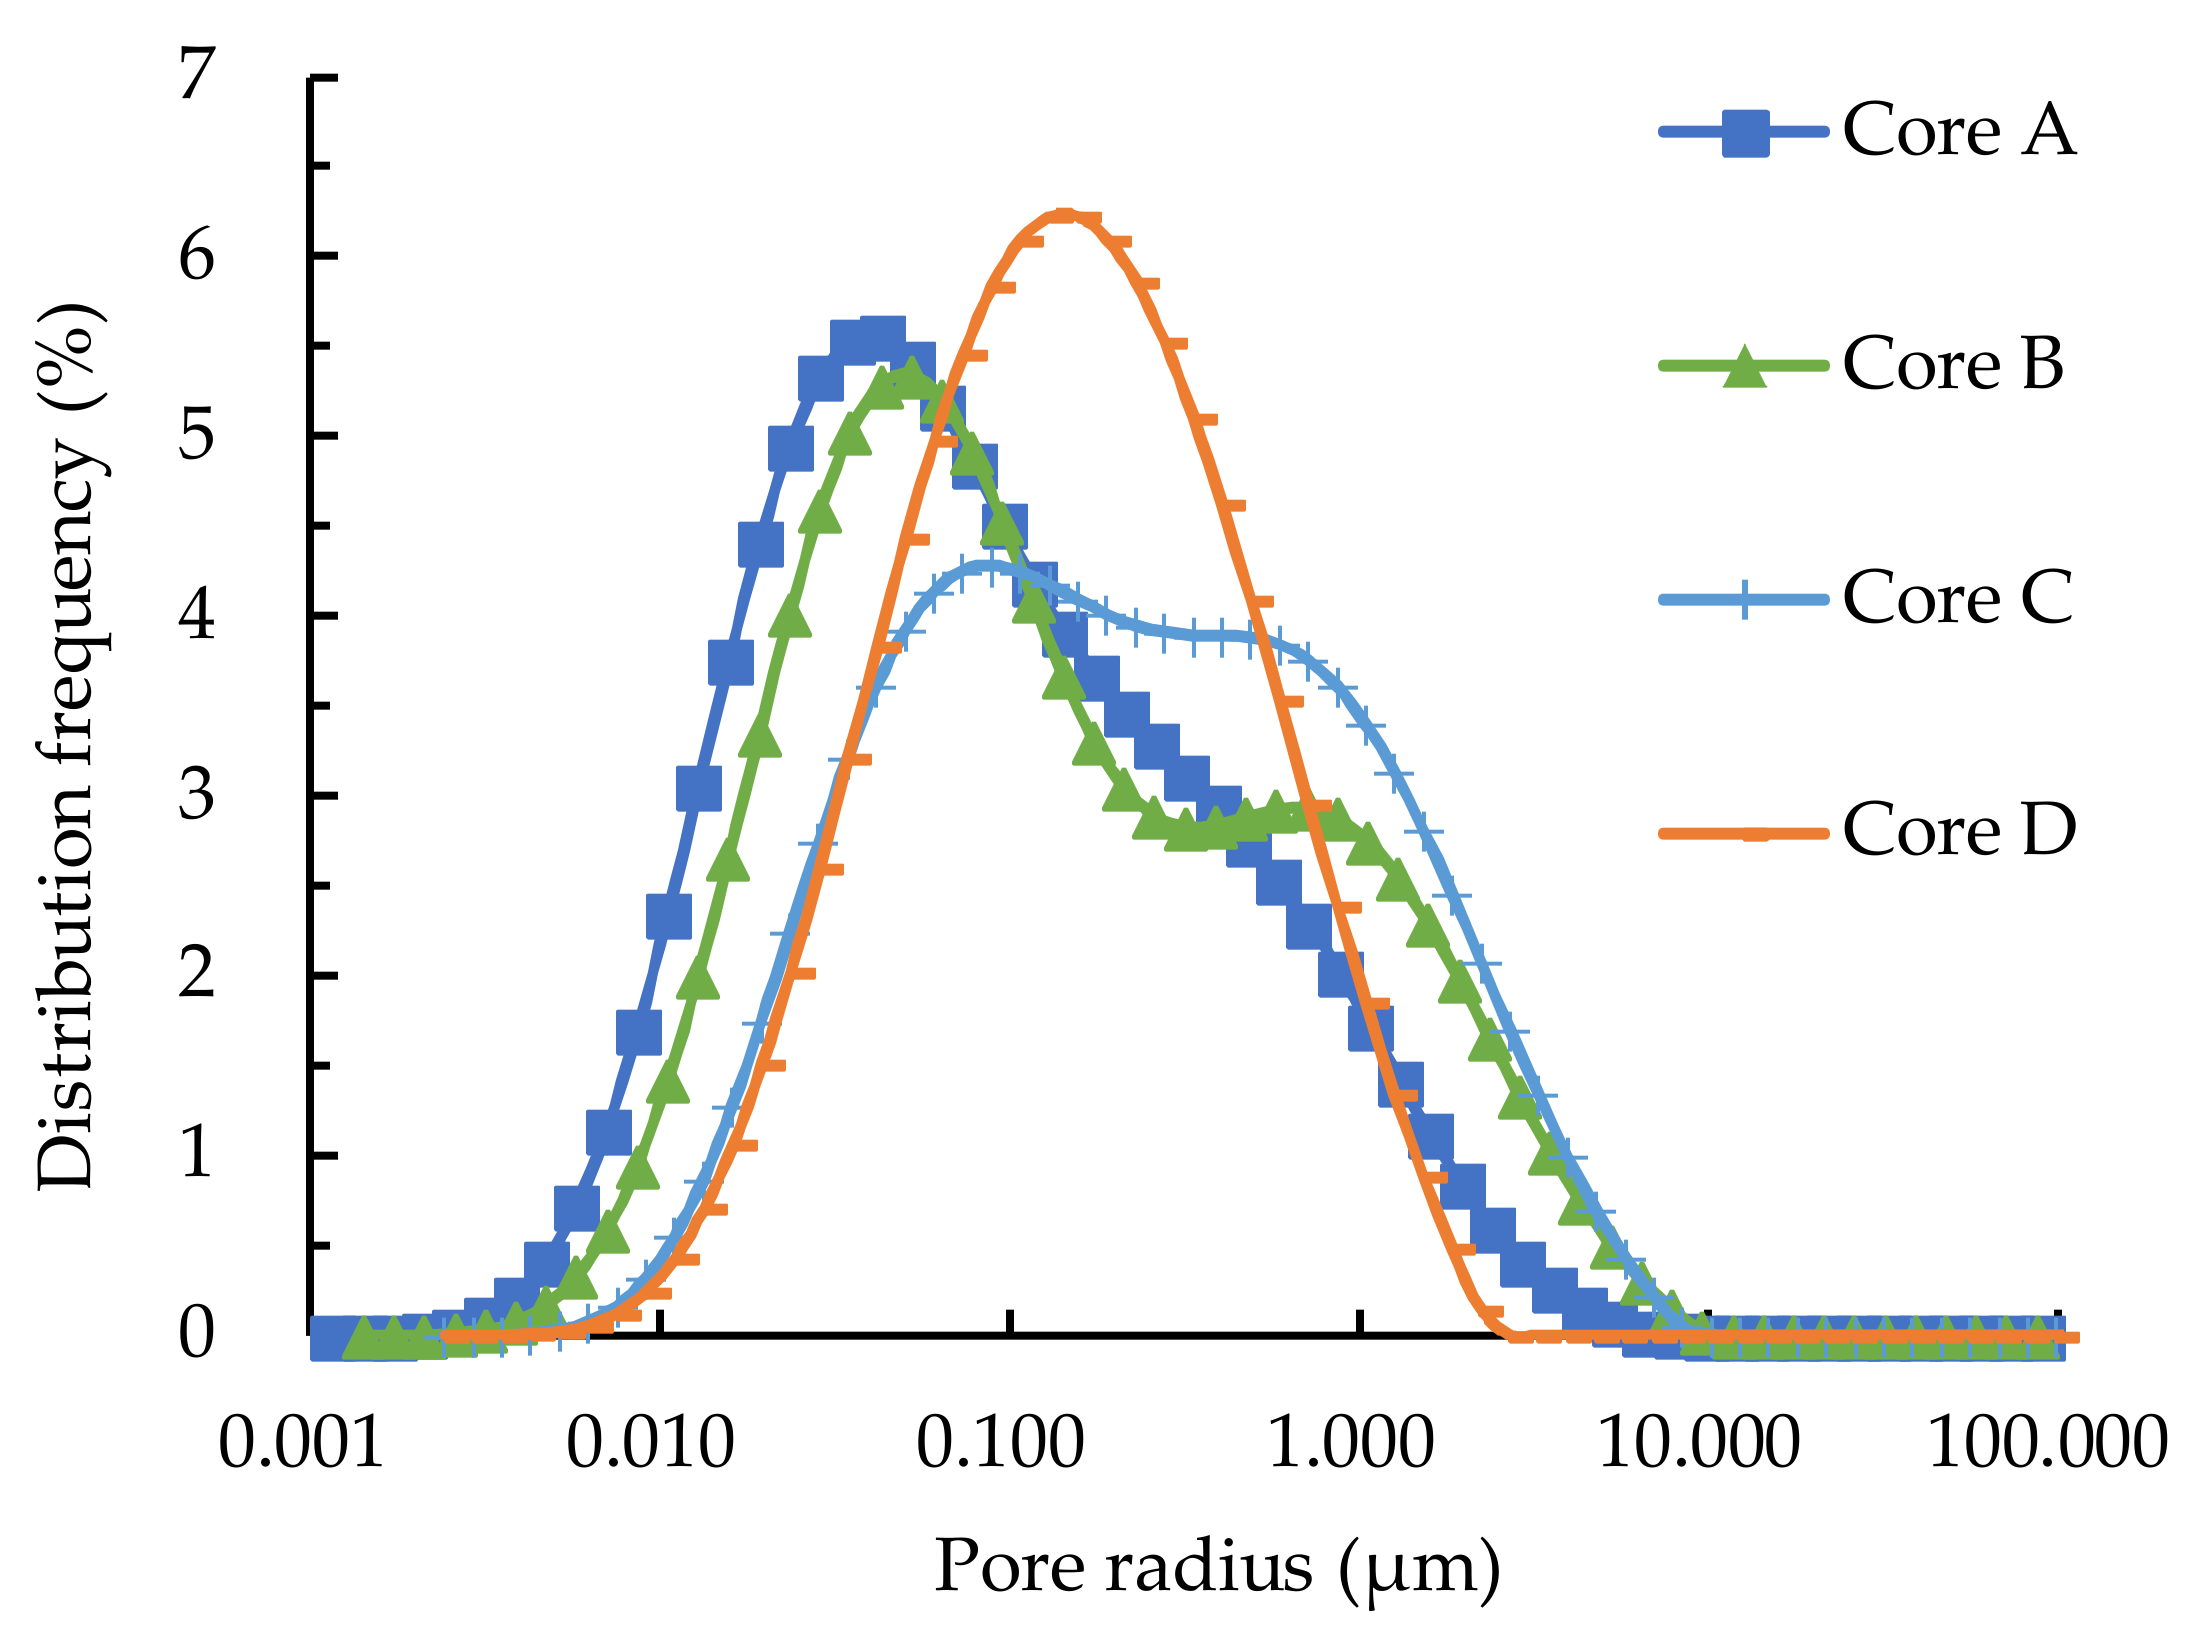
The NMR T2 distribution of the cores saturated with simulated formation water was converted into pore radius distribution [43,45,46]. The NMR data obtained from the cores saturated with simulated formation water were converted into pore radius distribution. The results are shown in Figure 3.
According to three pore radius boundaries [47], i.e., 0.05, 0.1, and 1 μm, the pores were classified as nanopores, micro-nanopores, sub-micropores, and micropores. The pore radius of the tight oil cores was mainly less than 10 μm, and more than 80% were sub-micropores and micro-nanopores.
4.2. Study on Oil Saturation and Movable Fluid Saturation
The method for calculating the ratios of oil saturation in different pores was the same as that used for the ratio of the saturated simulated formation water. Table 2 shows the oil saturation in different pores after the core was saturated with crude oil. More than 77.8% of crude oil was found in sub-micropores and micropores, and the ratio of crude oil stored in micro-nanopores increased with decreasing permeability. The main reason for this finding is that the total volume of nano- and micro-nanopores was small. Though the total amount of these pores was large, the proportion of stored crude oil was very low. The fluid in the nanopores was considered immovable. Therefore, saturating the nanopores with crude oil was difficult. Overall, the higher the permeability of this batch of cores, the lower the oil saturation. The reason for this anomaly is that many large pores and channels with higher permeability were present inside the cores, creating a small flow resistance. When the cores were penetrated by crude oil, the fine pores could hardly be saturated. As little difference exists inside the cores between large and small pores with lower permeability, under the same displacement pressure, the cores required more time to become saturated at 10 PV and then they could become more fully saturated. In addition to the above reasons, slip flow and diffusion occurred especially at low pressure in the nanopores. The preferential flow path led to significant porosity and permeability underestimation. A practice that can be used to avoid this misinterpretation is to measure several permeability values under different pressures. High-pressure might be more indicative of fluid phase permeability [48,49,50].
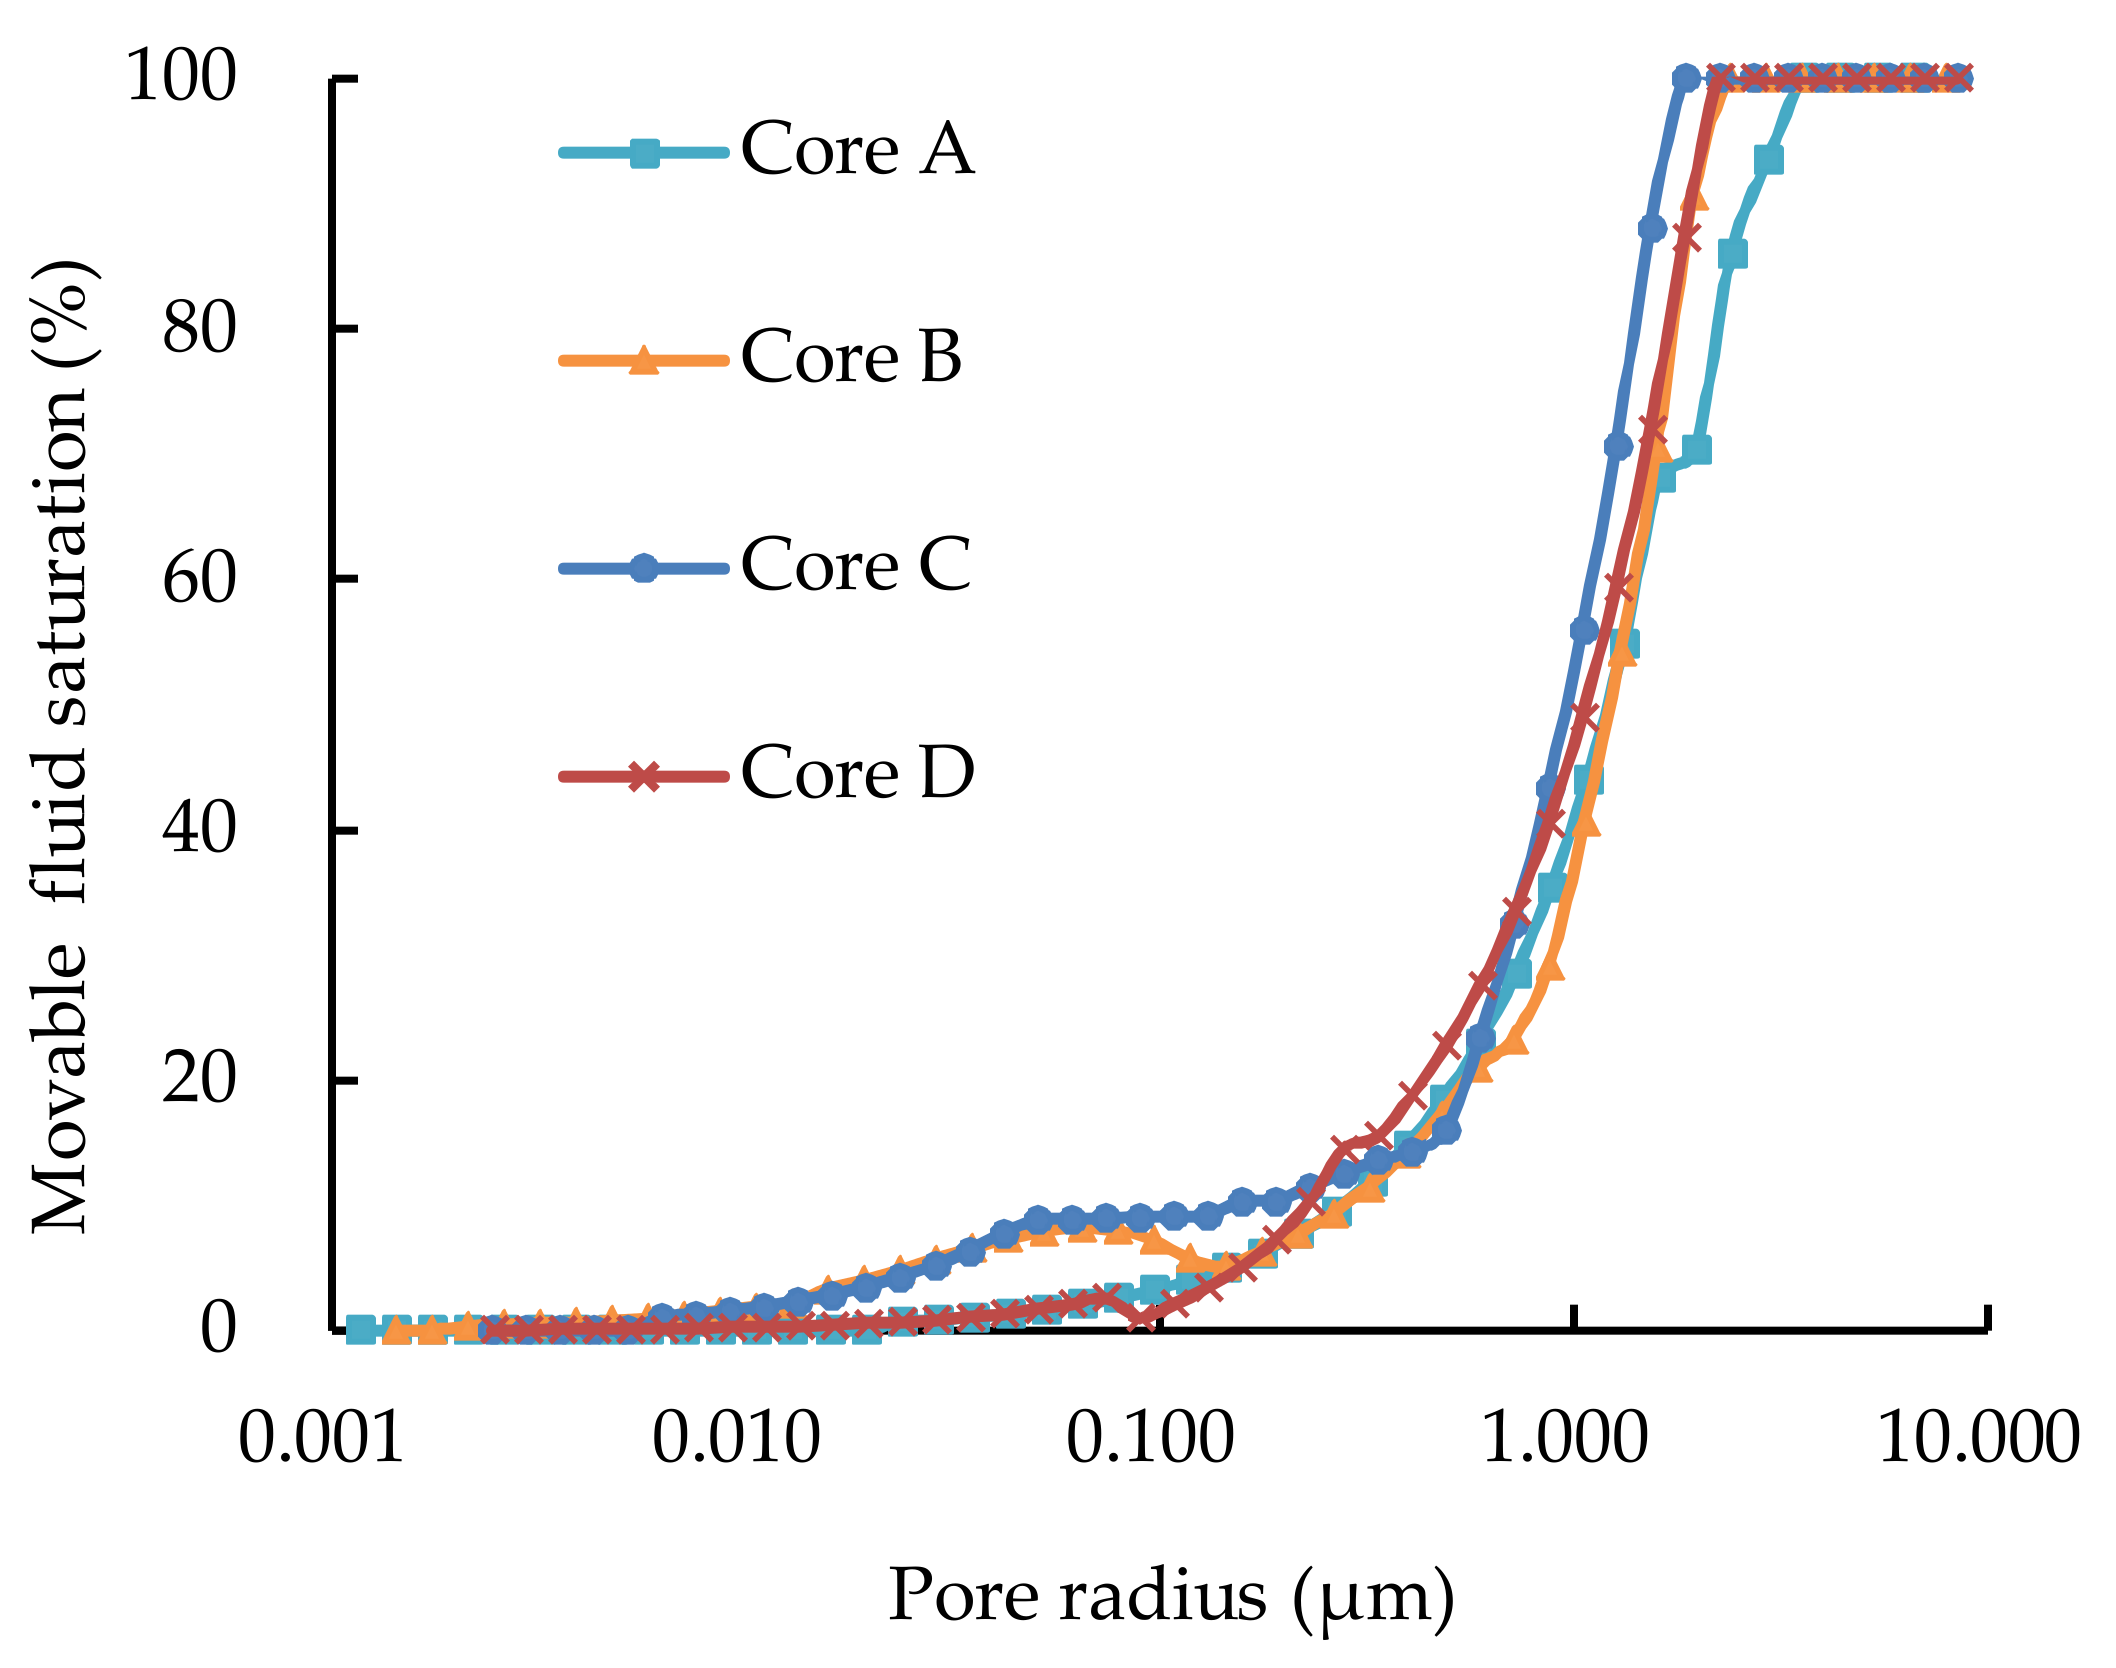
Figure 4 provides the movable fluid saturations in different pores of each core. Only a small difference was observed between the movable fluid saturations in the various cores. In tight oil cores, hardly any relationship was found between permeability and movable fluid saturation. The amount of movable fluid in the micro-nanopores was not more than 10%. A small amount of movable fluid was found in the sub-micropores. Movable fluids mainly existed in the micropores with a radius larger than 1 μm.
4.3. Study on Oil Displacement Effect and Residual Oil Distribution
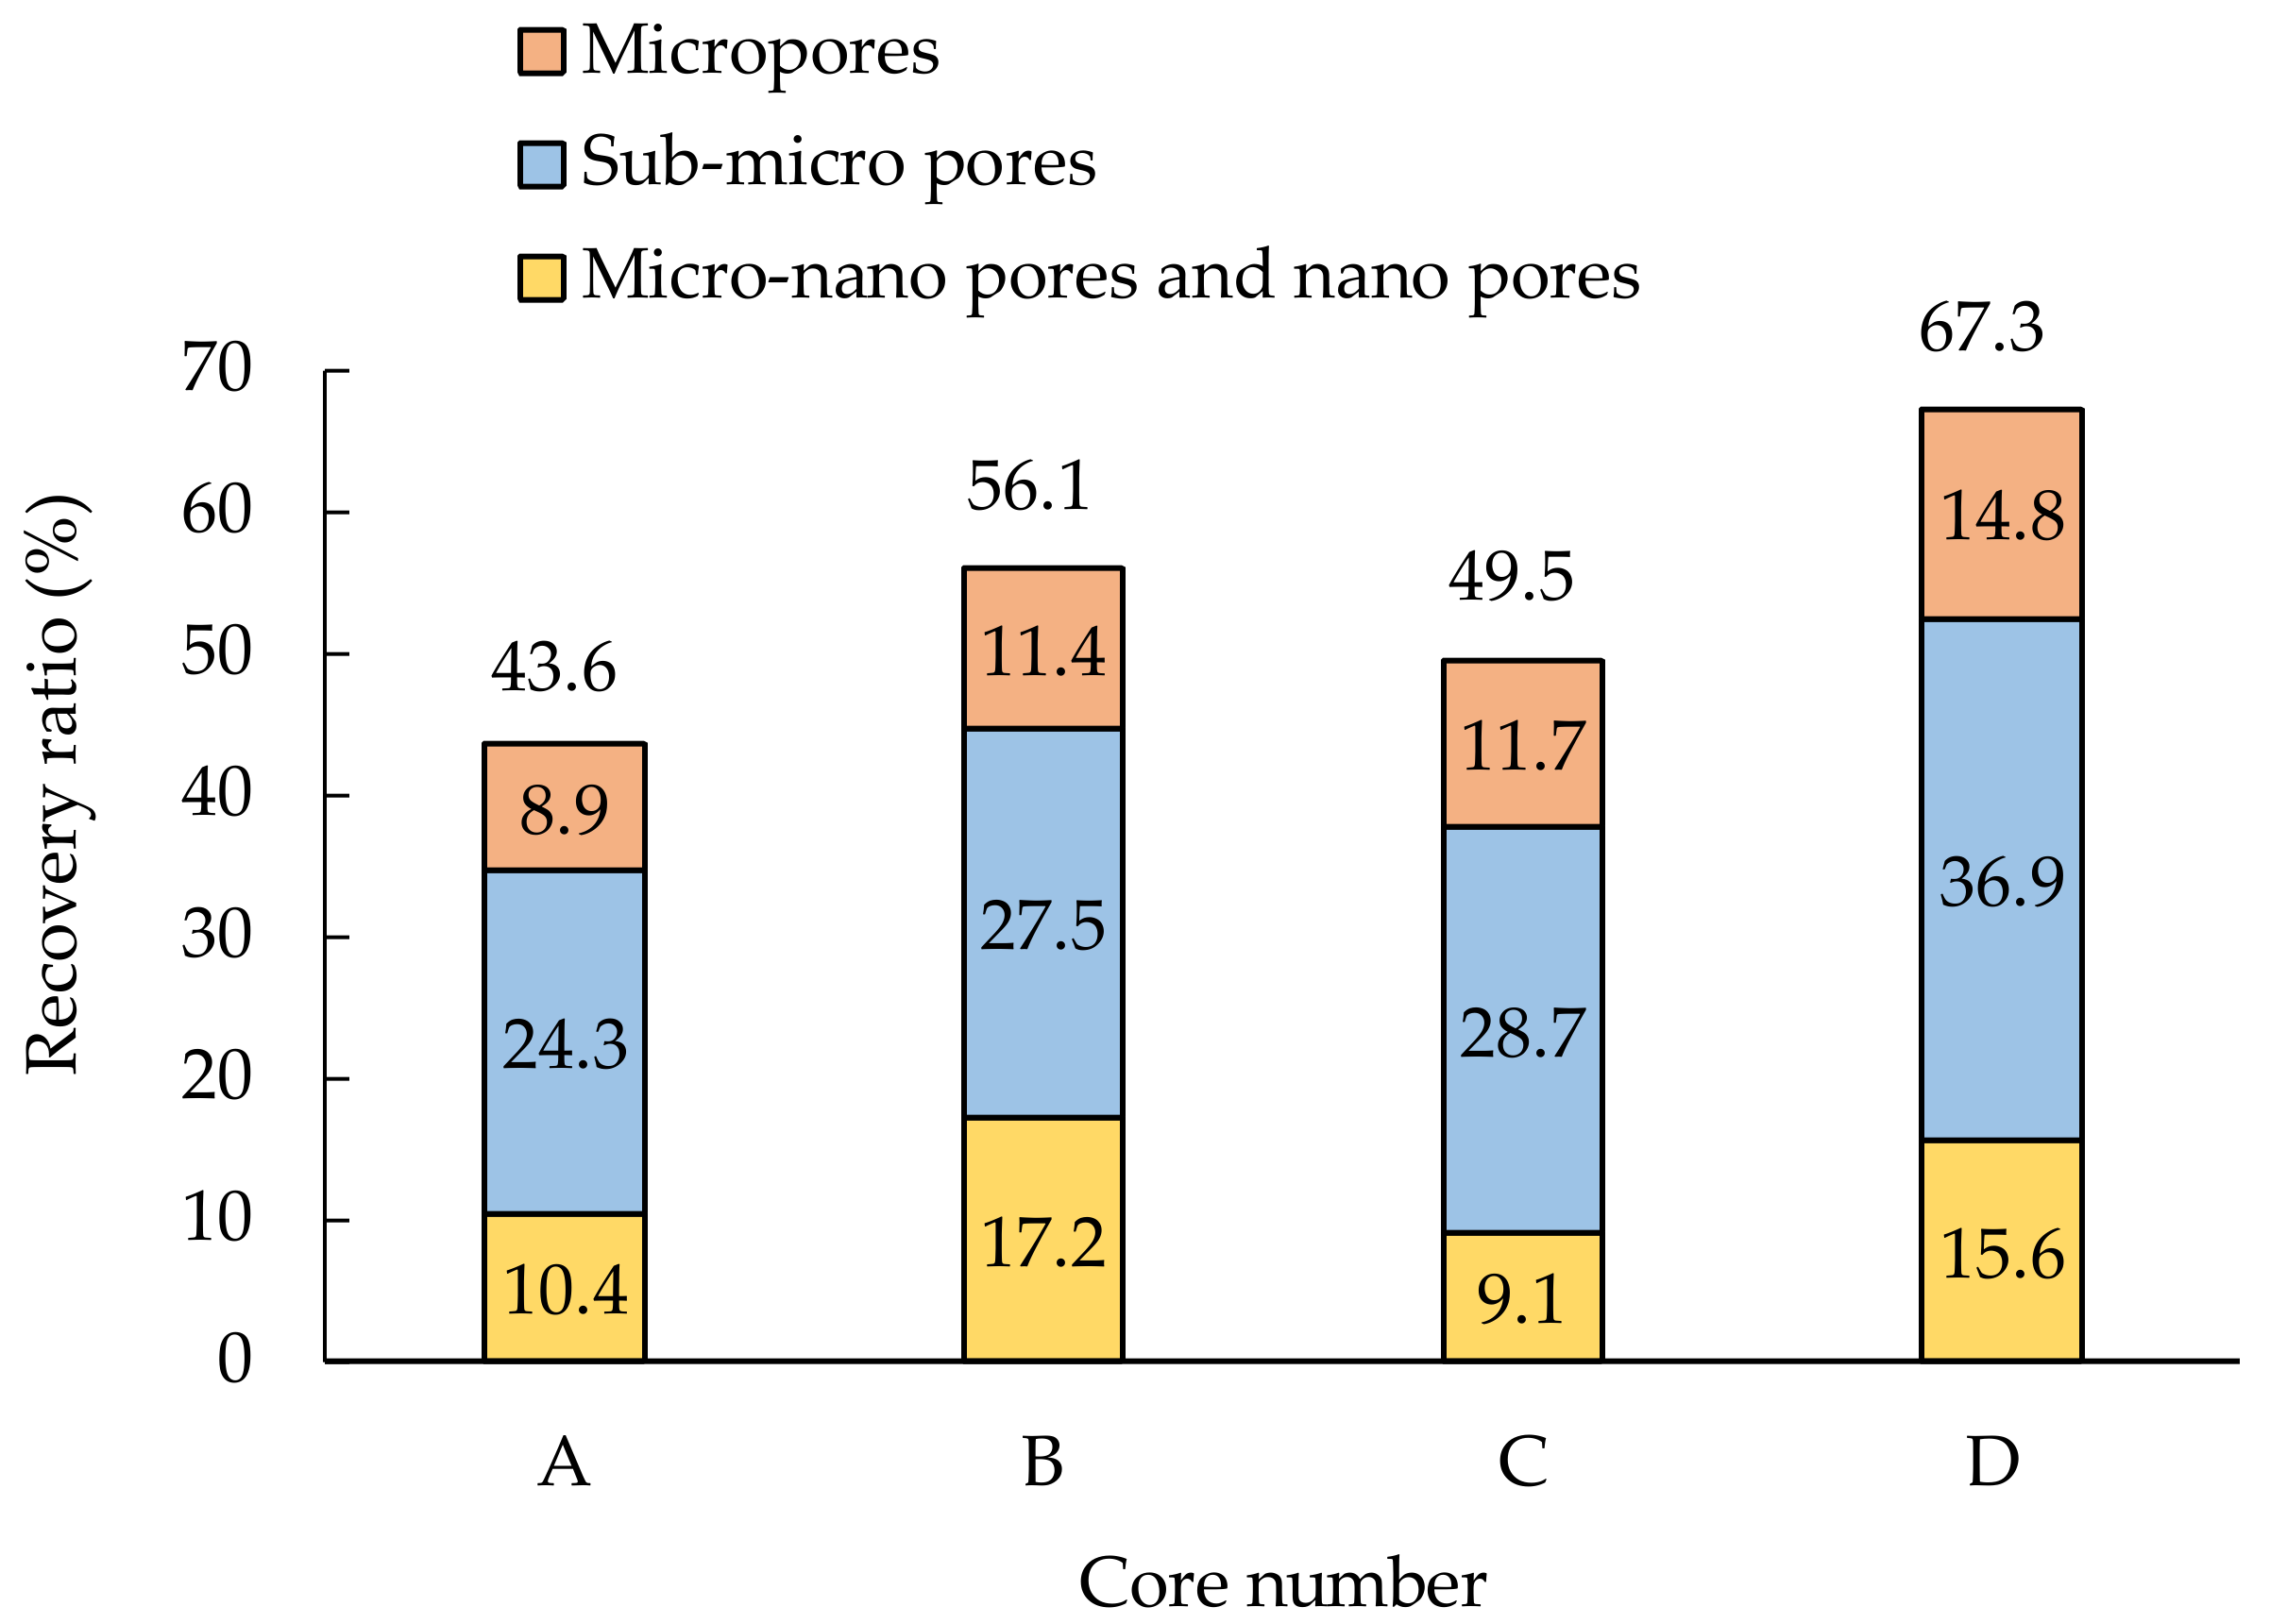
The recovery ratio of crude oil in each piece of core was calculated, as shown in Figure 5 and Table 3. For tight oil cores, the recovery ratio of waterflooding huff-n-puff was lower than that of conventional waterflooding. A large amount of kerosene was produced during the waterflooding stage after huff-n-puff. The oil in the heart of the rock entered the macropores by imbibition during the waterflooding huff-n-puff process; however, the pressure was insufficient to extract the oil from the core. The subsequent waterflooding provided enough pressure, thus effectively improving the recovery ratio.
The study of the recovery ratio of each cycle showed that the first cycle for the two cores accounted for 41.4% and 40.6% of the total recovery ratio, respectively. The second cycle of the two cores accounted for 24.4% and 16.6% of the total recovery ratio, respectively, and the third cycle was responsible for 4.1% and 5.3% of the total recovery ratio, respectively. Overall, the displacement stage accounted for 30.1% and 37.4% of the total recovery ratio. The first two huff-n-puff cycles significantly contributed to the recovery ratio. The contribution of the third huff-n-puff cycle was less, which indicates that the remaining oil was difficult to recover via imbibition. In contrast to the recovery ratios of different pores, the overall recovery ratio increased in every pore type via huff-n-puff. Notably, the recovery ratios of the micropores and sub-micropores were higher than that of conventional waterflooding. The reason for this phenomenon is that most of the pores in the reservoir were hydrophilic. In the process of soaking, molecular diffusion occurs, which is important in tight reservoirs, causing a slight decrease in the average reservoir pressure. During the production period, molecular diffusion can mitigate the reservoir pressure decline. The hydrophilic nature of the reservoir accelerated the diffusion process of water and water imbibition and displaced oil into the larger pores [51].
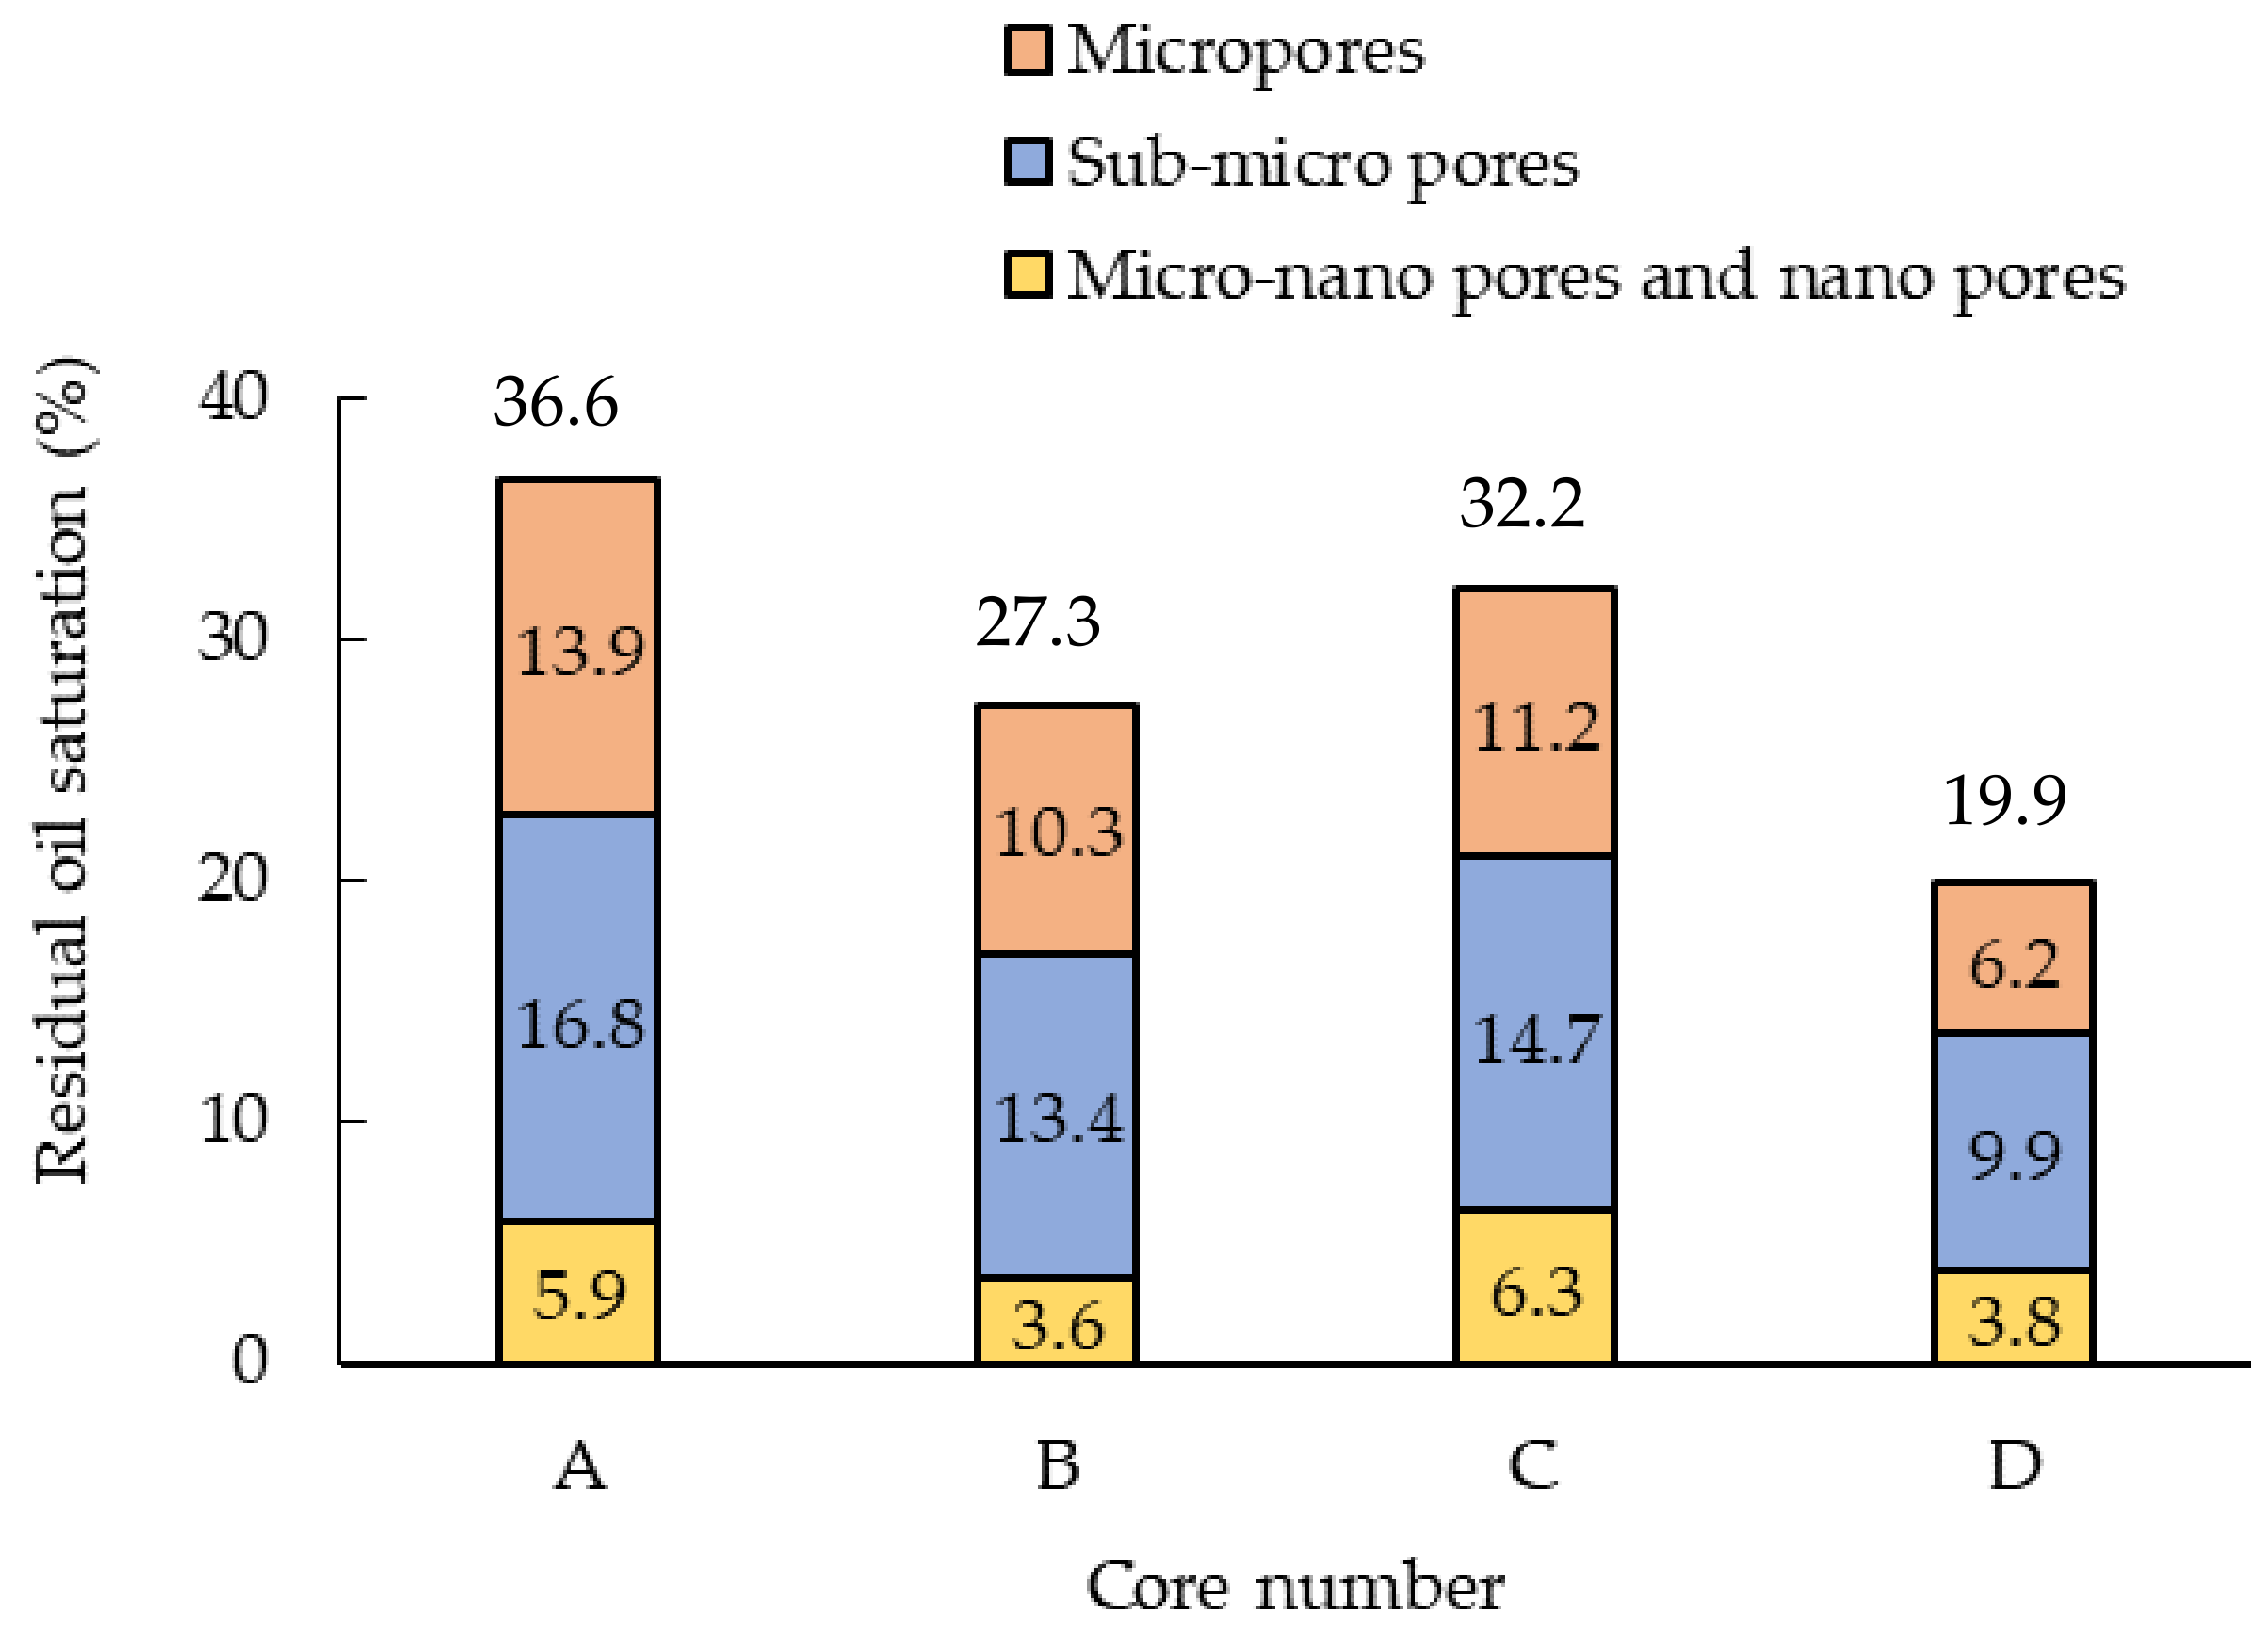
The calculation results for the residual oil saturation in the different pores of each core are shown in Figure 6 and Table 4. Comparing the residual oil saturation of the two groups, the residual oil saturation was higher than in conventional waterflooding using only huff-n-puff; however, the residual oil saturation of waterflooding huff-n-puff was obviously lower than that of conventional waterflooding.
Table 2, Table 3 and Table 4 and Figure 5 and Figure 6 show that the sub-micropores contributed 49–58% of the produced oil. Because the soaking process can promote imbibition, replacing the oil from the small pores into the macropores and fractures and then accumulating oil to form the oil belt could replace more oil. Waterflooding after huff-n-puff was less than 25–38% of conventional waterflooding in residual oil saturation. In the first cycle, waterflood huff-n-puff effectively replaced oil in the micro-nanopores and nanopores. The lower the permeability, the better the effect of soaking on recovery in the small pores, and the greater the proportion of imbibition in oil recovery. Therefore, the lower the permeability, the more obvious the effect of waterflooding huff-n-puff on oil recovery. The effect of the third cycle of huff-n-puff on tight oil reservoir recovery was not obvious, because after the first two cycles, the residual oil was difficult to move via soaking. Therefore, choosing two cycles of waterflooding after waterflooding huff-n-puff is more suitable for tight oil reservoir development, which could significantly improve the oil recovery ratio while being time-efficient.
4.4. MRI Images of the Cores at Various Stages of the Experiment
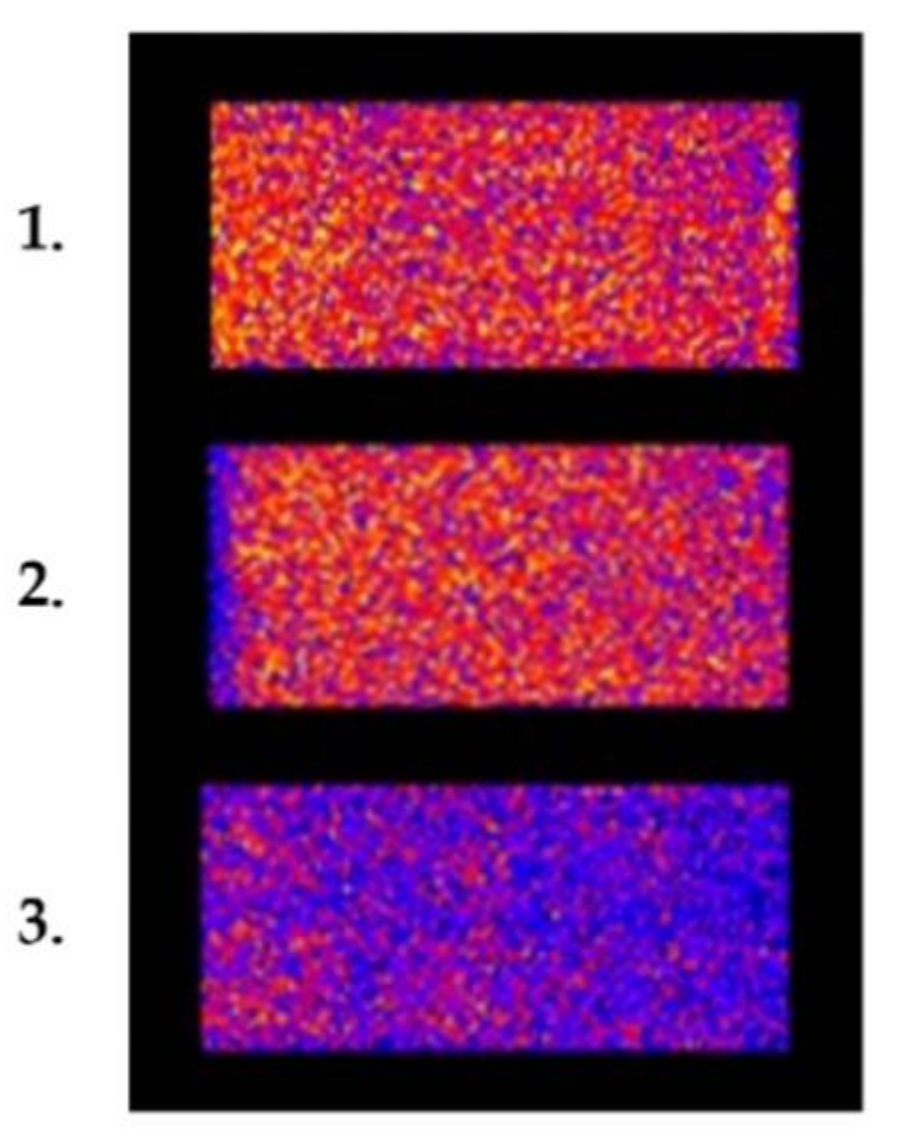
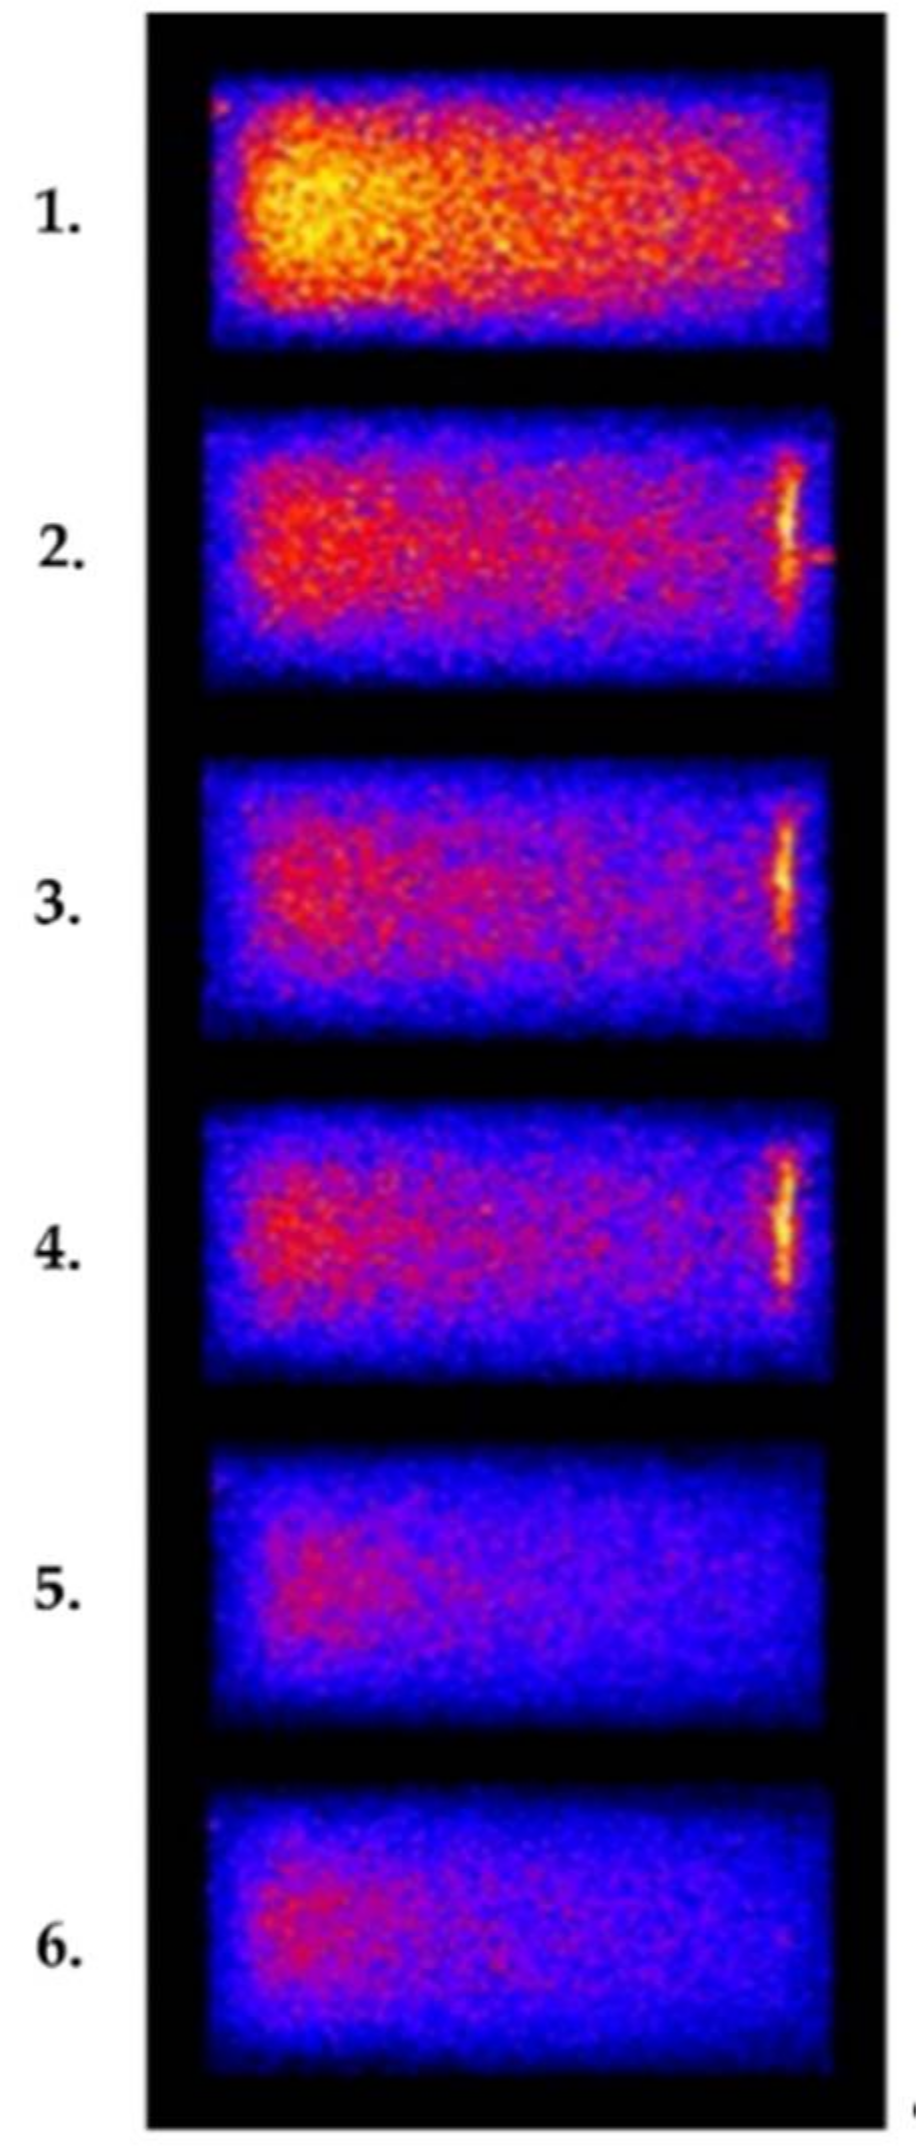
MRI images can help depict the changes in a core during the development process [40]. Only kerosene had nuclear magnetic signals in the heart of the experimental core. The brighter the image, the more oil in the core. Figure 7 and Figure 8 show the MRI images of core A and core B at different stages of the experiment. The imaging direction was in the coronal plane. The remaining oil in core B was significantly less than in core A, compared with the initial saturation oil stage. The end effect existed at the exit side, which showed a high brightness area at the end of the image. The reason for this observation is that the oil gathered under the internal pressure at the exit at the oil recovery stage. When the oil was removed from the core at the displacement stage, the end effect disappeared.
4.5. Field Test
In 2017, the waterflooding huff-n-puff test of a horizontal well was performed in the tight oil of the Changqing Oilfield. From the production data of four wells developed by waterflooding huff-n-puff in the X well area, within seven days, the average daily production oil of a single well increased from 9.9 t to 18.2 t, and the water content decreased from 50 to 26.7%. After 30 days’ production, the daily oil production in a single well was stable at 12.1 t, and the water content was stable at 23%. This is because, as a result of the strong conductivity of the volume fracturing in a relatively short time under capillary pressure, the effective imbibition and replacement between the crude oil and the injected water were removed, and the preliminary effect of waterflooding huff-n-puff of tight oil reservoir was achieved.
5. Conclusions
Online NMR equipment was used to complete waterflooding huff-n-puff experiments in tight oil cores and to obtain data in the process displacement without core removal. The pore structure of the tight oil cores and the changes in oil saturation in different pores during the huff-n-puff process were compared with those of conventional waterflooding, which provides a theoretical basis for the rational exploitation of tight oil reservoirs.
Some conclusions from the above study can be summarized as follows. The pore radius of the tight oil cores was mainly below 10 μm, and more than 80% were sub-micro- and micro-nanopores. More than 77.8% crude oil existed in sub-micro- and micropores, and the ratio of crude oil stored in the micro-nano pores increased with decreasing permeability. Movable fluids mainly existed in micropores with a radius larger than 1 μm.
For tight oil cores, the recovery ratio of waterflooding huff-n-puff was lower than in conventional waterflooding, and 16.9–25.2% kerosene was produced at the waterflooding stage after huff-n-puff. The residual oil saturation of waterflooding huff-n-puff was obviously lower than that of conventional waterflooding. To significantly improve the oil recovery ratio while remaining time-efficient, using two cycles of waterflooding huff-n-puff was more suitable for tight oil reservoir waterflooding development. From the MRI images, the residual oil of waterflooding after waterflooding huff-n-puff was less than that of conventional waterflooding.
In the field pilot test, the production of crude oil increased by 22.2%, which preliminarily proved that waterflooding huff-n-puff was suitable for tight oil reservoirs.
Author Contributions
Each author has made contributions to the present paper. Conceptualization, T.C., Z.Y. and Y.D.; Data curation, T.C., Y.L., D.Q., W.L. and X.Z.; Investigation, T.C., Z.Y., Y.D. and Y.L.; Validation, T.C., D.Q. and X.Z.; Writing—review & editing, T.C. All authors have read and approved the final manuscript.
Acknowledgments
We would like to express appreciation to the following financial support: Major national science and technology special project: Physical simulation method and percolation mechanism of ultra-low permeability reservoir (2017ZX05013-001).
Conflicts of Interest
The authors declare no conflict of interest.
References
- Velasco, R.; Panja, P.; Pathak, M. Analysis of North-American Tight Oil Production. AIChE J. 2018, 64, 1479–1484. [Google Scholar] [CrossRef]
- Jia, C.; Zheng, M.; Zhang, Y. Unconventional hydrocarbon resources in China and the prospect of exploration and development. Pet. Explor. Dev. 2012, 49, 43–44. [Google Scholar] [CrossRef]
- Zou, C.; Tao, S.; Yang, Z.; Hou, L.; Yuan, X.; Zhu, R.; Jia, J.; Wu, S.; Gong, Y.; Gao, X.; et al. Development of Petroleum Geology in China: Discussion on Continuous Petroleum Accumulation. J. Earth Sci. 2013, 24, 796–803. [Google Scholar] [CrossRef]
- Zou, C.; Zhai, G.; Zhang, G.; Wang, H.; Zhang, G.; Li, J.; Wang, Z.; Wen, Z.; Ma, F.; Liang, Y.; et al. Formation, distribution, potential and prediction of global conventional and unconventional hydrocarbon resources. Pet. Explor. Dev. 2015, 42, 13–25. [Google Scholar] [CrossRef]
- Zeng, J.; Cheng, S.; Kong, X.; Guo, K.; Wang, H. Non-Darcy flow in oil accumulation (oil displacing water) and relative permeability and oil saturation characteristics of low-permeability sandstones. Pet. Sci. 2010, 7, 20–30. [Google Scholar] [CrossRef]
- Yao, D.; Ge, J. Characteristics of non-Darcy flow in low-permeability reservoirs. Pet. Sci. 2011, 8, 55–62. [Google Scholar] [CrossRef]
- Hadi, S.J.; Peyman, P. Significance of non-Darcy flow effect in fractured tight reservoirs. J. Nat. Gas. Sci. Eng. 2015, 24, 132–143. [Google Scholar] [CrossRef]
- Sun, S.; Shu, L.; Zeng, Y.; Cao, J.; Feng, Z. Porosity–permeability and textural heterogeneity of reservoir sandstones from the Lower Cretaceous Putaohua Member of Yaojia Formation, Weixing Oilfield, Songliao Basin, Northeast China. Mar. Pet. Geol. 2007, 24, 109–127. [Google Scholar] [CrossRef]
- Zou, C.; Zhu, Ru.; Liu, K.; Su, L.; Bai, B.; Zhang, X.; Yuan, X.; Wang, J. Tight gas sandstone reservoirs in China: Characteristics and recognition criteria. J. Pet. Sci. Eng. 2012, 88–89, 82–91. [Google Scholar] [CrossRef]
- Zhao, J.; Bai, Y.; Qing, C.; Chuang, E. Quasi-continuous hydrocarbon accumulation: A new pattern for large tight sand oilfields in the ordos basin. Oil Gas Geol. 2012, 33, 811–827. [Google Scholar] [CrossRef]
- Lai, J.; Wang, G.; Ran, Y.; Zhou, Z.; Cui, Y. Impact of diagenesis on the reservoir quality of tight oil sandstones: The case of Upper Triassic Yanchang Formation Chang 7 oil layers in Ordos Basin, China. J. Pet. Sci. Eng. 2018, 145, 54–65. [Google Scholar] [CrossRef]
- Ghanbari, E.; Dehghanpour, H. The fate of fracturing water: A field and simulation study. Fuel 2016, 163, 282–294. [Google Scholar] [CrossRef]
- Wang, H.; Liao, X.; Zhao, X. Study of tight oil reservoir flow regimes in different treated horizontal well. J. Energy Inst. 2015, 88, 198–204. [Google Scholar] [CrossRef]
- Ozkan, E.; Brown, M.; Raghavan, R.; Kazeml, H. Comparison of Fractured-Horizontal-Well Performance in Tight Sand and Shale Reservoirs. SPE Reserv. Eval. Eng. 2011, 14, 248–259. [Google Scholar] [CrossRef]
- Fan, D.; Yao, J.; Sun, H.; Zeng, H.; Wang, W. A composite model of hydraulic fractured horizontal well with stimulated reservoir volume in tight oil & gas reservoir. AAPG Bull. 2015, 24, 115–123. [Google Scholar] [CrossRef]
- Zhao, Y.; Zhang, L.; Luo, J.; Zhang, B. Performance of fractured horizontal well with stimulated reservoir volume in unconventional gas reservoir. J. Hydrol. 2014, 512, 447–456. [Google Scholar] [CrossRef]
- Wang, H.; Liao, N.; Lu, N.; Cai, Z.; Liao, C.; Dou, X. A study on development effect of horizontal well with SRV in unconventional tight oil reservoir. J. Energy Inst. 2014, 87, 114–120. [Google Scholar] [CrossRef]
- Guo, C.; Xu, J.; Wei, M.; Jiang, R. Experimental study and numerical simulation of hydraulic fracturing tight sandstone reservoirs. Fuel 2015, 159, 334–344. [Google Scholar] [CrossRef]
- Xie, J.; Zhu, Z.; Hu, R.; Liu, J. A calculation method of optimal water injection pressures in natural fractured reservoirs. J. Pet. Sci. Eng. 2015, 133, 705–712. [Google Scholar] [CrossRef]
- Li, Z.; Qu, X.; Liu, W.; Lei, Q.; Sun, H.; He, Y. Development modes of Triassic Yanchang Formation Chang 7 Member tight oil in Ordos Basin, NW China. Pet. Explor. Dev. 2015, 42, 241–246. [Google Scholar] [CrossRef]
- Zhao, J.; Fan, J.; He, Y.; Yang, Z.; Wei, G.; Gao, W. Optimization of horizontal well injection-production parameters for ultra-low permeable-tight oil production: A case from Changqing Oilfield, Ordos Basin. Pet. Explor. Dev. 2015, 42, 74–82. [Google Scholar] [CrossRef]
- Li, P.; Zheng, M.; Bi, H.; Wu, S.; Wang, X. Pore throat structure and fractal characteristics of tight oil sandstone: A case study in the Ordos Basin, China. J. Pet. Sci. Eng. 2017, 149, 665–674. [Google Scholar] [CrossRef]
- Wang, Y.; Liu, L.; Li, S.; Ji, H.; Xu, Z.; Luo, Z.; Xu, T.; Li, L. The forming mechanism and process of tight oil sand reservoirs: A case study of Chang 8 oil layers of the Upper Triassic Yanchang Formation in the western Jiyuan area of the Ordos Basin, China. J. Pet. Sci. Eng. 2017, 158, 29–46. [Google Scholar] [CrossRef]
- Combs, G.D.; Knezek, R.B. Gas injected for upstructure drainage. In Proceedings of the SPE 44th Annual Fall Meeting, Denver, CO, USA, 28 September–1 October 1969. [Google Scholar]
- Haskin, H.K.; Alston, R.B. An Evaluation of CO2 Huff ‘n’ Puff Tests in Texas. In Proceedings of the 61st Annual Technical Conference and Exhibition of the Society of Petroleum Engineers, New Orleans, LA, USA, 5–8 October 1986. [Google Scholar]
- Wehner, S.C.; Prieditis, J. CO2 Huff-n-Puff: Initial Results form a Waterflooded SSC Reservoir. In Proceedings of the Permian Basin Oil & Gas Recovery Conference, Midland, TX, USA, 27–29 March 1996. [Google Scholar]
- Zhang, Y.P.; Sayegh, S.G.; Huang, S. Laboratory Investigation of Enhanced Light-Oil Recovery by CO2/Flue Gas Huff-n-Puff Process. In Proceedings of the Petroleum Society’s 5th Canadian International Petroleum Conference (55th Annual Technical Meeting), Calgary, AB, Canada, 8–10 June 2004. [Google Scholar]
- Asghari, K.; Torabi, F. Laboratory Experimental Results of Huff ‘n’ Puff CO2 Flooding in a Fractured Core System. In Proceedings of the SPE Annual Technical Conference and Exhibition, Anaheim, CA, USA, 11–14 November 2007. [Google Scholar]
- Song, C.; Yang, D. Performance Evaluation of CO2 Huff-n-puff Processes in Tight Oil Formations. In Proceedings of the SPE Unconventional Resources Conference-Canada, Calgary, AB, Canada, 5–7 November 2013. [Google Scholar]
- Ma, J.; Wang, X.; Gao, R.; Zeng, F.; Huang, C.; Tontiwachwuthikul, P.; Liang, Z. Enhanced light oil recovery from tight formations through CO2 huff ‘n’ puff processes. Fuel 2015, 154, 35–44. [Google Scholar] [CrossRef]
- Pu, W.; Wei, B.; Jin, F.; Li, Y.; Jia, H.; Liu, P.; Tang, Z. Experimental investigation of CO2 huff-n-puff process for enhancing oil recovery in tight reservoirs. Chem. Eng. Res. Des. 2016, 111, 269–276. [Google Scholar] [CrossRef]
- Burton, M.; Bryant, SL. Eliminating Buoyant Migration of Sequestered CO2 Through Surface Dissolution: Implementation Costs and Technical Challenges. SPE Reserv. Eval. Eng. 2009, 12, 399–407. [Google Scholar] [CrossRef]
- Zhou, T.; Liu, X.; Yang, Z.; Li, X.; Wang, S. Experimental analysis on reservoir blockage mechanism for CO2 flooding. Pet. Explor. Dev. 2015, 42, 548–553. [Google Scholar] [CrossRef]
- Jin, L.; Sorensen, J.A. Improving Oil Recovery by Use of Carbon Dioxide in the Bakken Unconventional System: A Laboratory Investigation. SPE Reserv. Eval. Eng. 2017, 20, 602–612. [Google Scholar] [CrossRef]
- Wei, B.; Lu, L.; Pu, W.; Wu, R.; Zhang, X.; Li, Y.; Jin, F. Production dynamics of CO2 cyclic injection and CO2 sequestration in tight porous media of Lucaogou formation in Jimsar sag. J. Pet. Sci. Eng. 2017, 157, 1071–1081. [Google Scholar] [CrossRef]
- Yu, W.; Lashgari, H.; Sepehrnoori, K. Simulation Study of CO2 Huff-n-Puff Process in Bakken Tight Oil Reservoirs. In Proceedings of the SPE Western North American and Rocky Mountain Joint Regional Meeting, Denver, CO, USA, 16–18 April 2014. [Google Scholar]
- Zhang, Z.; Shi, Y.; Li, H.; Jin, W. Experimental study on the pore structure characteristics of tight sandstone reservoirs in Upper Triassic Ordos Basin China. Energy Explor. Exploit. 2016, 34, 418–439. [Google Scholar] [CrossRef] [Green Version]
- Gu, X.; Pu, C.; Huang, H.; Huang, F.; Li, Y.; Liu, C.; Liu, H. Micro-influencing mechanism of permeability on spontaneous imbibition recovery for tight sandstone reservoirs. Pet. Explor. Dev. 2017, 44, 948–954. [Google Scholar] [CrossRef]
- Wang, J.; Liu, Y.; Chen, M.; Liu, L.; Gao, J. Experimental study on dynamic imbibition mechanism of low permeability reservoirs. Pet. Explor. Dev. 2009, 36, 86–90. [Google Scholar] [CrossRef]
- Li, S.; Tang, J.; Ding, Y.; Liu, S.; Liu, G.; Cai, B. Recovery of Low Permeability Reservoirs Considering Well Shut-Ins and Surfactant Additivities. Energies 2017, 10. [Google Scholar] [CrossRef]
- Di, Q.; Zhang, J.; Hua, S.; Chen, H.; Gu, C. Visualization experiments on polymer-weak gel profile control and displacement by NMR technique. Pet. Explor. Dev. 2017, 44, 294–298. [Google Scholar] [CrossRef]
- Zhang, P.; Lu, S.; Li, J.; Chen, C.; Xue, H.; Zhang, J. Petrophysical characterization of oil-bearing shales by low-field nuclear magnetic resonance (NMR). Mar. Pet. Geol. 2018, 89, 775–785. [Google Scholar] [CrossRef]
- Lyu, C.; Ning, Z.; Wang, Q.; Chen, M. Application of NMR T-2 to Pore Size Distribution and Movable Fluid Distribution in Tight Sandstones. Energy Fuels 2018, 32, 1395–1405. [Google Scholar] [CrossRef]
- Wang, X.; Yang, Z.; Li, H.; Guo, H. Microscopic Distribution of Remaining Oil of Ultra-low Permeability Reservoir by using NMR Technique. J. Basic Sci. Eng. 2013, 21, 702–709. [Google Scholar] [CrossRef]
- Wang, X.; Yang, Z. Experimental study on pore structure of low permeability core with NMR spectra. J. Southwest Pet. Univ. (Sci. Tech. Ed.) 2010, 32, 69–72. [Google Scholar] [CrossRef]
- Guo, H.; Zhu, Q.; Meng, Z.; Li, H. Research on the Moveable Oil in Tight Oil Reservoir with NMR and Centrifugal Experiment. Appl. Mech. Mater. 2014, 641–642, 434–440. [Google Scholar] [CrossRef]
- Chen, T.; Yang, Z.; Wang, X.; Xiao, P.; Wang, X.; Ma, Z. Oil displacement mechanism for the active water flooding in tight oil reservoirs. Pet. Geol. Oilfield Dev. Daqing 2017, 36, 169–174. [Google Scholar] [CrossRef]
- Jia, B.; Tsau, J.S.; Barati, R. Evaluation of Core Heterogeneity Effect on Pulse-decay Experiment. In Proceedings of the 31st International Symposium of the Society of Core Analysts, Vienna, Austria, 28 August–1 September 2017. [Google Scholar]
- Jia, B.; Tsau, J.S.; Barati, R. A Workflow to Estimate Shale Gas Permeability Variations during the Production Process. Fuel 2018, 220, 879–889. [Google Scholar] [CrossRef]
- Jia, B.; Tsau, J.S.; Barati, R. Different Flow Behaviors of Low-pressure and High-pressure CO2 in Shales. In Proceedings of the SPE/AAPG/SEG Unconventional Resources Technology Conference, Austin, TX, USA, 24–26 July 2017. [Google Scholar] [CrossRef]
- Jia, B.; Tsau, J.S.; Barati, R. Role of molecular diffusion in heterogeneous, naturally fractured shale reservoirs during CO2 huff-n-puff. J. Pet. Sci. Eng. 2018, 164, 31–42. [Google Scholar] [CrossRef]
Figure 1.
Nuclear magnetic resonance (NMR) T2 spectra of a tight oil sandstone core.

Figure 2.
Flow chart of the experimental equipment.

Figure 3.
Distribution frequencies of the core pore radius.

Figure 4.
Movable fluid saturations in the different pore cores.

Figure 5.
Recovery ratio for the cores and their different pores.

Figure 6.
Residual oil saturations for the cores and their different pores.

Figure 7.
Magnetic resonance imaging (MRI) of Core A: (1) Saturated kerosene state; (2) after displacing 1 pore volume (PV); (3) after displacing 10 PV.
Figure 7.
Magnetic resonance imaging (MRI) of Core A: (1) Saturated kerosene state; (2) after displacing 1 pore volume (PV); (3) after displacing 10 PV.

Figure 8.
MRI of Core B: (1) Saturated kerosene state; (2) after the first cycle of huff-n-puff; (3) after the second cycle of huff-n-puff; (4) after the third cycle of huff-n-puff; (5) after displacing 1 PV; (6) after displacing 10 PV.
Figure 8.
MRI of Core B: (1) Saturated kerosene state; (2) after the first cycle of huff-n-puff; (3) after the second cycle of huff-n-puff; (4) after the third cycle of huff-n-puff; (5) after displacing 1 PV; (6) after displacing 10 PV.


Table 1.
Characteristics of the tight oil sandstone core samples.
| No. | Length (cm) | Diameter (cm) | Permeability (×10−3 μm2) | Porosity (%) | Development Regime |
|---|---|---|---|---|---|
| A | 5.39 | 2.49 | 0.57 | 17.19 | Waterflooding |
| B | 5.35 | 2.40 | 0.58 | 17.52 | Waterflooding after waterflooding huff-n-puff |
| C | 5.46 | 2.49 | 1.78 | 17.10 | Waterflooding |
| D | 5.37 | 2.50 | 1.85 | 17.20 | Waterflooding after waterflooding huff-n-puff |
Table 2.
Oil saturations for the cores and their different pores saturated with the crude oil.
| No. | Permeability (×10−3 μm2) | Initial Oil Saturation (Soi) in Different Pores Share of Total (%) | Total Soi (%) | |||
|---|---|---|---|---|---|---|
| Nano | Micro-Nano | Sub-Micro | Micro | |||
| A | 0.57 | 1.6 | 9.9 | 25.7 | 16.7 | 53.9 |
| B | 0.58 | 1.9 | 9.2 | 24.7 | 19.8 | 55.6 |
| C | 1.78 | 1.7 | 10.3 | 26.8 | 18.5 | 57.3 |
| D | 1.85 | 1.8 | 11.7 | 32.3 | 15.2 | 61.0 |
Table 3.
Recovery ratio for the cores and their different pores in the huff-n-puff experiment.
| No. | Stage | Recovery Ratio (ER) in Different Pores Share of Total (%) | ER (%) | Total ER (%) | |||
|---|---|---|---|---|---|---|---|
| Nano | Micro-Nano | Sub-Micro | Micro | ||||
| B | First cycle | 1.8 | 5.5 | 11.2 | 4.7 | 23.2 | 56.1 |
| Second cycle | 0.5 | 2.5 | 6.8 | 3.9 | 13.7 | ||
| Third cycle | 0.1 | 0.3 | 1.3 | 0.6 | 2.3 | ||
| Waterflooding | 1.7 | 4.8 | 8.2 | 2.2 | 16.9 | ||
| D | First cycle | 0.5 | 3.3 | 15.9 | 7.6 | 27.3 | 67.3 |
| Second cycle | 0.3 | 3.0 | 6.0 | 1.9 | 11.2 | ||
| Third cycle | 0.1 | 0.3 | 2.3 | 0.9 | 3.6 | ||
| Waterflooding | 2.6 | 5.5 | 12.7 | 4.4 | 25.2 | ||
Table 4.
Residual oil saturations for the cores and their different pores in the huff-n-puff experiment.
Table 4.
Residual oil saturations for the cores and their different pores in the huff-n-puff experiment.
| No. | Stage | Residual Oil Saturation (Sor) in Different Pores Share of Total (%) | Sor (%) | |||
|---|---|---|---|---|---|---|
| Nano | Micro-Nano | Sub-Micro | Micro | |||
| B | First cycle | 1.2 | 8.3 | 23.9 | 16.2 | 48.3 |
| Second cycle | 1.0 | 6.9 | 19.2 | 13.0 | 40.1 | |
| Third cycle | 1.0 | 6.7 | 18.5 | 12.3 | 38.5 | |
| Waterflooding | 0.5 | 3.1 | 13.4 | 10.3 | 27.3 | |
| D | First cycle | 1.3 | 9.9 | 22.6 | 10.5 | 44.3 |
| Second cycle | 0.9 | 8.2 | 19.0 | 9.4 | 37.5 | |
| Third cycle | 0.9 | 8.0 | 17.6 | 8.9 | 35.4 | |
| Waterflooding | 0.6 | 3.2 | 9.9 | 6.2 | 19.9 | |
© 2018 by the authors. Licensee MDPI, Basel, Switzerland. This article is an open access article distributed under the terms and conditions of the Creative Commons Attribution (CC BY) license (http://creativecommons.org/licenses/by/4.0/).
Share and Cite
MDPI and ACS Style
Chen, T.; Yang, Z.; Ding, Y.; Luo, Y.; Qi, D.; Lin, W.; Zhao, X. Waterflooding Huff-n-puff in Tight Oil Cores Using Online Nuclear Magnetic Resonance. Energies 2018, 11, 1524. https://doi.org/10.3390/en11061524
AMA Style
Chen T, Yang Z, Ding Y, Luo Y, Qi D, Lin W, Zhao X. Waterflooding Huff-n-puff in Tight Oil Cores Using Online Nuclear Magnetic Resonance. Energies. 2018; 11(6):1524. https://doi.org/10.3390/en11061524
Chicago/Turabian StyleChen, Ting, Zhengming Yang, Yunhong Ding, Yutian Luo, Dan Qi, Wei Lin, and Xinli Zhao. 2018. "Waterflooding Huff-n-puff in Tight Oil Cores Using Online Nuclear Magnetic Resonance" Energies 11, no. 6: 1524. https://doi.org/10.3390/en11061524
Note that from the first issue of 2016, this journal uses article numbers instead of page numbers. See further details here.