Investigations of Ventilation Airflow Characteristics on a Longwall Face—A Computational Approach


1
College of Safety Science and Engineering, Xi’an University of Science and Technology, Xi’an 710054, China
2
School of Civil, Mining and Environmental Engineering, Faculty of Engineering and Information Sciences, University of Wollongong, Wollongong, NSW 2522, Australia
3
School of Energy, Xi’an University of Science and Technology, Xi’an 710054, China
4
Key Laboratory of Deep Coal Resource Mining, Ministry of Education, China University of Mining and Technology, Xuzhou 221116, China
5
College of Safety Science and Engineering, Henan Polytechnic University, Jiaozuo 454000, China
*
Authors to whom correspondence should be addressed.
Energies 2018, 11(6), 1564; https://doi.org/10.3390/en11061564
Submission received: 6 May 2018
/
Revised: 6 June 2018
/
Accepted: 6 June 2018
/
Published: 14 June 2018
(This article belongs to the Section L: Energy Sources)
Abstract
:Mine ventilation has always been critical for underground mining operations to ensure operational efficiency and compliance with safety and health statutory requirements. To obtain a thorough understanding of the ventilation flow characteristics on a longwall face, innovative three dimensional (3D) models, incorporating key features of the longwall equipment and a zone of immediate goaf area, were developed. Mesh independent studies were conducted to determine the desirable mesh required for a mesh-independent solution. Then the model results were validated using field ventilation survey data. At both intersections of maingate/tailgate (MG/TG) and face where the flow boundary changes sharply, the occurrence of undesirable flow separation which causes additional energy loss was identified, as well as its extent of influence. The recirculation of airflow resulting from separation in the TG will lead to accumulation of high concentrations of mine gas, thus regular inspection or continuous monitoring of gas concentration in that area is highly recommended, especially when high gas emission is expected from the working seam. In addition, we also investigated the influence of shearer position and cutting sequence on longwall ventilation. Overall, the longwall models developed in this study together with the flow characteristics obtained will provide fundamental basis for the investigation of longwall gas and dust issues in the future.
1. Introduction
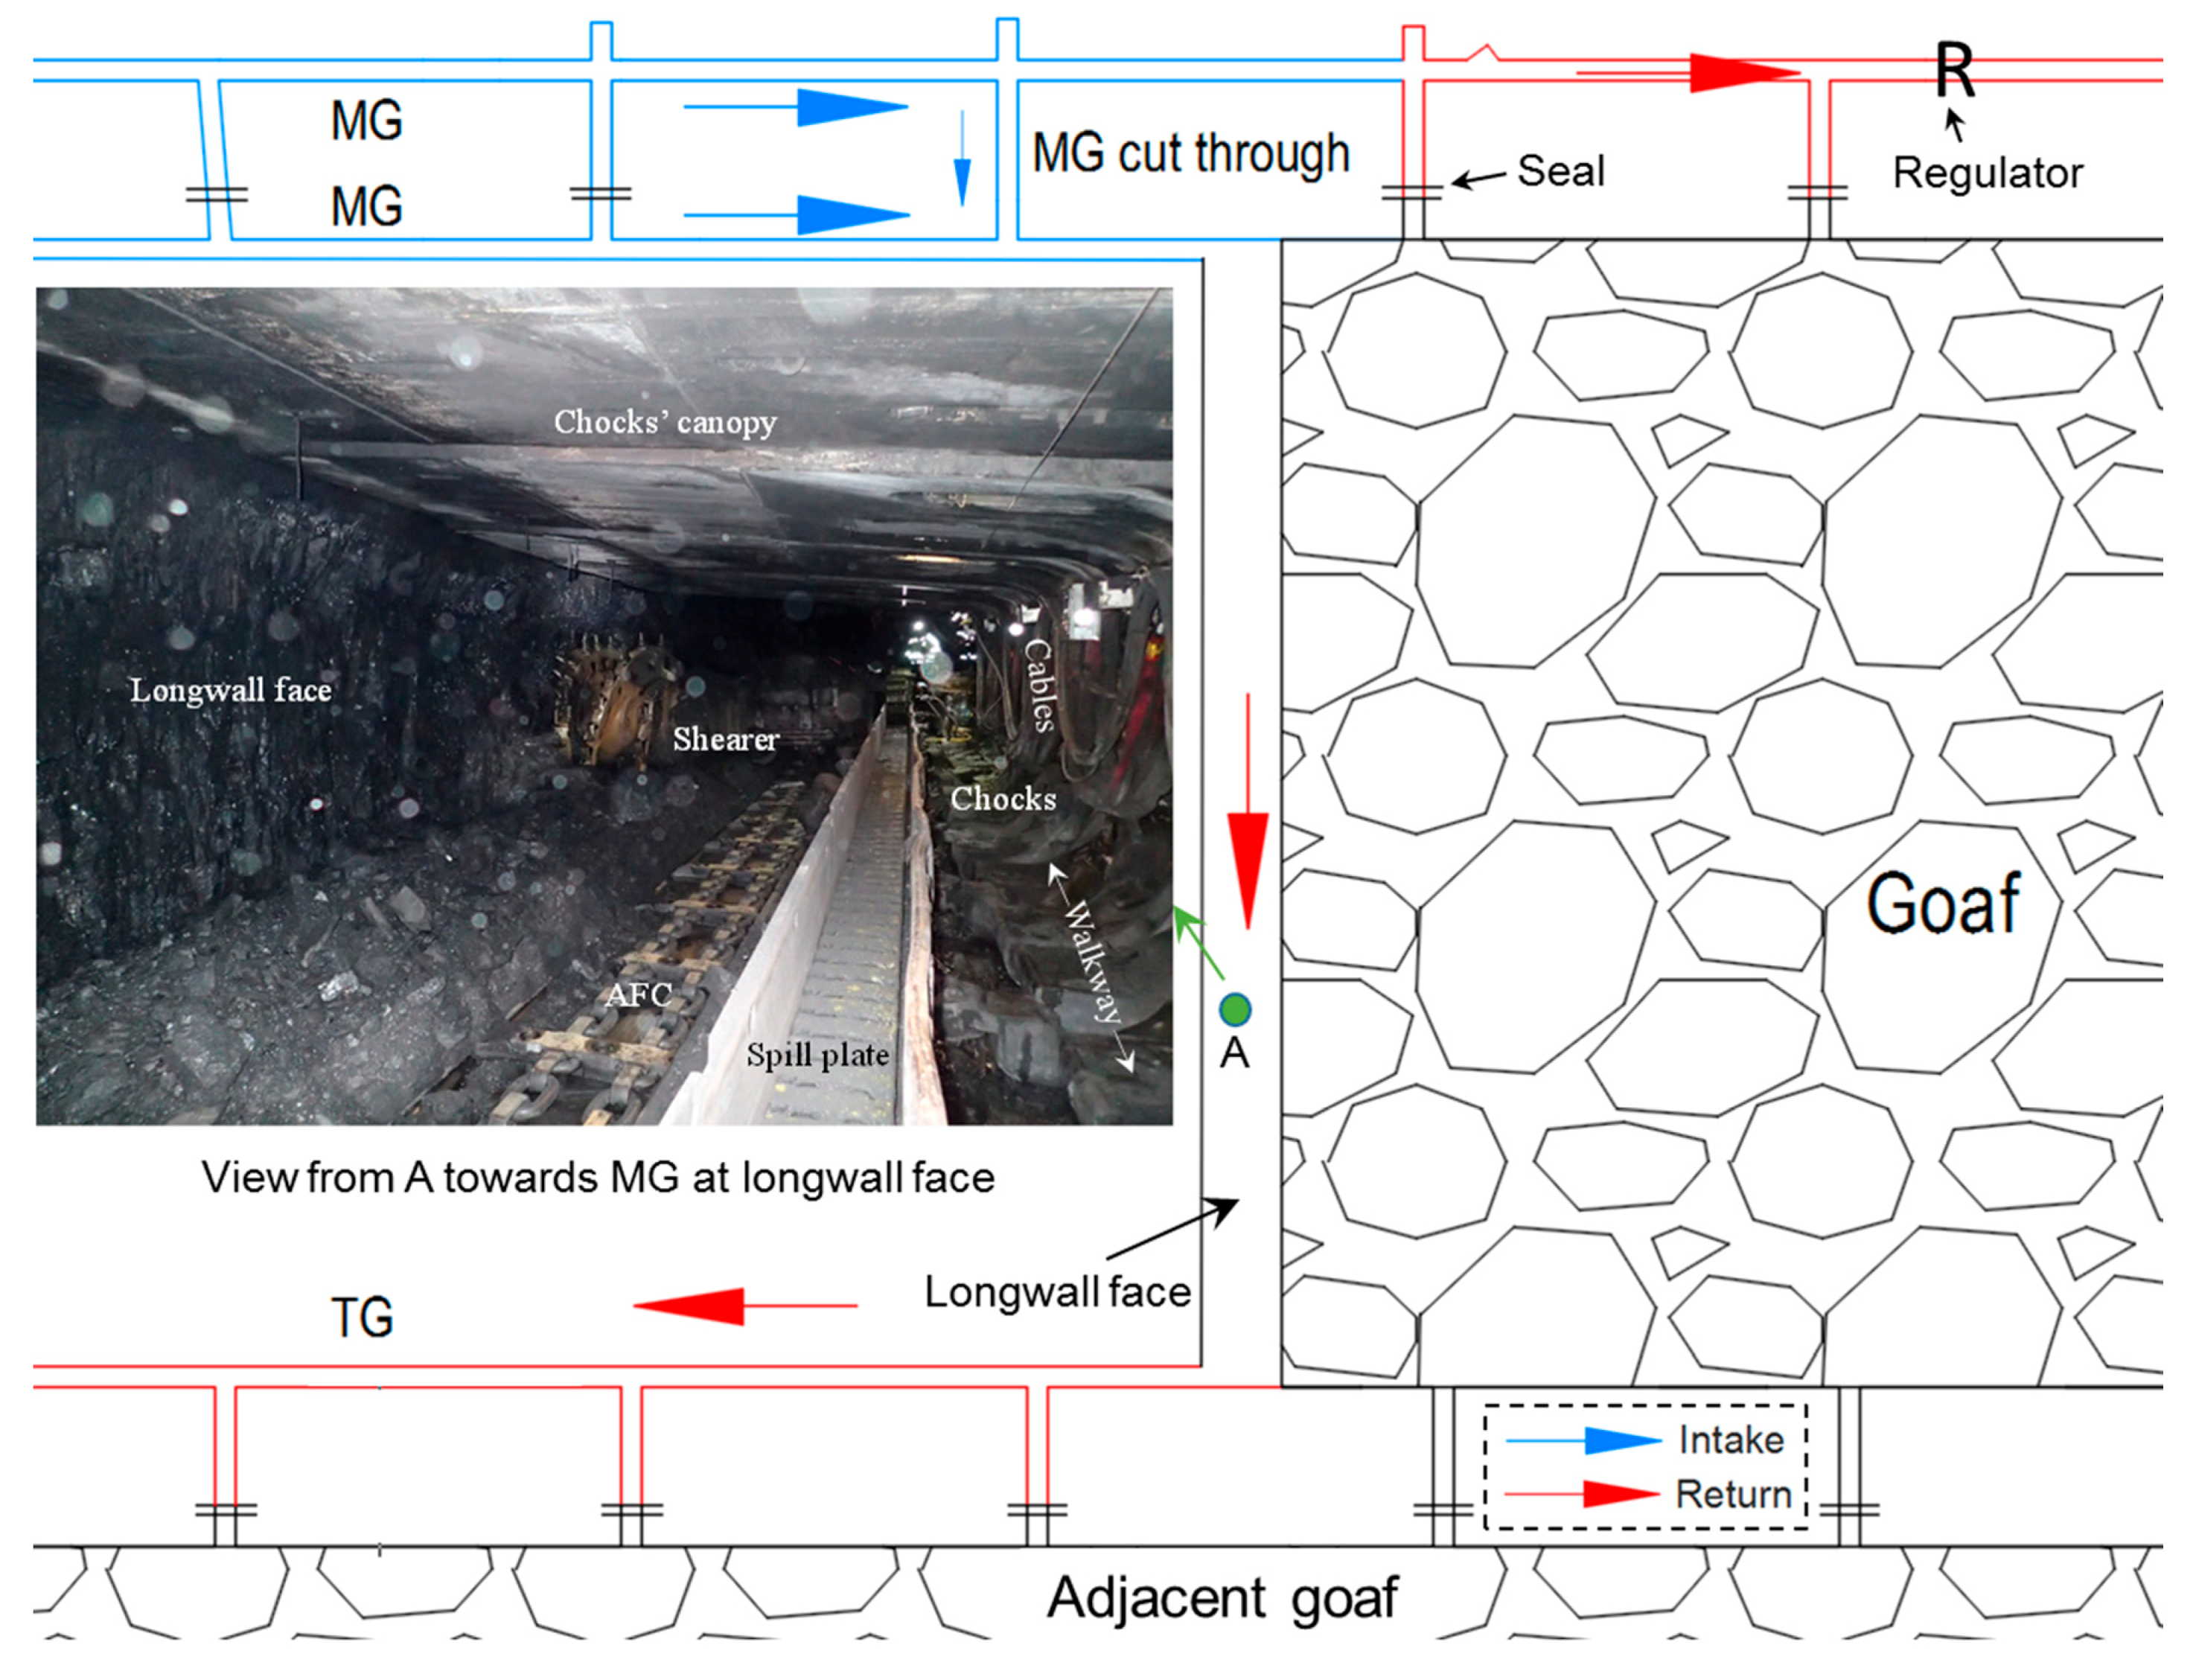
Longwall panels (rectangular coal blockss to be mined) are typically 150 to 400 m wide and can be up to 3 to 4 km long, depending on the geological conditions. Gateroads, similar to subsurface tunnels, are developed on both sides throughout the length of the panel and then connected by the face at the panel ends where mining equipment is installed for coal extraction. When the longwall system is ready for mining, the gateroad on one side of the panel is termed a maingate (MG) or headgate and on the other side is termed a tailgate (TG). Fresh air travels from the MG, across the face and back to the mine’s main return gateroad via the TG, forming the commonly used U ventilation system. Similar to the excavation of tunnels and other underground facilities, ventilation to the longwall face is vital in terms of providing fresh air for operators and diluting hazardous gas/dust as well as cooling the mining machinery. However, the roof support for the underground longwall face is significantly different, it is normally supported by hydraulic chocks which can be advanced automatically as the shearer (coal cutting machine) cuts coal from the face and mine operators are working under the chocks canopy [1]. As longwall chocks advance, the roof behind chocks is allowed to cave, forming the goaf. The layout of a typical longwall face is presented in Figure 1, where the major mining equipment (i.e., chocks, longwall shearer, Armoured Face Conveyor (AFC)) generally used at a longwall face can also be seen. At the longwall face, the shearer cuts coal from the face as it travels along the AFC which is used for transporting coal from face to the MG. The coal from face will then be crushed by a crusher in the MG before being transported by a Beam Stage Loader (BSL), after which a belt conveyor is used to remove coal from the panel. Bearing in mind the complex longwall system, Computational Fluid Dynamics (CFD) models were developed in this study to obtain a thorough understanding of ventilation flow characteristics on a typical longwall face. The results can provide practical guidance to mine operators for improved longwall ventilation management, and the gas/dust hazards prevention. The longwall models developed in this study can also be used as a prototype for further simulation studies of gas and dust dispersion at the longwall face under different ventilation conditions.
The longwall face is the main production area of a modern underground coal mine, where more than 90% of coal production is achieved. As a result, the longwall face becomes the largest gas and dust contributor of the mine, and the place where the majority of gas explosion accidents may occur if not sufficiently ventilated [2,3,4]. Historically many mine disasters with fatalities have occurred worldwide, the majority of which are methane gas and coal dust explosions resulting from poor ventilation [5,6,7,8]. Some of the major explosions that occurred recently in underground coal mines are summarised in Table 1. Undoubtedly, mine ventilation to the underground workplace is vital for diluting hazardous gas and dust contaminants. Better understandings on the ventilation system using more advanced techniques are needed to guarantee a safe and healthy working environment in the underground space.
Ventilation engineers and researchers have always devoted effort to seeking for approaches to better understand subsurface ventilation. At present, two main approaches are generally used to investigate the mine ventilation system, i.e., field monitoring and computational modelling.
Understanding the underground ventilation system by field monitoring is a traditional but most effective and practical method. Instruments that could be used to measure the airflow velocity have been developed, from the traditional vane anemometers to the more modern digital anemometers which can be used for point velocity measurement with acceptable accuracy. In addition to the vane anemometers, pitot-static tube, which is primarily used for pressure measurement (i.e., the total, static and velocity pressure), constitutes another indirect method for airflow velocity determination using the measured velocity pressure and the density of air [9]. In routine ventilation management, these ventilation parameters are measured regularly, through which the general distributions of airflow and pressure can be obtained, and more recently, there is also a demand to conduct real time velocity monitoring practice in underground coal mines [10]. However, it is worth noting that a detailed airflow field is not achievable or is labour intensive by means of field monitoring. Meanwhile, these instruments are not able to capture the turbulence characteristics of flow field on a longwall face, and some areas are not accessible to conduct ventilation measurement due to the complex operation conditions of the longwall face and the employment of large mining equipment in the confined underground space.
Combined with field ventilation survey, a variety of ventilation software oriented towards ventilation network solutions has been widely used in the mining industry [11]. With the aid of modern computers, the overall status of the ventilation system can be determined and visualised in three dimensions, as well as the optimisation of the existing ventilation system. Some computer programmes, typically known as mine ventilation network models (e.g., Ventsim), provide the function of heat and humidity analysis, together with fire and contaminants dispersion studies in the mine atmosphere [11]. Efforts have also been put to improve the performance of these network models [12]. It is noted that these ventilation programmes are written to solve the overall distribution of airflow or pressure in the entire mine ventilation system, and the actual working places and roadways are represented by nodes or branches in 3D views, as a result, a detailed airflow distribution on different cross sections of these locations cannot be obtained using the ventilation software.
In addition to the programmes used for ventilation network solution, Computational Fluid Dynamics (CFD) modelling, has also gained its popularity in the research and study of ventilation systems in underground mines [13,14,15,16]. With the use of the CFD modelling technique, there will be no such disadvantages associated with the field monitoring and the ventilation software, and a detailed airflow field can be predicted not only along the mine roadways but also within the working faces, in particular, along the walkway and around the shearer on the face. Assisted by the field measured velocity profile along the face, the validation of base model results will constitute a prerequisite to investigate the airflow characteristics using CFD models. With the advancement of high performance computers, the trend of using CFD models to solve mine safety and health problems has increased dramatically. The study was based on a longwall face of an underground coal mine around 350 m below surface where longwall mining method was used.
2. Review of CFD Modelling of Underground Ventilation Systems
Since the early nineties of the 20th century, the CFD modelling approach has become an indispensable predictive and design tool in the mining industry. CFD models were firstly employed by Heerden and Sullivan [17] to investigate the airflow characteristics in underground headings. Based on the modelled flow field, they also examined both the dust and methane flow behaviour around the continuous miner. However, the validation of their models was not provided. Srinivasa [18] used a three dimensional CFD code to model the air velocities distribution along a longwall face. Due to limitations of the computer resources at that time, only 40 m of the longwall face was modelled but it was reported that the model predicted results tallied well with field measurements. Edwards et al. [19] discussed a general process of carrying out a CFD simulation, and they concluded that the potential of using CFD models to tackle mine safety and health related issues was great. Oberholzer and Meyer [20,21] used CFD models to evaluate the performance of different ventilation systems for the purpose of methane dilution and dust removal at development headings and they concluded that the CFD models were very effective in ventilation design. Moloney and his colleagues [22,23,24] conducted CFD studies to investigate flow patterns within drivages of underground coal mines, where reasonable agreement with the results of physical model tests had been achieved. Wala et al. [25] carried out CFD investigations to evaluate the performance of different ventilation systems in a heading face and demonstrated that the CFD technique could dramatically facilitate the design of ventilation systems.
Later, Wala et al. [26,27] performed a series of benchmark experiments in a scaled physical model for the validation purpose of the CFD models. Both airflow and methane concentration distribution in the heading were employed in the validation process. Balusu et al. [28] constructed longwall goaf models to understand the gas flow patterns in the goaf, based on which the gas drainage strategies for highly gassy mines was optimised. It was reported that the results of the optimum gas drainage strategies were highly successful at the two underground coal mines that participated in the field demonstration. Parra et al. [29] carried out both experimental tests and CFD studies to probe into the flow distribution in the heading of an underground coal mine. Upon validation of the model predicted flow field, they performed parametric studies to identify the distribution of dead zone and methane concentration within the heading under three different ventilation systems. Branny [3] studied the flow of air and methane mixture in the longwall return crossing zone and investigated the impact of jet fan positions on the methane distribution. The modelling of ventilation flow in a heading with different cutting scenarios was reported by Hargreaves and Lowndes [30]. In their study, the simulated flow velocities were compared against the data obtained from ventilation experiments. To achieve a better dust control effect on longwall faces, Ren and Balusu [31,32,33] conducted extensive CFD modelling studies on the longwall face ventilation system, and a new shearer scrubber had been designed and mounted to the longwall shearer with good dust mitigation effect. It is noticed that the longwall models employed in their study were restricted to part of the longwall face on the MG side rather than the entire face. Using 2D models, Aminosadati and Hooman [34] examined the effects of brattice length on fluid flow behaviour in the crosscut regions. Toraño et al. [35] carried out CFD studies to investigate the methane flow behaviour in a development heading of an underground coal mine, where both airflow and methane concentration were measured at selected cross sections and points for the validation purpose. They demonstrated that the CFD modelling approach could be an effective tool for detecting zones in which methane tended to accumulate and thus requiring necessary ventilation enhancement. Considering the methane released from different sources, i.e., methane librated from the coal cut by the shearer, the coal on the face conveyor, coal ribs and coal on the belt, Zheng and Tien [36] modelled the methane flow characteristics on a longwall face. The methane emission rate used in the model was derived from the field study conducted by Krog et al. [37]. It is worth noting that they did not take into account the methane emitted from the goaf and the gas exchange between face and goaf was not considered either.
More recently, Ndenguma [38] simulated the air and dust flow patterns in a heading using simplified CFD models, which were validated with the use of a scale down model. Ren et al. [39] investigated the performance of a newly designed water mist systems for dust suppression at the longwall entrance with the aid of CFD longwall models. The water mist system was also used for dust mitigation above an underground bin according to the CFD modelled ventilation and dust flow behaviour around the bin [40]. Using 4D CFD models, Torno et al. [41] studied the gas flow dynamics at a heading face in Spain where a blasting method was used and evaluated the safe condition for miners to return to a blasted area. Xu et al. [42,43] developed a methodology with combined use of tracer gas and CFD modelling to remotely evaluate the status of underground mine ventilation systems. Sasmito et al. [44] demonstrated that CFD modelling could be an effective approach to improve the ventilation system in underground coal mines. In their study, the airflow and methane distribution under different ventilation systems within the room and pillar mining roadways and a cross-cut region were examined respectively. Kurnia et al. [15,45,46] conducted a series of CFD modelling studies for the evaluation of several innovative ventilation systems on the hazardous gas control with minimal energy cost at headings. Hurtado and Acuna [47] evaluated the performance of main fans parallel installation for the needs of underground mine expansion in Chile. Gilmore et al. [48] conducted goaf ventilation modelling on HPC platforms and claimed that up to 75% of computing time could be reduced using GPGPU/CPU combinations. Guo et al. [49] employed CFD models to evaluate the impact of different gas drainage designs on goaf gas control, based on which a conceptual model was proposed for practical guidance of horizontal gas drainage design. To optimise goaf gas drainage, Qin et al. [50] studied gas flow patterns in the goaf under various gas drainage parameters. Kurnia et al. [51] proposed a novel concept of enhanced gas recovery strategy from development headings and evaluated the impact of several parameters (such as suction velocity and duct height) on gas recovery using the CFD modelling approach. Fang et al. [52] investigated the airflow behaviour and gas dispersion during the construction of a twin-tunnel. Cheng et al. [53] modelled the impact of different ventilation parameters on goaf gas distribution with due consideration of balanced goaf gas control and fire prevention. Li et al. [54] studied the ventilation flow characteristics in super-large subsurface tunnels and concluded that the minimum air velocity should be greater than 0.15 m/s to dilute the CO concentration below statutory level within 20 min. Xia et al. [55] numerically investigated the ventilation and dust flow behaviour in open-type TBM tunnelling work area and optimised the ventilation configuration for optimal dust control. Brodny and Tutak [2,6] analysed the methane distribution in the longwall goaf and factors influencing its distribution. Tutak and Brodny [13] investigated the impact of goaf sealing from TG on the methane distribution at the return end of a longwall face, concluding that the methane level could be significantly lowered if the sealing position and material are properly designed. Xu et al. [56] conducted a comprehensive review of CFD applications in solving mine ventilation related issues and pointed out that benefits from the simulations were enormous if proper procedures were followed. The effect of shock losses in a parallel fan station for an underground coal mine was studied by Gou et al. [57].
There is also an increasing trend of using CFD modelling approach to investigate the aerodynamics of dust particles within underground workings recently. For instance, Zhou et al. [58] and Zhang et al. [59] investigated the respirable dust pollution characteristics in a longwall face using the CFD modelling approach. Wang et al. [60,61] and Yu et al. [62] employed CFD models to evaluate the performance of air curtain generator on dust control within development headings. Geng et al. [63,64] investigated the dust dispersion behaviour within a roadway with hybrid ventilation system. Shi et al. [65] carried out numerical studies to optimise the arrangement of ventilation duct at a coal mine heading face.
It can be seen from our literature review that the majority of these studies focus on the air and gas/dust flow in development headings, except the work conducted by Srinivasa [18], Zheng and Tien [36], Ren and Balusu [31,32,33], Ren et al. [39], Zhou et al. [58] and Zhang et al. [59] who put their interest on the longwall face. However, their models only include part of the longwall face for their specific purposes of study or the geometry of the models are not sufficiently illustrated, a detailed airflow field or some important characteristics of the flow field cannot be obtained and thus is not provided. As the major coal production place and the major source of hazardous pollutants in the underground working space, ventilation to the longwall face is of vital importance to achieve safety in mining. Field ventilation monitoring tends to be labour intensive, and it is not able to capture the details of the ventilation flow characteristics in the three dimensional underground space of longwall face. The ventilation network simulations cannot be used to obtain the detailed flow characteristics either. Review of the literature has shown that the CFD modelling is a cost effective and promising approach to investigate the ventilation in a variety of underground workings, whilst a lack of study about ventilation flow characteristics on underground longwall face is also shown. Therefore, to further explore the capability of CFD approach in longwall ventilation modelling, and more importantly to obtain fundamental understandings of the ventilation flow characteristics on a longwall face, innovative longwall models were developed and modelling results were analysed quantitatively, which would provide essential guidance for longwall ventilation management and form basis for the study of gas/dust related hazards prevention and control at longwall face.
3. Development of Longwall CFD Models
To obtain a better understanding of the flow field on a longwall face, full scale three dimensional models were developed. For the first time, the models were constructed as close as possible to the actual longwall face geometry by embedding the key features of the longwall equipment in the models. As the dispersion and migration of hazardous gas and dust heavily depend on the airflow patterns, it is of great significance to obtain a more realistic airflow field by incorporating all the key features of major longwall equipment in the models.
3.1. Overview of the Longwall Model
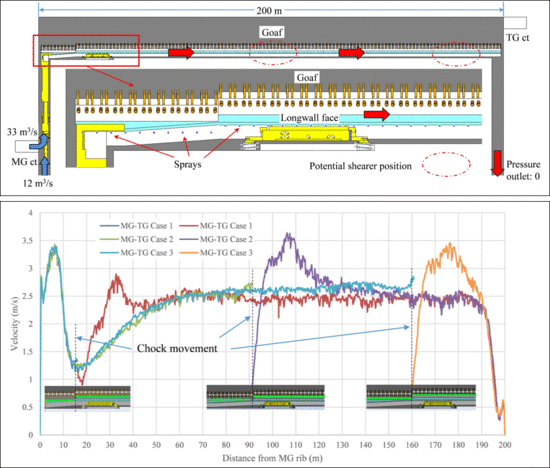
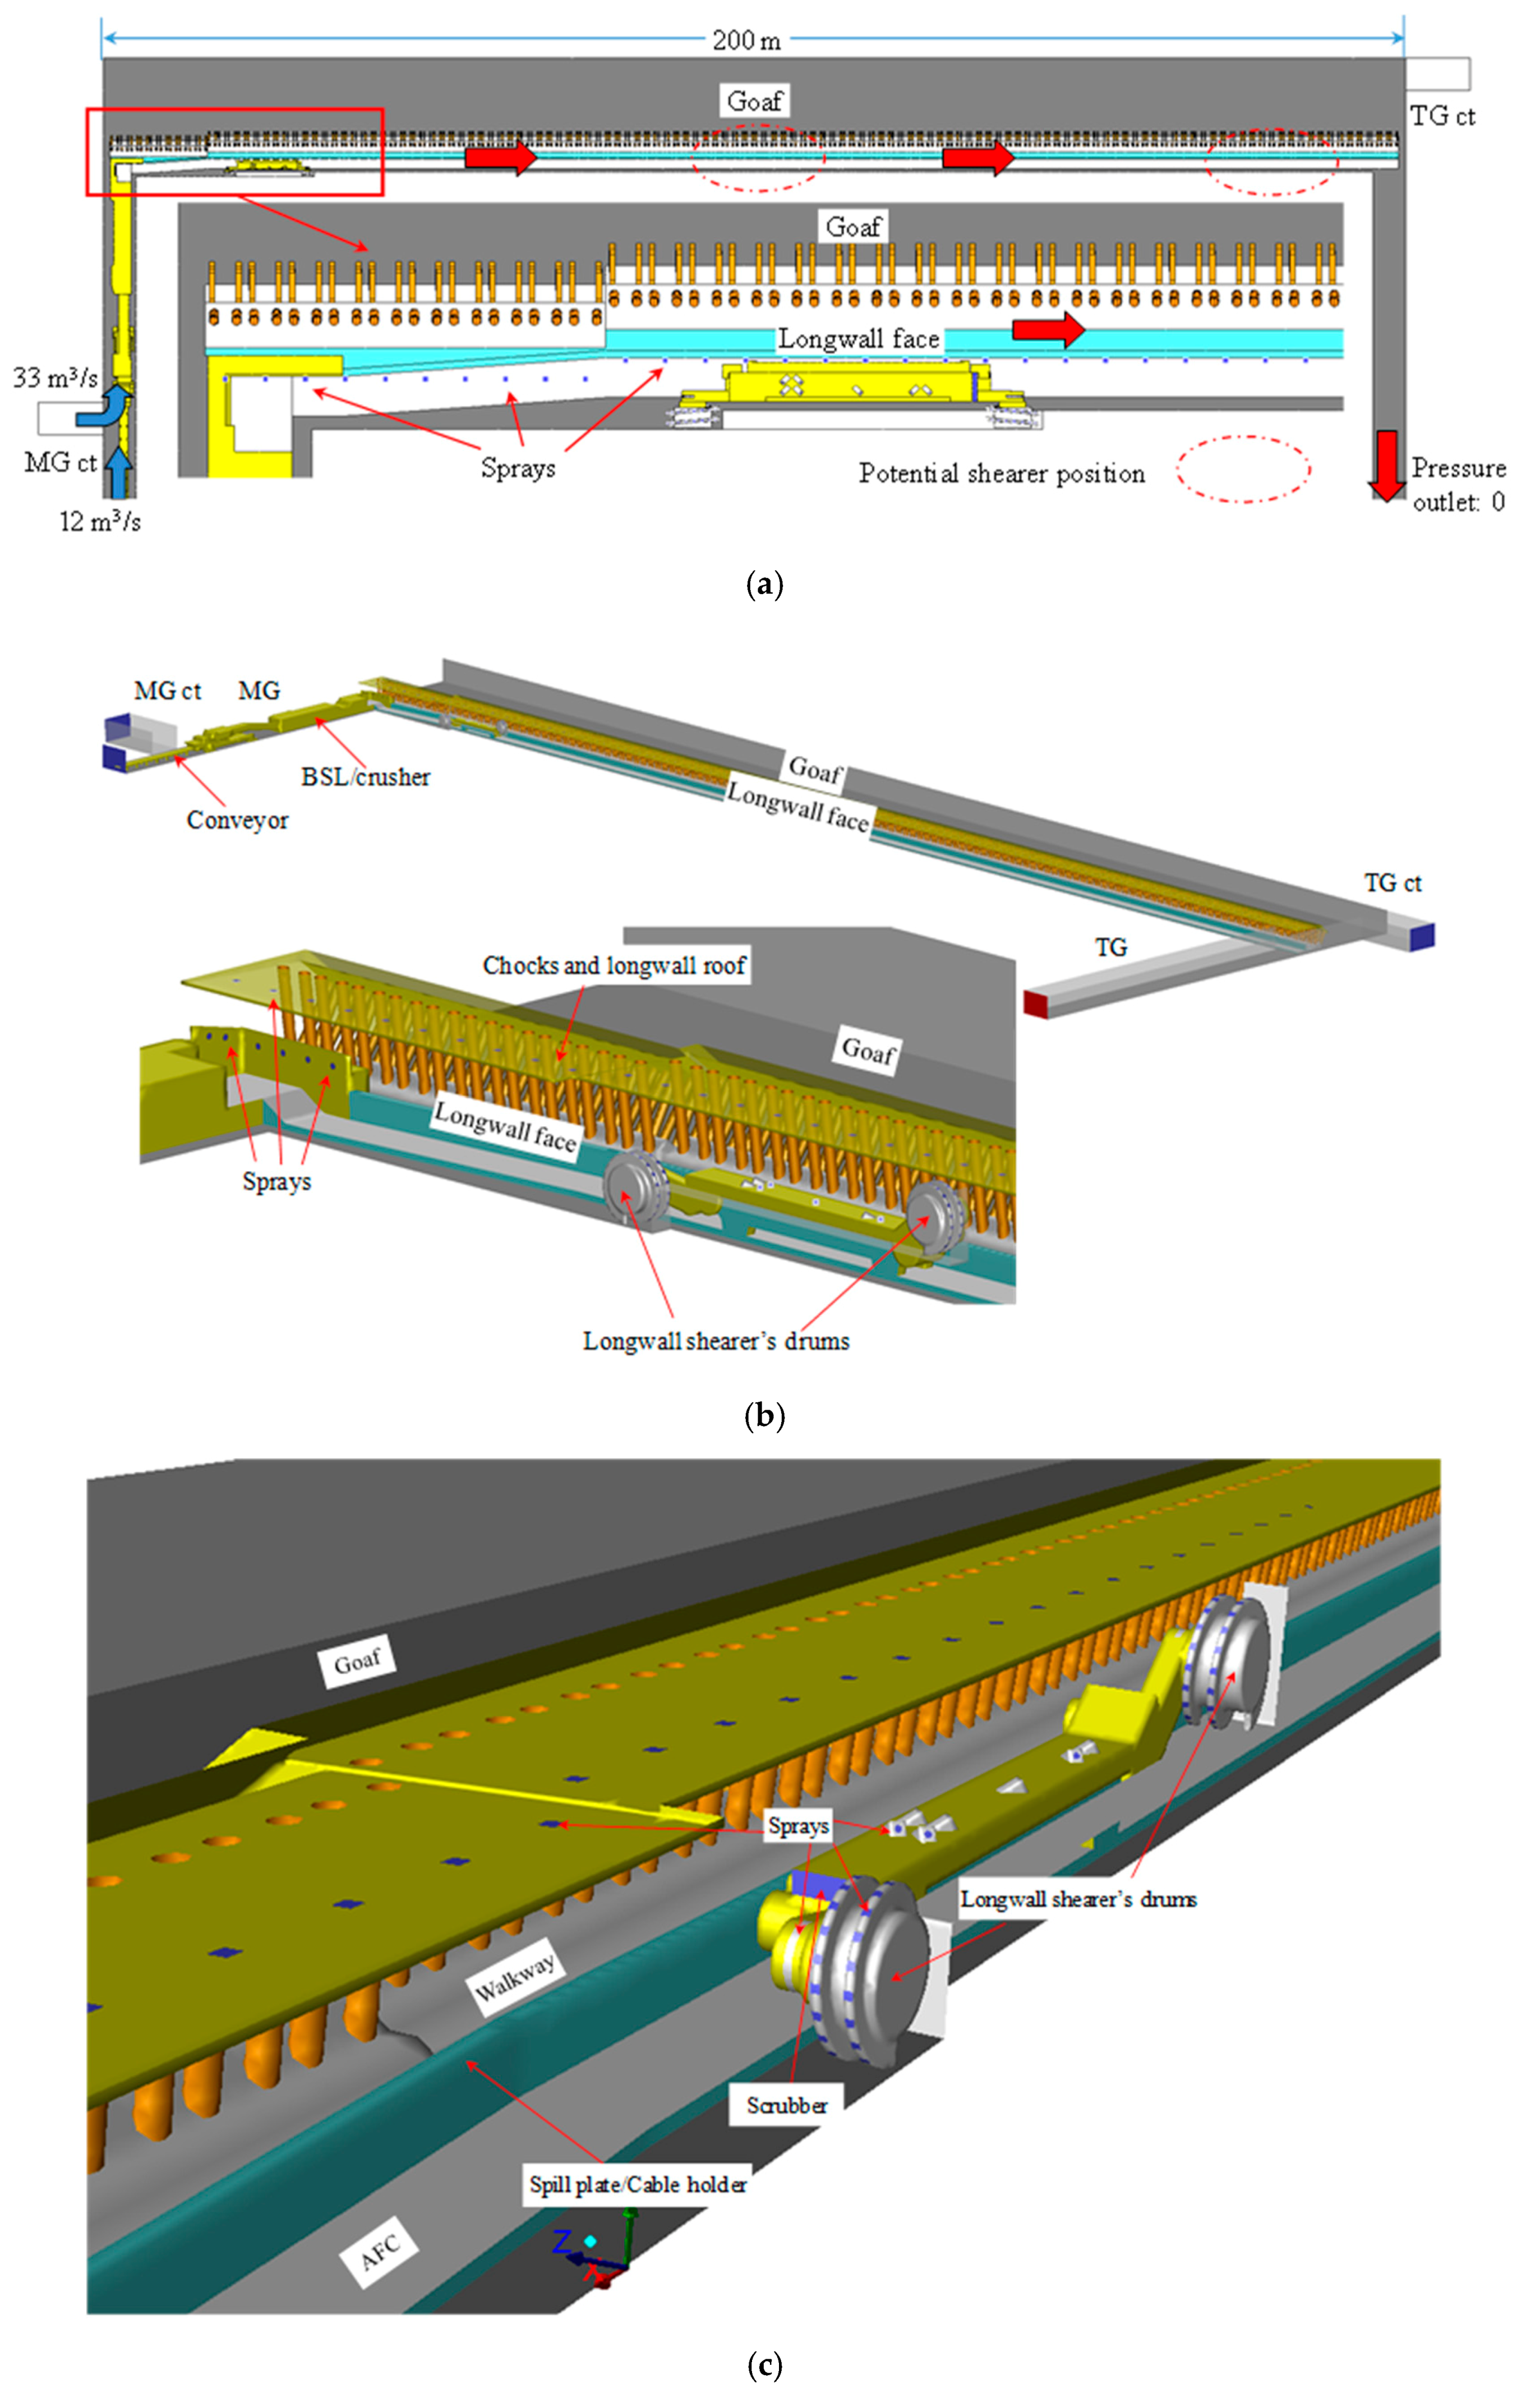
Based on data collected from an Australian longwall face, a three dimensional longwall model was constructed. A general layout of the model is shown in Figure 2. The main dimensions of the model are summarised in Table 2. The model was constructed by embedding the main longwall equipment installed along the face, including 132 hydraulic supports, the coal cutting machine (shearer), AFC, Beam Stage Loader (BSL) as well as breaker/feeder of the belt conveyor. The longwall model mimics a working scenario that the shearer is cutting towards the TG and the MG drum is about 10 m away from the rib of MG. As this study focuses on ventilation characteristics along the face, only 50 m of the MG and the TG are included in the model. On the MG side, there is a cut through located at 45 m outbye the face. There is also a cut through on the TG side which is 10 m away from the face and is connected to the goaf. It is worth noting that the position of the TG cut through is not based on the actual panel layout, its main purpose is to investigate the longwall gas distribution characteristics under various ventilation systems in the future parametric studies. The position of the MG cut through is in accordance with the position where ventilation survey was conducted on site for base model validation.
To thoroughly understand the airflow patterns within the longwall face, two more models were constructed to probe the flow features under different longwall mining scenarios, which were achieved by positioning the shearer to the middle section and TG side (refer to the potential shearer positions illustrated in Figure 2a) of the longwall face respectively. In addition, as the airflow pattern around the shearer is significantly affected by the cutting sequence, three more models were constructed to represent scenarios when the shearer is cutting towards MG. For the three models indicating the TG to MG pass, the shearer in each model is located at the same position as the corresponding MG-TG pass models. For the convenience of reference, distinctive names, as shown in Table 3, are given to the six models representing six different working scenarios of the longwall face.
3.2. Model Mesh and Boundary Condition
Upon defining the physical geometry of the longwall face, the model was meshed using the unstructured tetrahedron approach due to the complicated geometry. Two different meshing schemes (denoted as medium mesh and fine mesh with 2.2 million and 4.8 million control volumes respectively) were employed to verify the mesh independence of the solution. It is worth noting that as the six models generally share similar geometric characteristics, the mesh independent study was only carried out for the MG-TG Case 1; then according to the result of mesh independent study, the same mesh controls on the boundaries and within the domain would be applied to all the other five models, leading to an approximately equal size of control volumes for each model, as well as ensuring a mesh independent solution for these models.
As shown in Figure 2, fresh air with quantities of 12 m3/s (0.69 m/s) and 33 m3/s (1.88 m/s) are provided to the face through the MG and the MG cut through respectively, and these two inlets are treated as velocity inlet with velocity of 0.69 m/s at the MG and 1.88 m/s at the MG cut through. Pressure outlet (pressure is set to 0) is assigned to the TG, which is the outlet of the model. Regarding the moving parts of the longwall equipment, the shearer drums are treated as a moving wall with a rotational speed of 3.665 rad/s (i.e., 35 rpm) to investigate its local influence on airflow patterns in the vicinity of the shearer, whilst the surfaces of the AFC and belt conveyor are also set as moving wall but with a translational speed of 1.78 m/s and 4 m/s respectively according to site conditions. For the other boundaries of the model, such as the coal ribs, floor, roof and chocks, standard wall conditions are employed with a roughness of 2.5 mm. Standard k-ε turbulence model is used for near wall treatment in the models. In this calculation the flow medium (air) is assumed to be incompressible and the temperature field is constant, thus the inlet ventilation velocity can be calculated for both MG and the MG cut through. The operating pressure is 101,325 Pa and the gravity is considered by adding a gravitational acceleration of −9.81 m/s2 in the vertical direction (y direction) of the model. Turbulence parameters are specified at model inlets and outlet using intensity and hydraulic diameter method. The turbulent intensity at the MG and MG cut through are 3.49% and 3.08% respectively, and is 2.96% at TG outlet. The hydraulic diameter for the two inlets and TG outlet are all 4.12 m as they have the same rectangular shape and dimensions (refer to Table 2 for the dimensions).
In addition, the extension of the longwall face model to include a shallow goaf constitutes another challenge besides the construction of longwall models with such a complex geometry. Porous media is used to mimic the goaf area. And momentum sinks which vary with positions were added to the momentum equation through user defined functions. The momentum sink consists of two parts: a viscous loss term, (the first term on the right-hand side of Equation (1)), and an inertial loss term (the second term on the right-hand side of Equation (1)). Specifically, the momentum sink can be expressed in the following form:
where Si stands for the momentum loss for the ith momentum equation, μ represents the viscosity of air, α represents the permeability, vi represents the velocity in the ith direction, and C2 means the inertial resistance factor (taken as 100th the inverse of α), ρ indicates the air density, and is the velocity magnitude. In this study, goaf permeability varied from 10−3.5 m2 to 10−5.5 m2, and a hyperbolic function was used to express the permeability distribution [66,67,68].
3.3. Governing Equations and Turbulence Model Selection
The fluid flow in underground workings follows the conservation laws of fluid mechanics. On the basis of Newton’s second law, the principle of conservation of linear momentum can be written as:
where ρ is the density of fluid, V = (vx, vy, vz) represents the velocity vector of flow particle, ∇p stands for the pressure gradient, is fluid viscosity, and F = (Fx, Fy, Fz) represents the body force vector. On the left hand side of Equation (1), the terms and stand for force components resulting from the rate of momentum change and convective acceleration, respectively. These two terms together are force from inertial effect, while the term is viscous force.
For a Newtonian fluid, the mass conservation in finite volume is expressed as follows using Reynolds transport theorem:
where the first term on the left-hand side stands for the change of fluid density with time, while the second term represents the spatial change of mass over unit area at unit time.
According to the first law of thermodynamics, the energy conservation can be expressed by:
where E represents energy, K represents conductivity, T is temperature, Ws stands for work done by the surface stresses and SE stands for the energy source term.
Three computational approaches are generally used to solve the Navier-Stokes equations, i.e., Large Eddy Simulation (LES), Direct Numerical Simulation (DNS) and the Reynolds-Averaged Navier-Stokes (RANS) models. However, due to the extremely high requirements of the DNS and LES approaches, they are rarely adopted in the actual large scale flow simulations, especially the DNS approach which demands a very fine grid and very small time steps and thus is restricted to supercomputer applications for lower Reynolds-number flows. As a result, in this study, the most widely used approach—the RANS models are adopted.
In Reynolds averaging, the variables of the instantaneous field can be categorised into the mean and the fluctuating components, such as:
where represents the mean velocity component and represents the fluctuating velocity components.
Therefore, by taking a time average of the Navier-Stokes equations, the RANS equations have the following form:
As can be seen from Equation (7), a new variable, the Reynolds stress is introduced to the equations and it must be solved to achieve the closure of the equations. Two approaches are adopted to calculate the Reynolds stress, i.e., the Reynolds Stress Models (RSM) and the Boussinesq hypothesis.
The Reynolds stresses are related to the mean velocity gradients in the Boussinesq hypothesis:
Based on the Boussinesq hypothesis, several turbulence models, such as the Spalart-Allmaras one equation model, the two equations model and the two equations model, are provided in the CFD code, which vary from each other in determining the turbulent viscosity . In the Spalart-Allmaras one equation model, only one additional equation is solved to obtain the turbulent viscosity . In the model and the model, two additional equations are employed to calculate .
However, in the RSM, the transport equations for each of the terms in the Reynolds stress tensor are solved, indicating five and seven additional equations are required to be solved for 2D and 3D flows respectively.
Comparisons between the two approaches indicate that the RSM is superior to the Boussinesq hypothesis based models when the effect of anisotropy of turbulence dominates the mean flow, such as stress-driven secondary flows and highly swirling flows [69]. Considering the flow characteristics in the underground ventilation system, the Boussinesq hypothesis based model is adopted in the study. It is noted that the model is subdivided into the Standard model, the RNG model and the Realizable model. Comparative calculations were conducted using the three sub models and no significant variation was observed among the corresponding results, thus, the Standard model is finally used.
4. Mesh Independent Study and Model Validation
4.1. Mesh Independent Study
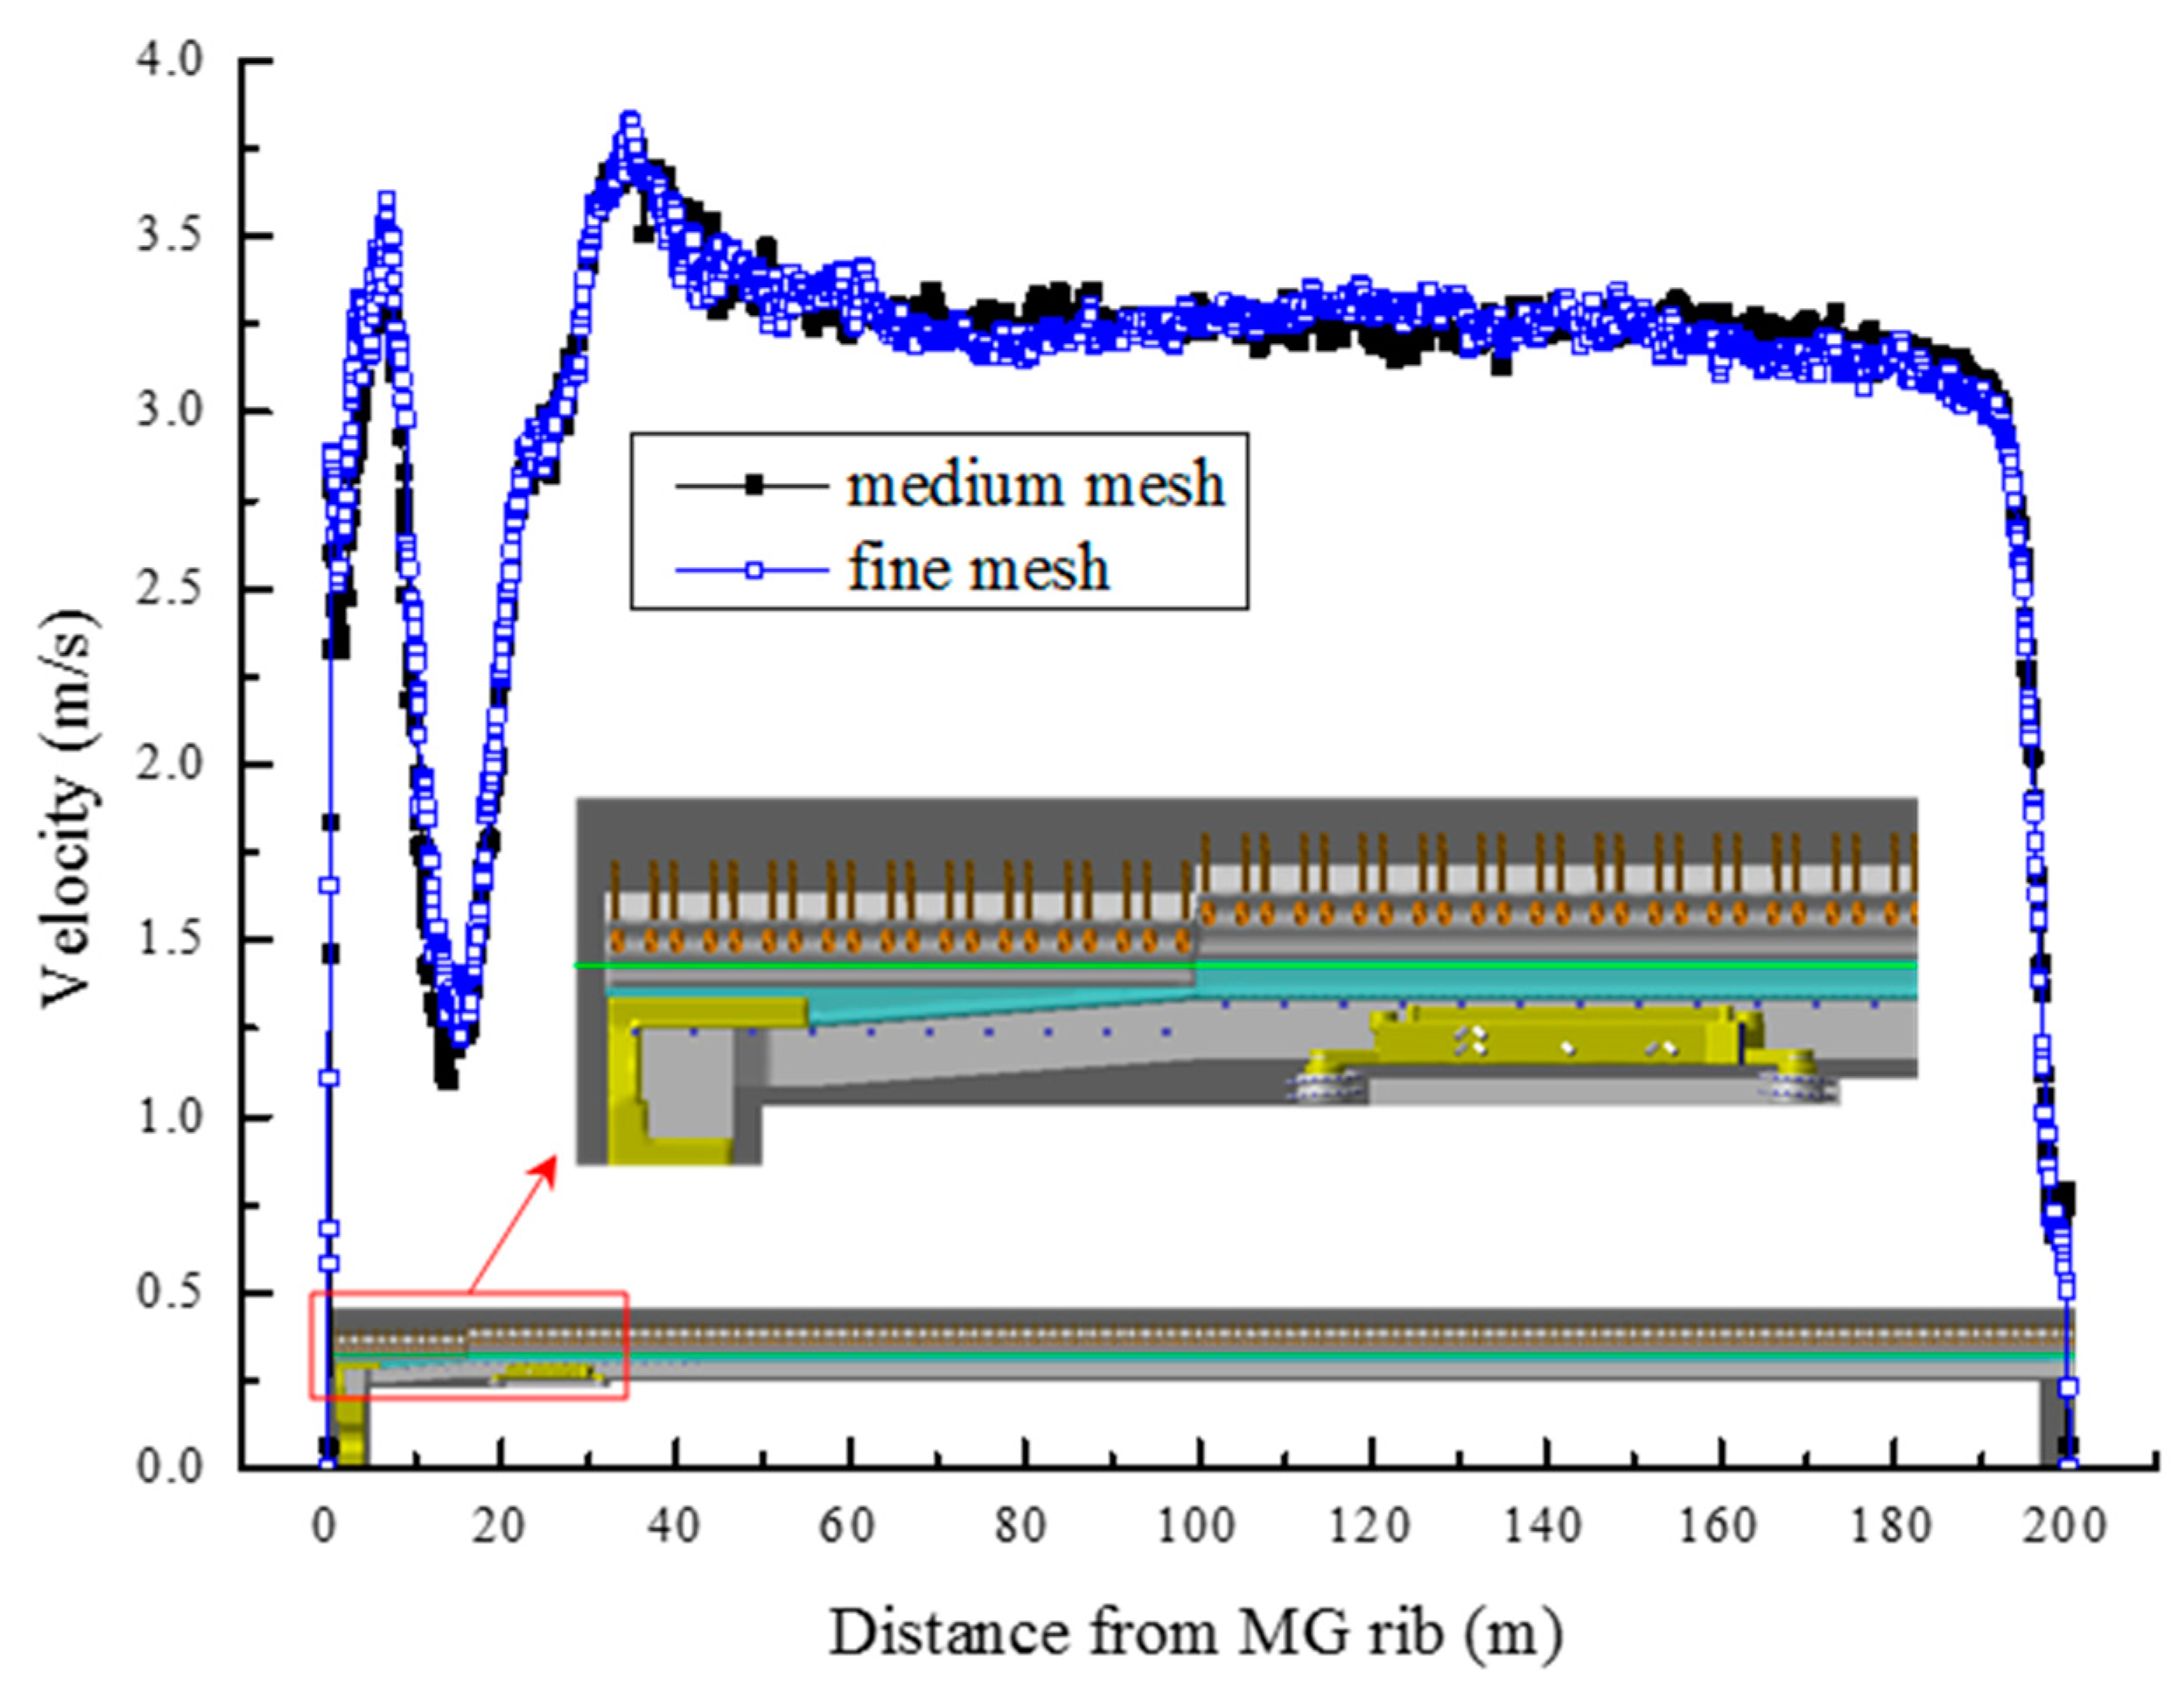
The numerical solutions of the flow field rely greatly on the meshes employed, and the solution will gradually approach to the exact solution as the mesh gets finer. However, the denser mesh might not lead to a better result. As the refinement of mesh, the discretisation error decreases, while the round-off error increases at the same time. Consequently, mesh independent study needs to be conducted to guarantee both the discretisation and round-off errors are acceptable, and the mesh adopted does not affect the solutions significantly. In this study, we employed both a medium mesh and a fine mesh to verify the mesh independence of the solution.
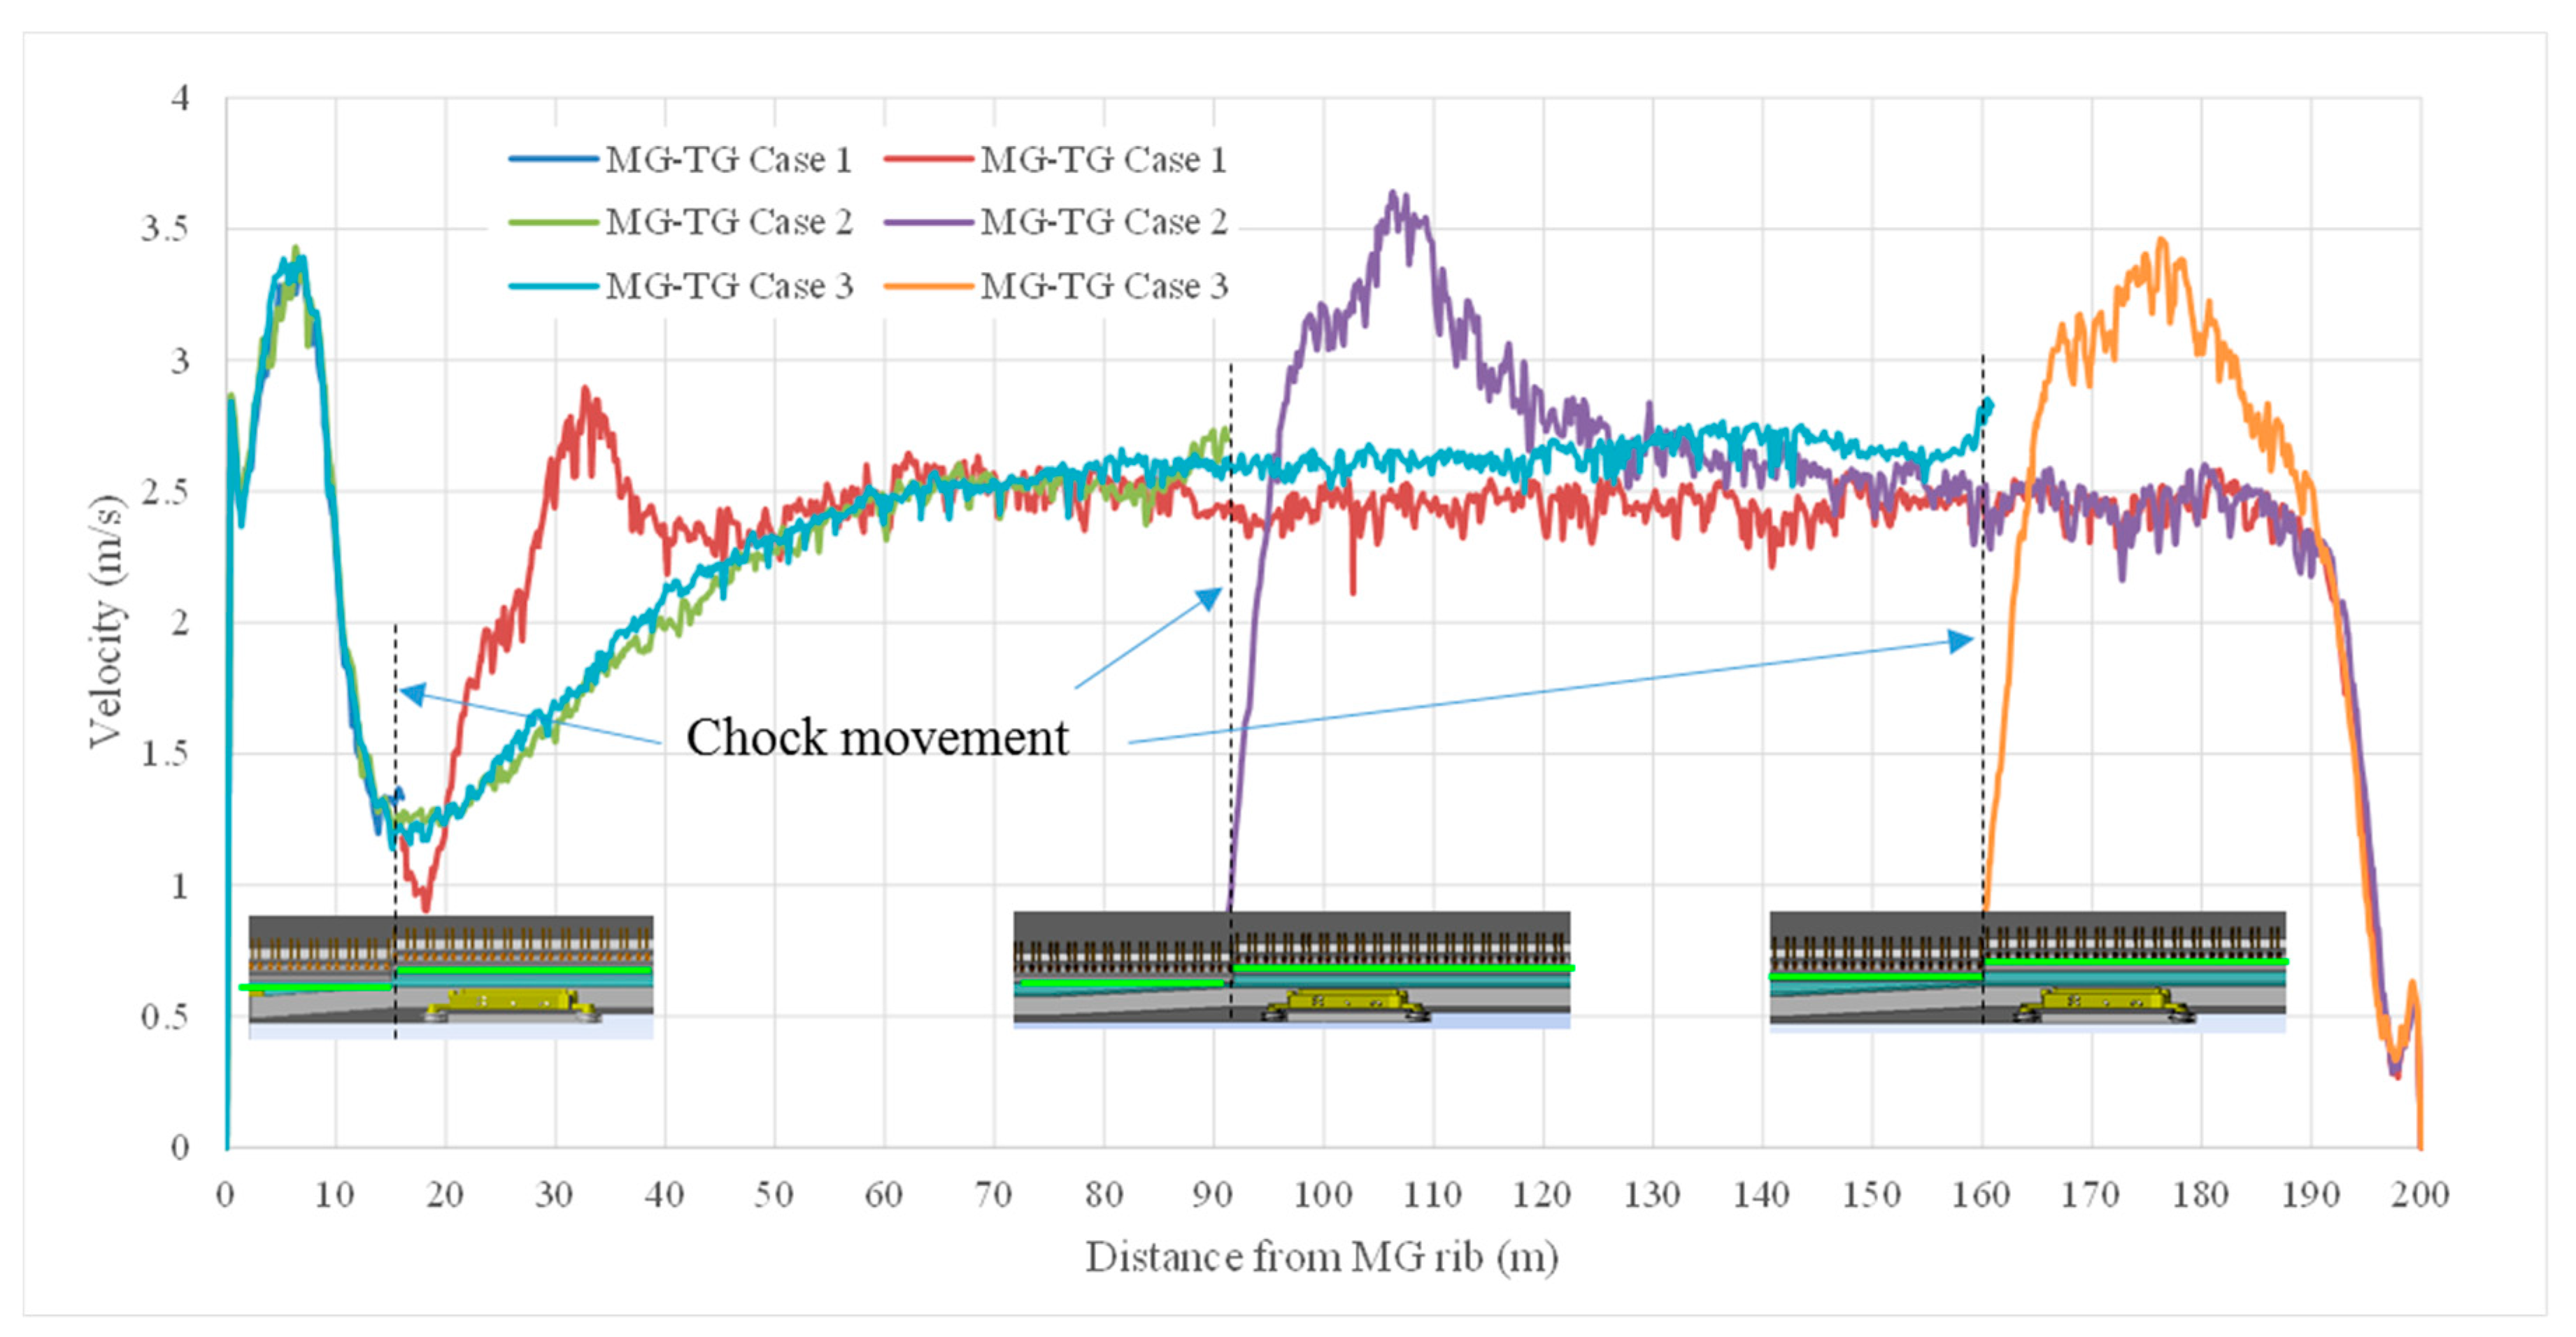
Mesh independences were investigated by taking into account the flow features at different positions of the domain. Velocity contours and vectors at different cross sections predicted by the two models were found to be similar. Figure 3 depicts a comparison of velocity profiles predicted by the medium and fine mesh models, and the line chosen here is 2 m above floor along the face in the walkway (as indicated by green line). Similar comparisons have also been conducted for the velocity profiles at other positions where good agreement have been observed. Apparently, the comparison indicated a mesh independent solution could be achieved using the medium mesh. As a result, the mesh controls used in the medium mesh model were also used in the other five models to ensure mesh independent solutions can be obtained. The model results from the medium mesh were then adopted in the following sections for flow field analysis.
4.2. Model Validation
Besides the mesh independent study, the model results must be validated by comparing the modelled predicted results with the field measured data. Considering the similarity of validation process, only the validation of MG-TG Case 1 is described here, and thus the result can be used to assess the feasibility and reliability of investigating the longwall face flow patterns using similar CFD models. Field ventilation survey was carried out in the conditions illustrated in Figure 2a: the shearer is cutting towards TG and the MG drum is 10 m away from the coal rib of MG, the longwall face is ventilated with 45 m3/s air, of which 33 m3/s from the last cut through (MG ct), but there is no TG ct for site condition. So the TG ct is switched to a solid zone in the calculation not allowing airflow passing through it. The actual pressure at TG was not measured on site. The pressure at TG is set to 0 in the model. Under this condition, the MG-TG Case 1 model is also referred to as base model in this study.
During the field survey, the velocity distribution at four cross-sections along the face (mostly around the shearer) were measured on 10 predefined positions as shown in Figure 4 which were subsequently used to validate the base model. Table 4 compares the field measured velocity and model calculated results at the four cross sections. It can be seen from the comparison that majority of the modelled velocity agree well with the measurements with errors less than 10%. However, at position 10 on the cross section of 2 m behind TG drum where the relative error reached 30%. This is because the velocity behind chock legs is relatively low compared with those close to face and a small difference between the measured and modelled data (which is 0.06 m/s in this case) can lead to large errors. Generally, the model predicted velocity are within acceptable level and are thought to be able to reflect the field condition, suggesting a proper setup of the longwall model has been achieved and the model predicted results are reliable for the investigation of flow patterns along the longwall face.
5. Base Model Results and Discussion
5.1. General Airflow Patterns
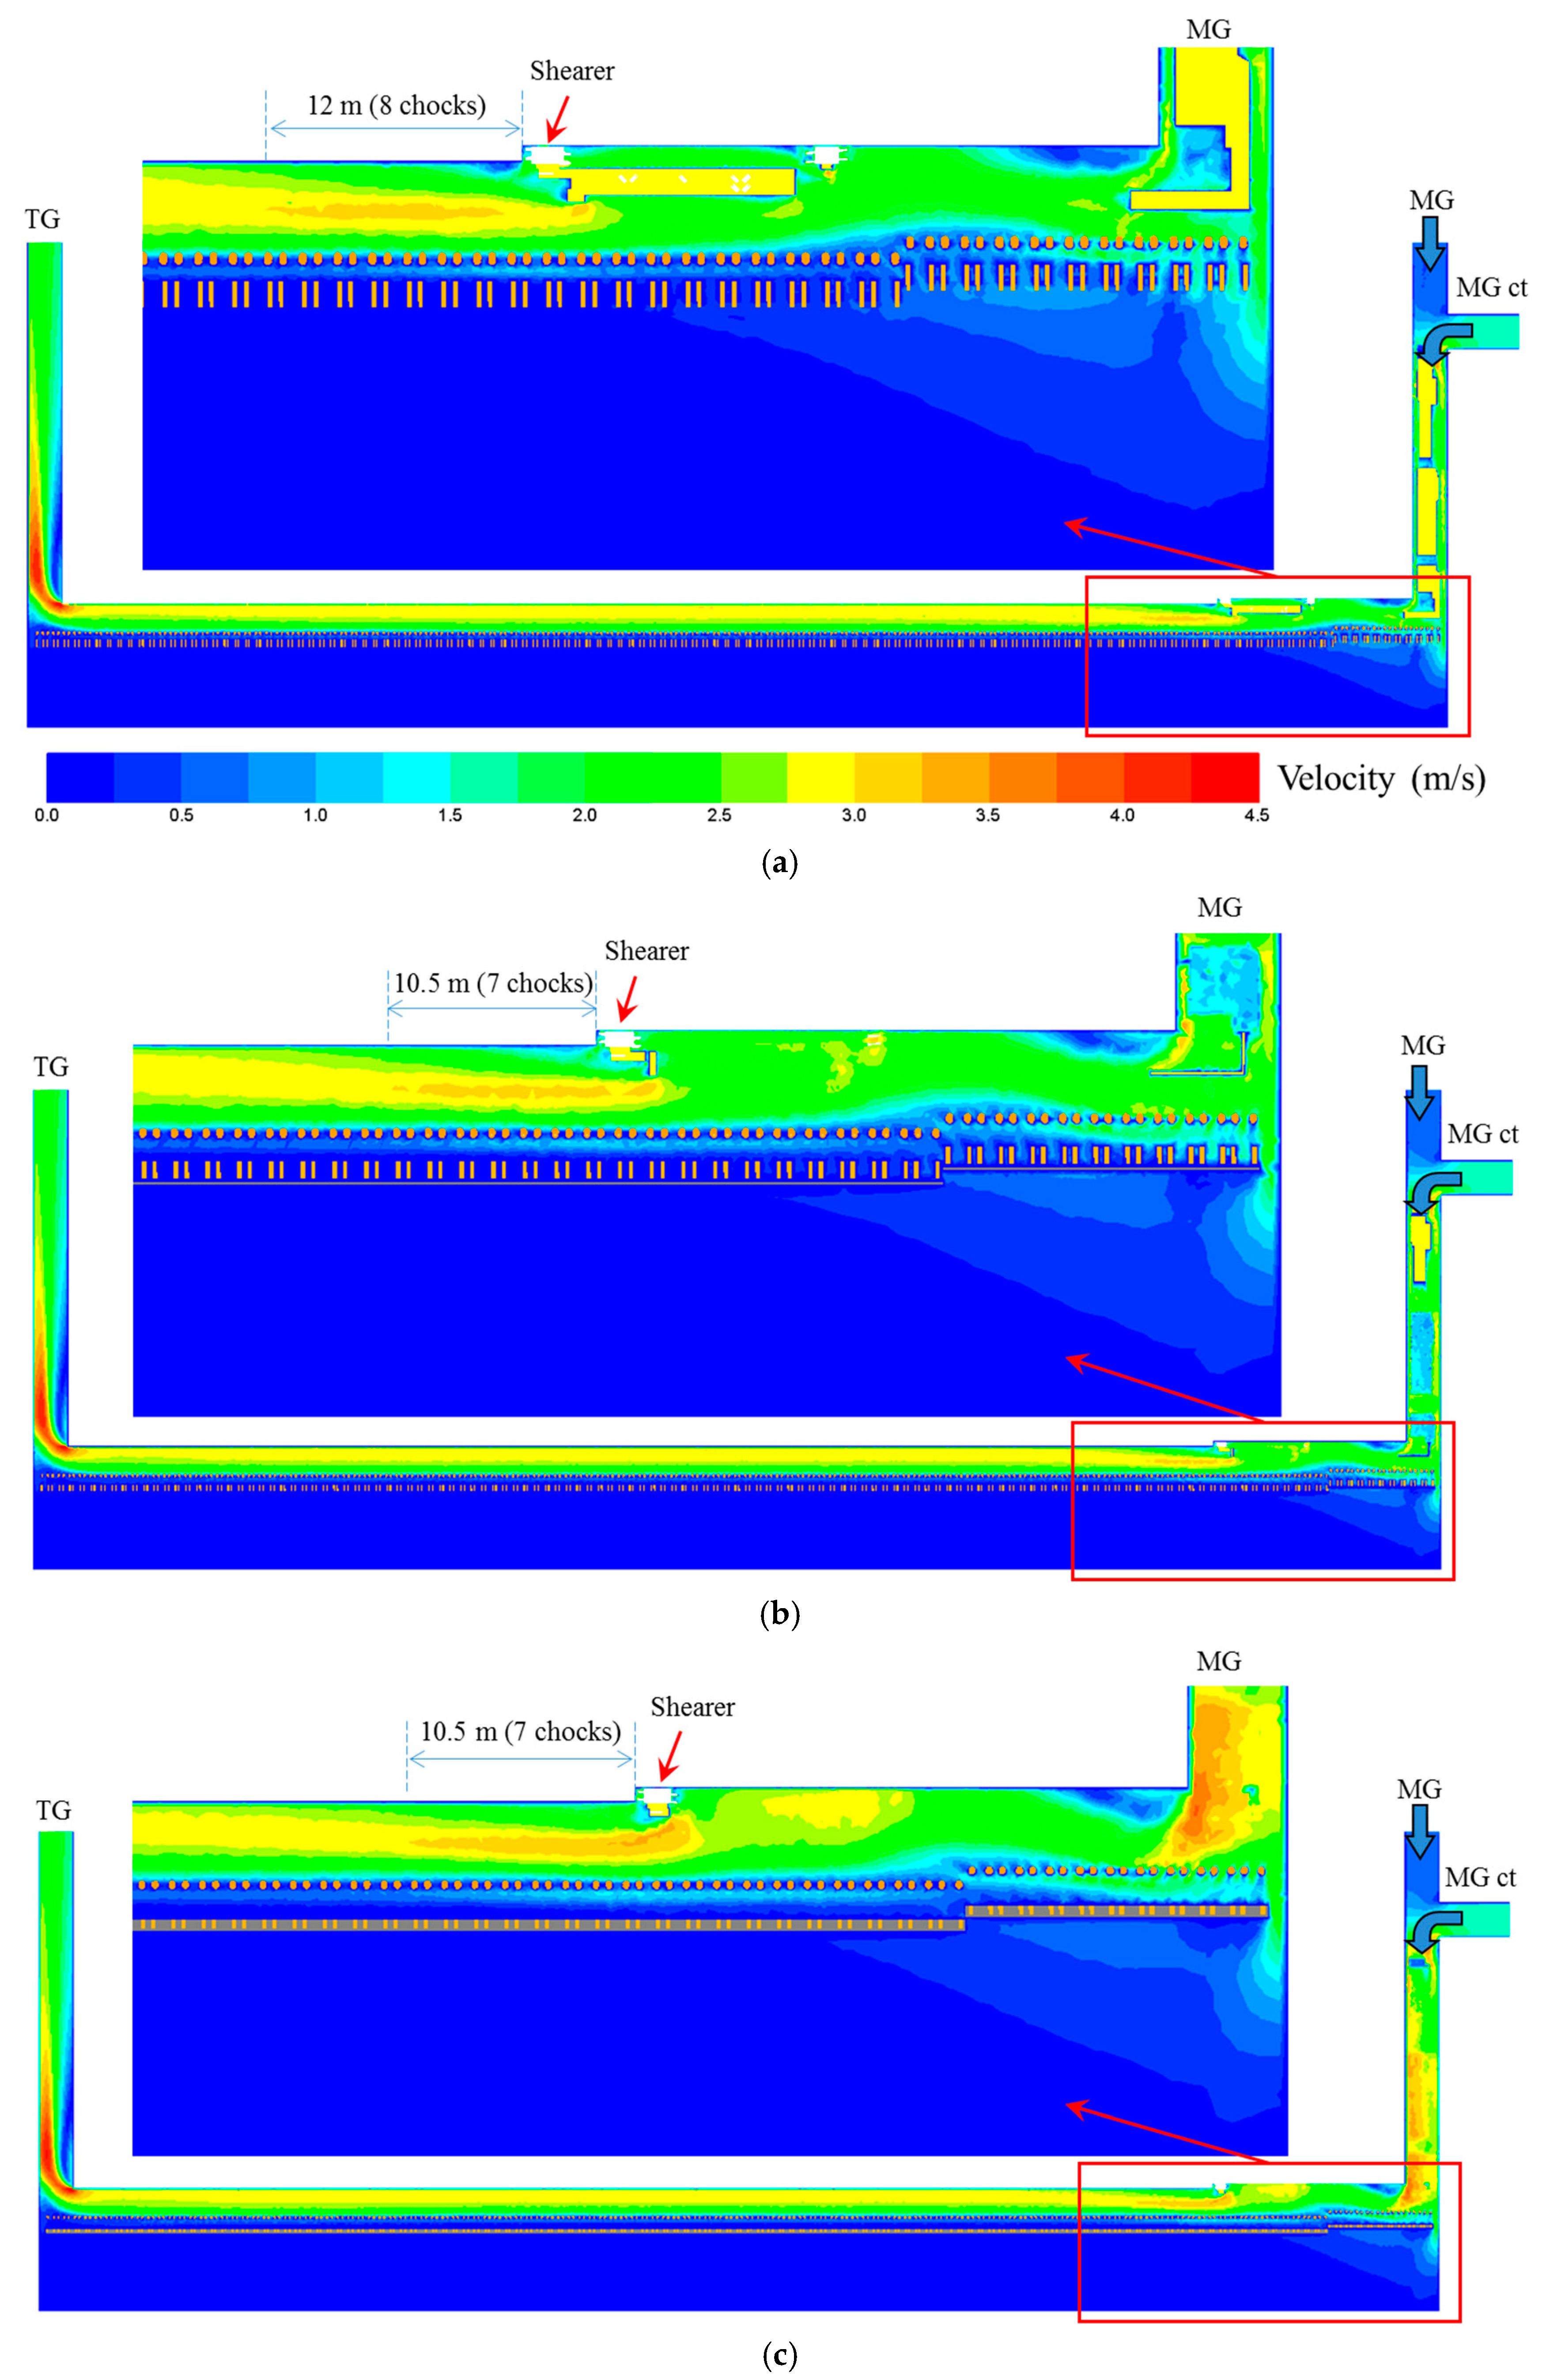
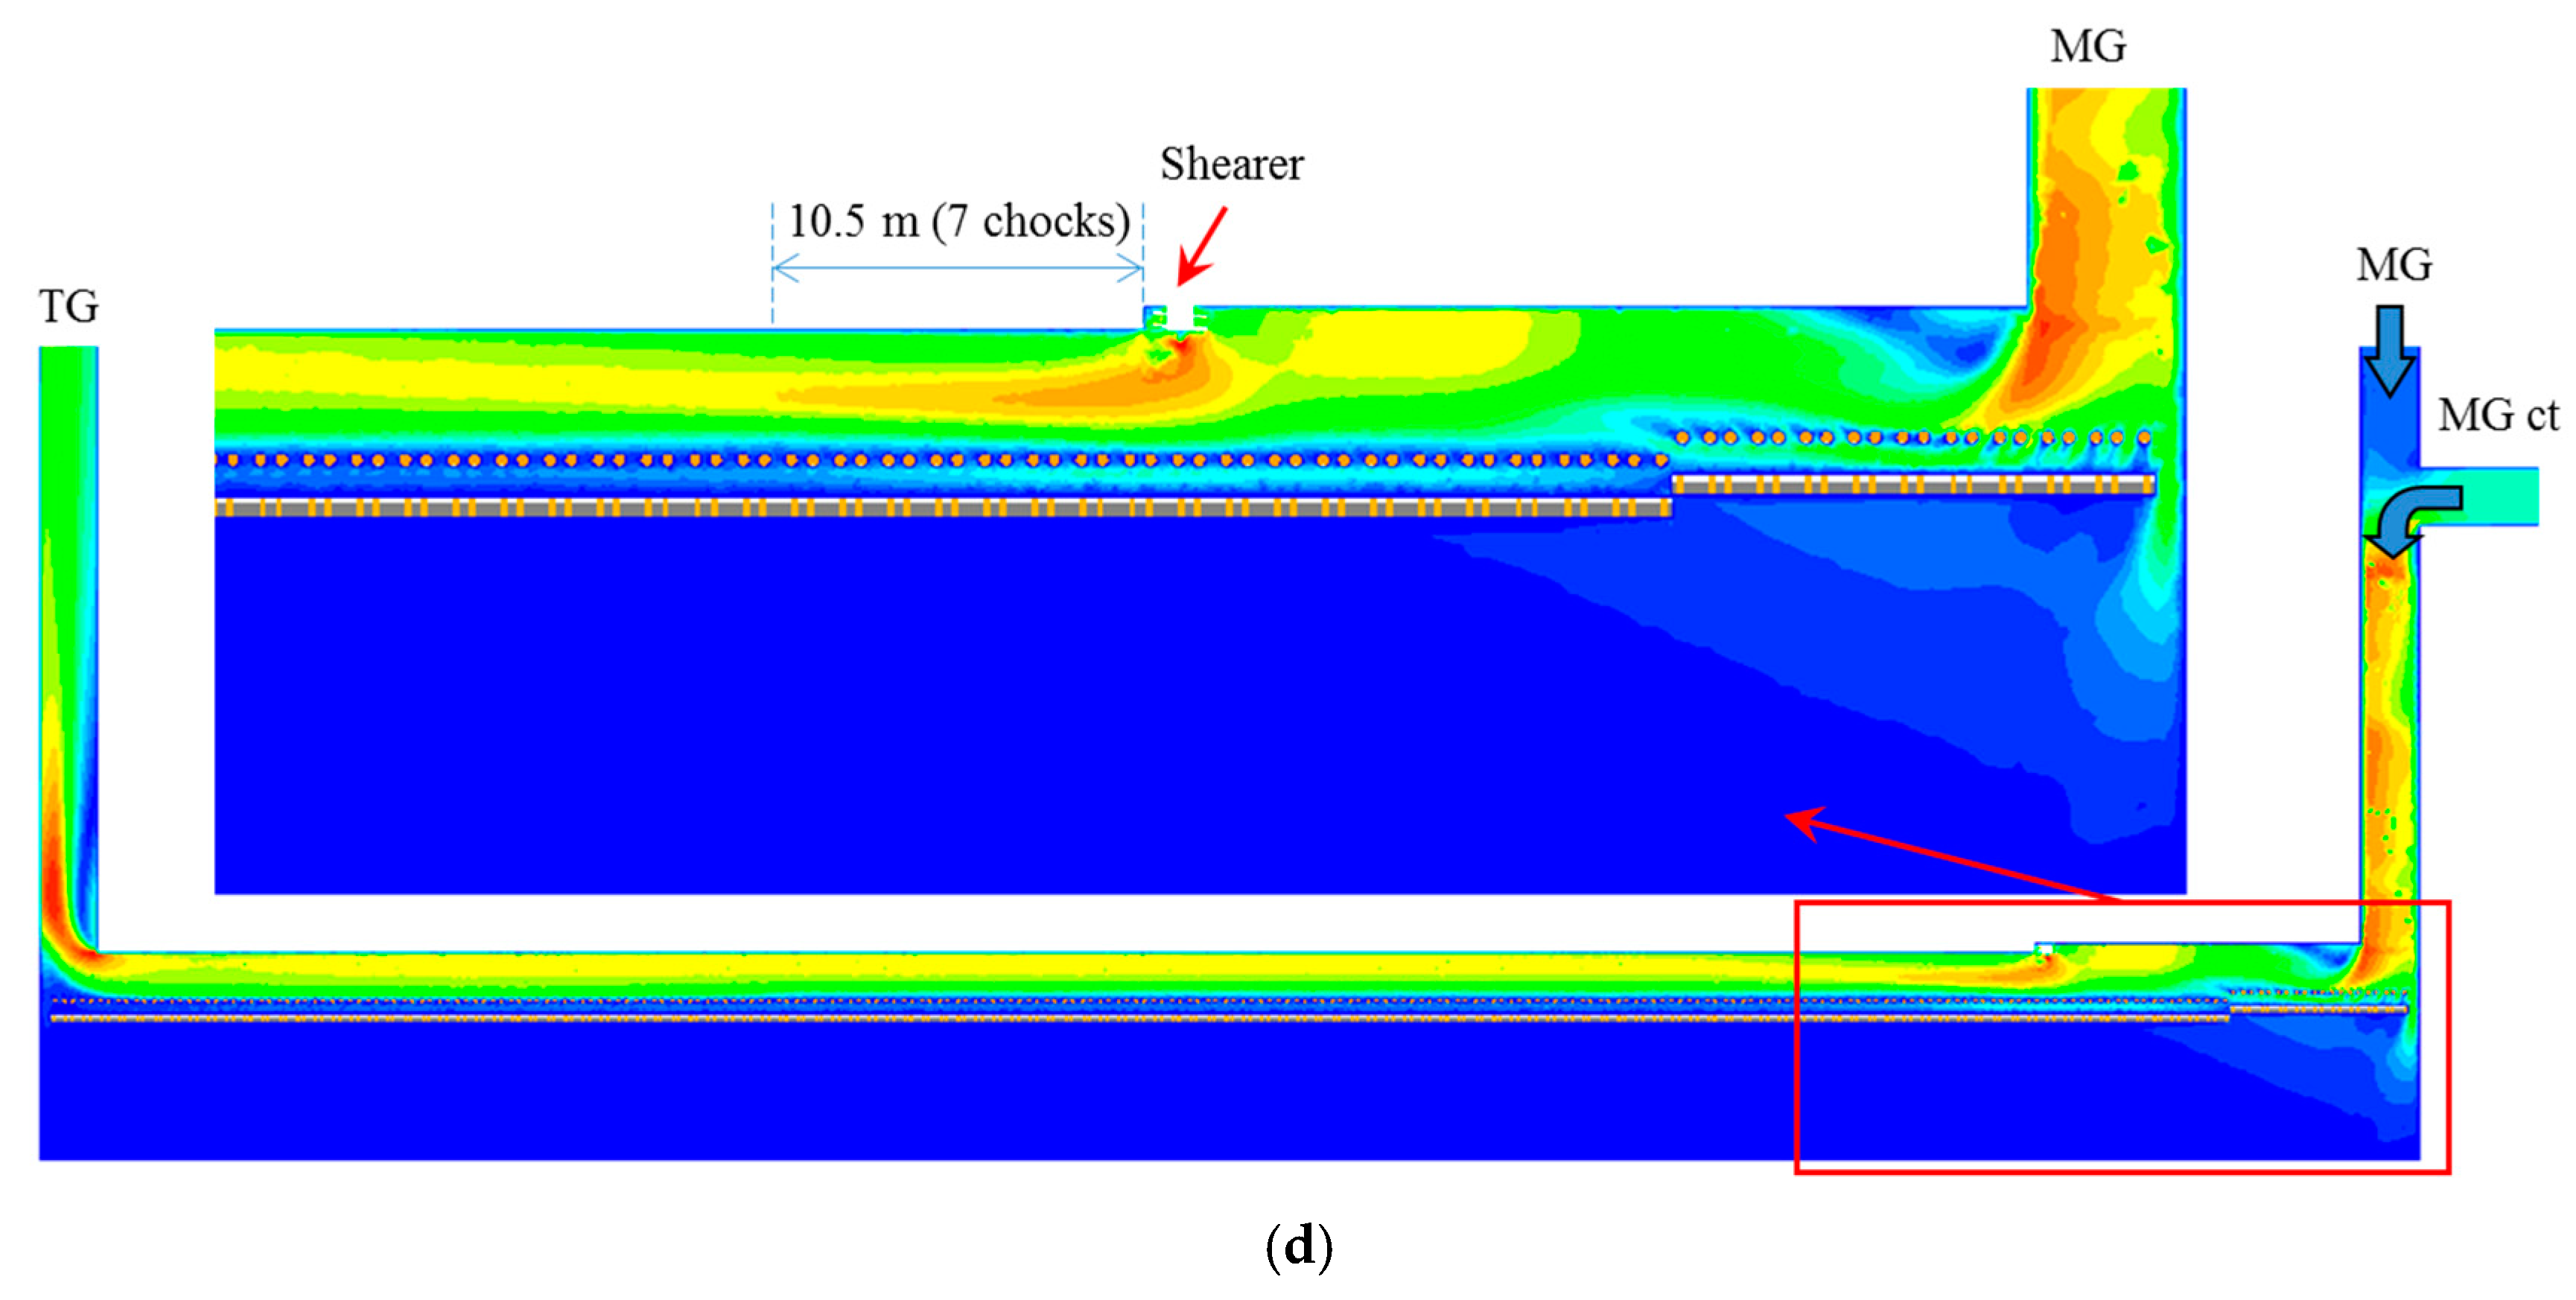
Figure 5 shows the overall airflow velocity contour along the entire face at different levels above the floor. As expected, the airflow velocity is not evenly distributed along the face. Areas along the MG, at the intersection of MG/TG and face and within 10 to 12 m downwind of the shearer are typically the major high velocity areas (above 3 m/s). In the MG, the velocity is slightly higher due to the existence of equipment in the roadway. While at the intersection of MG/TG and face, the velocity is higher at the outer corners, especially at the intersection of face and TG where the velocity reaches 4 m/s and above. It is observed from these modelling results that the majority of airflow, which has penetrated to the goaf at the MG side, returns to the main flow again just behind the shearer. Therefore, the flow rate in the downstream of the shearer recovers to approximately the same flow rate at the MG regardless of the quantity of flow lost in the goaf. Hence, the increased flow rate together with the reduced cross section contributes to the relatively higher velocity downstream of the shearer, and this effect is more significant at higher levels above the floor in the airway. The range of velocity increase due to shearer could reach about 12 m in its downstream.
5.2. Flow Separation along Longwall Face
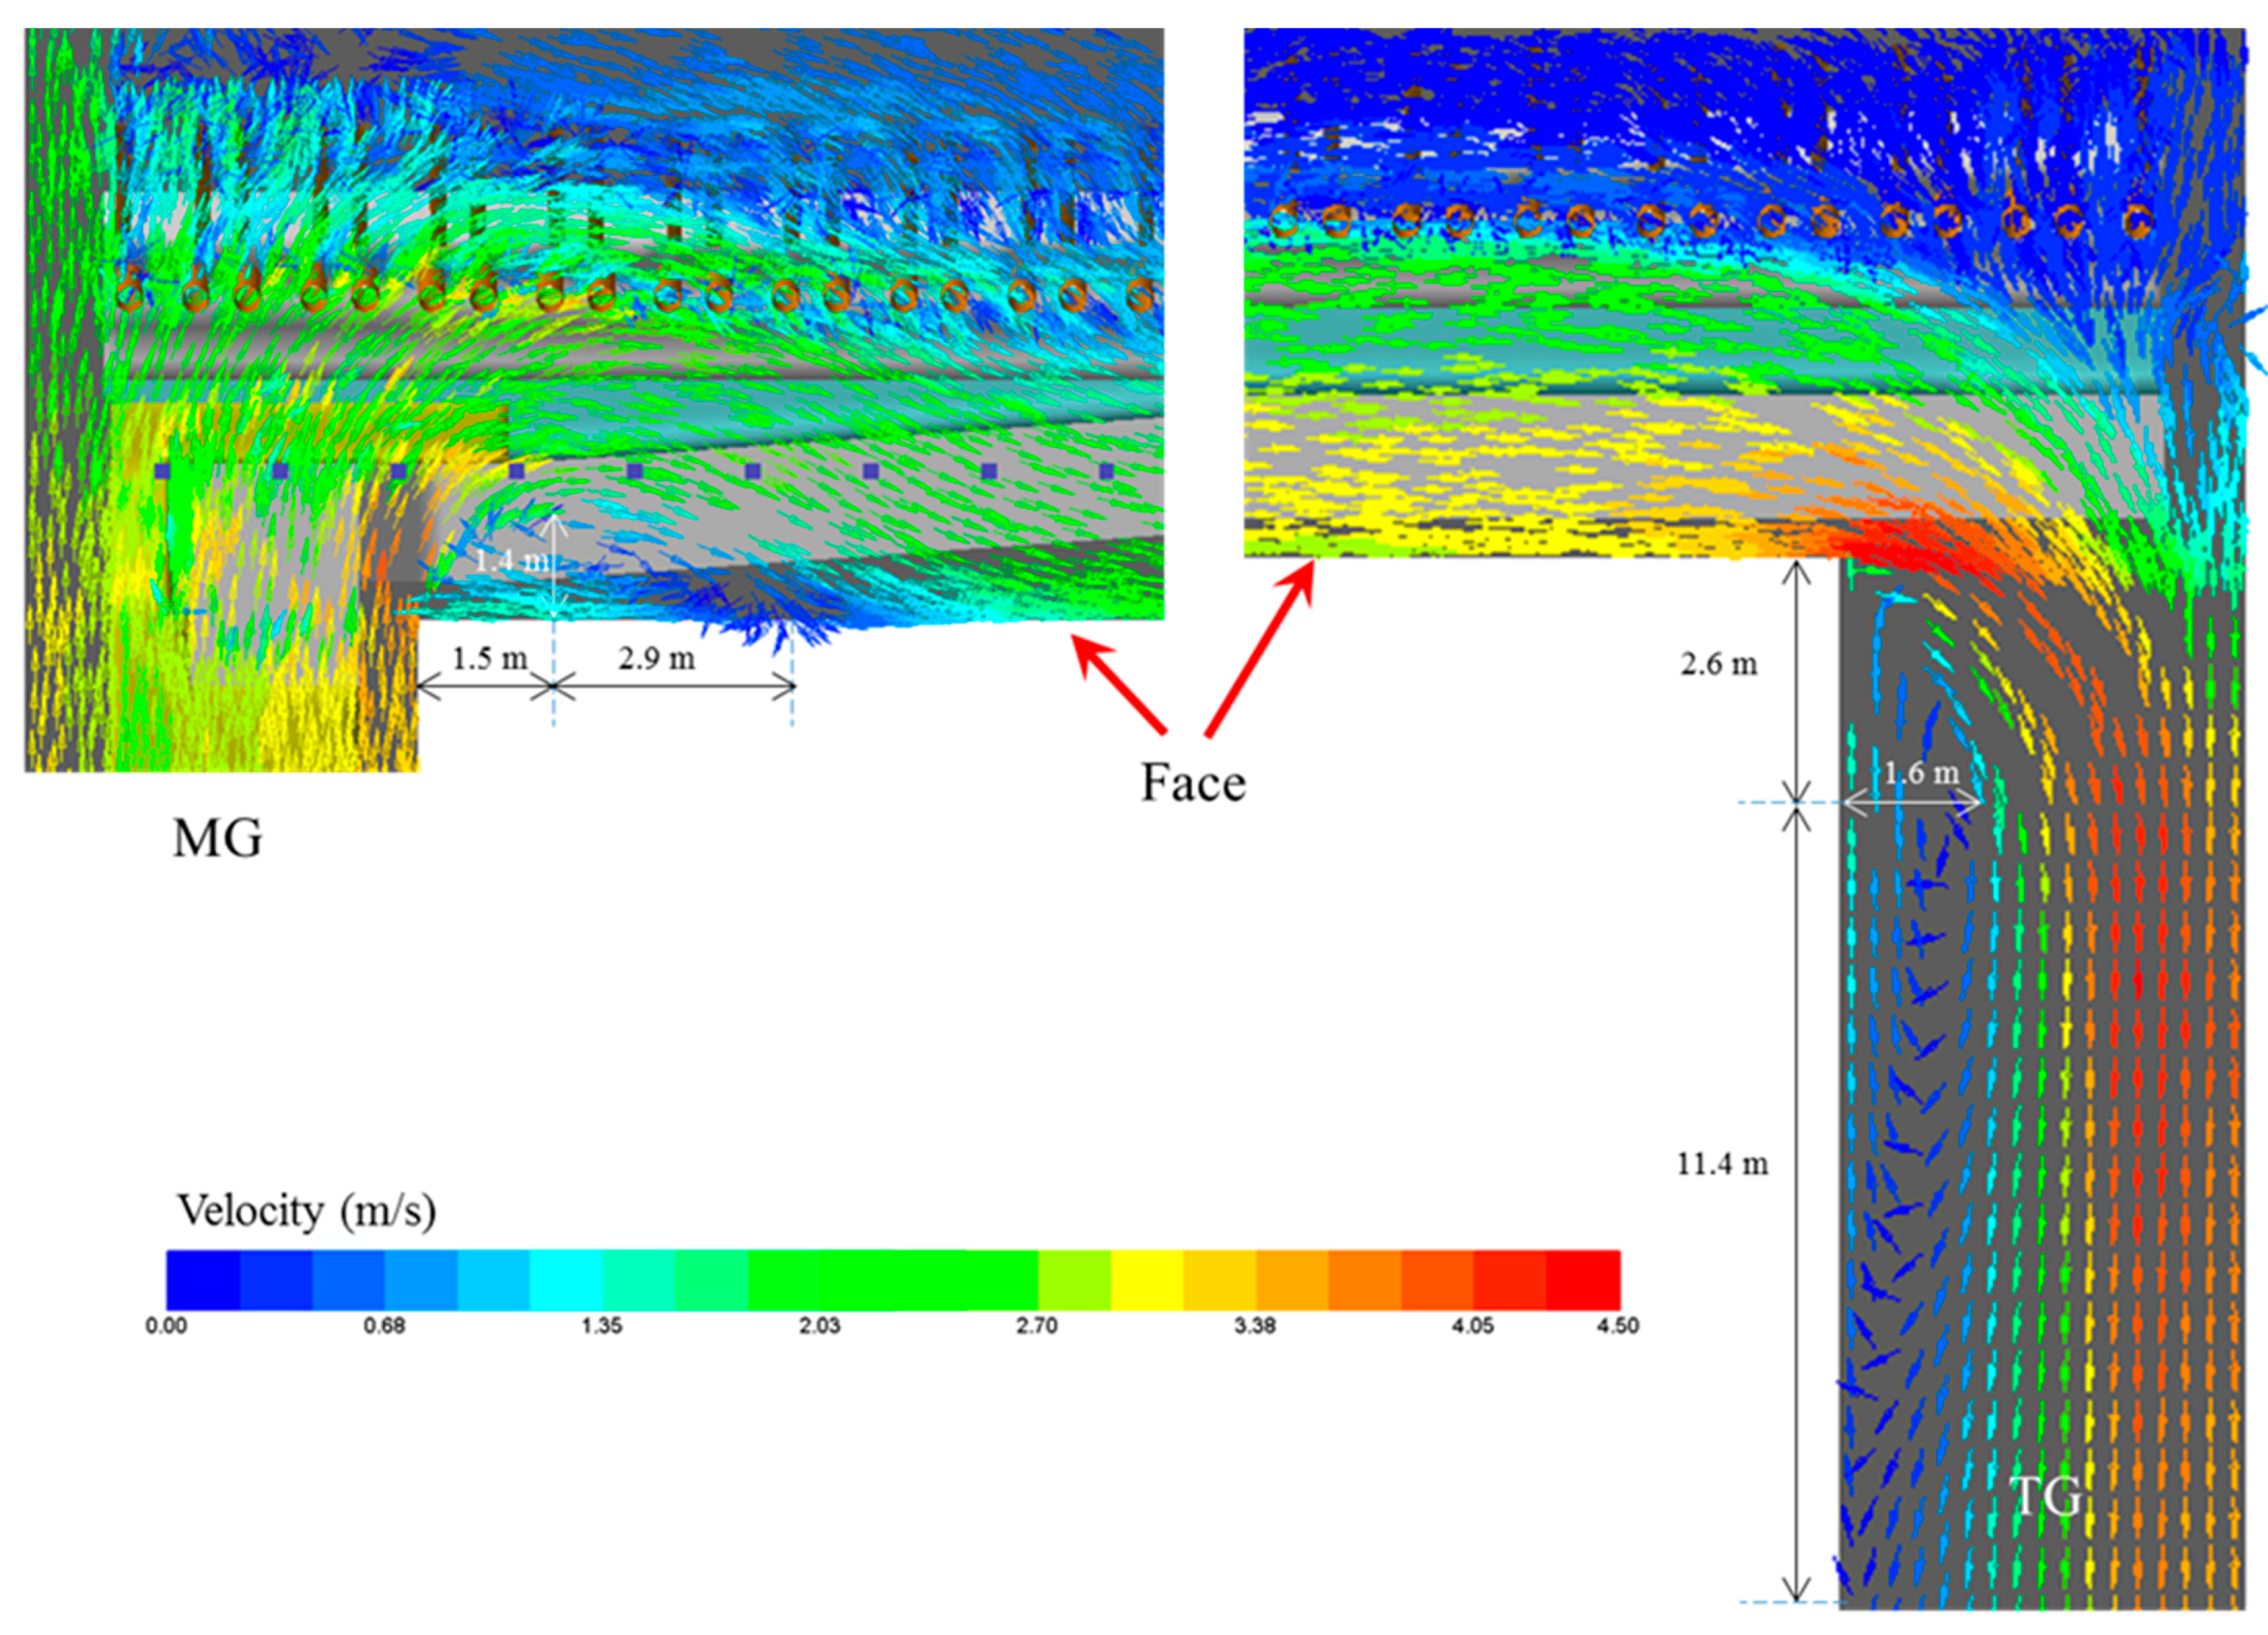
Figure 6 depicts the flow patterns at the intersection of MG/TG and face where flow separation occurs. As stated before, the mean airflow is significantly accelerated at the intersection of face and TG. This is primarily due to the occurrence of flow separation which introduces backflow towards upstream. In order to satisfy the incompressible continuity requirement, the mean flow away from the backflow area must be accelerated accordingly. The acceleration is not obvious at the intersection of MG and face as a result of significant leakage to goaf. The leakage velocity can reach up to about 2 m/s. The extent of flow separation varies at the two intersections resulting from different flow patterns. At the intersection of MG and face, ventilation at face entry is reduced greatly due to significant leakage to goaf; while face ventilation together with leaked ventilation from goaf converge at the intersection of face and TG. Therefore, the airflow rate through the face entry is smaller than that through the TG, leading to smaller extent of separation at the intersection of MG and face. Specifically, the separation ends at around 4.4 m at face entry while it ends at around 14 m in the TG. The maximum width of separation does not vary greatly at the two locations, with about 1.4 m at face entry and 1.6 m at the TG.
As the only exit, the airflow pattern in the TG is of great significance in terms of discharging the hazardous gas and dust associated with the longwall coal extraction. As Figure 6 shows, the influence of separation is significant in the first 14 m at the TG. The backflow and stagnant air in the downstream will increase the risk of gas accumulation. It is also inferred that the majority of gas trapped in the recirculation zone will be the gas liberated from the face rather than the goaf. And the gas released from the goaf, prefers to accumulate in the sluggish zone (velocity is typically lower than 0.8 m/s) under the TG chocks and the gap between the last longwall chock and the TG rib (referred as upper TG corner thereafter). This inference has been proved by a recent study of gas distribution at a longwall face where the gas sources leading to different levels of accumulation at different positions were identified [70]. It is the ventilation system that determines the gas distribution patterns. Therefore, during the extraction of single coal seam where the gas is mainly emitted from face, the range of separation at the TG should be minimised to prevent significant gas accumulation within that area. When mining multi-seam, more gas would be liberated from goaf, thus the upper TG corner is the place where more attention should be paid to. The occurrence of flow separation in the ventilation system is not desirable, not only because it causes energy loss but also increases the likelihood of hazardous gas and dust accumulation in the recirculation zone. Preliminary study about gas distribution at longwall face has proved that gas concentration is higher in both of the recirculation zones [70]. The specific impact of flow separation on the dust flow behaviour at the two intersections will be investigated in future studies as well as the development of effective measures to minimise the extent of separation.
5.3. Airflow Patterns around the Shearer
At the longwall face, as coal seam is cut by the shearer, a high level of hazardous gas (e.g., methane) and dust is generated in the coal extraction process, thus it is important to understand the airflow patterns around the shearer. As mentioned before, a longwall shearer has been incorporated in the model, aiming at capturing details of the ventilation airflow as the field situation.
The velocity contour around the shearer at different levels above the floor can also be observed in Figure 5. As expected, the air flow velocity is not evenly distributed around the shearer as the air passes the shearer body. A small separation zone (about 1 m long) is observed ahead of the TG drum; however, this zone gradually diminishes as the elevation increases, indicating the airflow separation is mainly induced by the shearer body at the lower position. The rotation of the shearer drums provides an additional motion to the flow, stimulating/retarding the airflow movement in the vicinity of the drums where the gas emission rate is supposed to be the highest along the face. In areas above the shearer body, the velocity gradually increases from about 2.5 m/s to above 3 m/s as the distance above it increases, two factors are thought to be the cause of this characteristic; as the airflow passes the shearer body, the effective cross section is reduced due to the occupation of the shearer body, whilst the leaked air in the goaf flows back to the face through gaps between the chocks, pushing the airflow towards the face side and upwards.
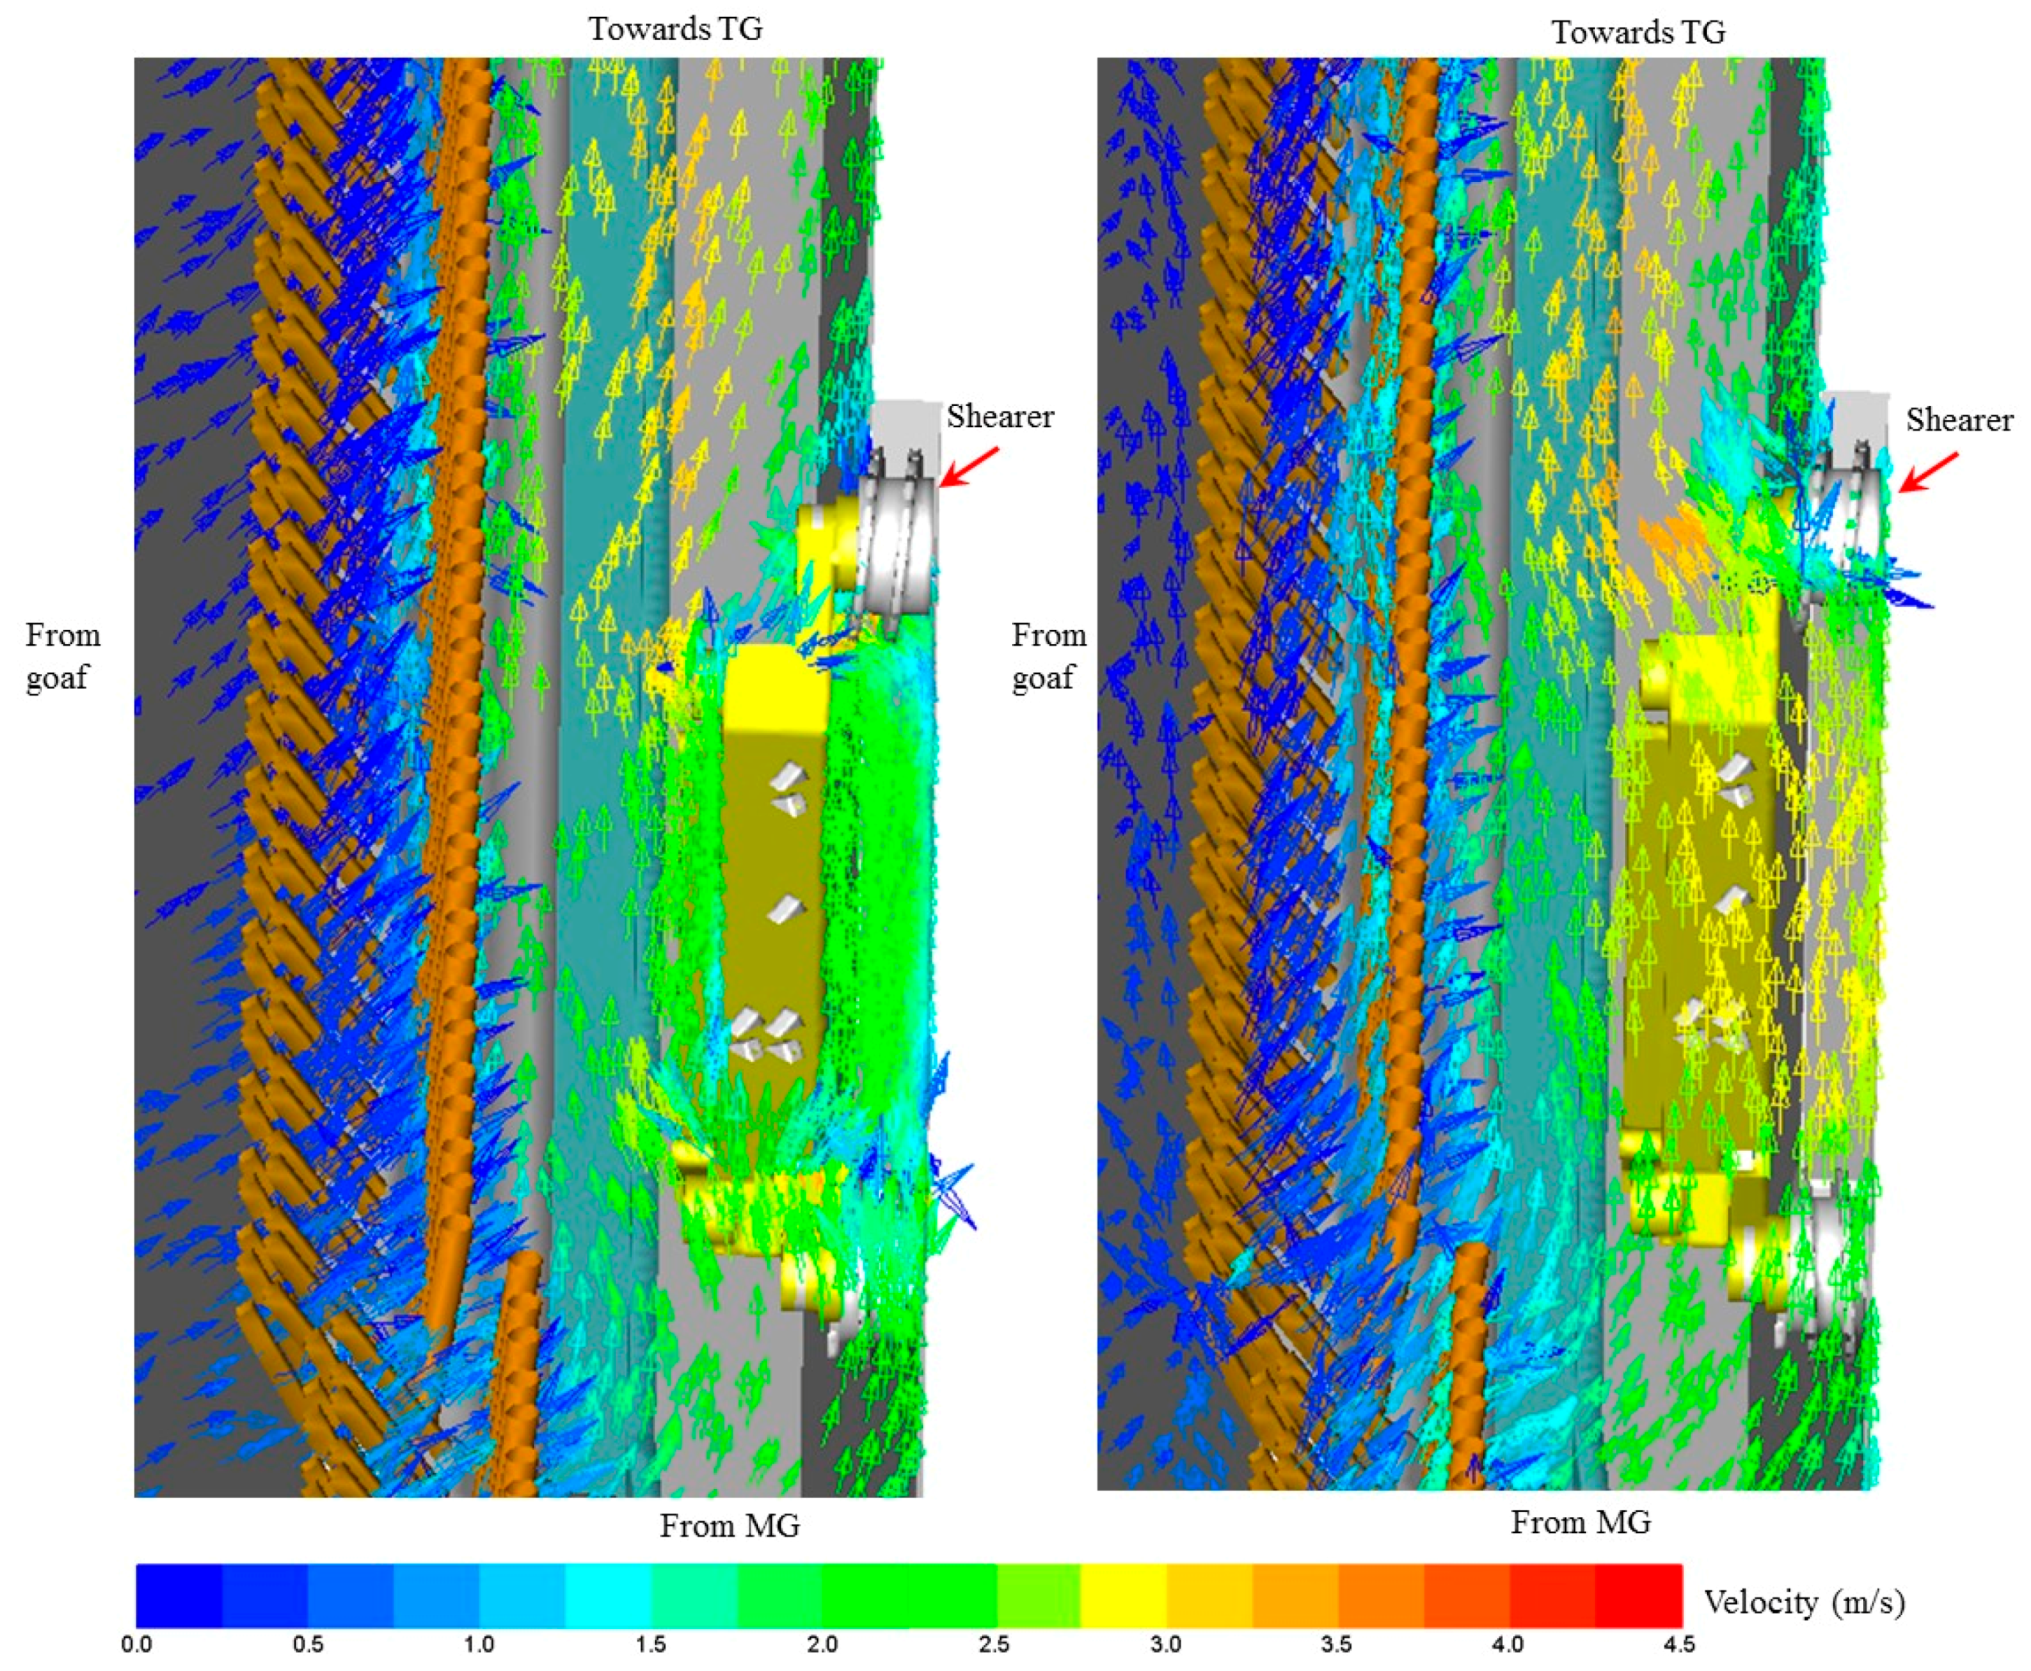
Figure 7 provides a 3D view of the velocity vectors around the shearer. It can be seen that at lower elevations, the ventilation is able to flow across the gaps between longwall supports and re-enter the face to join the main air stream. Owing to the special configurations and the location of the shearer body, the flow direction varies as the flow passes the shearer, indicating an “S” shape airflow pattern. It is observed that the intake air flows towards the face at the MG drum position and above it due to the influence of separation at face entry. As the airflow approaches the TG drum, the velocity becomes smaller near the drum, and the flow is deflected to flow faster towards the walkway, after which it flows back to the existing face and starts to travel straight along the face.
5.4. Velocity Distribution cross the Face
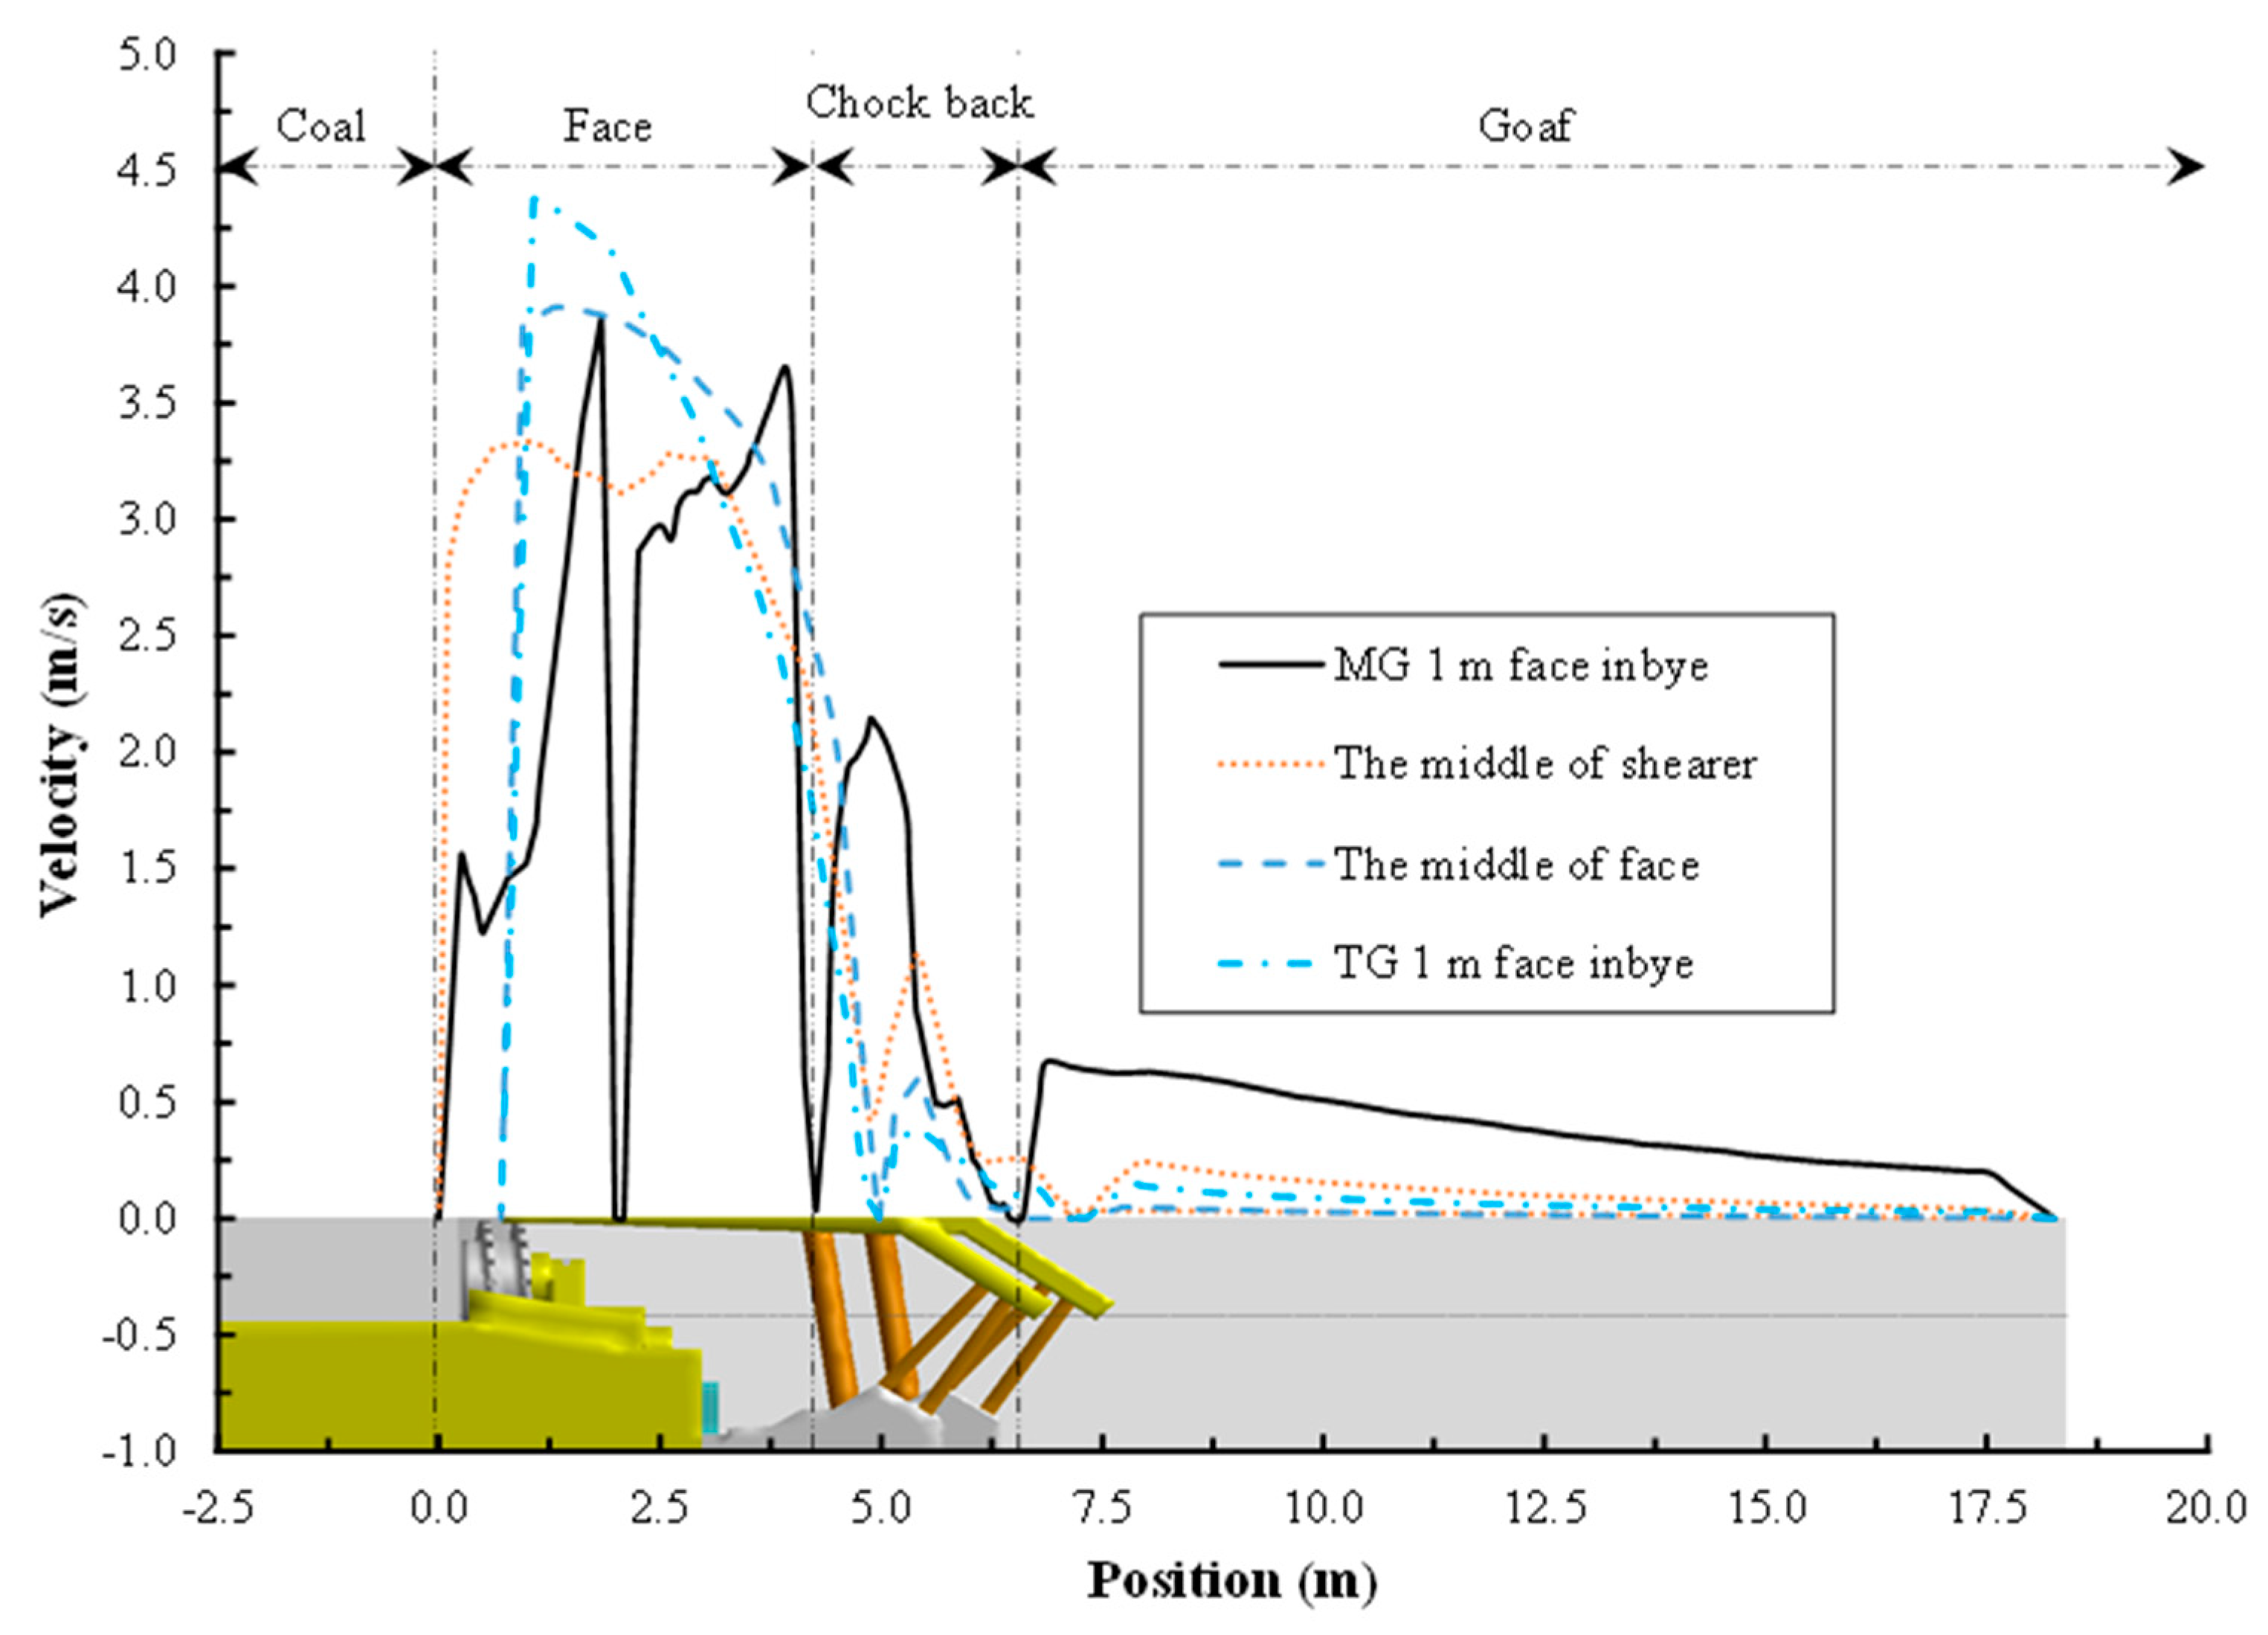
Figure 8 shows the velocity variations from the face towards the goaf at four different locations along the face, i.e., 1 m face inbye on the MG side, the middle of shearer body and face, and 1 m face inbye on the TG side. The 2 m level is chosen to represent the workforces’ breathing level. It can be seen that the overall velocity varies significantly from the face to the goaf, and even in the face area, the velocity is not evenly distributed, especially just after the flow enters the longwall face where a large volume of airflow tends to penetrate into the goaf. Generally, the flow regimes can be categorised into three sections which are in accordance with the geometry of the face, namely, airflow along the face, between the chocks’ legs and the immediate goaf behind the chocks, as indicated in Figure 8. Flow velocity in the face area generally varies between 1.5 m/s and 4.5 m/s. And at 1 m face inbye of MG side, the sudden drop of velocity profile is caused by the flow separation. Between chocks’ legs, velocity drops from about 2 m/s on the MG side to around 0.5 m/s or below on the TG side. The overall velocity in the goaf is the lowest in the three sections, and the maximum velocity of 0.5 m/s occurs at the MG end, indicating an obvious air exchange between face and goaf, whilst the velocity is lower than 0.25 m/s in the goaf as the ventilation flows towards the TG, reflecting a good roof caving and compaction in the goaf.
6. Parametric Studies
The base model reveals a working scenario of the longwall extraction process when the shearer is cutting towards TG on the MG side; however, as the shearer cuts further along the face, the corresponding airflow patterns may vary accordingly. Thus, this section describes the airflow patterns along the longwall face considering more working scenarios in terms of shearer position and cutting sequence.
6.1. Impact of Shearer Position
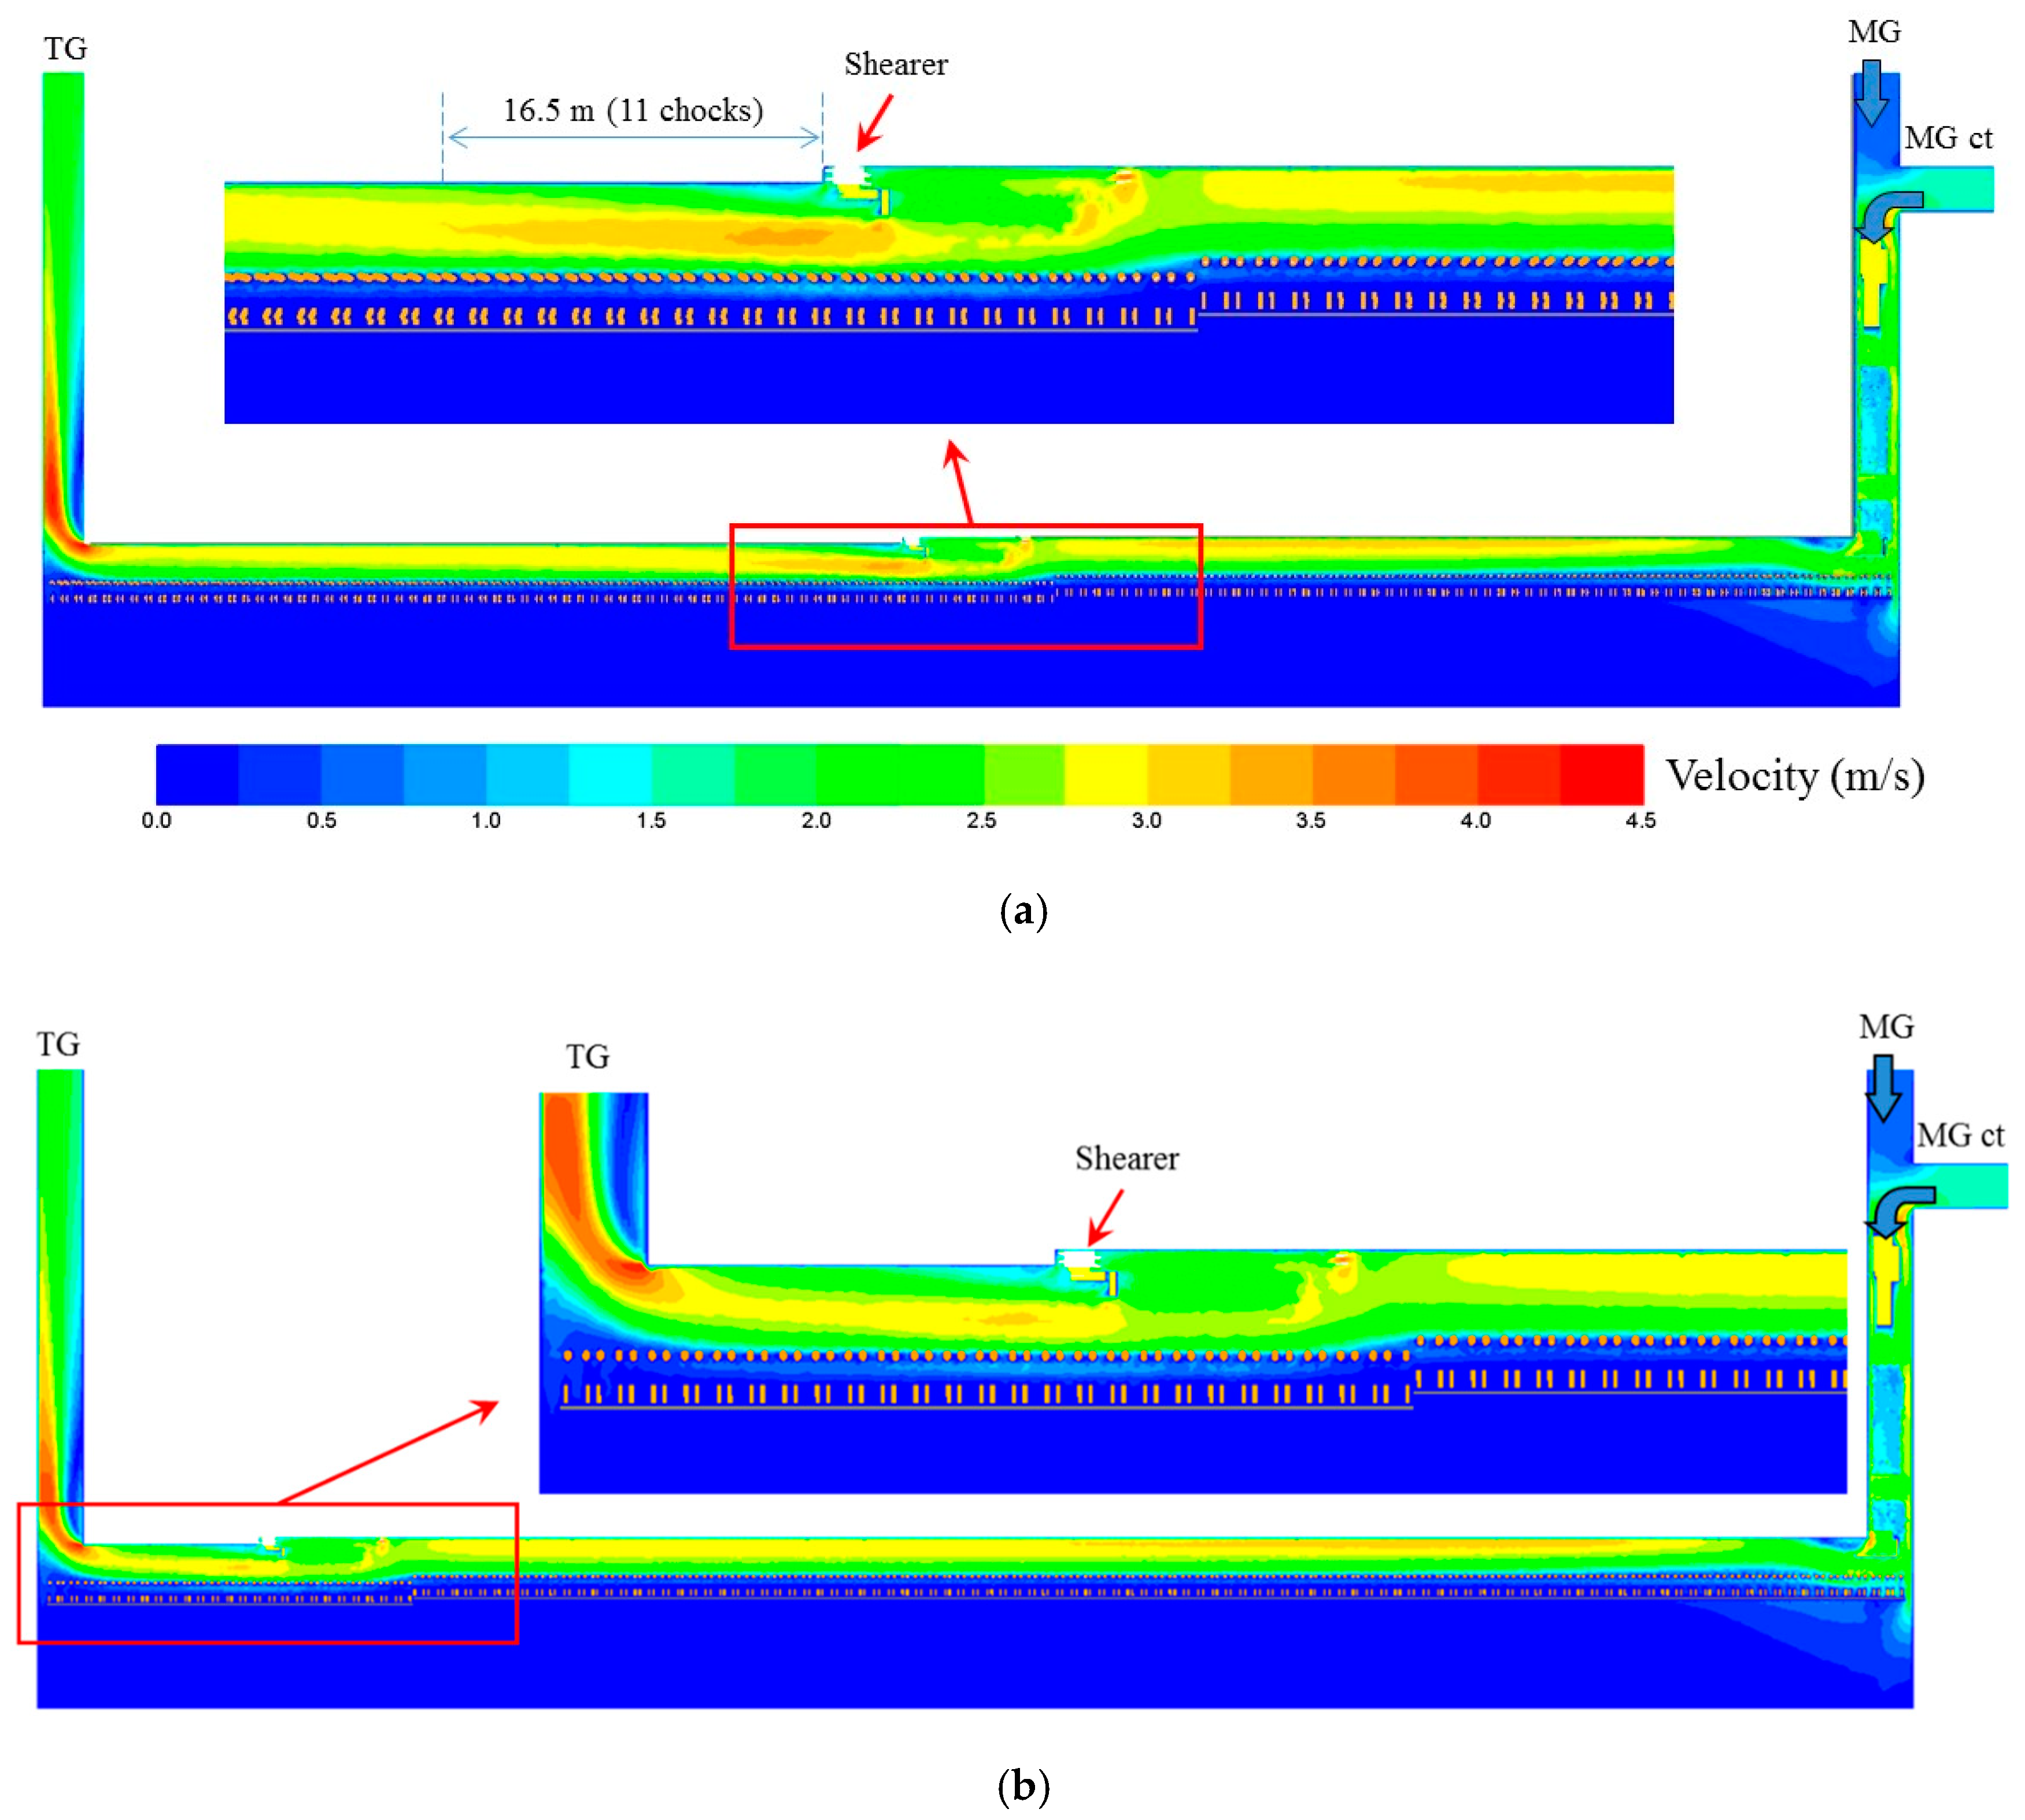
Figure 9 shows the velocity contour at 2 m above floor for MG-TG Case 2 and Case 3. General airflow pattern similar to that of the base model can be observed, suggesting the ventilation at face generally remains stable. The effect of shearer on the overall airflow patterns is limited to zones close to the shearer body and about 16.5 m downstream of the TG drum in MG-TG Case 2, which is slightly longer than that in the base model (about 12 m downstream of the TG drum). This is probably because majority of leaked air to the goaf has already flowed back to face, and ventilation passing through the shearer is slightly higher than that in the base model. However, the effect is minimal as the shearer approach the TG in MG-TG Case 3. It is noticed that in all three cases, as a result of leakage to goaf, the ventilation at the first 20 to 30 m of face is lower than other parts of the face, characterised by lower velocity (around 2 m/s) compared with the flow further downstream. With the gradual return of the leaked air, the velocity gradually increases to about 3.0 m/s, and then becomes stable as it flows along the face until it reaches the shearer body where the velocity starts to fluctuate again. A similar velocity contour distribution pattern to the base model is predicted around the shearer in both models.
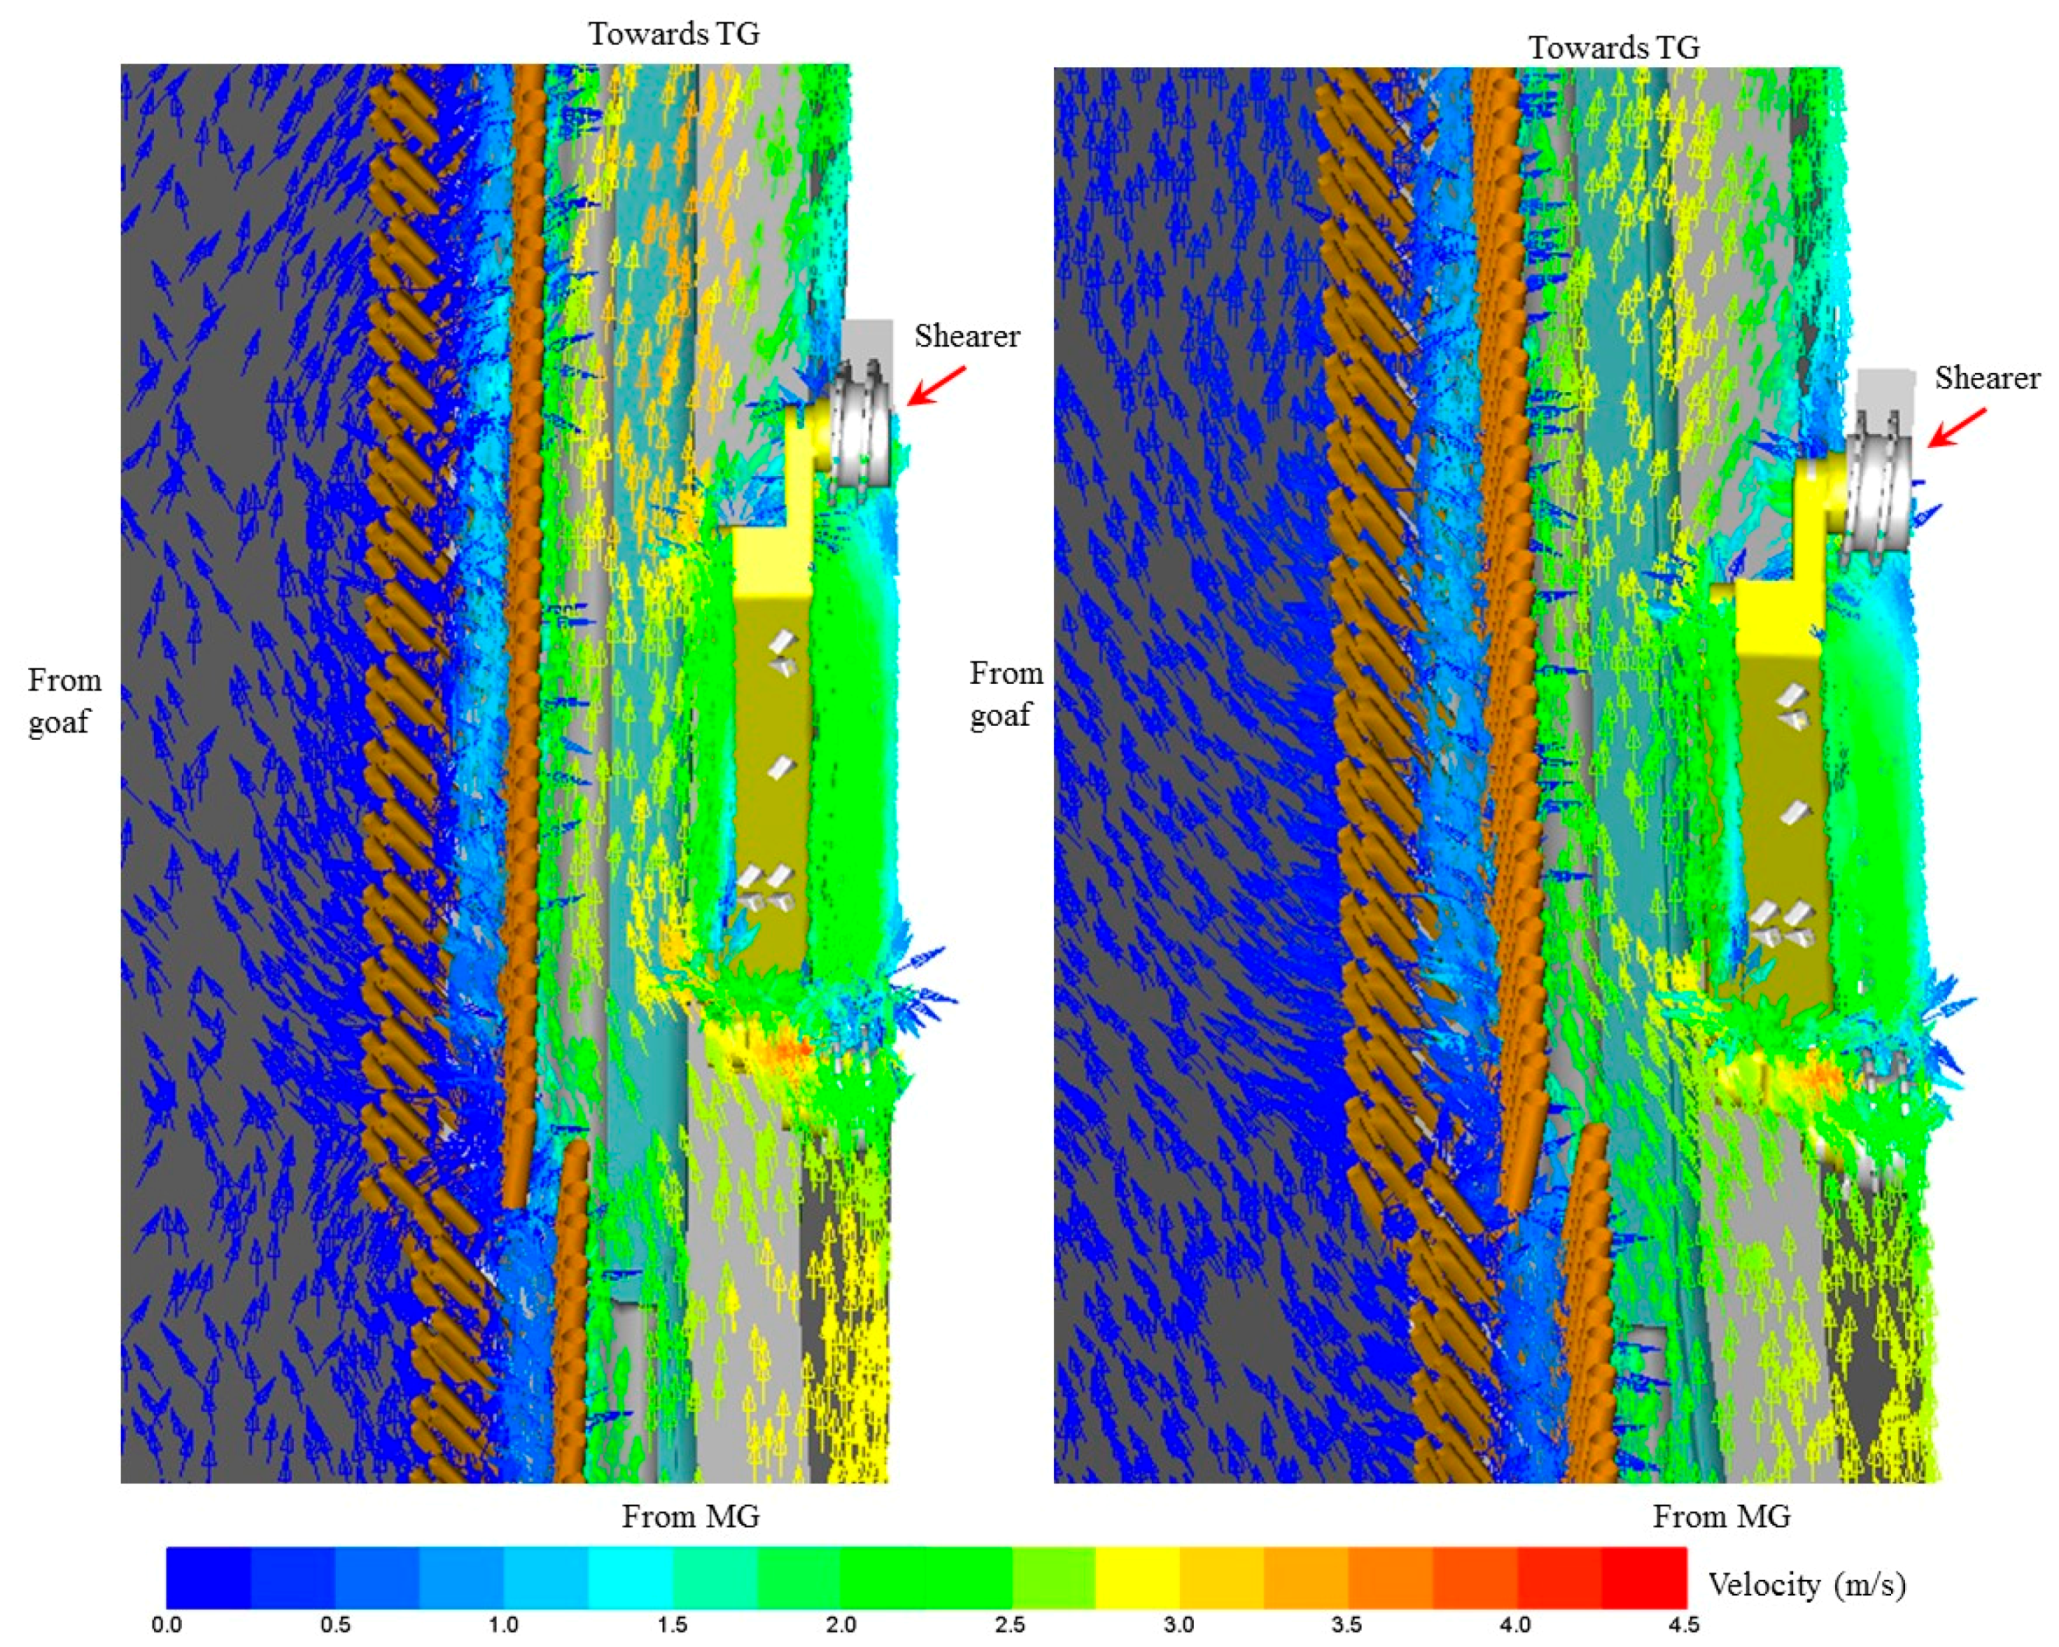
The velocity vectors around the shearer for both models are illustrated in Figure 10. As can be seen, the general flow patterns are different with that of the base model. Around the shearer, the flow shows a “C” shape pattern rather than the “S” shape as in the base model. This is because the impact of airflow separation vanishes as the air flows further along the face, and when the shearer reaches the middle or close to the TG, the air stream has been flowing straight along the face upstream of the shearer.
Flow behind the chocks is also different for all three models. In the base model, the leakage to goaf tries to flow back to the face (refer to Figure 7). In MG-TG Case 2, the main flow starts to penetrate into the goaf because of chocks movement and the obstruction of the shearer body. As the leaked airflow passes the shearer body, it flows back towards face. In MG-TG Case 3, the face ventilation has already started penetrating to the goaf upstream of the shearer body, and the ventilation leaked to the goaf flows straight towards the TG side instead of flowing back to the face as in the case of MG-TG Case 2. Therefore, the flow downstream of the shearer is less accelerated in MG-TG Case 3 as observed in Figure 9.
Figure 11 illustrates the velocity distribution along face in the walkway. The investigation line is 2 m above floor. Within the first 60 m of face, velocity fluctuates greatly between 1 m/s and 3.5 m/s because of ventilation leakage to goaf at MG side and the gradual return of goaf leakage to face, suggesting the air exchange between face and goaf mainly occurs within the first 60 m of face. Effective control measures (e.g., using MG curtains) are highly recommended at face entry to minimise ventilation leakage to goaf. After 60 m, velocity generally becomes stable at around 2.5 m/s unless disturbed by the shearer. The airflow velocity directly behind shearer in the walkway can increase up to 3.5 m/s and the increase can extend to around 15 to 20 m downstream of the shearer. Within 10 to 15 m from TG, airflow velocity starts to drop and decreases to below 0.5 m/s in about two thirds of the TG (the low velocity area can be more clearly seen in Figure 9b), creating a favourable environment for goaf gas accumulation which is a significant drawback of U ventilation system. When large amount of goaf gas emission is expected during longwall mining, strategies should be developed to eliminate the hazardous gas accumulation in that sluggish zone.
6.2. Impact of Cutting Sequence
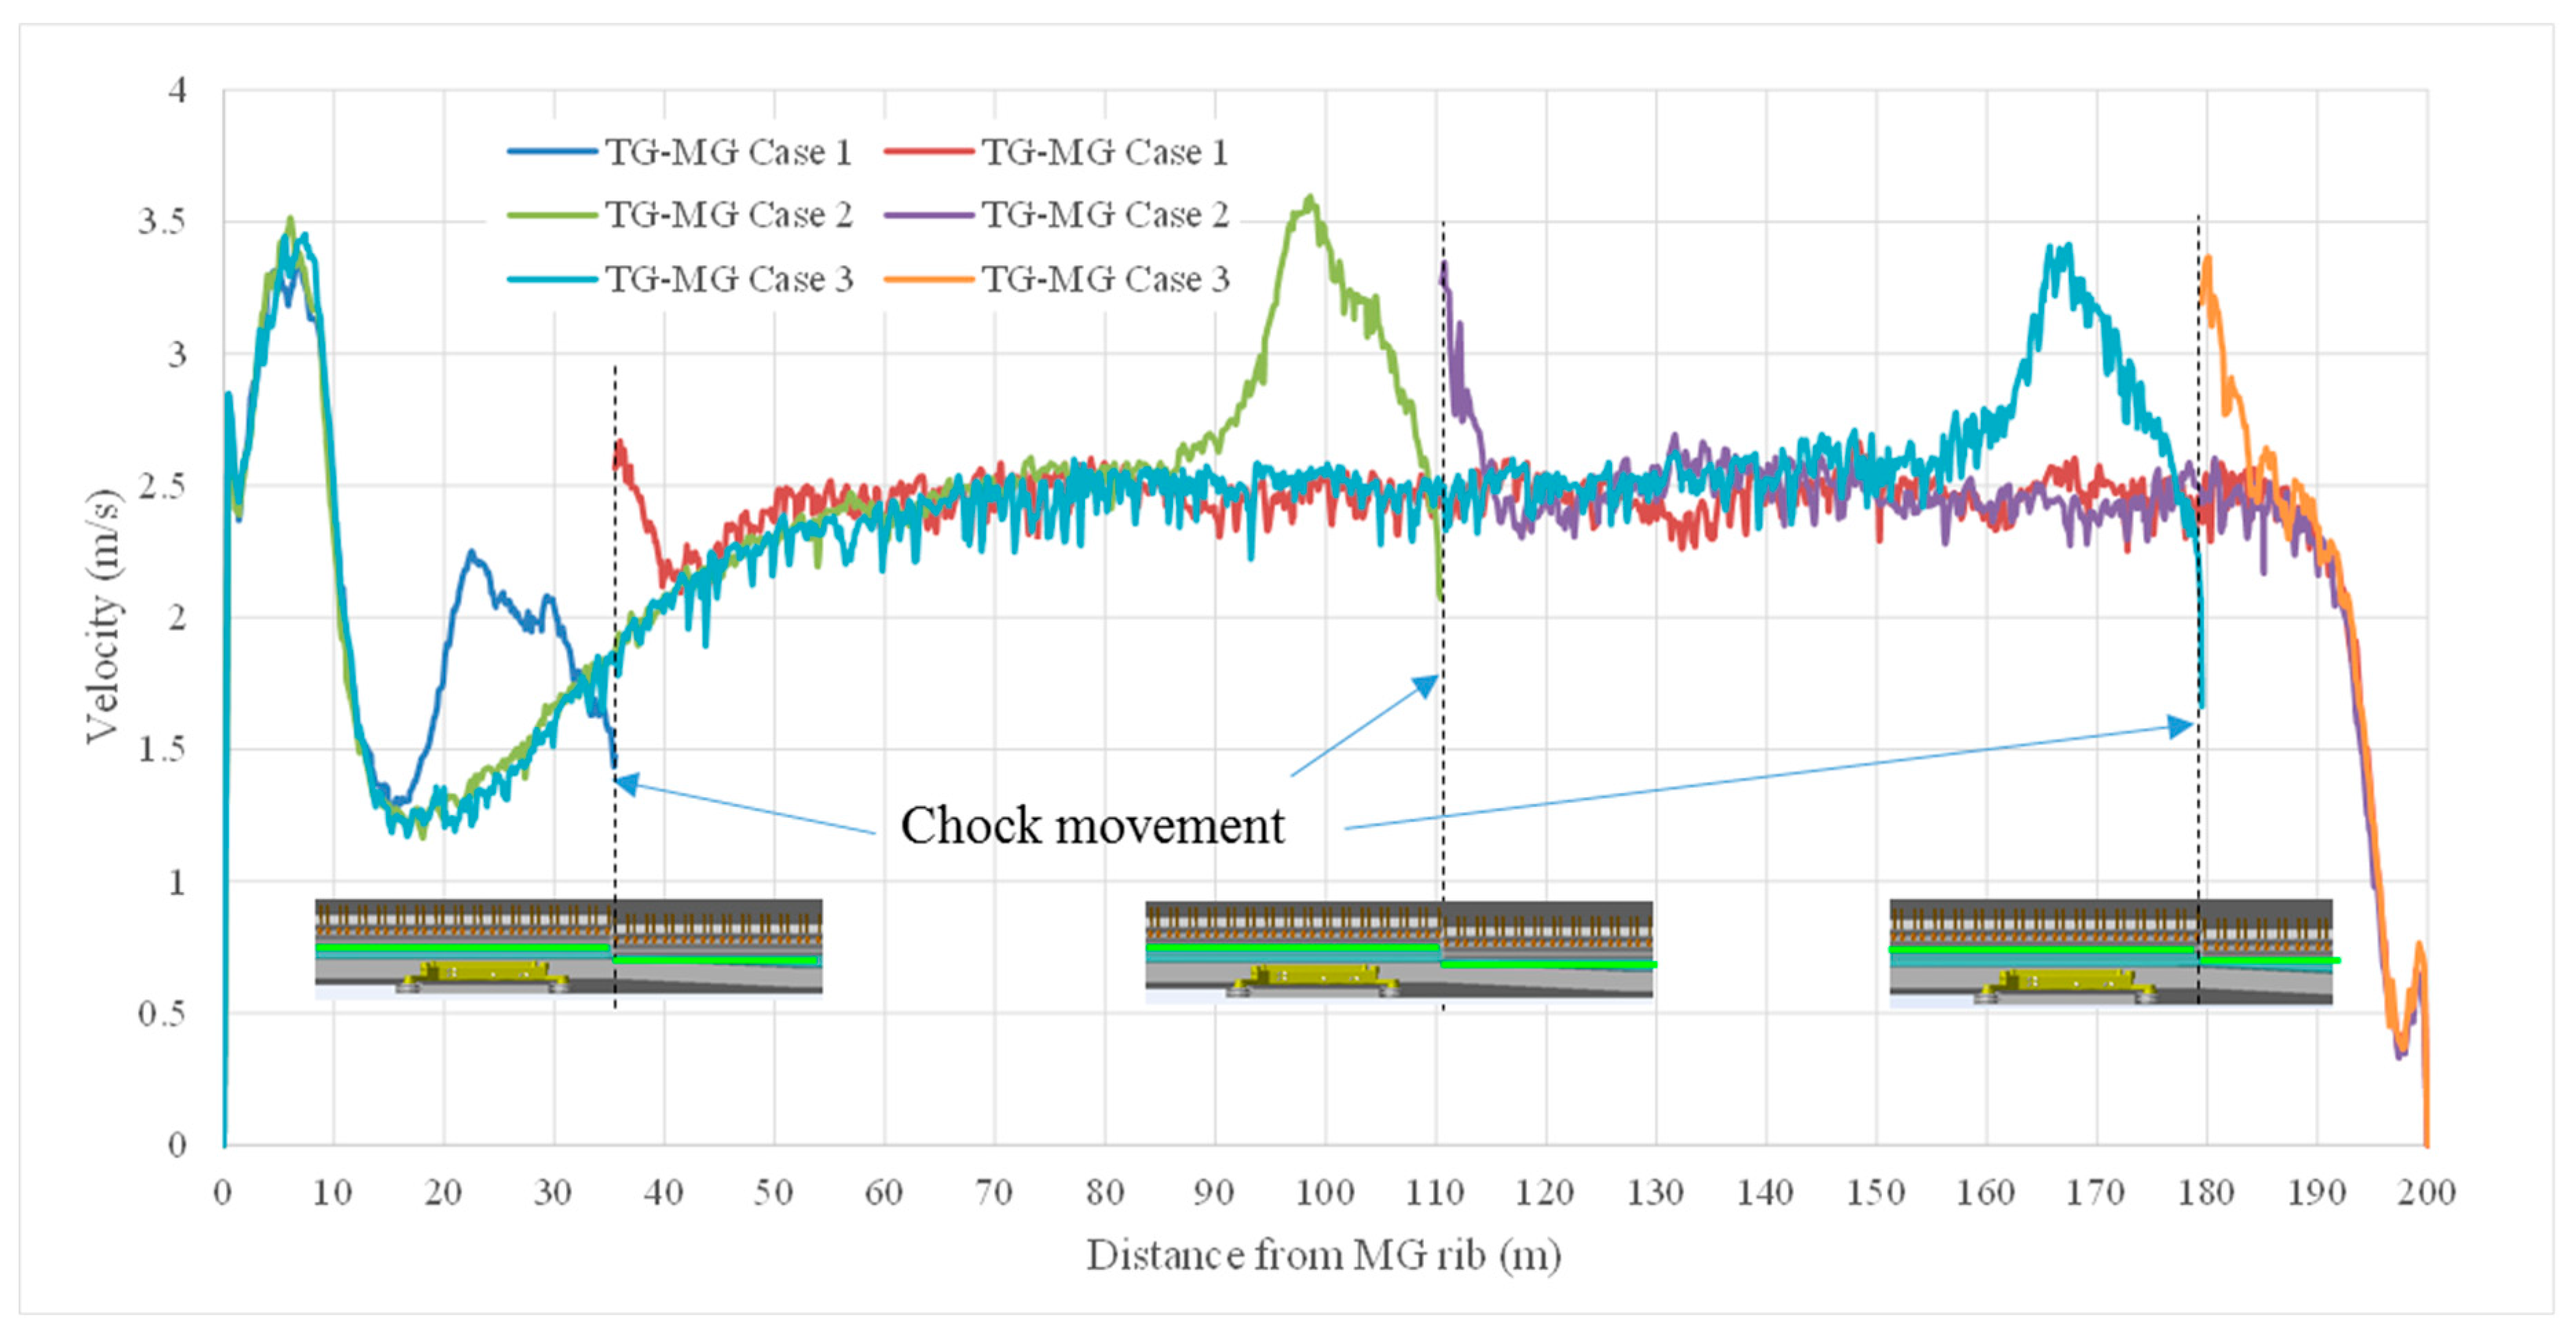
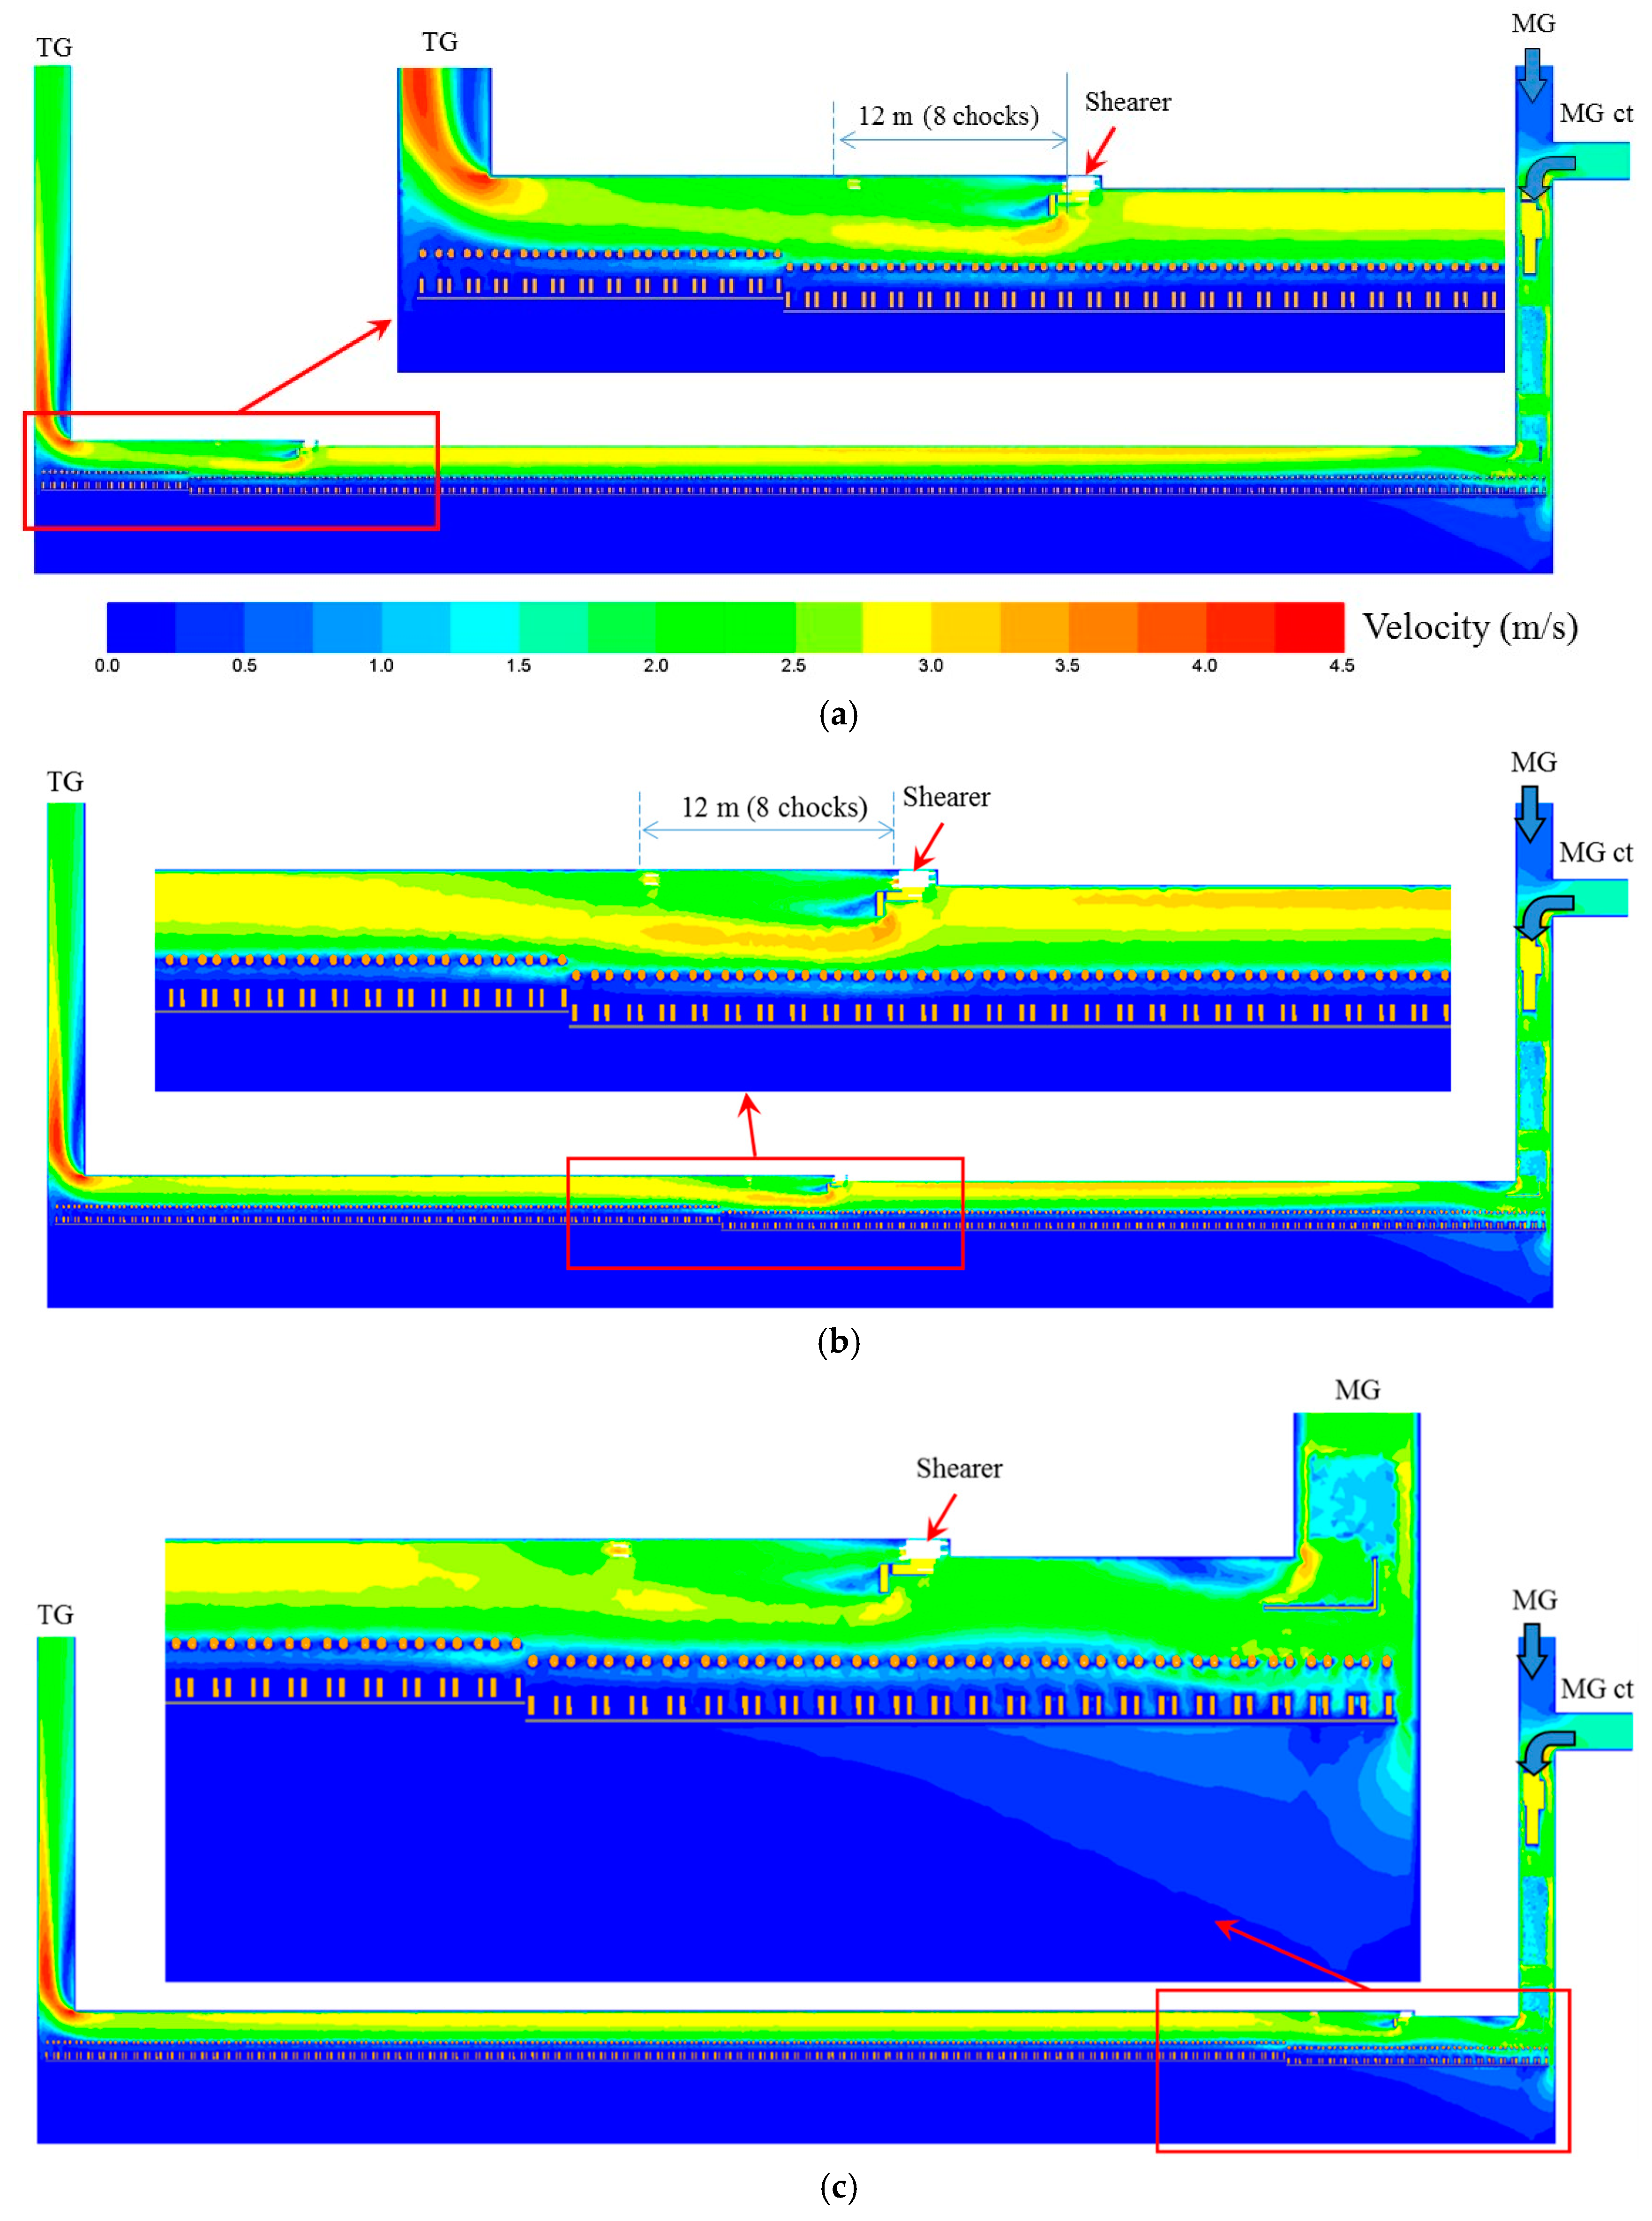
Figure 12 shows the velocity contour at 2 m above floor for the TG-MG pass models. As stated before, the overall flow patterns is similar to the base model results, except in the region around the shearer. In the TG-MG pass, the flow next to the shearer body is also accelerated but not as much as it is in the base model, especially in the area close to the ranging arm of the leading drum. It is noted that in the MG-TG pass models, the TG drum is the leading drum, whilst in the TG-MG pass models, the leading drum is the MG drum. As the flow passes the shearer, due to the obstruction of the leading drum and its ranging arm, the high velocity airflow near the face (about 3 m/s) is deflected to the walkway side, and the extent of shearer’s influence can be up to 12 m.
In the MG-TG pass where the flow is also deflected by the ranging arm of the leading drum (TG drum), the deflected flow can attach to the old face within a short distance downstream; while in the TG-MG pass, the deflected flow needs to travel a longer distance to be able to attach to the fresh face which is one web depth (0.8 m) further in the coal seam than the old face. Once the high velocity flow attaches to the face again, the disturbance of the shearer to the flow field comes to an end, and the flow gradually recovers to the state before it passes the shearer. For TG-MG Case 3, the high velocity flow near the face cannot recover until it reaches the TG as a result of increased air leakage to the goaf as the flow approaches the TG. In the TG-MG pass, it is noted that the advance of chocks behind the TG drum is favourable to air leakage to goaf, and the velocity can be as high as 1.6 m/s between the chocks’ legs.
The velocity distribution along the face for the TG-MG Cases are shown in Figure 13. The overall velocity changing trend is similar to those in the MG-TG pass models. Specifically, the velocity varies significantly between 1.2 and 3.5 m/s within the first 50 to 60 m where the air exchange between face and goaf mainly occurs. And the velocity in the rest of longwall face reaches stable at about 2.5 m/s unless disturbed by the shearer. The impact of shearer on the velocity distribution is slightly different with that in the MG-TG pass models. In the TG-MG pass, the extent of shearer induced velocity increase is smaller than that in the MG-TG pass. Velocity is also increased within about 3 to 5 m immediately behind the last advanced chock.
7. Conclusions
CFD longwall models were constructed to obtain thorough understandings of the ventilation flow characteristics on a typical longwall face of underground coal mines. The novel part of this study includes considering the impact of large dimensional longwall equipment and the actual mining conditions (i.e., the formation of goaf immediately behind face). The Standard turbulence model was used to perform the CFD calculations. Two meshing schemes with different mesh densities were used to investigate the mesh independence of the numerical solution. To validate the model results, velocity profiles at four cross sections were measured and then compared against the model predicted velocity values at the corresponding cross sections, through which a generally good agreement between the measured and modelled data was obtained.
The occurrence of flow separation at both intersections of MG/TG and face was identified by the model results. It generally occurs at places where the flow boundary changes sharply. The extent of separation is relatively small at face entry (about 4 m long) compared with the range of separation at the intersection of face and TG (about 14 m long). This is primarily caused by the difference in flow patterns at the two areas, i.e., there is serious ventilation leakage to goaf at face entry on MG side while ventilation from face and goaf converge at face end on TG side. These areas have the potential accumulation of hazardous gas and dust, thus control measures are recommended for operators to minimise its range of influence in the ventilation system.
Ventilation airflow velocity along the face is not evenly distributed. The overall ventilation flow patterns at face are similar among the six models. Regardless of shearer position and cutting sequence, airflow velocity varies greatly between 1 m/s and 3.5 m/s within about 60 m from MG, indicating the range of major air exchange between face and goaf. Beyond 60 m from MG, velocity generally keeps stable at about 2.5 m/s along the walkway except areas disturbed by the shearer. The shearer has significant impact on flow distribution in its vicinity, resulting in increased flow velocity behind it in the walkway and about 10 to 15 m of its downstream. The extent of shearer’s influence is slightly smaller in the TG-MG pass (the shearer length plus about 3 to 5 m of its downstream) than it in the MG-TG pass (the shearer length plus about 10 to 15 m of its downstream).
Model results also identified a sluggish air movement zone at the upper TG corner where velocity is typically below 0.8 m/s and is beneficial to goaf gas accumulation. Model results also imply that gas emission from face cutting is more likely to be accumulated in the recirculation zone caused by airflow separation in the TG. Therefore, routine gas monitoring should be conducted at these two places when high gas emission from both face and goaf is expected during longwall mining. And more attention should be paid at the separation zone in the TG if high gas emission from only working seam is encountered.
A general ventilation flow characteristics on a typical longwall face has been obtained using the CFD modelling approach. The six consecutive longwall models developed in this study together with the obtained ventilation flow characteristics will provide a fundamental basis for the investigation of longwall gas and dust issues in the future as well as the development of corresponding hazards prevention and control measures. It is worth noting that the general ventilation flow characteristics obtained in this study is applicable to longwall faces with similar ventilation system while the velocity magnitude will vary depending on ventilation flow rate provided and face geometries.
Author Contributions
Z.W. and T.R. came up with the idea of ventilation modelling incorporating key longwall equipment. Z.W. developed the longwall models and conducted analysis. Z.W. wrote the paper. T.R. and L.M. revised the paper. J.Z. helped to collect field ventilation data.
Acknowledgments
The authors acknowledge the support of Open Fund from the State Key Laboratory of Coal Resources and Safe Mining (SKLCRSM16KF10), China University of Mining & Technology. Thanks are due to the mine staff of Peabody Energy for providing the data and access to the underground for conducting field ventilation surveys and observations. The authors are also grateful to Bob Kininmnoth for providing language help in the preparation of the paper.
Conflicts of Interest
The authors declare no conflict of interest.
References
- Brodny, J.; Tutak, M.; Michalak, M. The Use of the TGŚP Module as a Database to Identify Breaks in the Work of Mining Machinery; Springer International Publishing: Cham, Switzerland, 2017; pp. 441–452. [Google Scholar]
- Brodny, J.; Tutak, M. Analysis of Methane Hazard Conditions in Mine Headings. Teh. Vjesn. 2018, 25, 271–276. [Google Scholar]
- Branny, M. Computer simulation of flow of air and methane mixture in the longwall-return crossing zone. Arch. Min. Sci. 2006, 51, 133–145. [Google Scholar]
- Felka, D.; Brodny, J. Application of Neural-Fuzzy System in Prediction of Methane Hazard. In International Conference on Intelligent Systems in Production Engineering and Maintenance; Springer: Berlin, Germany, 2017; pp. 151–160. [Google Scholar]
- Mine Safety and Health Administration. Report of Investigation: Fatal Underground Mine Explosion April 5, 2010; Upper Big Branch Mine-South, Performance Coal Company, Montcoal, Raleigh County, West Virginia: Naoma, WV, USA, 2011. [Google Scholar]
- Brodny, J. Determination of the zone endangered by methane explosion in goaf with caving of operating longwalls. In Proceedings of the 16th International Multidisciplinary Scientific GeoConference, Albena, Bulgaria, 30 June–6 July 2016; Volume 2, pp. 299–306. [Google Scholar]
- Royal Commission on the Pike River Coal Mine. Tragedy Report to the Governor General; Royal Commission on the Pike River Coal Mine: Wellington, New Zealand, 2012. [Google Scholar]
- Karacan, C.Ö.; Ruiz, F.A.; Cotè, M.; Phipps, S. Coal mine methane: A review of capture and utilization practices with benefits to mining safety and to greenhouse gas reduction. Int. J. Coal Geol. 2011, 86, 121–156. [Google Scholar] [CrossRef]
- McPherson, M.J. Subsurface Ventilation Engineering, 2nd ed.; Mine Ventilation Services, Inc.: Fresno, CA, USA, 2009. [Google Scholar]
- Belle, B. Real-time air velocity monitoring in mines—A quintessential design parameter for managing major mine health and safety hazards. In 13th Coal Operators’ Conference; Aziz, N., Ed.; University of Wollongong: Wollongong, Australia, 2013; pp. 184–198. [Google Scholar]
- Hartman, H.L.; Mutmansky, J.M.; Ramani, R.V.; Wang, Y.J. Mine Ventilation and Air Conditioning; Wiley: Hoboken, NJ, USA, 1997. [Google Scholar]
- Xu, G.; Huang, J.; Nie, B.; Chalmers, D.; Yang, Z. Calibration of Mine Ventilation Network Models Using the Non-Linear Optimization Algorithm. Energies 2018, 11, 31. [Google Scholar] [CrossRef]
- Tutak, M.; Brodny, J. Analysis of Influence of Goaf Sealing from Tailgate on the Methane Concentration at the Outlet from the Longwall. IOP Conf. Ser. Earth Environ. Sci. 2017, 95, 042025. [Google Scholar] [CrossRef]
- Kurnia, J.C.; Sasmito, A.P.; Mujumdar, A.S. Computational Study of Thermal Management in Underground Coal Mines: Effect of Operating Ventilation Parameters; Technical Report: Report No. M3TC TN-10-05; National University of Singapore: Singapore, 2012. [Google Scholar]
- Kurnia, J.C.; Sasmito, A.P.; Mujumdar, A.S. CFD simulation of methane dispersion and innovative methane management in underground mining faces. Appl. Math. Model. 2014, 38, 3467–3484. [Google Scholar] [CrossRef]
- Gao, J.; Liu, J.; Zhang, X. Simulation Study on the Influence of Permeability on Gas Migration in Gob. China Saf. Sci. J. 2010, 20, 9–14. [Google Scholar]
- Heerden, J.; Sullivan, P. The application of CFD for evaluation of dust suppression and auxiliary ventilation systems used with continuous miners. In Proceedings of the 6th US Mine Ventilation Symposium, Salt Lake City, UT, USA, 21–23 June 1993; pp. 293–297. [Google Scholar]
- Srinivasa, R.B. Design and Development of a Multi-Scrubber Dust Control System for Longwall Faces: Experimental and Modelling Studies. Ph.D. Thesis, University of Wollongong, Wollongong, Australia, 1993. [Google Scholar]
- Edwards, J.S.; Ren, T.; Jozefowicz, R. Using Computational Fluid Dynamics (CFD) to solve mine safety and health problems. In Proceedings of the APCOM XXV 1995 Conference, Brisbane, Australia, 9–14 July 1995. [Google Scholar]
- Oberholzer, D.R.J.W.; Meyer, C.F. The evaluation of heading ventilation systems through the use of computer simulations. In Proceedings of the 7th US Mine Ventilation Symposium, Lexington, KY, USA, 5–7 June 1995. [Google Scholar]
- Oberholzer, D.R.J.W.; Meyer, C.F. Computer modelling in the solution of continuous miner heading ventilation problems. In Proceedings of the APCOM XXV 1995 Conference, Brisbane, Australia, 9–14 July 1995. [Google Scholar]
- Moloney, K.W. An Analysis of Airflow Patterns in Auxiliary Ventilated Drivages. Ph.D. Thesis, University of Nottingham, Nottingham, UK, 1997. [Google Scholar]
- Moloney, K.W.; Lowndes, I.S.; Hargrave, G.K. Analysis of flow patterns in drivages with auxiliary ventilation. Trans. Inst. Min. Metall. Sect. A Min. Technol. 1999, 108, A17–A26. [Google Scholar]
- Moloney, K.W.; Lowndes, I.S. Comparison of measured underground air velocities and air flows simulated by computational fluid dynamics. Trans. Inst. Min. Metall. Sect. A Min. Technol. 1999, 108, A105–A114. [Google Scholar]
- Wala, M.A.; Yingling, J.C.; Zhang, J. Evaluation of the face ventilation systems for extended cuts with remotely operated mining machines using three-dimensional numerical simulations. In Proceedings of the SME Annual Meeting, Orlando, FL, USA, 9–11 March 1998. [Google Scholar]
- Wala, M.A.; Huang, P.G.; Brown, J.T. New approaches to mine-face ventilation. Min. Eng. 2003, 55, 25–30. [Google Scholar]
- Wala, M.A.; Vytla, S.; Taylor, C.D.; Huang, P.G. Mine face ventilation: A comparison of CFD results against benchmark experiments for the CFD code validation. Min. Eng. 2007, 59, 49–55. [Google Scholar]
- Balusu, R.; Tuffs, N.; Peace, R.; Xue, S. Longwall goaf gas drainage and control strategies for highly gassy mines. In Proceedings of the 8th Iternational Mine Ventilation Congress, Brisbane, Australia, 6–8 July 2005. [Google Scholar]
- Parra, M.T.; Villafruela, J.M.; Castro, F.; Mendez, C. Numerical and experimental analysis of different ventilation systems in deep mines. Build. Environ. 2006, 41, 87–93. [Google Scholar] [CrossRef]
- Hargreaves, D.M.; Lowndes, I.S. The computational modeling of the ventilation flows within a rapid development drivage. Tunn. Undergr. Space Technol. 2007, 22, 150–160. [Google Scholar] [CrossRef]
- Ren, T.; Balusu, R. Dust Control Technology Development for Longwall Faces—Shearer Scrubber Development; Australian Coal Association Research Program, Brisbane: Queensland, Australia, 2007; p. 58. [Google Scholar]
- Ren, T.; Balusu, R. Innovative CFD modelling to improve dust control in longwalls. In 8th Underground Coal Operators’ Conference; Aziz, N., Ed.; University of Wollongong: Wollongong, Australia, 2008; pp. 137–142. [Google Scholar]
- Ren, T.; Balusu, R. The use of CFD modelling as a tool for solving mining health and safety problems. In 10th Underground Coal Operators’ Conference; Aziz, N., Kininmonth, B., Nemcik, J., Eds.; University of Wollongong: Wollongong, Australia, 2010; pp. 339–349. [Google Scholar]
- Aminosadati, S.M.; Hooman, K. Numerical simulation of ventilation air flow in underground mine workings. In Proceedings of the 12th North American Mine Ventilation Symposium, Sparks, NV, USA, 9–11 June 2008; pp. 253–259. [Google Scholar]
- Toraño, J.; Torno, S.; Menendez, M.; Gent, M.; Velasco, J. Models of methane behaviour in auxiliary ventilation of underground coal mining. Int. J. Coal Geol. 2009, 80, 35–43. [Google Scholar] [CrossRef]
- Zheng, Y.; Tien, J.C. Simulation of longwall face methane distribution. In Proceedings of the SME Annual Meeting, Colorado, FL, USA, 22–25 February 2009. [Google Scholar]
- Krog, R.B.; Schatzel, S.J.; Garcia, F.; Marshall, J.K. Predicting methane emissions from wider longwall panels by analysis of emission contributors. In Proceedings of the 11th U.S./North American Mine Ventilation Symposium, Pennsylvania, PA, USA, 5–7 June 2006. [Google Scholar]
- Ndenguma, D.D. Computational Fluid Dynamics Model for Controlling Dust and Methane in Underground Coalmines. Master‘s Thesis, University of Pretoria, South Africa, 2010. [Google Scholar]
- Ren, T.; Wang, Z.; Plush, B.; Cooper, G.; Cook, A.; Karekal, S.; Yarlagadda, S. Improved Dust Control on Longwalls Using a New Water Mist Venturi System; Australian Coal Association Research Program, Brisbane: Queensland, Australia, 2012; p. 89. [Google Scholar]
- Ren, T.; Wang, Z.; Cooper, G. CFD modelling of ventilation and dust flow behaviour above an underground bin and the design of an innovative dust mitigation system. Tunn. Undergr. Space Technol. 2014, 41, 241–254. [Google Scholar] [CrossRef]
- Torno, S.; Toraño, J.; Ulecia, M.; Allende, C. Conventional and numerical models of blasting gas behaviour in auxiliary ventilation of mining headings. Tunn. Undergr. Space Technol. 2013, 34, 73–81. [Google Scholar] [CrossRef]
- Xu, G.; Luxbacher, K.D.; Ragab, S.; Schafrik, S. Development of a remote analysis method for underground ventilation systems using tracer gas and CFD in a simplified laboratory apparatus. Tunn. Undergr. Space Technol. 2013, 33, 1–11. [Google Scholar] [CrossRef]
- Xu, G.; Jong, E.C.; Luxbacher, K.D.; Ragab, S.A.; Karmis, M.E. Remote characterization of ventilation systems using tracer gas and CFD in an underground mine. Saf. Sci. 2015, 74, 140–149. [Google Scholar] [CrossRef]
- Sasmito, A.P.; Birgersson, E.; Ly, H.C.; Mujumdar, A.S. Some approaches to improve ventilation system in underground coal mines environment—A computational fluid dynamic study. Tunn. Undergr. Space Technol. 2013, 34, 82–95. [Google Scholar] [CrossRef]
- Kurnia, J.C.; Sasmito, A.P.; Mujumdar, A.S. Simulation of a novel intermittent ventilation system for underground mines. Tunn. Undergr. Space Technol. 2014, 42, 206–215. [Google Scholar] [CrossRef]
- Kurnia, J.C.; Sasmito, A.P.; Wong, W.Y.; Mujumdar, A.S. Prediction and innovative control strategies for oxygen and hazardous gases from diesel emission in underground mines. Sci. Total Environ. 2014, 481, 317–334. [Google Scholar] [CrossRef] [PubMed]
- Hurtado, J.P.; Acuña, E.I. CFD analysis of 58 Adit main fans parallel installation for the 2015–2019 underground developments of the new level mine project. Appl. Therm. Eng. 2015, 90, 1109–1118. [Google Scholar] [CrossRef]
- Gilmore, R.; Brune, J.; Marts, J.; Saki, S.; Bogin, G.; Grubb, J. Gob Ventilation Modeling on HPC Platforms using GPGPU/CPU Combinations. In Application of Computers and Operations Research in the Mineral Industry (APCOM 2015): Proceedings of the 37th International Symposium; Society for Mining Metallurgy: Fairbanks, AK, USA, 2015; pp. 904–910. [Google Scholar]
- Guo, H.; Todhunter, C.; Qu, Q.; Qin, Z. Longwall horizontal gas drainage through goaf pressure control. Int. J. Coal Geol. 2015, 150–151, 276–286. [Google Scholar] [CrossRef]
- Qin, Z.; Yuan, L.; Guo, H.; Qu, Q. Investigation of longwall goaf gas flows and borehole drainage performance by CFD simulation. Int. J. Coal Geol. 2015, 150–151, 51–63. [Google Scholar] [CrossRef]
- Kurnia, J.C.; Xu, P.; Sasmito, A.P. A novel concept of enhanced gas recovery strategy from ventilation air methane in underground coal mines—A computational investigation. J. Nat. Gas Sci. Eng. 2016, 35, 661–672. [Google Scholar] [CrossRef]
- Fang, Y.; Fan, J.; Kenneally, B.; Mooney, M. Air flow behavior and gas dispersion in the recirculation ventilation system of a twin-tunnel construction. Tunn. Undergr. Space Technol. 2016, 58, 30–39. [Google Scholar] [CrossRef]
- Cheng, J.; Li, S.; Zhang, F.; Zhao, C.; Yang, S.; Ghosh, A. CFD modelling of ventilation optimization for improving mine safety in longwall working faces. J. Loss Prev. Process Ind. 2016, 40, 285–297. [Google Scholar] [CrossRef] [Green Version]
- Li, M.; Aminossadati, S.M.; Wu, C. Numerical simulation of air ventilation in super-large underground developments. Tunn. Undergr. Space Technol. 2016, 52, 38–43. [Google Scholar] [CrossRef]
- Xia, Y.; Yang, D.; Hu, C.; Wu, C.; Han, J. Numerical simulation of ventilation and dust suppression system for open-type TBM tunneling work area. Tunn. Undergr. Space Technol. 2016, 56, 70–78. [Google Scholar] [CrossRef]
- Xu, G.; Luxbacher, K.D.; Ragab, S.; Xu, J.; Ding, X. Computational fluid dynamics applied to mining engineering: A review. Int. J. Min. Reclam. Environ. 2017, 31, 251–275. [Google Scholar] [CrossRef]
- Gou, Y.; Shi, X.; Zhou, J.; Qiu, X.; Chen, X. Characterization and Effects of the Shock Losses in a Parallel Fan Station in the Underground Mine. Energies 2017, 10, 785. [Google Scholar] [Green Version]
- Zhou, G.; Zhang, Q.; Bai, R.; Fan, T.; Wang, G. The diffusion behavior law of respirable dust at fully mechanized caving face in coal mine: CFD numerical simulation and engineering application. Process Saf. Environ. Prot. 2017, 106, 117–128. [Google Scholar] [CrossRef]
- Zhang, Q.; Zhou, G.; Qian, X.; Yuan, M.; Sun, Y.; Wang, D. Diffuse pollution characteristics of respirable dust in fully-mechanized mining face under various velocities based on CFD investigation. J. Clean. Prod. 2018, 184, 239–250. [Google Scholar] [CrossRef]
- Wang, H.; Cheng, W.; Sun, B.; Ma, Y. Effects of radial air flow quantity and location of an air curtain generator on dust pollution control at fully mechanized working face. Adv. Powder Technol. 2017, 28, 1780–1791. [Google Scholar] [CrossRef]
- Wang, H.; Nie, W.; Cheng, W.; Liu, Q.; Jin, H. Effects of air volume ratio parameters on air curtain dust suppression in a rock tunnel’s fully-mechanized working face. Adv. Powder Technol. 2018, 29, 230–244. [Google Scholar] [CrossRef]
- Yu, H.; Cheng, W.; Wang, H.; Peng, H.; Xie, Y. Formation mechanisms of a dust-removal air curtain in a fully-mechanized excavation face and an analysis of its dust-removal performances based on CFD and DEM. Adv. Powder Technol. 2017, 28, 2830–2847. [Google Scholar] [CrossRef]
- Geng, F.; Luo, G.; Zhou, F.; Zhao, P.; Ma, L.; Chai, H.; Zhang, T. Numerical investigation of dust dispersion in a coal roadway with hybrid ventilation system. Powder Technol. 2017, 313, 260–271. [Google Scholar] [CrossRef]
- Geng, F.; Luo, G.; Wang, Y.; Peng, Z.; Hu, S.; Zhang, T.; Chai, H. Dust dispersion in a coal roadway driven by a hybrid ventilation system: A numerical study. Process Saf. Environ. Prot. 2018, 113, 388–400. [Google Scholar] [CrossRef]
- Shi, G.; Liu, M.; Guo, Z.; Hu, F.; Wang, D. Unsteady simulation for optimal arrangement of dedusting airduct in coal mine heading face. J. Loss Prev. Process Ind. 2017, 46, 45–53. [Google Scholar] [CrossRef]
- Ren, T.; Edwards, J.S.; Jozefowicz, R.R. CFD modelling of methane flow around longwall coal faces. In Proceedings of the 6th International Mine Ventilation Congress, Pittsburgh, PA, USA, 17–22 May 1997. [Google Scholar]
- Ren, T.X.; Edwards, J.S. Three-dimensional computational fluid dynamics modelling of methane flow through permeable strata around a longwall face. Trans. Inst. Min. Metall. Sec. A Min. Ind. 2000, 109, 41–48. [Google Scholar] [CrossRef]
- Ren, T.; Wang, Z.; Liang, Y.; Zhang, J. Numerical investigation of CO2 fringe behaviour on a longwall face and its control. Int. J. Coal Geol. 2018, 186, 80–96. [Google Scholar] [CrossRef]
- ANSYS. ANSYS Fluent Theory Guide; ANSYS: Canonsburg, PA, USA, 2010. [Google Scholar]
- Wang, Z.; Ren, T.; Cheng, Y. Numerical investigations of methane flow characteristics on a longwall face Part I: Methane emission and base model results. J. Nat. Gas Sci. Eng. 2017, 43, 242–253. [Google Scholar] [CrossRef]
Figure 1.
The layout of an underground longwall face.

Figure 2.
Longwall model layout when shearer cuts towards TG: (a) Plan view of the longwall model (ct: cut through); (b) 3D view of the longwall model (ct: cut through); (c) Closer view around the shearer.
Figure 2.
Longwall model layout when shearer cuts towards TG: (a) Plan view of the longwall model (ct: cut through); (b) 3D view of the longwall model (ct: cut through); (c) Closer view around the shearer.

Figure 3.
Velocity profiles along the face in the walkway—2 m above floor.

Figure 4.
Velocity measurement positions on a cross section.
Figure 5.
Velocity contour at different levels above floor: (a) 1.5 m above floor (near the top of the shearer); (b) 2 m above floor; (c) 2.5 m above floor; (d) 3 m above floor.
Figure 5.
Velocity contour at different levels above floor: (a) 1.5 m above floor (near the top of the shearer); (b) 2 m above floor; (c) 2.5 m above floor; (d) 3 m above floor.


Figure 6.
Flow patterns at the intersection of MG/TG and face indicating airflow separation.

Figure 7.
3D view of airflow velocity vectors around the shearer for base model (Left: Near the top of the shearer; Right: 1 m above the shearer).
Figure 7.
3D view of airflow velocity vectors around the shearer for base model (Left: Near the top of the shearer; Right: 1 m above the shearer).

Figure 8.
Velocity distribution at different locations across the face—2 m above the floor.

Figure 9.
Velocity contour at 2 m above floor for MG-TG Case 2 and Case 3: (a) MG-TG Case 2; (b) MG-TG Case 3.
Figure 9.
Velocity contour at 2 m above floor for MG-TG Case 2 and Case 3: (a) MG-TG Case 2; (b) MG-TG Case 3.

Figure 10.
3D view of velocity vectors around the shearer (Left: MG-TG Case 2; Right: MG-TG Case 3).
Figure 10.
3D view of velocity vectors around the shearer (Left: MG-TG Case 2; Right: MG-TG Case 3).

Figure 11.
Velocity distribution along face for the MG-TG Cases.

Figure 12.
Velocity contour at 2 m above floor for TG-MG Cases: (a) TG-MG Case 3; (b) TG-MG Case 2; (c) TG-MG Case 1.
Figure 12.
Velocity contour at 2 m above floor for TG-MG Cases: (a) TG-MG Case 3; (b) TG-MG Case 2; (c) TG-MG Case 1.

Figure 13.
Velocity distribution along face for the TG-MG Cases.

Table 1.
Major underground coal mine explosion incidents after 2000.
| Country | Date | Coal Mine | Fatalities |
|---|---|---|---|
| China | 14 February 2005 | Sunjiawan, Haizhou shaft, Fuxin | 214 |
| USA | 2 June 2006 | Sago, West Virginia | 12 |
| Poland | 21 November 2006 | KWK Halemba, Ruda Śląska | 19 |
| Kazakhstan | 20 September 2006 | Lenina, Karaganda | 43 |
| Russia | 19 March 2007 | Ulyanovskaya, Kemerovo | 108 |
| Ukraine | 19 November 2007 | Zasyadko, Donetzk | 80 |
| Poland | 18 September 2009 | KWK Wujek (Śląsk), Ruda Śląska | 20 |
| USA | 5 April 2010 | Upper Big Branch, West Virginia | 29 |
| Russia | 8 May 2010 | Raspadskaya, Kemerovo Oblast | 66 |
| Turkey | 17 May 2010 | Karadon, Zonguldak | 30 |
| New Zealand | 19 November 2010 | Pike River Mine | 29 |
| Turkey | 13 May 2014 | Soma, Turkey | 301 |
| Ukraine | 4 March 2015 | Zasyadko, Donetzk | 33 |
| China | 30 October 2016 | Jinshangou, Chongqing | 33 |
Table 2.
The longwall model dimensions.
| Item | Unit/m | Item | Unit/m |
|---|---|---|---|
| Face length | 200 | MG/TG width | 5 |
| Face height | 3.5 | MG/TG height | 3.5 |
| Goaf depth | 10 | MG/TG length | 50 |
Table 3.
Reference names of the longwall models.
| Model Reference Name | Scenario |
|---|---|
| MG-TG Case 1 | Shearer is cutting towards TG and is located on MG side |
| MG-TG Case 2 | Shearer is cutting towards TG and is located at face middle |
| MG-TG Case 3 | Shearer is cutting towards TG and is located on TG side |
| TG-MG Case 1 | Shearer is cutting towards MG and is located on MG side |
| TG-MG Case 2 | Shearer is cutting towards MG and is located at face middle |
| TG-MG Case 3 | Shearer is cutting towards MG and is located on TG side |
Table 4.
Comparison between the measured and modelled velocity.
| Position | 1 | 2 | 3 | 4 | 5 | 6 | 7 | 8 | 9 | 10 |
|---|---|---|---|---|---|---|---|---|---|---|
| 1 m from MG | - | - | - | - | - | - | - | - | - | - |
| Measured (m/s) | 1.8 | 3.5 | 2.9 | 3.0 | 2.2 | 3.3 | 2.2 | 2.8 | 2.3 | 1.7 |
| Modelled (m/s) | 1.71 | 3.68 | 2.79 | 3.06 | 2.41 | 3.33 | 2.43 | 2.71 | 2.13 | 1.78 |
| Error (%) | −5.00 | 5.14 | −3.79 | 2.00 | 9.55 | 0.91 | 10.45 | −3.21 | −7.39 | 4.71 |
| 2 m before MG drum | - | - | - | - | - | - | - | - | - | - |
| Measured (m/s) | 2.5 | 3.0 | 1.9 | 2.0 | 2.2 | 1.6 | 1.2 | 2.6 | 1.5 | 1.0 |
| Modelled (m/s) | 2.61 | 2.95 | 2.05 | 2.17 | 2.36 | 1.55 | 1.25 | 2.53 | 1.38 | 0.95 |
| Error (%) | 4.40 | −1.67 | 7.89 | 8.50 | 7.27 | −3.13 | 4.17 | −2.69 | −8.00 | −5.00 |
| Shearer middle | - | - | - | - | - | - | - | - | - | |
| Measured (m/s) | 3.0 | - | 2.5 | 2.6 | 2.3 | 1.2 | 2.0 | 2.9 | 1.8 | 1.0 |
| Modelled (m/s) | 3.23 | - | 2.67 | 2.78 | 2.46 | 1.31 | 2.12 | 2.87 | 1.69 | 0.91 |
| Error (%) | 7.67 | - | 6.80 | 6.92 | 6.96 | 9.17 | 6.00 | −1.03 | −6.11 | −9.00 |
| 2 m behind TG drum | - | - | - | - | - | - | - | - | - | - |
| Measured (m/s) | 2.5 | 2.6 | 3.6 | 3.2 | 2.8 | 2.2 | 2.5 | 3.2 | 0.8 | 0.2 |
| Modelled (m/s) | 2.53 | 2.71 | 3.83 | 3.39 | 2.92 | 2.06 | 2.41 | 3.08 | 0.75 | 0.26 |
| Error (%) | 1.20 | 4.23 | 6.39 | 5.94 | 4.29 | −6.36 | −3.60 | −3.75 | −6.25 | 30.00 |
© 2018 by the authors. Licensee MDPI, Basel, Switzerland. This article is an open access article distributed under the terms and conditions of the Creative Commons Attribution (CC BY) license (http://creativecommons.org/licenses/by/4.0/).
Share and Cite
MDPI and ACS Style
Wang, Z.; Ren, T.; Ma, L.; Zhang, J. Investigations of Ventilation Airflow Characteristics on a Longwall Face—A Computational Approach. Energies 2018, 11, 1564. https://doi.org/10.3390/en11061564
AMA Style
Wang Z, Ren T, Ma L, Zhang J. Investigations of Ventilation Airflow Characteristics on a Longwall Face—A Computational Approach. Energies. 2018; 11(6):1564. https://doi.org/10.3390/en11061564
Chicago/Turabian StyleWang, Zhongwei, Ting Ren, Liqiang Ma, and Jian Zhang. 2018. "Investigations of Ventilation Airflow Characteristics on a Longwall Face—A Computational Approach" Energies 11, no. 6: 1564. https://doi.org/10.3390/en11061564
Note that from the first issue of 2016, this journal uses article numbers instead of page numbers. See further details here.