2. Research Methodology. Materials and Methods
Based on the results obtained in previous researches, revealed by the literature, the following objectives were set for the research:
Selection of the most representative types of projects for increasing the energy efficiency of the dwellings stock that can be achieved in the South-Muntenia region and their implementation scenarios;
Determining the type of project for increasing the energy efficiency of the dwellings stock that can be applied at the level of each county of South-Muntenia region on the basis of the life cycle cost related to the application of each project variant at regional level;
Determining the type of project to increase the energy efficiency of the dwellings stock that can be applied at regional level;
Establishing the optimal implementation scenario at regional level.
In order to achieve these objectives, a research methodology was developed that includes the following steps presented in
Figure 2.
1. Choosing the most suitable development region for research on projects for increasing the energy efficiency of the dwelling stock. The South-Muntenia region was chosen for this research because all its counties are located in the same climatic zone (Romania’s climate zone II), which will allow for a unitary appreciation of the effects of projects for increasing the energy efficiency of the dwelling stock. The region has seven counties (Argeş, Călăraşi, Dâmboviţa, Giurgiu, Ialomiţa, Prahova and Teleorman). In each of them, the effects of the projects for increasing the energy efficiency of the dwellings stock were studied.
2. Establishing the typology of projects for increasing the energy efficiency of the dwellings stock. Eight types of projects for increasing the energy efficiency of the dwelling stock in Romania have been considered.
The reference building chosen for the dwelling stock energy efficiency projects is one in which the space heating is done by a central installation with vertical columns connected to the district heating system. The cooling is done with split equipment. Hot water is supplied by a local thermal power point and electricity is provided through the public network. From the point of view of the geometry of the reference building, the total envelope comprises opaque and transparent vertical elements, adjacent to the natural environment, the terrace, the floor above the technical basement, the wall to the staircase.
The building is ground floor plus five floors, 25.8 m long, 14.8 m wide and 16.76 m high and the surface/volume ratio is 0.422 m
2/m
3. The ratio between the glazed surface and the total building envelope is: South—4.89%; East—2.40%; North—4.89%; West—2.40%. The use of the building is equivalent to the building block proposed in
Appendix A (
Table A1) of Directive 2010/31/EU and the average heat input from the occupants is 6.10 W/m
2. The specific electrical power of the lighting system is 5.08 W/m
2 and the equipment is 10.5 W/m
2. The average U value of the walls is 1.521 W/m
2K, the roof is 0.917 W/m
2K, the basement is 2.624 W/m
2K and the windows is 2.739 W/m
2K. For thermal bridges the total length is 669.88 m and the average linear thermal transmission is 0.215 W/m
2K. The recording temperature is 20–24 °C in winter and 22–27 °C in the summer. Moisture humidity is 60% both in summer and winter. The program is: occupancy—24 h/day, lighting—8 h/day, heating system—24 h/day, cooling system 0.35 h/average hot season. Infiltration rate (air exchanges per hour) is 0.65. The energy requirement for the reference building was determined taking into account: the energy required for heating, the energy required for cooling, the energy required for domestic hot water, the energy required for humidification-dehumidification, the energy use for ventilation, the energy use for indoor lighting, other energy use (for home appliances, external lighting, auxiliary systems, etc.).
The calculation method used is dynamic simulation—a model for hourly time calculation, evaluation of the natural thermal regime and necessary utilities in thermal comfort regime. The primary energy conversion factors used were: district heating—0.92; cogeneration electricity—2.62. For the reference building, consideration was also given to the possibility of generating energy on site: heat from renewable sources, electricity generated in the building and used on-site, electricity generated in the building and used on the market.
Project 1 (P1) is the reference building in its current state. For this project, the building’s energy needs include heating and cooling energy, domestic hot water, energy use for indoor lighting and other household appliances, outdoor lighting and auxiliary systems. Project P1 does not include energy used for humidification-dehumidification nor for ventilation. P1 also does not include on-site power generation.
Project 2 (P2) is the reference building with organized natural ventilation, used in the hot season, economical lighting. For this project, the building’s energy needs include heating and cooling energy, domestic hot water, energy used for indoor lighting and other energy used for home appliances, auxiliary systems. No energy used for humidification and de-humidification, nor for ventilation is achieved in this project. Project P2 does not involve power generation on site. Organized natural ventilation is a controlled movement between outdoor and indoor air, due to fresh air entering the door and window joints, as well as through the pores of the materials from which the walls of a building are made, so without the provision of special devices for the purpose of air circulation organized ventilation. The specific electrical power of the lighting system is 1.02 W/m2 and the equipment is 10.5 W/m2. The program is: occupancy—24 h/day, lighting—8 h/day, heating system—24 h/day, cooling system 0.07 h/average hot season. Infiltration rate (air exchanges per hour) is 0.65.
Project 3 (P3) is the reference building under the Romanian normative without shutters. For this project, the energy needs of the building include heating and cooling, domestic hot water, energy for indoor lighting and other energy use (especially for home equipment). This project does not involve generating energy on site. The specific electrical power of the lighting system is 1.02 W/m2 and the equipment is 10.5 W/m2. The average U value of the walls is 0.557 W/m2K, the roof is 0.197 W/m2K, the basement is 0.352 W/m2K and the windows is 1.349 W/m2K. For thermal bridges the total length is 669.88 m and the average linear thermal transmission is 0.195 W/m2K. The program is: occupancy—24 h/day, lighting—8 h/day, heating system—24 h/day, cooling system 0.07 h/average hot season.
Project 4 (P4) is the reference building equipped with heat recovery and shutters. The energy needs of the building include: heating energy, cooling energy, domestic hot water, energy used for ventilation, energy for indoor lighting and other energy use (especially for home appliances). Project P4 does not include energy used for humidification and de-humidification in determining the energy demand of the building. This project does not have the effect of generating energy on site. The specific electrical power of the lighting system is 1.02 W/m2 and the equipment is 10.5 W/m2. The average U value of the walls is 0.557 W/m2K, the roof is 0.197 W/m2K, the basement is 0.352 W/m2K and the windows is 0.978 W/m2K. For thermal bridges the total length is 669.88 m and the average linear thermal transmission is 0.195 W/m2K. The program is: occupancy—24 h/day, lighting—8 h/day, heating system—24 h/day, cooling system 0.07 h/average hot season.
Project 5 (P5) is the reference building equipped with heat recovery, shutters, solar panels and photovoltaic panels. The energy requirement of the reference building resulting from this project includes: energy required for heating and cooling, domestic hot water, energy for ventilation, energy for indoor lighting and other energy used (especially for home appliances). In determining the energy requirement, energy used for humidification and dehumidification was not included. This project includes the generation of onsite energy by thermal energy from renewable sources (solar collectors) and electrical energy generated in the building and used on site. The specific electrical power of the lighting system is 1.02 W/m2 and the equipment is 10.5 W/m2. The average U value of the walls is 0.557 W/m2K, the roof is 0.197 W/m2K, the basement is 0.352 W/m2K and the windows is 0.978 W/m2K. For thermal bridges the total length is 669.88 m and the average linear thermal transmission is 0.195 W/m2K. The program is: occupancy—24 h/day, lighting—8 h/day, heating system—24 h/day, cooling system 0.07 h/average hot season. Infiltration rate (air exchanges per hour) is 0.05.
Project 6 (P6) is a modernized building with natural ventilation and summer blinds. Following the implementation of this project, the energy requirements of the reference building include only energy used for heating, cooling, domestic hot water. This energy efficiency improvement project does not involve generating energy on site. The modernized building is the one where other works of rehabilitation of structural and non-structural elements (wall repairs, finishing, re-partitioning) have been carried out besides those strictly related to energy efficiency projects but have an impact on them. The specific electrical power of the lighting system is 1.02 W/m2 and the equipment is 10.5 W/m2. The average U value of the walls is 0.396 W/m2K, the roof is 0.197 W/m2K, the basement is 0.351 W/m2K and the windows is 0.978 W/m2K. For thermal bridges the total length is 669.88 m and the average linear thermal transmission is 0.115 W/m2K. The program is: occupancy—24 h/day, lighting—8 h/day, heating system—24 h/day, cooling system 0.05 h/average hot season. Infiltration rate (air exchanges per hour) is 0.05.
Project 7 (P7) is the modernized building with summer blinds, shutters and heat recovery. As a result of the implementation of this project, the energy needs of the reference building include the energy required for heating and cooling, domestic hot water, ventilation energy consumption, energy for indoor lighting and other energy used (especially for home appliances and other auxiliary systems). Project P7 does not have the effect of generating energy on site. The specific electrical power of the lighting system is 1.02 W/m2 and the equipment is 10.5 W/m2. The average U value of the walls is 0.396 W/m2K, the roof is 0.197 W/m2K, the basement is 0.351 W/m2K and the windows is 0.827 W/m2K. For thermal bridges the total length is 669.88 m and the average linear thermal transmission is 0.115 W/m2K. The program is: occupancy—24 h/day, lighting—8 h/day, heating system—24 h/day, cooling system 0.05 h/average hot season. Infiltration rate (air exchanges per hour) is 0.05.
Project 8 (P8) is the modernized building with summer blinds, equipped with shutters and heat recovery solar panels and photovoltaic panels. The energy requirement of the reference building resulting from this project includes: energy required for heating and cooling, domestic hot water, ventilation energy consumption, energy for indoor lighting and other energy used (for outdoor lighting, home appliances and other auxiliary systems). The implementation of the P8 project would have the effect of generating on site energy as heat from renewable sources (solar collectors) and electricity generated in the building and used on site. The specific electrical power of the lighting system is 1.02 W/m2 and the equipment is 10.5 W/m2. The average U value of the walls is 0.396 W/m2K, the roof is 0.197 W/m2K, the basement is 0.351 W/m2K and the windows is 0.827 W/m2K. For thermal bridges the total length is 669.88 m and the average linear thermal transmission is 0.115 W/m2K. The program is: occupancy—24 h/day, lighting—8 h/day, heating system—24 h/day, cooling system 0.05 h/average hot season. Infiltration rate (air exchanges per hour) is 0.05.
A summary of the characteristics of each energy efficiency project in the South-Muntenia region is presented in
Table 1.
3. Establishing scenarios for the implementation of projects to increase energy efficiency of the dwellings stock. Taking into account the objectives of the national strategy [7], three scenarios of analysis were established:
- (a)
A minimum scenario, corresponding to the minimum targets of the national strategy in the field, which implies the thermal rehabilitation of 1% of the dwellings stock per year until 2050;
- (b)
An average scenario involving the thermal rehabilitation of 2% of the dwellings stock per year by 2050;
- (c)
A maximum scenario involving the thermal rehabilitation of 3% of the dwellings stock per year over the same period.
The rehabilitation rate for each scenario has been determined taking into account the built-up area of the dwellings stock at regional level published by the National Institute of Statistics in Romania. The propagation of the rehabilitation rate was calculated by determining the product between the rehabilitation rate and the area built at county and regional level.
The scenarios chosen, according to the objectives of the national strategy, may seem optimistic but the economic growth in 2017 at national level was 7%, in 2016 it was 5% and in 2015 was 4%. According to the National Forecast Commission, economic growth will be 6.1% in 2018 and the trend will continue in the coming period. The volume of work on energy efficiency projects in buildings follows the trend of GDP growth at national level. This is explained by the many sources of funding: European funds dedicated to this area, national programs in the field, local and private funding. Even if the trend of economic growth slows, this area will be less affected as it will only reduce private contribution but national or European funding sources.
4. Determining the implementation cost for each project type for increasing the energy efficiency of the dwellings stock. The implementation cost for each project variant was expressed in euro/m2. The implementation cost for each project included costs for each category of works provided in national costing standards at the time of the research methodology.
5. Determining the operating cost for each project type for increasing the energy efficiency of the dwellings stock. The operating cost for each variant was determined based on the cost of maintenance and the cost of energy (expressed in euro/m2/year).
The cost of maintenance included: the cost of maintaining the heating/cooling system, the cost of maintaining the solar panels, the costs of changing bulbs. The cost of energy was determined taking into account the energy billing tariff, the electricity tariffs delivered by the final suppliers to the final consumers who did not exercise their eligibility right and the reactive energy prices.
6. Calculation of the area rehabilitated annually for each scenario and for each county of the South-Muntenia region. The calculation of the area rehabilitated annually was done taking into account the thermal rehabilitation rate for each scenario.
7.
LCC determination for each energy efficiency project variant. The calculation was made for each type of project in all counties:
where:
LCCpc—the lifetime cost of the project “p” to increase the energy efficiency of the dwellings stock in the county “c”;
Cih—the cost of implementing the project “p” to increase the energy efficiency of the dwellings stock in the county “c” in year “h”;
Ceh—the energy cost related to the year “h” of exploitation of the project “p” to increase the energy efficiency of the dwellings stock in county “c
Cmh—the maintenance cost of the year “h” of exploitation of the project “p” to increase the energy efficiency of the dwellings stock in county “c”.
Crh—the replacement cost of the year “h” of exploitation of the project “p” to increase the energy efficiency of the dwellings stock in county “c”.
Cdh—the removal and final disposal cost of the year “h” of the project “p” to increase the energy efficiency of the dwellings stock in county “c”.
a—the discount rate. A discount rate of 5% was chosen to perform the calculations.
The discount rate was chosen taking into account: the nationally recommended discount rate for national energy efficiency investment projects for the 2014–2020 period, the evolution of the interest rate, the inflation rate and the risks associated with this type of projects on a long-term exploitation period of 30 years.
The chosen period for LCC determination was 30 years, from the perspective of the 2050 targets according to the national strategy. According to Romanian design codes, the lifetime of residential residential buildings is between 50 and 100 years. The choice of the 30-year period for the calculations is explained by the fact that the dwelling stock at the regional level consists of 80% of the existing dwellings built at least 50 years ago. At regional level, 31% of the dwelling stock was built before 1961, 19% was built between 1961–1970, 23% were built between 1970 and 1980 and 14% between 1981 and 1989.
8. Centralization of the results obtained in the LCC calculation for each research project and for each county for all three scenarios. Establishing the optimal regional portfolio. The centralization of the results is aimed to facilitate the choice of the optimal project option for increasing the energy efficiency of the dwellings stock at county level and creating the optimal portfolio of projects increasing the energy efficiency of the dwellings stock at regional level.
The optimal regional portfolio will be the one that will have the minimum lifecycle cost. It will include the sum of lifetime cost of projects with minimum LCC for all counties:
where
LCCro is the the optimal life cycle cost at a regional level (corresponding to the optimal portfolio of projects) to increase the energy efficiency of the housing fund at regional level.
9. Choosing the optimal regional scenario. The optimal scenario is the one whose cost-optimal regional life cycle is minimal. For this purpose, the LCCro values will be compared for the scenarios considered and the scenario for which the LCCro is the lowest will be chosen.
3. Results
3.1. Preliminary Results
The research carried out had as initial results the determination of the energy requirement for the reference building in the case of the implementation of each of the eight studied projects, the calculation of the cost related to the implementation of the eight projects for increasing the energy efficiency of the dwelling stock, the determination of the operating cost of the reference building for the eight project variants and the calculation of the area rehabilitated annually in each scenario for each county of the South-Muntenia region. Based on these results LCC was determined for each of the eight projects to increase the energy efficiency of the dwellings stock in each county of the region. By selecting projects with the lowest LCC in each county for each scenario, LCCro could be determined for the optimal portfolio of projects for increasing the energy efficiency of the dwelling stock in the South-Muntenia Region.
The energy requirement for the reference building for the implementation of each type of project is presented in
Figure 3. This table also presents the primary energy requirement compared to the reference building.
The P1 project, which represents the reference building at its current stage, has the highest energy requirement. Project P2 has a primary energy requirement relatively close to the reference building at its current stage (only 9% lower than the reference building). Projects P3, P4, P6 and P7 have a primary energy requirement of about half that of the reference building at the current stage (P1 project).
This situation can be explained by analyzing the data presented in
Figure 4 because the energy used in heating for these projects is much lower compared to the reference building. Also, the energy used for hot water in these projects has considerably lower values than the reference building. The big differences between the P1 project and the other projects mentioned above stem from the higher endowment of these projects with equipment that leads to lower energy consumption (heat recovery, shutters, solar panels and photovoltaic panels).
The P7 and P8 projects have the lowest primary energy requirement (15.42% and 12.51% of the reference building’s energy requirement) because they benefit from solar relay and photovoltaic panels.
Figure 4 shows the energy used for heating, cooling, ventilation, hot water and lighting as a result of implementing each type of project. For all projects the highest share in energy used is the energy used for heating and hot water. The highest energy use for P1, P2, P3 projects is for heating. For projects P4, P5, P6, P7, P8 the highest share in energy used has the energy used for hot water. In most projects, the energy used for cooling has a very low share in total consumption.
Table 2 presents the cost of implementing the eight project variants to increase the energy efficiency of the dwelling stock. The cost of implementing projects covers all the work needed for installing the main units and also the cost needed for adapting the system to an existing building. The P1 project involves a zero implementation cost as it represents the reference building at the current stage. Since it is only a minimal upgrade version of the reference building at the current stage, the P2 project has a very low implementation cost. The most significant implementation costs are those for P5 and P8 projects, since for these projects the investment expenditures with the additional endowments are the highest of all the costs of implementing the projects for increasing the energy efficiency of the dwellings stock.
The costs of other energy efficiency improvement projects of the dwelling stock are either half the cost of project P5 (P7 project case) or one quarter of the project cost P5 (P3 project case). These projects represent modernization options involving investments in additional facilities as important as the P5 and P8 projects.
The operating costs of the reference building following the implementation of the energy efficiency improvement projects are presented in
Table 3. The highest operating costs are those for the P1 project—the reference building at the current stage. Although they are the lowest energy cost variants, the P5 and P8 projects have the highest operating costs compared to the P1 and P2 projects (the current reference building) as the cost of maintenance is very high.
Projects P3, P4, P6 and P7 have lower operating costs than projects P5 and P8, although they are at a disadvantage in terms of energy costs. The cost of maintenance for the implementation of these projects is much lower—almost half that of the P5 and P8 projects—which leads to a much lower operating cost.
Maintenance costs are based on the specificity of each type of project: the heating/cooling maintenance costs; the cost of solar panels maintenance; the cost of changing incandescent and economical bulbs. For incandescent bulbs there were 2 replacements per year, and for the economic one a two-year replacement. Project P1 has the higher maintenance cost because the size of annual maintenance works will be higher than other projects as this project does not involve any investment. Projects P5 and P8, as the cost of solar panels maintenance is the case.
For each project, a replacement of the equipment was foreseen over the 30 years analyzed (replacement of the equipment is done for each project after the 15th year of operation). Replacement costs for each project, in euro/m
2 are shown in
Figure 5. The projects with the highest replacement costs are P5 and P8 projects because these projects involve the highest initial investment in equipment.
Figure 6 shows removal and final disposal costs. The projects with the highest removal and final disposal costs are the P8 and P5 projects, followed by the P7 project. These projects involve significant costs for decommissioning and transporting installations and equipment in relation to the other projects under consideration. Projects P1 and P2 require minimum removal and final disposal costs because initial investment in equipment is very low.
Table 4 shows the areas rehabilitated annually in each scenario for each county of the South-Muntenia region. The calculations were based on data from the National Institute of Statistics on the surface of the dwellings in the South-Muntenia region. At the regional level, in each of the three scenarios considered, the counties Arges, Dâmboviţa and Prahova hold the most important shares of the existing surface of the existing dwellings.
In the minimal scenario, energy efficiency projects will include nearly one-third of the surface area of dwellings by 2050, and in the maximum scenario, energy efficiency projects will cover the entire surface of dwellings by 2050.
The evolution of the dwellings area rehabilitated annually in each scenario is shown in
Figure 7. After 10 years in the minimum scenario, 10% of the area of dwellings in the South-Muntenia Region will be rehabilitated and 30% of the same area will be rehabilitated in the maximum scenario. At the end of the analyzed period, after 30 years, the majority of the building area will be rehabilitated in the maximum scenario and one third of the area in the minimal scenario.
3.2. LCC for Implementing Energy Efficiency Projects at Regional Level
LCC for each project variant in each county (and each scenario) and
LCCro values for each scenario are presented in
Figure 8,
Figure 9,
Figure 10,
Figure 11,
Figure 12 and
Figure 13.The LCC determination for each project in each county was carried out for a period of 30 years, in the perspective of 2050.
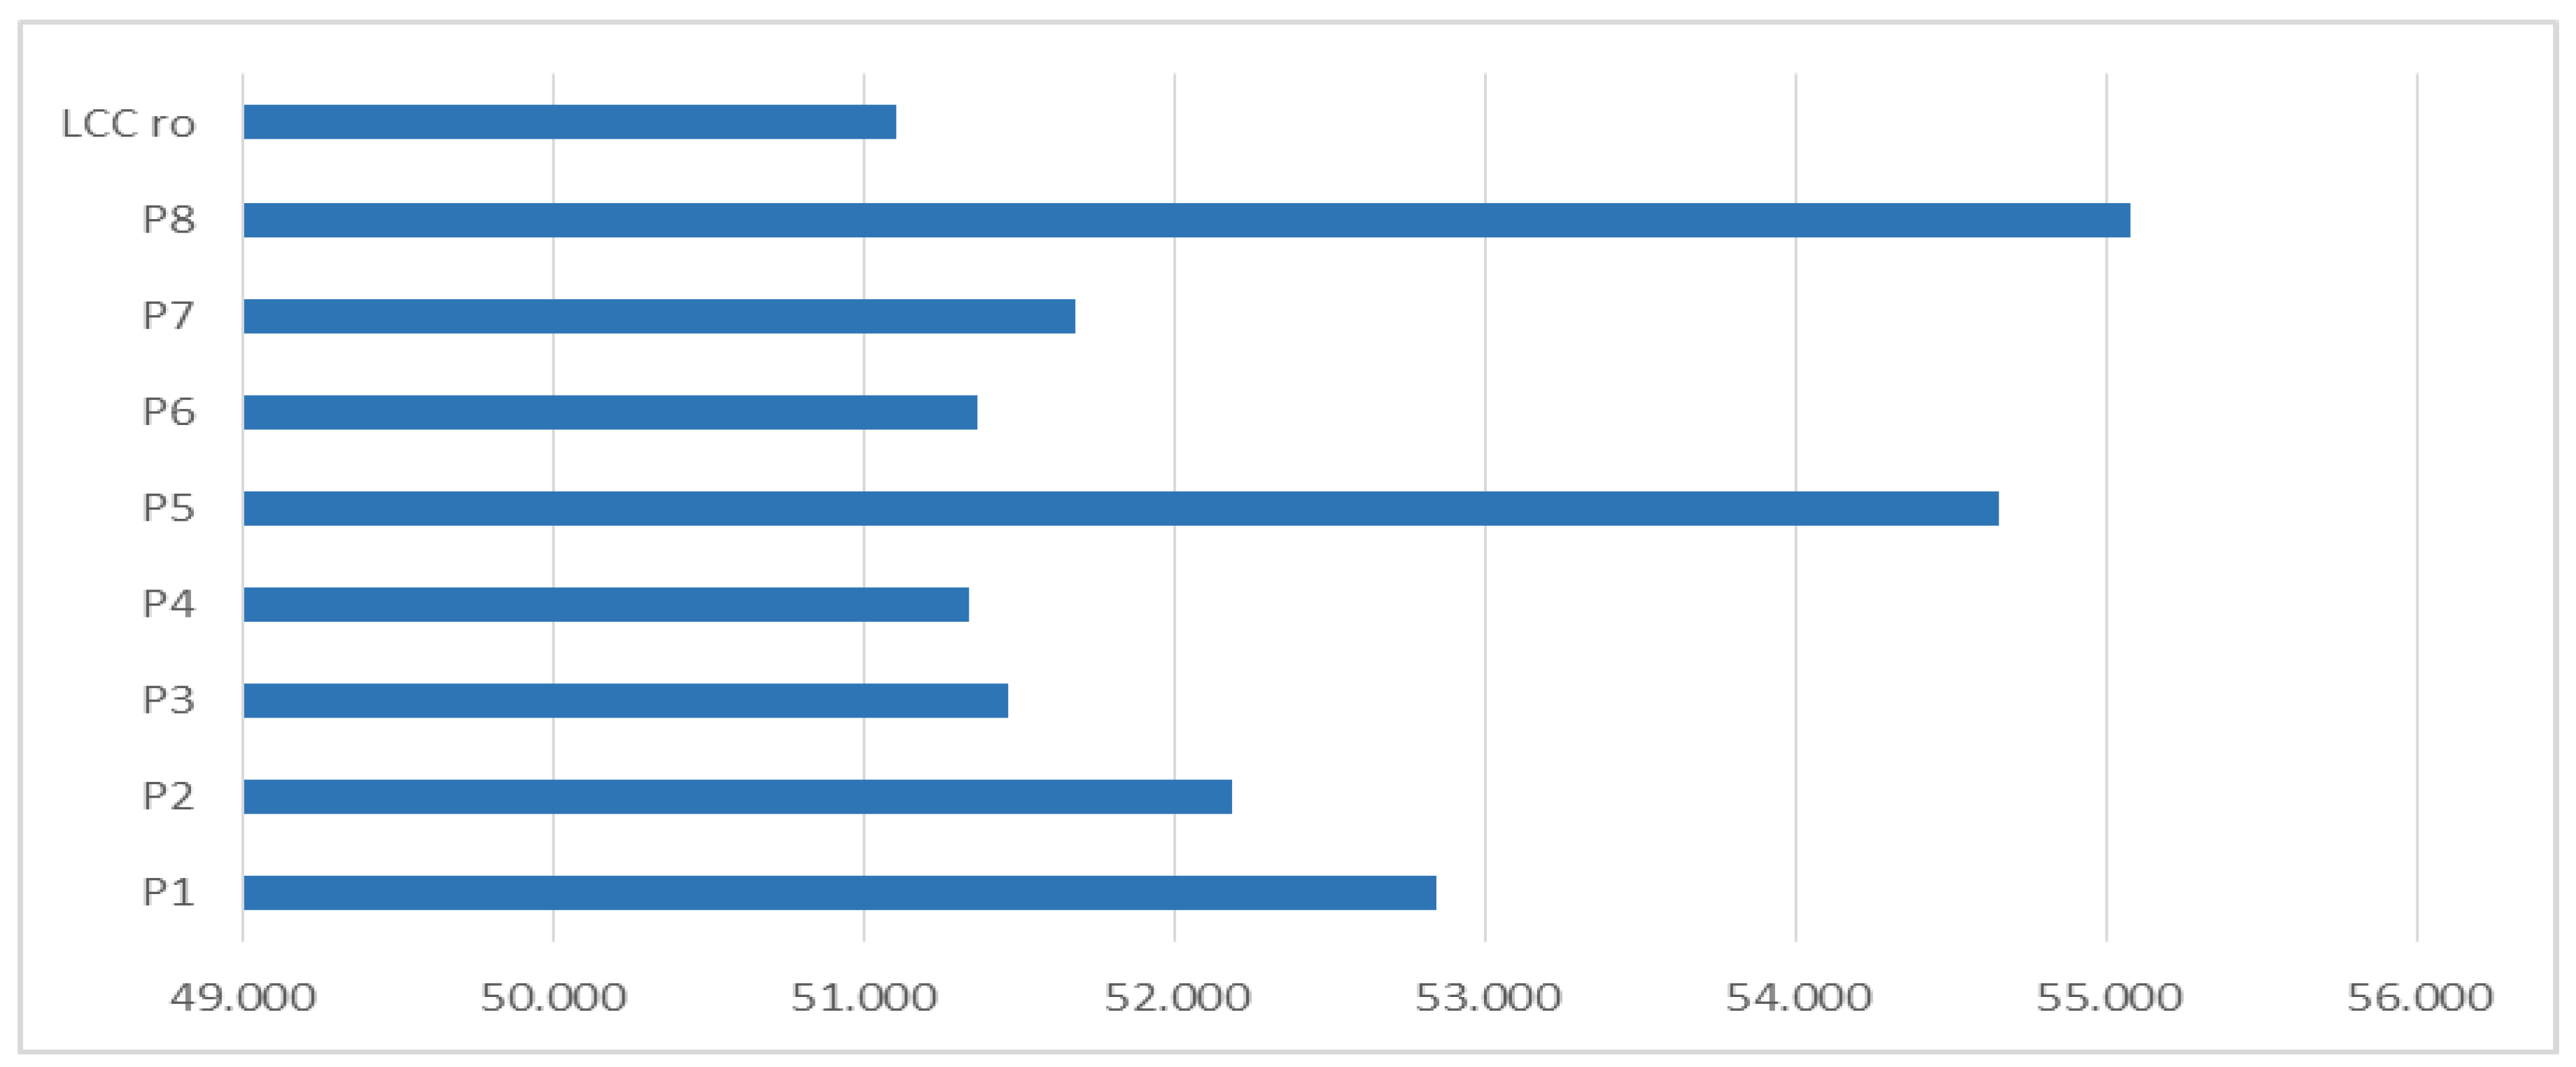
The LCC determination for each project in each county in the case of the minimal scenario (presented in
Figure 8 and in
Appendix A,
Table A1) shows that in most of the counties of the region (in four out of seven counties) the draft project for increasing the energy efficiency of the dwelling stock with the minimum LCC is the project P3—reference building according to the Romanian normative without shutters. In three counties, project variants with minimal LCC were other than the project P3. In Argeş the project with minimal LCC was the project P7 (modernized building, summer shutters, shutters and heat recovery), in Dâmboviţa county the project with minimal LCC was the project P4, and in the Ialomița county the project version with minimal LCC was the project P6.
Project variants P5 and P8, with the most important additional equipment, were not among the minimal LCC variants in any county of the South Muntenia region.
LCCro at the regional level (presented in
Figure 9 and in
Appendix A,
Table A1), which represents the minimum LCC at regional level, corresponding to the optimal portfolio, amounting to 51.099 billion euros was determined by adding up the project variants with the lowest LCC in each county.
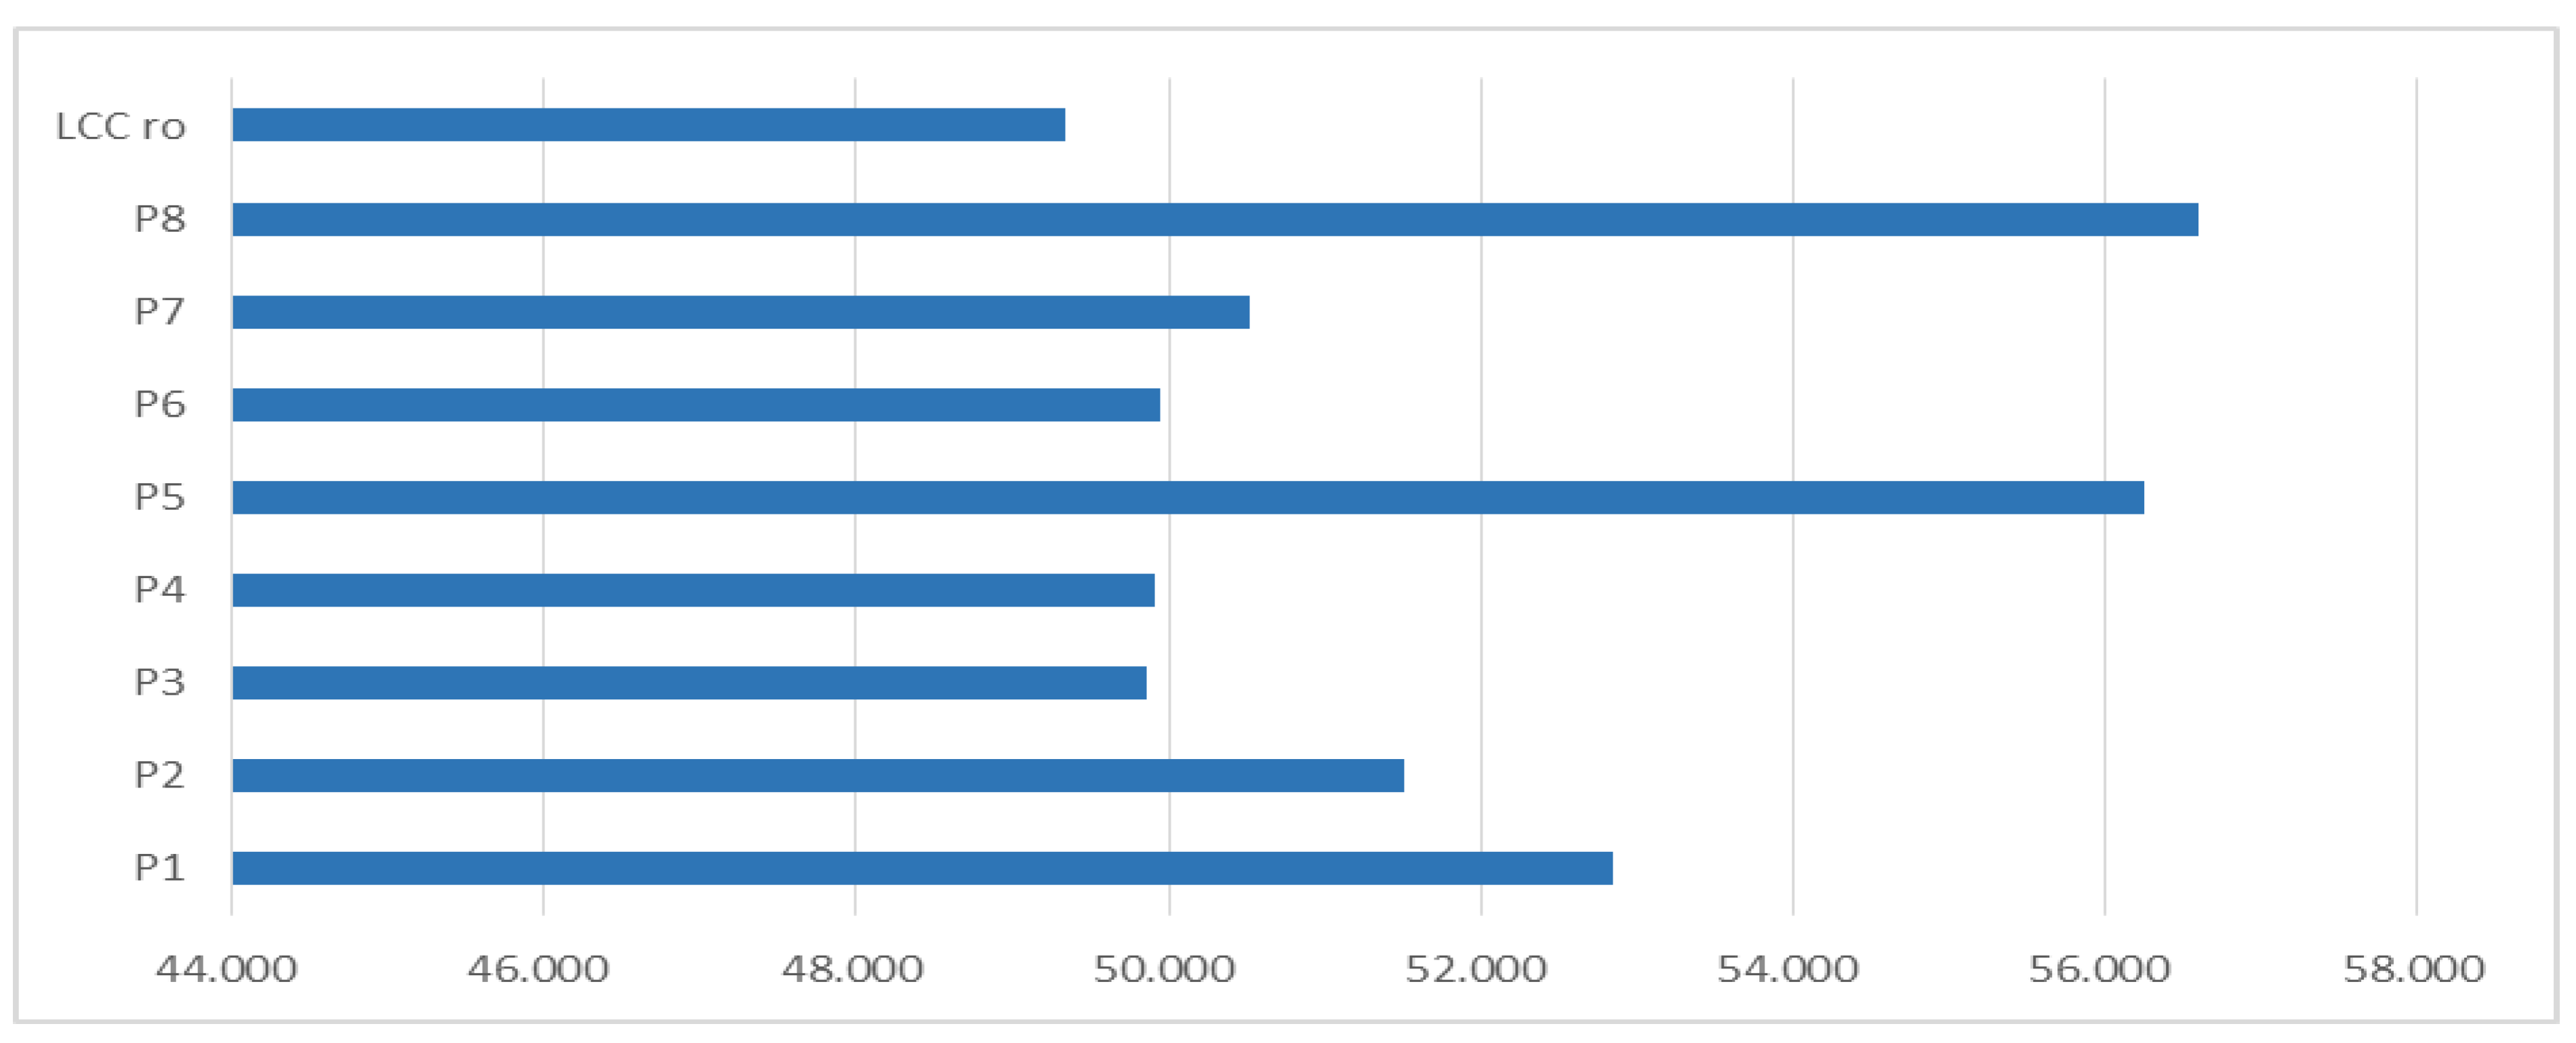
In the case of the LCC average scenario at regional level, for each project in each county, it is presented in
Figure 10 and
Figure 11 (see also
Appendix B,
Table A2). In this scenario, in five counties of seven (Călăraşi, Dâmboviţa, Giurgiu, Prahova, Teleorman) the project of increasing the energy efficiency of the dwelling stock with the lowest LCC is the project P3—reference building according to the Romanian normative without shutters.
However, assuming that only one project variant should be selected for all counties, the project P3 would lead to the lowest LCC at regional level, but the project P6 has the lowest LCC at the regional level. The methodology for this research leads to LCCro at regional level, which represents the minimum level of regional LCC obtained by selecting project variants with minimum LCC for each county.
Only in two counties (Argeş and Ialomiţa) the project for increasing the energy efficiency of the dwellings stock with the lowest LCC is different from the P3 project. In Argeş County, the project with minimal LCC is the P7 project and in Ialomiţa County the project with minimal LCC is the project P6 (modernized building with natural ventilation and summer blinds).
LCCro for the second scenario valued at 49.345 billion euros is lower than the first scenario considered.
Figure 12 and
Figure 13 (and also
Appendix C,
Table A3) presents LCC at regional level for each project in each county for the maximum scenario. And in the case of this scenario in most counties in the South Muntenia region (Călăraşi, Dâmboviţa, Giurgiu, Prahova, Teleorman) the project P3 is the one that has a minimum LCC.
Project variants for increasing the energy efficiency of the dwelling stock with the most important facilities are not among those providing a minimum LCC in any county in the case of the maximum scenario.
LCCro in the case of the maximum scenario, amounting to 47.610 billion euros, is the lowest of all three scenarios analyzed for the implementation of projects to increase the energy efficiency of the housing stock.
Since the LCCro maximum scenario is the lowest value compared to the other two scenarios analyzed, it should be chosen for the 2050 perspective.
3.3. Sensitivity Analysis
For the maximum scenario, a sensitivity analysis was carried out in view of the various changes that may occur in the evolution of the economy. Values of variables used in LCC determination may undergo changes and may affect the expected situation. In this respect, it is necessary to test the sensitivity of the maximum scenario to changes of the key variables. The sensitivity analysis was performed for the following key variables: cost of project implementation, maintenance cost and energy cost. For each of the key variables, the assumption of 10% growth was considered in relation to the projected trend. The results of the sensitivity analysis are presented in
Table 5,
Table 6,
Table 7 and
Table 8.
The chosen scenario has a low sensitivity to change of the implementation cost of the projects to increase the energy efficiency of the dwelling stock as LCCro increases by only 0.34%. The same effect is to increase the cost of implementation for all project variants implemented in all counties. LCC variations are very low (below 2%) as a result of increasing implementation costs.
At regional level, the most affected projects to increase the cost of implementation are projects P5 (the reference building equipped with heat recovery, shutters, solar panels and photovoltaic panels) and P8 (the modernized building with summer shutters, photovoltaic panels). The least affected is the P1 project (the reference building at its current state) because it does not involve implementation costs.
This is understandable because these projects have the highest implementation costs and the most important endowments of all energy efficiency projects taken into account in this research. The regional energy efficiency projects are not significantly affected by the increase in implementation costs.
At a regional level, the chosen scenario has a relatively high sensitivity to increased maintenance costs as LCCro increases by 5.25%. The highest LCC variations at project level are those for P5 and P8 projects.
The increase in energy costs also has a significant impact on LCC at regional level, as there is a 4.40% increase in this indicator compared to the initial situation. The most affected projects in the case of increasing the cost of energy are P1 and P2 projects in all counties because in their case the energy needs are the highest.
The sensitivity analysis revealed that the increase of the operation costs has more significant effects on the LCC at regional level compared to the increase of the cost of the projects implementation. The situation is the same in the application of the eight project variants in each county.
In the last part of the sensitivity analysis, the combined effect of the three factors previously analyzed (cost of implementation, maintenance cost and energy cost) was studied.
Table 8 presents these results.
The combined action of the three factors considered has significant effects on all projects, leading to an LCCro increase of 10.22%. This increase in LCC at regional level shows that projects are sensitive to a combined action of the three factors considered.

