Electro-Thermal Modeling of Metal-Oxide Arrester under Power Frequency Applied Voltages


State Key Laboratory of Disaster Prevention & Reduction for Power Grid Transmission & Distribution Equipment, State Grid Hunan Electric Power Corporation Disaster Prevention & Reduction Center, Changsha 410007, China
*
Author to whom correspondence should be addressed.
Energies 2018, 11(6), 1610; https://doi.org/10.3390/en11061610
Submission received: 30 May 2018
/
Revised: 11 June 2018
/
Accepted: 14 June 2018
/
Published: 20 June 2018
Abstract
:Metal-oxide arresters (MOAs) are used to absorb the electrical energy resulting from overvoltages in power systems. However, temperature rises caused by the absorbed energy can lead to the electrothermal failure of MOAs. Therefore, it is necessary to analyze the electric and thermal characteristics of MOAs. In this paper, in order to study the electric and thermal characteristics of MOAs under power frequency voltage, an improved electrothermal model of an MOA is presented. The proposed electrothermal model can be divided into an electric model and a thermal model. In the electric model, based on the conventional MOA electric circuit, the effect of temperature on the voltage–current (V–I) characteristics of an MOA has been obtained. Using temperature and applied voltage as input data, the current flows through the MOA can be calculated using the artificial neural network (ANN) method. In the thermal model, the thermal circuit of a MOA has been built. The varistor power loss obtained from the electric model is used as input data, and the temperature of the zinc oxide varistors can be calculated. Therefore, compared with the existing MOA models, the interaction of leakage current and temperature can be considered in the proposed model. Finally, experimental validations have been done, and the electrothermal characteristics of an MOA have been studied by simulation and experimental methods. The electrothermal model proposed in this paper can assist with the prediction of the electric and thermal characteristics of MOAs.
1. Introduction
Metal-oxide arresters (MOAs) are electric equipment that are used in the power systems for protection against overvoltages [1,2]. When a MOA is subjected to an electric system operating voltage, its resistance is high enough that the leakage resistive current can be neglected. However, due to the highly non-linear voltage–current (V–I) characteristics, when the MOA is subjected to temporary overvoltages or transient surges, the equivalent resistance become much smaller, and the resistive dynamic behavior is predominant [3,4,5,6]. Due to these non-linear V–I characteristics and excellent current/energy absorption capabilities, MOAs are widely used in the electrical power systems [1,2,3,4,5,6]. For an MOA, zinc oxide (ZnO) varistors are the core components, and the V–I characteristics of ZnO varistors show temperature dependence under power frequency-applied voltages [7,8,9,10,11]. What’s more, when an AC voltage is applied to a MOA, the resistive current flowing through the ZnO varistors can cause power loss, which may lead to temperature rise or thermal failure of the MOA [12,13,14,15]. Thus, in order to improve the thermal stability of MOAs, it is of great significance to study the interaction of MOAs’ temperature and power loss characteristics under power frequency overvoltages.
In order to study the interaction of the electric and thermal characteristics of MOAs, it is necessary to develop their electrothermal models. Electric models of MOAs were proposed to provide tools for studies of insulation coordination, optimal location, and so on by Schmidt, Vita and Kim [16,17,18]. These models, which have considered the non-linear V–I characteristics of ZnO varistors, can be used under different applied voltages (power frequency [16], switching [17], lightning [18], etc.). However, the electric models proposed by Schmidt, Vita and Kim [16,17,18] have not considered the temperature effects on the V–I characteristics of MOAs. The electric characteristics of surge arresters were studied by He [19], and the electric failure modes of MOAs caused by thermal reasons were investigated [20]. The V–I characteristics of MOAs have been expressed as a function of temperature by Petit [21]. The influence of temperature on the resistive current of MOAs was studied by He, Bartkowiak and Petit [19,20,21], but the power loss and temperature rise caused by the resistive current have not been studied. In order to study the thermal characteristics of MOAs, methods have been suggested for power loss and temperature performance prediction [22,23,24,25,26,27]. The thermal characteristics of MOAs have been studied experimentally [22], and an analytical method for the performance prediction of MOAs was proposed by Lat [23]. Finite element methods were applied to calculate temperature and power loss [24,25,26], the thermal stability of MOAs with different structures was compared [24], the effects of the thermal failure on the microstructure of ZnO varistors were analyzed [25], and the pollution degree of MOA has also been considered when calculating the temperature rise of MOA [26]. Seyyedbarzegar [27] built a thermal balance diagram, and it has been confirmed that the power loss caused by the leakage current is dependent on the applied voltage, temperature, and V–I characteristics of the varistors.
In view of the existing studies, it can be known that when the resistive leakage current increases, the power loss and temperature of the ZnO varistors rise [22,23,24,25,26,27], which consequently increases the resistive leakage current in the ZnO varistors [19,20,21]. This process continues cumulatively, leading to thermal instability and associated catastrophic effects. Using the existing simulation models mentioned above, it is not possible to identify the interaction of leakage current and MOA temperature at the same time. Therefore, in this paper, an electrothermal model is proposed. Compared with the existing studies, the electrothermal model proposed in this paper has considered the interaction of resistive current and the temperature rise of MOA; thus, it can simulate the electric and thermal characteristics at the same time. This paper is organized as follows:
- Firstly, the conventional electric model of an MOA is introduced; based on the conventional model, the diagram and calculation algorithm of the electrothermal model is proposed.
- Secondly, in order to build the electric part of the electrothermal model, experiments were carried out to obtain the voltage–current–temperature (V–I–T) characteristics of the tested ZnO varistors. According to the experimental results, the electric model of the tested ZnO varistors considering the temperature effects is built using the artificial neural network (ANN) method. Using temperature and applied voltage as input data, the leakage current flowing through the varistors can be obtained, and the electric part of the electrothermal model has been validated through experimental results.
- Thirdly, a thermal resistance circuit model is introduced to build the thermal part of the model. Using power loss and ambient temperature as input data, the temperature of the MOA is calculated, which is used as the input data of the electric model. By doing so, the electrothermal model can be obtained combining the electric and thermal model built above. Compared with the existing studies, the interaction between the resistive leakage current and the temperature rise of ZnO varistors has been considered in this paper, and the electric and thermal characteristics can be simulated at the same time.
- Finally, experiments were carried out to validate the simulation model, and its electric and thermal characteristics have been studied. Compared with the existing studies, the relationship between arrester temperature and time under different applied voltages is studied, and the experimental and simulated results show good agreement with each other.
2. Diagram and Calculation Algorithm of Electrothermal Model
Conventional Electric Model Review
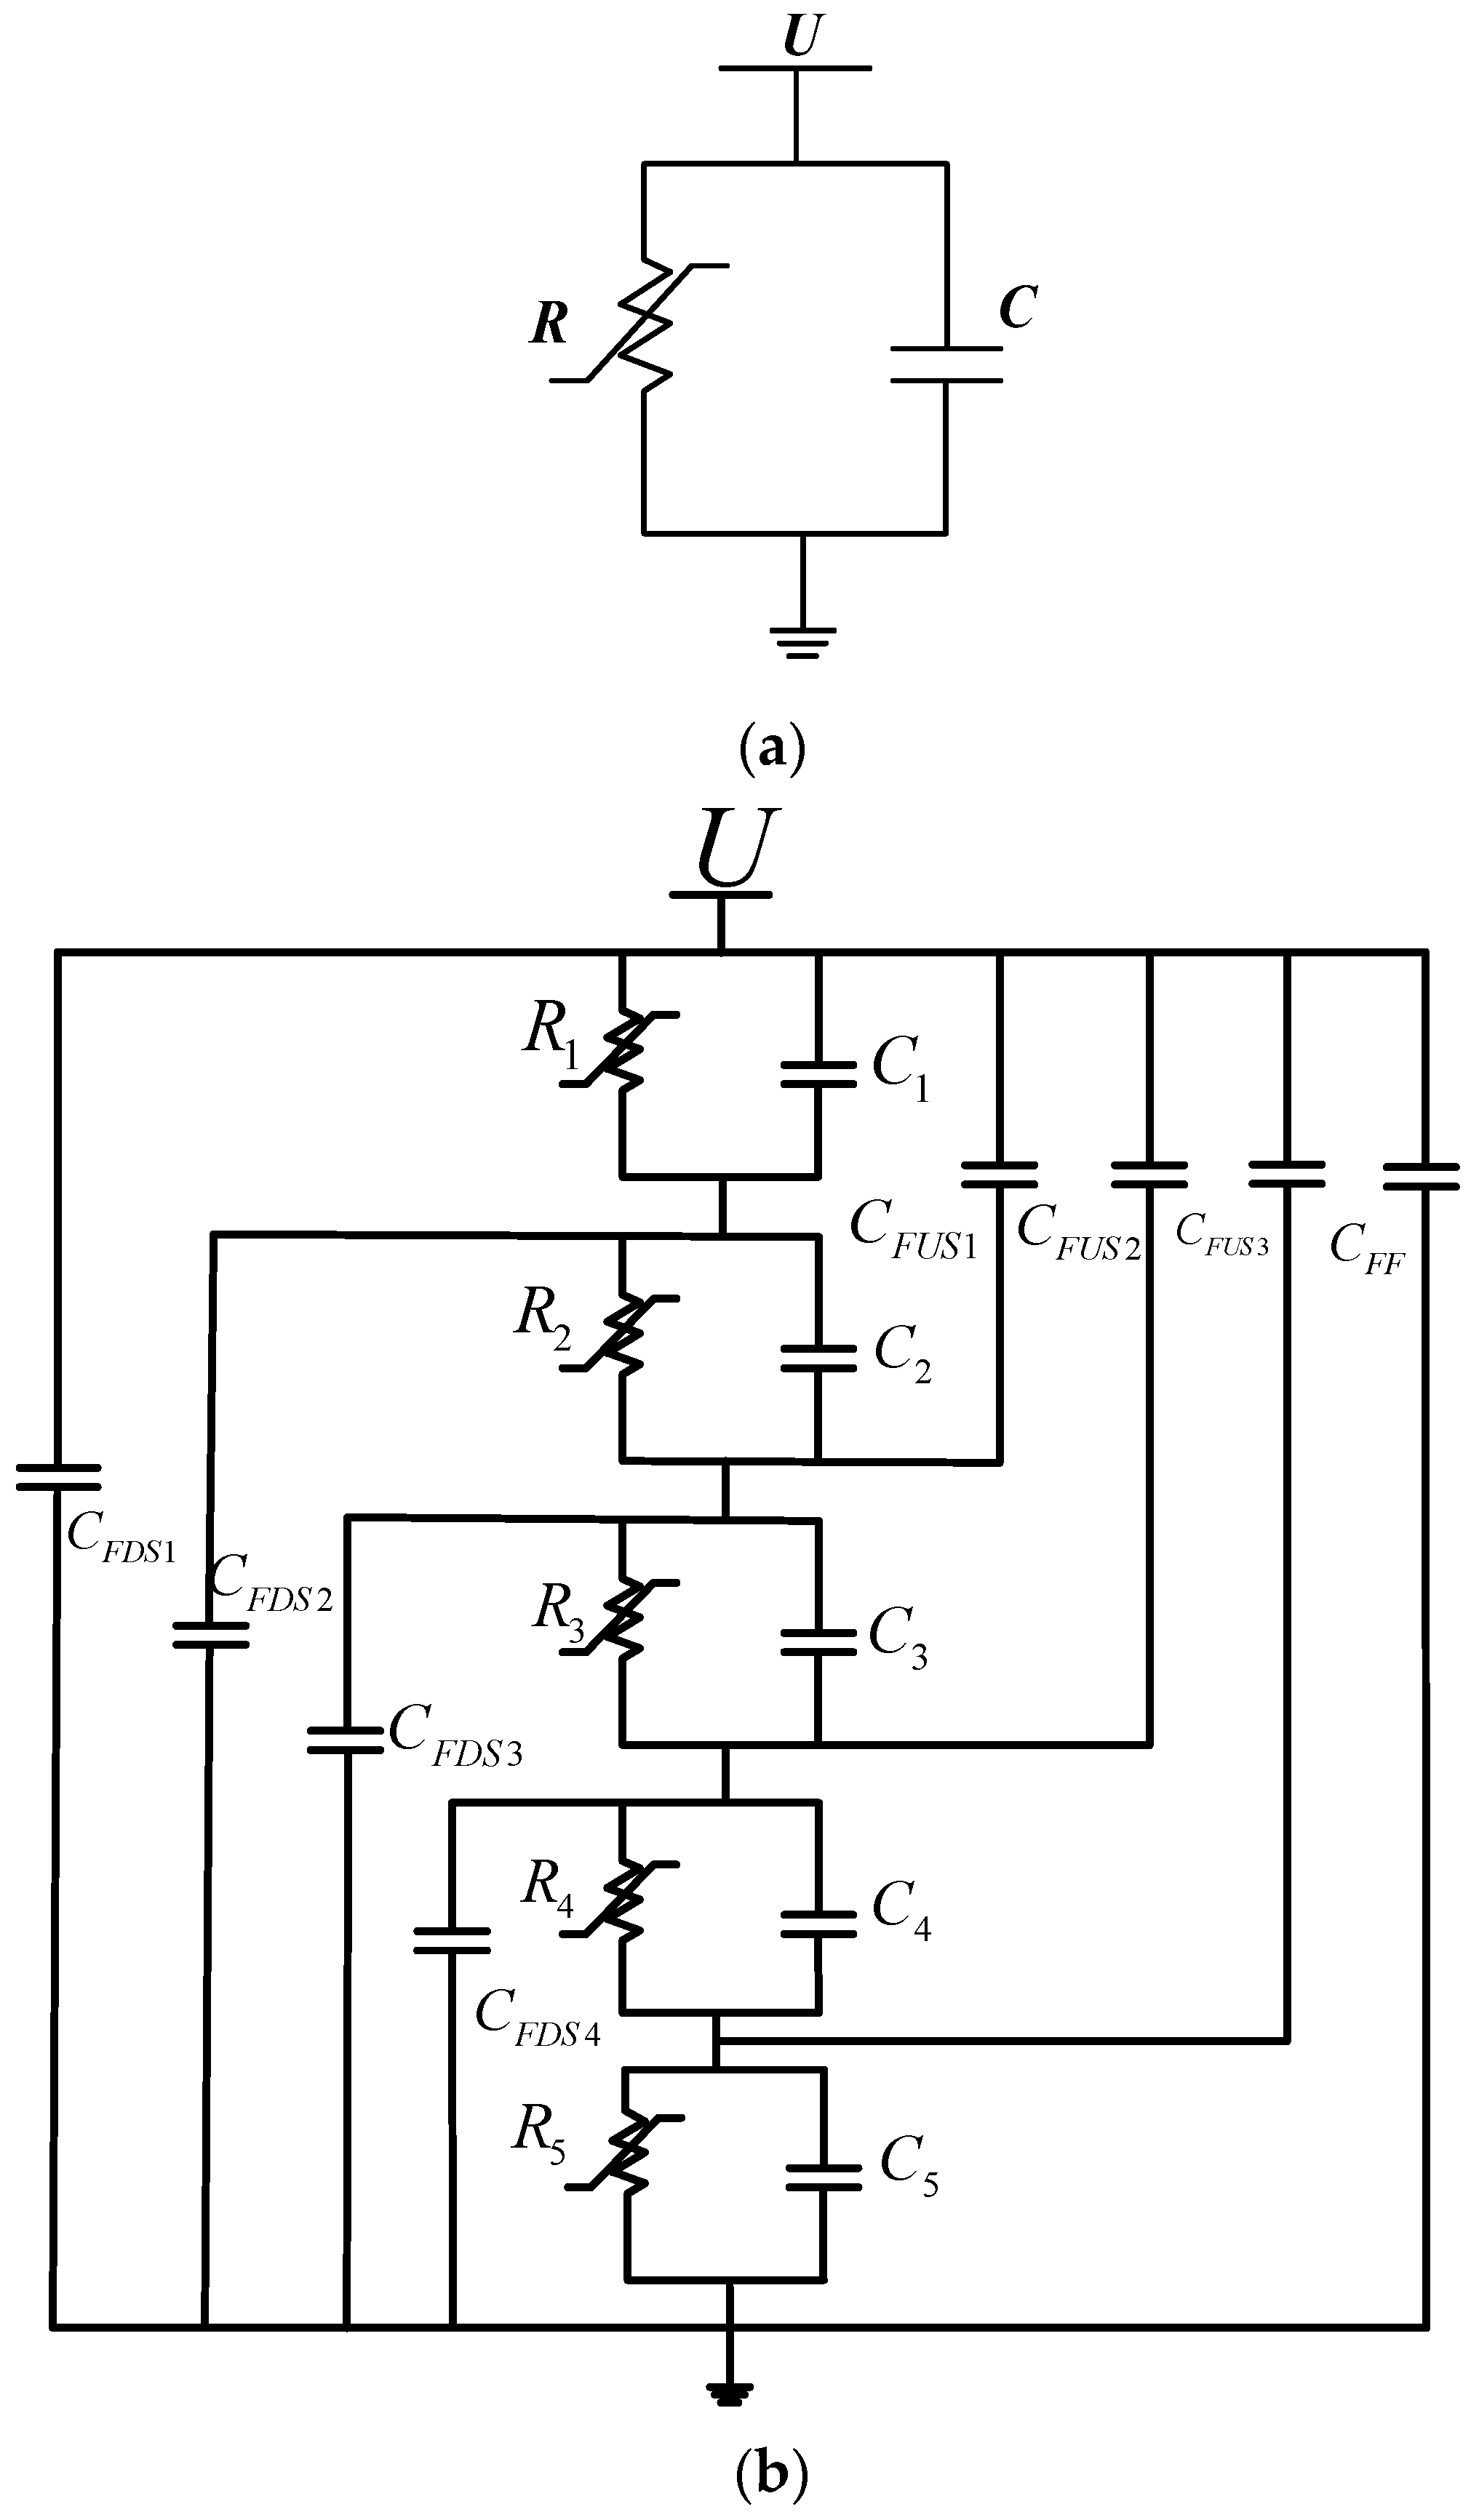
According to Section 1, MOAs have temperature-dependent non-linear V-I characteristics. Under power frequency voltage, the current flowing through the ZnO varistor can be divided into resistive and capacitive components. Therefore, the conventional circuit models of ZnO varistors and MOAs are built and shown in Figure 1 [18]. In this conventional model, five ZnO varistors are contained in the MOA; R, R1 to R5 represent the resistances of each varistor. C, C1 to C5 represent the stray capacitance of each varistor. CFF is the capacitance between the upper and lower flanges, CFUSi (i = 1, 2, 3) are the upper flange stray capacitances with spacers and aluminum sheets, and CFDSi (i = 1, 2, 3, 4) are the stray capacitances among the lower flange and spacers and aluminum sheets.
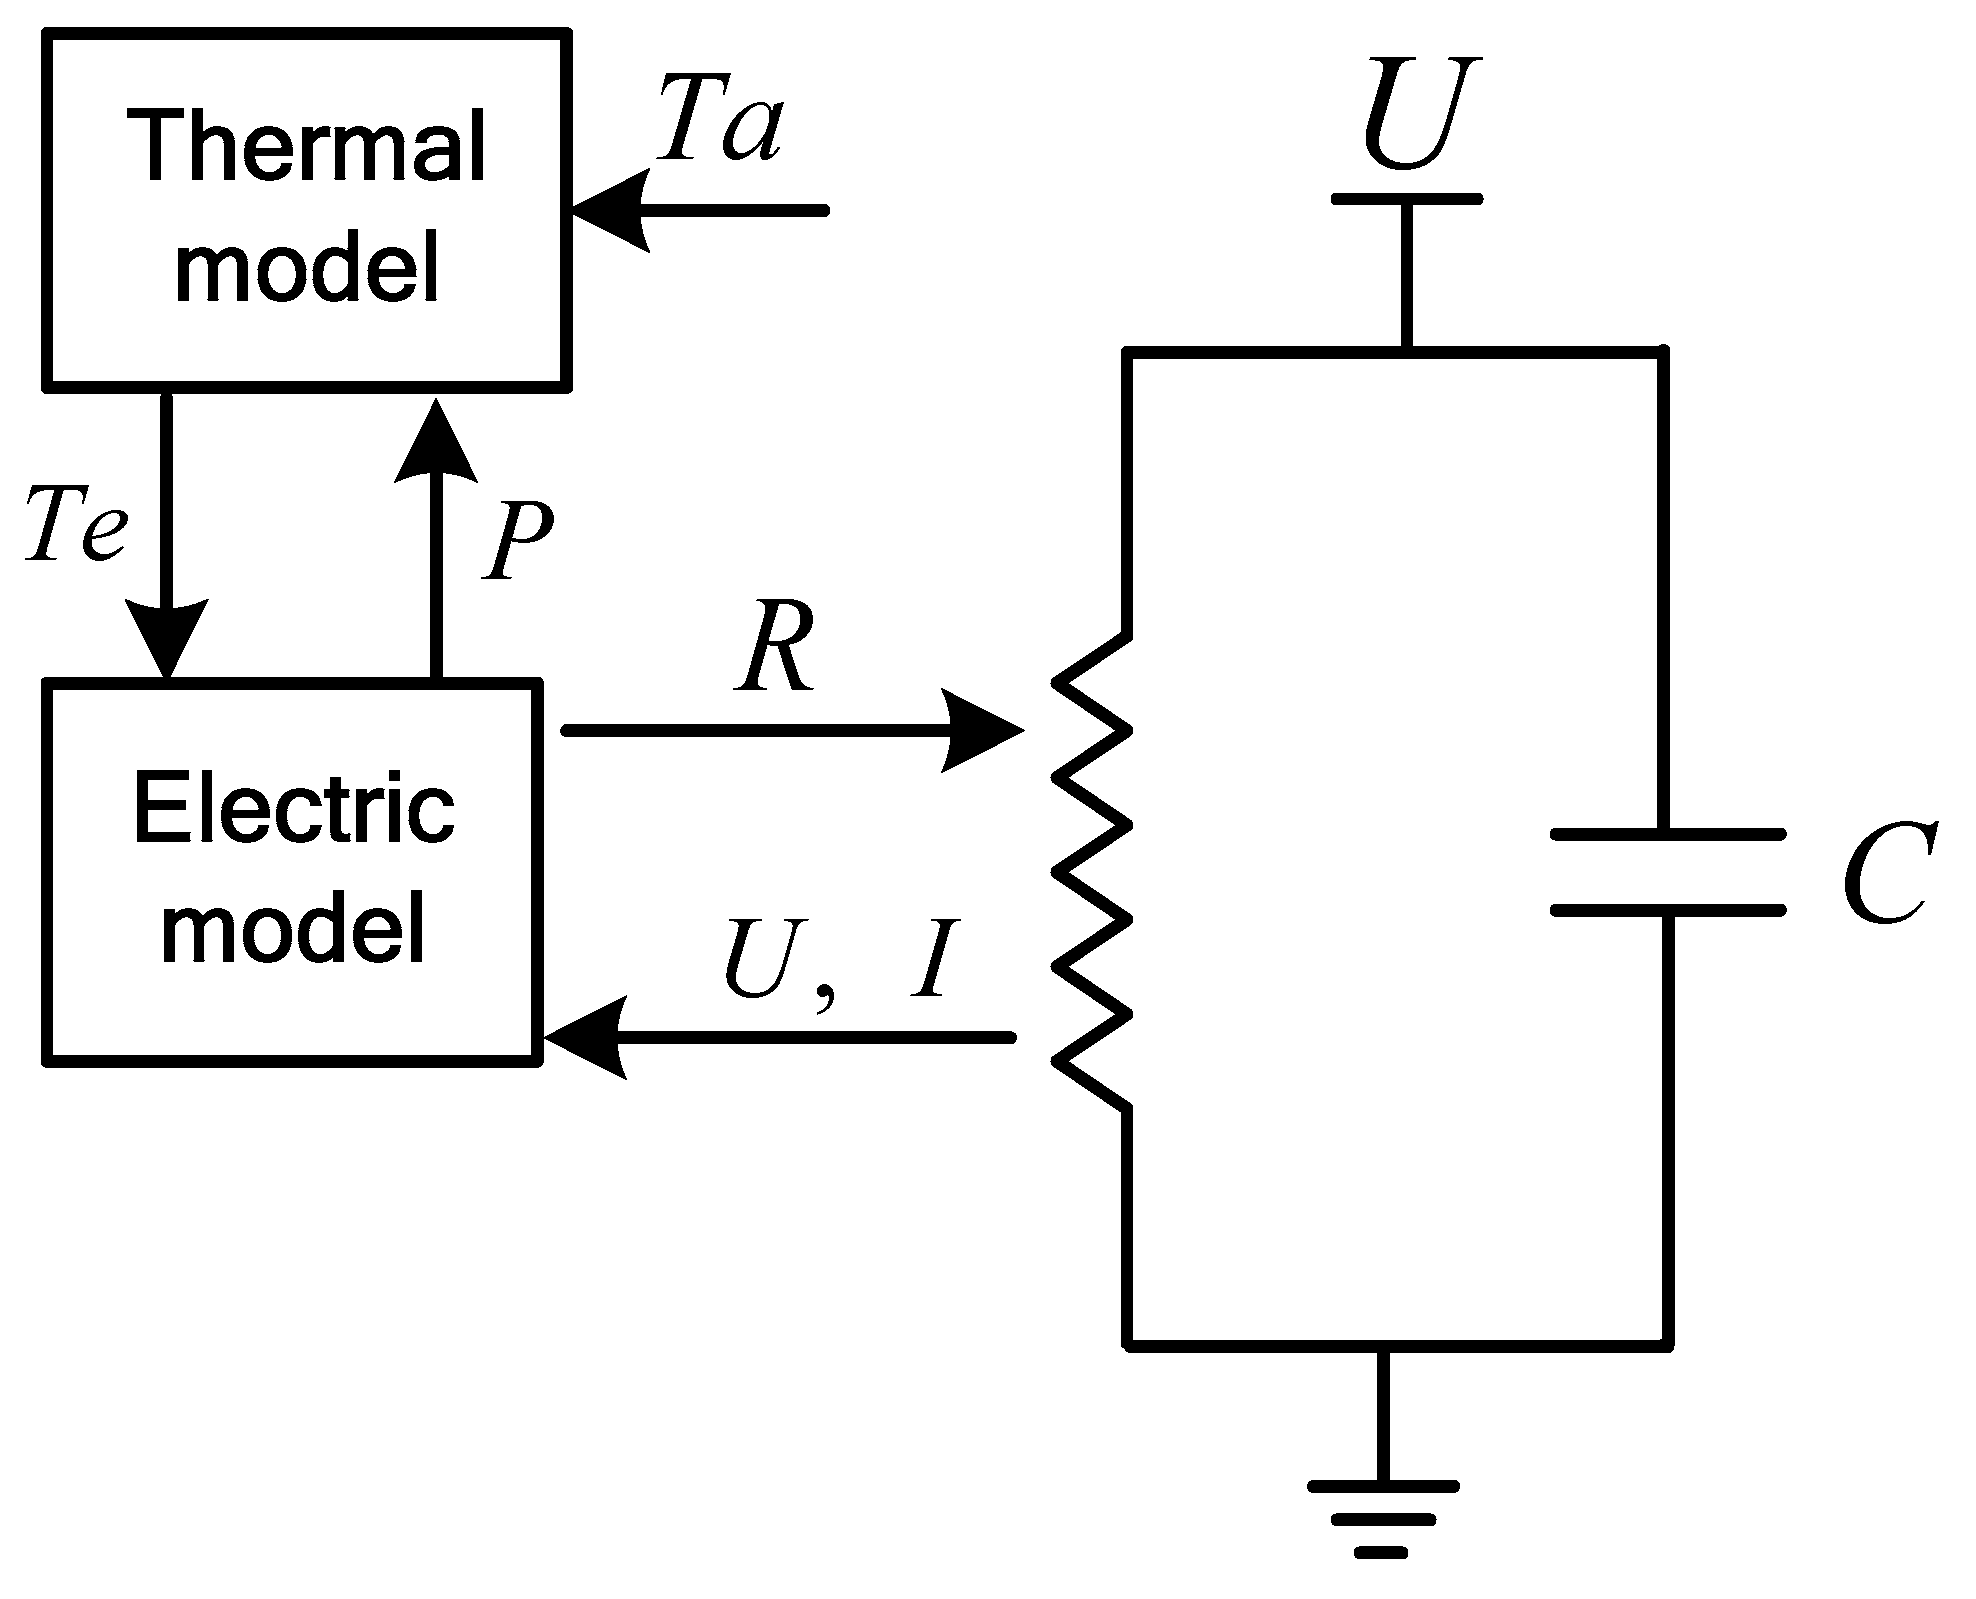
In the conventional model shown in Figure 1, R1 to R5 are only dependent on the V–I characteristics of the ZnO varistors, and the power loss and temperature effects on the V–I characteristics of MOAs are not considered. So, the electric model in Figure 1 can only be used to calculate the electric characteristics of MOAs under specific temperature. Based on the electric model in Figure 1, an electrothermal model of ZnO varistors is proposed in Figure 2, where P is the power loss, Te is the varistor temperature, and Ta is the ambient temperature. As shown in Figure 2, the electrothermal model can be divided into an electric part and a thermal part. In the electric part, using the applied voltage and varistor temperature as input data, the temperature-dependent V–I characteristics can be estimated by an artificial neural network (ANN). The power loss and electric characteristics (applied voltage, leakage current) can be obtained as output data of the electric model. In the thermal model, a thermal circuit of an MOA has been built. Based on the power loss of the ZnO varistors and the ambient temperature as input data, the temperature of the varistors can be obtained as the output of the thermal model. The temperature of the arresters is used as the input data of the electric part of the model consequently. Replacing the ZnO varistor model in Figure 1b with that in Figure 2, the electrothermal model of MOA can be obtained.
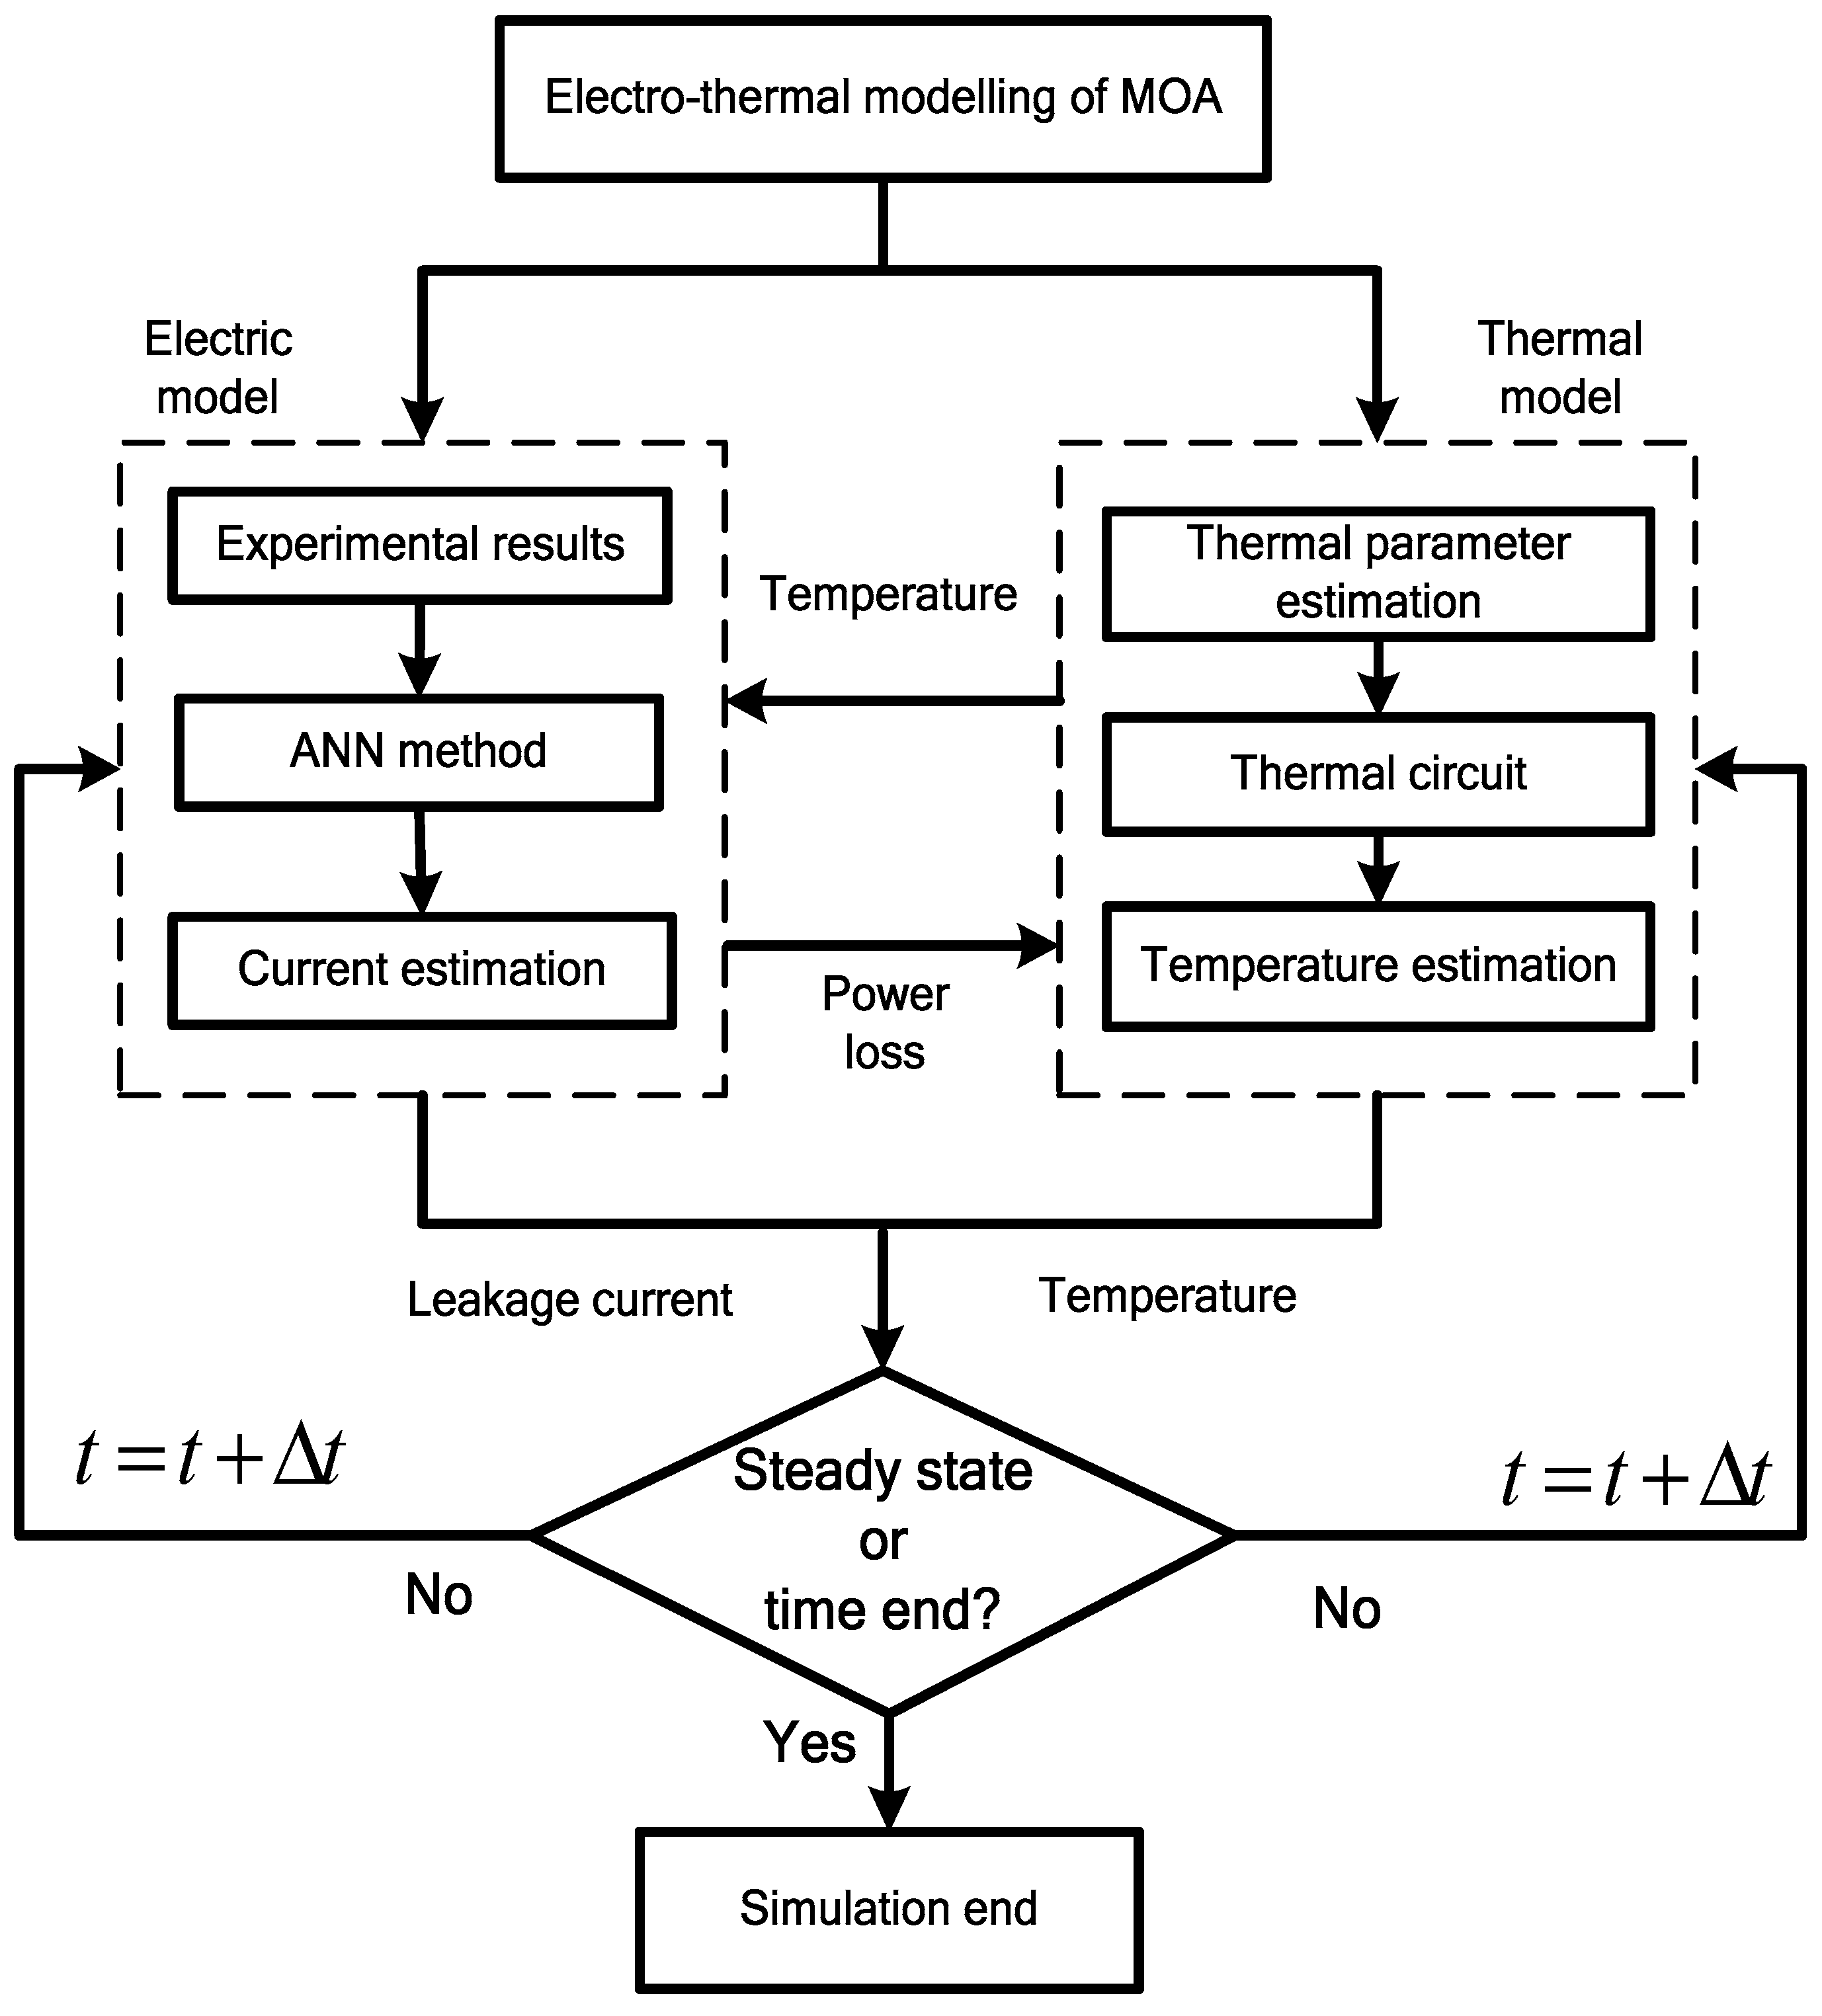
In order to solve the electrothermal model in Figure 2, a calculation algorithm is proposed in Figure 3. The calculation process of the algorithm contains three steps:
- Firstly, the V–I characteristics of ZnO varistors are measured under different temperatures experimentally. Using the applied voltage and varistor temperature as input data and the measured leakage current as output data, an artificial neural network is trained; thus, the V–I–T characteristics of the tested ZnO varistors can be obtained using the ANN method. The power losses of the varistors are calculated in order to be used in the thermal model.
- Secondly, an equivalent thermal circuit of MOA is built; using the ambient temperature, power loss, and MOA temperature at time t as input data, the temperature changes of the MOA can be obtained, and the MOA temperature at the next time-step (t + Δt) is calculated as the output data of the thermal model.
- Finally, according to the last two steps, setting an ambient temperature, initial MOA temperature, and applied voltage, the electrothermal characteristics at different times can be calculated. If the difference between the electrothermal characteristics of two adjacent time steps is smaller than a threshold value, the electrothermal state reaches a steady state. Once the simulation time reaches the end, or the electrothermal simulation reaches a steady state, the simulation process reaches the end.
3. Electric Model Considering Temperature Effects
According to Section 2, the electrothermal model in this paper can be divided into an electric part and a thermal part. In this section, the electric model is proposed. The V–I characteristics of the tested varistors at different temperatures are obtained through experiments. The ANN method is applied to simulate the temperature effects on V–I characteristics, and the simulated results show good agreement with the experimental ones.
3.1. Experimental Setup, Test Species, and Procedures
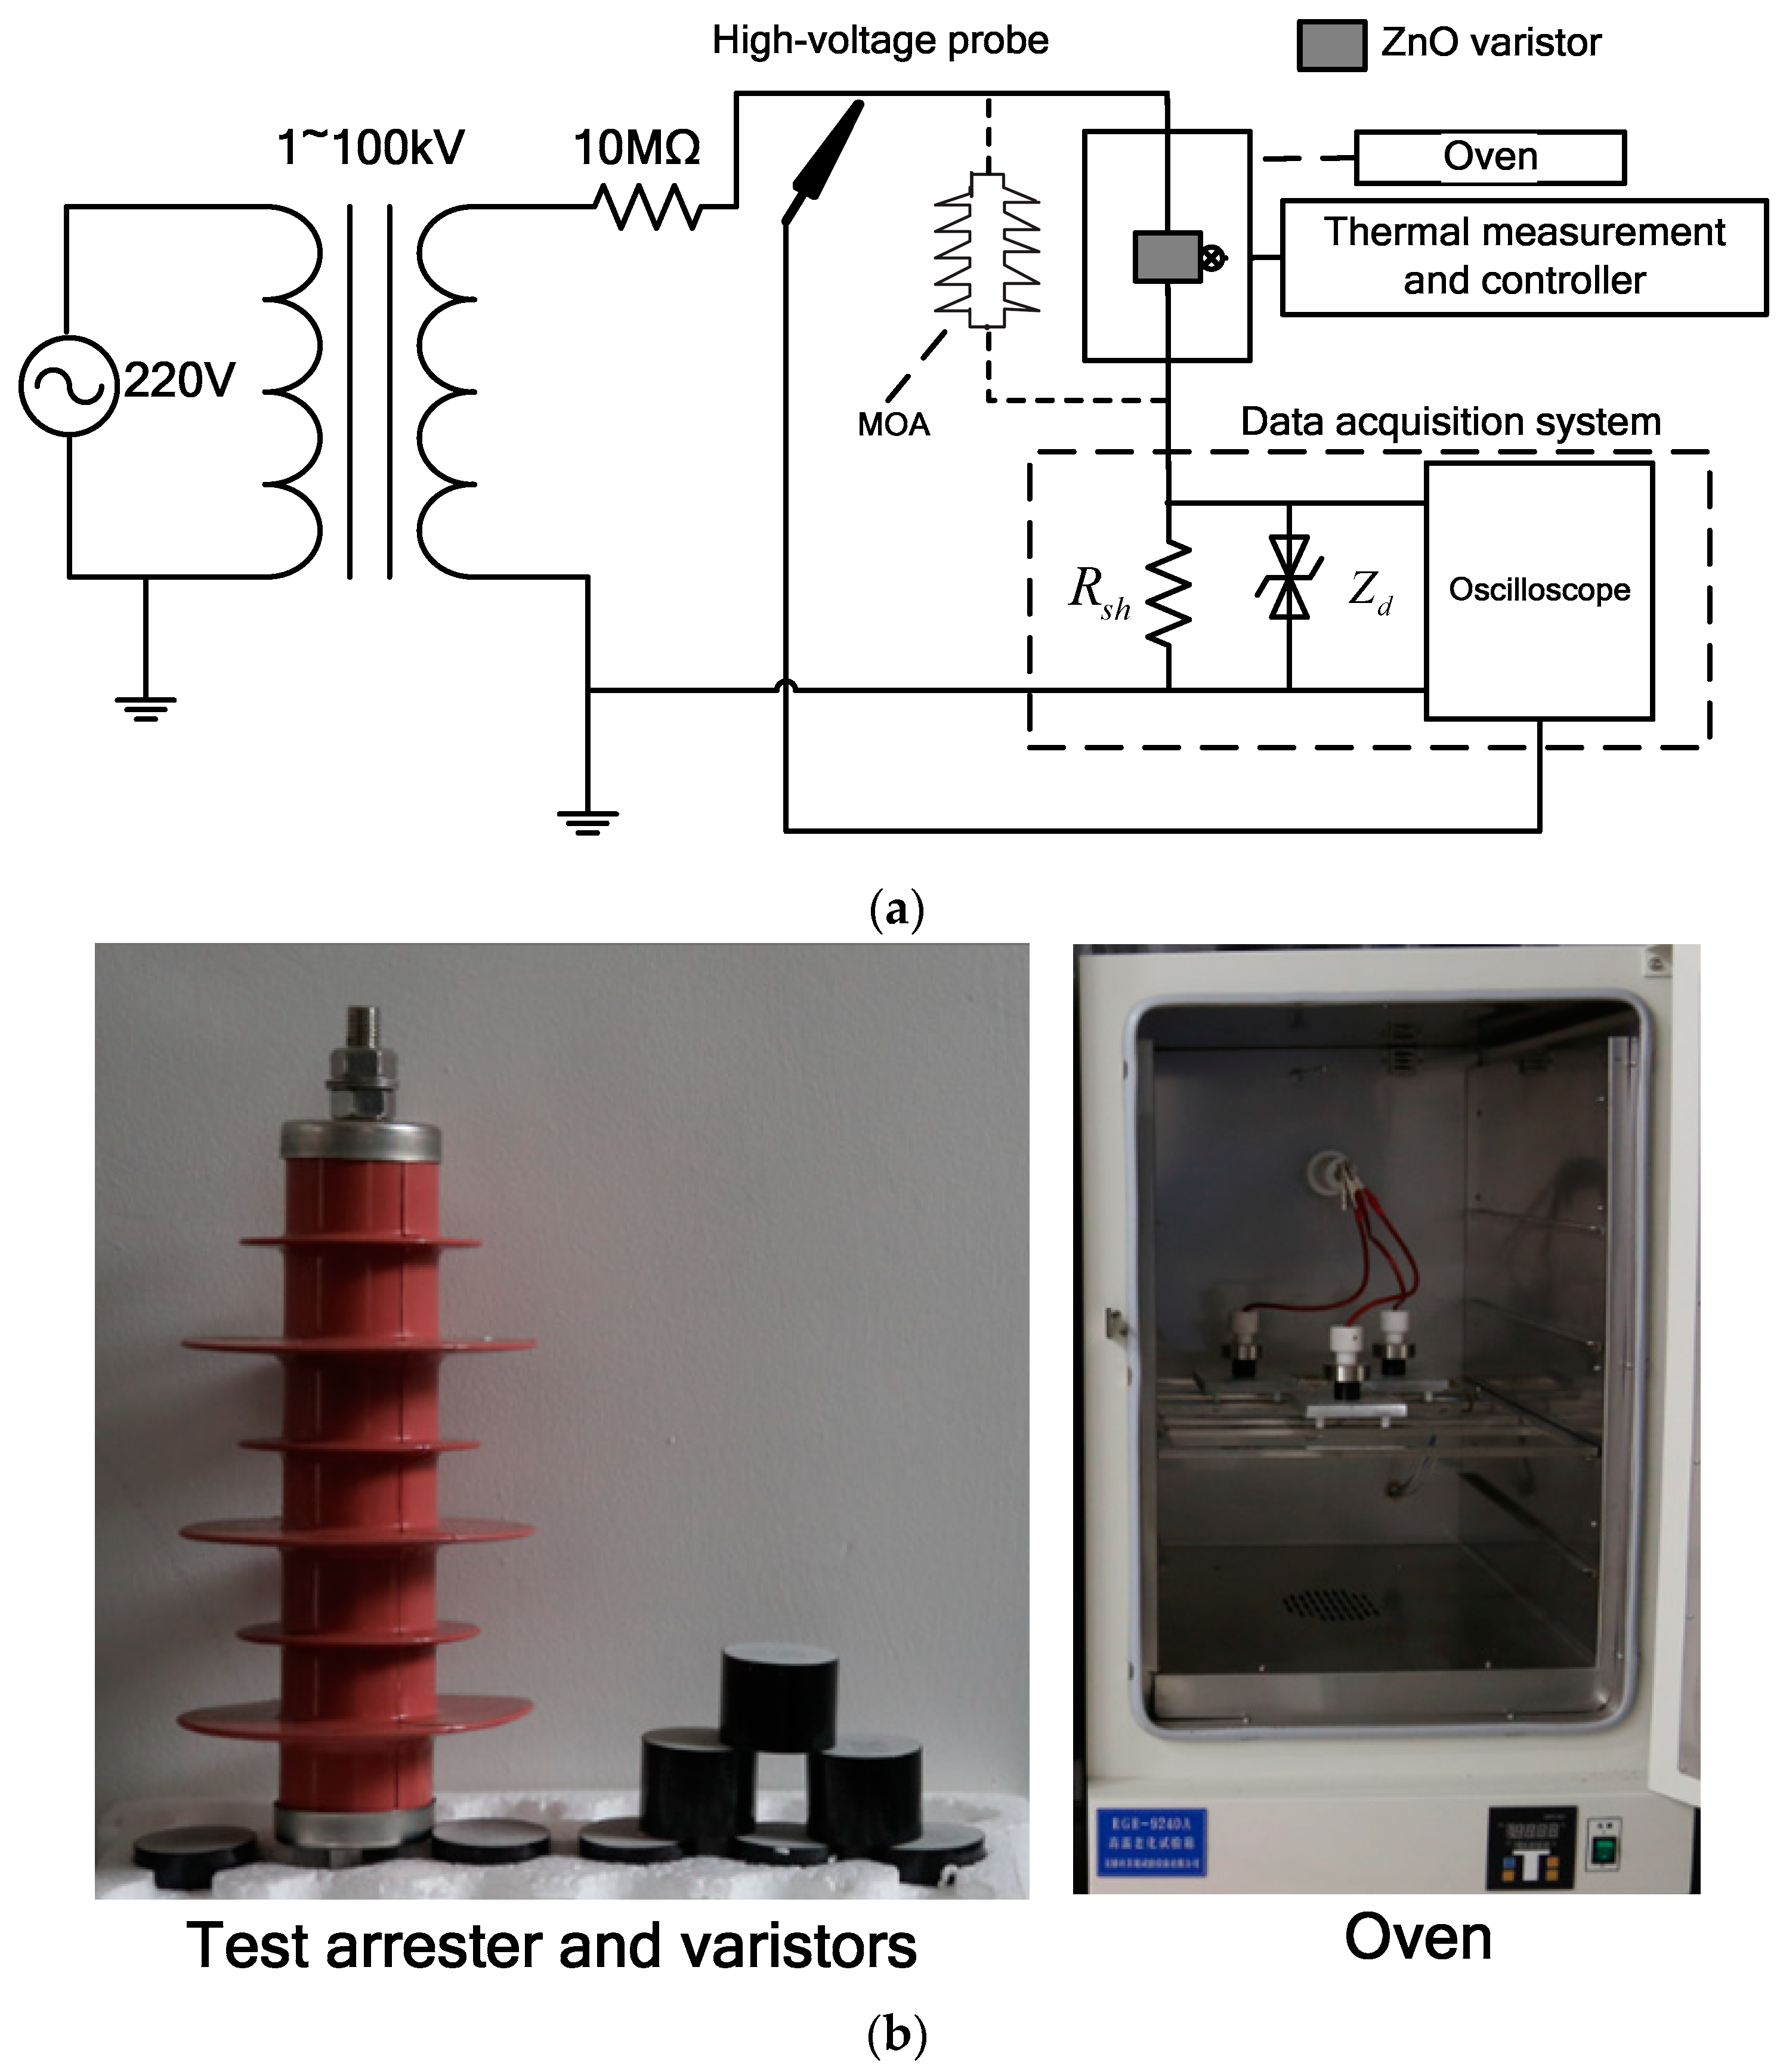
An experimental setup for the measurement of V–I–T characteristics under a power frequency-applied voltage is shown in Figure 4. As shown in Figure 4a, the experimental circuit mainly includes a high voltage transformer, an oven, a high voltage probe, and a data acquisition system. The high voltage transformer has an adjustable voltage between 0–10 kV. In the oven, there is a thermal sensor, a temperature controller, and a heater; it is possible to increase the temperature over 200 ± 3 °C in the oven. The data acquisition system includes a digital oscilloscope, back-to-back connected Zener diodes Zd for overvoltage protection, and a 470-Ω shunt resistor Rsh for leakage current measurements. The leakage current and applied voltage can be captured using a digital oscilloscope in the data acquisition system. The experimental setup in Figure 4 can be used to obtain the V–I characteristics of the ZnO varistors under different temperatures.
Studied MOA and varistors are shown in Figure 4b. The MOA structure includes ZnO varistors, silicon rubber housing, and metal plates. Varistors, which have been removed from the studied MOA, were tested to obtain the V–I–T characteristics under a power frequency voltage. Firstly, the varistors were placed in the oven; then, voltage and current were measured. During the tests, the oven temperature was fixed at ambient temperature (20 °C), and the required parameters were then measured under different applied voltages. In order to measure the leakage current and V–I characteristics under different temperatures, the oven temperature was fixed at a new value, and this process was repeated continuously until all of the required values have been obtained. In this paper, virgin arresters and ZnO varistors are used, and the degradation effects are not considered.
3.2. ANN Modeling of V–I Characteristic Considering Temperature Effects
Temperature increments change the V–I characteristics, leading to different leakage current waveforms and amplitudes at a constant applied voltage. Therefore, it is necessary to model the MOA as a temperature-dependent element.
In this paper, the MOA temperature-dependent electrical model under power frequency voltages has been simulated based on the non-linear resistor’s V–I characteristic estimation. An artificial neural network (ANN) has been used to estimate the temperature effects on V–I characteristics [28]. As shown in Figure 5, the artificial network consists of an input layer, a hidden layer, and an output layer. The applied voltage and varistor temperature are used as the ANN input data, the node number of the hidden layer is chosen as 10, and the resistance can be obtained as output data.
According to the ANN method, the relationship between the output layer and input layer can be given as Equation (1), where:
In Equation (1), X is the input vector, Y is the output vector, and w1, w2 and b1, b2 are the connective weights and bias in the hidden layer and output layer, respectively. f (·) is the non-linear activation function in the hidden layer, as shown in Equation (2).
The back-propagation algorithm is applied to determine the connective weights and bias in Equation (1). At the output layer, the error function is defined as in Equation (3), where RO is the expected output and Rx is the actual output:
In order to obtain the minimum value of the error function in Equation (3), a gradient descent algorithm is employed to adjust the weights w1 and w2 in the ANN model. The weight-adjusting formula is shown as Equation (4), where η is the learning rate, α is the momentum factor, and n is the interaction number:
Using Equations (1)–(4), the connective weights and bias can be calculated through the experimental data obtained in Section 3.1. Thus, the mapping between the input and output data of the ANN model can be obtained.
3.3. Capacitive Component Model of Leakage Current
An accurate parameter extraction of the capacitive components is also very important for the electrothermal model of the MOA. It is confirmed by Bargigia, Spack-Leigsnering, Lundquist and Seyyedbarzegar [12,13,14,15] that the stray capacitance is independent of applied voltage and temperature. In this paper, finite element methods are used to calculate the stray capacitances in ANSOFT Maxwell software (V16 software, ANSYS company, Pittsburgh, PA, USA). The two-dimensional (2D) simulation model is built in Figure 6. In the computation stage, for example, a 1-V voltage is applied to a single element i, and the voltage of the other elements is set to 0 V. Evaluating the electric charge induced in the other elements, the capacitance between element i and element j can be calculated in Equation (5), where Qij is the electric charge induced between element i and j, and V is the voltage applied on element i.
3.4. Experimental Validation of the ANN Model
In order to validate the electric model of the MOA, the simulated V–I characteristics of the varistor at different temperatures are compared with the experimental results. As shown in Figure 7, for a constant temperature, 50 points on the V–I curve are measured, 42 points are used to build the ANN model, and eight points are used to validate the calculated results of the ANN model. From Figure 7, it can be confirmed that the simulated V–I–T characteristics obtained from the ANN model are in good agreement with the experimental results. It can also be seen that, under power frequency voltage, with an increasing varistor temperature, the equivalent varistor resistance become smaller.
4. Thermal Model
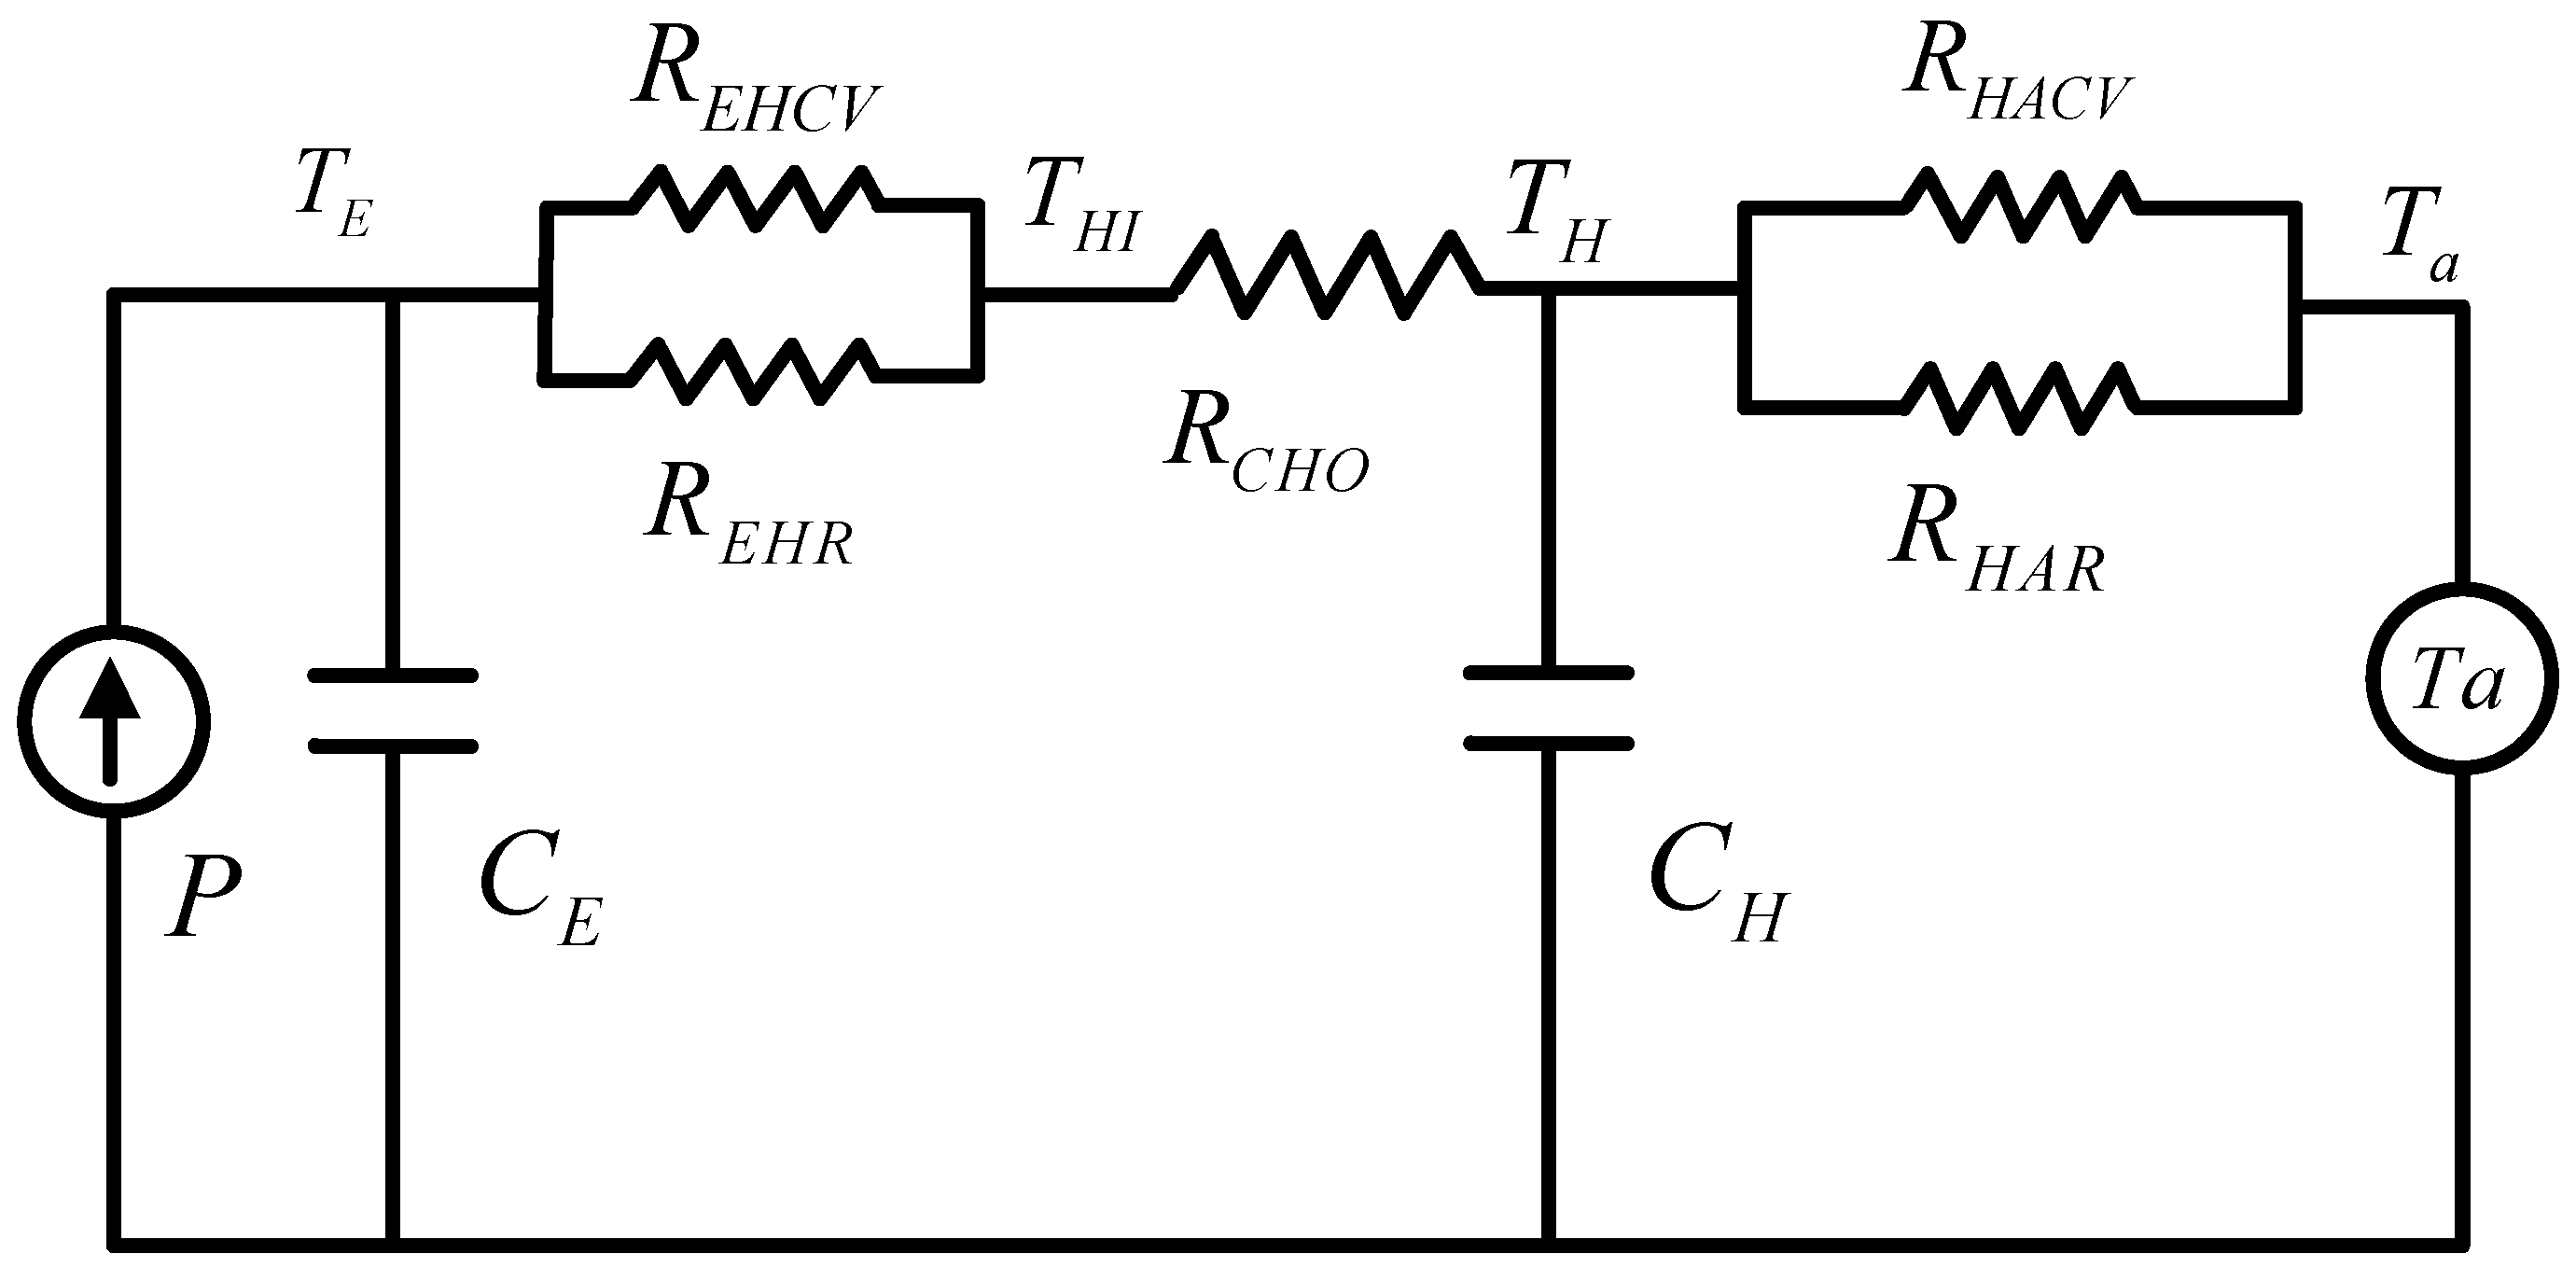
In this paper, a thermal circuit is introduced to calculate the arrester temperature [22,23]. As shown in Figure 8, P is the power loss obtained from the electric model, Ta is the ambient temperature, Te is the varistor temperature, THI is the temperature of the inner surface of the arrester housing, TH is the temperature of the polymer housing, RCHO is the thermal resistor between the varistor and housing, REHR and REHCV are the radiation and conduction thermal resistances between the ZnO varistors and housing, RHACV and RHAR are the conduction and radiation thermal resistance between the housing and ambient, and CE and CH are the thermal capacitance of the ZnO varistor and housing.
In Figure 8, the input to the thermal circuit is the power loss obtained from the electric model. It is assumed that the initial temperature of the varistors and housing is the same with the fixed ambient temperature, and that the difference between the temperatures of the varistors can be neglected [22,23]. According to the equations given by Lat [22,23], once the structure and thermal parameters of the MOA are known, the thermal resistance and capacitance at different times in Figure 8 can be calculated. Therefore, in this paper, the temperature variations are obtained by solving the thermal circuit in Figure 8.
5. Experimental Validations
In order to validate the proposed electrothermal model, experimental data has been carried out using the experimental setup in Figure 5. Power frequency voltages were applied on the tested MOA, and the temperature and leakage current flowing through the MOA was measured.
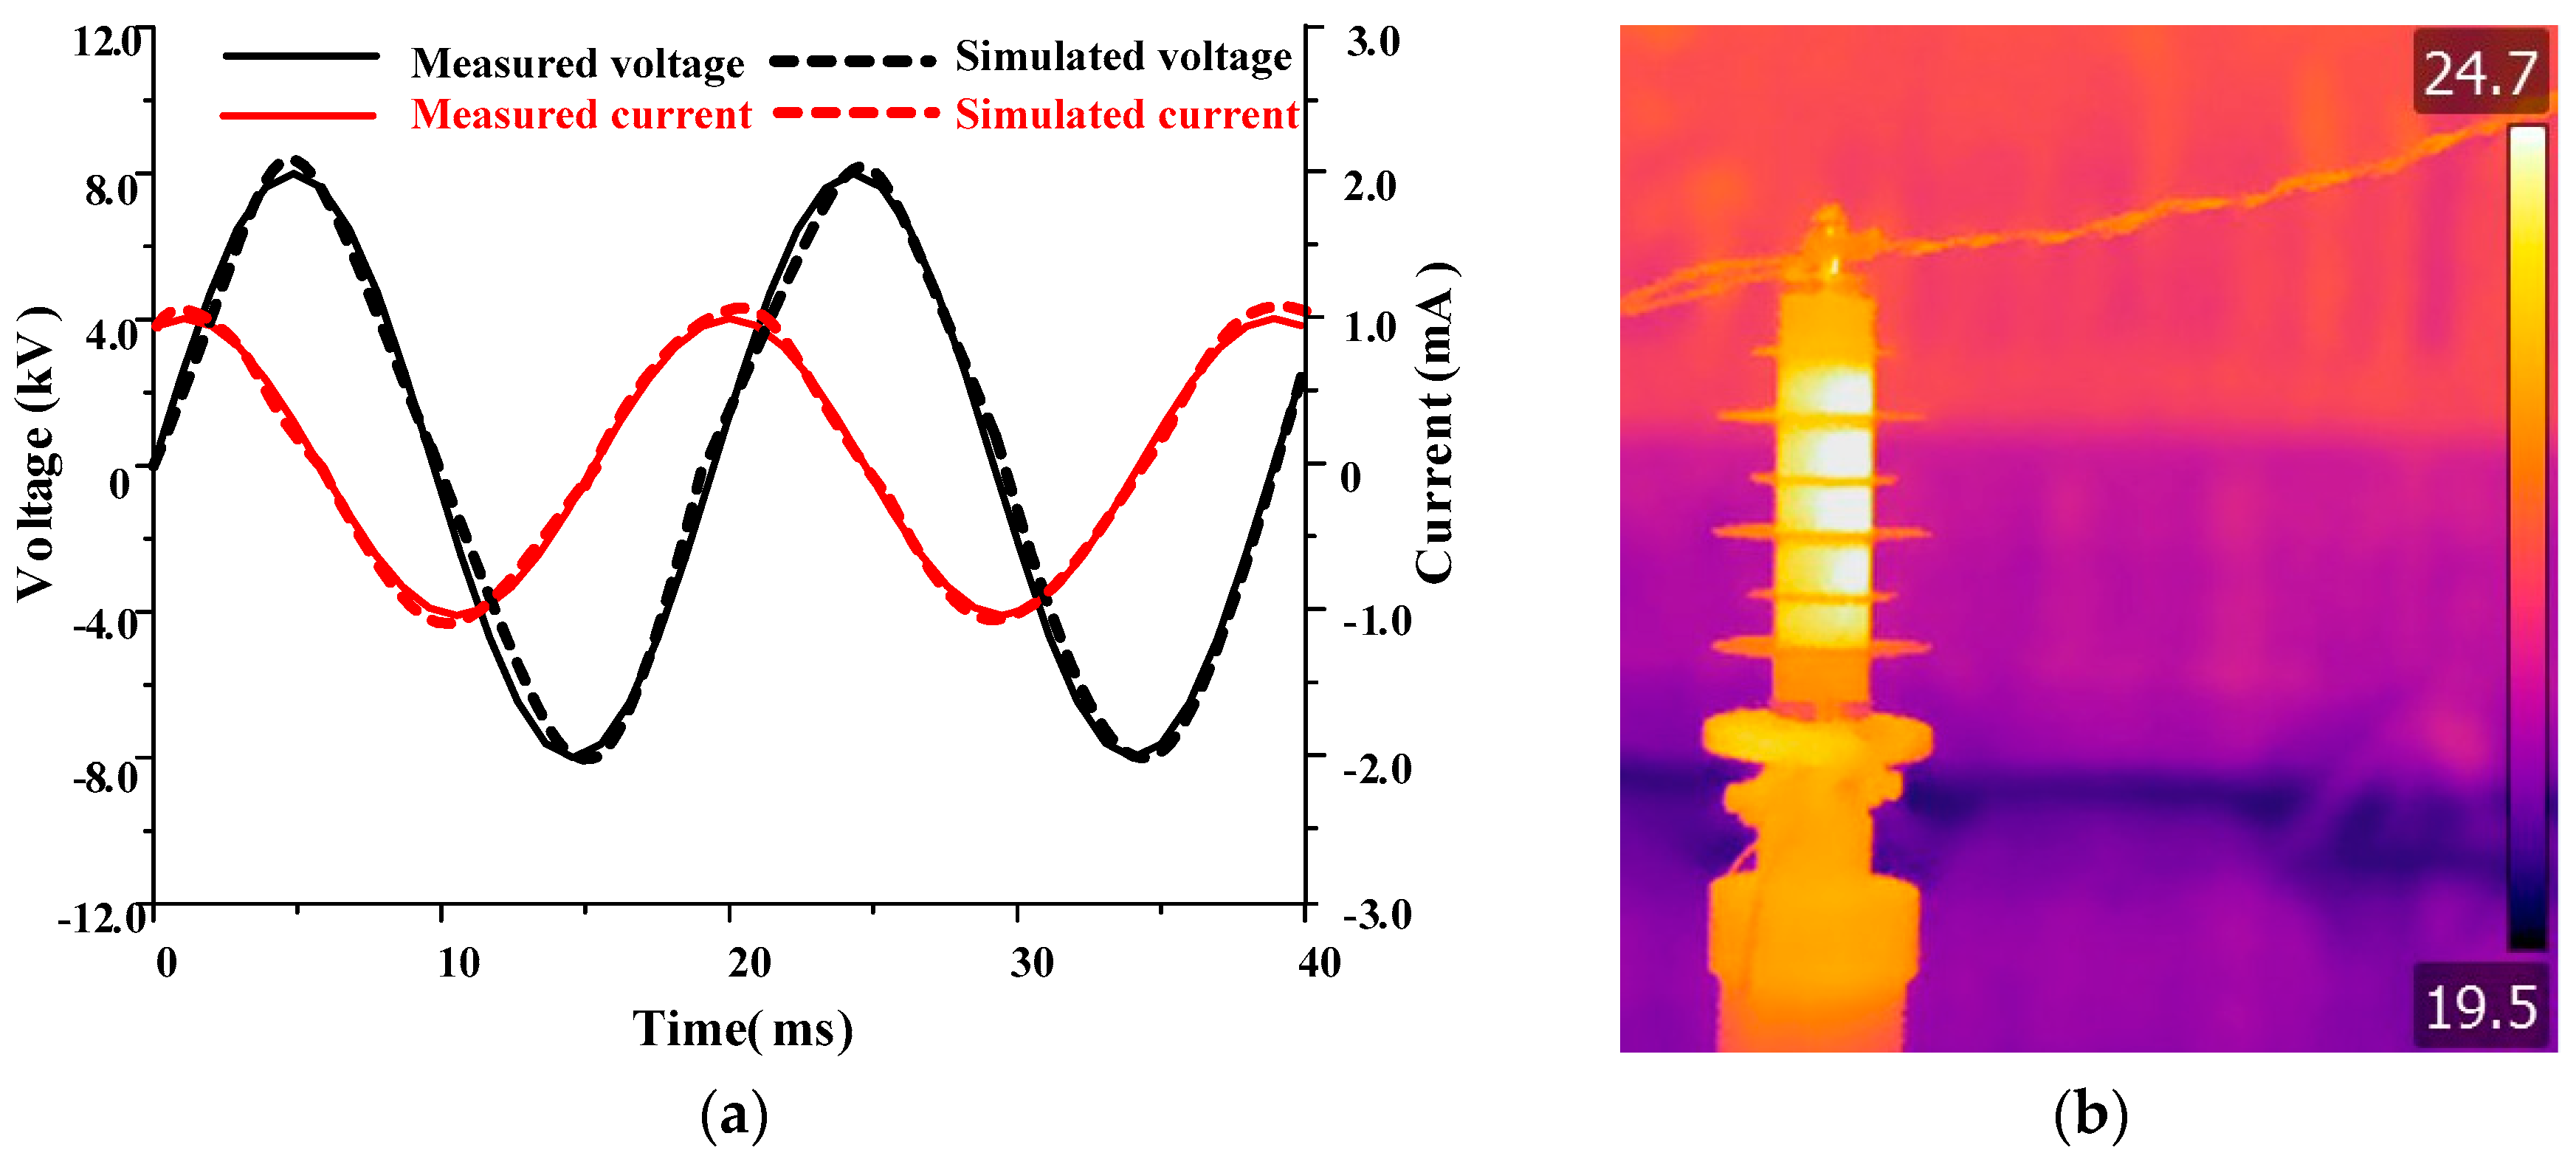
Under normal working conditions, the phase voltage applied on each 10 kV MOA is about 5.8 kV. When the arrester temperature is 24.7 °C, the applied voltage, leakage current, and thermal picture photographed by a high-quality thermal camera is shown in Figure 9. As shown in the figure, the leakage current is in sinusoidal waveform, and the amplitude of the leakage current is about 1 mA. The capacitive current is much larger than the resistive current, and the difference between the temperatures of the varistors in the MOA can be neglected. Seen from Figure 9b, it can be seen that the simulated leakage current can effectively reflect the experimental results.
Due to switching or power system faults, the power frequency overvoltages applied on the MOA can be much higher than operation voltage. In order to monitor these conditions, a 17.4-kV AC overvoltage was applied on the arrester. The voltage applied on the MOA and the leakage current flowing through the varistors are shown in Figure 10a, while the thermal picture photographed by high quality thermal camera is shown in Figure 10b. As shown in Figure 10, when the arrester temperature is 27.9 °C and the applied voltage is 17.4 kV, the leakage current amplitude is about 40 mA. From Figure 10, it can also be seen that the simulated current curve can effectively reflect the amplitude of the experimental results.
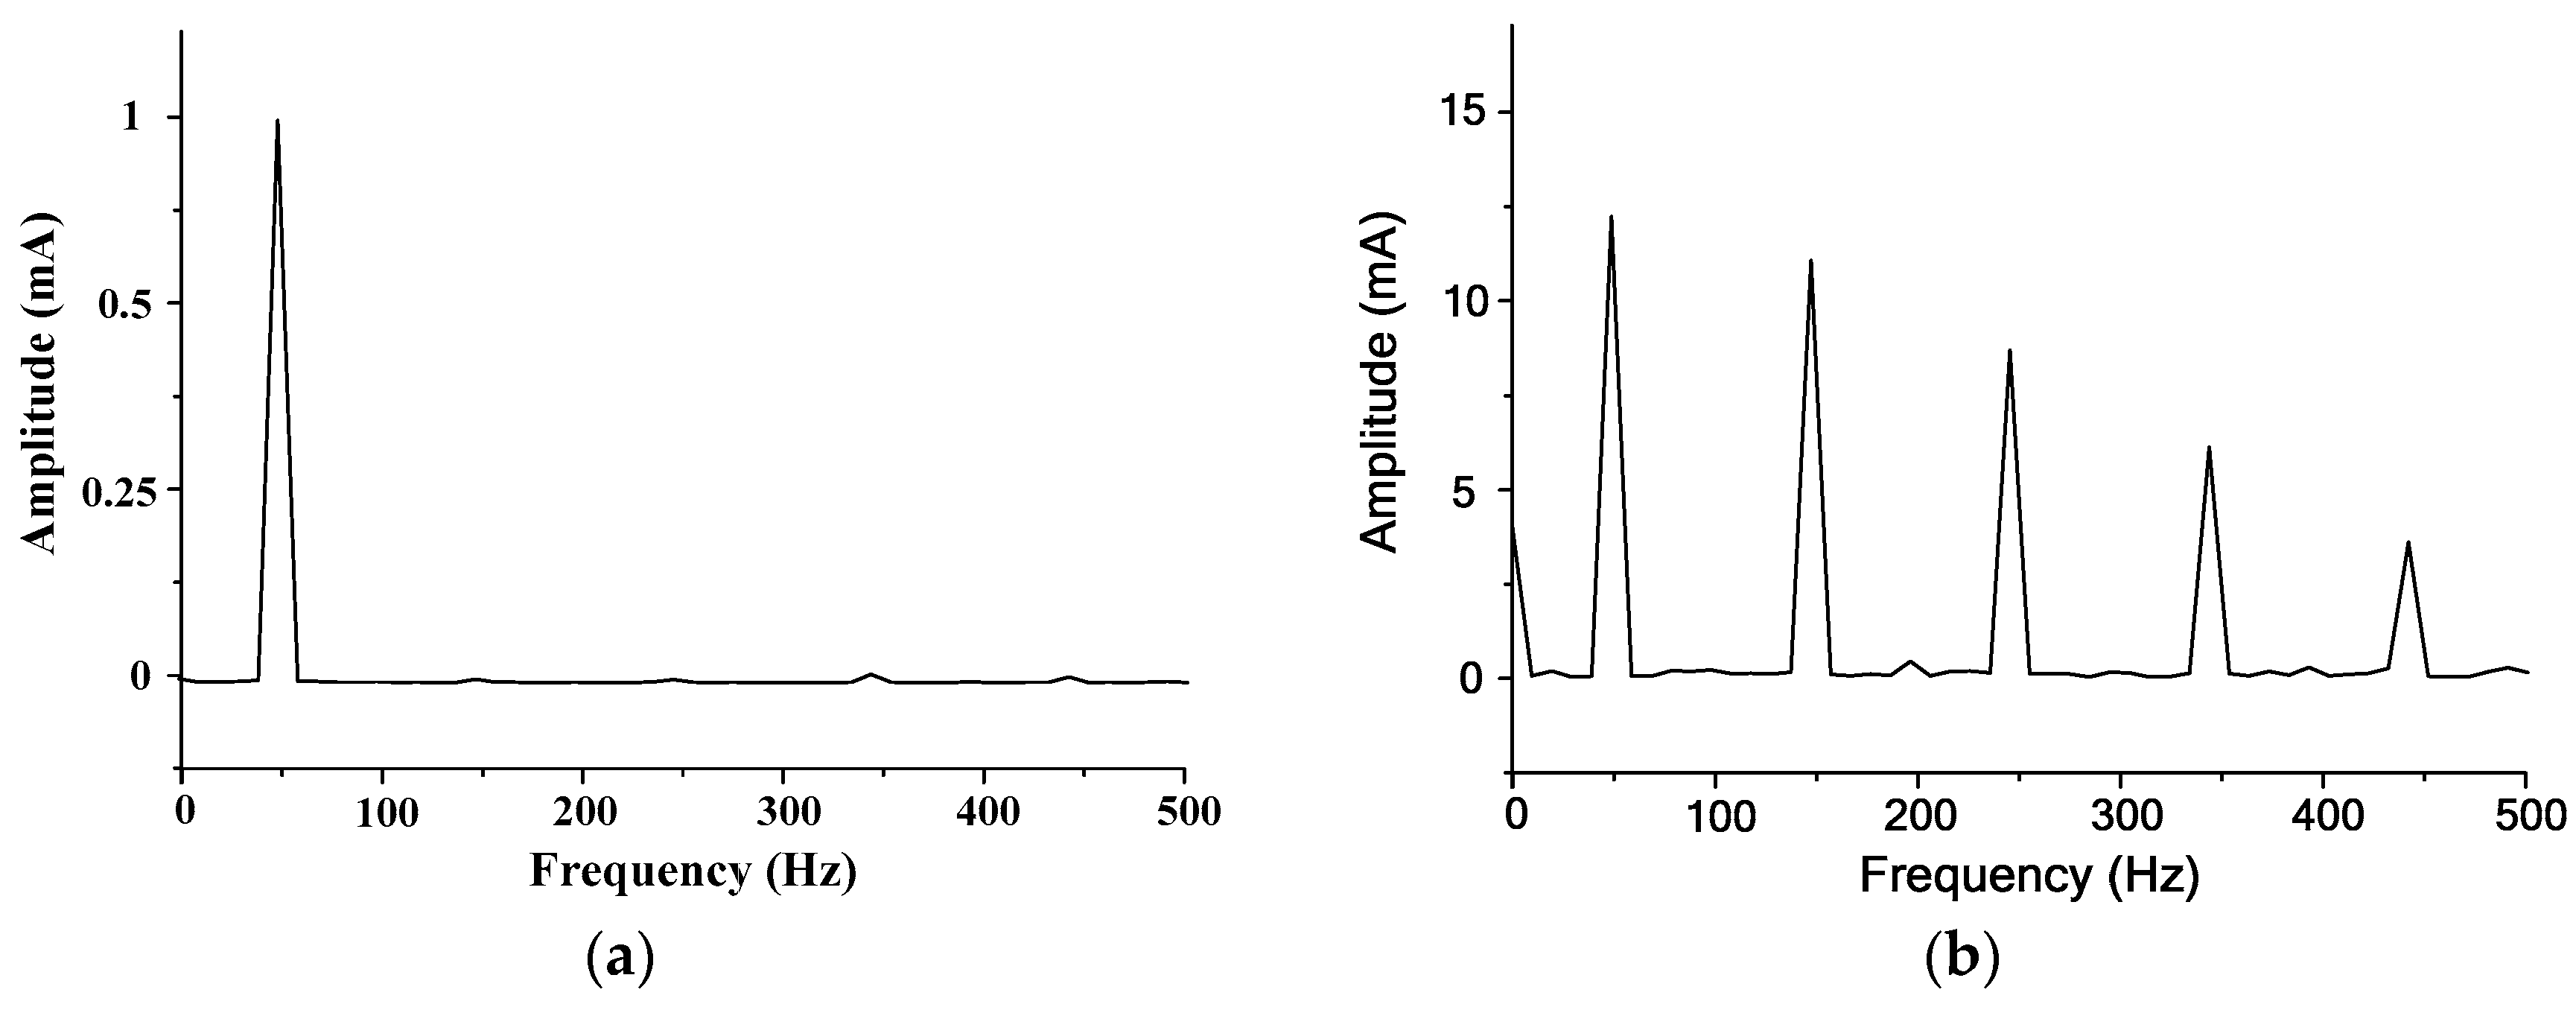
The frequency spectra of the leakage current in Figure 9 and Figure 10 are shown in Figure 11. As shown in Figure 11a, under normal working conditions, the applied voltage is in the linear section of the V–I characteristics curve, and the harmonics of the leakage current are so small that they can be neglected. When the applied voltage reaches the non-linear section, as shown in Figure 11b, the amplitudes and odd harmonics of the leakage current increase greatly.
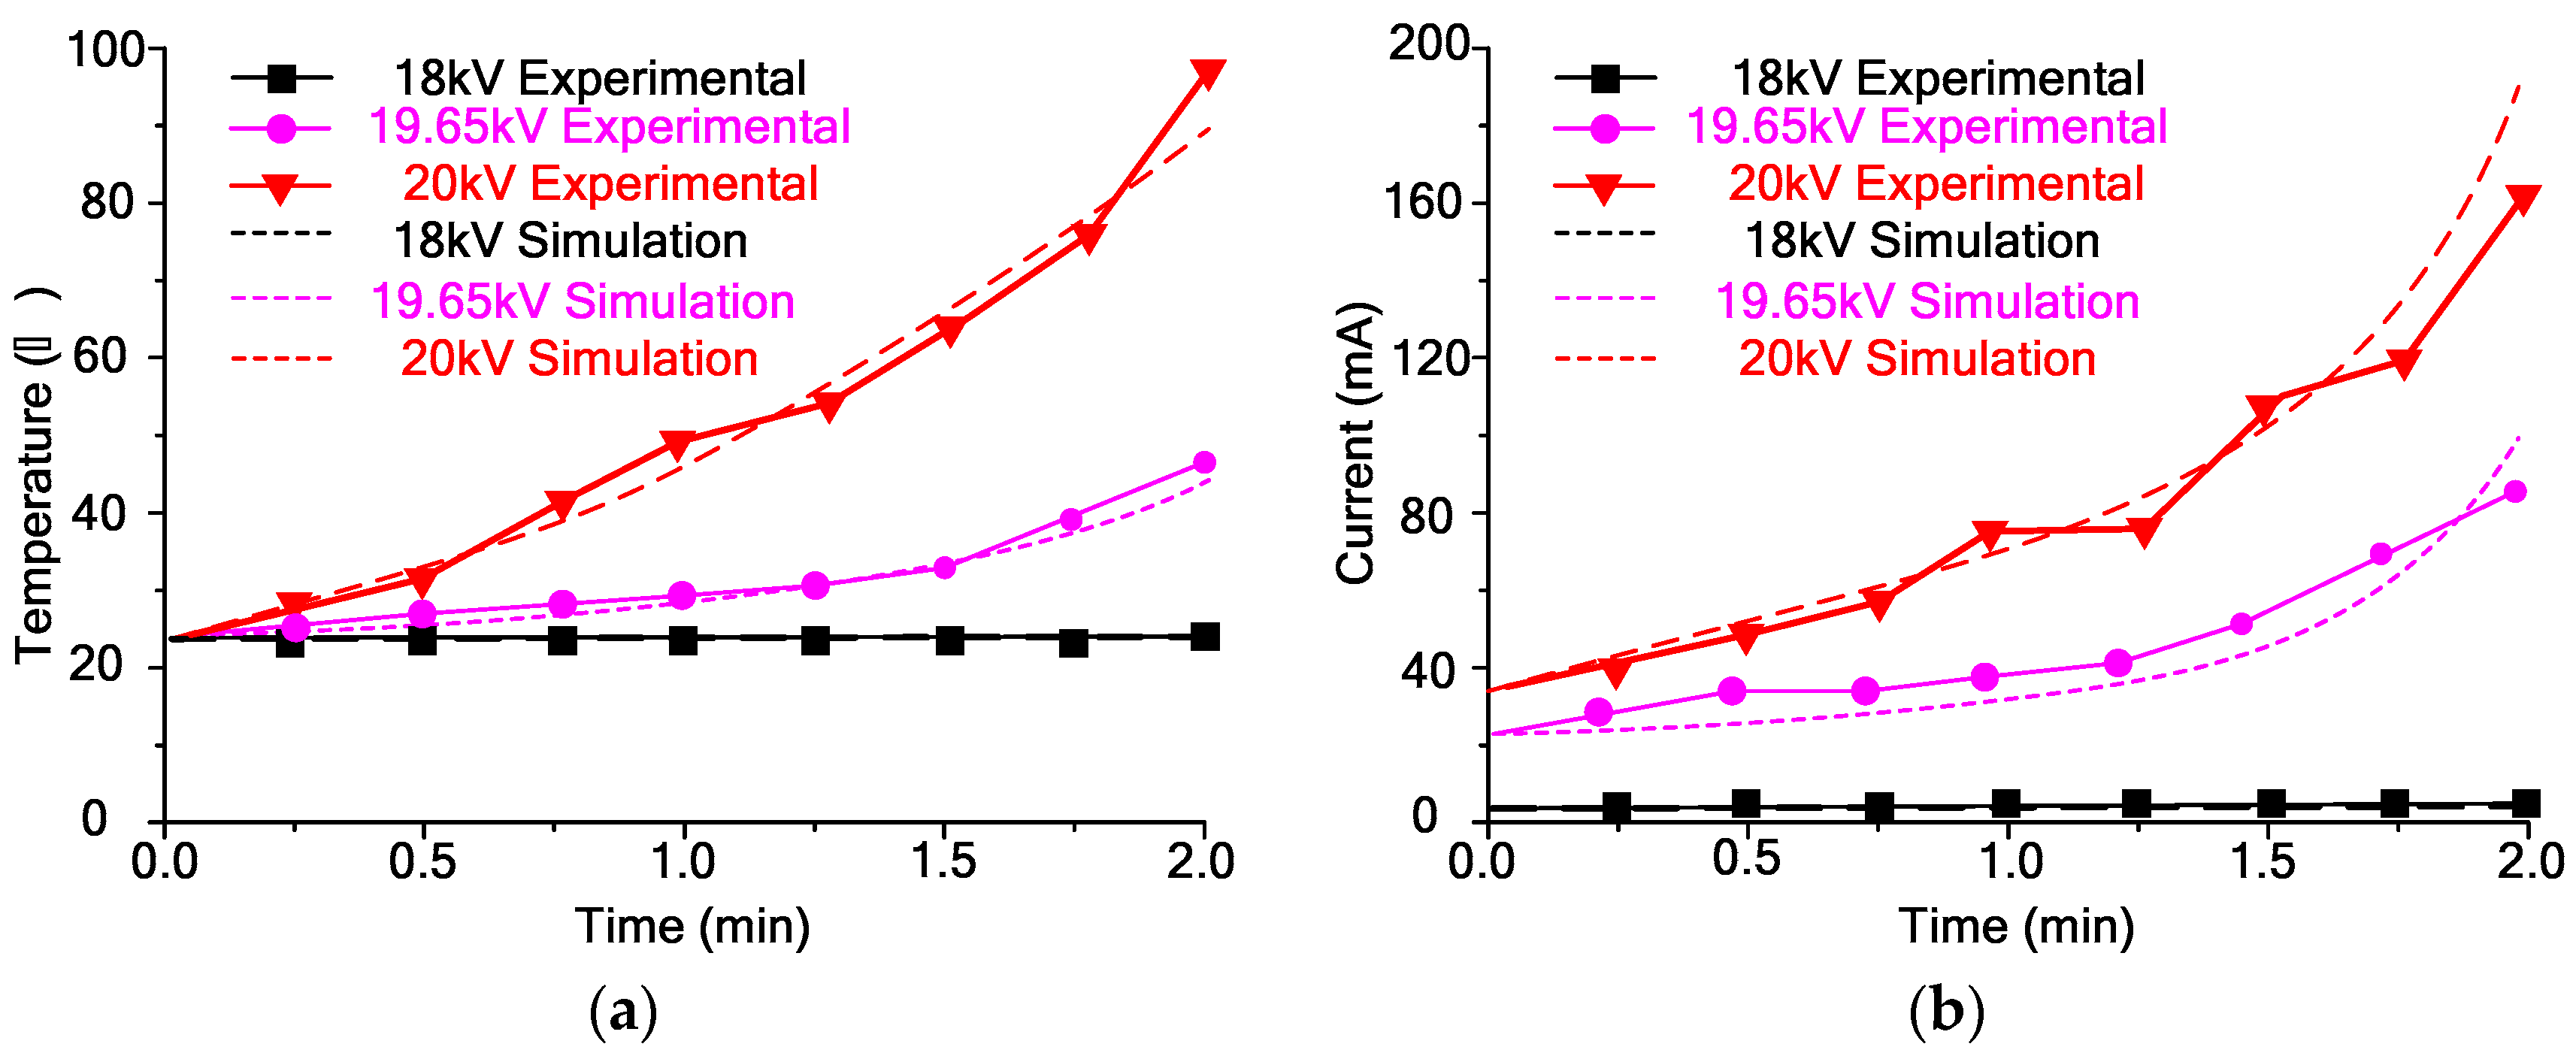
When the ambient temperature is 23 °C, under different overvoltages, the amplitude variations of current and temperature with time are shown in Figure 12, from which it can be seen that when the applied voltage is smaller than 17.4 kV, the arrester temperature is kept stable. When the applied voltage is larger than 17.4 kV, the power loss of the arrester is larger than the heat dissipation, the varistor resistance decreases, and the leakage current increases, leading to an electrothermal failure of MOAs.
6. Discussions
The simulated and measured results in Section 5 can be explained as follows.
Under normal working conditions, when the applied voltage is 5.8 kV, the capacitive component of the leakage current is dominate, the leakage current is in sinusoidal waveform, and the harmonics of leakage current can be neglected. Under power frequency overvoltage, when the applied voltage reaches the non-linear section of the V–I curve, the leakage current increases rapidly, and the resistive component of the leakage current is dominate. The frequency spectra show that the odds harmonics of the leakage current become much higher under power frequency overvoltage.
Under the ambient temperature of 23 °C, when the power frequency overvoltage is smaller than 18 kV, the power loss caused by the leakage current is equal to the heat emitted into the ambient; thus, the temperature of the MOA remains stable when the applied voltage is smaller than 18 kV. When the applied voltage increases continuously, the heat created by the leakage current is larger than the emitted heat, leading to an exponentially increasing MOA temperature. This increases the leakage current in the ZnO varistors, and finally leads to the thermal failure of the MOA.
According to the above discussion, it is suggested that the critical voltage between the small current and non-linear regions should be designed to be higher than the max power frequency voltages in the power system; thus, the electrothermal failure of the MOA can be avoided under power frequency overvoltages.
7. Conclusions
In this paper, an electrothermal model of a MOA has been proposed. It has considered the interaction between the leakage current and the temperature rise of the MOA. Using applied voltage, ambient temperature, and initial temperature as input data, the temperature and leakage current of a MOA at any time can be calculated. Experimental validations have been done, and the experimental and simulated results show good agreement with each other.
The electrothermal models in this paper can be used to predict not only the voltage and leakage current, but also the temperature characteristics of a MOA. It is also suggested that the critical voltage between the small current and non-linear regions should be designed to be higher than the max power frequency voltages in the power system to avoid the electrothermal failure of MOAs. The studies in this paper can assist with the design and type selection of MOAs in the power system.
Author Contributions
P.X. carried out the experiments, analyzed the test results, and wrote this paper. J.L. gave input to the analysis of test results. J.H. and Z.F. carried out the experimental set up.
Funding
This research was funded by State Grid Corporation of China Science and Technology Program, grant number [5216AF160005].
Acknowledgments
The authors gratefully acknowledge the contributions of all members of the external insulation research team in State Grid Hunan Electric Power Corporation for their work on this paper.
Conflicts of Interest
The authors declare no conflict of interest.
References
- Gu, S.Q.; Chen, W.J.; He, J.L.; Shen, H.B.; Zhang, S. Development of Surge Arresters with Series Gap Against Lightning Breakage of Covered Conductors on Distribution Lines. IEEE Trans. Power Deliv. 2007, 4, 2191–2198. [Google Scholar] [CrossRef]
- Toshihiro, T.; Jun, T.; Shigemitsu, O. Energy Absorption Capacity of a 500 kV Surge Arrester for Direct and Multiple Lightning Strokes. IEEE Trans. Dielectr. Electr. Insul. 2015, 2, 916–924. [Google Scholar] [CrossRef]
- Brito, V.S.; Lira, G.R.S.; Costa, E.G.; Maia, M.J.A. A Wide-Range Model for Metal-Oxide Surge Arrester. IEEE Trans. Power Deliv. 2018, 1, 102–109. [Google Scholar] [CrossRef]
- Tominaga, S.; Azumi, K.; Shibuya, Y.; Imataki, M.; Fujiwara, Y.; Nishida, S. Protective Performance of Metal Oxide Surge Arrester Based on the Dynamic V-I Characteristics. IEEE Trans. Power Apparatus Syst. 1979, 6, 1860–1871. [Google Scholar] [CrossRef]
- Magro, M.C.; Giannettoni, M.; Pinceti, P. Validation of ZnO surge arresters model for overvoltage studies. IEEE Trans. Power Deliv. 2004, 4, 1692–1695. [Google Scholar] [CrossRef]
- Nigol, O. Methods for analyzing the performance of gapless metal oxide surge arresters. IEEE Trans. Power Deliv. 1992, 3, 1256–1264. [Google Scholar] [CrossRef]
- Li, S.T.; He, J.Q.; Lin, J.J.; Wang, H.; Liu, W.F.; Liao, Y.L. Electrical-Thermal Failure of Metal-Oxide Arrester by Successive Impulses. IEEE Trans. Power Deliv. 2016, 6, 2538–2545. [Google Scholar] [CrossRef]
- He, J.Q.; Lin, J.; Liu, W.Q.; Wang, H.; Liao, Y.; Li, S.T. Structure-Dominated Failure of Surge Arresters by Successive Impulses. IEEE Trans. Power Deliv. 2017, 4, 1907–1913. [Google Scholar] [CrossRef]
- Christodoulou, C.; Vita, V.; Perantzakis, G.; Ekonomou, L.; Milushev, G. Adjusting the Parameters of Metal Oxide Gapless Surge Arresters’ Equivalent Circuits Using the Harmony Search Method. Energies 2017, 10, 2168. [Google Scholar] [CrossRef]
- Tuczek, M.N.; Hinrichsen, V. Recent Experimental Findings on the Single and Multi-Impulse Energy Handling Capability of Metal-Oxide Varistors for Use in High-Voltage Surge Arresters. IEEE Trans. Power Deliv. 2014, 5, 2197–2205. [Google Scholar] [CrossRef]
- Stojanovi, Z.N.; Stojkovi, Z.M. Evaluation of MOSA condition using leakage current method. Electr. Power Energy Syst. 2013, 52, 87–95. [Google Scholar] [CrossRef]
- Bargigia, A.; De, N.; Pigini, A. Comparison of Different Test Method to Assess the Thermal Stresses of Metal Oxid Surge Arrester under Pollution Condition. IEEE Trans. Power Deliv. 1993, 1, 146–155. [Google Scholar] [CrossRef]
- Spack-Leigsnering, Y.; Gjonaj, E.; De Gersem, H.; Weiland, T.; GieBel, M.; Hinrichsen, V. Electroquasi static-Thermal Modeling and Simulation of Station Class Surge Arresters. IEEE Trans. Magnet. 2016, 3, 1–4. [Google Scholar] [CrossRef]
- Lundquist, J.; Stenstrom, L.; Schei, A.; Hansen, B. New method for measurement of the resistive leakage currents of metal-oxide surge arresters in service. IEEE Trans. Power Deliv. 1990, 5, 1811–1822. [Google Scholar] [CrossRef]
- Seyyedbarzegar, S.M.; Mirzaie, M. Heat Transfer Analysis of Metal Oxide Surge Arrester under Power Frequency Applied Voltage. Energy 2015, 93, 141–153. [Google Scholar] [CrossRef]
- Schmidt, W.; Meppelink, J.; Richter, B.; Feser, K.; Kehl, L.E.; Qui, D. Behaviour of MO-surge-arrester blocks to fast transients. IEEE Trans. Power Deliv. 1989, 1, 292–300. [Google Scholar] [CrossRef]
- Vita, V.; Mitropoulou, A.D.; Ekonomou, L.; Panetsos, S.; Stathopulos, I.A. Comparison of metal-oxide surge arresters circuit models and implementation on high-voltage transmission lines of the Hellenic network. IET Gen. Transm. Distrib. 2010, 5, 846–853. [Google Scholar] [CrossRef]
- Kim, I.; Funabashi, T.; Sasaki, H.; Hagiwara, T.; Kobayashi, M. Study of ZnO arrester model for steep front wave. IEEE Trans. Power Deliv. 1996, 2, 834–841. [Google Scholar] [CrossRef]
- He, J.L.; Zeng, R.; Chen, S.M.; Tu, Y.P. Thermal Characteristics of High Voltage Whole-solid-insulated Polymeric ZnO Surge Arrester. IEEE Trans. Power Deliv. 2003, 4, 1221–1227. [Google Scholar] [CrossRef]
- Bartkowiak, M.; Comber, M.G.; Mahan, G.D. Failure modes and energy absorption capability of ZnO varistors. IEEE Trans. Power Deliv. 1999, 1, 152–162. [Google Scholar] [CrossRef]
- Petit, A.; Do, X.D.; Jean, G.S. An experimental method to determine the electro-thermal model parameters of metal oxide surge arresters. IEEE Trans. Power Deliv. 1991, 2, 715–721. [Google Scholar] [CrossRef]
- Lat, M.V. Thermal Properties of Metal Oxide Surge Arresters. IEEE Trans. Power Apparatus Syst. 1983, 7, 2194–2202. [Google Scholar] [CrossRef]
- Lat, M.V. Analytical Method for Performance Prediction of Metal Oxide Surge Arresters. IEEE Trans. Power Apparatus Syst. 1985, 10, 2664–2674. [Google Scholar] [CrossRef]
- Zheng, Z.; Boggs, S.A.; Imai, T.; Nishiwaki, S. Computation of Arrester Thermal Stability. IEEE Trans. Power Deliv. 2010, 3, 1526–1529. [Google Scholar] [CrossRef]
- Zhao, G.; Joshi, R.P.; Lakdawala, V.K.; Hjalmarson, H.P. Electro-thermal Simulation Studies for Pulsed Voltage Induced Energy Absorption and Potential Failure in Microstructured ZnO Varistors. IEEE Trans. Dielectr. Electr. Insul. 2007, 4, 1007–1015. [Google Scholar] [CrossRef]
- Latiff, N.A.A.; Illias, H.A.; Bakar, A.H.A.; Dabbak, S.Z.A. Measurement and Modelling of Leakage Current Behaviour in ZnO Surge Arresters under Various Applied Voltage Amplitudes and Pollution Conditions. Energies 2018, 4, 875. [Google Scholar] [CrossRef]
- Seyyedbarzegar, S.M.; Mirzaie, M. Thermal balance diagram modelling of surge arrester for thermal stability analysis considering ZnO varistor degradation effect. IET Gen. Transm. Distrib. 2016, 7, 1570–1581. [Google Scholar] [CrossRef]
- Seyyedbarzegar, S.M. A new approach to electrical modeling of surge arrester considering temperature effect on V-I characteristic. Measurement 2017, 111, 295–306. [Google Scholar] [CrossRef]
Figure 1.
Conventional circuit model for ZnO varistor and metal-oxide arrester (MOA): (a) varistor model; (b) MOA model.
Figure 1.
Conventional circuit model for ZnO varistor and metal-oxide arrester (MOA): (a) varistor model; (b) MOA model.

Figure 2.
Diagram of the electrothermal MOA model.

Figure 3.
Calculation diagram for electrothermal characteristics’ estimation.

Figure 4.
Experimental setup for voltage–current–temperature (V–I–T) characteristics measurement: (a) experimental circuit; (b) test species and oven.
Figure 4.
Experimental setup for voltage–current–temperature (V–I–T) characteristics measurement: (a) experimental circuit; (b) test species and oven.

Figure 5.
Diagram of the artificial neural network (ANN) algorithm.
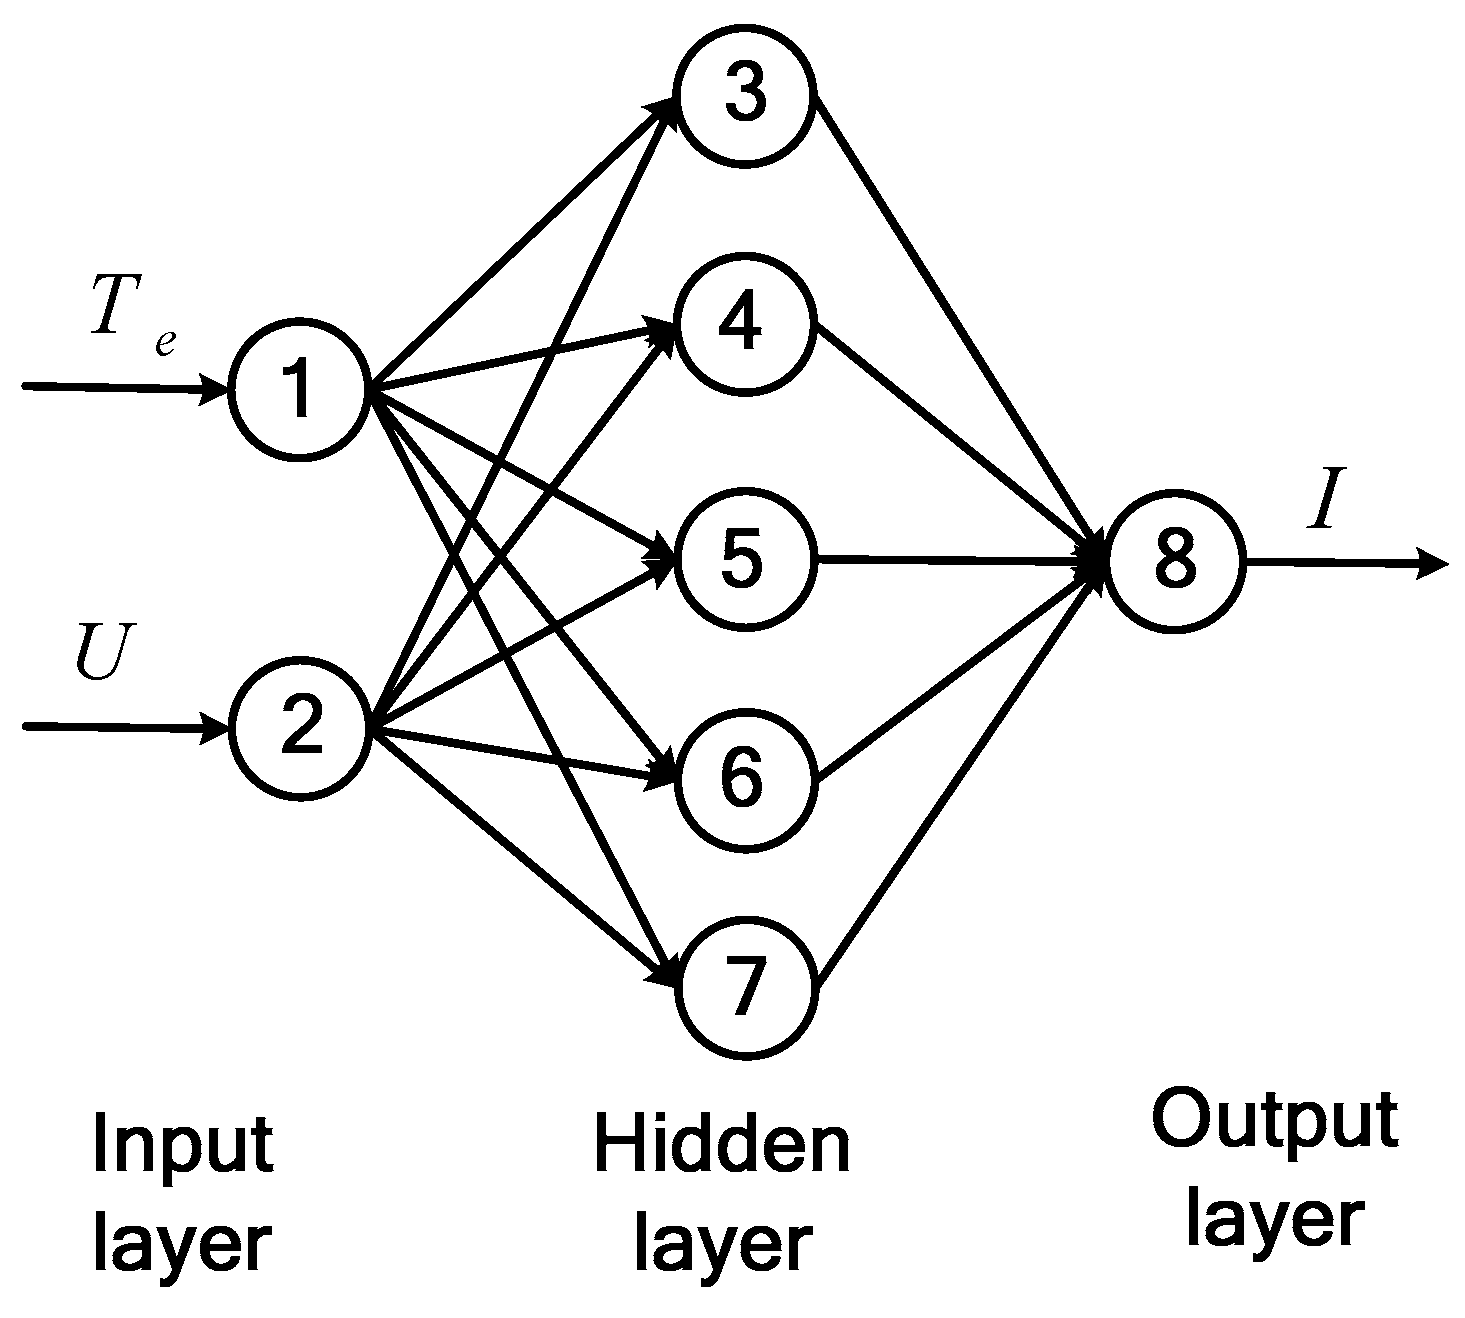
Figure 6.
Finite element simulation model of MOA.
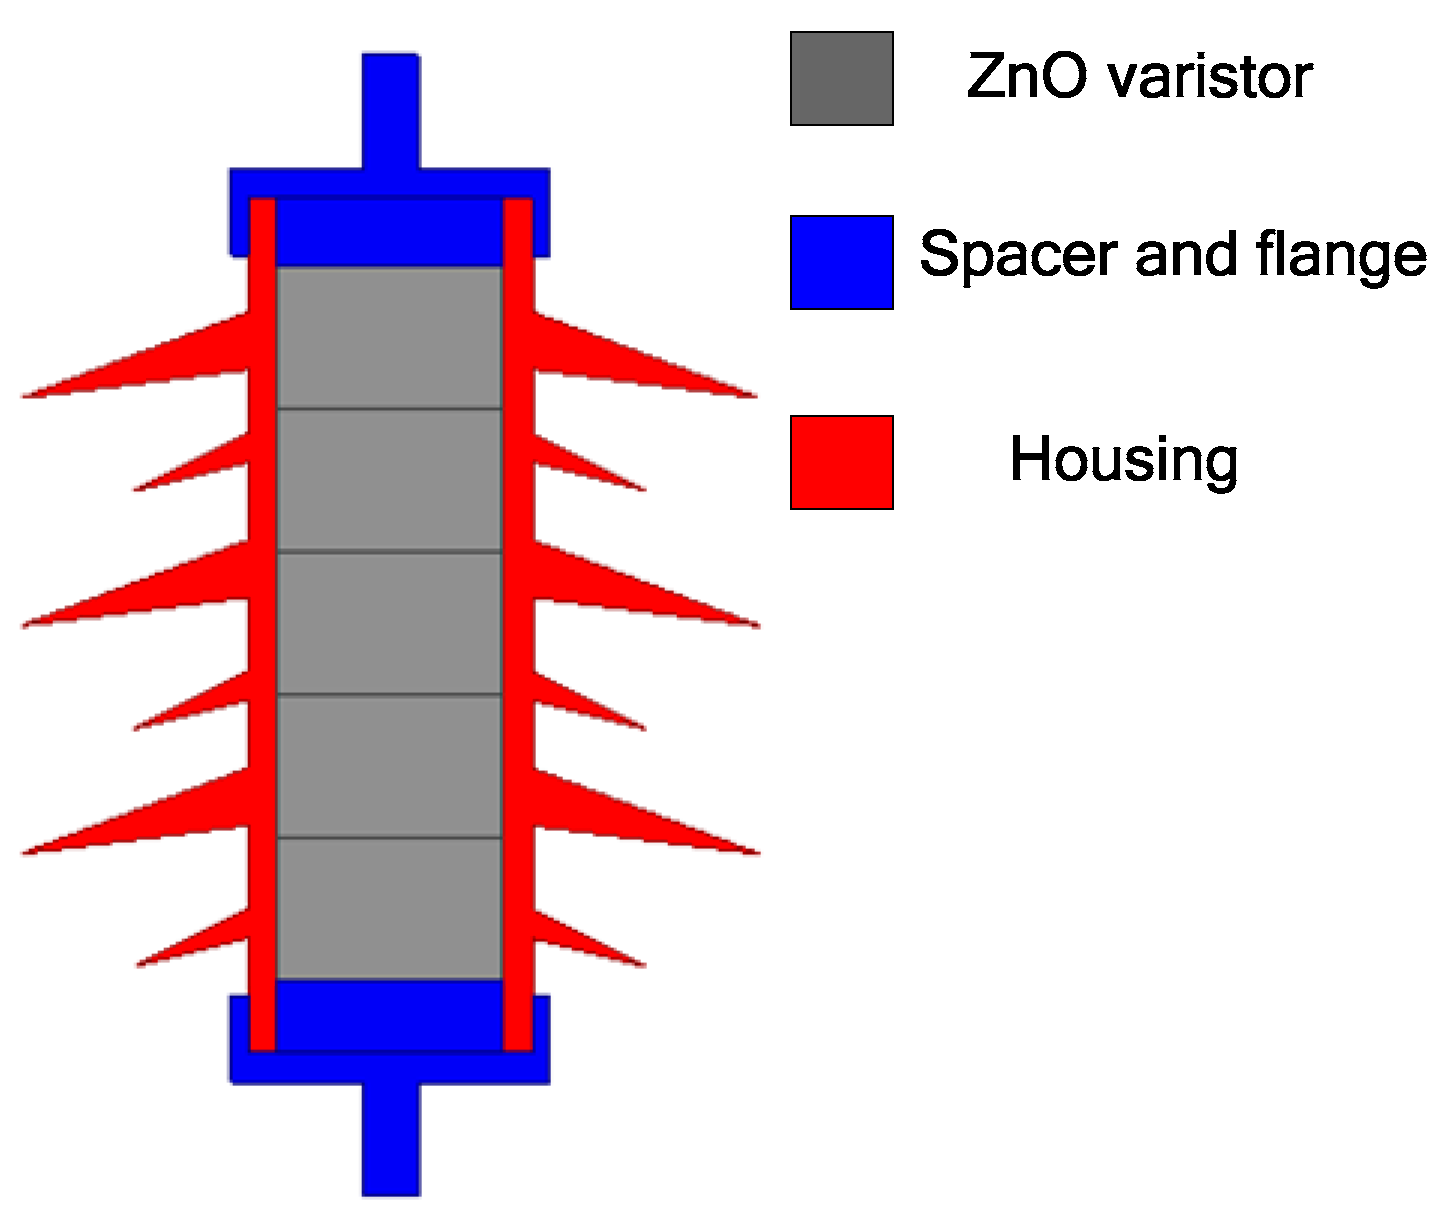
Figure 7.
Comparison of V–I–T characteristics between simulated and experimental results.
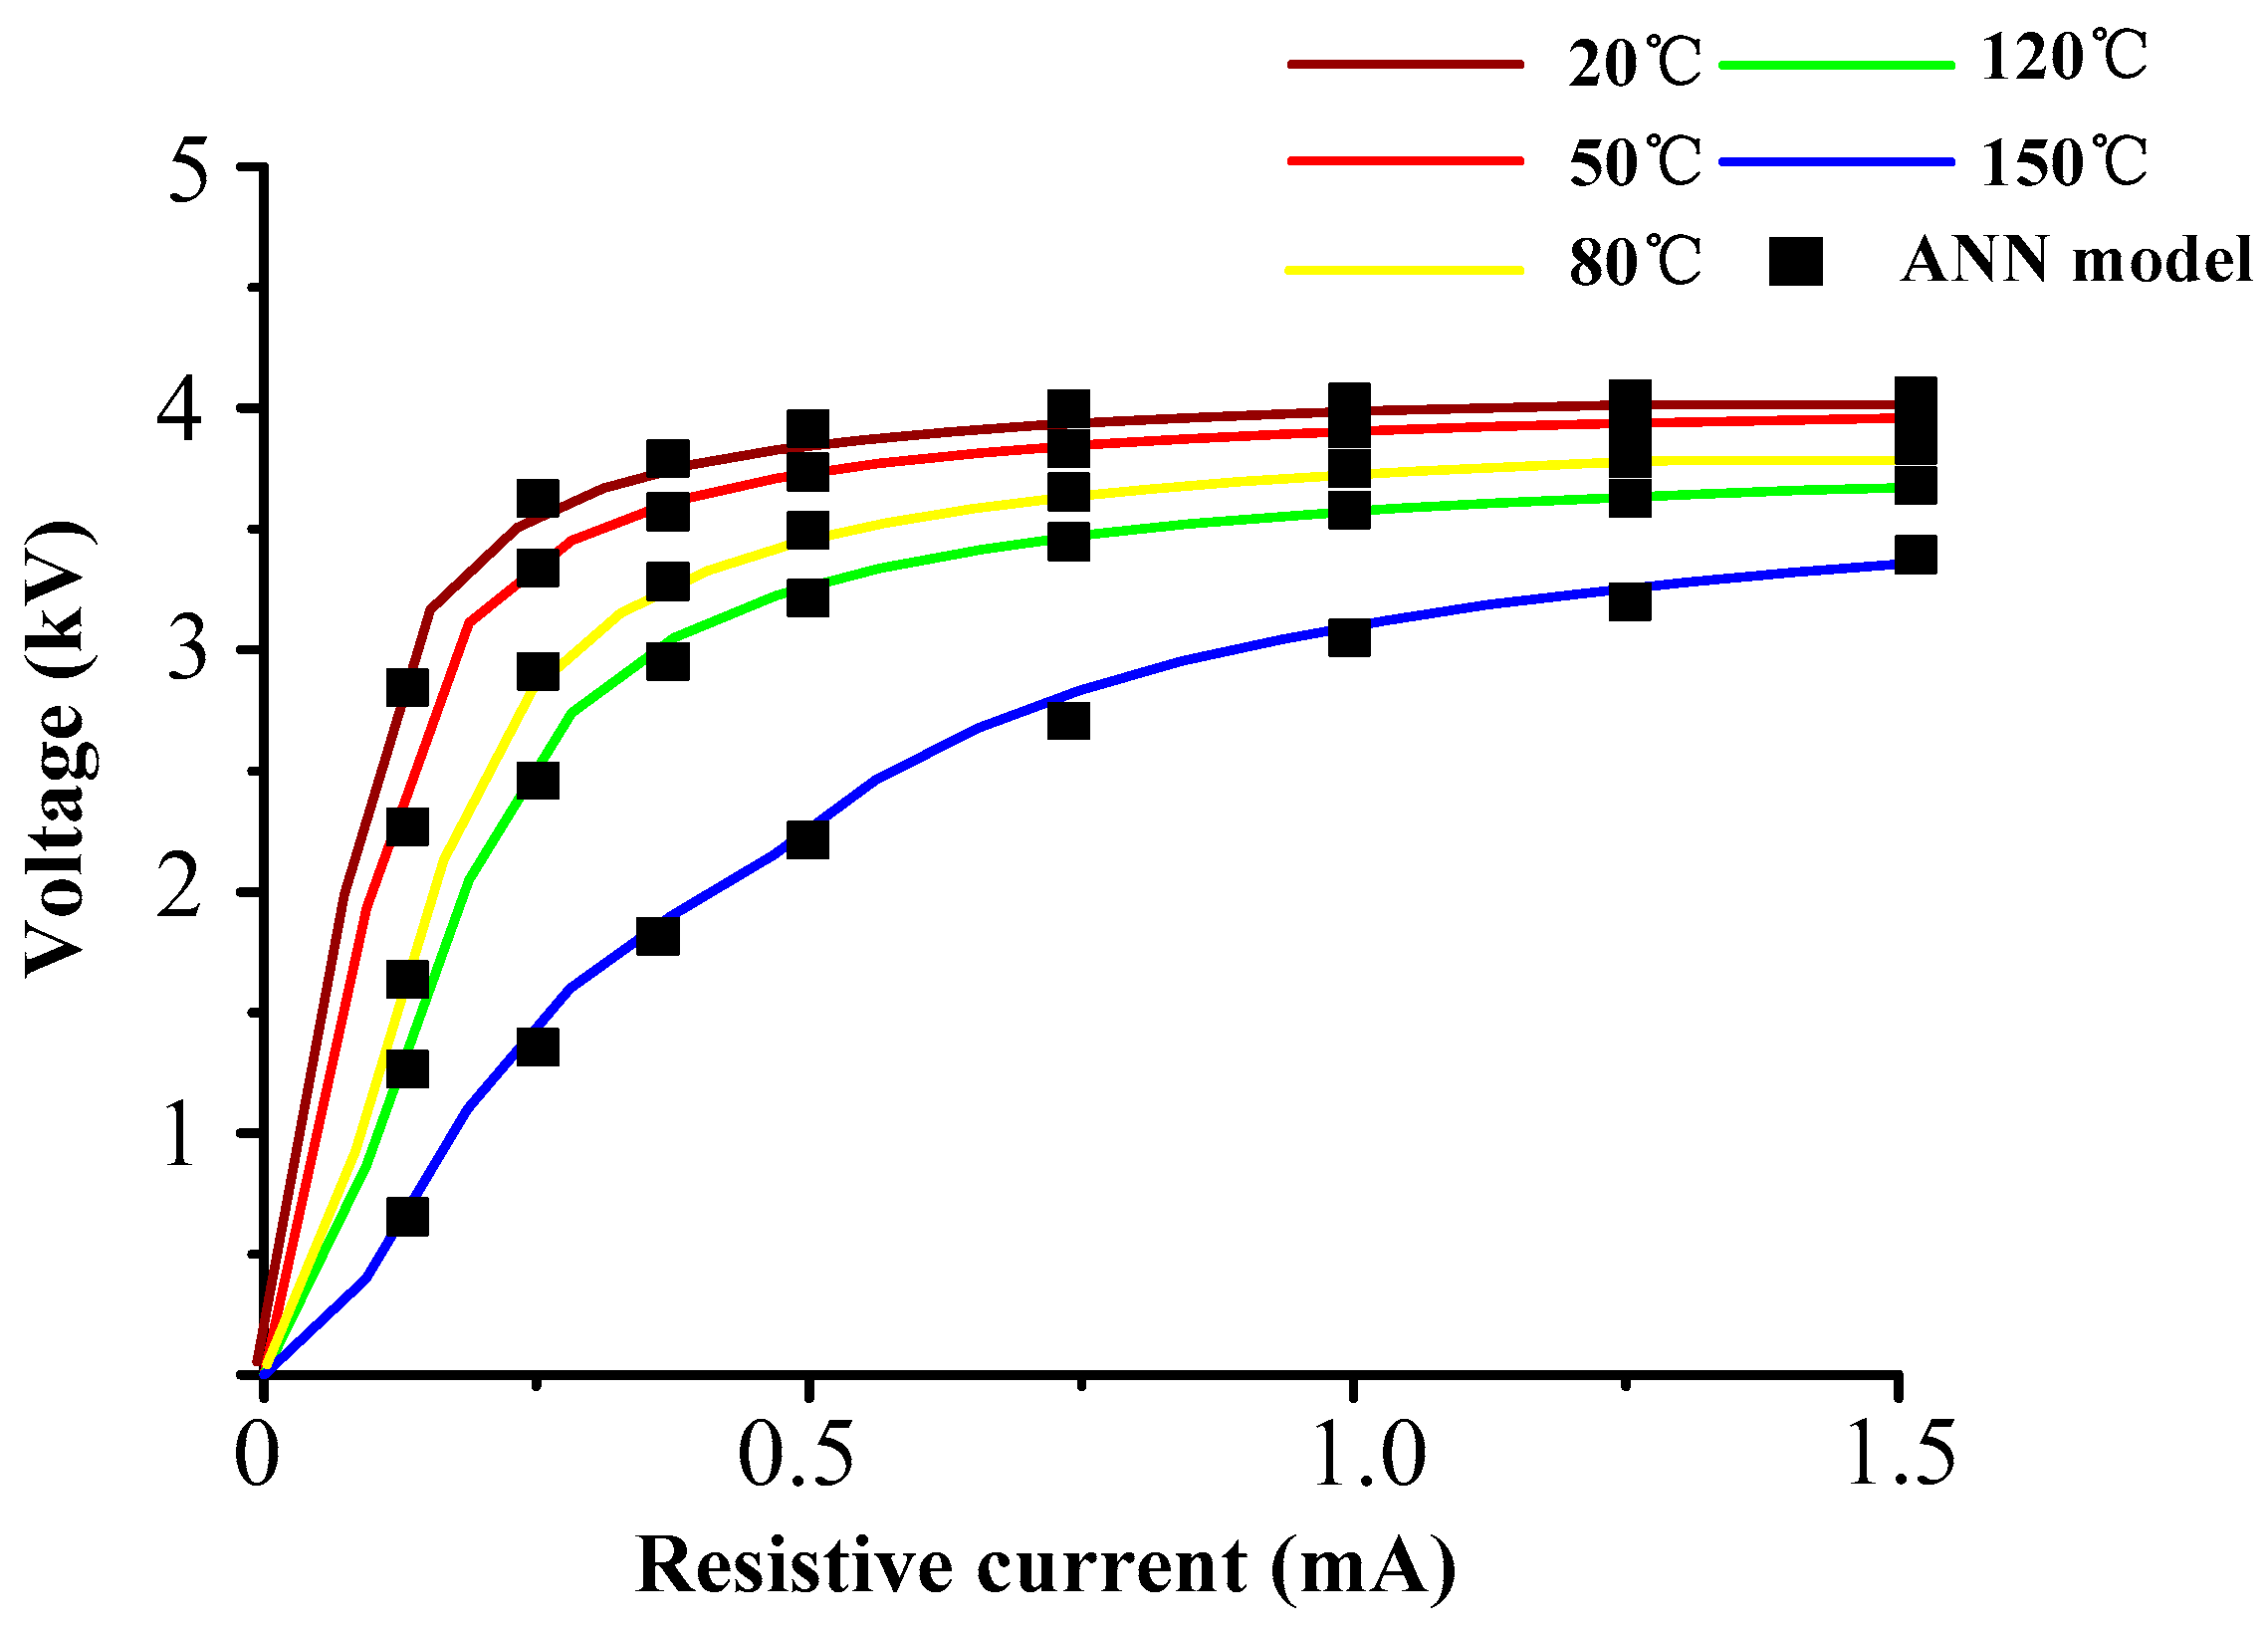
Figure 8.
Thermal model of MOA.

Figure 9.
Electrothermal characteristics of MOA under the applied voltage of 5.8 kV. (a) Voltage and current time curves; (b) thermal picture.
Figure 9.
Electrothermal characteristics of MOA under the applied voltage of 5.8 kV. (a) Voltage and current time curves; (b) thermal picture.

Figure 10.
Electrothermal characteristics of MOA under the applied voltage of 17.4 kV. (a) Voltage and current time curves/courses; (b) thermal picture.
Figure 10.
Electrothermal characteristics of MOA under the applied voltage of 17.4 kV. (a) Voltage and current time curves/courses; (b) thermal picture.
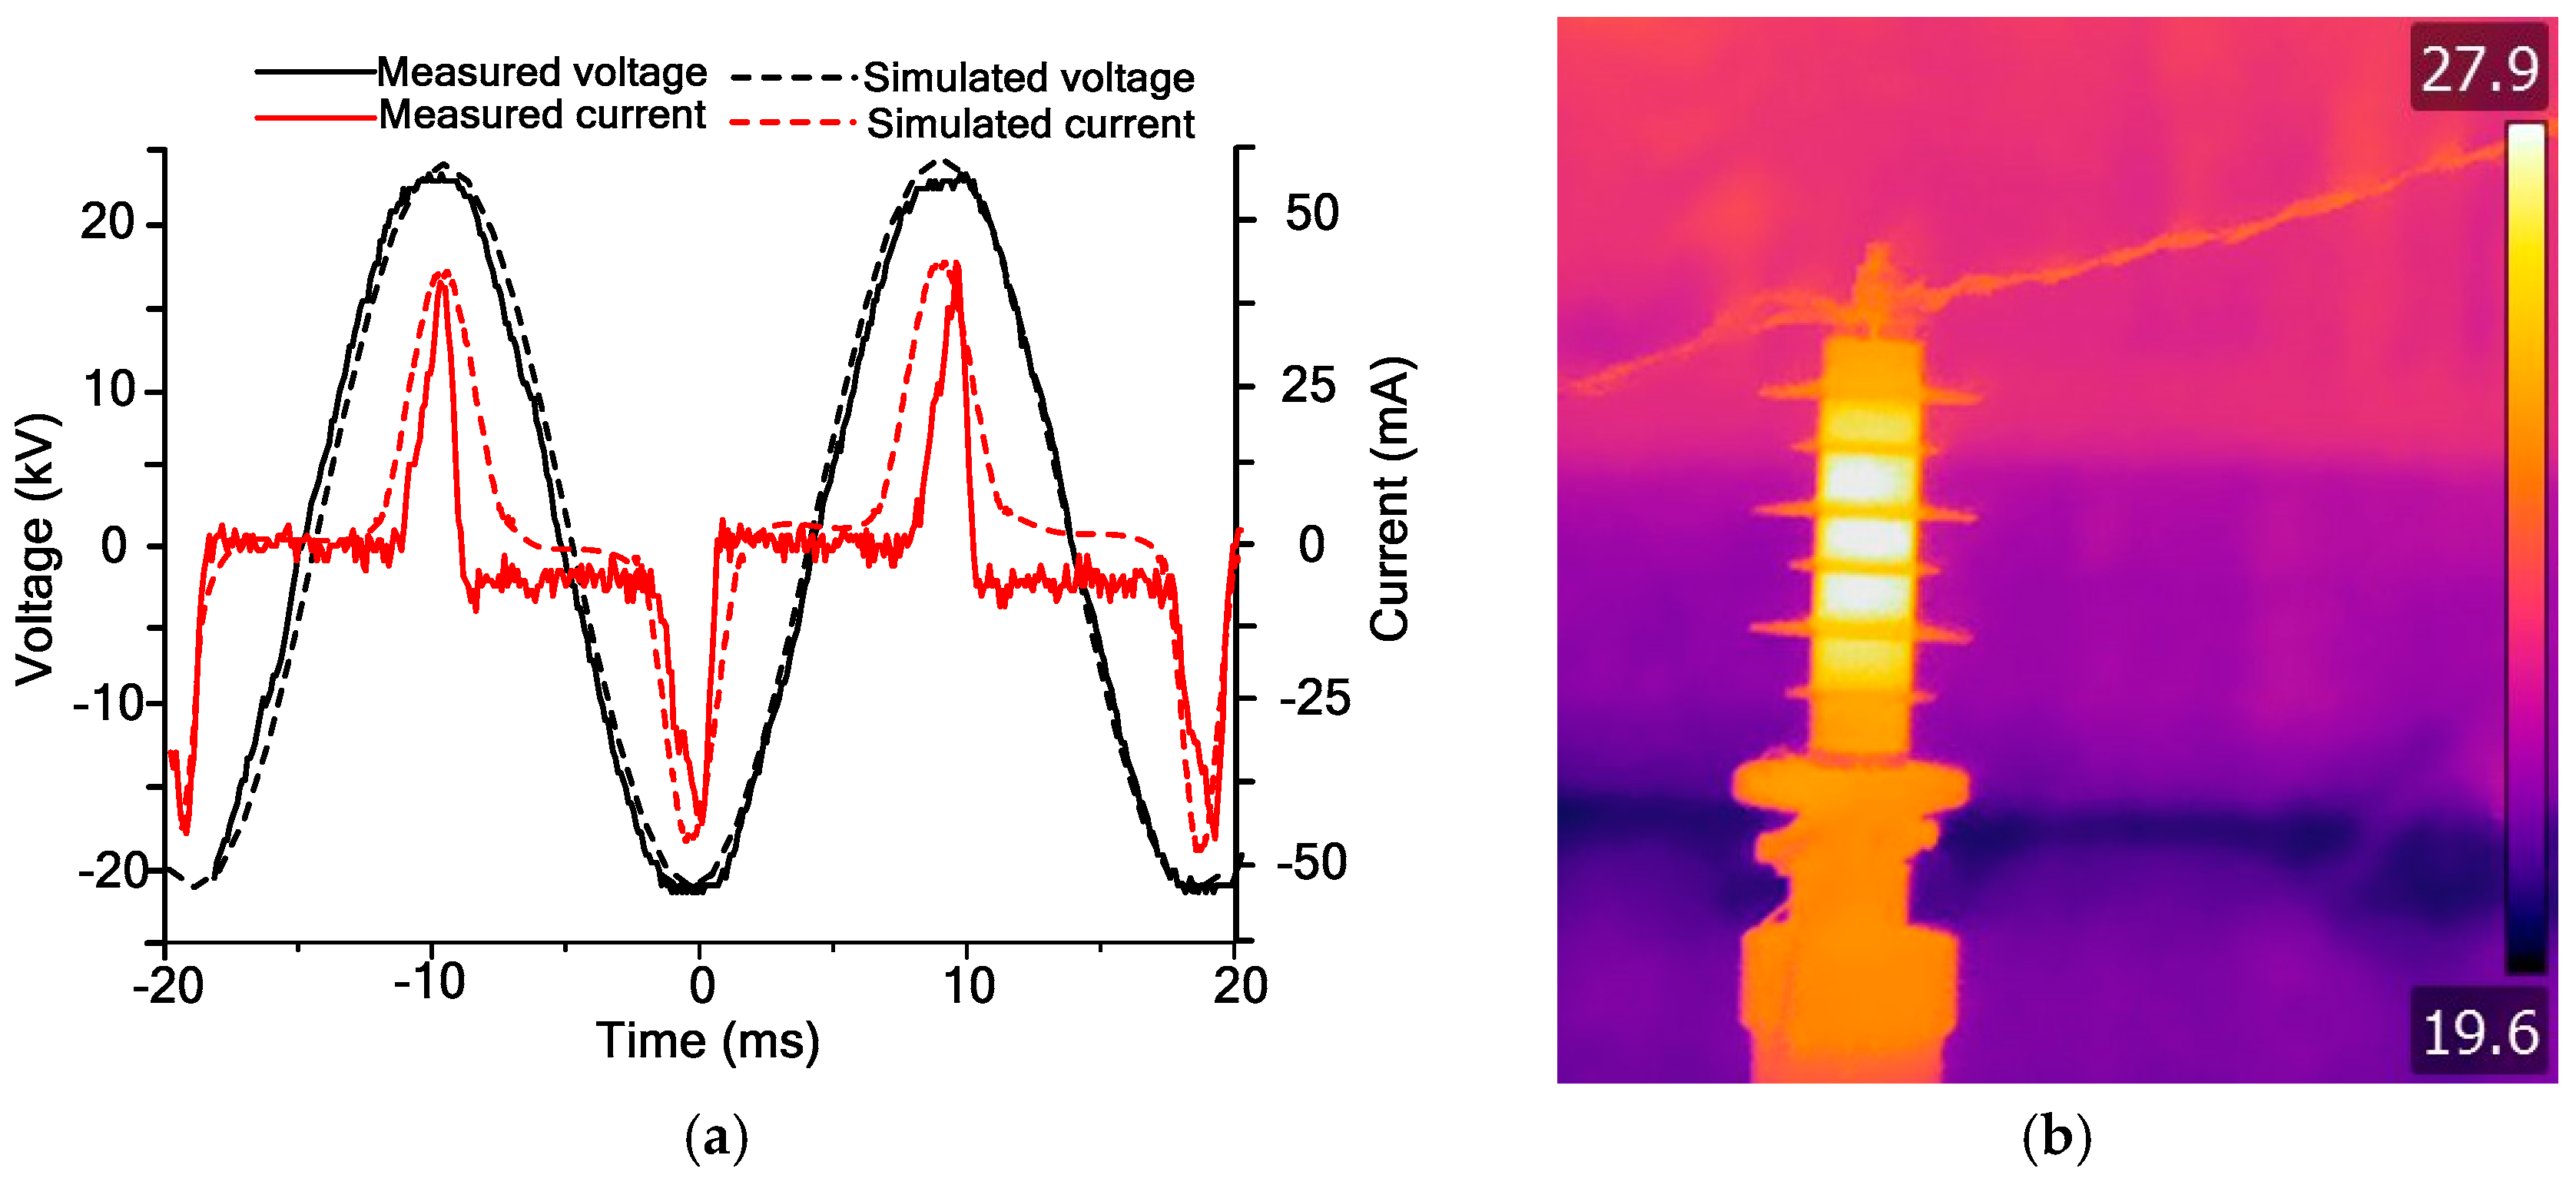
Figure 11.
Frequency spectra of the leakage current. (a) U = 5.8 kV; (b) U = 17.4 kV.

Figure 12.
Amplitudes’ variation of temperature and leakage current with time. (a) Temperature; (b) leakage current.
Figure 12.
Amplitudes’ variation of temperature and leakage current with time. (a) Temperature; (b) leakage current.
© 2018 by the authors. Licensee MDPI, Basel, Switzerland. This article is an open access article distributed under the terms and conditions of the Creative Commons Attribution (CC BY) license (http://creativecommons.org/licenses/by/4.0/).
Share and Cite
MDPI and ACS Style
Lu, J.; Xie, P.; Fang, Z.; Hu, J. Electro-Thermal Modeling of Metal-Oxide Arrester under Power Frequency Applied Voltages. Energies 2018, 11, 1610. https://doi.org/10.3390/en11061610
AMA Style
Lu J, Xie P, Fang Z, Hu J. Electro-Thermal Modeling of Metal-Oxide Arrester under Power Frequency Applied Voltages. Energies. 2018; 11(6):1610. https://doi.org/10.3390/en11061610
Chicago/Turabian StyleLu, Jiazheng, Pengkang Xie, Zhen Fang, and Jianping Hu. 2018. "Electro-Thermal Modeling of Metal-Oxide Arrester under Power Frequency Applied Voltages" Energies 11, no. 6: 1610. https://doi.org/10.3390/en11061610
Note that from the first issue of 2016, this journal uses article numbers instead of page numbers. See further details here.