Building Retrofit with Photovoltaics: Construction and Performance of a BIPV Ventilated Façade
by
Nuria Martín-Chivelet
1,*, 
Juan Carlos Gutiérrez
2,
Miguel Alonso-Abella
1,
Faustino Chenlo
1 and
José Cuenca
1 1
CIEMAT-Photovoltaic Unit, Avda. Complutense, 40, E-28040 Madrid, Spain
2
CIEMAT-Architecture and Projects Unit, Avda. Complutense, 40, E-28040 Madrid, Spain
*
Author to whom correspondence should be addressed.
Energies 2018, 11(7), 1719; https://doi.org/10.3390/en11071719
Submission received: 30 May 2018
/
Revised: 20 June 2018
/
Accepted: 26 June 2018
/
Published: 1 July 2018
(This article belongs to the Special Issue Energy Efficient and Smart Cities)
Abstract
:Building retrofit offers the opportunity to reduce energy consumption, improve energy efficiency and increase the use of renewable energy sources. The photovoltaic (PV) technology can be integrated into the building envelope, where conventional construction materials can be easily substituted by PV modules. Prices are competitive with some other solutions and good architectural building integrated photovoltaics (BIPV) solutions enhance the appearance of the buildings. All this makes BIPV an attractive solution for effectively and sustainably retrofitting building envelopes, providing savings in materials and in conventional electricity consumption and, at the same time, improving the energy efficiency of the buildings. This paper shows a building retrofit case study in which standard PV modules are integrated into a new ventilated façade, aiming at serving as an easy-to-implement example for large-scale actions.
1. Introduction
Building Integrated Photovoltaics (BIPV) relates to photovoltaic modules providing one or more functions of the building envelope [1]. This means that BIPV modules, apart from generating electricity, constitute an integral part of the building, replacing conventional building components such as tiles or ventilated façade elements. The different applications of BIPV are detailed in various publications especially addressed to architects [2,3,4,5,6].
The recent COP21 in Paris [7], resulting in 195 countries all over the world committed to strengthening the global response to the threat of climate change, makes necessary urgent actions towards the increase of energy efficiency in buildings, which account for around 40% of total final energy consumption, due in a big extent to the low energy performance of most of the current buildings. In Europe, the Energy Performance of Building Directive [8] establishes a regulatory framework for energy performance in buildings that requires all new buildings to be Nearly Zero-Energy Buildings (NEZBs) by 31 December 2019, or by 31 December 2018 if buildings are public. European Union countries must set minimum energy performance requirements for new buildings and for those that undergo major retrofitting works. Using energy from renewable sources, supported by legislative acts such as the European Renewable Energy Directive [9], together with measures taken to reduce energy consumption, would allow the agreed commitments about the reduction of greenhouse gas emissions to be fulfilled.
In this context, Building Integrated Photovoltaics (BIPV) can play an important role in an efficient and sustainable refurbishment of buildings, an increasing activity identified as a major driver of the current and near-future construction sector. The photovoltaic (PV) technology can be easily integrated into the building envelope, where conventional cladding materials can be substituted by PV modules, already with competitive costs in many cases [10]. BIPV, which appears as the market segment with the greatest growth potential in the photovoltaic sector [11], brings attractive solutions for effectively and sustainably retrofitting building envelopes, providing savings in materials and in conventional electricity consumption and, at the same time, improving the energy efficiency of the buildings.
The transposition of the European Directives to the different EU countries has affected the national regulations, as it is in Spain, where the Spanish Technical Building Code [12] establishes a minimum photovoltaic power to be installed in tertiary buildings, both in new construction and in major retrofit works. In addition, specific normative related to BIPV is starting to be established: the recent European standard for BIPV modules and systems [13], which focuses on the properties of BIPV modules as construction products, has boosted the related international normalization activity. Based on the European document, the International Electrotechnical Commission (IEC) is developing a new Technical Specification on BIPV.
Moreover, the International Energy Agency (IEA) has dedicated several Tasks to the development an enhancement of BIPV, in two different Programs (Solar and Heating and PV Power Systems). Currently, IEA Task 15 [14], with the aim of accelerating the penetration of BIPV products in the global market of renewables. The new favorable framework for BIPV is motivating the PV sector to research in new materials and solutions form BIPV. A complete review of the BIPV products and the research opportunities in the future can be found in [15].
There are plenty of BIPV products and singular projects that show the versatility of PV modules to adapt to the architectural exigencies, and not always in detriment of the energy performance [16]. Different experimental specific set-ups have been developed [17] to assess the performance of BIPV modules, and many buildings having BIPV modules are being monitored and studied. For instance, Lee et al. [18] reported the electrical performance of a BIPV curtain wall affected by partial shading, and Yoon et al. [19] analyzed the performance of an amorphous silicon PV façade in Korea through two-year monitoring.
Extensive reviews about products and solutions are available in the bibliography since some years ago [20,21], and more recently [15,22]. It is commonly accepted that there are no universal principles applicable to all contexts referring to “good architectural design” but some criteria are suggested in the bibliography, as for instance in [23], where it is stated that all the PV characteristics affecting the building’s appearance should be coherent with the overall building’s design, including the architectural composition, colors, and textures. Undoubtedly, there are many more possibilities of integrating PV modules in new buildings if this is done from the very first stage, which usually leads to better aesthetic results.
Although the building sector in the EU is the largest single energy consumer in Europe, absorbing 40% of final energy, and about 75% of buildings are energy inefficient, only 0.4–1.2% of the stock is renovated each year. This involves the need for their energy retrofit to save energy and to reduce CO2 emissions [24]. However, addressing renovation with BIPV has the double benefit to combining energy-retrofit, to reduce energy demand, with photovoltaic generation to participate in the required energy. Although only one-third of European BIPV cases correspond to retrofit so far [10] BIPV renovation solutions can be found in the literature [25]. Retrofit of residential buildings with BIPV has been recently addressed by Evola and Margan [26], with a solution of façade with PV modules combined with ceramic panels. In addition, Eicker et al. [27] and Hachem et al. [28] studied the convenience of the integration of PV modules in the retrofit of residential buildings in Northern Europe and Canada, respectively.
None of the reviewed examples included construction details or pictures of the renovation works to make them easy to be replicated. There is no evidence of how standard PV modules can be integrated into a ventilated façade for building retrofit either. The present work addresses a practical solution for building retrofit with a BIPV ventilated façade, especially recommended for tertiary buildings. The study includes constructive details and pictures, and the analysis of one-year performance data. The objective is to propose a feasible and easy-to-implement BIPV solution which can achieve good architectural results with standard PV modules, intended to serve as a reference to undertake similar retrofit works and hopefully will help to accelerate BIPV in building retrofit in the near future.
2. The Building Retrofit
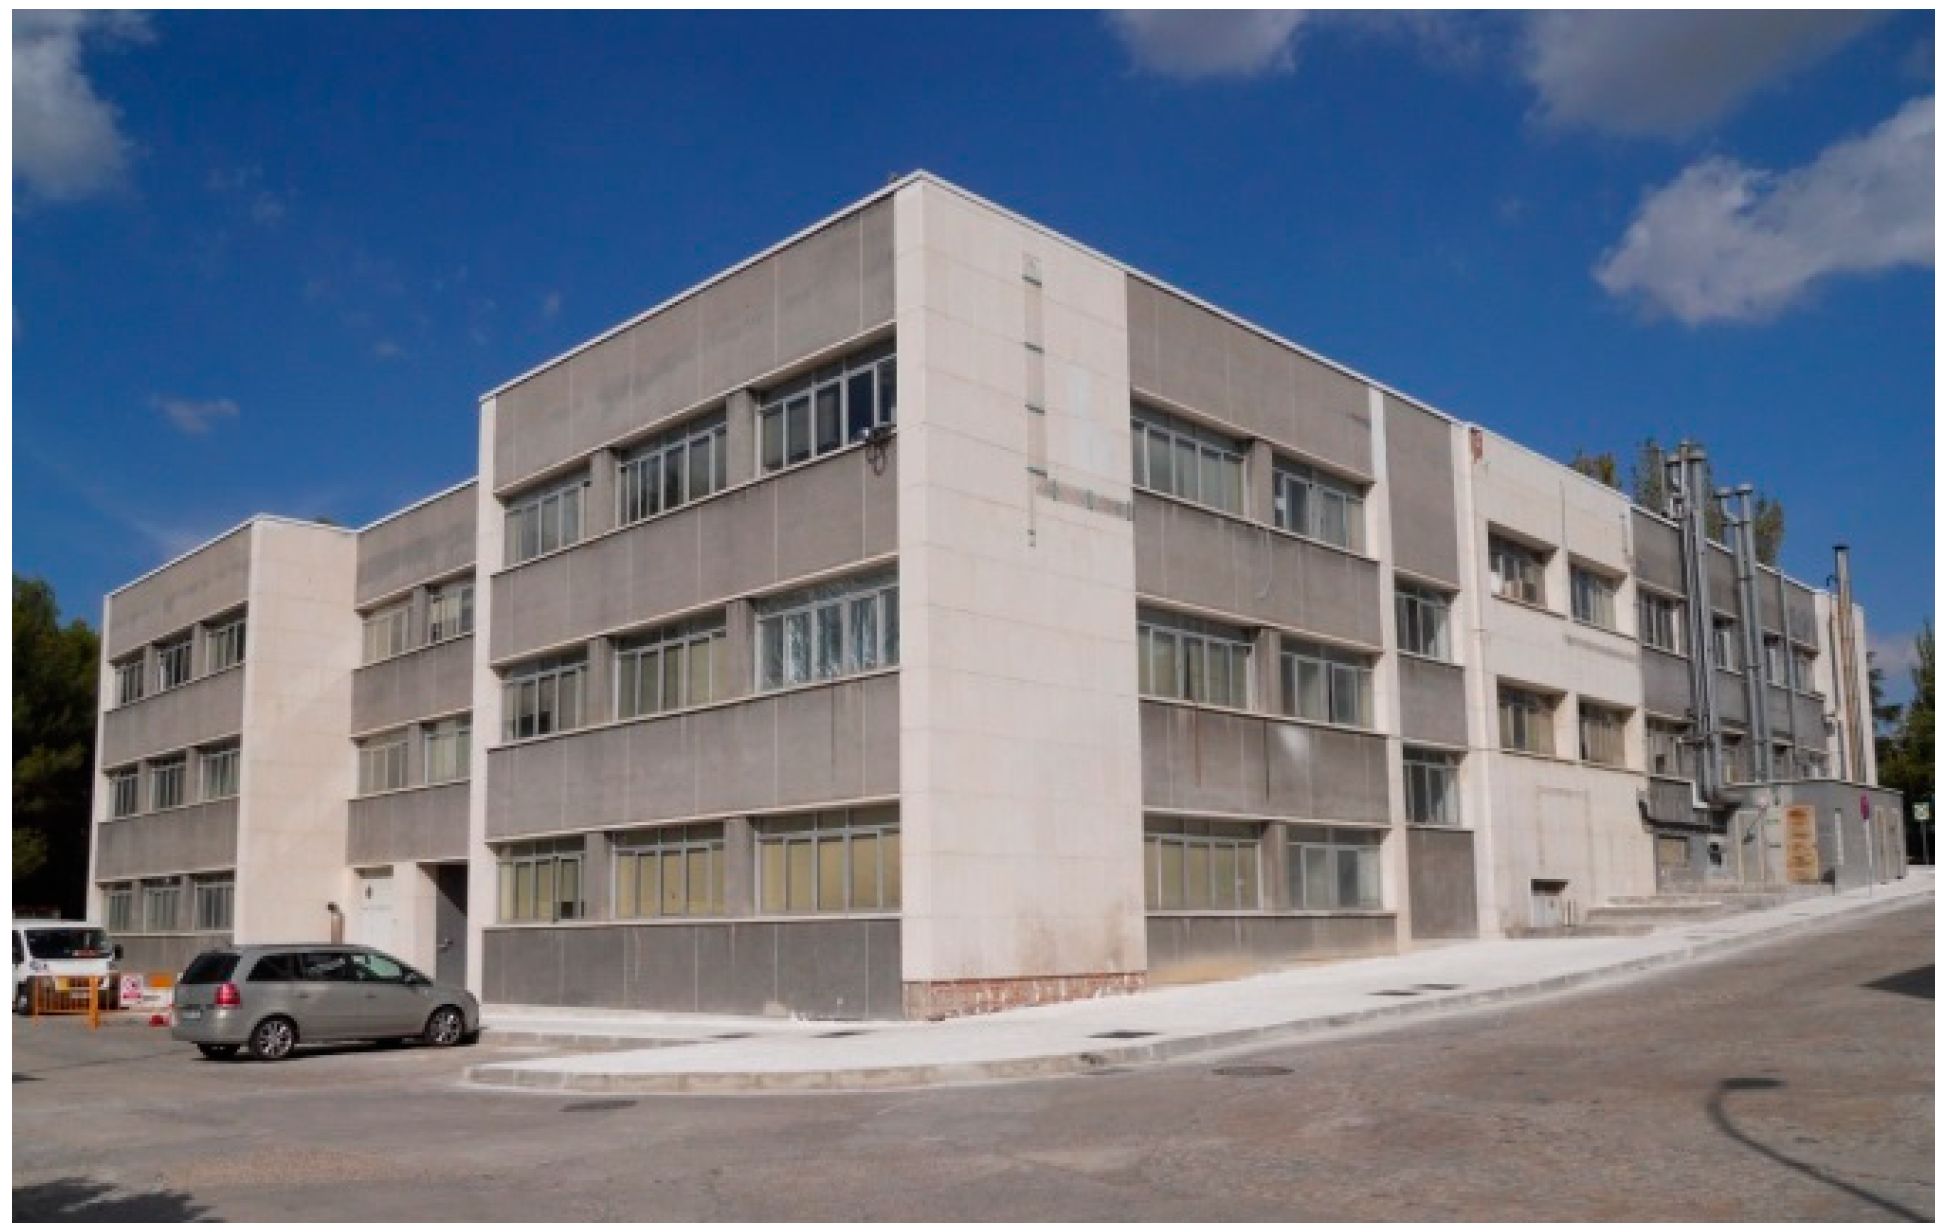
CIEMAT (Centro de Investigaciones Energéticas, Medioambientales y Tecnológicas) is a Spanish public research body focusing on energy and environment technologies. CIEMAT’s building 42 houses the headquarters of the Renewable Energies Division, which includes the Photovoltaic Unit. The building façades are almost aligned with the cardinal axes. It was built in two phases between 1970 and 1980 and has suffered from a series of structural issues which led to assume an integral retrofit in phases. Once the stability problems were solved with a new foundation in the northeast section, rehabilitation of the roofs and the façades was undertaken. It was decided to implement a ventilated façade that, in addition to improving the building’s structural condition and its energy efficiency, had building integrated photovoltaic (PV) modules. From the point of view of the PV generation, the ventilated façade has the advantage of the air gap behind the photovoltaic modules, which helps to reduce their temperature and, consequently, increases their electrical efficiency. Furthermore, maintenance and replacement of photovoltaic modules in the ventilated facades is simple.
2.1. The Architectural Integration
The PV modules considered to integrate in the new ventilated façade are made of high performance crystalline silicon solar cells with a standard structure: tempered front glass/EVA/PV cells/EVA/PVF (where EVA states for ethylene-vinyl acetate and PVF for polyvinyl fluoride), and a sturdy anodized frame. The main reason to consider these commercial and not BIPV specific modules was that there was an appreciable quantity of them already available at CIEMAT at the time the rehabilitation was defined, and therefore only the ones needed to complete the total power according to the project design were purchased. These modules can be successfully integrated in the façades and roofs of buildings using suitable fastening elements. The high efficiency of these PV modules and their dark homogenous appearance are some other features that were valued.
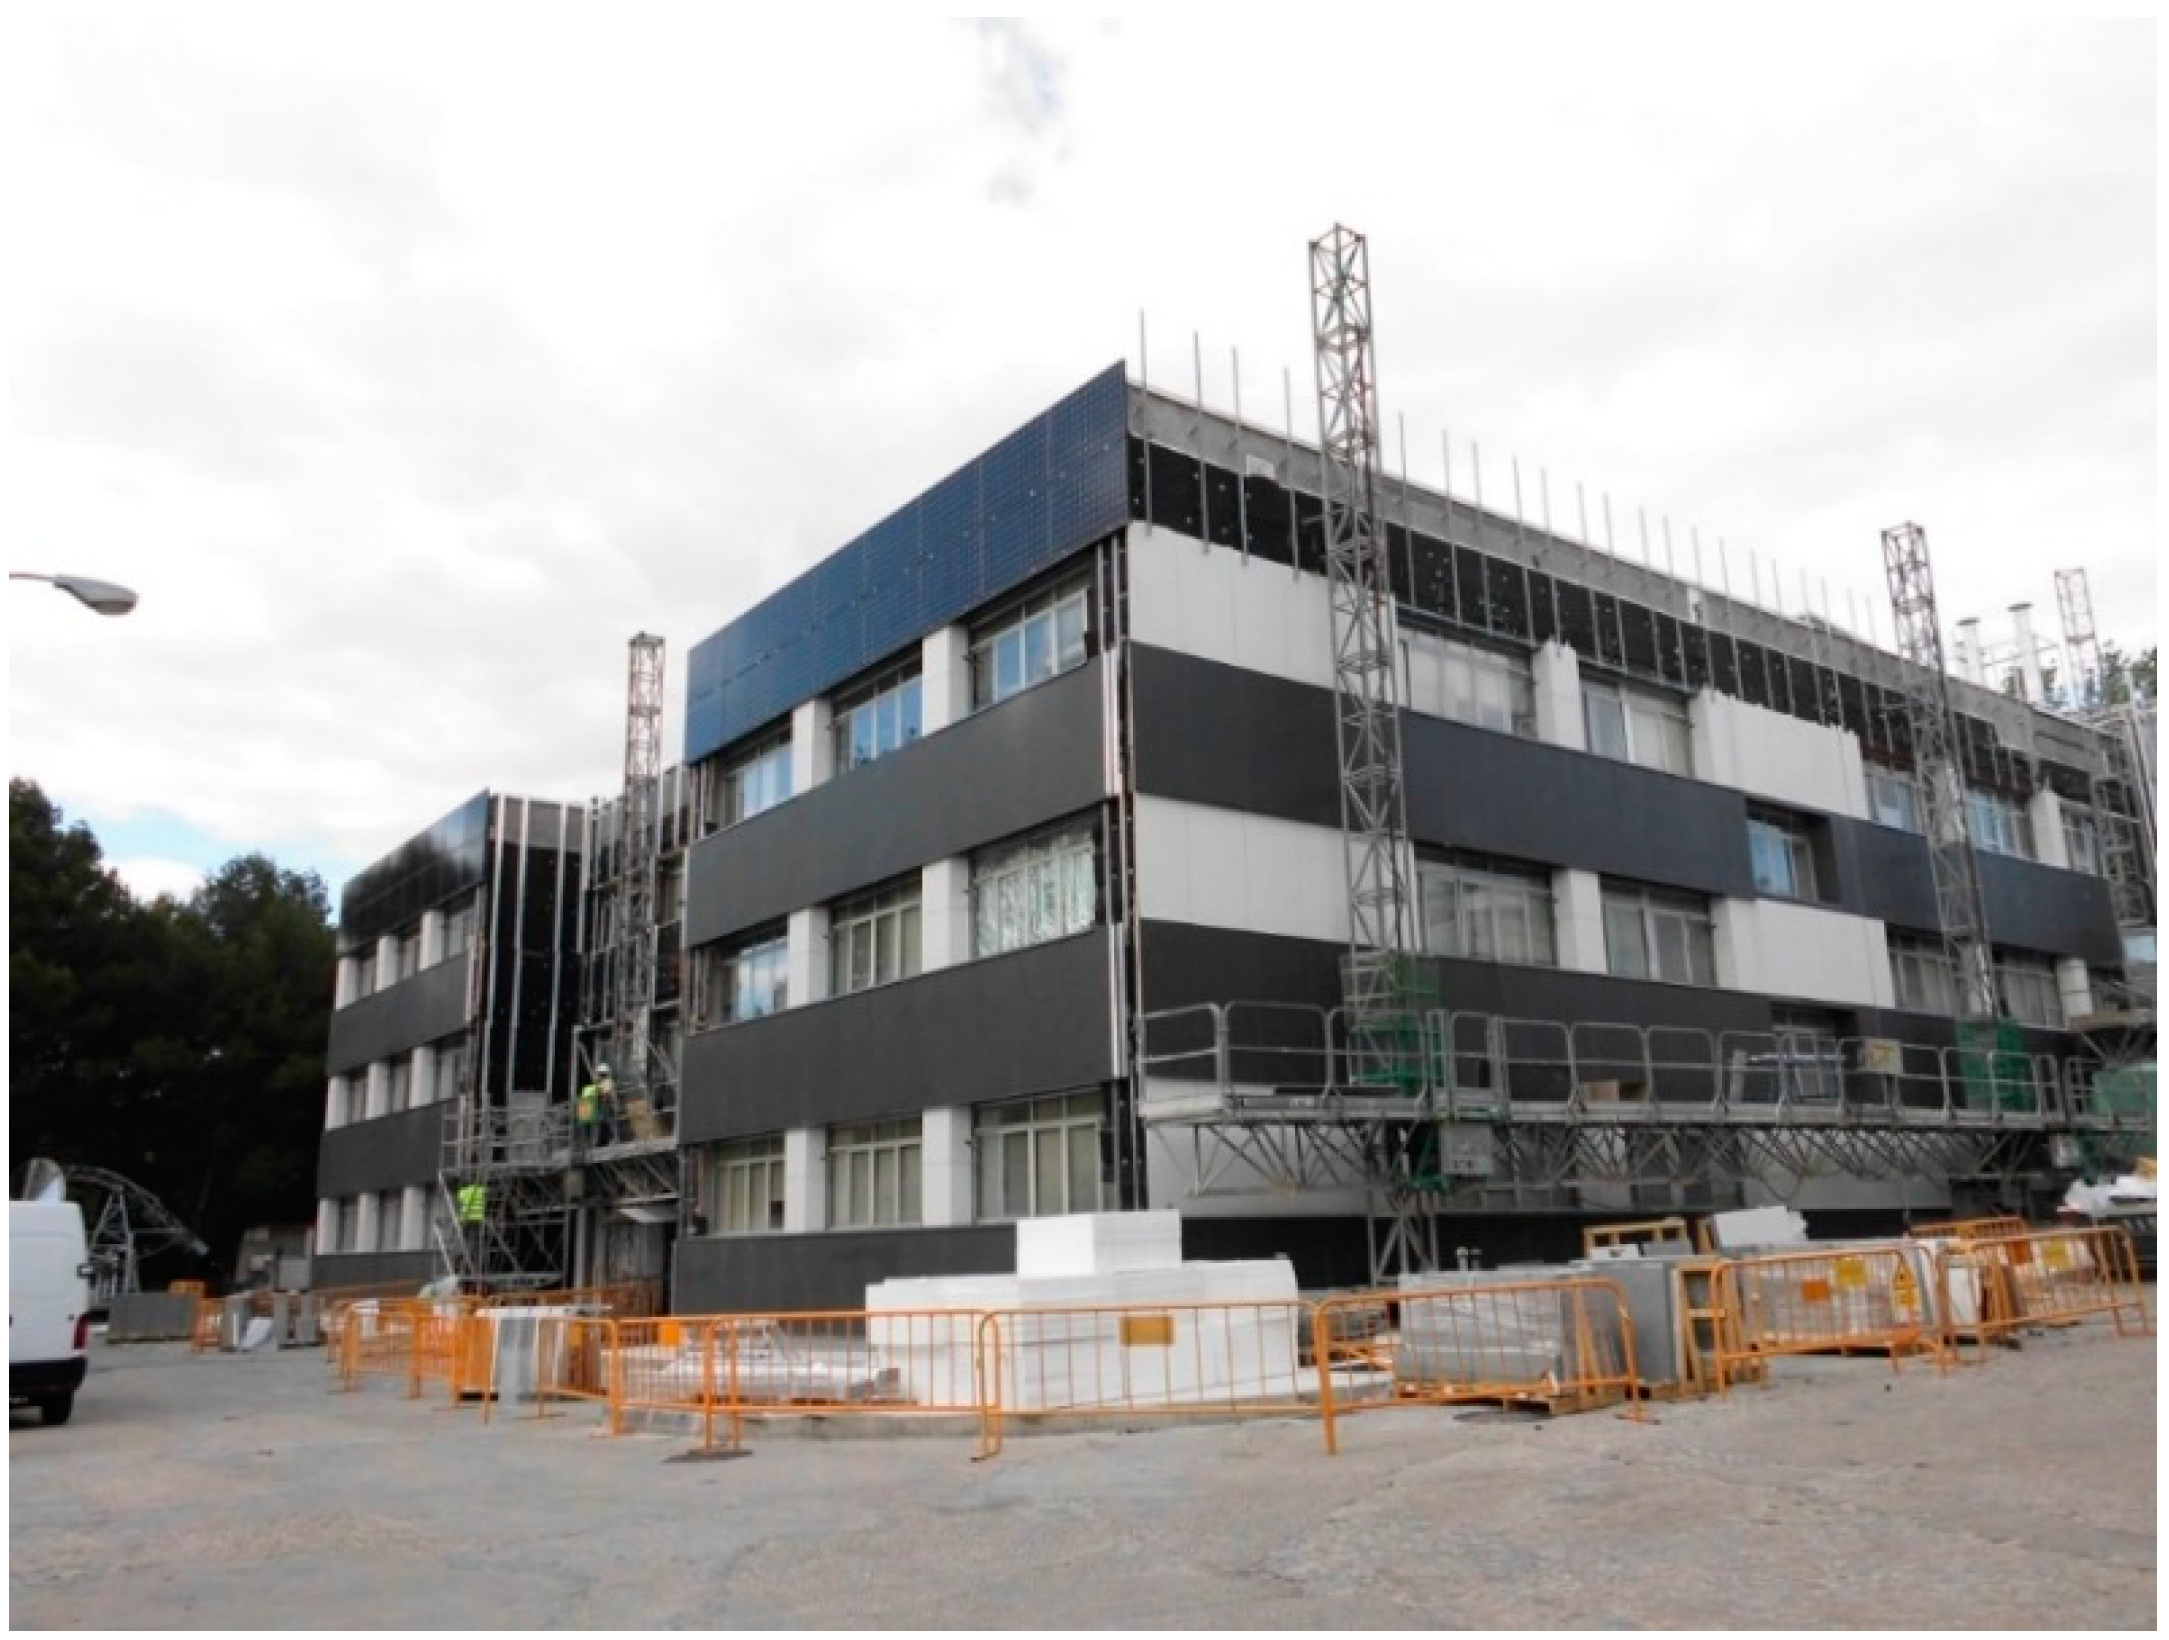
The type of material for the ventilated façade was defined based on these PV modules, looking for similar dimensions and tones, and adapting the modulation and the general appearance such that the integration would be as successful as possible. The combination of the PV modules with the polymer concrete panels selected for the façades achieves a good integration from an aesthetic point of view, thanks to the similarity of colors and shapes (see Figure 1, Figure 2 and Figure 3). The PV modules are integrated into the upper areas of the east, south and west façades, to receive more sun irradiation and occupy a total surface area of about 176 m2.
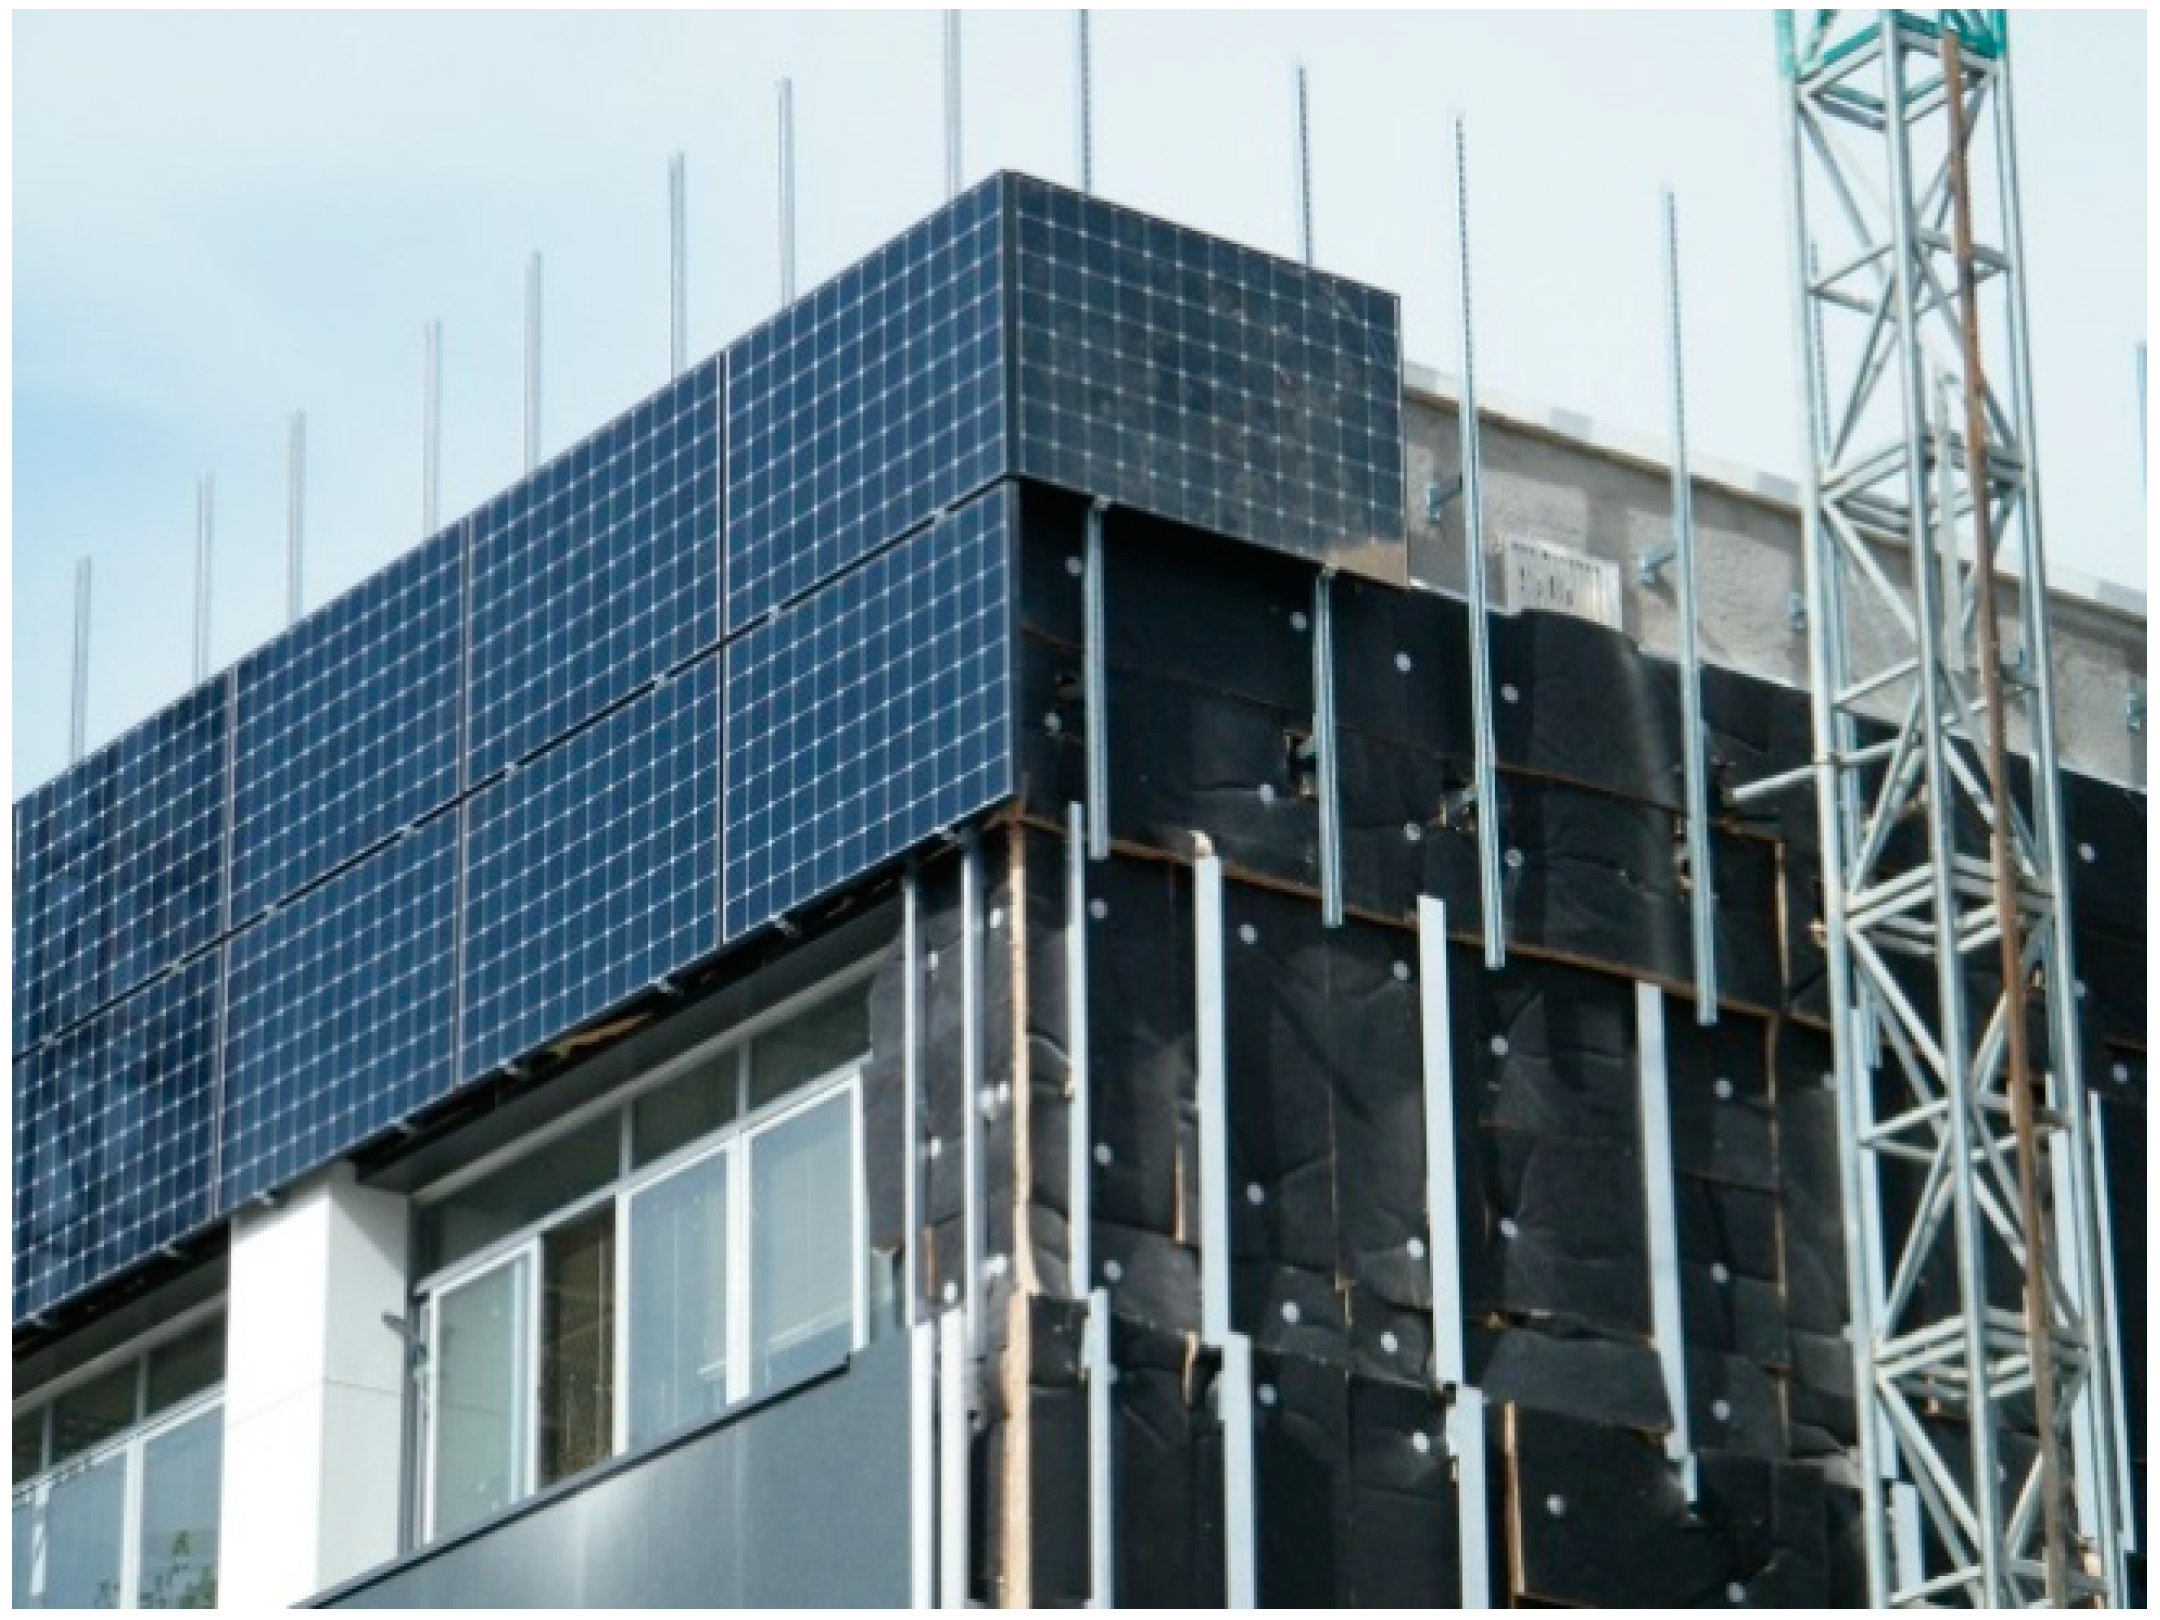
The support structure of the PV modules was fastened in parallel to that of the rest of the façade, to suitably coordinate the levels and finishing touches between the elements (see Figure 4 and Figure 5). This required a special effort which in the end has resulted in what can be considered as a good integration between two dissimilar structures.
2.2. The Photovoltaic Installation
The BIPV installation comply with the regulation in force at the time of the rehabilitation, mainly the international IEC norms related to the PV modules and the electrical installation [29,30], the Spanish Building Technical Code [12], the Low Voltage Electricity Regulation [31] and the Small PV Installations Grid Connection Regulation [32]. The PV modules form part of two photovoltaic installations: one connected to the building’s local electric power grid, and another stand-alone installation to charge batteries and perform tests in the Photovoltaic Laboratory at the bottom floor.
The grid-connected photovoltaic installation has a peak power of 27.2 kW, rated at standard test conditions (irradiance value of 1 kW/m2 and cell temperature of 25 °C), and is divided into six photovoltaic subfields: three on the east façade with 14 modules each and connected to three single-phase inverters, one on the south façade with 28 modules connected to a single three-phase inverter, and another on the west façade with 16 modules connected to a single-phase inverter. Distributing the PV modules of the east façade into three subsystems aims at reducing the production losses due to partial shading, as it will be shown in a subsequent section. The specifications of the installed PV modules and the inverters are indicated in Table 1 and Table 2.
All the energy generated by the grid-connected PV system is instantaneously self-consumed in the building, reducing the electric power bill. Since the PV modules are distributed over the south, east and west facades, to achieve a flatter generation curve throughout the day, the expected values of maximum daily power generated by the PV system are around 11 kW, a value considerably lower than the 60 kW of electric power consumed on average in the building during working hours before the retrofit. Even on weekends, average consumption is around 30 kW (see Figure 6). Thus, a surplus of PV energy produced and not consumed in the building is not expected at any time (self-consumption index of 100%). Nevertheless, the PV system is provided with the “zero injection” device that prevents PV energy from being dispatched to the electric power grid outside the building, in compliance with the Spanish legislation at the time of the renovation.
The stand-alone installation is composed of a PV generator formed by 16 modules integrated into the west façade and wired to the Photovoltaic Laboratory, located in the building’s ground floor, where there are different types of photovoltaic batteries, charge controllers and a stand-alone inverter. The 16 PV modules are serial connected in pairs, forming three independent stand-alone systems, being one of them connected to the inverter (see Table 3).
The purpose of the stand-alone installation is to keep the batteries charged to perform different tests to the inverter with different loads. The surplus photovoltaic generation, mainly during the summer months, is being used to supply power to two LED lamps intended for measuring and testing the durability of small amorphous silicon photovoltaic modules. Up to 30 physical magnitudes, including irradiance, voltages, currents and temperatures can be monitored on a workbench data-logger to provide a complete characterization of the stand-alone PV installation [33].
3. Energy Performance
3.1. Monitoring
In order to continuously track the operation and quantify the solar photovoltaic energy generated and consumed in the building, the installation is being monitored. This includes the different electrical parameters of each subsystem and the local meteorological variables. The results are displayed as graphs and figures on an interactive screen placed at the entrance of the building (Figure 6).
The data are monitored by RS485 communication (ATEN, New Taipei City, Taiwan) with the inverters, supplying instantaneous values of the electrical parameters: voltage, current, power and energy. Temperature and irradiance are measured with a datalogger Datataker DT800 (Datataker, Melbourne, VIC, Australia). Temperature sensors are type T thermocouples and irradiance sensors are calibrated Equivalent Technology Cells (ETCs).
The monitoring software consists of two different parts, one for the data acquisition from the inverters and the datalogger, and the other for presentation and visualization through a web page. Communication with inverters has been developed in C language following the instructions of the manufacturer of the inverters Fronius (Fronius, Pettenbach, Austria). The software operates on a PC under Linux-Ubuntu and uses the Apache as platform web server.
The annual energy generated by the grid-connected PV system, estimated for a typical meteorological year, is 20 MWh/year. This value represented 4.6% of the total electric power consumption of the building before the rehabilitation was undertaken, which was 432 MWh/year. The production measured during a complete year, from October 2016 till September 2017, has been 19 MWh/year. When the energy retrofit concludes, including lightings and windows renewal, the expected reduction in the energy consumption will be 30%, and then PV energy will represent 6.6% of the total consumption.
Figure 7 shows the daily consumption profile of the building during a weekday and on a Sunday. Observe that the base load is quite high in this building because part of the load is switched on during unoccupied hours, mainly laboratory equipment that cannot be turned off. Together it is represented the PV generation curve in a clear day of April. Observe the good shape fitting between the weekday curve and the generation profile, due to the distribution of the PV modules among the three different façades. Lowering the building’s load and increasing the number of modules would lead to higher self-sufficiency indexes while keeping 100% self-consumption [34]. Figure 7 includes a hypothetical solution having three times the actual PV installed power, achieving the maximum self-sufficiency and 100% self-consumption (all PV would be consumed in the building even on Sundays).
The monitoring system enables real-time display of the electrical and meteorological parameters, and it also calculates the electrical production and the figures of merit of the PV system. Typically they are Reference Yield, YR, Final Yield, Yf, and Performance Ratio, PR, all referred to a certain period of time—daily, monthly or yearly values—[35]. YR is the incident irradiation on the generator plane—in this case measured with equivalent technology PV cells—normalized to the nominal value of 1 kW/m², and thus stated in hours (kWh/m²)/(kW/m²); Yf is the generated energy normalized to the nominal PV power of the installation, which may be interpreted as the effective number of plant production hours (kWh/kWp), and PR is the ratio between both factors, PR = Yf/YR. The value of PR is related to the overall performance of the installation which, in optimally oriented and designed systems, is usually around 80%. While Yf strongly depends on the solar irradiation, which is a function of the geographic location, the value of PR does not, being a function of different losses factors, as the local ambient temperature, the soiling conditions, or the PV inverter efficiency.
3.2. Partial Shading Effect
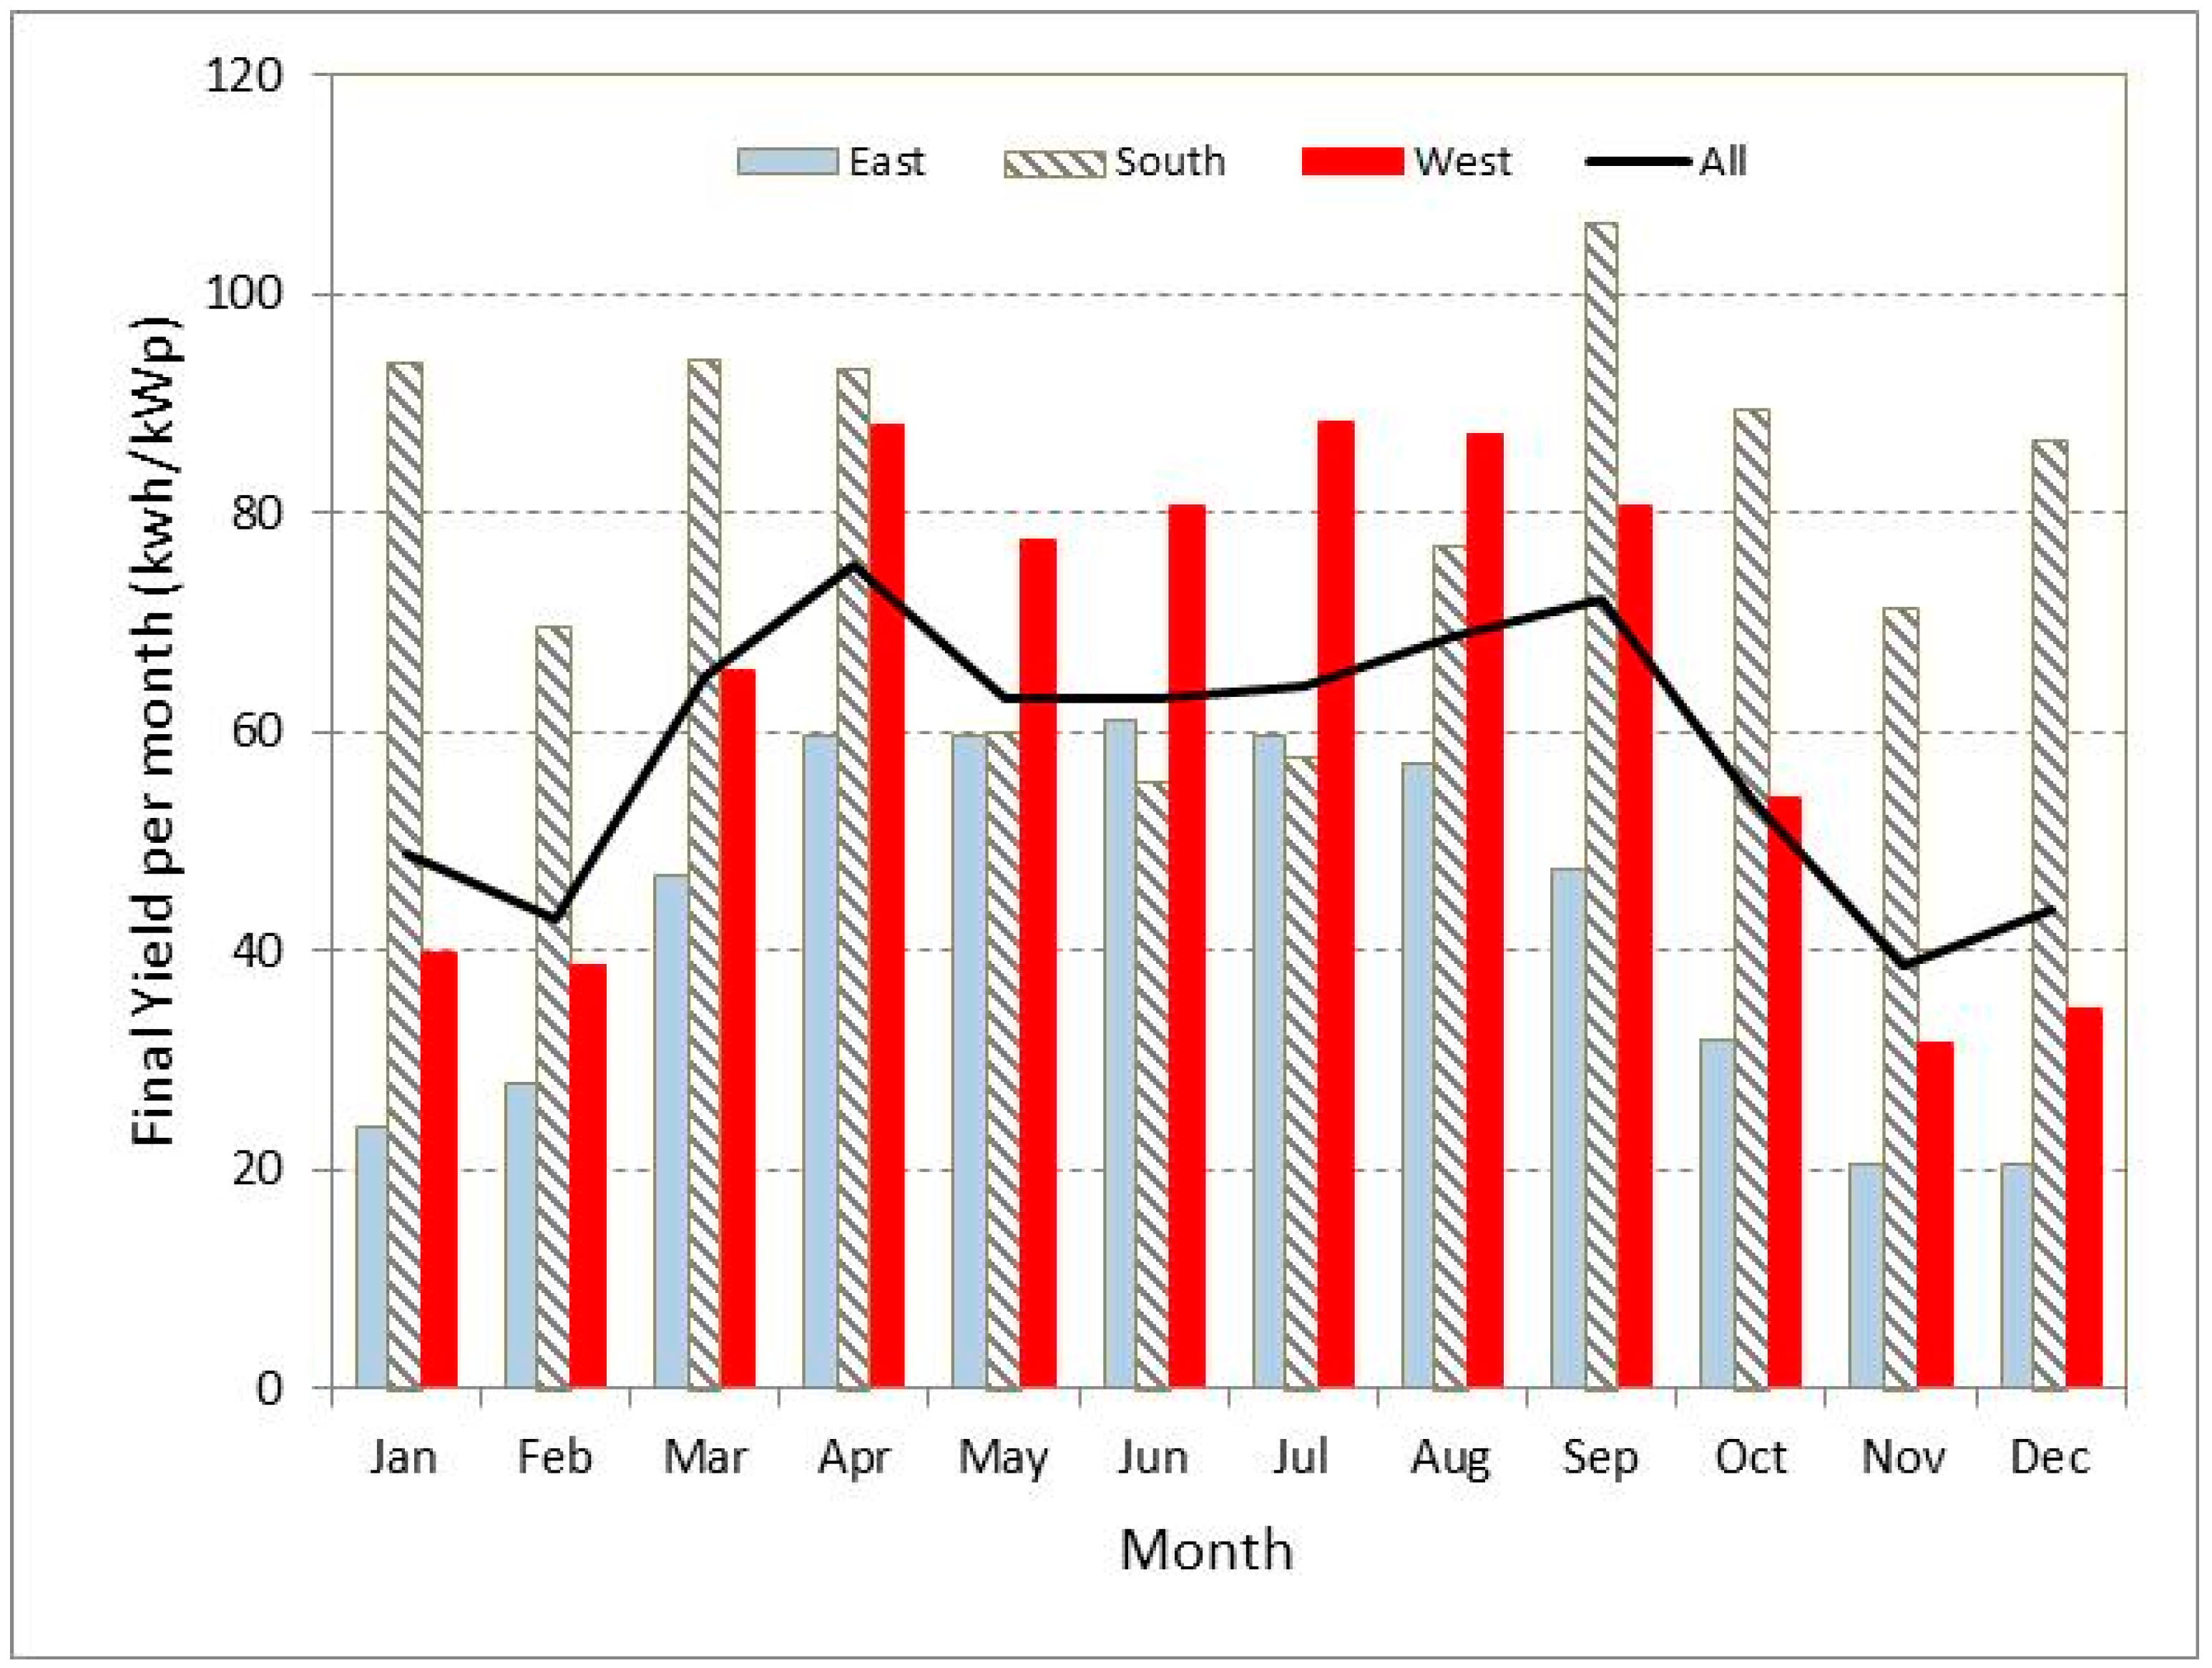
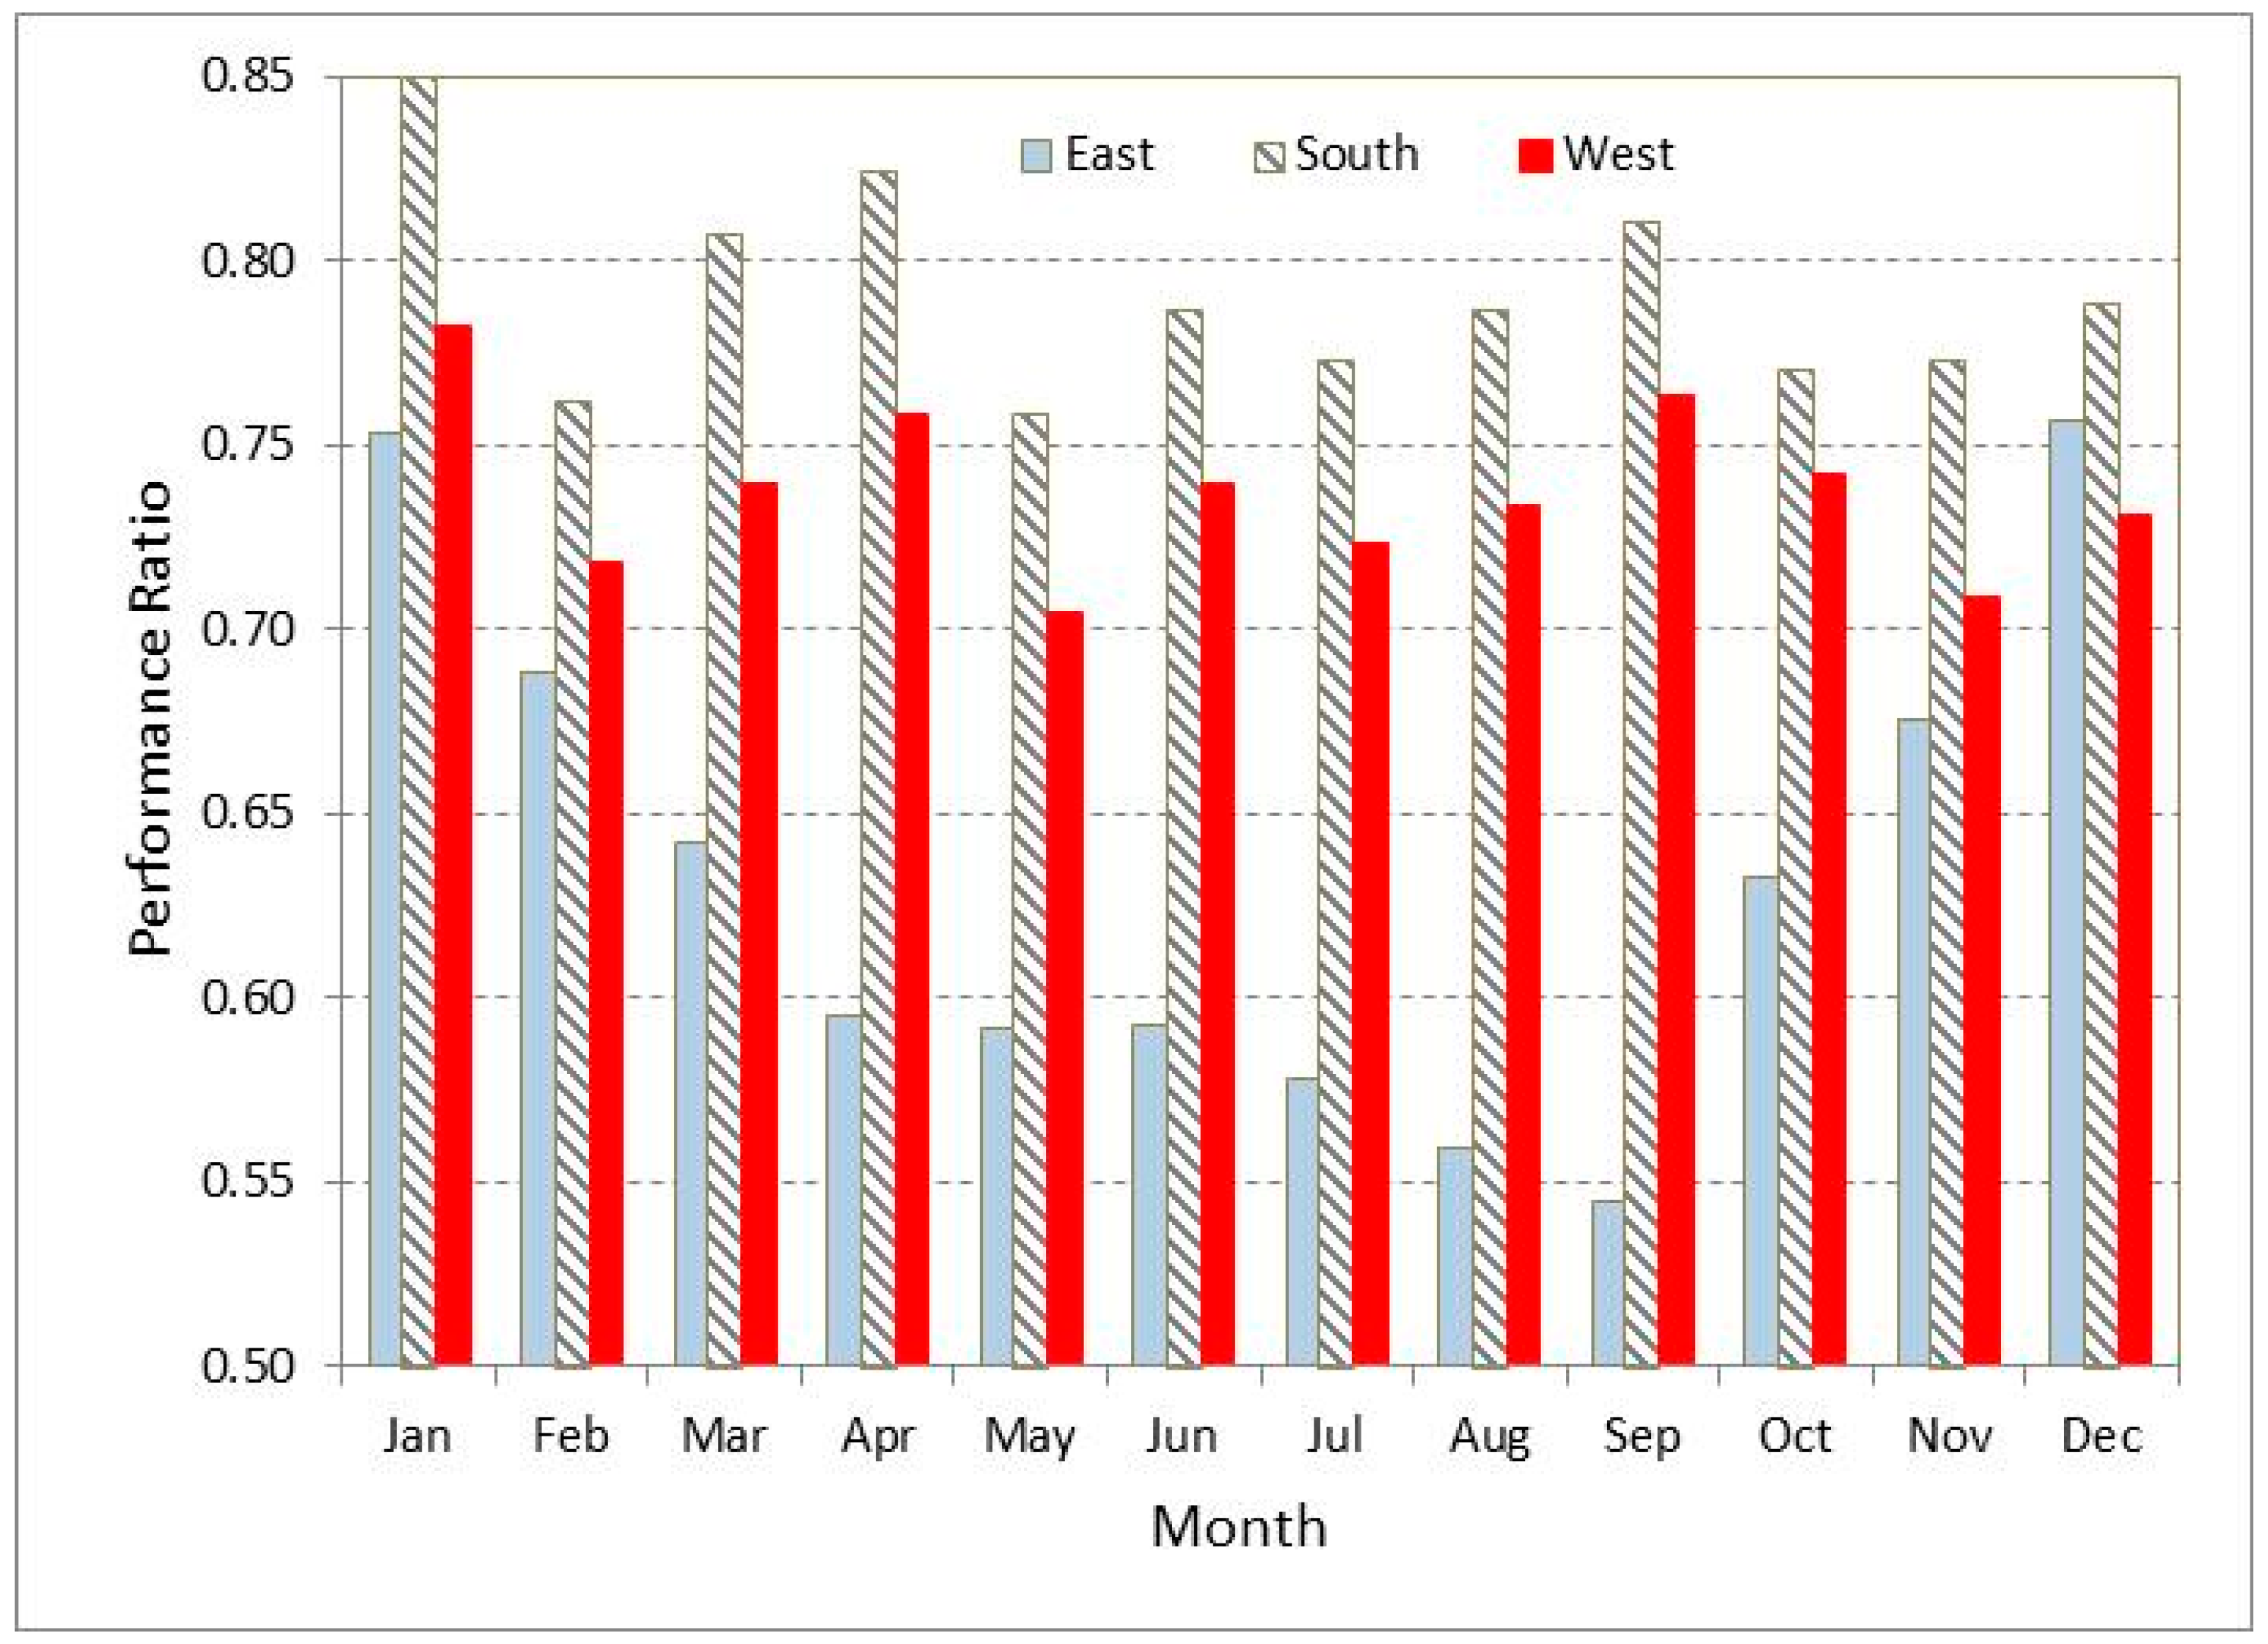
Figure 8 shows the monthly final yield measured along a year at each façade. While the south façade shows the highest productivity during the period from September to April, the west performs the best from May to August. For symmetry reasons, the east façade should have had similar behavior as the west one, or even slightly better because of the lower ambient temperatures during the morning, but the fact is that this façade performs the worst along the whole year. This is clearly seen in Figure 9, which shows the monthly performance factor of each façade along the year.
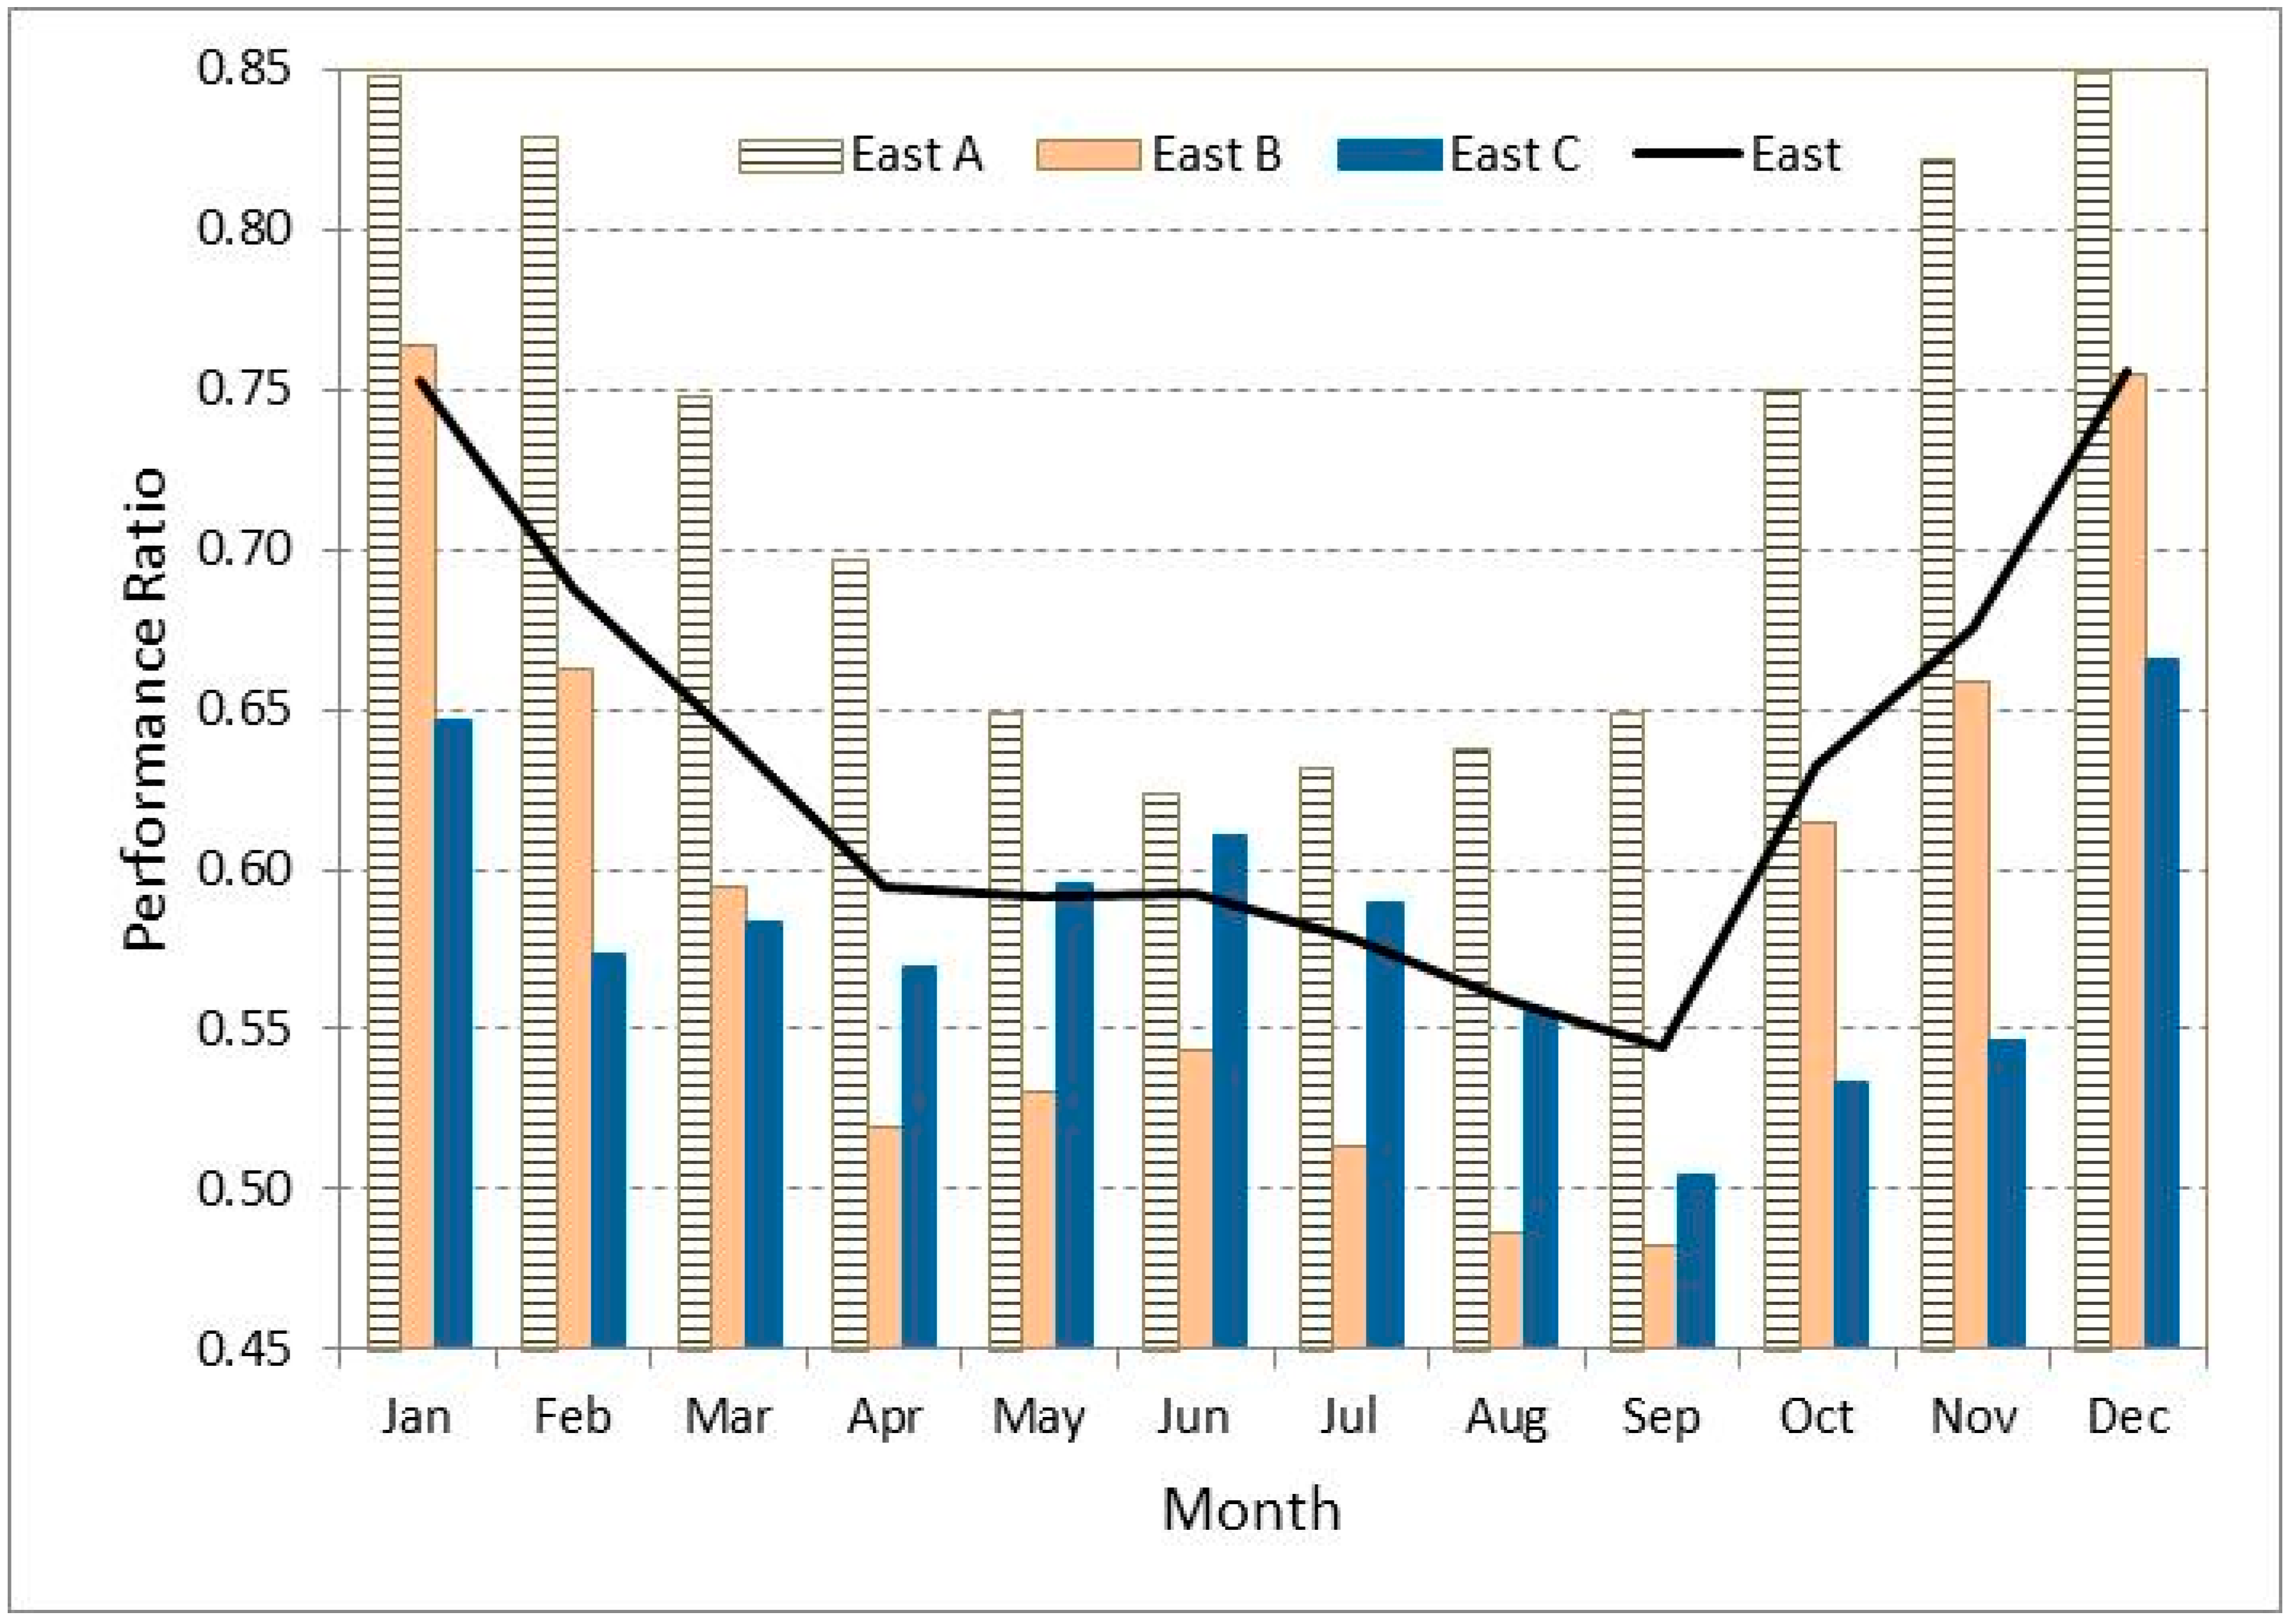
The reason for the low performance of the east façade is that there is a line of trees that partially shadows it during part of the morning, when direct sun radiation should illuminate it (Figure 10). The trees are poplars, so in autumn they lose their leaves, and shadows become less intense, which, together with the decrease of ambient temperature, make PR becoming significantly higher in autumn and winter months than in spring and summer. Considering that the east façade is not homogenously affected by shading and being aware of the impact this was going to have in the PV production, the east PV generator had been distributed into three sub-systems (named A, B and C from South to North).
This electrical design in three parts has avoided major problems and has increased the PV production in 0.37 MWh per year. Nevertheless, the partial shading causes losses of 0.97 MWh per year even with the final configuration. Figure 11 shows the yearly evolution of the monthly performance ratio of each of the three subsystems of the east façade. Observe the low PR values of subsystems B and C, compared to subsystem A, which is located in the south part of the east facade. PR values in the south façade are good, in the west are reasonable and in the east are very poor, except in winter.
3.3. A Stand-Alone Installation for Other Purposes
In this building, the stand-alone installation has been designed for testing and educational purposes. Other applications could have been considered instead. Figure 12 shows an example of the performance of sub-system 1 during a clear day (25 April). It can be seen that the west façade starts to receive direct solar radiation at noon, around 14:00 local official summer time. From that moment on, the irradiance G increases continuously up to its maximum at 18:28. The current delivered by the PV modules to the battery, Ibat-EN, follows the irradiance profile till battery reaches its floating voltage, at 18:00. At this point, the charge regulator keeps the battery voltage VREG-EN constant, and the battery current starts to decrease exponentially. Discontinuities in the current waveform are caused by intermittent connections of the load for checking. At night the load is connected between 22:00 and 7:00. During that day, the electric charge or capacity stored in the battery Cbat, after a complete daily cycle, was 10 Ah, the capacity extracted from the battery 54 Ah, and the capacity restored 64 Ah [36].
3.4. The PV Modules Temperature
The rear ventilation of PV modules increases their efficiency when integrated in building façades. The effect depends on the air gap width and the local climate conditions, as has been shown in several works. For instance, Guiavarch and Peuportier [37] analyzed the influence of the air gap in the increase of the PV efficiency, considering different climates and architectural applications in France. ElSayed [38], in a case study in Egypt, determined that the increase of air gap until 22 cm reduced the heat gain through the envelope, but that with wider air gaps heat gain increased due to laminar convective heat flow. Peng et al. [39] found experimentally that 60 mm is a suitable thickness of the air gap behind the PV module that enhances its efficiency and reduces the cooling load in summer and the heating load in winter. Besides, Ritzen et al. [40] indicated a possible correlation between ventilation, operating temperatures, and performance and lifespan of modules, after a comparative BIPV field test conducted during three years of a roof-top application.
In the present case study, the stand-alone PV installation has enabled the analysis of the temperatures of the modules and their dependence with the operation conditions, which vary from maximum power point (MPP) to open circuit.
Figure 13 shows a thermography of the west façade where the PV modules of the stand-alone system are integrated. It can be seen that some modules get cooler than the rest, around 7 °C less in this case because they are working at their MPP instead of being at OC, because part of the irradiance they receive is converted into electrical power (about 20% in this case). At nominal operating conditions (800 W/m2, 20 °C), the obtained temperatures for the modules in the façade are 59 °C, and 52 °C, considering open circuit and maximum power point conditions, respectively [41]. To estimate the effect of this temperature difference in the power generated, we should consider the dependence of PV power with temperature and irradiance:
where G denotes global irradiance, the temperature coefficient (0.38%/°C), Tm module temperature, and the subscript 0 stands for any reference situation. The increase of temperature at the open circuit condition implies a decrease of 3% in the obtained power.
A similar reasoning permits comparing the nominal temperature of the PV modules having the actual ventilation with a no ventilated case (overlapping). The result is a nominal temperature difference of 12 °C, which leads to power losses of 6% at nominal operating conditions. On a yearly basis, the effect of non-ventilation of this façade in Madrid would lead to additional losses of 2.5%, in reference to the ventilated façade.
The IR picture also shows that all PV modules keep cooler than the polymer concrete panels, around 20 °C less if they are at MPP. Although the renovation has included stone wool panels on the building enclosure behind the ventilated façade to enhance the thermal insulation of the building, the different thermal behavior of the PV panels compared to polymer concrete should be taken into account in the energy analysis of the building.
4. Conclusions
The ventilated façade with the integration of photovoltaic modules has proved to be a good solution for the rehabilitation of the envelope of the building considered, and it serves as a reference to undertake similar renovations. The result of architecturally integrated PV modules in substitution of polymer concrete panels on the façade has been very positive, being coherent with the overall building’s design. In addition to improving the structural condition, it has increased the energy efficiency of the building and included renewable energy sources. The PV self-sufficiency index of this self-consumption PV building is expected to become around 6.6% after renewal all lighting and windows.
The monitoring and analysis of the electric power production and consumption data show that the influence of partial shading due to nearby trees or buildings can affect seriously the performance of the PV installation. In the present case study, the east façade exhibits poor performance ratio below 60% the whole year except in winter time, due to the shadowing. It is recommended to discard those parts of the facades of the building that receive significant shading along the year, or at least to divide the PV system associated to each façade into different sub-systems. In this particular case, dividing the PV generator into three parts has increased the PV production 0.37 MWh per year. Nevertheless, the partial shading causes losses of 0.97 MWh per year.
Considering different façades of the building with diverse orientations extends the production time along the day and flattens the production curve, which may help to fit the generation curve to the building’s load profile. In general, higher self-sufficiency indexes firstly require reducing the building load and secondly increasing the PV installed power, after considering in more detail the matching between the daily profiles of production and consumption.
The rear ventilation of PV modules increases their efficiency when integrated in building façades, and the effect depends on the air gap width and the local climate conditions. In this case study, the rear ventilation solution causes an annual increase of 2.5%, in reference to a not ventilated case. The increase of temperature in open circuit implies a decrease of 3% in the obtained power at nominal operating conditions.
The thermal behavior of the PV modules has shown to differ significantly from that of conventional construction materials. In this case, temperatures during sunny hours become cooler in the PV modules than in the polymer concrete panels, which have a dark color to fit better with the PV modules appearance.
Author Contributions
Conceptualization, N.M.-C., J.C.G. and F.C.; Methodology, F.C., M.A.-A., J.C.G. and N.M.-C.; Software, M.A.-A.; Validation, F.C., J.C.; Formal Analysis, M.A.-A.; Investigation, F.C., N.M.-C., J.C.; Resources, F.C.; Data Curation, M.A.-A.; Writing-Original Draft Preparation, N.M.-C., J.C.G.; Writing-Review & Editing, N.M.-C.; Visualization, M.A.-A; Supervision, N.M.-C.; Project Administration, J.C.G., F.C.; Funding Acquisition, F.C., J.C.G.
Funding
This research received no external funding.
Conflicts of Interest
The authors declare no conflict of interest.
References
- International Electrotechnical Commission. IEC TS 61836:2016 Solar Photovoltaic Energy Systems-Terms, Definitions and Symbols; British Standards Institution: London, UK, 2016. [Google Scholar]
- Bonomo, P.; Frontini, F.; Chatzipanagi, A. Overview and analysis of current BIPV products: New criteria for supporting the technological transfer in the building sector. Vitr. Int. J. Archit. Technol. Sustain. 2015, 1, 67–85. [Google Scholar] [CrossRef]
- Chivelet, N.M.; Solla, I.F. La Envolvente Fotovoltaica en la Arquitectura: Criterios de Diseño y Aplicaciones; Reverté: Barcelona, Spain, 2007. [Google Scholar]
- Scognamiglio, A.; Bosisio, P.; di Dio, V. Fotovoltaico Negli Edifici; Ambiente: Milano, Italy, 2009. [Google Scholar]
- Farkas, K.; Frontini, F.; Maturi, L.; Munari Probst, M.C.; Roecker, C.; Scognamiglio, A. Designing Photovoltaic Systems for Architectural Integration. Criteria and Guidelines for Product and System Developers; Solar Heating and Cooling Programme International Energy Agency: Trondheim, Norway, 2013. [Google Scholar]
- Hagemann, I. Gebäudeintegrierte Photovoltaik: Architektonische Integration der Photovoltaik in die Gebäudehülle; No. 1; Rudolf Müller: Cologne, Germany, 2002. [Google Scholar]
- United Nations. Report of the Conference of the Parties on Its Twenty-First Session; UN: New York, NY, USA, 2015. [Google Scholar]
- The European Parliament and the Council of the European Union. Directive 2010/31/EU of the European Parliament and of the Council of 19 May 2010 on the energy performance of buildings. Off. J. Eur. Union 2010, L153, 13–35. [Google Scholar]
- The European Parliament and the Council of the European Union. Directive 2009/28/EC of the European Parliament and of the Council of 23 April 2009 on the promotion of the use of energy from renewable sources. Off. J. Eur. Union 2009, 52, 16–62. [Google Scholar]
- Delponte, E.; Marchi, F.; Frontini, F.; López, C.S.P.; Fath, K.; Batey, M. BIPV in EU28, from Niche to Mass Market: An Assessment of Current Projects and the Potential for Growth through Product Innovation. In Proceedings of the 31st European Photovoltaic Solar Energy Conference and Exhibition, Hamburg, Germany, 14–18 September 2015; pp. 3046–3050. [Google Scholar]
- European Photovoltaic Industry Association (EPIA). Global Market Outlook for Photovoltaics; European Photovoltaic Industry Association: Brussels, Belgium, 2014. [Google Scholar]
- Government of Spain. Código Técnico de la Edificación—Documento Básico de Ahorro de Energía; BOE 219 2013 Sec. I.; State Agency BOE: Madrid, Spain, 2013.
- European Commitee for Electrotechnical Stantardization (CENELEC). EN 50583-1:2016. Photovoltaics in Buildings—Part 1: BIPV Modules; European Commitee for Electrotechnical Stantardization: Brussels, Belgium, 2016. [Google Scholar]
- IEA-PVPS Home Page—Task 15. Available online: http://www.iea-pvps.org/index.php?id=task15 (accessed on 15 March 2018).
- Shukla, A.K.; Sudhakar, K.; Baredar, P. Recent advancement in BIPV product technologies: A review. Energy Build. 2017, 140, 188–195. [Google Scholar] [CrossRef]
- Zomer, C.; Nobre, A.; Cassatella, P.; Reindl, T.; Rüther, R. The balance between aesthetics and performance in building-integrated photovoltaics in the tropics. Prog. Photovolt. Res. Appl. 2014, 22, 744–756. [Google Scholar] [CrossRef]
- Han, J.; Lu, L.; Peng, J.; Yang, H. Performance of ventilated double-sided PV façade compared with conventional clear glass façade. Energy Build. 2013, 56, 204–209. [Google Scholar] [CrossRef]
- Lee, H.M.; Yoon, J.H.; Kim, S.C.; Shin, U.C. Operational power performance of south-facing vertical BIPV window system applied in office building. Sol. Energy 2017, 145, 66–77. [Google Scholar] [CrossRef]
- Yoon, J.H.; Song, J.; Lee, S.J. Practical application of building integrated photovoltaic (BIPV) system using transparent amorphous silicon thin-film PV module. Sol. Energy 2011, 85, 723–733. [Google Scholar] [CrossRef]
- Jelle, B.P.; Breivik, C.; Røkenes, H.D. Building integrated photovoltaic products: A state-of-the-art review and future research opportunities. Sol. Energy Mater. Sol. Cells 2012, 100, 69–96. [Google Scholar] [CrossRef] [Green Version]
- Cerón, I.; Caamaño-Martín, E.; Neila, F.J. ‘State-of-the-art’ of building integrated photovoltaic products. Renew. Energy 2013, 58, 127–133. [Google Scholar] [CrossRef] [Green Version]
- Shukla, A.K.; Sudhakar, K.; Baredar, P. A comprehensive review on design of building integrated photovoltaic system. Energy Build. 2016, 128, 99–110. [Google Scholar] [CrossRef]
- Probst, M.C.M.; Roecker, C. Criteria for architectural integration of active solar systems IEA Task 41, Subtask A. Energy Procedia 2012, 30, 1195–1204. [Google Scholar] [CrossRef]
- European Commission. Commission Welcomes Final Vote on Energy Performance of Buildings. 2018. Available online: file:///C:/Users/rcarv/Downloads/IP-18-3374_EN.pdf (accessed on 4 June 2018).
- Scognamiglio, A. Building-Integrated Photovoltaics (BIPV) for Cost-Effective Energy-Efficient Retrofitting. In Cost-Effective Energy Efficient Building Retrofitting Materials, Technologies, Optimization and Case Studies; Elsevier: New York, NY, USA, 2017; pp. 169–197. [Google Scholar]
- Evola, G.; Margani, G. Renovation of apartment blocks with BIPV: Energy and economic evaluation in temperate climate. Energy Build. 2016, 130, 794–810. [Google Scholar] [CrossRef]
- Eicker, U.; Demir, E.; Gürlich, D. Strategies for cost efficient refurbishment and solar energy integration in European Case Study buildings. Energy Build. 2015, 102, 237–249. [Google Scholar] [CrossRef]
- Hachem, C.; Athienitis, A.; Fazio, P. Energy performance enhancement in multistory residential buildings. Appl. Energy 2014, 116, 9–19. [Google Scholar] [CrossRef]
- International Electrotechnical Commission (IEC). IEC 6125:2016. Terrestrial Photovoltaic (PV) Modules—Design Qualification and Type Approval; International Electrotechnical Commission: Geneva, Switzerland, 2016. [Google Scholar]
- International Electrotechnical Commission. IEC 61730-1:2016. Photovoltaic (PV) Module Safety Qualification—Part 1: Requirements for Construction; International Electrotechnical Commission: Geneva, Switzerland, 2016. [Google Scholar]
- Government of Spain. Reglamento Electrotécnico para Baja Tensión e Instrucciones Técnicas Complementarias (ITC) BT 01 a BT 51; Real Decreto 842/2002; State Agency BOE: Madrid, Spain, 2002.
- Government of Spain. Real Decreto 1699/2011, de 18 de Noviembre, por el que se Regula la Conexión a red de Instalaciones de Producción de Energía Eléctrica de Pequeña Potencia; BOE-A-2011-19242; State Agency BOE: Madrid, Spain, 2011.
- Cuenca, J. CIEMAT Internal Report. PVLabDER/IT001-JC/2016; CIEMAT: Madrid, Spain, 2016. [Google Scholar]
- Martín-Chivelet, N.; Montero-Gómez, D. Optimizing photovoltaic self-consumption in office buildings. Energy Build. 2017, 150, 71–80. [Google Scholar] [CrossRef]
- International Electrotechnical Commission. IEC 61724-1: 2017. Photovoltaic System Performance—Part 1: Monitoring; IEC: Geneva, Switzerland, 2017. [Google Scholar]
- Lancereau, M. Test, Measurement and Performance Evaluation of a Standalone and Building Integrated Photovoltaic Power System. Master’s Thesis, Haute Ecole Provinciale Hainaut, Condorcet, Tournai, Belgium, 2016. [Google Scholar]
- Guiavarch, A.; Peuportier, B. Photovoltaic collectors efficiency according to their integration in buildings. Solar 2006, 80, 65–77. [Google Scholar] [CrossRef]
- Elsayed, M.S. Optimizing thermal performance of building-integrated photovoltaics for upgrading informal urbanization. Energy Build. 2016, 116, 232–248. [Google Scholar] [CrossRef]
- Peng, J.; Lu, L.; Yang, H.; Ma, T. Comparative study of the thermal and power performances of a semi-transparent photovoltaic façade under different ventilation modes. Appl. Energy 2015, 138, 572–583. [Google Scholar] [CrossRef]
- Ritzen, M.J.; Vroon, Z.A.E.P.; Rovers, R.; Geurts, C.P.W. Comparative performance assessment of a non-ventilated and ventilated BIPV rooftop configurations in the Netherlands. Sol. Energy 2017, 146, 389–400. [Google Scholar] [CrossRef]
- Payno, D. Temperatura de Operación de Módulos Fotovoltaicos (FV) en Integración Arquitectónica. Master’s Thesis, Universidad Complutense de Madrid, Madrid, Spain, 2016. [Google Scholar]
Figure 1.
Southwest view of the building before the retrofit.

Figure 2.
Southwest view of the building after the retrofit.

Figure 3.
Southwest view of the rehabilitation works.

Figure 4.
Constructive details of the PV modules fixation.

Figure 5.
Constructive details of the PV modules fixation.

Figure 6.
Real-time monitoring of the electrical variables of the grid-connected photovoltaic installation.
Figure 6.
Real-time monitoring of the electrical variables of the grid-connected photovoltaic installation.

Figure 7.
Example of CIEMAT Building 42 electric power consumption before the renovation, at a working day and a Sunday, and typical PV generation profile. In addition, a hypothetical case is included, keeping the same façades share but multiplying by 3 the installed power.
Figure 7.
Example of CIEMAT Building 42 electric power consumption before the renovation, at a working day and a Sunday, and typical PV generation profile. In addition, a hypothetical case is included, keeping the same façades share but multiplying by 3 the installed power.

Figure 8.
Final Yield of each façade and of the total PV installation, in hours (kWh/kWp).

Figure 9.
Monthly Performance Ratio of each façade.

Figure 10.
Partial shading by the trees of the east façade.

Figure 11.
Performance ratio of each of the three equivalent subsystems of the east façade, and average PR value of the whole east façade (line).
Figure 11.
Performance ratio of each of the three equivalent subsystems of the east façade, and average PR value of the whole east façade (line).

Figure 12.
Daily performance curves of one of the sub-systems that constitute the stand-alone PV installation.
Figure 12.
Daily performance curves of one of the sub-systems that constitute the stand-alone PV installation.

Figure 13.
Thermography of part of the west façade, comparing the surface temperatures of the PV modules (upper line) with those of the polymer concrete panels (lower line) [41].
Figure 13.
Thermography of part of the west façade, comparing the surface temperatures of the PV modules (upper line) with those of the polymer concrete panels (lower line) [41].


Table 1.
Main electrical specifications of the two types of PV modules used in the installation.
| SunPower E18-305W (South and West Façades) | SunPower E20-327W (East and West Façades) | |
|---|---|---|
| Number Installed | 30 + 16 + 16 + 2 = 64 | 42 + 2 = 44 |
| Voc (V) | 64.2 | 64.9 |
| Isc (A) | 5.96 | 5.98 |
| Vm (V) | 54.7 | 54.7 |
| Im (A) | 5.58 | 5.98 |
| Pm (W) | 305 | 327 |
Table 2.
Main electrical specifications of the two types of grid connection inverters.
| Fronius IG Plus 50 V-1 (East and West Façades) | Fronius IG Plus 100 V-3 (South Façade) | |
|---|---|---|
| units | 3 (east), 1 (west) | 1 |
| Vdc max (V) | 600 | 600 |
| Idc max (A) | 18.5 | 36.7 |
| ΔVpmp (V) | 230–500 | 230–500 |
| Pdc max (W) | 4260 | 8430 |
| Pac (W) | 4000 | 8000 |
| Iacmax (A) | 17.4 | 11.6 |
| ηeuropean (%) | 95.0 | 95.3 |
Table 3.
Characteristics of the three independent stand-alone systems.
| Sub-System | PV Power (kWp) | Daily PV Energy Production (kWh) December/July | Battery Capacity (kWh@10h) | Battery Voltage (V) | Output |
|---|---|---|---|---|---|
| 1 | 3.6 | 2.4/7.9 | 19 | 48 | 230 Vac, 7 kWmax |
| 2 | 0.6 | 0.4/1.3 | 28 | 48 | 48 Vdc |
| 3 | 0.6 | 0.4/1.3 | 3.5 | 12/24 | 12/24 Vdc |
© 2018 by the authors. Licensee MDPI, Basel, Switzerland. This article is an open access article distributed under the terms and conditions of the Creative Commons Attribution (CC BY) license (http://creativecommons.org/licenses/by/4.0/).
Share and Cite
MDPI and ACS Style
Martín-Chivelet, N.; Gutiérrez, J.C.; Alonso-Abella, M.; Chenlo, F.; Cuenca, J. Building Retrofit with Photovoltaics: Construction and Performance of a BIPV Ventilated Façade. Energies 2018, 11, 1719. https://doi.org/10.3390/en11071719
AMA Style
Martín-Chivelet N, Gutiérrez JC, Alonso-Abella M, Chenlo F, Cuenca J. Building Retrofit with Photovoltaics: Construction and Performance of a BIPV Ventilated Façade. Energies. 2018; 11(7):1719. https://doi.org/10.3390/en11071719
Chicago/Turabian StyleMartín-Chivelet, Nuria, Juan Carlos Gutiérrez, Miguel Alonso-Abella, Faustino Chenlo, and José Cuenca. 2018. "Building Retrofit with Photovoltaics: Construction and Performance of a BIPV Ventilated Façade" Energies 11, no. 7: 1719. https://doi.org/10.3390/en11071719
Note that from the first issue of 2016, this journal uses article numbers instead of page numbers. See further details here.