Article

On the Effect of a Rail Pressure Error State Observer in Reducing Fuel Injection Cycle-to-Cycle Variation in an Opposed-Piston Compression Ignition Engine

1
School of Mechanical Engineering, Beijing Institute of Technology, Beijing 100081, China
2
Department of Mechanical Engineering, The Hong Kong Polytechnic University, Hung Hom, Hong Kong 999077, China
*
Authors to whom correspondence should be addressed.
Energies 2018, 11(7), 1729; https://doi.org/10.3390/en11071729
Submission received: 28 May 2018 / Revised: 12 June 2018 / Accepted: 13 June 2018 / Published: 2 July 2018

Abstract

:
The fuel injection cycle-to-cycle variation characteristic in an opposed-piston compression ignition engine was investigated experimentally. Based on the optimal Proportion Integration Differentiation (PID) method, a new control method was proposed by utilizing a rail pressure error state observer (OBS) before feedback. Compared with the conventional filtering treatment method, the OBS method was developed to simultaneously account for the flow mass changing and the dynamics of a common rail system, rather than representing the rail pressure state as an average value over a period time. The OBS method was subsequently implemented in the control system to investigate the injection pressure oscillation characteristic and cycle-to-cycle variation of injected fuel quantity. The results show that the present OBS method substantially reduces the injection pressure oscillation, improves response characteristics of the control system, and produces qualitatively satisfactory fuel injection cycle-to-cycle variation in the opposed-piston compression ignition (OPCI) engine.

1. Introduction

Due to the increasingly severe requirements of fuel consumption and exhaust emission, common rail systems (referred to as CRS hereinafter) are moving towards higher rail pressure and multiple injections [1,2], which implies a better fuel/air mixture in the combustion chamber of conventional compression ignition engines (referred to as CCI hereinafter) [3]. Nevertheless, high rail pressure and multiple injections uncertainty will lead to a larger increase in rail pressure oscillations and complex pressure wave propagation laws, which impose higher requirements for CRS control such as fast actuations, retaining, and good precision of the injected fuel quantity.
Currently, CRS utilizes the rail pressure–time injected fuel metering method, which obtains the injector energizing time, E T , from a related map according to the current rail pressure value and the target injected fuel quantity; the injector is then driven to implement the fuel injection process [4]. Thus, the accuracy and stability of the rail pressure are key to influencing E T and the injected fuel quantity, which also plays a very important role in the cycle-to-cycle variation of the injection process. The rail pressure is continuously monitored by a pressure sensor, so that the difference between the target rail pressure and the filtered sensor-measured value is used as an input parameter for the electronic control unit (ECU) to stabilize the rail pressure and reduce pressure oscillations. Commonly used control methods include optimized Proportion Integration Differentiation (PID) [5,6], intelligent control [7], and coordinated control [8,9]. Generally, the filtering employs eigenvalue methods, such as mean variance, maximum, median [10,11], and other methods like linear filtering, first-order filtering, etc. [12,13]. Attention has mainly been directed to filtering high-frequency interferential signals by handling pressure data, i.e., the transient rail pressure value will be replaced by an average one over a period of time. However, average values of rail pressure alone cannot accurately reflect the real rail pressure state in real time, which can lead to the misjudgment of rail pressure and, hence, cycle-to-cycle variation of injected fuel quantity.
Because of its important role in influencing fuel injection control and cycle-to-cycle variation of injected fuel quantity, the pressure oscillation characteristic in CRS and its suppression methods have been investigated for many years. A number of research works have been conducted to investigate the transient rail pressure oscillation characteristics. For a brief summary, Catania et al. [14] numerically studied the dynamic characteristics of the pressure wave propagation, the result showing that significant pressure oscillation caused by water hammer can be observed near the injector entrance, which also takes a relatively long time (i.e., around 5 ms) to recover. Henein et al. [15] experimentally investigated the pressure wave on a prototype by employing a Matlab/Simulink (2014a, MathWorks, Inc., Natick, MA, USA) simulation platform to determine and control the rail pressure. The result indicates that the pressure wave affects the operation of either the needle valve or the nozzle under the condition of single injection, hence influencing the injected fuel quantity. Moreover, the injection delay time (i.e., the time period between the injection signal’s starting time and the real injection starting time) reduces with increasing rail pressure. To further investigate the pressure oscillation characteristics, Bianchi et al. [16] experimentally and theoretically analyzed the fuel pressure wave characteristics within the rail pipe; the result shows that the propagation and oscillation of the fuel pressure wave in the rail pipe significantly influences the injected fuel quantity. However, the discrepancy between the real rail pressure value and the filtered senor-measured value has been barely investigated in injected fuel quantity oscillation and cycle-to-cycle variation control.
With the motive of quantitatively fixing the sensor-measured rail pressure, Catania et al. [17,18] proposed a lumped parameter model to evaluate the rail pressure value which is significantly different from the sensor-measured rail pressure. Subsequently, Lino et al. [19] established a nonlinear equilibrium model of fuel mass flow rate in CRS and found the unbalanced flow to be an important factor in pressure oscillation generation and applied the sliding mode control method in pressure oscillation suppression. Baur et al. [20] developed a strategy-dependent model to control and stabilize the rail pressure in a direct injection gasoline engine; the experimental results show that this model can be used to accurately control the rail pressure. Alessandro et al. [21] proposed injection pressure regulation to stabilize the fuel pressure in the common rail fuel line and validated it via experiments. The resulting control strategy was composed of a feedback integral action and a static model-based feed-forward action whose gains are scheduled as a function of fundamental plant parameters. These control methods modified the sensor-measured pressure by using mathematical models to account for the flow changing effects in off-line controller design. However, investigations on predicting the inlet and outlet mass flow rate by using mathematical revision in an on-line control system are still insufficient.
In the present work we aim to develop a new on-line pressure-oscillation-reducing control method based on the mathematical model of CRS [22,23], namely, a rail pressure error state observer (referred to as OBS hereinafter) to reduce the injection cycle-to-cycle variation in an opposed-piston compression ignition engine (referred to as OPCI hereinafter). Unlike the CCI, OPCI has no cylinder head but has two pistons in one cylinder, so the fuel injectors can only be mounted on the cylinder liner. In order to adequately utilize the air in the combustion chamber, two injectors are oppositely arranged on the liner and liquid fuel from two opposed injectors is simultaneously injected into the combustion chamber, producing larger fuel flow mass change than CCI does and giving prominence to the rail pressure oscillation and cycle-to-cycle variation of the injected fuel quantity. Because the conventional filtering method cannot meet the needs of rail pressure control of the OPCI, the OBS is specially designed to achieve a better control effect.
It has been recognized that fuel injection cycle-to-cycle variation substantially reduces the engine performance [24,25]. Whereas fuel injection pressure oscillation and injected quantity cycle-to-cycle variation become more prominent in the OPCI, it is surprising to find that most previous studies on fuel injection of OPCI were concerned with spray layout [26,27] optimization and spray combustion characteristics [28]. Thus, it is necessary to analyze the effects of OBS application on the spray combustion characteristics.
Based on the above considerations, we conducted an experimental investigation on pressure oscillation and injection cycle-to-cycle variation characteristics in the OPCI, with an emphasis on illustrating the necessity of reducing injection pressure oscillation in the OPCI engine. A new rail pressure treatment method was developed based on the mathematical model of CRS to accurately estimate the rail pressure value and reduce the cycle-to-cycle variation of fuel injection. CFD (Computational Fluid Dynamics) calculation was employed to simulate the spray combustion characteristic so as to supplement the experimental results. We shall describe the adopted OBS method based on the mathematical model of CRS in Section 2. The experimental methodology and specifications shall be presented and introduced in Section 3, followed by results and discussion in Section 4 and concluding remarks in Section 5.

2. Mathematical Model of CRS and OBS

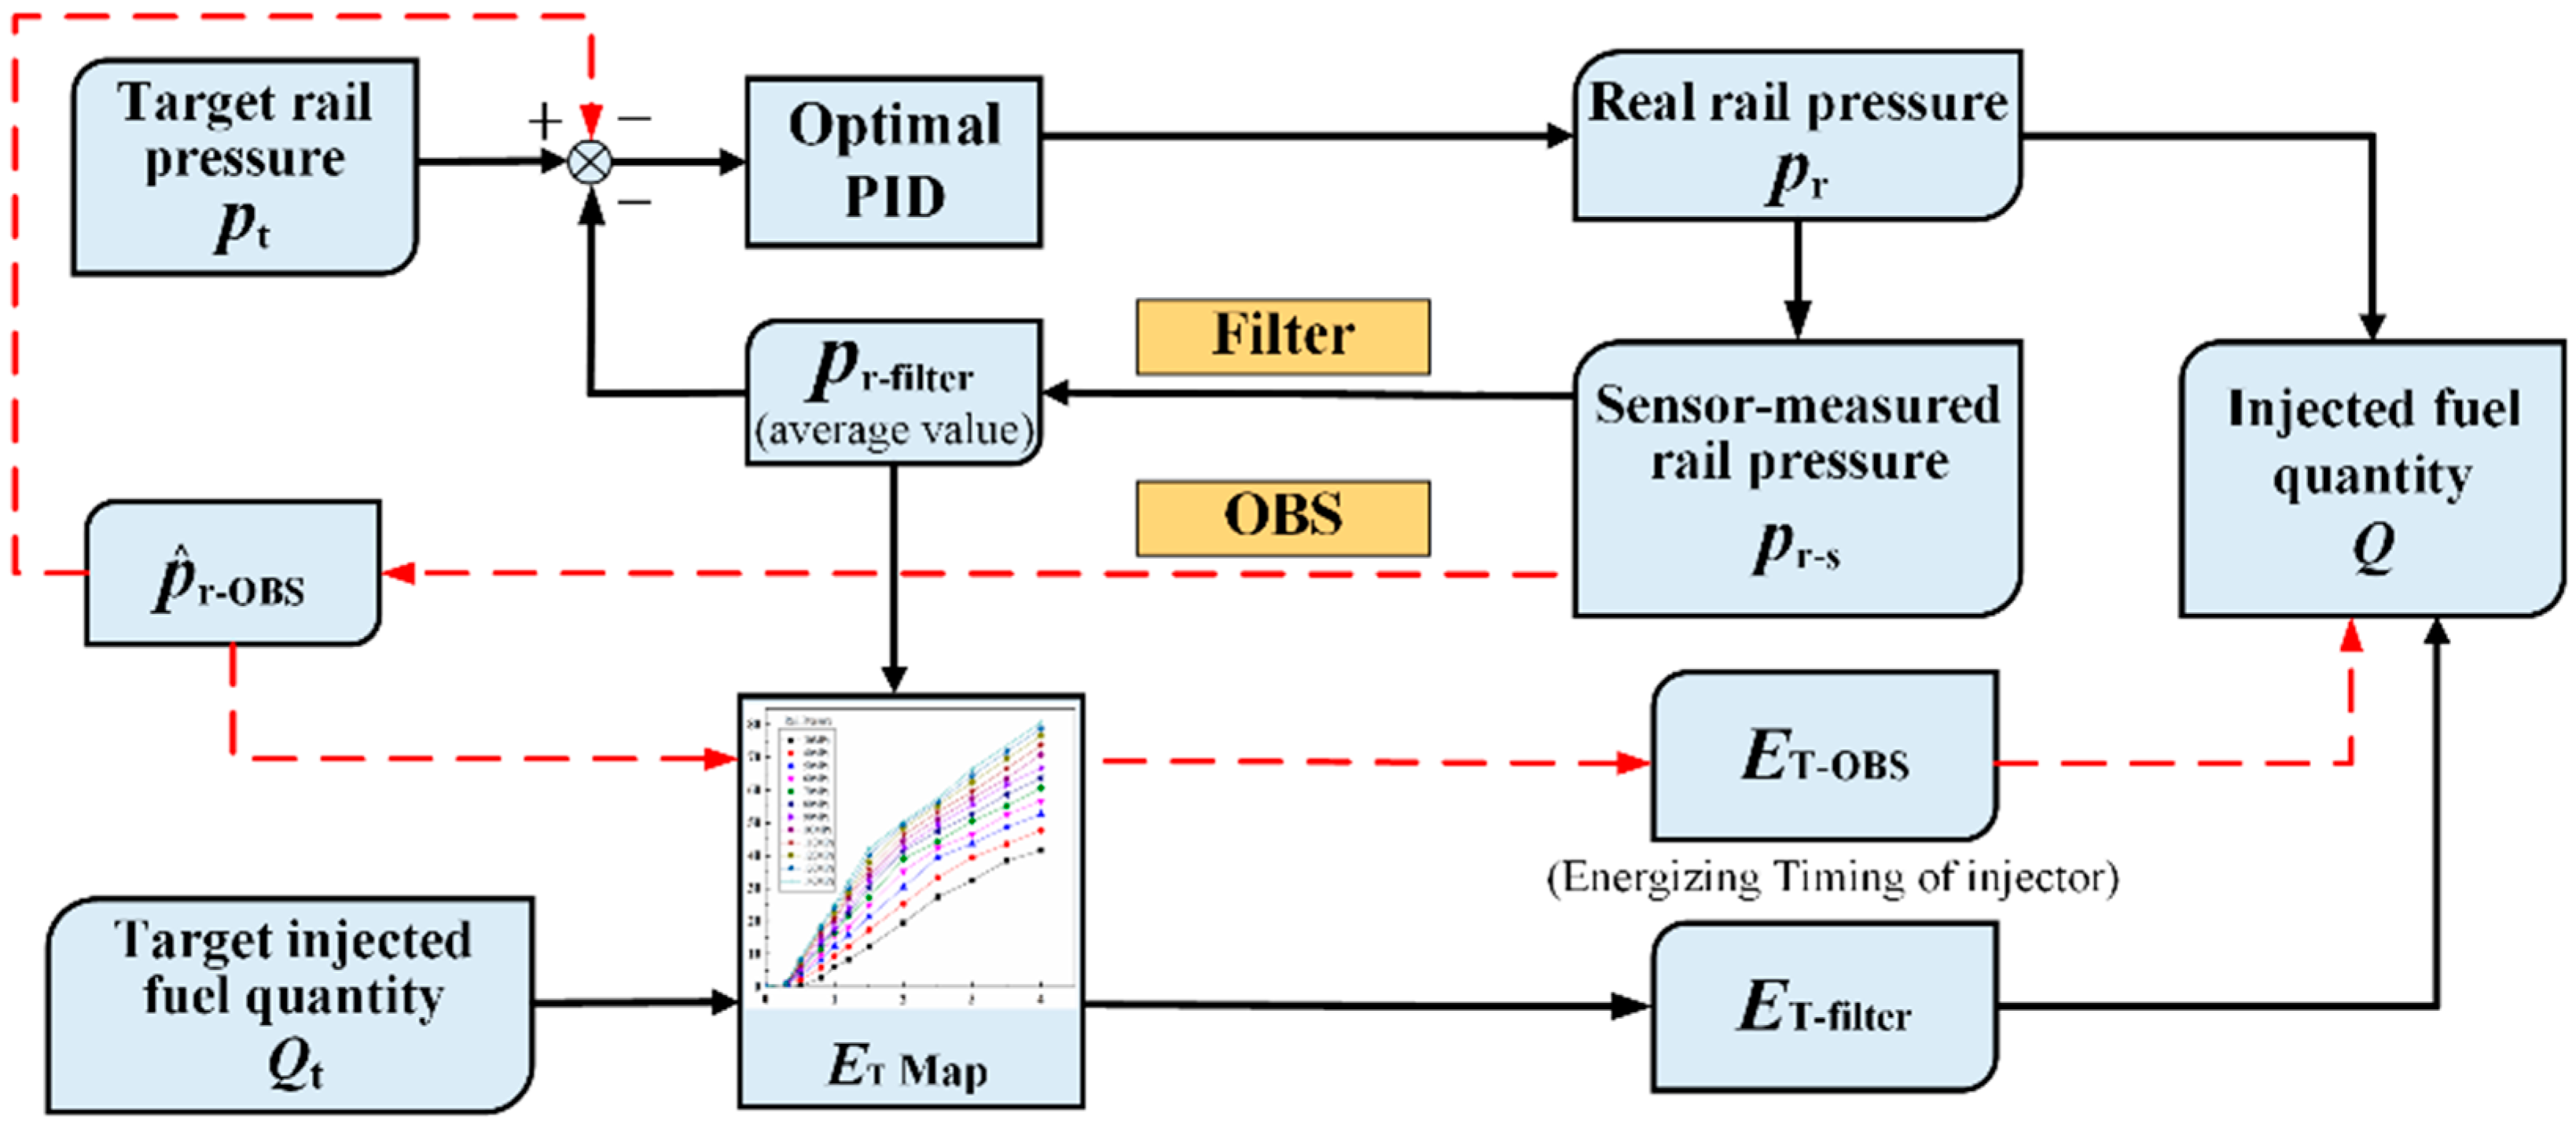
2.1. Control Principle of CRS

The control principle of CRS is shown in Figure 1. The CRS controller adopts the close-loop control strategy, which stabilizes the rail pressure, p r , adequately close to the target rail pressure, p t . The rail pressure is monitored by a pressure sensor, namely, sensor-measured, p r - s , so that the difference between p t and the filtered sensor-measured rail pressure, p r - f i l t e r , is the input signal for the controller. Hence, the pumping fuel quantity, Q p u m p , is adjusted and the difference of pressure tends to zero. The injected fuel quantity, Q , control adopts the open-loop control strategy, which queries the related map according to the target injected fuel quantity, Q t , and p r - f i l t e r ; thus, the injector energizing time, E T , is obtained. On this basis, the E T signal and the injection timing signal are used to drive the injector. Nevertheless, p r - f i l t e r is only an average value over a period of time, and cannot accurately reflect the transient rail pressure state in real time. Actually, p r and Q are all affected by system dynamics, which include flow rate change, hydraulic components dynamics, and injection pulse. Therefore, a new rail pressure treatment method based on the mathematical model of CRS, namely, OBS, is designed to replace the filter and reduce both the oscillation and cycle-to-cycle variation of the injected fuel quantity.

2.2. Control-Oriented Mathematical Model of CRS

In the following section we shall introduce the adopted mathematic model of OBS associated with the widely used optimal Proportion Integration Differentiation (PID) control. Here, we first briefly introduce the mathematical model of CRS for the subsequent OBS model design. CRS possess a specific pressure–flow rate relationship; thus, the transient pressure of the liquid fuel can be described by the continuity and momentum equations and Newton’s law of motion. By assuming a constant temperature of the liquid fuel, constant pressure before and after the low-pressure pump, and no hysteresis effects of hydraulic switches, the relevant mathematical model was obtained [19].
Fuel compressibility can be expressed using the fuel bulk modulus of elasticity K f , given by
K f = d p / ( d v / v )
where p is the fuel pressure, and v is the instantaneous fuel volume. This equation can be approximated by the empirical formula [29] as
K f = 12,000 × ( 1 + 0.6 p 600 ) .
Equation (1) also can be represented as
d p d t = K f v d v d t = K f v ( d V d t q i n + q o u t )
where V is the fuel volume change due to the motion of mechanical parts, q i n is the inlet volume flow rate, and q o u t is the outlet volume flow rate. By using the energy conservation law, q i n and q o u t can be calculated as follows:
q = s g n ( δ p ) c d A 2 | δ p | / ρ
where δ p is the fuel pressure difference across the orifice section of interest A , c d is the discharge coefficient defined as the rate of actual and ideal flows, and ρ is the liquid density.
In terms of the high-pressure pump, piston motion results in the actual volume changes with respect to the camshaft angle; thus, the actual volume can be calculated by
V p ( θ ) = V p 0 A p s p ( θ )
where V p 0 is the maximum chamber volume, the engine crankshaft is driven by the belt with a 1.125 times rotation speed, θ is the camshaft angle, and A p is the pump orifice area. s p is the plunger instantaneous axial displacement, which is obtained by fitting the camshaft profile, given by
s p ( θ ) = [ 2.85 2.85 cos ( 0.01745 θ ) ] × 10 3 .
The pumping fuel volume, q p , is determined from the Pulse Width Modulation (PWM) signal u PWM , which is used for controlling the solenoid valve, given by
q p = s g n ( p p p g ) c d , p A p 2 | p p p g | ρ u PWM
where p p and p g are the pressures before and after the fuel pump, respectively, and c d , p is the discharge coefficient of the fuel pump. Similarly, the fuel injection volume, q i , for each injector can be calculated as
q i = s g n ( p r p i ) c d , i A i E T 2 | p r p i | ρ
where p r and p i are the rail pipe pressure and the ambient pressure surround the injector, c d , i is the injector nozzle discharge coefficient, A i is the nozzle area, and E T is the injection pulse width.
To simplify the design process of the control law, we assume that the flow between delivery valve and fuel pump is equal to the flow between the delivery valve and the common rail pipe. It should be noted that the inaccuracies resulting from the simplifications of the model can be compensated for by the rational design of the control algorithm. Thus, the rail pressure variation ( p r ˙ ) and the fuel mass change ( m ) inside the CRS are as follows:
p r ˙ = d p r d t = K f ( p r ) V r [ A p ω d s p d θ + s g n ( p p p g ) c d , p A p 2 | p p p g | ρ u PWM 2 c d , i A i E T 2 p r ρ ]
and
m = ρ A p ω d s p d θ + s g n ( p p p g ) c d , p A p 2 ρ | p p p g | u PWM 2 c d , i A i E T 2 ρ p r
where V r is the rail pipe volume, ω is the camshaft speed, s p is the piston instantaneous axial displacement of pump volume, m is the fuel mass change per cycle.

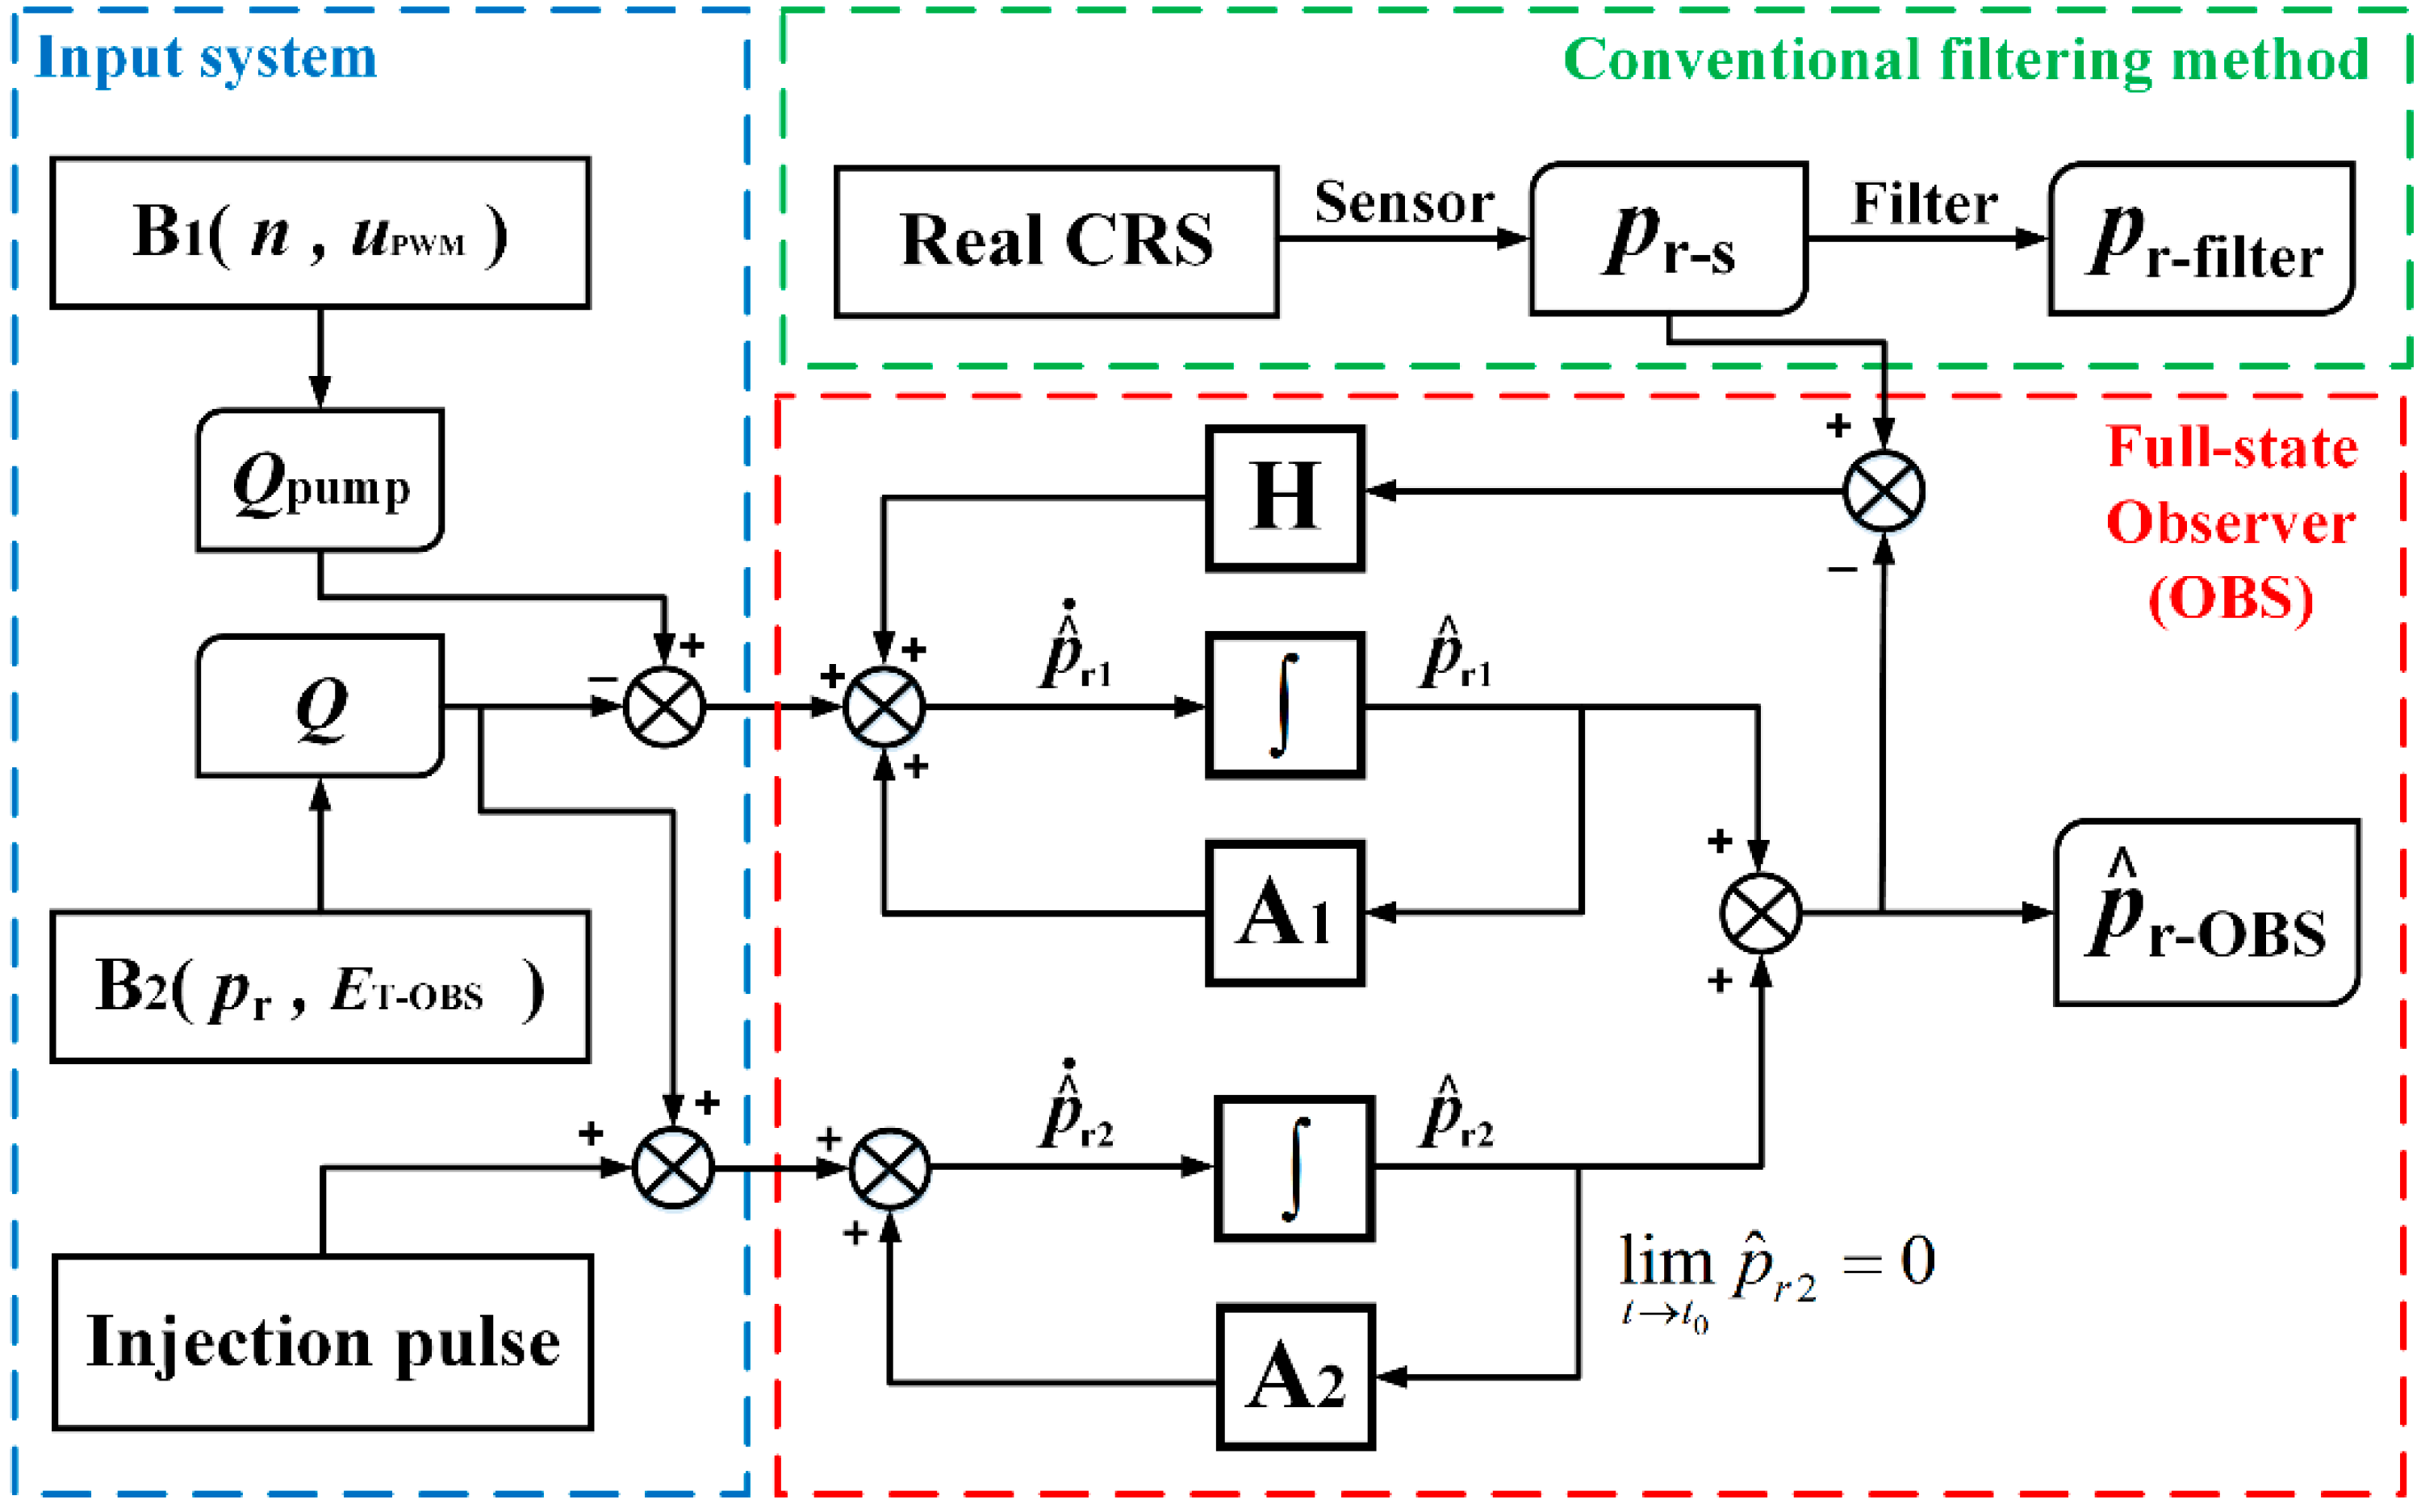
2.3. Mathematical Model of OBS

The working principle of the OBS method based on the mathematical model of CRS and conventional filtering method is shown in Figure 2. The conventional control method adopts sensor-measured pressure data after a simple filtering, p r - f i l t e r , as the input parameter of the control system. As mentioned in the previous text, the p r - f i l t e r is an average value over a period of time, and may not accurately represent the real pressure state inside the rail pipe in real time, resulting in cycle-to-cycle variation of fuel injection. Additionally, the sensor-measured pressure, p r - s , cannot be directly used as the input of the controller due to the influence of large high-frequency interferential signals, which may cause larger pressure oscillation. Thus, we modified the previous control by adding an OBS model to replace the filter. The OBS method can effectively eliminate the influence of pressure oscillation, resulting from the dynamics of CRS hydraulic components and the wave propagation phenomena after the injection pulse, and decrease the injected fuel quantity oscillation caused by the misjudgment of the rail pressure state. Particularly, the OBS model contains two components, namely, the input system and the full-state observer. The input system includes pumping fuel quantity, Q p u m p , and injected fuel quantity, Q . B 1 ( n , u PWM ) is a coefficient associated with speed, n , and u PWM ; while B 2 ( p r , E T ) is a coefficient associated with rail pressure, p r , and fuel injection duration, E T . “Injection pulse” represents the action of the injector opening and closing.
The full-state observer contains Part 1 which accounts for the pressure affected only by fuel quantity change, p ^ r 1 , during the pumping and injection process, and Part 2 which accounts for the pressure affected by the injection pulse, p ^ r 2 . A 1 and A 2 are the rail-pressure-determining matrices associated with the error correction gain matrix H to determine the output pressure p ^ r - OBS .
It is noted that in the engine operating conditions the concern about the precise characteristics of pressure oscillation is far below the trend and accuracy of pressure oscillation which are consistent with changes in the input and output of the total fuel injection quantity. Consequently, it is a great advancement to get the continuous flow characteristics by using OBS in the real-time calculation of rail pressure. Simultaneously, the limitation of p ^ r 2 is trending to zero within the specific time (i.e., lim t t 0 p ^ r 2 = 0 ). By considering the liquid fuel mass change and pressure oscillation, together with real-time data from the sensors and the error correction gain matrix H , the system response speed and accuracy were significantly improved.
In the control system, we assumed that the sensor-measured rail pressure, p r - s , can be described by the following nonlinear equation:
p ˙ r - s = A 1 p r - s + A 2 p r - s + B 1 ( n , u PWM ) Q p u m p + B 2 ( p r , E T ) Q
where A 1 is influenced by the cavity structure of CRS, and the order is related to the modeling refinement degree. A 2 describes the pressure oscillation characteristics caused by the action of the injector opening and closing. It has been recognized that the actual rail pressure variation results from the changing of p ˙ r 1 and p ˙ r 2 . Therefore, the estimated value of OBS includes f p ^ r 1 and p ^ r 2 :
p ^ ˙ r 1 = A 1 p ^ r 1 + B 1 ( n , u PWM ) Q p u m p + B 2 ( p r , E T ) Q
and
p ^ ˙ r 2 = A 2 p ^ r 2 .
Simultaneously, the CRS is an initial nonzero system, so if the OBS equation consists of the nonlinear equation in the application process, and the initial state is completely known, the OBS can be used to completely reproduce the system state. In addition, there are some errors in the actual CRS due to the model equation simplification, the initial state, and the low sampling frequency. Consequently, it is necessary to add a weighted term containing the estimated error to continuously correct the influence of the above errors and accelerate the state feedback. To determine the online real-time correction of OBS, we use
p ^ ˙ r - OBS = A ^ 1 p ^ r - OBS + B 1 ( n , u PWM ) Q p u m p + B 2 ( p r , E T ) Q + H ( p r s p ^ r - OBS ) .
To effectively control the error range of OBS, an error vector was determined by
e ˙ p = A 1 ( p r s p ^ r - OBS )   H ( p r s p ^ r - OBS ) + A 2 p ^ r 2 + e
e ˙ p = ( A 1 H ) e p + A 2 p ^ r 2 + e
and
e p = e ( A 1 H ) t + 0 t A 2 p ^ r 2 d t + 0 t e d t .
Here, 0 t A 2 p ^ r 2 d t = 0 because the pressure oscillation A 2 p ^ r 2 caused by fuel injection decays over time. Sensor-measured pressure consists of the real pressure variation and oscillation characteristics, and the error between the real model and e also decays to zero over time.

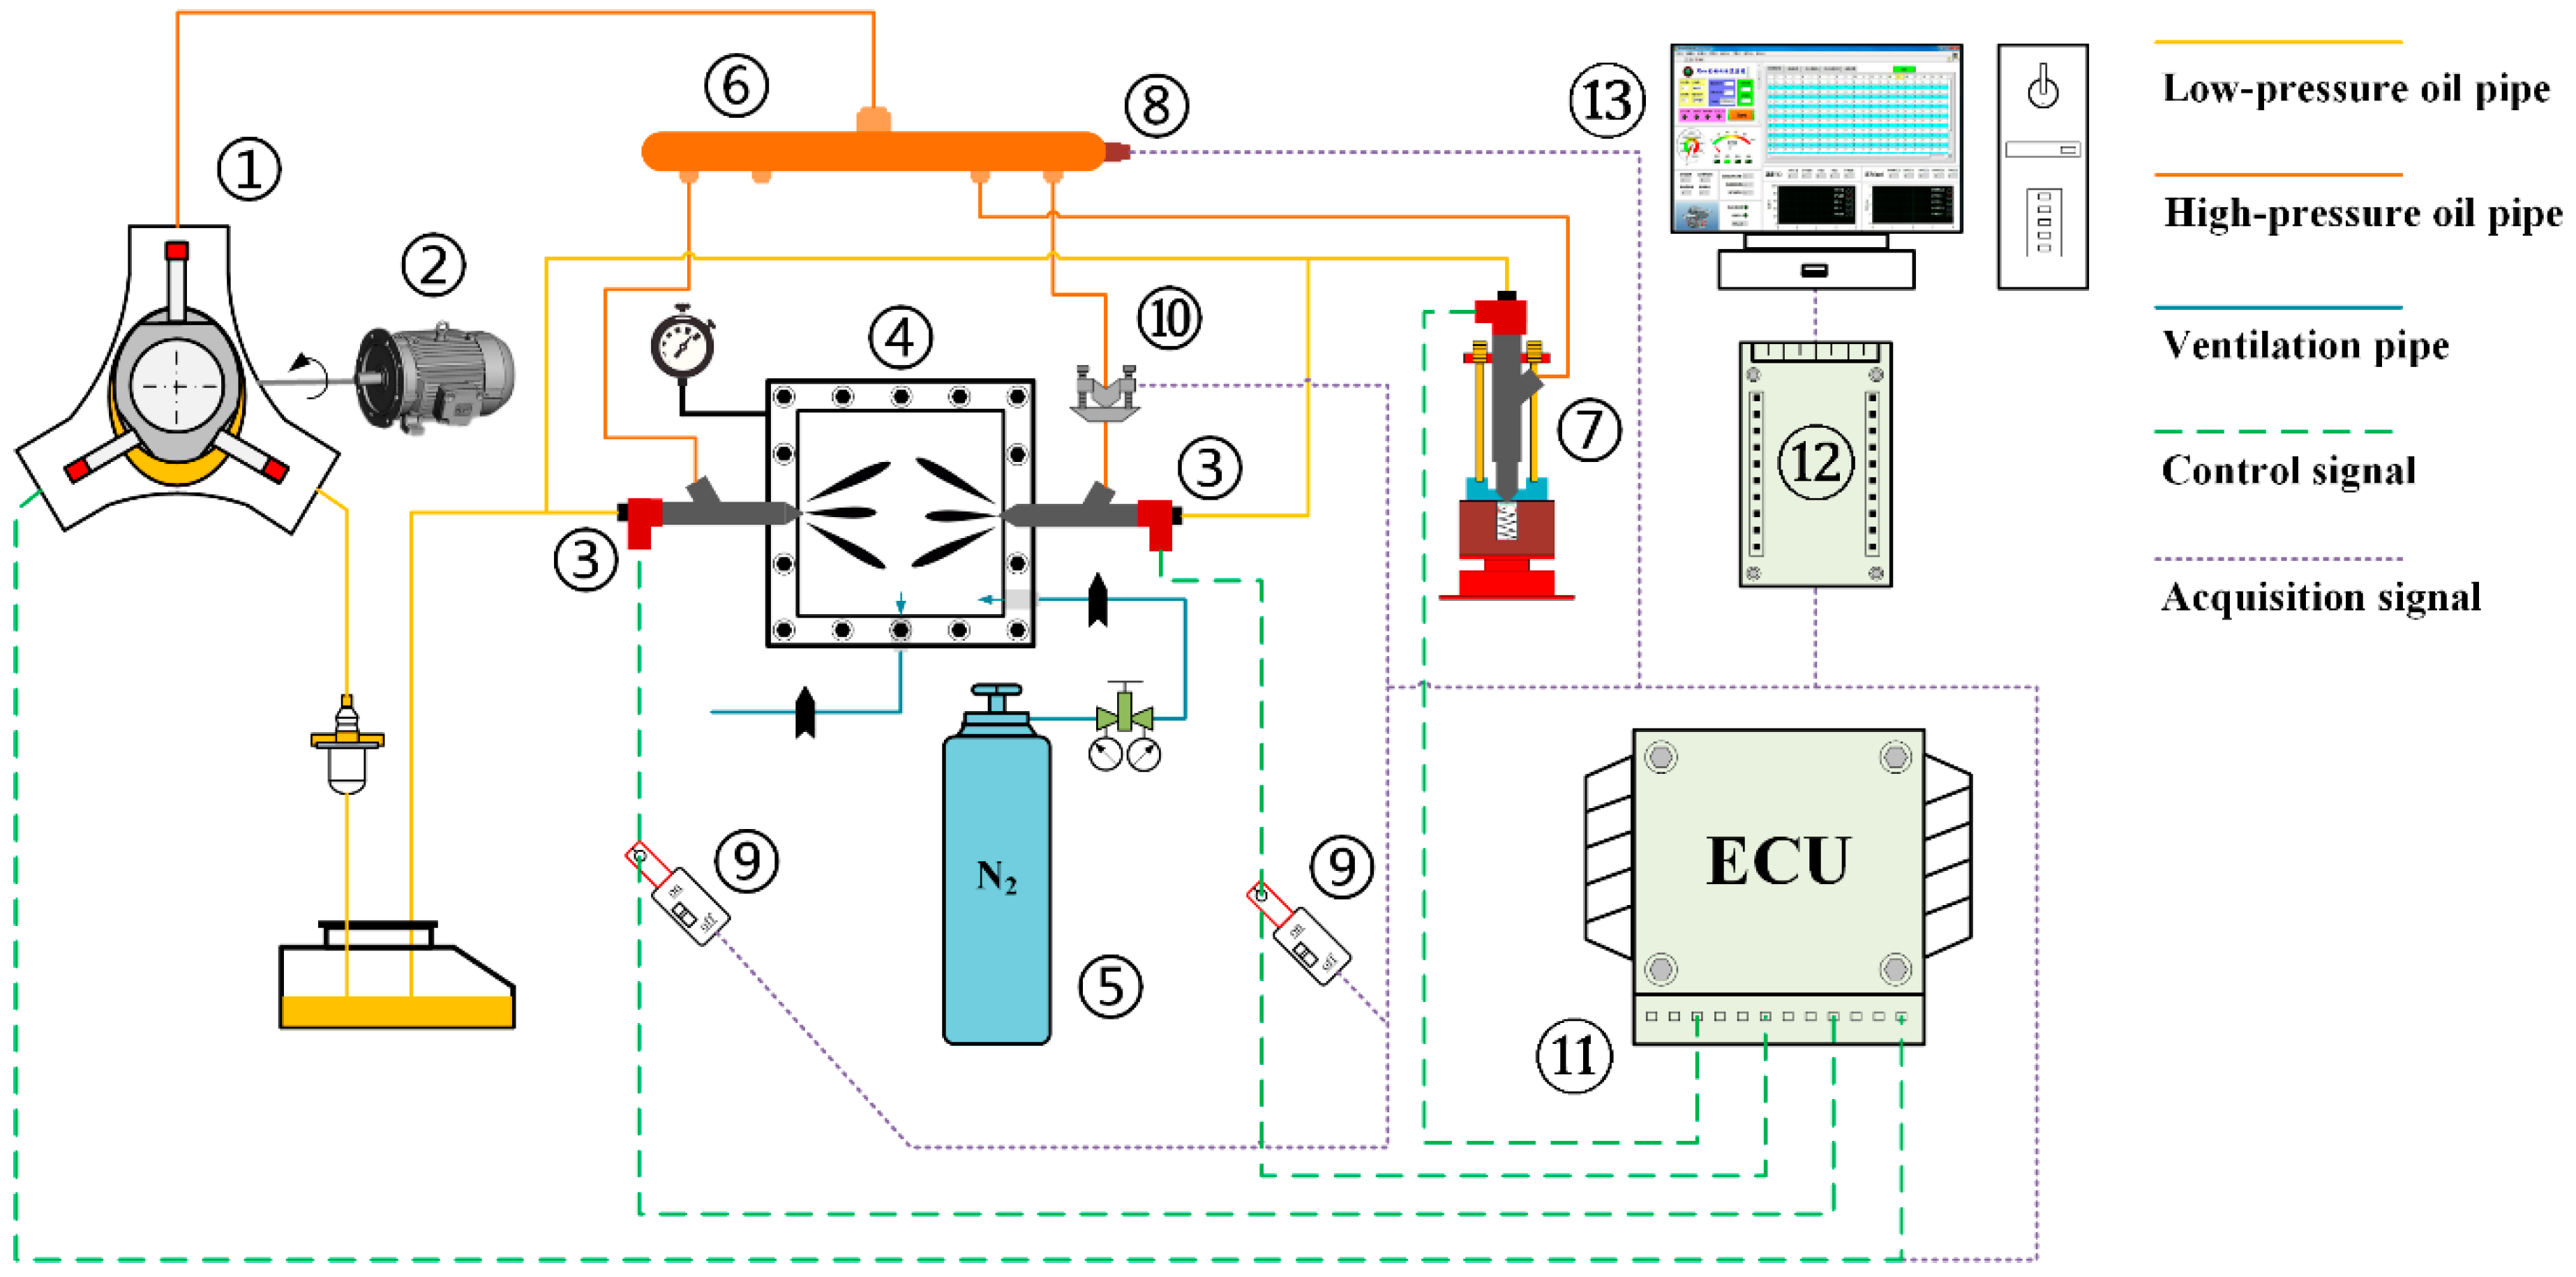
3. Experimental Specifications

To evaluate the effect of the control algorithm, we designed and conducted an experiment for a CRS which is employed by the OPCI prototype, as shown in Figure 3. The Bosch CP1H3 three-plunger fuel pump (Bosch, Stuttgart, Baden-Württemberg, Germany) ① was powered by an EBS677 electrical motor (Jinnuo, Tai’an, Shandong, China) ② with the rated power of 30 kW. Two opposed-arranged Bosch CRI 2.2 injectors (Bosch, Stuttgart, Baden-Württemberg, Germany) ③ were mounted on the high-ambient-pressure constant-volume chamber ④, and the chamber was filled with high-pressure nitrogen which was initially stored in the container ⑤. During the experiment, fuel was pumped into the common rail pipe ⑥ so as to generate high rail pressure. The fuel injection quantity was measured by an EFS8246 single-injection instrument (EFS, Montagny, Burgundy, France) ⑦. A Bosch-0281002937 pressure sensor (Bosch, Stuttgart, Baden-Württemberg, Germany) ⑧ installed on one side of the rail pipe was employed to measure the rail pressure with 100 Hz in frequency. The current clamp ⑨ was employed to record the injectors’ driving electric current, while a Kistler 4067C pressure sensor (Kistler Instrument Corp., Amherst, NY, USA) ⑩ which was installed on the injector entrance was used to measure the injector driving pressure with 1 × 10 5 Hz in frequency. The test bench was controlled by a handmade electronic control unit ⑪, and the input parameters were collected by a data acquisition card ⑫ and processed by a host computer ⑬. The performance of the rail pressure control algorithm with and without the OBS was tested and compared, to be elucidated in the following text.

4. Results and Discussion

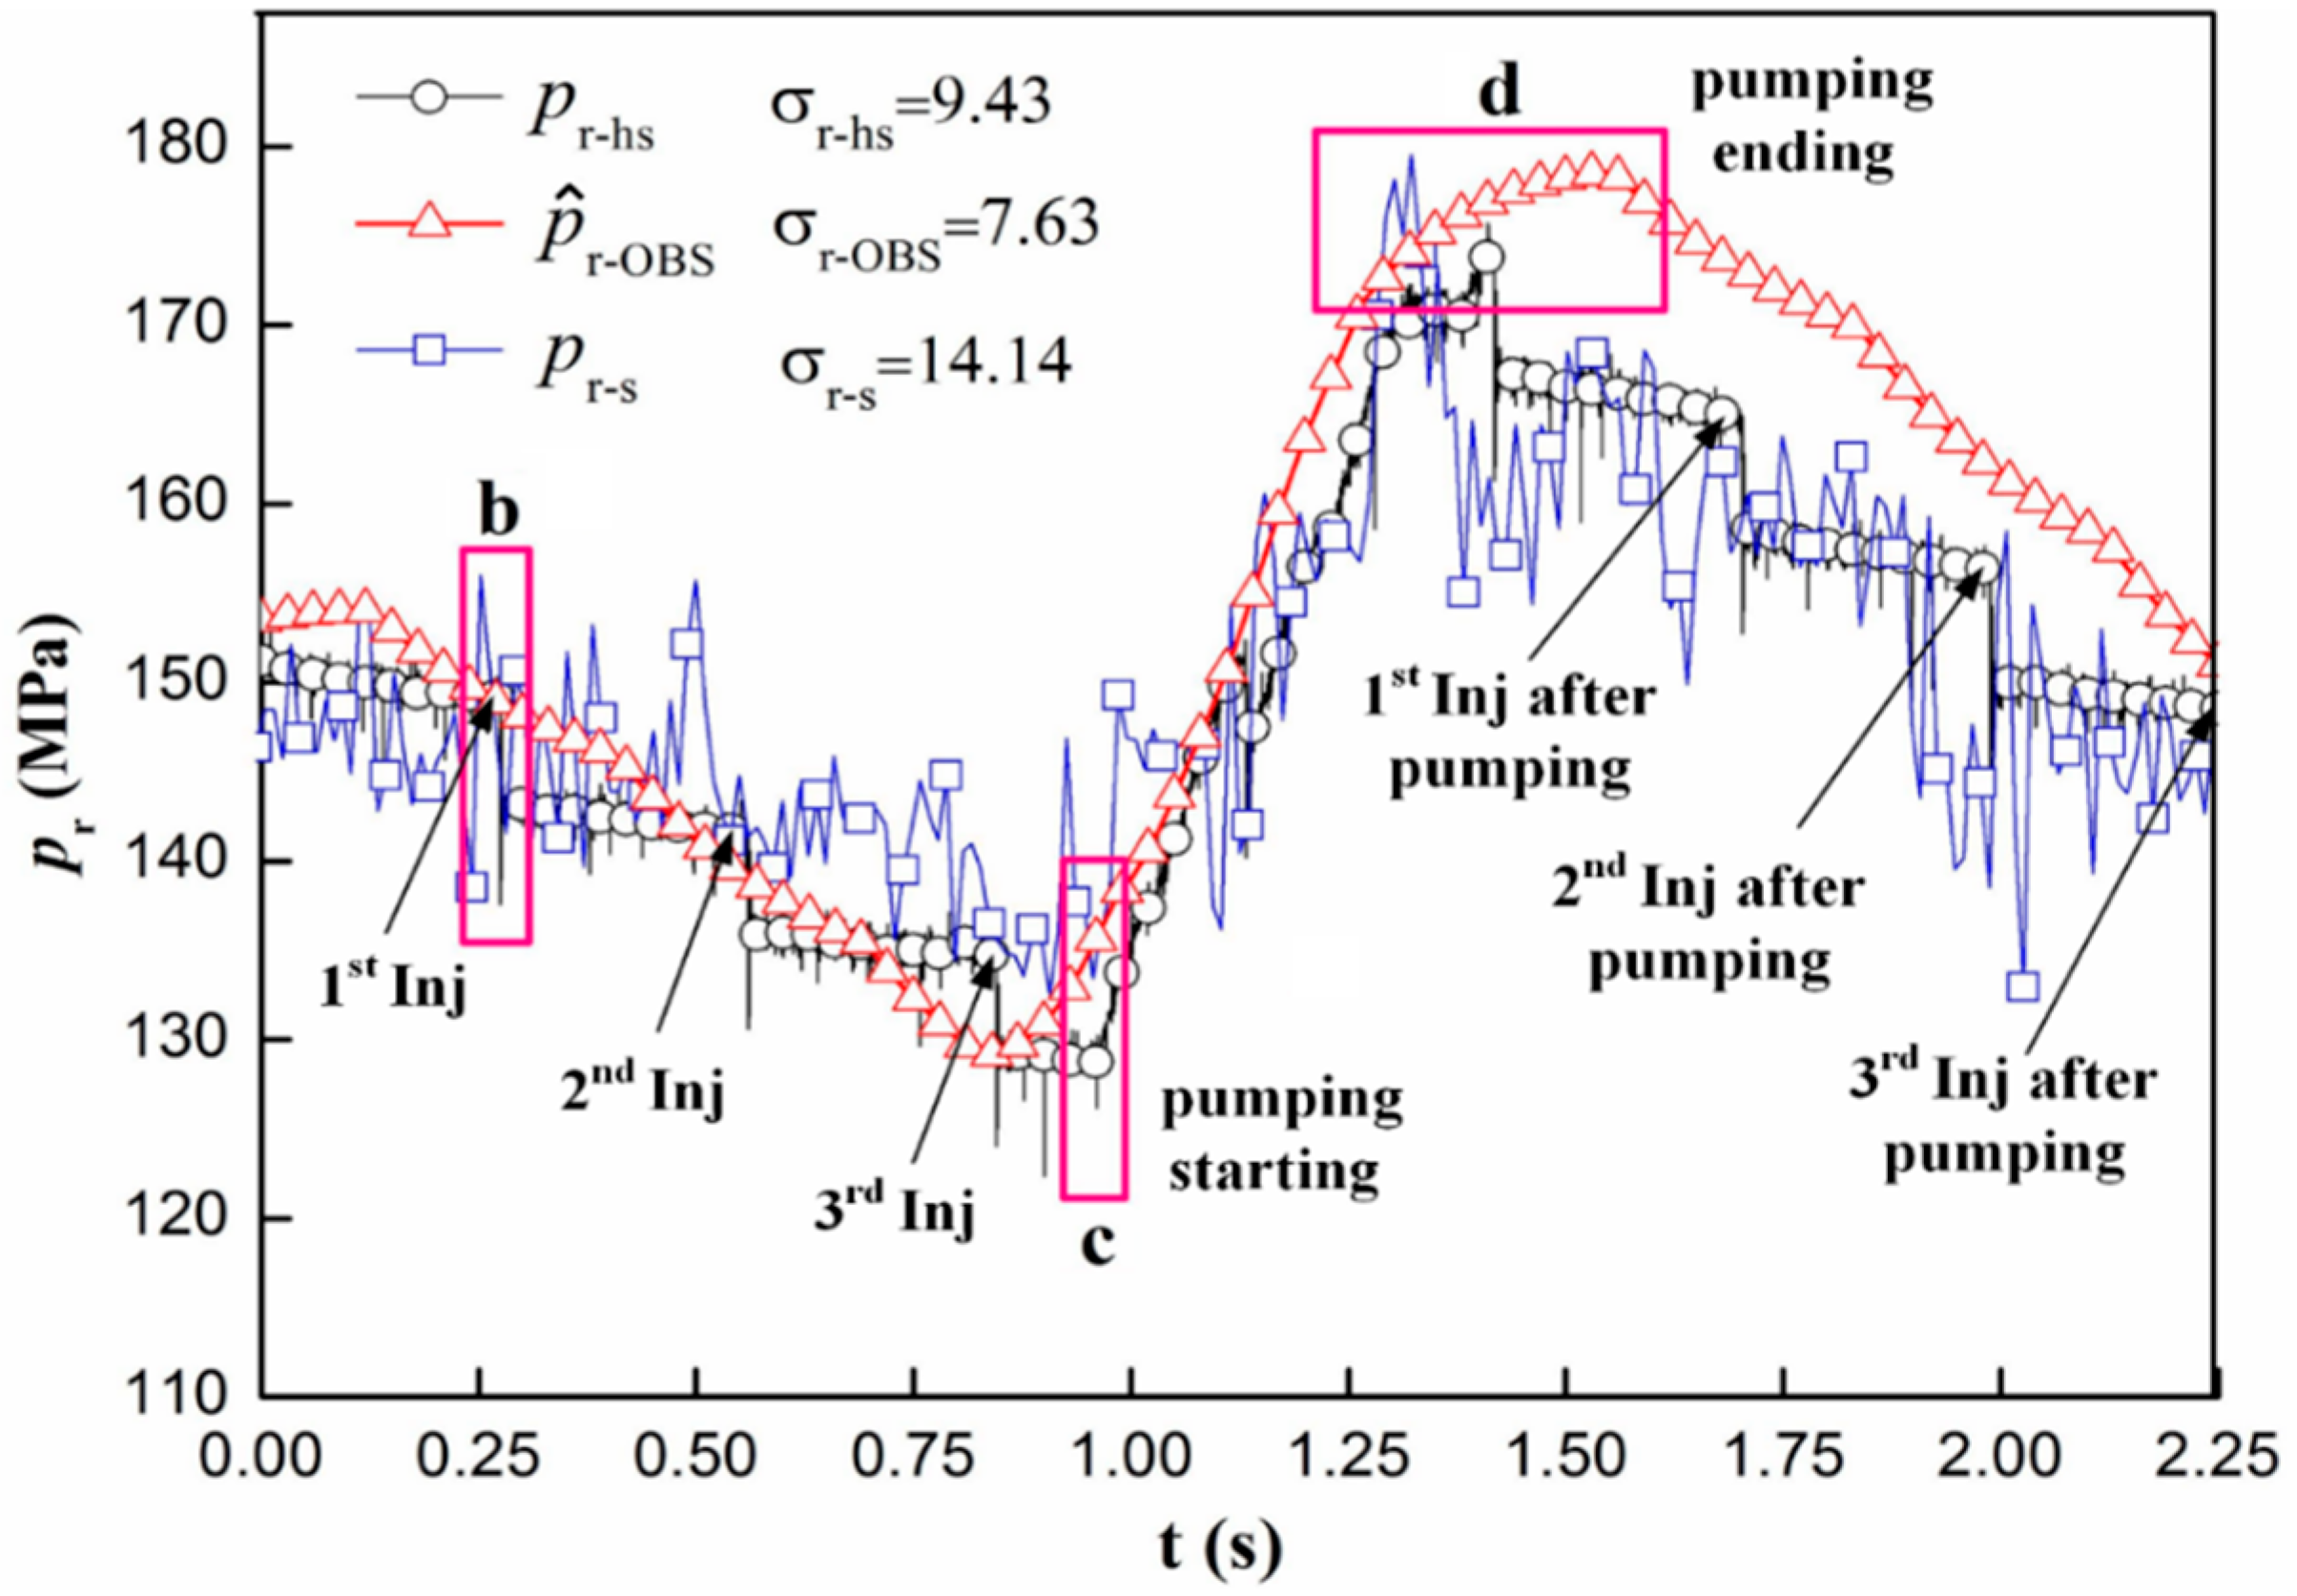
4.1. Rail Pressure in a Pumping–Injection Cycle

To show the difference between p r - s and p ^ r - OBS , we compared the two measured pressures in Figure 4 with the target pressure, p t = 150   MPa . Specifically, the sensor-measured pressure under high sampling frequency, p r - h s , is shown in the figure as a reference. In the experiment, one pumping is followed by three injection processes, with a sampling frequency of 100 kHz. Due to its extremely high sampling frequency, p r - h s is closer to the real rail pressure state; hence, it can be used to fully represent the pressure oscillation. For this reason, significant terraces caused by the fuel injection can be observed in p r - h s . However, the widely used pressure sensor adopts a relatively lower sampling frequency at 100 Hz, which means that the sensor collects rail pressure data 10 ms apart during the engine operating conditions. This time period is far larger than the injection duration; as a result, p r - s may not be able to represent the real rail pressure state and may cause injection quantity cycle-to-cycle variation.
The OBS method aims to modify the previous filter-dependent treatment method so as to reduce the injected quantity cycle-to-cycle variation. Points b, c, and d in Figure 4 are, respectively, the injection start, pumping start, and pumping end times. It is seen in Figure 4 that all three pressures decrease after fuel injection starts (i.e., after point b); after three injection processes, the rail pressure arrives at the minimum value and the fuel pump starts pumping at point c. For this reason, rail pressures increase stably, and after peaking at around the pump ending point d, the pressures slowly decrease. To facilitate the quantitative comparison between p r - s and p ^ r - OBS , we calculated the mean square error σ of all three measured pressures, given by σ = i = 1 n ( x i x ¯ ) 2 / n where x ¯ = 1 n i = 1 n x i and x ¯ is approximately equal to the target rail pressure, p t . Note that p r - h s has significantly more samples because of the extremely high sampling frequency of the pressure sensor and will not be involved in the following comparison. It is seen that p ^ r - OBS shows the lowest σ while p r - s accounts for the largest σ, indicating that the OBS method can be used to substantially reduce the rail pressure oscillation. Overall, p r - s and p ^ r - OBS show the same trend as the high-sampling-frequency sensor-measured pressure; however, p ^ r - OBS shows significantly lower pressure oscillation than p r - s does, indicating that p ^ r - OBS is more stable and meets the requirement of the control system. More detailed explanations are as follows.
To explain the above observations, Figure 5 shows three measured rail pressures and the comparison of error ranges in each three-injection process before and after pumping. Here, the histogram is the p r - h s measured under high sampling frequency, which is adopted as a reference of rail pressure. The initial p r - h s is equal to 150 MPa at the beginning of the first injection and decreases to around 144 MPa when the second injection begins, finally degenerating to less than 138 MPa before the third injection because of the fuel mass decreasing in the rail pipe. Due to the over-attenuation of the rail pressure, the fuel pump starts to work to maintain the rail pressure, followed by another three injections in the next pumping–injection cycle. The rail pressure after pumping is slightly higher than the initial pressure (i.e., 150 MPa) because of the fuel metering valve closing delay in the fuel pump. As expected, p ^ r - OBS shows significantly narrow error bars, indicating that the OBS method results in less pressure oscillation. It is interesting to observe that p ^ r - OBS is always higher than p r - h s at pumping start times; however, p r - s is always higher than p p r - h s at pumping end times, indicating that the OBS method shows better response characteristics. This can be understood by recognizing that the OBS method which employs the mathematical model and gain matrix H (shown in Figure 2) shows a substantial compensation effect on the valve delay, hence earlier pressure rises.

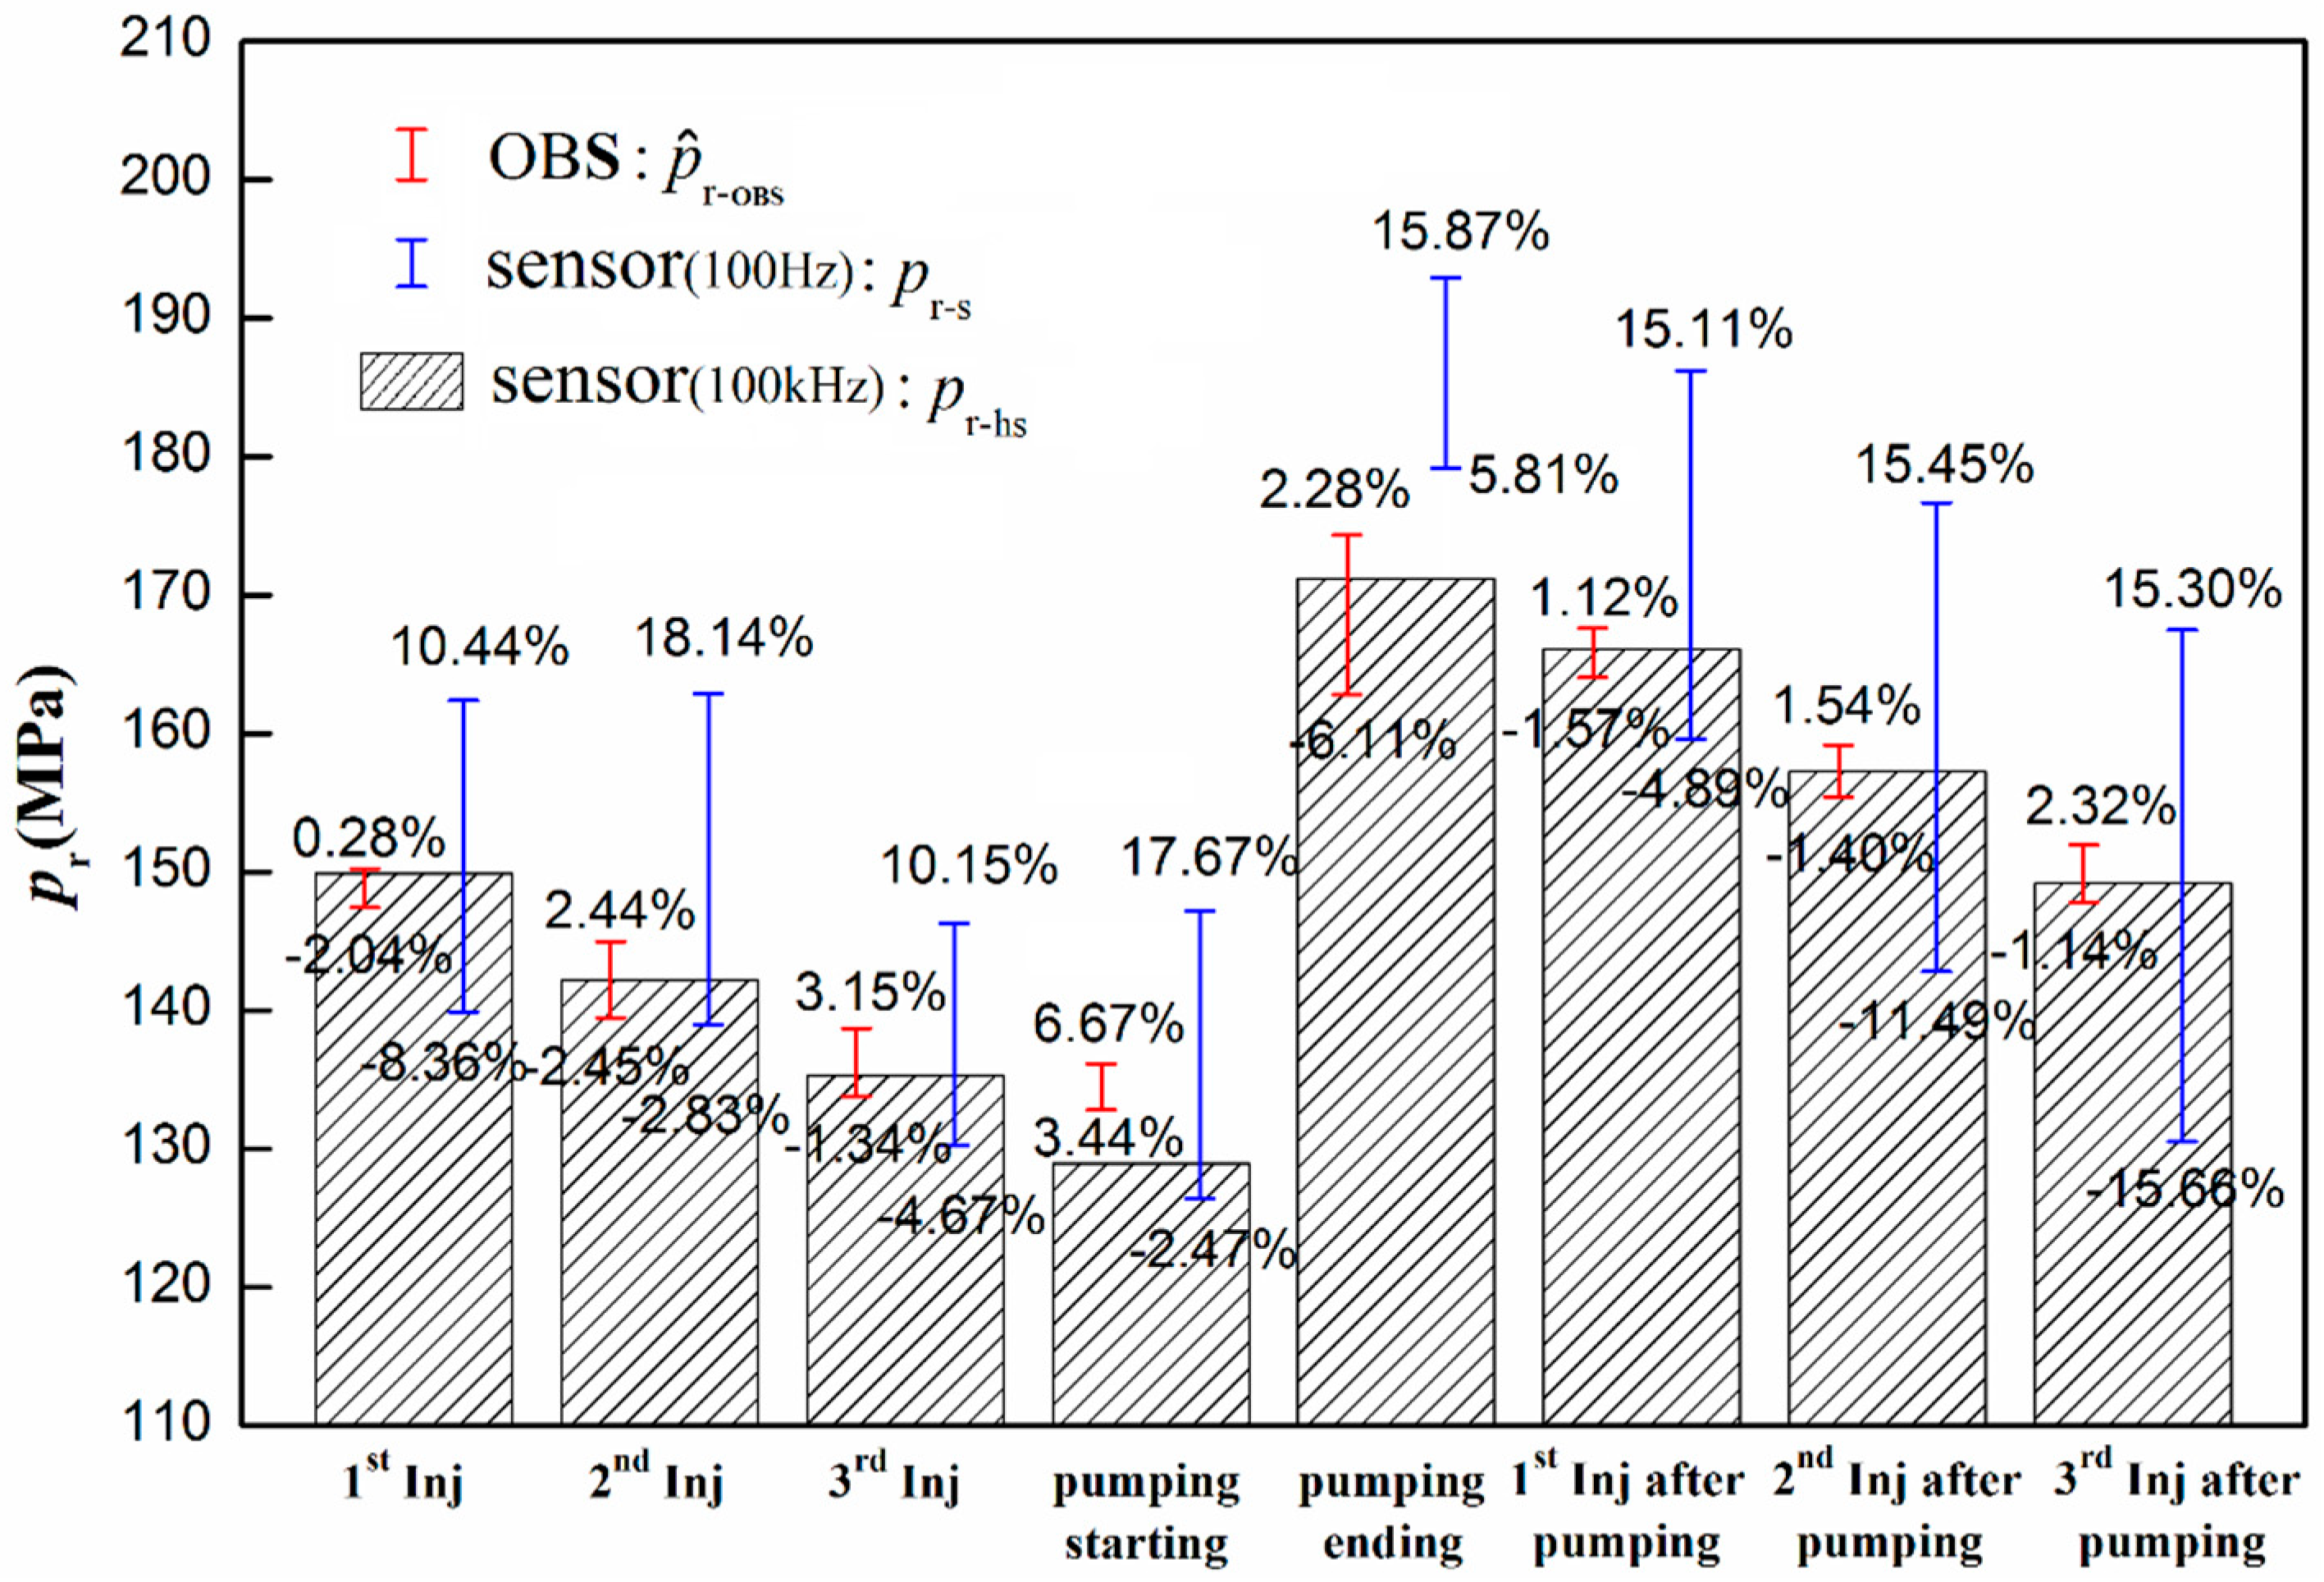
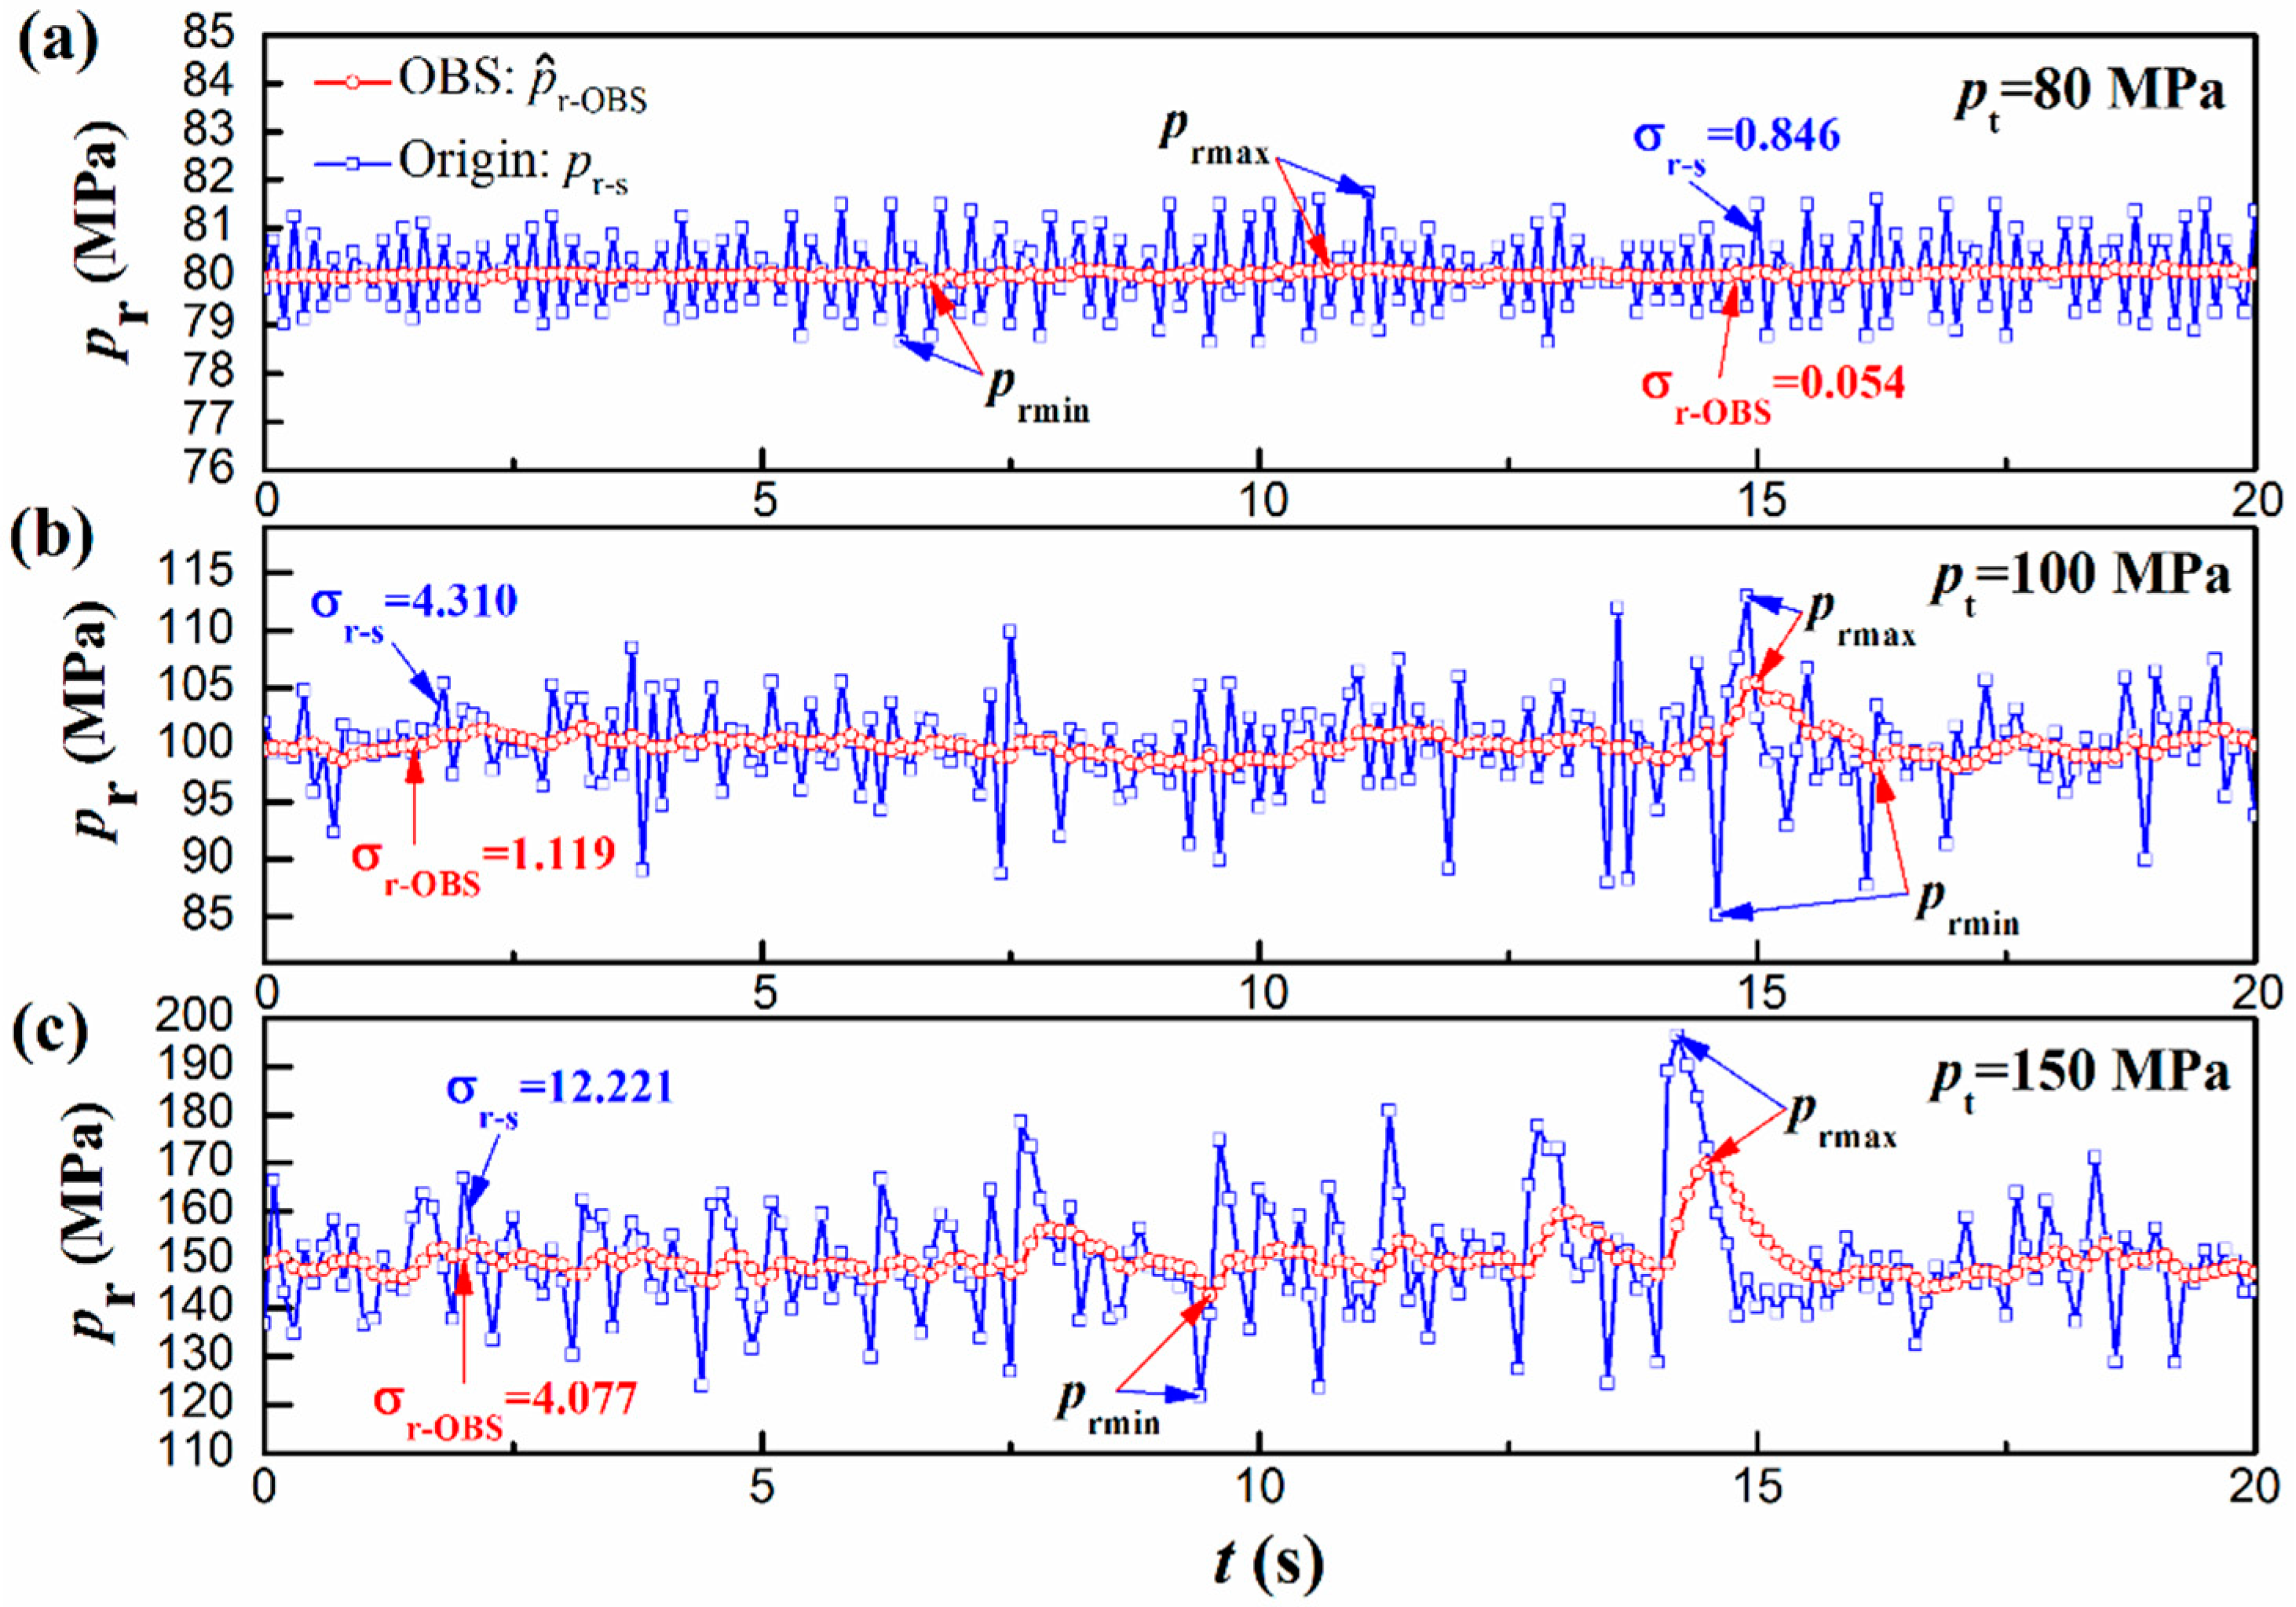
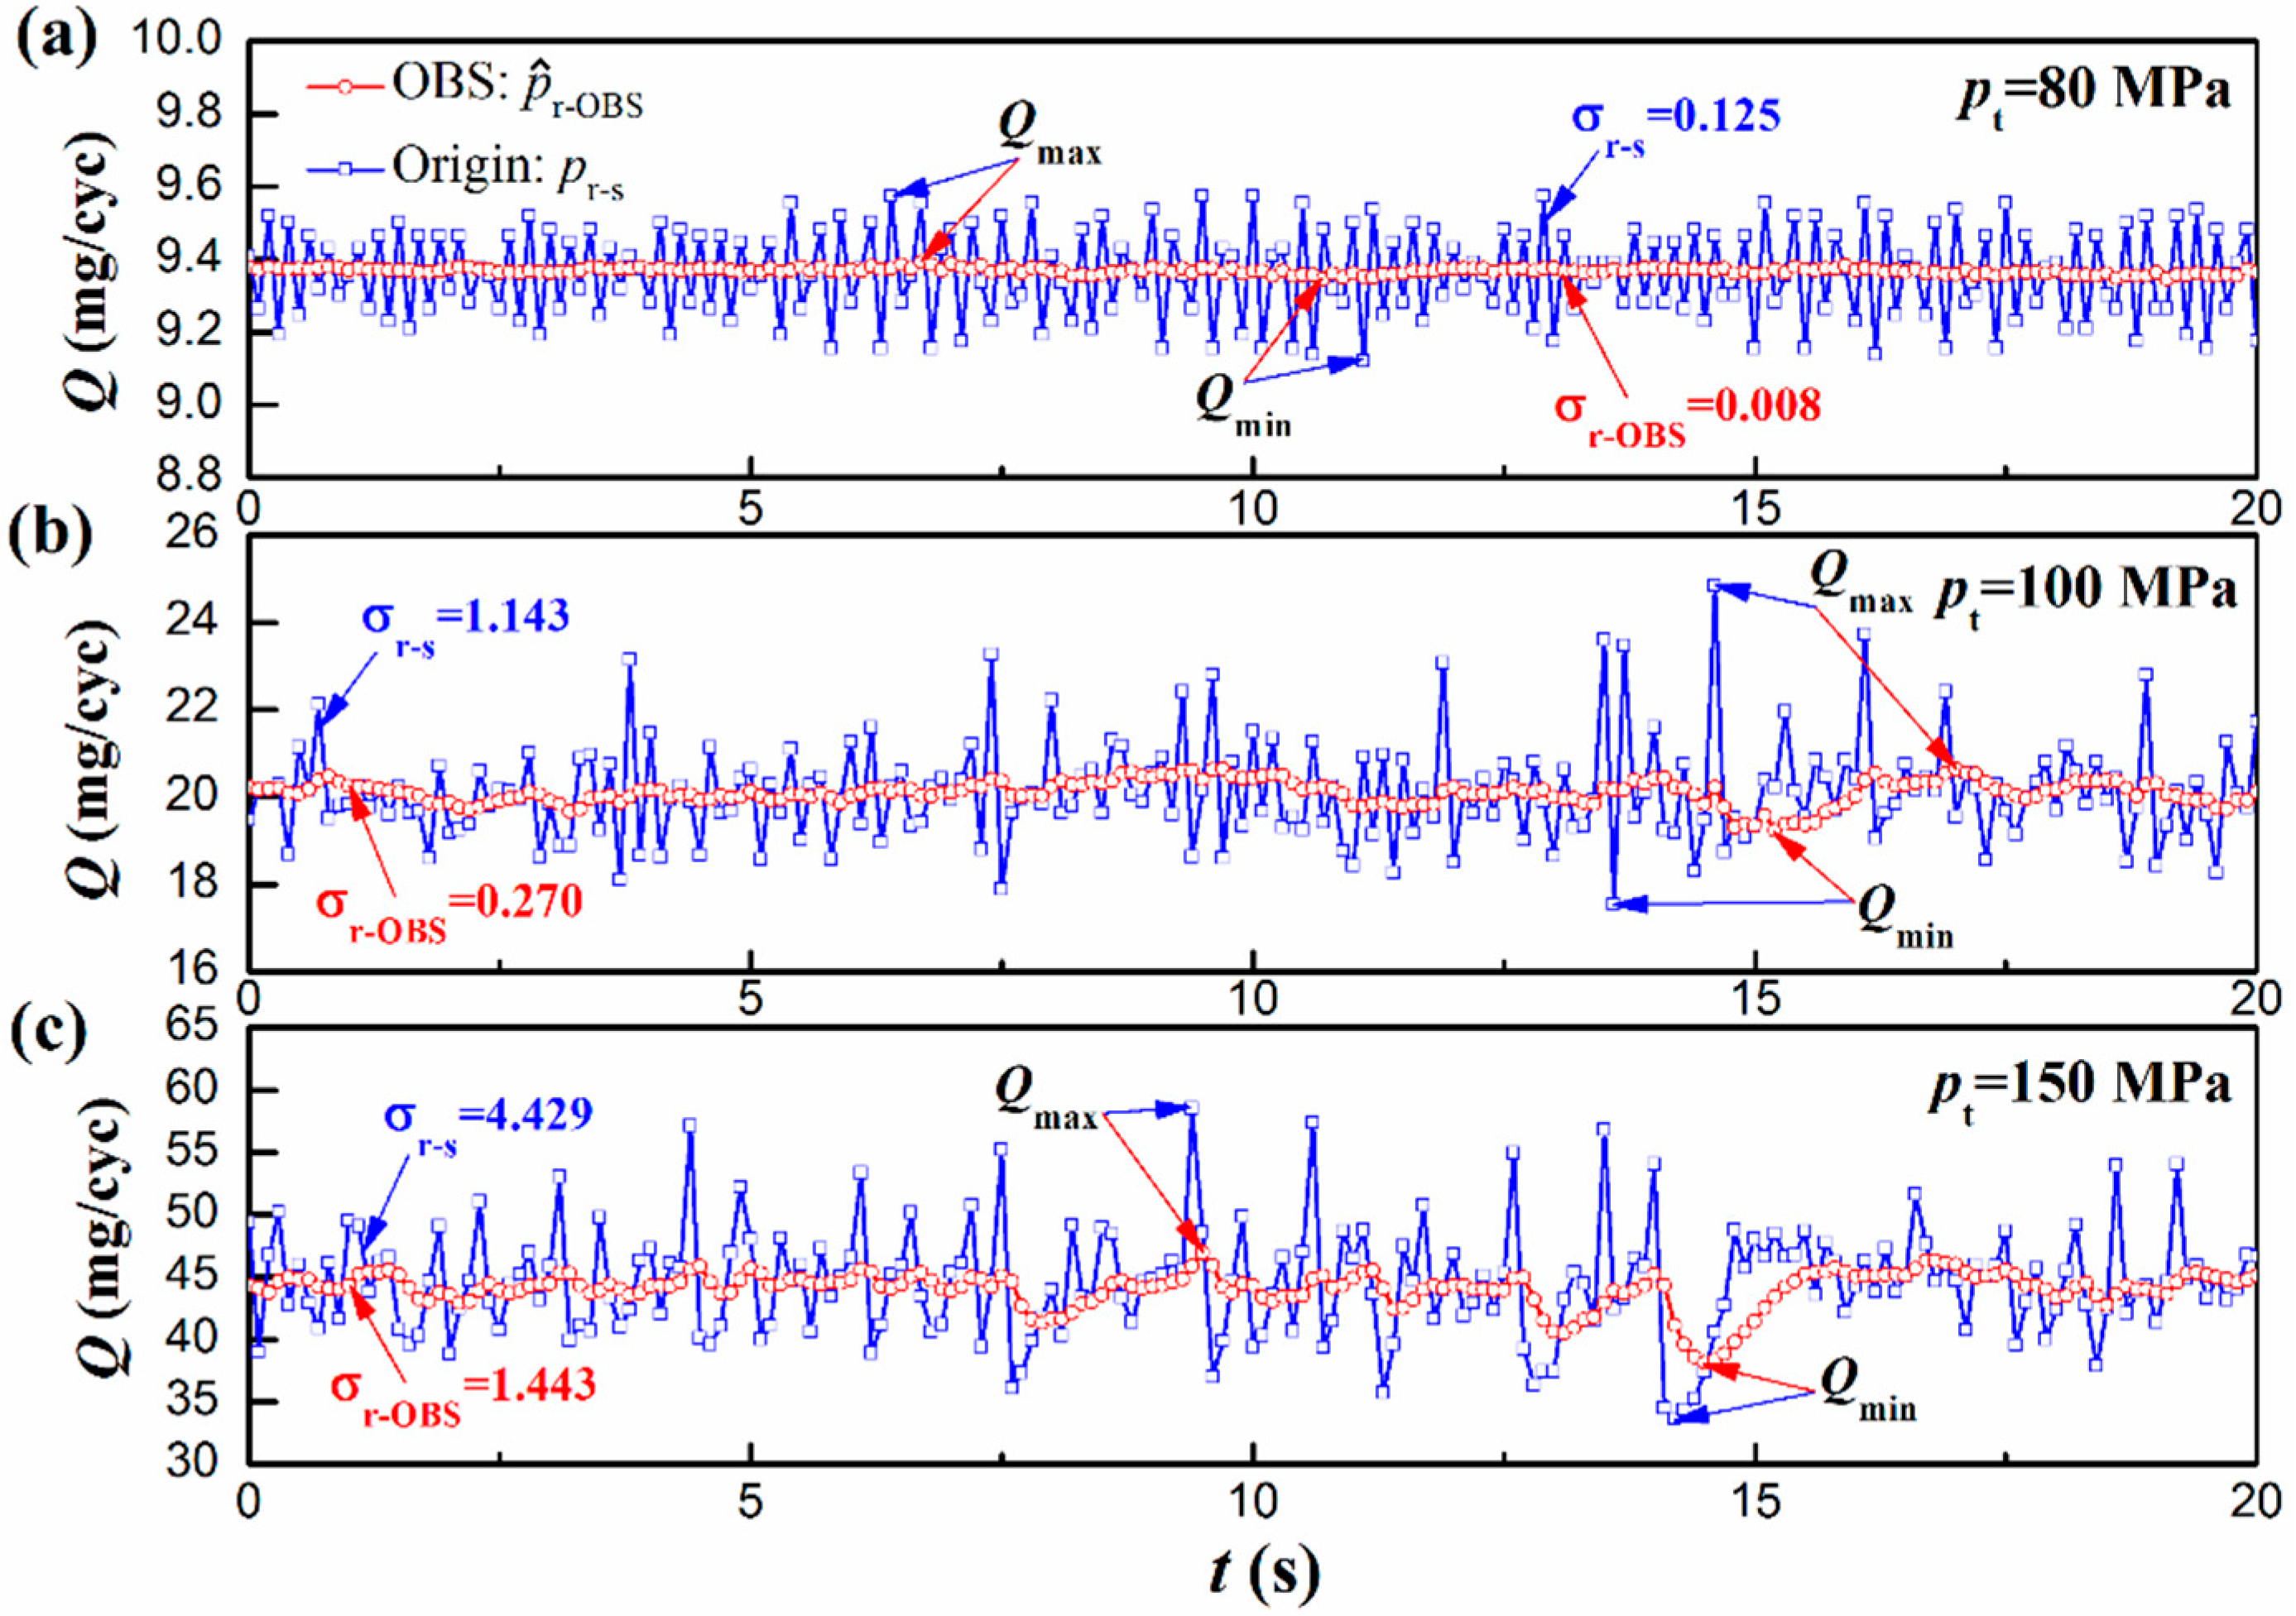
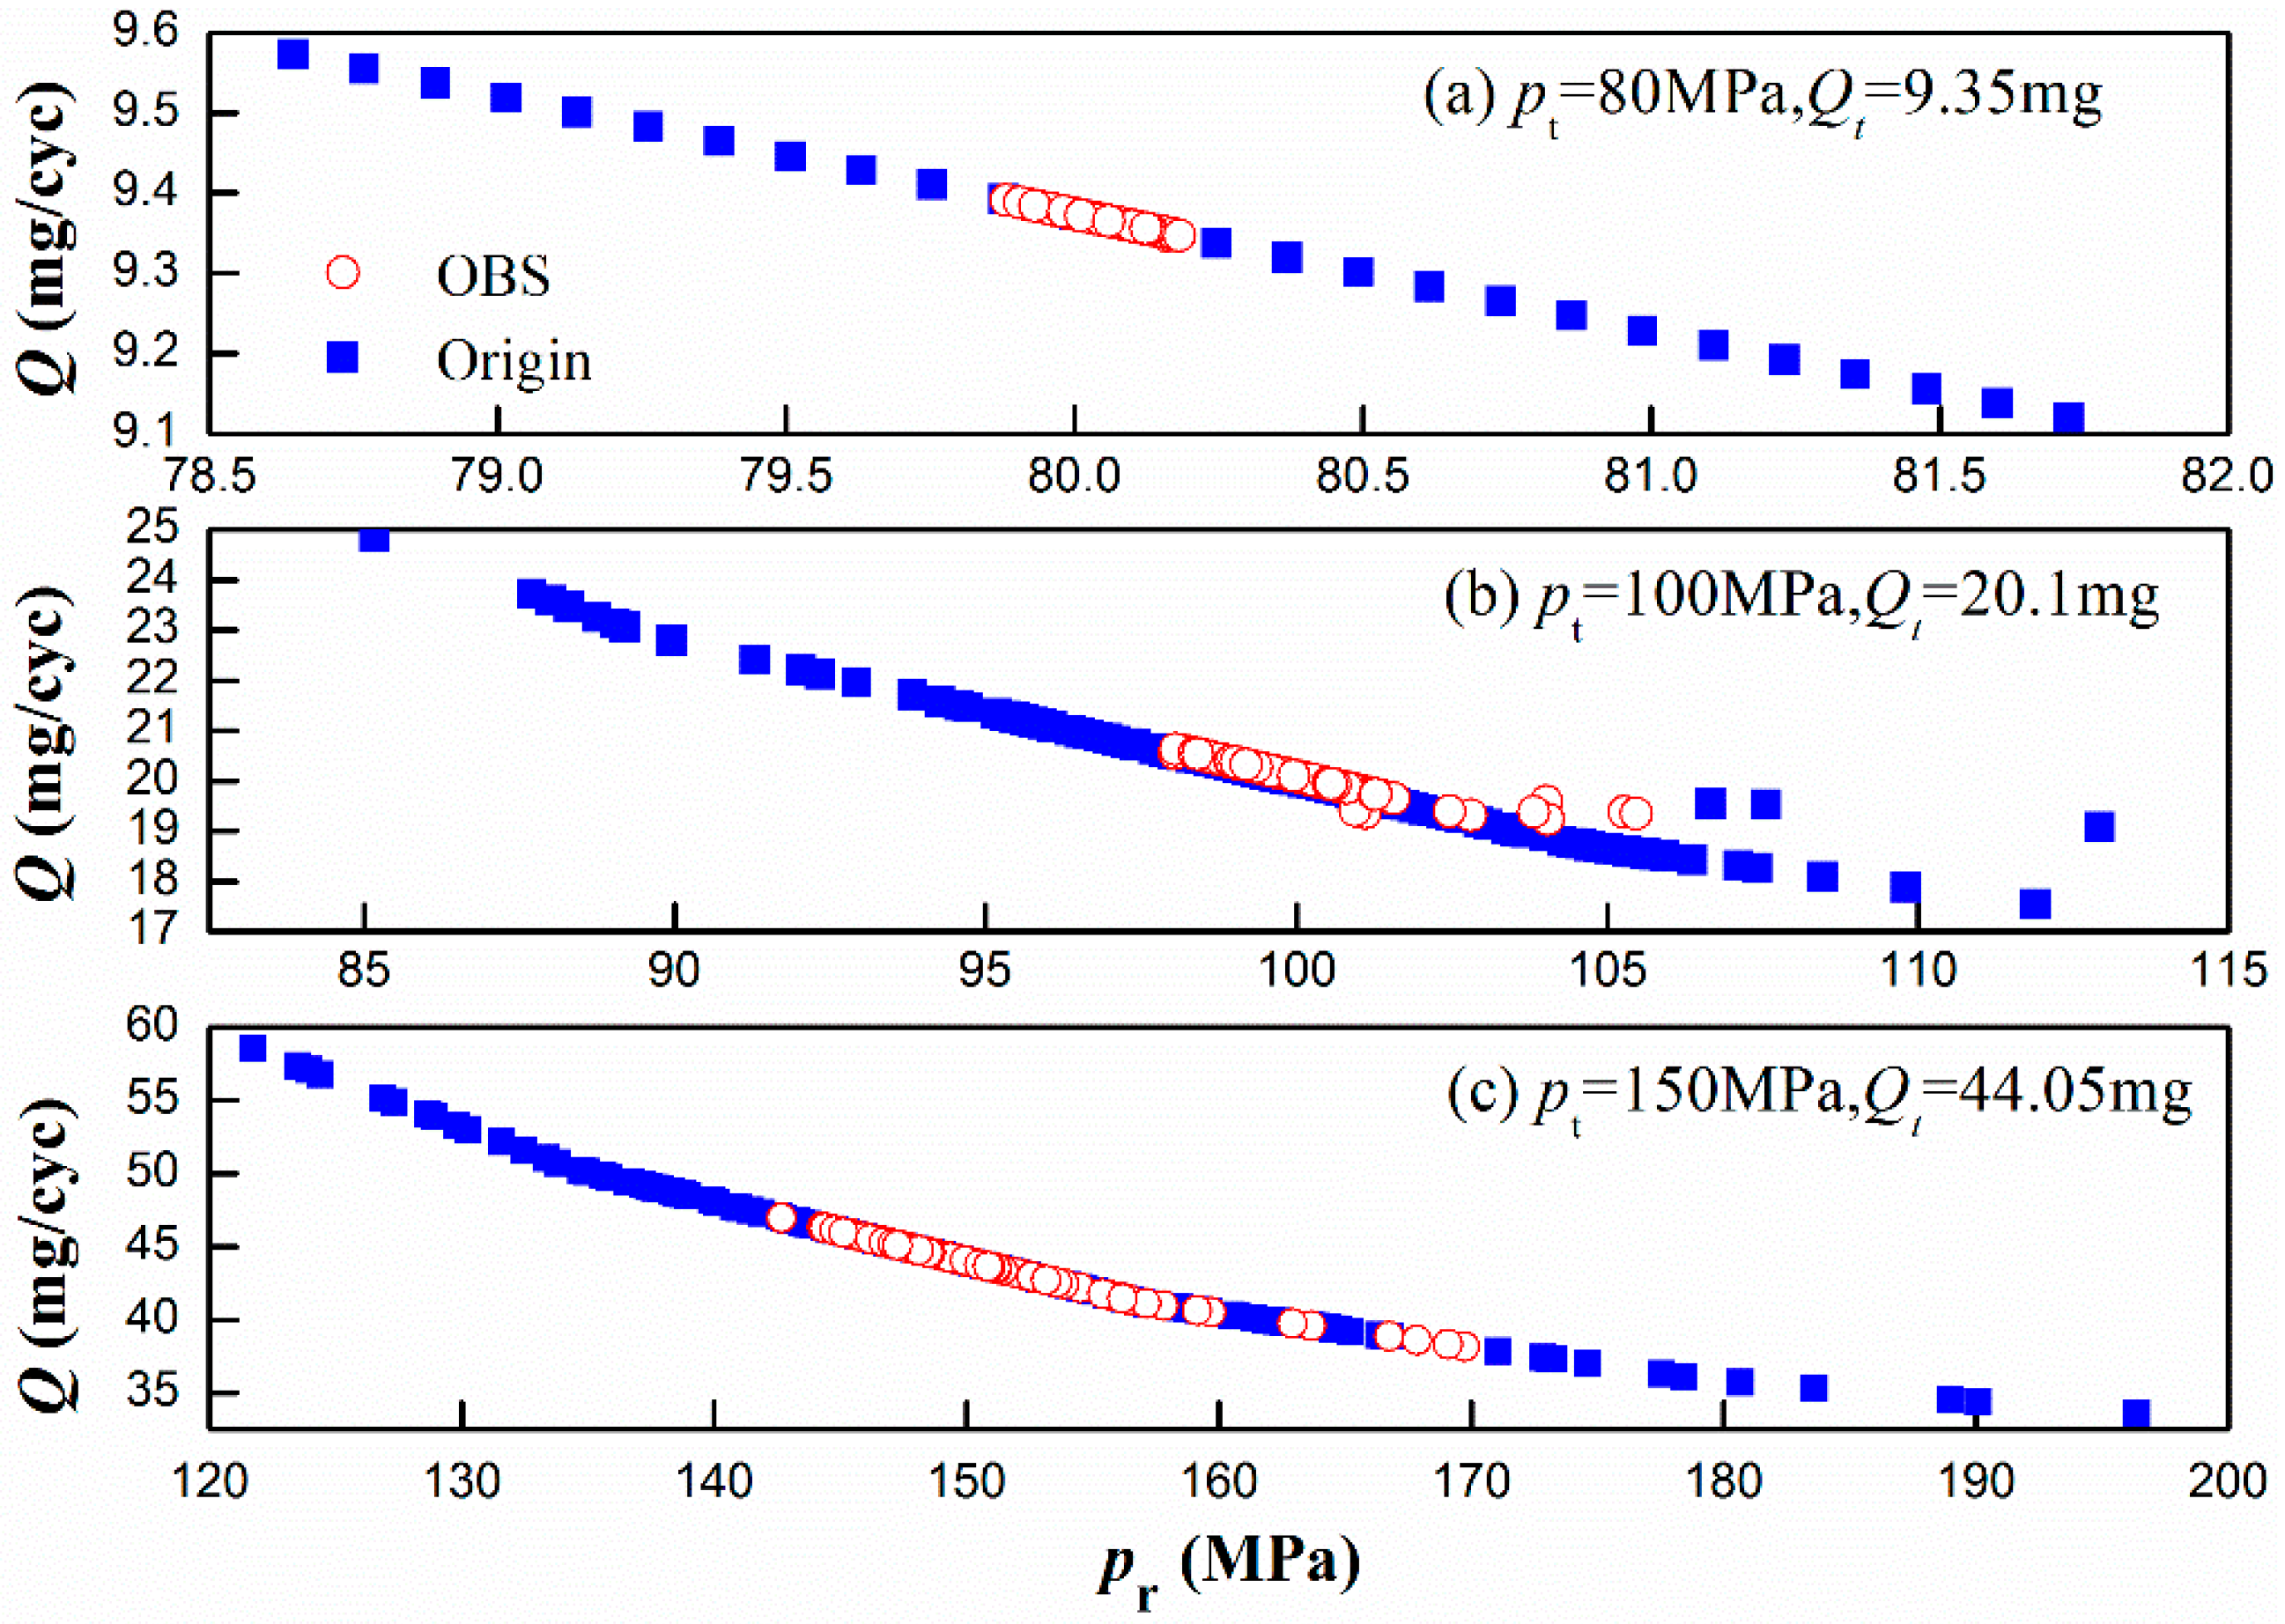
4.2. Cycle-to-Cycle Variation in Injection Pressure and Quantity

As discussed in the Introduction, rail pressure oscillation results in the cycle-to-cycle variation of injected fuel quantity in the OPCI engine. To further investigate the difference between conventional filtering and the present OBS method, we extended the comparison from pressure oscillation in one pumping–injection cycle to the rail pressure and injected quantity cycle-to-cycle variation. Figure 6 shows the comparison between p r - s and p ^ r - OBS under three different target pressures (i.e., 80 MPa, 100 MPa, and 150 MPa), corresponding to small, medium, and full engine operating load, respectively. Rail pressures of the first injection in 200 continuous pumping–injection cycles were collected and illustrated.
For the light engine operating load shown in Figure 6a, the target pressure p t = 80   MPa with Q t = 9.35   mg . It is clearly seen that p ^ r - OBS shows smaller oscillation amplitude than p r - s does. The mean square error σ was again employed to quantify the cycle-to-cycle variation of injected fuel quantity: as expected, p ^ r - OBS shows a significantly smaller σ due to the present OBS method substantially reducing the pressure oscillation in each pumping–injection cycle and increasing the response characteristics, indicating that the OBS method can be used to reduce the rail pressure cycle-to-cycle variation. Similar results also can be observed in the medium load shown in Figure 6b, where p t = 100   MPa , Q t = 20.1   mg ; and the heavy load with p t = 150   MPa , Q t = 44.05   mg , as shown in Figure 6c. It is also seen that the target pressure increases with the increase in the engine operating load, due to the increases of the target injection quantity, Q t . Because of this increase in injected fuel quantity, σ increases with engine load; hence, the σ of the rail pressure, p r , increases, which can be observed either for p ^ r - OBS or p r - s .
In terms of the injected fuel quantity shown in Figure 7, due to the substantial advancement in reducing the pressure cycle-to-cycle variation, p ^ r - OBS also shows significantly smaller cycle-to-cycle variation of the injected quantity, Q . Because the pressure oscillation amplitude increases with the rail pressure, p r , the σ of injection quantity, Q , also increases. In summary, the OBS method can be used to substantially reduce the cycle-to-cycle variation of fuel injection; hence, we can expect to improve the OPCI engine performance.
To further compare the two methods, Figure 8 shows the distribution of injected quantity Q against rail pressure p r . For the small engine operating load shown in Figure 8a, the OBS method produces significantly smaller variation ranges of rail pressure and fuel quantity, again indicating that the OBS method substantially reduces the fuel injection cycle-to-cycle variation. Similar results can also be observed in the medium load and full load shown in Figure 8b,c. It is noted that, although a small part of the state points controlled by OBS deviate from the main area, as shown in Figure 8b, it still can be quickly adjusted back by the control system.

4.3. Rail Pressure in a Pumping–Injection Cycle

To show the influence of rail pressure oscillation on the injection rate of the OPCI engine, Figure 9 illustrates the measured injection rate for the maximum injection quantity cycle, Q m a x , and minimum injection quantity cycle, Q m i n , of the full engine load in the collected 200 cycles for three different operating conditions corresponding to the injection quantity in Figure 7. The real rail pressure and injected quantity are also indicated in each graph. Specifically, Figure 9a–c show the case of OBS methods while Figure 9d–f show the case of the conventional filtering method.
For the small engine operating load shown in Figure 9a,d, the target pressure is p t = 80   MPa with target injected quantity Q t = 9.35   mg . All the curves increase rapidly after the injection starts, and after peaking at around 8 mg/ms, the injection rates soon decrease by the end of the injection. No significant difference can be observed in the case of the OBS method; however, a moderate discrepancy can be seen between the injection cycles with Q m a x and Q m i n in the case of the conventional filtering method in the later injection stage, forming a variation area. It is noted that the injection rates of other cycles in the later stage are distributed in this variation area. Thus, larger variation area indicates larger cycle-to-cycle fuel injection. For the medium engine load shown in Figure 9b,e, the target pressure is p t = 100   MPa with target injected quantity Q t = 20.1   mg . It is interesting to observe that the OBS method produces a significantly smaller variation area than the filtering method does, which again proves that the present OBS method substantially reduces the cycle-to-cycle variation of fuel injection.
Remarkable difference between two extreme cycles can be observed in both treatment methods under the engine full load condition, as shown in Figure 9c,f. In this case, the target pressure is p t = 150   MPa with target injected quantity Q t = 44.05   mg . The injection rate curves are close to the shape of a trapezoid, which is different from the small engine load. In the earlier stage, the injection rate increases rapidly after the fuel injection starts and then reaches a steady value of around 20 mg/ms for a while. For the OBS method shown in Figure 9c, no significant difference between the two curves can be observed in the earlier stage; however, an obvious discrepancy exists in the later stage, indicating the injected fuel quantity cycle-to-cycle variation resulting from the injection rate fluctuation among various cycles in the later stage. Similar results also can be seen in the injection rate of the filtering method, as shown in Figure 9f. However, the filtering method produces a significantly larger variation area than the OBS method does. These can also be used to explain the more obvious cycle-to-cycle variation of the injected fuel quantity in Figure 8 and Figure 9.
Overall, both OBS and filtering methods produce increasingly larger variation area with increasing engine load due to the increasing fuel mass and pressure change in the rail pipe, resulting in larger fuel injection cycle-to-cycle variation. However, the OBS method shows a significant improvement in reducing fuel injection cycle-to-cycle variation; hence, smaller variation areas result under different engine working conditions.

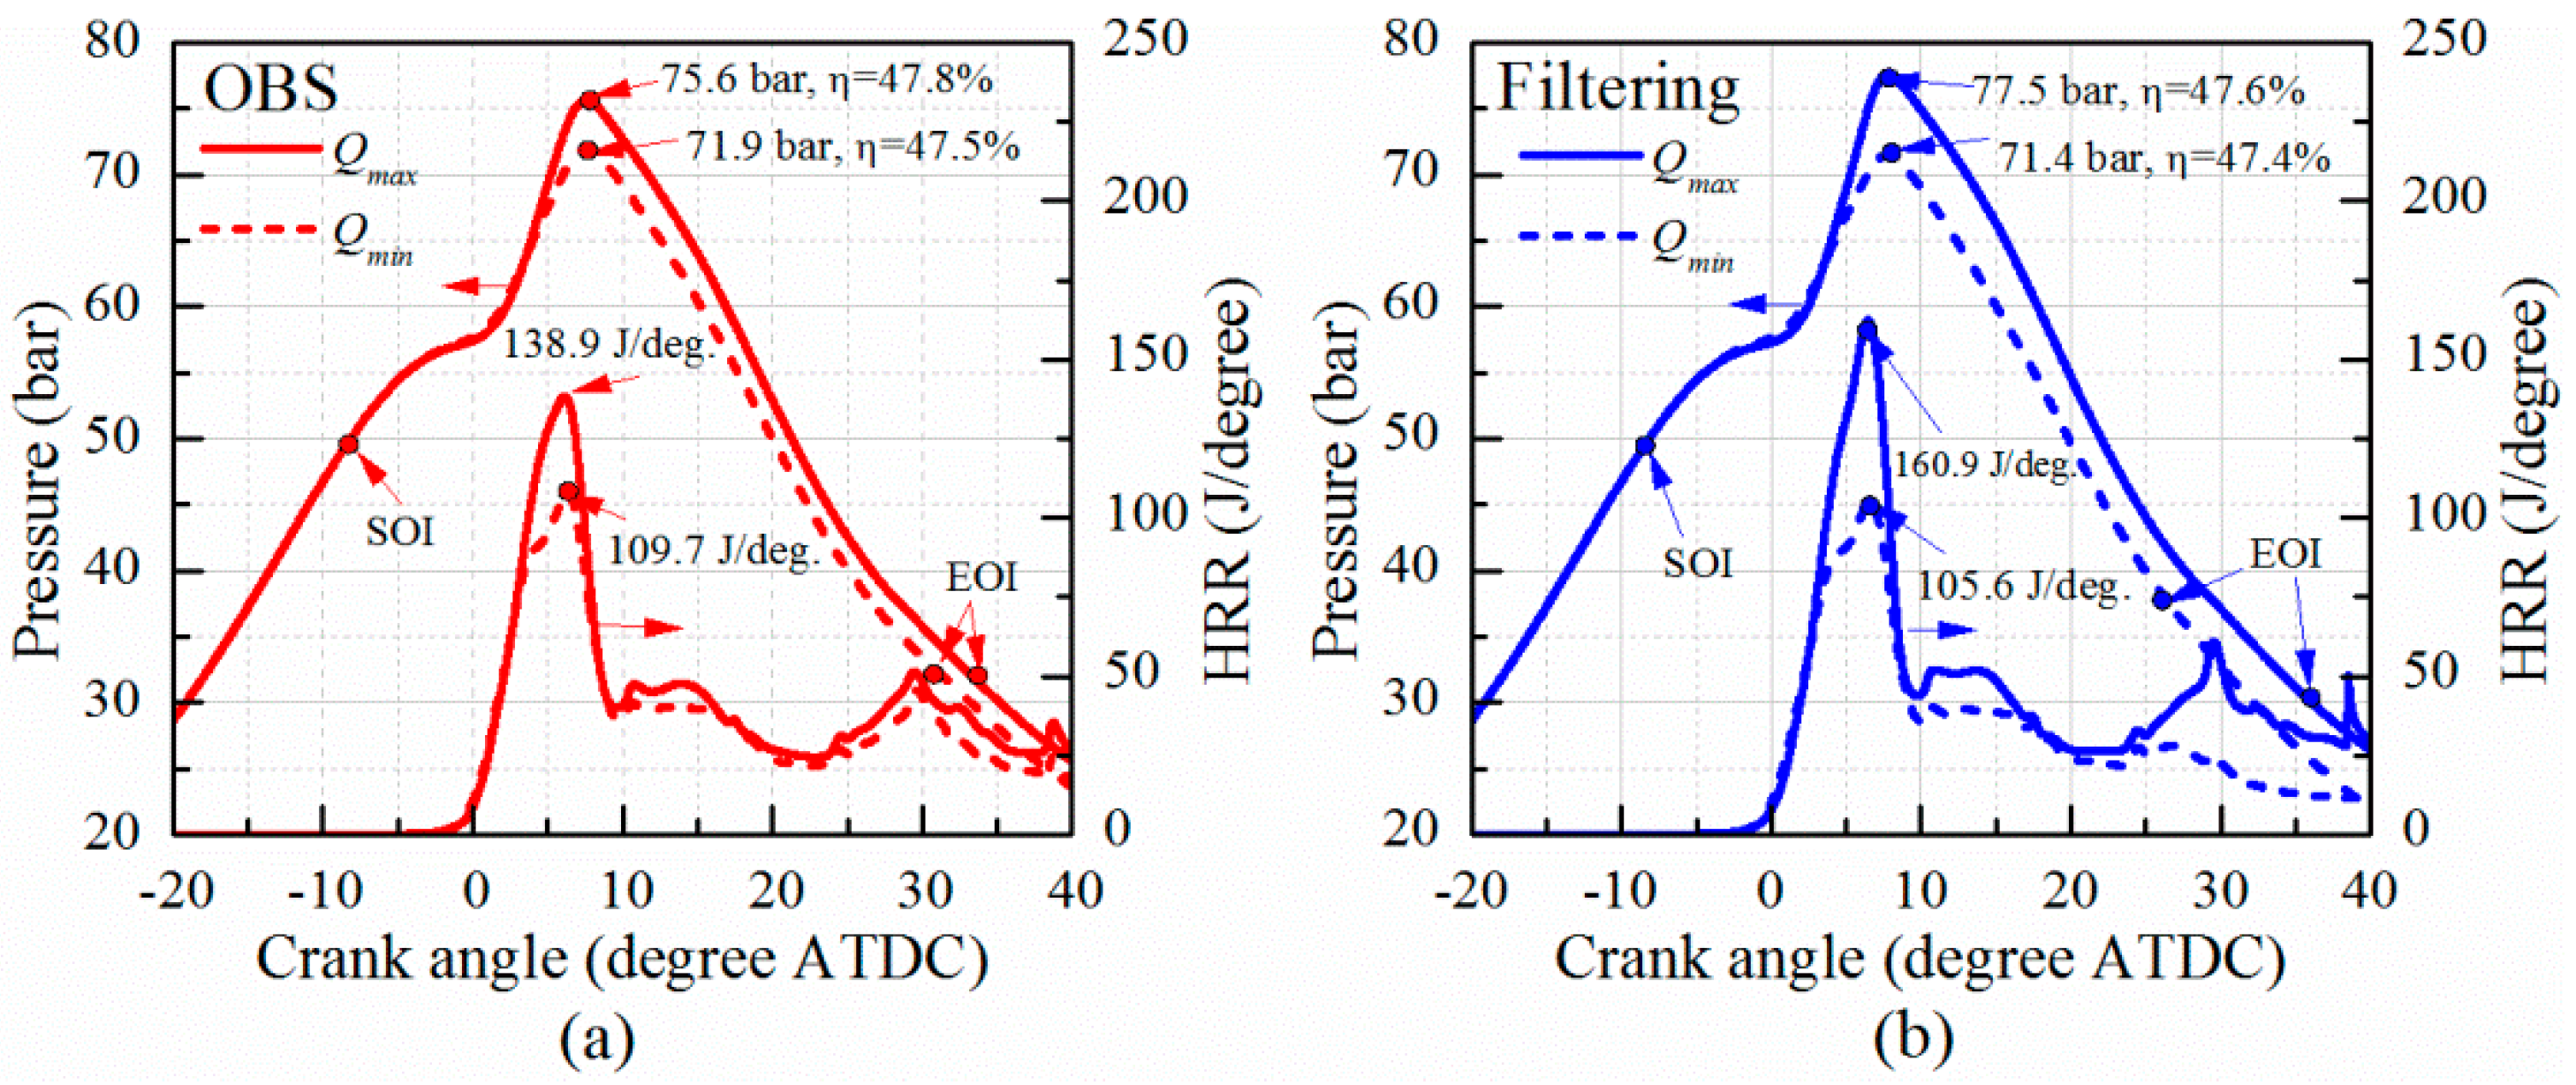
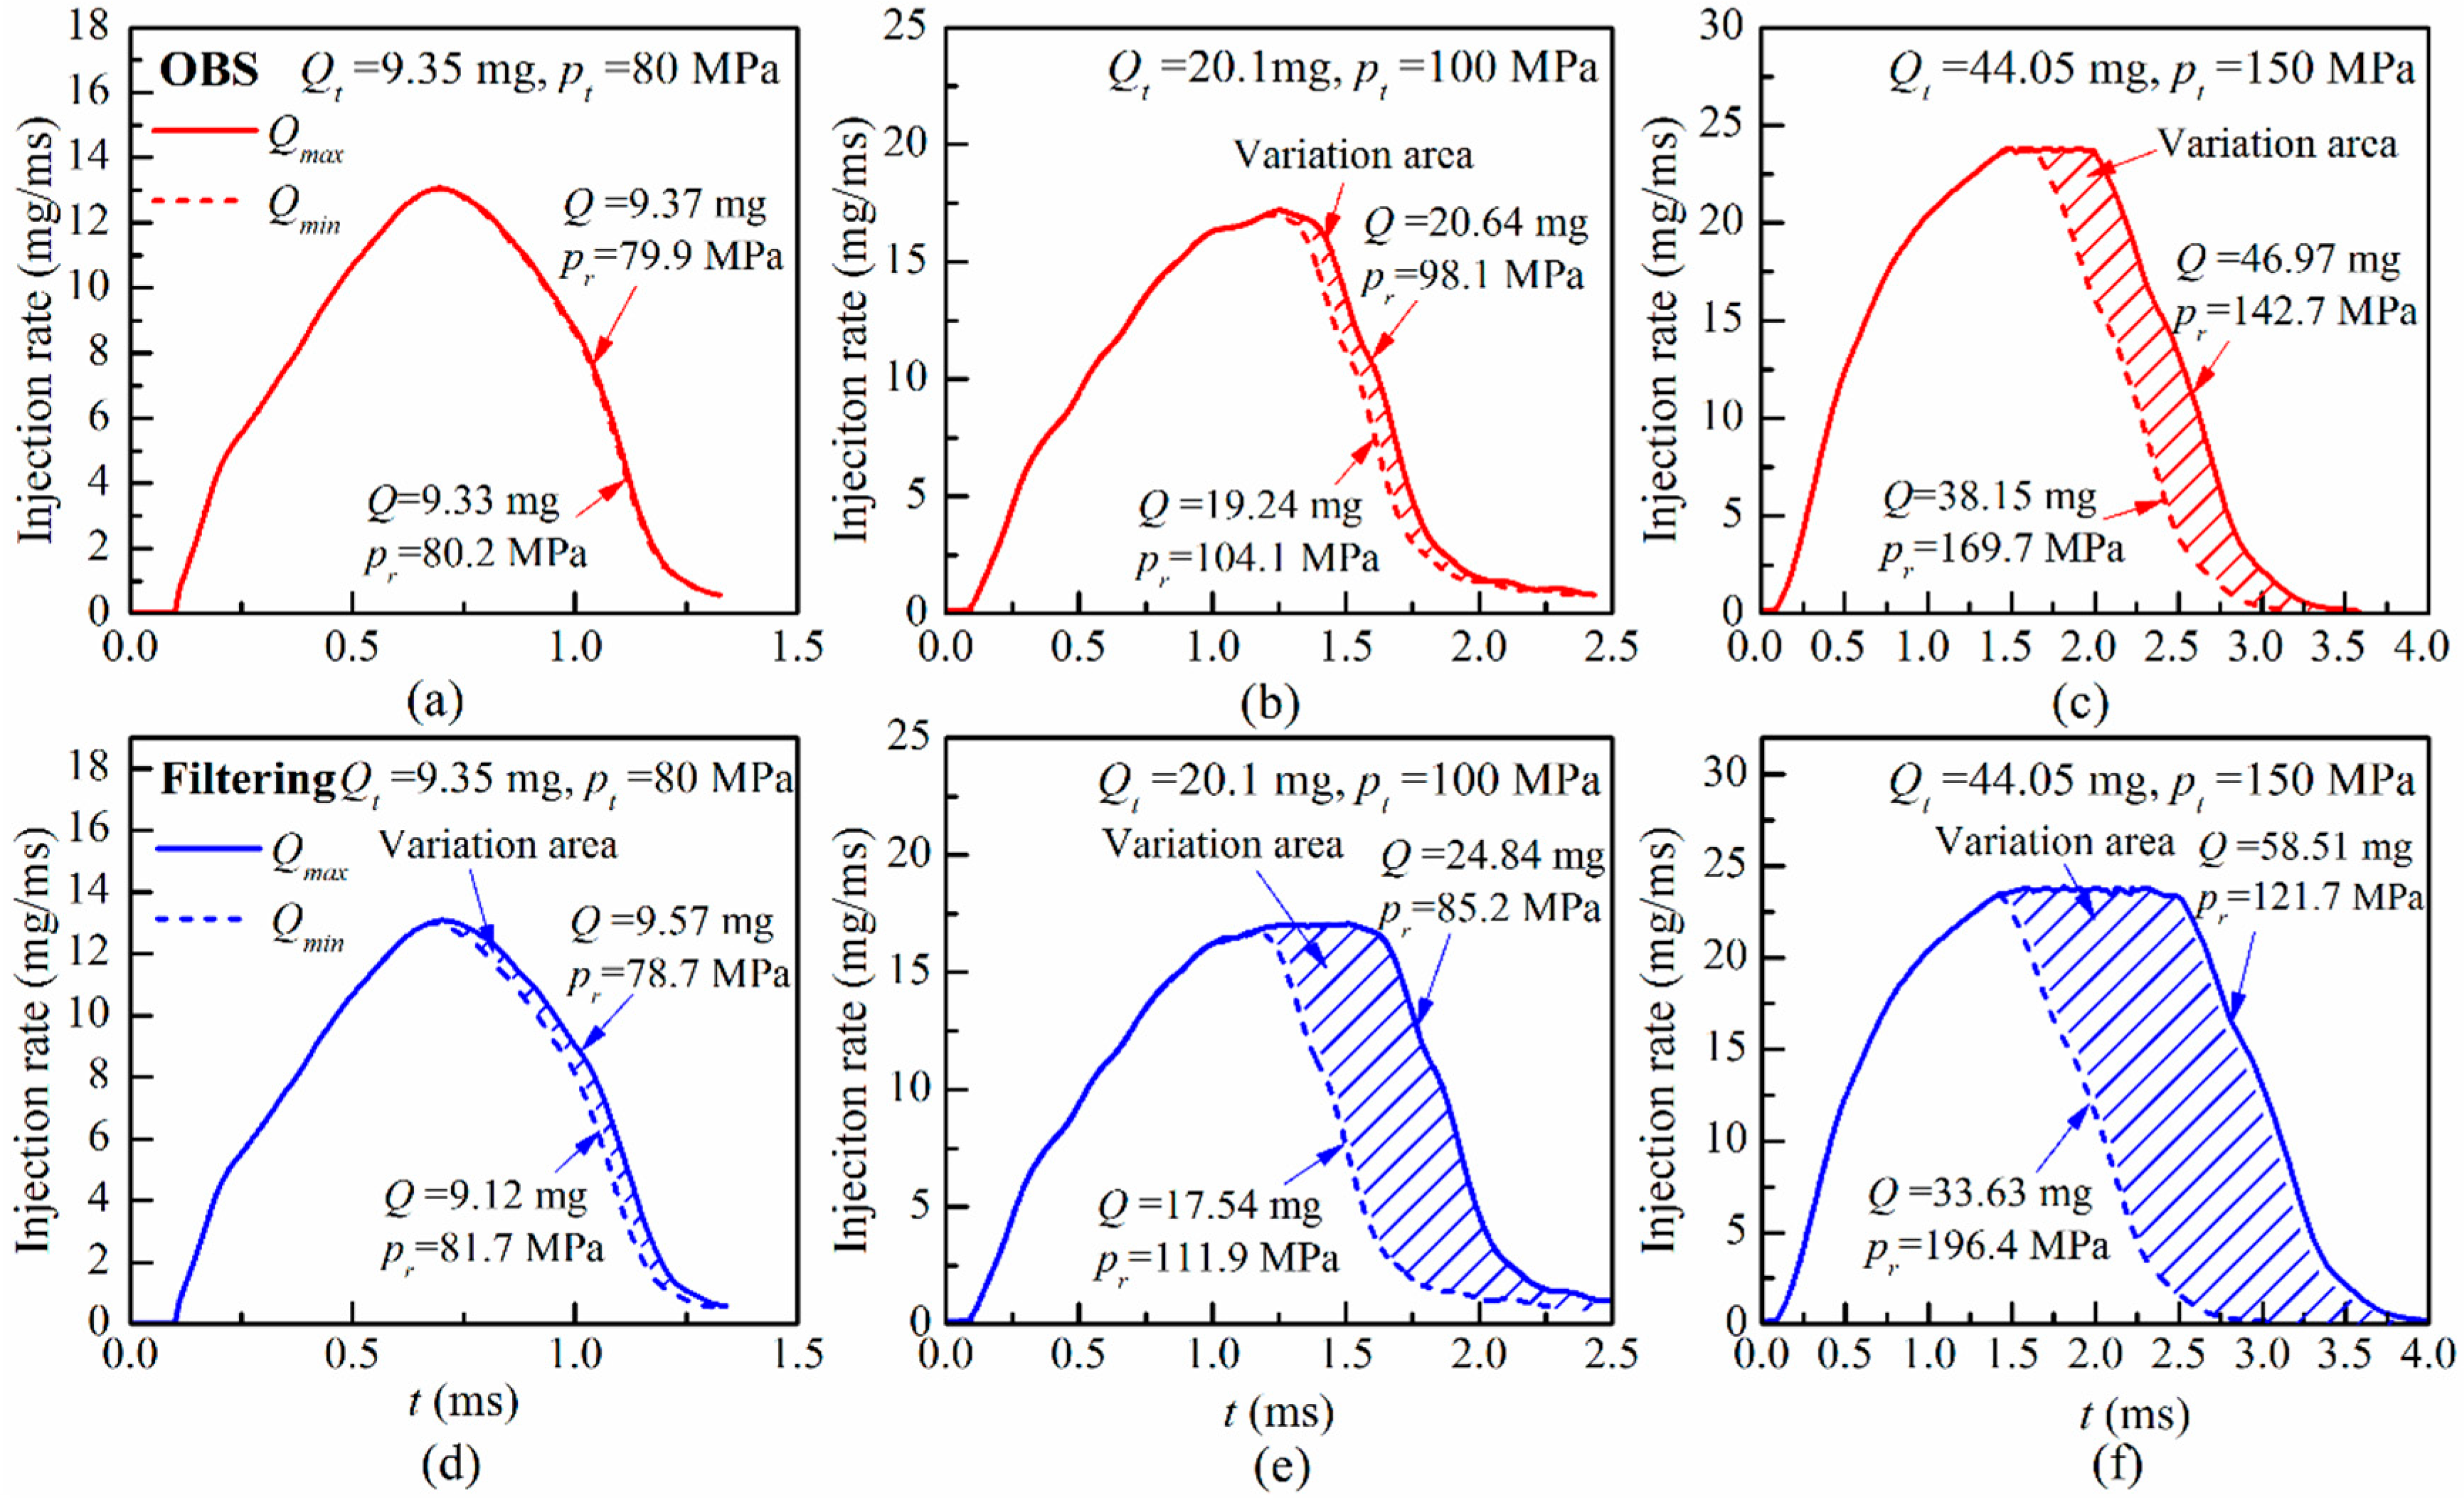
4.4. Effect of Pressure Oscillation on Spray Combustion

To supplement the above comparison, we extended the comparison from fuel injection to spray combustion in the OPCI engine by comparing the spray combustion characteristics in two extreme cycles with maximum and minimum fuel injection quantity (i.e., Q m a x and Q m i n ) corresponding to the comparison in Figure 9. Due to the nonuniform sampling frequency of various sensors, such as the rail pressure sensor and engine cylinder pressure sensor, together with the unstable operation of the OPCI engine prototype which is caused by many uncertain complex factors, determining the effect of pressure oscillation on the OPCI engine cycle-to-cycle variation poses an immense challenge for the engine operating test, which will not be considered in the present study but certainly merits future investigation. Instead, in the present study, the widely used KIVA-3V computer program (2 release, Los Alamos National Laboratory, Los Alamos, NM, USA) was employed to facilitate the quantitative comparison between OBS and the conventional filtering method by simulating an engine cycle with the maximum and minimum Q cases over 200 cycles under p t = 150   MPa .
The detailed description and validation of the present numerical methodology has been given in one of the authors’ previous publication [28]. Particularly, the predicted cylinder pressure and heat release rate at the engine speeds of 1500 rpm and 2000 rpm under 50% load have been validated with experimental results in the previous publication [28], and the numerical results show good agreement with test data. Here, we extended the working condition of 2000 rpm and full load in this subsection so as to explore the spray and combustion characteristics under the more practical situations. The intake pressure is 1.6 bar, temperature is 325 K, and the measured fuel injection rates shown in Figure 9c,f were adopted in this simulation. Liquid fuel was injected into the engine combustion chamber in the form of parcels with nozzle diameter. Following the previous study [28], we assumed the initial droplet number density to be 100 parcels/mg.
To quantify the evaporation and mixing processes, we defined a time-dependent ratio A d = N p ( t ) SMD 2 ( t ) / N p ( 0 ) SMD 2 ( 0 ) , where N p ( 0 ) and SMD ( 0 ) are the initial parcel number and Sauter mean diameter (SMD), as an index of total droplet surface area. Figure 10 shows the evaluation of A d (on the left Y axis) and premixed fuel mass (on the right Y axis) of different treatment methods. The prediction of A d for Q m a x is higher than that of Q m i n , which can be seen in both of the two methods. The larger A d indicates a higher total fuel droplet surface area, resulting in high evaporation rate and premixed fuel mass according to the well-known d 2 law [30]. As expected, due to the smaller cycle-to-cycle variation in the fuel injection rate, the OBS method predicts a significantly smaller discrepancy between the two extreme cycles in premixed fuel mass than the conventional filtering method does. The maximum premixed fuel mass of Q m a x for the OBS method is 12.9 mg—22.9% higher than that of Q m i n . In terms of the conventional filtering method, the maximum premixed fuel mass of Q m a x is 15.2 mg—50% higher than that of Q m i n .
To further investigate the influence of pressure oscillation on spray combustion in the OPCI, we extended the comparison from spray characteristics to the cylinder pressure (on the left Y axis) and heat release rate (on the right Y axis) in Figure 11. SOI denotes the start of injection; EOI the end of injection. The time period between SOI and EOI is the injection period. Thermal efficiency η for each case is indicated in the figure. The predicted cylinder pressures of Q m a x are higher than the predictions of Q m i n due to the following reasons. First, Q m a x produces a larger premixed fuel mass result and higher heat release rate in the earlier stage of the combustion. Second, as discussed in the previous text, Q m a x has a larger fuel quantity to be burnt in the combustion chamber which produces more heat, resulting in a higher gas pressure. Final, the injection period for Q m a x is longer to inject more fuel into the combustion chamber, resulting in the larger heat release rate in the later stage of the combustion, leading to the higher pressure. In particular, a significantly smaller discrepancy can again be observed in the predicted cylinder pressures of the OBS method. It is also seen that no significant difference among different cycles in thermal efficiency can be seen in either the OBS method or the filtering method, probably due to the fact that engine thermal efficiency is dominated by other factors such as compression ratio, injection time, etc., but not by fuel injection quantity.

5. Concluding Remarks

An experimental and computational investigation into the effect of a rail pressure error state observer method (OBS) in reducing injection cycle-to-cycle variation in an opposed-piston compression ignition engine (OPCI) was conducted in the present study. The primary motivation of the study is to control and reduce the cycle-to-cycle variation of fuel injection which, in turn, substantially influences the engine performance. The conventional filtering treatment method was modified by utilizing an OBS method to revise the widely used sensor-measured rail pressure before feedback. The OBS method accounts for the influence of both flow mass change and the system dynamics which, however, have been barely considered during the process of handing rail pressure data. By using the OBS method, due to the significantly lower misjudgment probability and effective correction of the sensor-measured pressure, significant improvements in reducing rail pressure oscillation in one pumping–injection cycle can be observed (error range reduced by 24.64%). Moreover, the OBS method which employs the mathematic model and gain matrix H shows a substantial correction effect on the valve delay, improving control system responsiveness. Because of its advances in controlling rail pressure, the OBS method shows obviously lower cycle-to-cycle variation characteristics in injected fuel quantity and injection rate, especially for the heavy engine operating load, where the range of injection quantity is increased by 36.5%. To further investigate the effect of the OBS method on spray combustion in the OPCI engine, we extended the experimental investigation of CRS to spray combustion characteristics of two extreme cycles with maximum and minimum fuel quantity by using a numerical simulation which has been fully validated in a previous publication by one of the authors. The results again prove that the OBS method can be used to substantially reduce the cycle-to-cycle variation in the OPCI engine. However, no significant difference among different cycles in thermal efficiency can be observed in both OBS method and Filtering method.

Author Contributions

Methodology, Validation, Writing—Original Draft Preparation, Y.L.; Formal Analysis, Z.Z. (Zhe Zuo); Software, Z.Z. (Zhenyu Zhang); Project Administration, C.Z.; Writing—Review & Editing, F.Z.

Funding

This research was funded by [National Natural Science Foundation of China] grant number [51406013] and [Beijing Natural Science Foundation] grant number [3182033].

Acknowledgments

The authors gratefully acknowledge the financial support by National Natural Science Foundation of China (grant no. 51406013) and Beijing Natural Science Foundation (grant no. 3182033).

Conflicts of Interest

The authors declare no conflict of interest.

References

  1. Herfatmanesh, M.R.; Peng, Z.; Ihracska, A.; Lin, Y.; Lu, L.; Zhang, C. Characteristics of Pressure Wave in Common Rail Fuel Injection System of High-Speed Direct Injection Diesel Engines. Adv. Mech. Eng. 2016, 8, 1–8. [Google Scholar] [CrossRef]
  2. Du, W.; Lou, J.; Yan, Y.; Bao, W.; Liu, F. Effects of Injection Pressure on Diesel Sprays in Constant Injection Mass Condition. Appl. Therm. Eng. 2017, 121, 234–241. [Google Scholar] [CrossRef]
  3. Pielecha, I. The Influence of Petrol Injection Parameters on the Structure of Geometry of Fuel Spray Injected from Outward-Opening Injectors. Fuel 2018, 222, 64–73. [Google Scholar] [CrossRef]
  4. Ferrari, A.; Paolicelli, F. An Indirect Method for the Real-Time Evaluation of the Fuel Mass Injected in Small Injections in Common Rail Diesel Engines. Fuel 2016, 191, 322–329. [Google Scholar] [CrossRef]
  5. Ren, W.J.; Shi, X.X.; Jiao, S.J.; Zhu, C.J.; Zhang, Q. Research on Rail Pressure Control of Diesel Engine Based on Genetic Algorithm Nonlinear PID. In Proceedings of the IEEE International Conference on Computer Science and Automation Engineering, Shanghai, China, 10–12 June 2011; pp. 67–71. [Google Scholar]
  6. Ji, Z.; Xie, X.; Sun, Z.; Chen, P. Rail Pressure Control of Common Rail Diesel Engine Based on RBF Neural Network Adaptive PID Controller. In Proceedings of the IEEE International Conference on Electronic and Mechanical Engineering and Information Technology, Harbin, China, 12–14 August 2011; pp. 1122–1125. [Google Scholar]
  7. Song, G.M.; Yang, F.Y.; Ouyang, M.G.; Hu, L.F.; Hang, Y. Equilibrium Algorithm Research for Each Individual Cylinders of Common Rail Based on Self-Adaptive Fuzzy Control. Trans. Csice 2005, 23, 451–456. [Google Scholar] [CrossRef]
  8. Montanaro, U.; Gaeta, A.D.; Giglio, V. An MRAC Approach for Tracking and Ripple Attenuation of the Common Rail Pressure for GDI Engines. In Proceedings of the 18th IFAC World Congress (IFAC 2011), Milan, Italy, 28 August–2 September 2011; pp. 4173–4180. [Google Scholar]
  9. Hong, S.; Shin, J.; Sohn, J.; Park, I.; Sunwoo, M. Coordinated Control Strategy for the Common-Rail Pressure Using a Metering Unit and a Pressure Control Valve in Diesel Engines. Proc. Inst. Mech. Eng. Part D J. Automob. Eng. 2015, 229, 898–911. [Google Scholar] [CrossRef]
  10. Payri, F.; Luján, J.M.; Guardiola, C.; Rizzoni, G. Injection Diagnosis through Common-Rail Pressure Measurement. Proc. Inst. Mech. Eng. Part D J. Automob. Eng. 2006, 220, 347–357. [Google Scholar] [CrossRef]
  11. Akiyama, H.; Yuasa, H.; Kato, A.; Saiki, T.; Sanada, K.; Kado, N. Precise Fuel Control of Diesel Common-Rail System by Using OFEM; SAE Technical Paper, 2010-01-0876; SAE International: Warrendale, PA, USA, 2010. [Google Scholar]
  12. Wu, Z.; Chen, Y. Experimental Study on Rail Pressure Signal Processing of High Pressure Common Rail Fuel System. Automob. Appl. Tech. 2016, 5, 78–80. [Google Scholar] [CrossRef]
  13. Tao, Q.; Wang, C.; Fang, Z.; Qi, Z.; Yin, W. Research on Rail Pressure Signal Processing Method of High Pressure Common Rail System. In Proceedings of the IEEE International Conference on Optoelectronics and Image Processing, Haikou, China, 11–12 November 2010; pp. 274–276. [Google Scholar]
  14. Catania, A.E.; Ferrari, A.; Manno, M.; Spessa, E. Experimental Investigation of Dynamics Effects on Multiple-Injection Common Rail System Performance. J. Eng. Gas Turbines Power 2008, 130, 460–466. [Google Scholar] [CrossRef] [Green Version]
  15. Henein, N.A.; LaiM, C.; Singh, I.P.; Zhong, L.; Han, J. Characteristics of a Common Rail Diesel Injection System under Pilot and Post Injection Modes; SAE Technical Paper, 2002-01-0218; SAE International: Warrendale, PA, USA, 2002. [Google Scholar]
  16. Bianchi, G.M.; Falfari, S.; Pelloni, P.; Filicori, F.; Milani, M. A Numerical and Experimental Study towards Possible Improvements of Common Rail Injectors; SAE Technical Paper, 2002-01-0500; SAE International: Warrendale, PA, USA, 2002. [Google Scholar]
  17. Catania, A.E.; Ferrari, A.; Manno, M. Parametric Study of Hydraulic Layout Effects on Common-Rail Multiple Injections. In Proceedings of the ASME ICED Fall Technical Conference, Ottawa, ON, Canada, 11–14 September 2005; pp. 1–12. [Google Scholar]
  18. Catania, A.E.; Ferrari, A.; Manno, M. Development and Application of a Complete Multijet Common-Rail Injection-System Mathematical Model for Hydrodynamic Analysis and Diagnostics. J. Eng. Gas Turbines Power 2008, 130, 181–192. [Google Scholar] [CrossRef]
  19. Lino, P.; Maione, B.; Rizzo, A. Nonlinear Modelling and Control of a Common Rail Injection System for Diesel Engines. Appl. Math. Model. 2007, 31, 1770–1784. [Google Scholar] [CrossRef]
  20. Baur, R.; Blath, J.P.; Bohn, C.; Kallage, F.; Schultalbers, M. Modeling and Identification of a Gasoline Common Rail Injection System; SAE Technical Paper, 2014-01-0196; SAE International: Warrendale, PA, USA, 2014. [Google Scholar]
  21. Alessandro, G.; Giovanni, F.; Angelo, P.; Veniero, G.D. Design and Experimental Validation of a Model-Based Injection Pressure Controller in a Common Rail System for GDI Engine. In Proceedings of the American Control Conference, San Francisco, CA, USA, 29 June–1 July 2011; pp. 5273–5278. [Google Scholar]
  22. Oppenheim, I. Statistical Thermodynamics: Fundamentals and Applications. J. Stat. Phys. 2006, 125, 245–276. [Google Scholar] [CrossRef]
  23. Hilborn, R.C. Introduction to Modern Dynamics: Chaos, Networks, Space, and Time. Am. J. Phys. 2015, 83, 741. [Google Scholar] [CrossRef]
  24. Herfatmanesh, M.R.; Lu, P.; Attar, M.A.; Zhao, H. Experimental Investigation into the Effects of Two-Stage Injection on Fuel Injection Quantity, Combustion and Emissions in a High-Speed Optical Common Rail Diesel Engine. Fuel 2013, 109, 137–147. [Google Scholar] [CrossRef]
  25. Kyrtatos, P.; Brückner, C.; Boulouchos, K. Cycle-to-Cycle Variations in Diesel Engines. Appl. Energy 2016, 171, 120–132. [Google Scholar] [CrossRef]
  26. Venugopal, R.; Abani, N.; MacKenzie, R. Effects of Injection Pattern Design on Piston Thermal Management in an Opposed-Piston Two-Stroke Engine; SAE Technical Paper, 2013-0148-7191; SAE International: Warrendale, PA, USA, 2013. [Google Scholar]
  27. Franke, M.; Huang, H.; Liu, J.; Geistert, A.; Adomeit, P. Opposed Piston Opposed Cylinder (OPOC™) 450 hp Engine: Performance Development by CAE Simulations and Testing; SAE Technical Paper, 2006-01-0277; SAE International: Warrendale, PA, USA, 2006. [Google Scholar]
  28. Zhang, Z.; Zhang, P.; Zhao, Z. Spray Impingement and Combustion in a Model Opposed-Piston Compression Ignition Engine. Combust. Sci. Technol. 2017, 189, 1943–1965. [Google Scholar] [CrossRef]
  29. Hountalas, D.T.; Kouremenos, A.D. Development of a Fast and Simple Simulation Model for the Fuel Injection System of Diesel Engines. Adv. Eng. Softw. 1998, 29, 13–28. [Google Scholar] [CrossRef]
  30. Law, C.K. Combustion Physics; Cambridge University Press: Cambridge, UK, 2010. [Google Scholar]
Figure 1. Control principle of common rail systems (CRS). PID: Proportion Integration Differentiation; OBS: rail pressure error state observer.
Energies 11 01729 g001
Figure 2. Schematic of the working principle for the OBS method.
Energies 11 01729 g002
Figure 3. Schematic of experimental apparatus for CRS test bench. ① Fuel pump, ② electrical motor, ③ injectors, ④ chamber, ⑤ N2 container, ⑥ common rail pipe, ⑦ single-injection instrument, ⑧ pressure sensor (100 Hz), ⑨ current clamp, ⑩ pressure sensor (100 kHz), ⑪ electronic control unit (ECU), ⑫ data acquisition card, ⑬ host computer.
Energies 11 01729 g003
Figure 4. Evolution of measured rail pressures for p r - h s , and p ^ r - OBS in the same pumping–injection cycle. p t = 150   MPa .
Energies 11 01729 g004
Figure 5. Measured rail pressure error range for p r - h s , p ^ r - OBS , and p r - s .
Energies 11 01729 g005
Figure 6. Measured rail pressure of 200 injection cycles for p ^ r - OBS , p r - s and p r - s under three different target pressures of (a) p t = 80   MPa , (b) p t = 100   MPa , and (c) p t = 150   MPa . The cycles of maximum and minimum pressure are indicated in the graphs.
Energies 11 01729 g006
Figure 7. Measured injected quantity of 200 injection cycles for p ^ r - OBS and p r - s under three different target pressures of (a) p t = 80   MPa , (b) p t = 100   MPa , and (c) p t = 150   MPa . The cycles of maximum and minimum injected quantity are indicated in the graphs.
Energies 11 01729 g007
Figure 8. Comparison of position information of state points under three different target pressures of (a) p t = 80   MPa , (b) p t = 100   MPa , and (c) p t = 150   MPa .
Energies 11 01729 g008
Figure 9. Measured injection rate of Q m a x and Q m i n in 200 cycles under the OBS method, shown in (ac), and conventional filtering method, shown in (df), for three different target pressures.
Energies 11 01729 g009
Figure 10. Comparison of the predicted evaporation index, A d (on the left Y axis), and premixed fuel mass (on the right Y axis) between Q m a x and Q m i n over 200 cycles for (a) the OBS method and (b) the filtering method. p t = 150   MPa , Q t = 44.05   mg . ATDC: After Top Dead Center.
Energies 11 01729 g010
Figure 11. Comparison of the predicted cylinder pressure (on the left Y axis) and heat release rate (HRR, on the right Y axis) between Q m a x and Q m i n in 200 cycles for (a) the OBS method and (b) the filtering method. p t = 150   MPa , Q t = 44.05   mg . SOI denotes the start of injection while EOI denotes the end of the injection. η is the indicating thermal efficiency.
Energies 11 01729 g011

