Effects of Electrode Composition and Thickness on the Mechanical Performance of a Solid Oxide Fuel Cell

1
Department of Physics, University of Science and Technology of China, No. 96, JinZhai Road, Hefei 230026, China
2
Hefei National Laboratory for Physical Sciences at Microscale, University of Science and Technology of China, No. 96, JinZhai Road, Hefei 230026, China
3
CAS Key Laboratory of Strongly-Coupled Quantum Matter Physics, University of Science and Technology of China, No. 96, JinZhai Road, Hefei 230026, China
*
Author to whom correspondence should be addressed.
Energies 2018, 11(7), 1735; https://doi.org/10.3390/en11071735
Submission received: 24 May 2018
/
Revised: 14 June 2018
/
Accepted: 25 June 2018
/
Published: 2 July 2018
(This article belongs to the Section I: Energy Fundamentals and Conversion)
Abstract
:Mechanical damage is a major factor limiting the long-term stability of solid oxide fuel cells (SOFCs). Here, the mechanical stability of planar SOFCs consisting of Ni-YSZ anode/YSZ electrolyte/LSM-YSZ cathode (Ni=Nickel, YSZ=yttria-stabilized zirconia, LSM=lanthanum strontium manganite) is analyzed by a structural mechanics model with composition dependent mechanical properties. Influencing factors considered include: the Ni and LSM volume fractions, the thicknesses of anode, cathode and electrolyte layers, and the cell types of anode-, cathode-, and electrolyte-supported designs. It is found that (i) the anode failure probability increases with the Ni content. However, SOFCs remain mechanically safe if the Ni volume fraction is below 65%. (ii) An LSM volume fraction of over 40% is required to maintain the mechanical integrity of cathode. (iii) For an anode-supported cell with a 20 μm thick electrolyte, the anode thickness should be more than 0.5 mm to be mechanically stable. (iv) The anode-supported cell is found to be mechanically safer than that of the electrolyte-supported cell.
1. Introduction
Solid oxide fuel cell (SOFC) converts the chemical energy of fuel into electricity through an electrochemical process. Owing to its high operating temperature, SOFC is fuel flexible, e.g., CO or reformed hydrocarbon may be used as fuel directly. The fuel flexibility is extremely important in practice as fossil fuel will remain dominant in the next several decades [1]. Consequently, the SOFC technology is actively pursued worldwide. The high operating temperature, however, also severely limits the material choices and designs of SOFCs. There have been a large number of studies on the material development based on electrical conductivity, chemical/electrochemical activities, and stabilities. Studies on the mechanical stabilities of SOFC materials are, however, scarce. As the mechanical stability is critically important for the lifetime and commercialization of SOFCs, more studies are highly desirable [2].
SOFCs may be classified into tubular, planar, monolithic, or microtubular designs [3]. Alternatively, they may be characterized as electrolyte-, anode-, or cathode-supported cells. The tubular design is often electrolyte-supported, while the planar and monolithic designs are mostly anode-supported. Regardless of the geometric features, Ni-YSZ anode, YSZ electrolyte, and LSM-YSZ cathode are the most commonly used material sets for SOFCs [4]. The thermal expansion coefficients (TECs) of the materials are different. Due to the TEC mismatch, thermal stress is inherent and may cause mechanical failure of SOFCs [5]. While degradations caused by electrochemical and chemical reactions are widely noticed, the intrinsic long-term instability due to thermal mismatch induced stress is rarely studied. In this work, the thermal stress distribution and mechanical failure probability of planar SOFC (pSOFC) with the material combination of Ni-YSZ anode, YSZ electrolyte, and LSM-YSZ cathode are analyzed in detail by a thermal mechanical model. The effects of temperature, Ni (LSM) content in the anode (cathode) and the thicknesses of the anode/electrolyte/cathode layers on the mechanical stress and failure probability are systematically examined. Unfavorable electrode compositions and layer thicknesses as well as operating conditions that are prone to cause mechanical failure are identified. Guidelines for designing high performance and long lifetime SOFCs are then proposed.
2. Computational Method
The mechanical stress distribution of pSOFC is determined by a structural mechanics model using a set of realistic material properties. The mechanical stress distribution is then used to compute the failure probability.
2.1. Structural Mechanics Model
According to the theory of elasticity, the stress and strain are related by
where σ, D, , and are the stress tensor, the elasticity matrix, the elastic strain, and the initial stress or the residual stress, respectively.
The total strain, , is the sum of the elastic strain, , the thermal strain, , the creep strain, , and the initial strain, .
The elastic matrix, D, for an isotropic material is defined as [6]
where E is the Young’s modulus and is the Poisson’s ratio of the material
where G is the shear modulus of the material.
The thermal strain is defined as,
where is the TEC of the material and is temperature-dependent. T is the local temperature, and denotes the reference temperature with zero initial strain. Combining Equations (2) and (5), Equation (1) can be written as . That is, σ is strongly dependent on the thermal strain induced stress, αD(T − Tf).
The mechanical properties of dense SOFC materials used here are shown in Table 1.
The boundary conditions for the determination of the stress distribution are the following: The anode-electrolyte-cathode assembly was assumed to be bonding-contacting and there was no slip among the components. No additional constraint or force was applied on the outer surface of the stack. Free deformation was set for the whole computational domain. Gravity is neglected in the stress analysis. The structural mechanics model is solved by the finite element commercial software ANSYS® version 14.5 [7].
2.2. Effective Material Properties of Porous Composite Material
Mechanical properties of the dense composite electrodes are computed by the composite sphere method (CSM) [18]. The bulk and shear moduli of composite material are determined as
where Ki(c) and Gi(c) are, respectively, the bulk modulus and shear modulus of the material phase i (c for composite). ψi is the volume fraction of each phase in the composite material. The results of Equations (6) and (7) depend on which material phase is chosen as the matrix or the impurity and the higher values are used [18].
The effective elastic and shear moduli of the porous electrode are calculated by the method of Ramakrishnan and Arunachalam [19]. Effective Young’s modulus, shear modulus and Poisson’s ratio are determined as
where is the porosity of the medium. Subscript 0 denotes the dense material phase.
The effective TEC of the composite material, α, is calculated as [20]
where the subscripts i and m denote the element and matrix phases, respectively. For example, Ni and YSZ are the elements in the Ni-YSZ composite anode, while YSZ is also the matrix. The effect of porosity on TEC is neglected as it is known to be very limited [21].
It is worthy of noting that the mechanical properties of porous composite materials are likely dependent on the grain sizes of the constituting materials. Due to a lack of widely accepted theory, the dependences of mechanical properties of cell components on the grain sizes of NiO/Ni/YSZ/LSM are neglected. Fortunately, the theoretical TECs thus determined for the Ni(O)-YSZ anode are in good agreement with experimental data, as to be seen below in the Result section.
It is noted that the anode was made of NiO-YSZ and the anode porosity changes when NiO is reduced to Ni. The relationship between the anode porosity and the fraction of reduced NiO is expressed as [11]
Here , , and are respectively the porosity, the density, and the weight fraction of NiO of the initial NiO/YSZ anode. r is the fraction of the reduced NiO. and are the density of Ni and NiO, and and are the atomic mass of oxygen and NiO.
2.3. Failure Probability Analysis
SOFCs consist of brittle ceramic components that exhibit statistical strength distributions. Mechanical failures such as crack and delamination may occur for a brittle material suffering a tensile stress. The Weibull approach [22] is used to estimate the mechanical failure probabilities of SOFC components. In the Weibull model, the failure probability, , of a ceramic material subjecting to a tensile principal stress distribution, σten, is calculated as
where σ0 is the Weibull strength, m is the Weibull modulus, V0 is the reference volume, and V is the volume of the cell component (anode, electrolyte, or cathode). Notice that only the tensile stress is considered in the Weibull analysis. A principal stress is tensile if σi > 0, and the stress is compressive if σi < 0. In Equation (13), σten = 0 is used where a compressive stress is encountered. A failure probability below 10−6 is considered safe [23] and used as the failure criterion.
Crack and breakage of material may also occur for a component suffering compressive stress. The ratio of the maximum compressive stress to the compressive strength of the material is used as a supplement of the Weibull failure probability. Mechanical failure is likely to occur if the compressive strength ratio is larger than 1. A compressive strength ratio of 1 is used as the failure criterion.
3. Results and Discussion
3.1. Stress Distribution
The stress distribution is dependent on the mechanical properties and on the material compositions and layer thicknesses of pSOFC components. The relevant basic model parameters are shown in Table 3. Unless explicitly stated otherwise, the parameters are assumed in all calculations. Moreover, it is noted that the stress free temperature is assumed to be 1073 K with NiO fully reduced into Ni, in accordance with a recent experimental analysis [28]. The stress-free temperature for the NiO-YSZ anode, however, is set at 1473 K due to the cell manufacturing process [29]. Besides, no shrinkage is considered for the reduced anode [11].
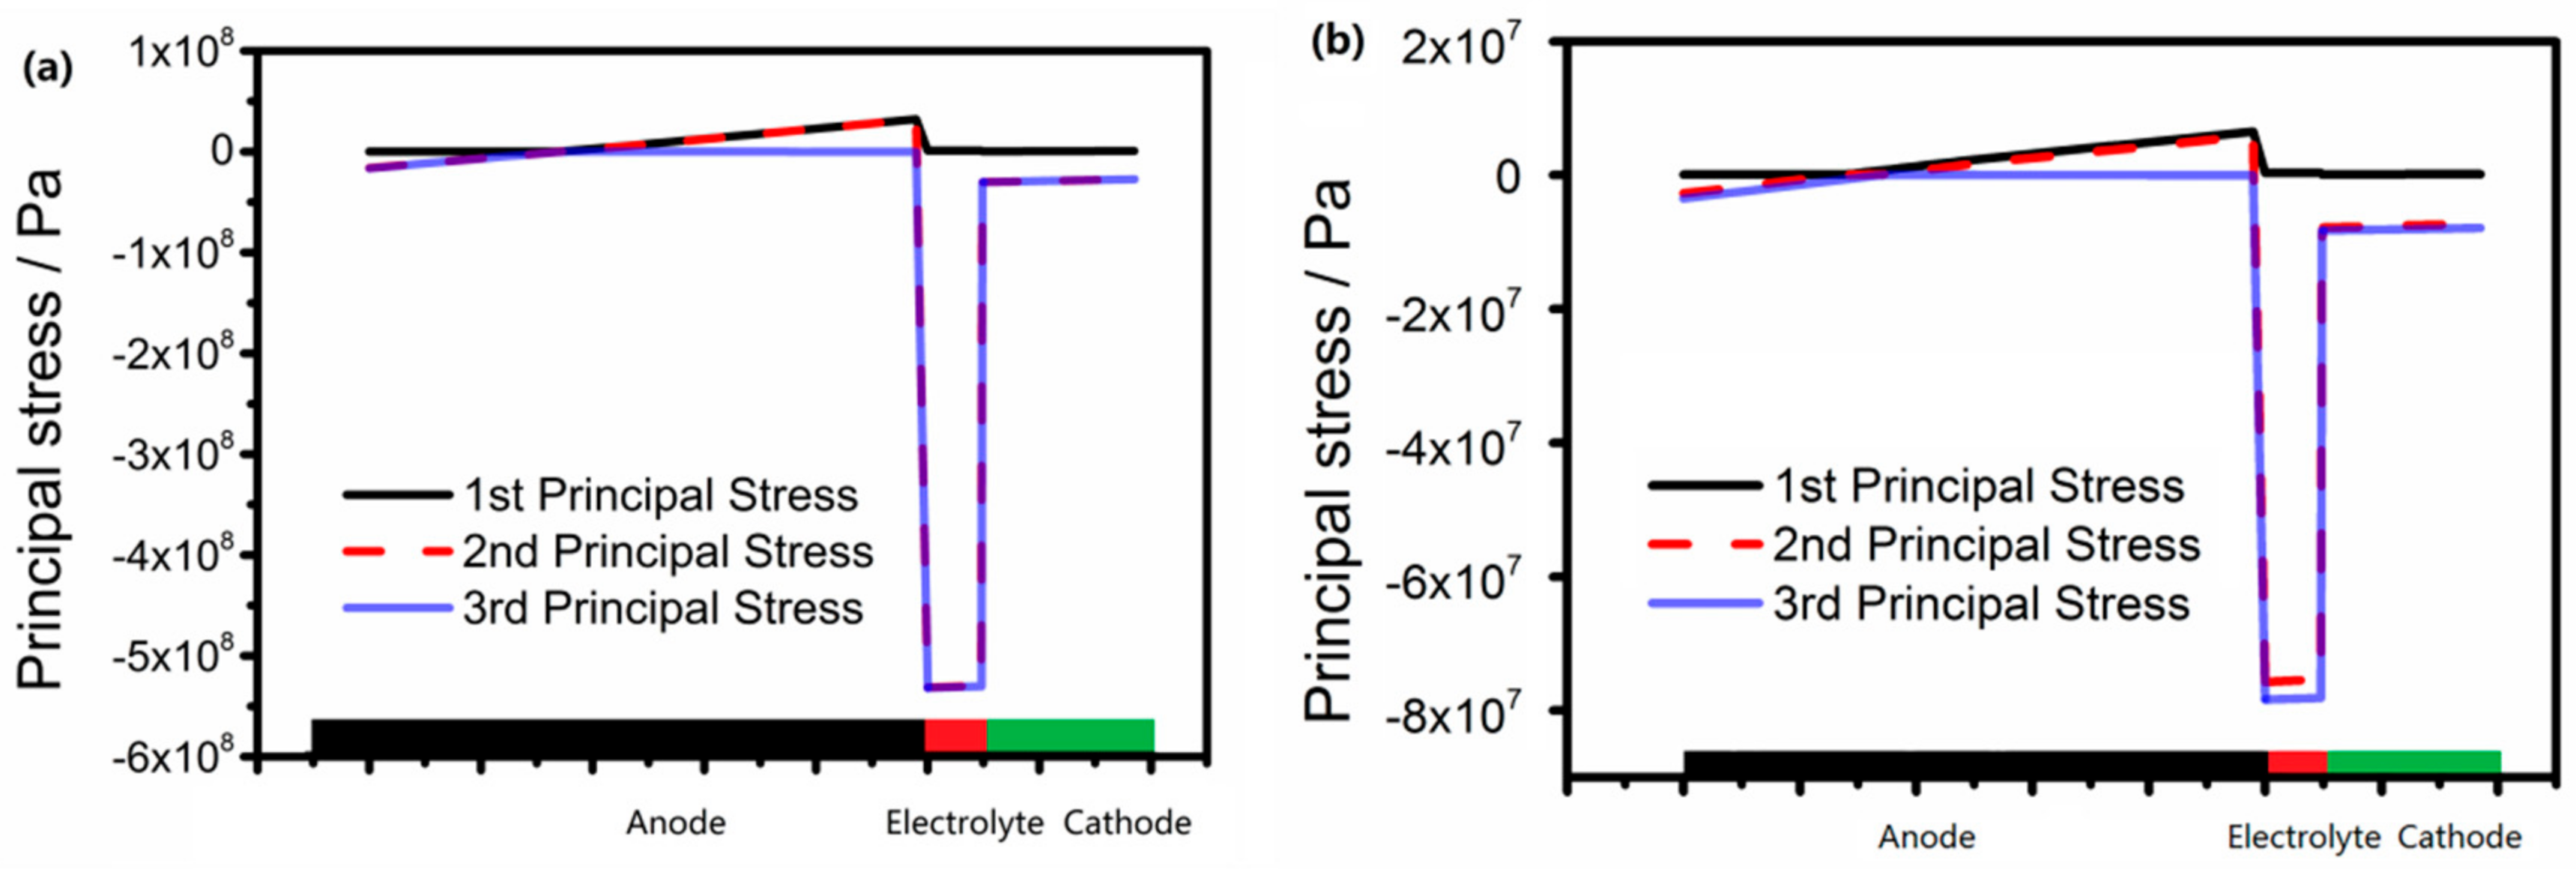
The maximum, middle, and minimum principal stresses of the anode-electrolyte-cathode assembly for the room temperature (RT) and the operating temperature (OT) of 973 K are shown in Figure 1. The maximum absolute stresses for the anode, electrolyte, cathode at RT are 32.2, 532, and 30.3 MPa, respectively. The maximum stresses for the anode, electrolyte, cathode at OT are respectively 6.49, 78.4, and 8.27 MPa, much smaller than that at RT. The maximum stresses of the anode and electrolyte are found at the interface of anode and electrolyte. Notice that the anode suffers mainly tensile stress, while the electrolyte and cathode suffer mainly compressive stress. To avoid mechanical failure, the anode should have an adequate Weibull strength, while the electrolyte and the cathode are required to have high compressive strengths.
3.2. Effects of Electrode Compositions on the Mechanical Stability of SOFC
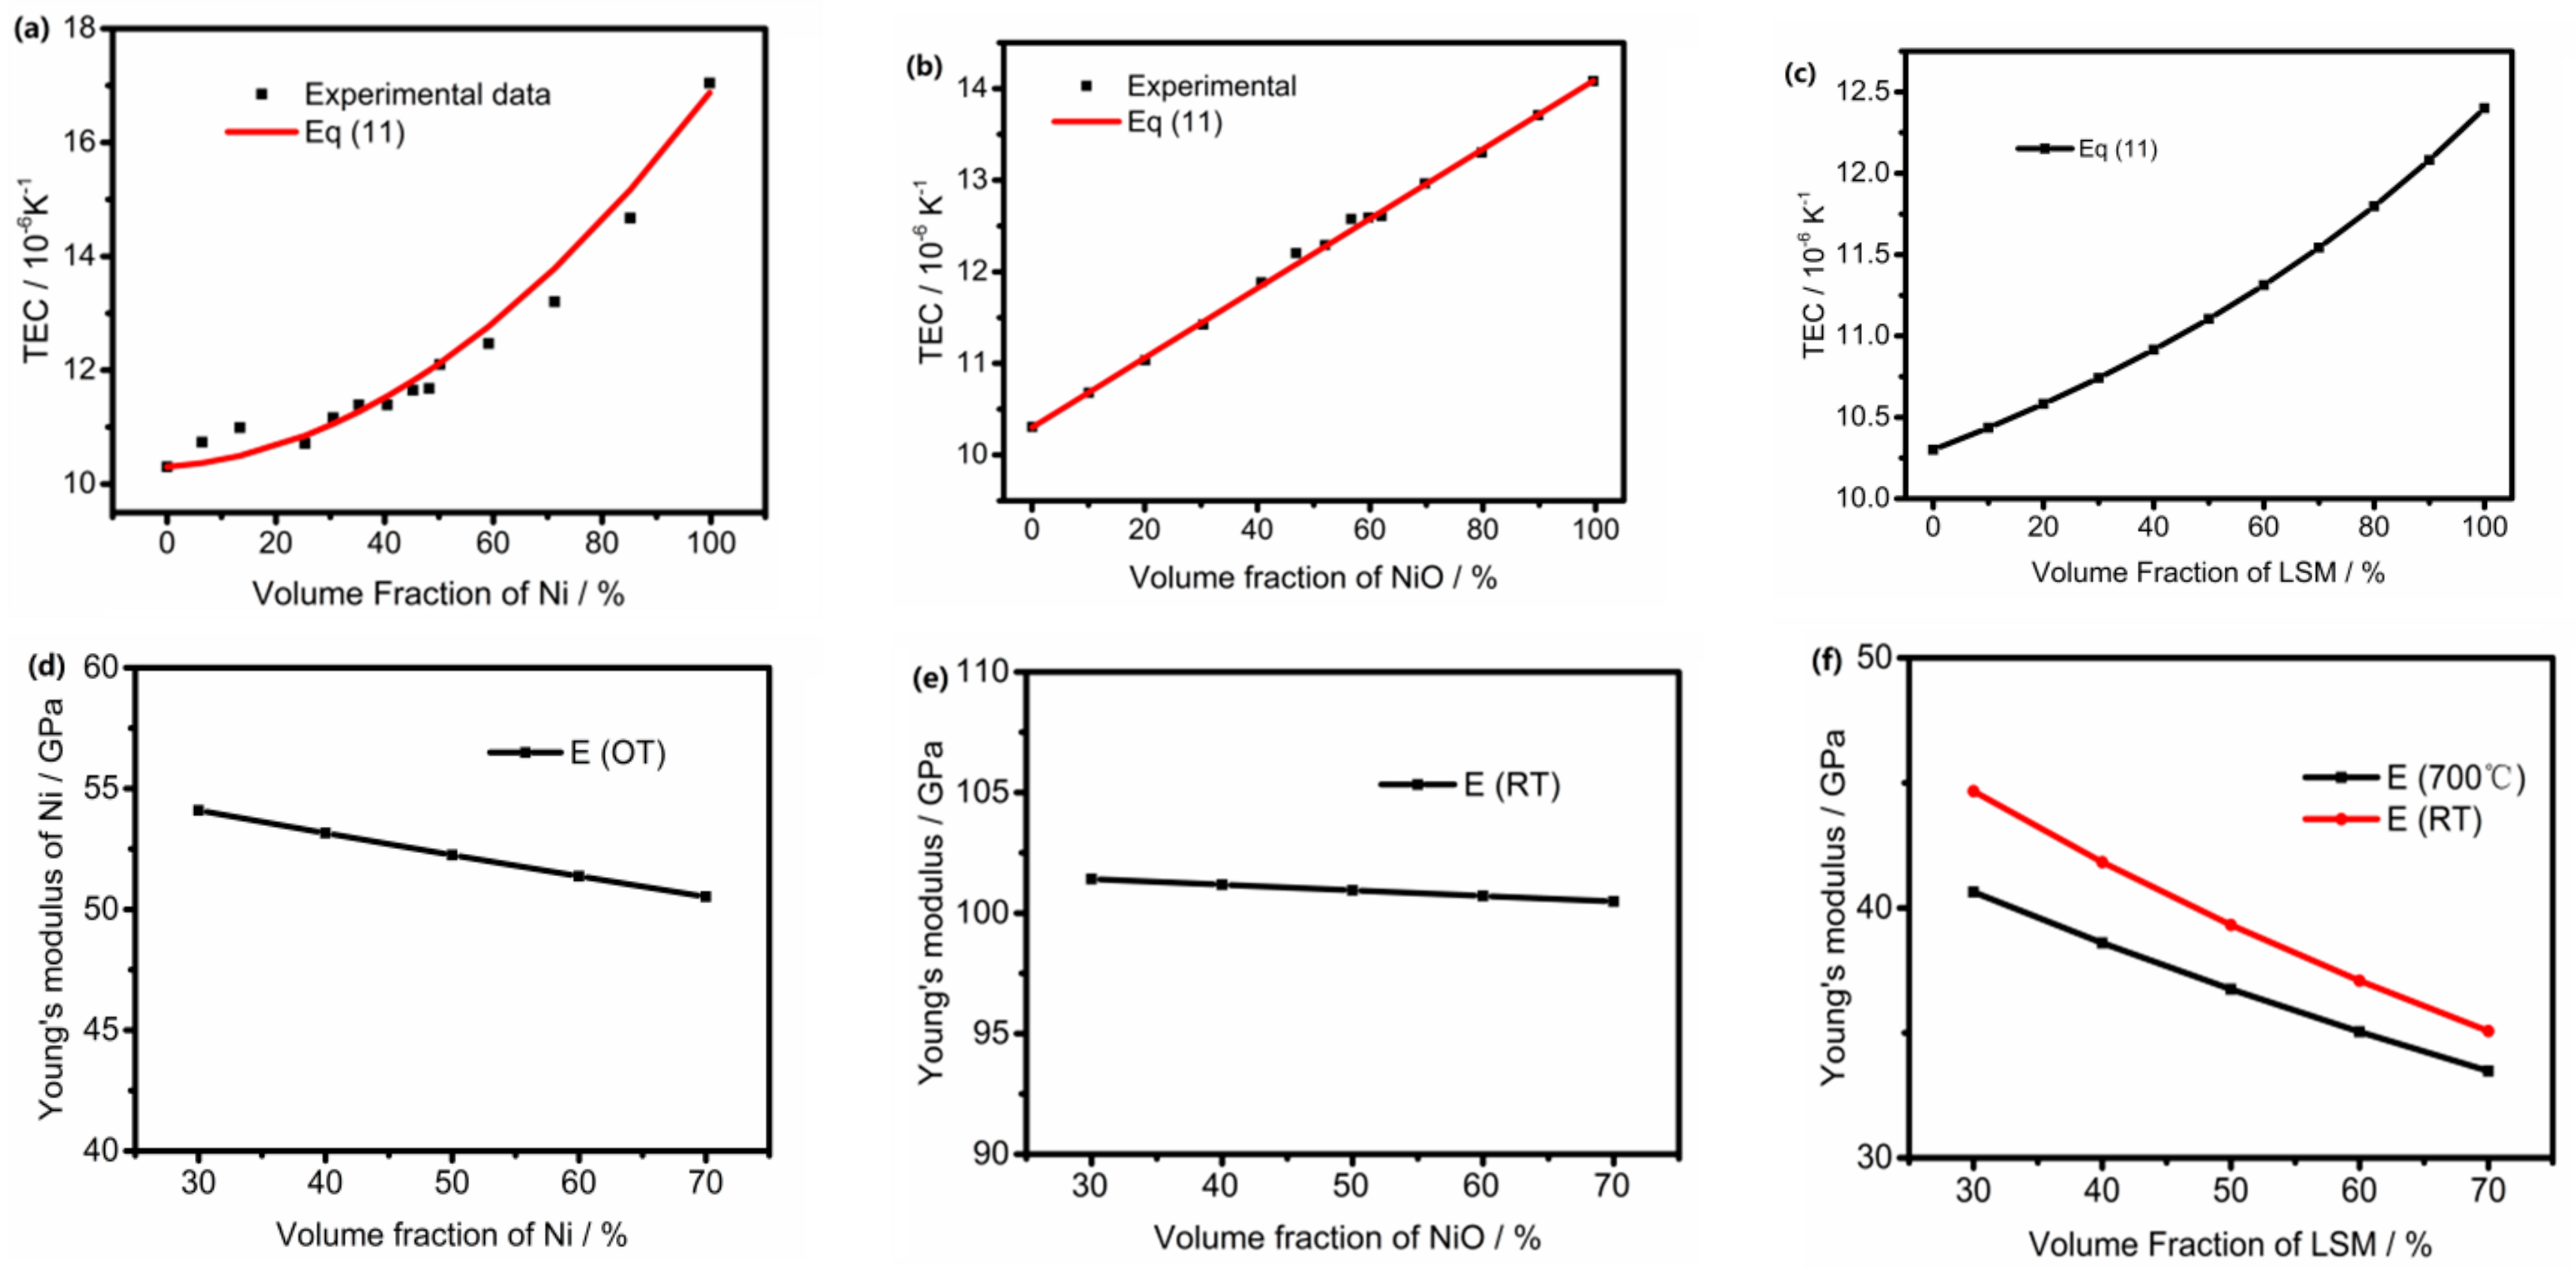
The mechanical properties of the composite electrodes are dependent on the Ni and LSM volume fractions in the electrodes. The theoretical model described above in Section 2.2 is applied to compute TEC of the Ni-YSZ (NiO-SYZ) anode as a function of the Ni (NiO) volume fraction in the Ni-YSZ (NiO-YSZ) composite material. The theoretical results are compared with the experimental data [14] in Figure 2. Due to the good theoretical and experimental agreement shown in Figure 2a,b, the theoretical model is considered validated. The theoretical model is used to determine the TEC of the LSM-YSZ cathode and the Young’s modulus of Ni-YSZ (NiO-SYZ) anode and LSM-YSZ cathode and the results are shown in Figure 2c–e. The effective mechanical properties of porous electrodes shown in Figure 2 are used to compute the stress distribution in the anode-electrolyte-cathode assembly varying with the electrode composition.
As shown in Figure 2, the anode TEC changes with the Ni volume fraction. That is, the thermal mismatch of SOFC components and the resulting mechanical stresses vary with the Ni volume fraction. The effects of the Ni volume fraction on the mechanical stability of SOFC components are illustrated in Figure 3. As shown in Figure 3, all the anode failure probability and the compressive stress strength ratios of the electrolyte and the cathode increase with the increase of the volume fraction of Ni. The anode failure probability is the highest for the NiO-YSZ anode at RT but remains below the safe criterion of 10−6 for all the Ni volume fractions examined. Similarly, the compressive stress strength ratio of the electrolyte is less than 1 for all the Ni volume fractions examined. The compressive stress strength ratio of the cathode is below 1 if the Ni volume fraction is less than 65%. As the Ni volume fraction is less than 50% in all practical applications, the cathode is mechanically safe.
Notice that the results shown in Figure 3 are obtained based on the stress free temperature of 1073 K with the reduced anode, as illustrated experimentally. Without the reduction process, the stress free temperature would correspond to the sintering temperature that is typically higher than 1273 K. As a result, the anode failure probability is much higher than that shown in Figure 3 and the anode is mechanically safe only for a Ni volume fraction of less than 40% [29]. Clearly, the reduction process is very favorable for releasing the harmful residual stress.
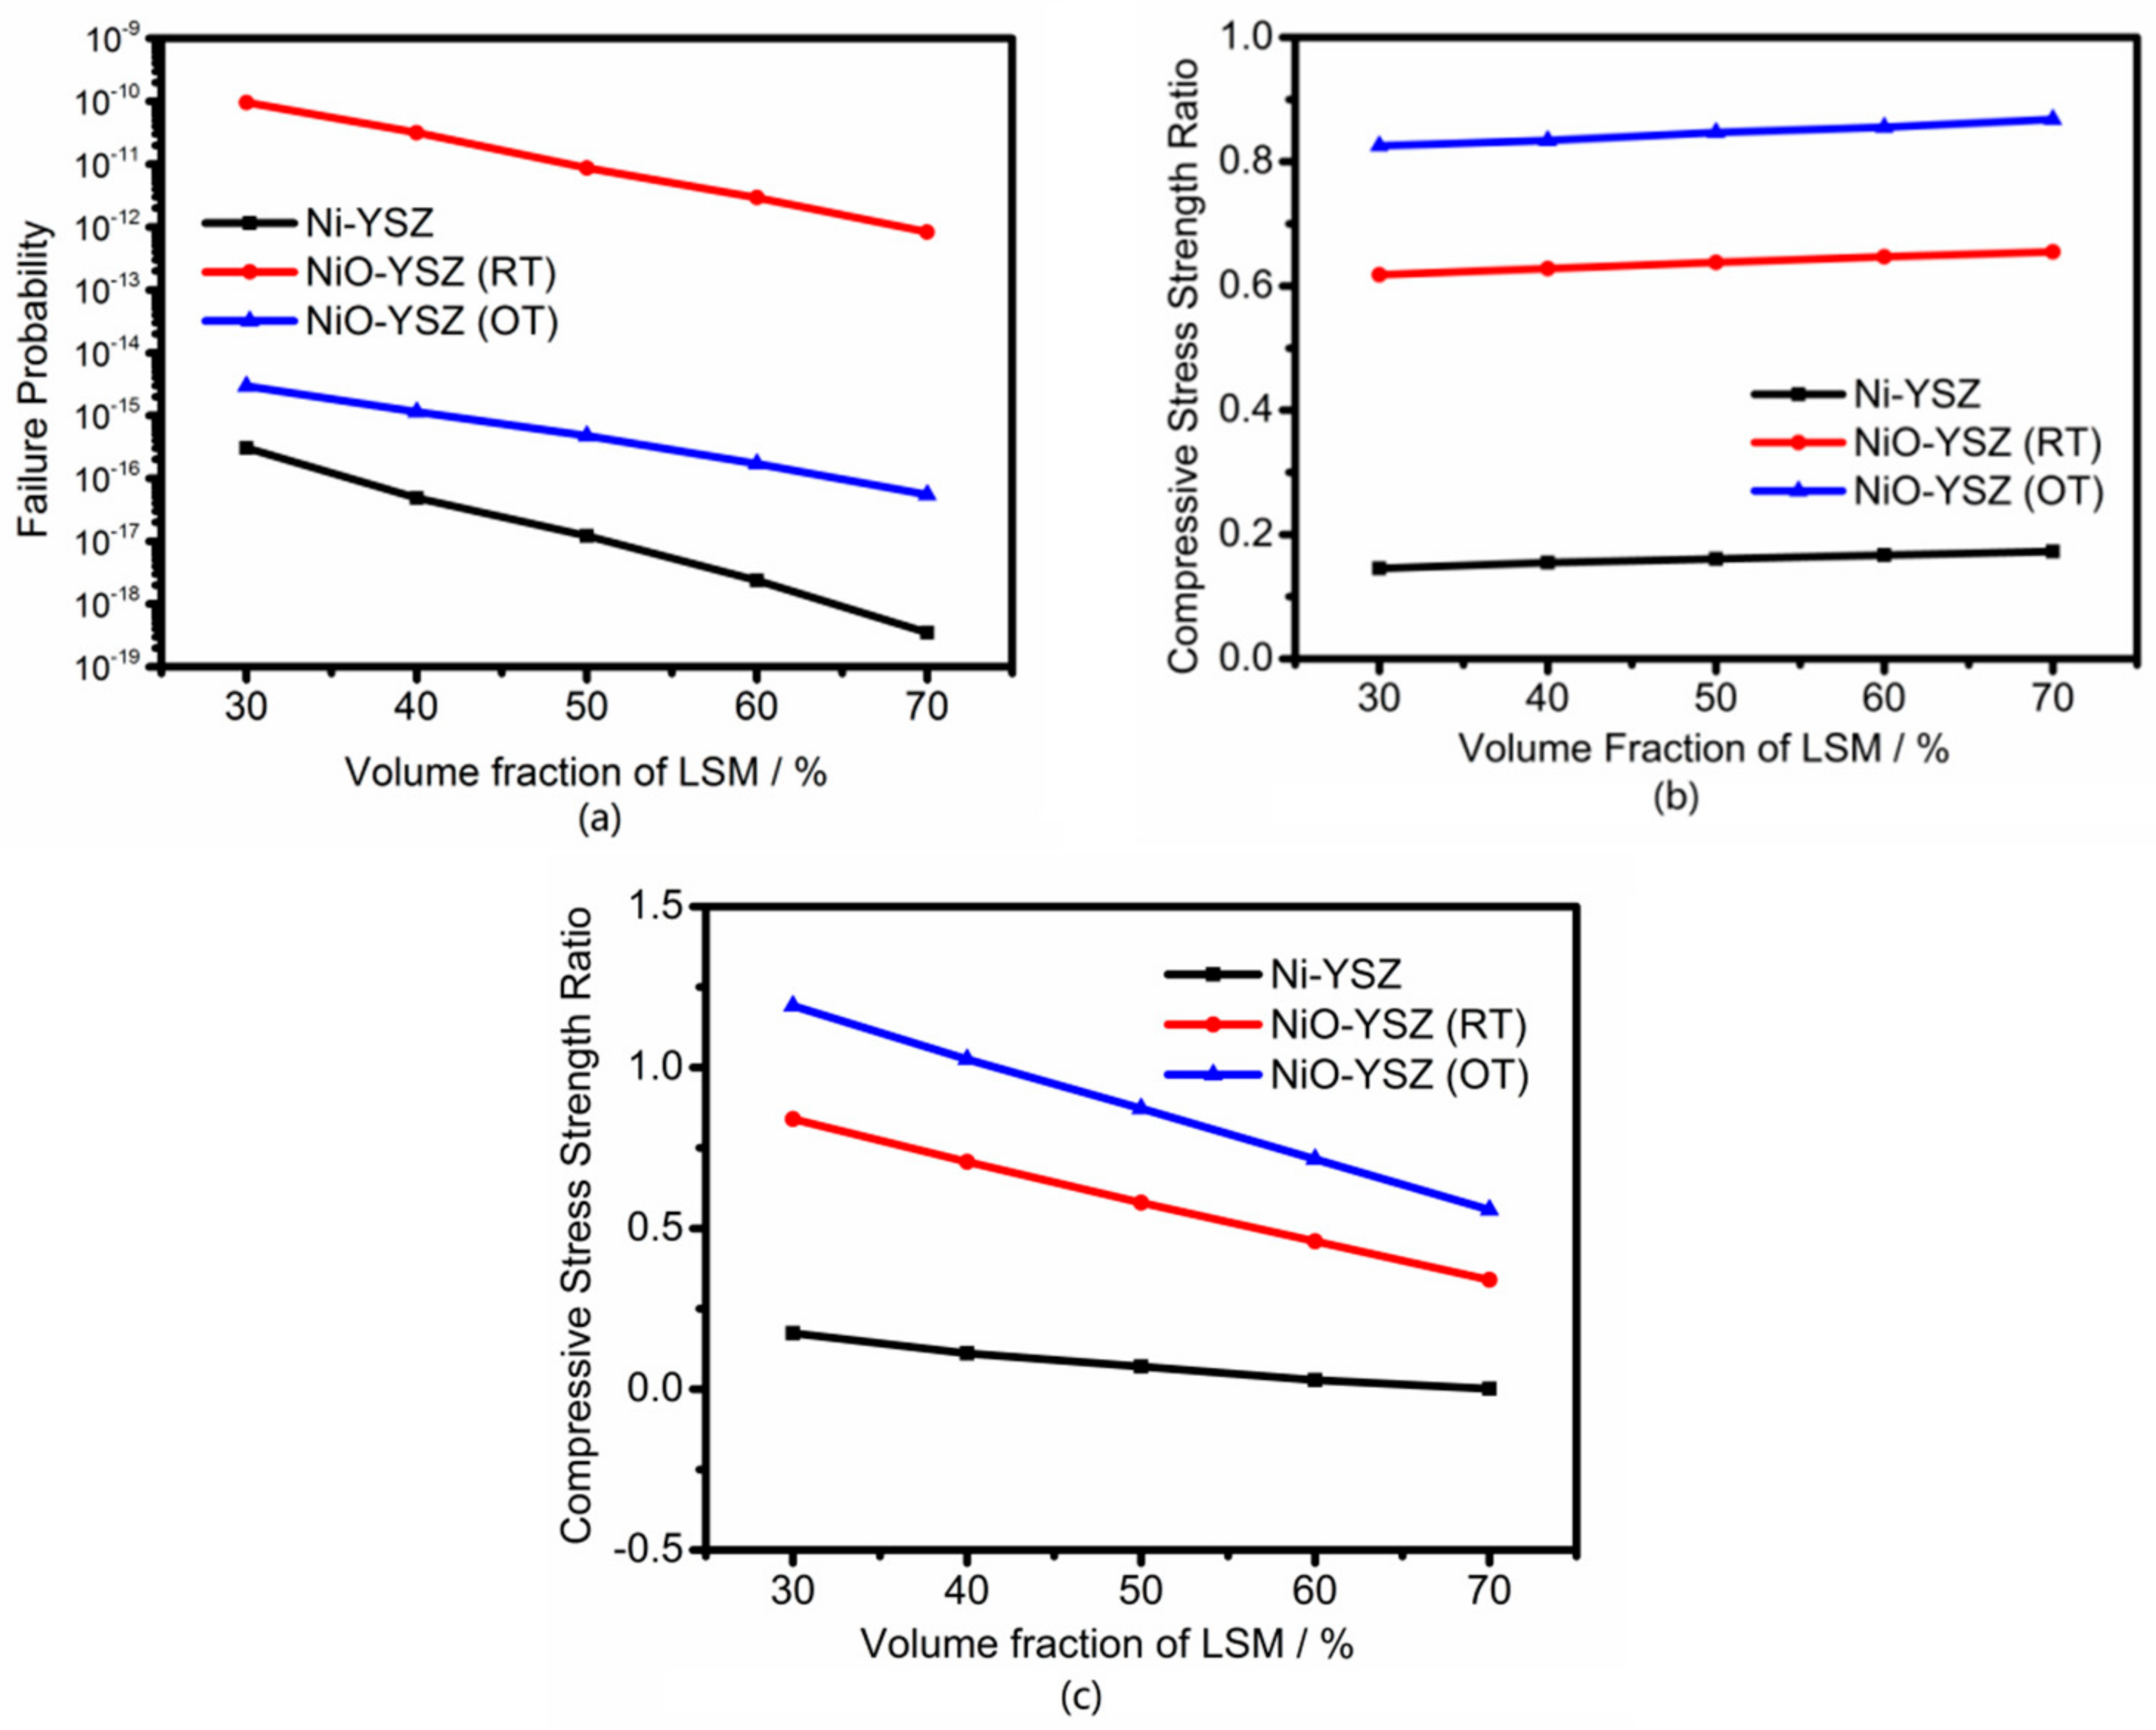
As shown in Figure 2c, the cathode TEC is substantially affected by the LSM volume fraction. The effects of the LSM volume fraction on the mechanical stability of SOFC components are depicted in Figure 4. Figure 4a shows that the anode failure probability is quite low for all LSM volume fractions. Similarly, the compressive stress strength ratio of the electrolyte is less than 1 for all the LSM volume fractions examined. As shown in Figure 4c, however, the compressive stress strength ratio of the cathode may be higher than 1 if the LSM volume fraction is less than 40%. Therefore, it is favorable to have an LSM volume fraction of above 45% in the LSM-YSZ cathode. It is known that an LSM volume fraction of around 50% is best for the electrochemical performance of the cathode, if the LSM and YSZ particles are of similar sizes [30]. Under the circumstance of similar LSM and YSZparticle sizes, it is recommended to have the LSM volume fraction in the range of 45–55%.
3.3. Effects of Layer Thickness on the Mechanical Stability of SOFC
Considering the fact that the anode at the operating condition is at its reduced state, only the cases for the Ni-YSZ anode at OT and the NiO-YSZ anode at RT are considered below. The effects of the anode layer thickness on the mechanical stability of SOFC components are illustrated in Figure 5. As naturally expectable, Figure 5a shows that the anode failure probability decreases with the increase of the anode layer thickness. Considering the criterion of 10−6 for the failure probability, the anode is mechanically safe once its thickness is more than 0.3 mm, as seen in Figure 5a. The compressive stress strength ratio of the electrolyte at RT tends to increase with the anode layer thickness but remains well below 1 for all the anode layer thicknesses examined. Similarly, the compressive stress strength ratio of the cathode is less than 1 for all the cases studied. That is, both the electrolyte and the cathode are mechanically stable.
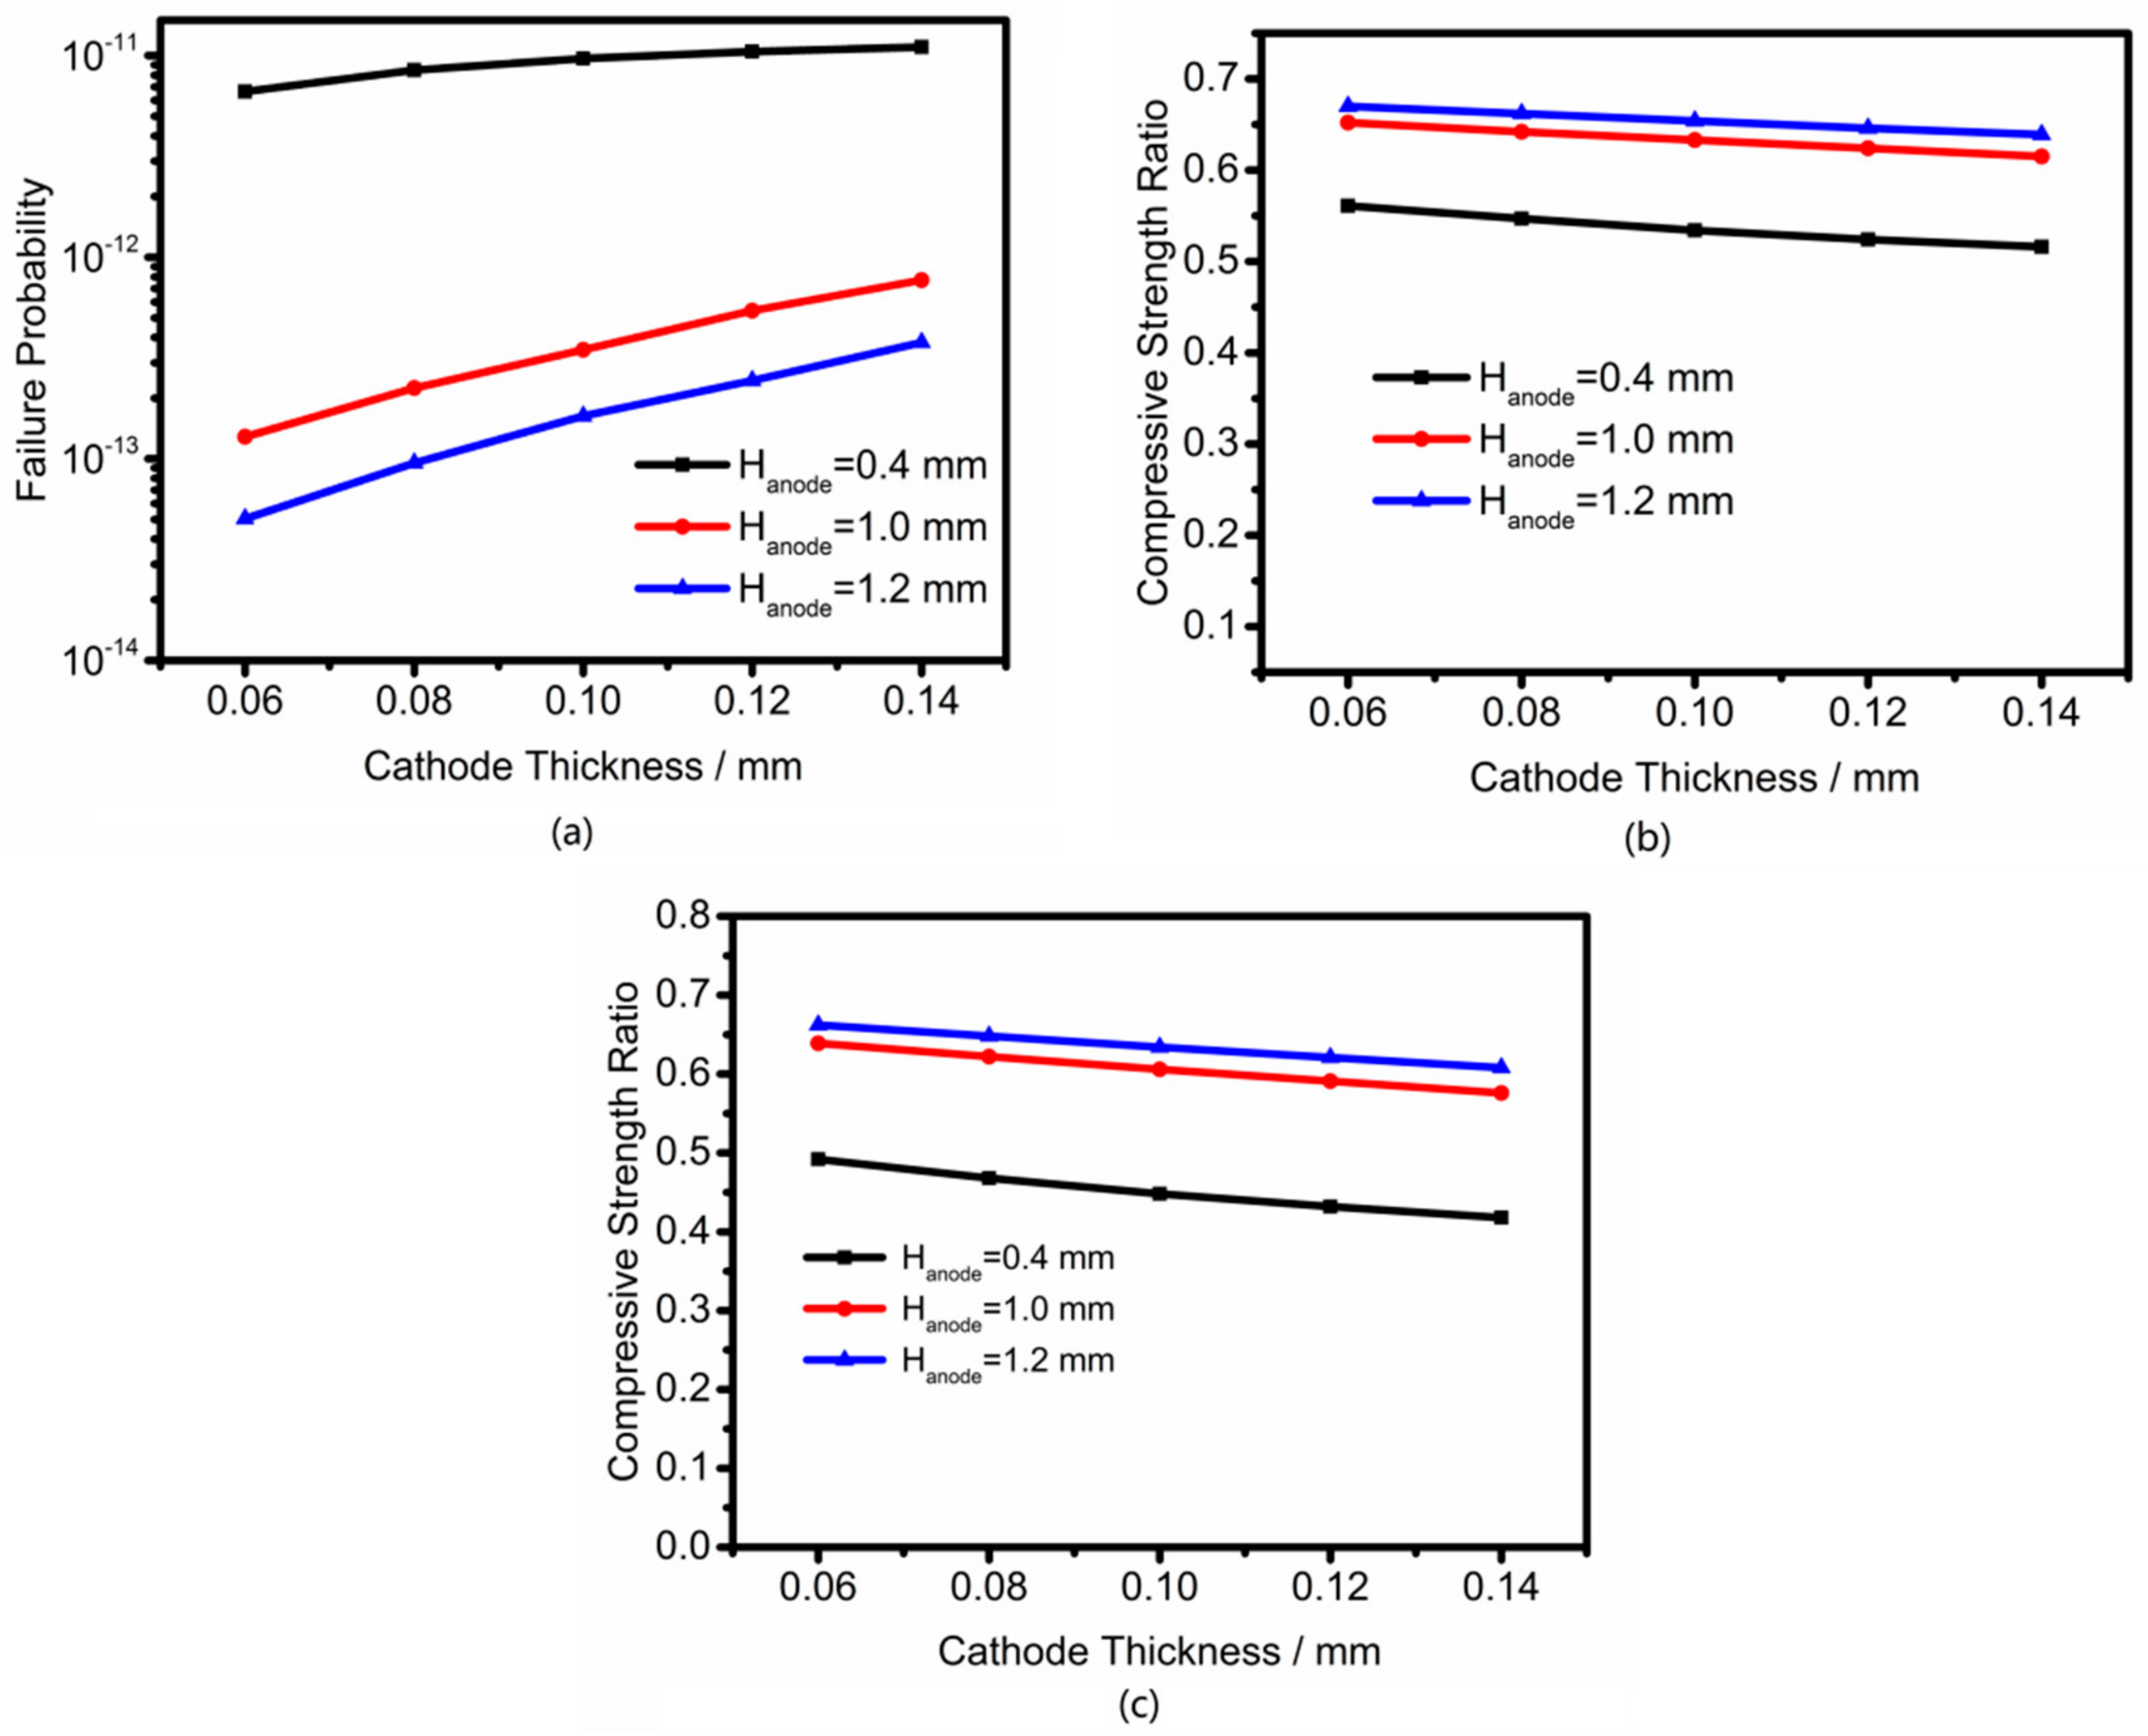
The effects of the cathode layer thickness on the mechanical stability of SOFC components are illustrated in Figure 6. Only the results for RT are shown in Figure 6 as the anode failure probability and the compressive stress strength ratios of the electrolyte and the cathode are found to be higher at RT than that at OT. As shown in Figure 6a, the anode failure probability increase with the increased cathode layer thickness. For the three cases of anode layer thickness, however, the anode is mechanically safe for all the cathode layer thicknesses examined. As shown in Figure 6b,c, the compressive stress strength ratios of the electrolyte and the cathode tend to decrease with the increased cathode layer thickness. Besides, the compressive stress strength ratios are less than 1 for all the cases examined.
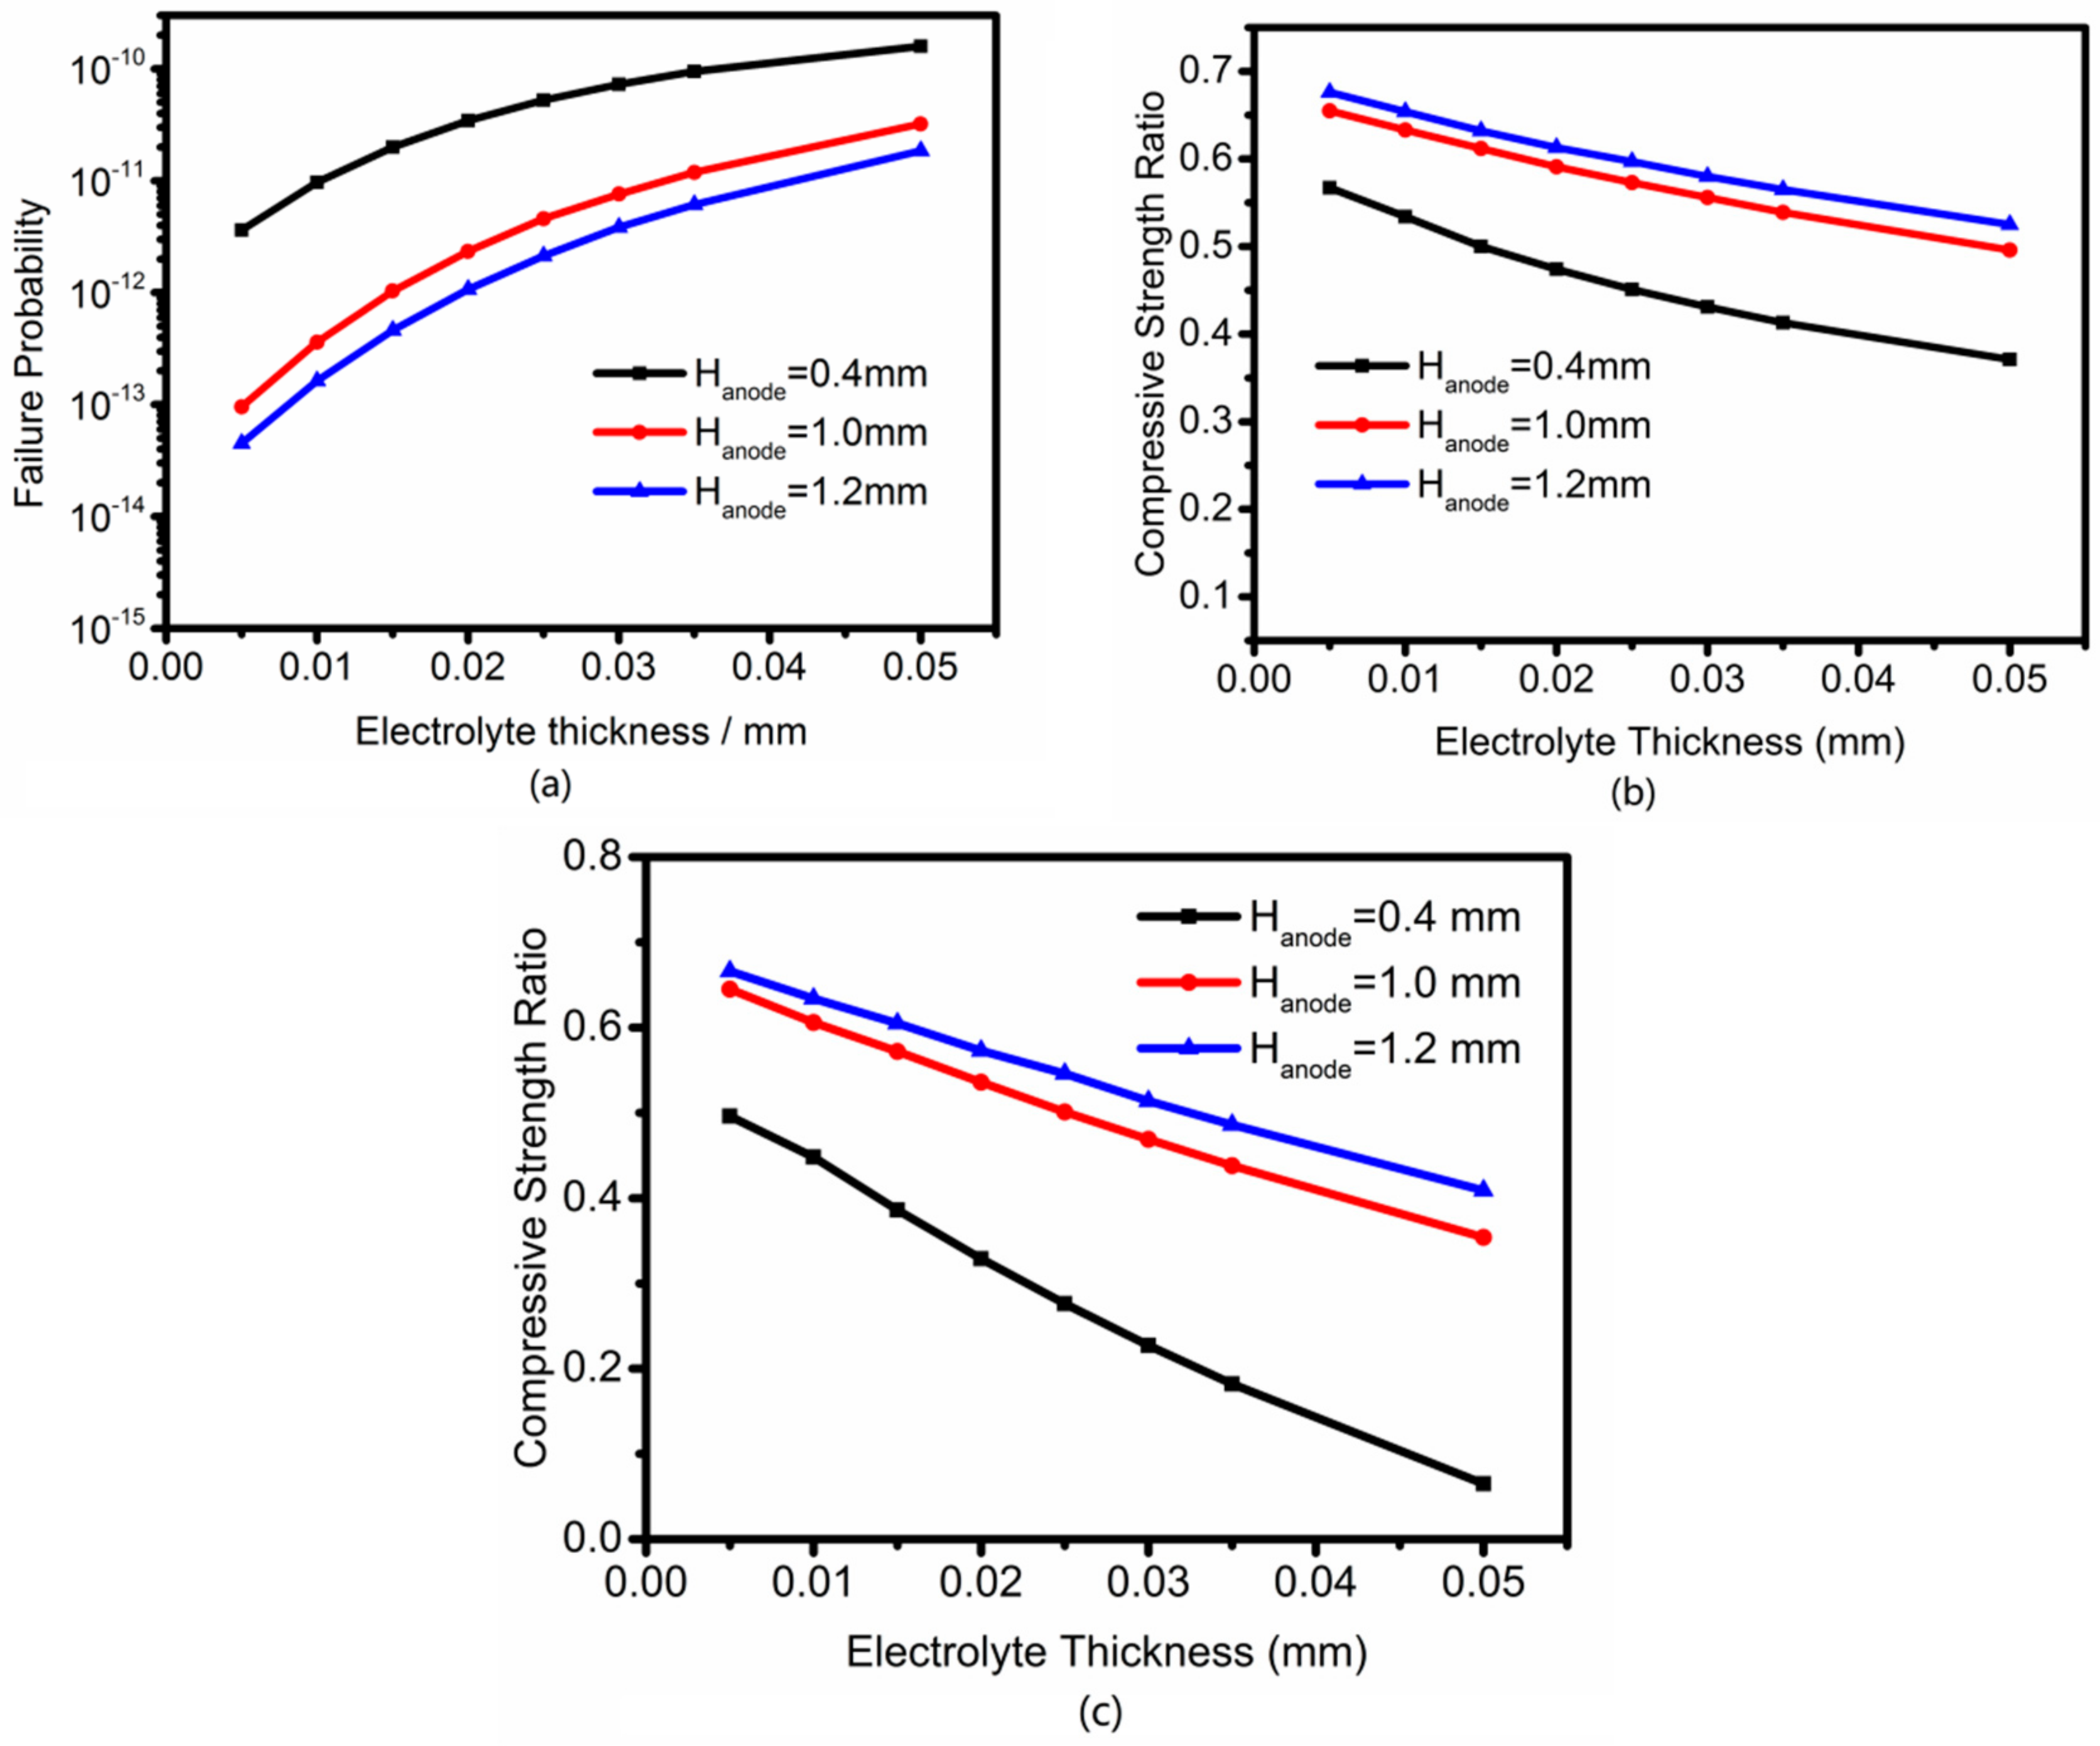
The effects of the electrolyte layer thickness on the mechanical stability of SOFC components at RT are illustrated in Figure 7. Due to the mismatch of the anode and electrolyte TECs, the electrolyte layer thickness has a strong influence on the anode failure probability. As shown in Figure 7a, the anode failure probability increases rapidly with the increased electrolyte layer thickness. The anode failure probability increases by 4–5 orders of magnitude when the electrolyte layer thickness increases from 5 μm to 50 μm. This is particularly critical when the anode is thin. For example, the failure probability for a 0.4 mm thick anode may reach a rather unsafe value of 2.1 × 10⁻⁴ for a 50 μm thick electrolyte. Clearly, a relatively thin anode and a relatively thick electrolyte is an unfavorable combination from the mechanical stability point of view. Even though the electrolyte is expected to be much thinner than 50 μm in an anode-supported cell, a thickness of about 20 μm is common in practice. To be mechanically stable, it is preferable to have the anode thickness of more than 0.5 mm.
Concerning the compressive stress strength ratios of the electrolyte and the cathode, they tend to decrease with the increase of the electrolyte thickness, as shown in Figure 7b,c. For all the cases examined, the compressive stress strength ratios are well below 1.
3.4. Effects of the Cell Support on the Mechanical Stability of SOFC
Table 4 compares the anode failure probability and the compressive stress strength ratios of the electrolyte and cathode for the anode-, cathode-, and electrolyte-supported cell designs. The layer thicknesses and the electrode compositions are from the relevant experiments [31,32,33]. However, due to various theoretical and experimental uncertainties, the results in Table 4 are most meaningful for discussing the qualitative trends.
As shown in Table 4, the anode failure probability is the lowest for the anode-supported cell, medium for the cathode-supported cell, and the highest for the electrolyte-supported cell. The trend concerning the compressive stress strength ratios of the electrolyte and the cathode is the opposite, however. The compressive stress strength ratio is the highest for the anode-supported cell, medium for the cathode-supported cell, and the lowest for the electrolyte-supported cell. Nevertheless, the compressive stress strength ratios are all below 1, i.e., within the mechanically stable zone. The anode failure probability, however, may be higher than the criterion of 1 × 10⁻⁶ for the electrolyte-supported cell. That is, the electrolyte-supported cell may be only marginally mechanical safe. Considering both the ohmic polarization and the mechanical stability together, the anode-supported cell is clearly more favorable than the electrolyte-supported design.
4. Summary
A structural mechanics model is described and used for the analysis of the mechanical behavior of pSOFC. The mechanical properties necessary for the structural mechanics analysis are determined by a theoretical model that links the properties with the compositions of materials. The property model is shown to be valid by comparing with the available experimental data. The structural mechanics analysis shows that the anode suffers mainly tensile stress, while the electrolyte and the cathode suffer mainly compressive stress. Consequently, the anode mechanical stability is analyzed with the Weibull failure probability model, while the mechanical stabilities of the electrolyte and cathode are characterized by the compressive stress strength ratios.
The effects of the anode and cathode compositions, the thicknesses of the anode, cathode and electrolyte layers, and the cell types of anode-, cathode-, and electrolyte-supported designs on the mechanical stability of SOFC components are examined systematically. The main conclusions are (i) the SOFC components are generally mechanically safe when a reasonable Ni volume fraction is used in the anode if, as shown experimentally, the Ni-YSZ anode at 1073 K is the stress-free state. (ii) An LSM volume fraction of over 40% is required to maintain the mechanical integrity of the cathode. An LSM volume fraction in the range of 45–55% is recommended by considering both the mechanical stability and the electrochemical performance of the LSM-YSZ cathode. (iii) For an anode-supported cell, the anode mechanical stability increases with the increased anode thickness and the reduced electrolyte thickness. For a 20 μm–thick electrolyte, the anode thickness should be more than 0.5 mm. (iv) The failure probabilities for the anode-, cathode-, and electrolyte-supported cells are the lowest, medium, and highest, respectively. The anode-supported cell design is favorable considering both the mechanical stability and electrochemical performance.
Author Contributions
Validation, X.F.; Formal Analysis, X.F. and J.Z.; Investigation, X.F.; Data Curation, X.F.; Writing-Original Draft Preparation, X.F.; Writing-Review & Editing, Z.L.; Supervision, Z.L.; Project Administration, Z.L. All authors read and approved the final manuscript.
Funding
This research was funded by the National Natural Science Foundation of China (11374272, 11574284, and 11774324) and the Collaborative Innovation Center of Suzhou Nano Science and Technology.
Conflicts of Interest
The authors declare no conflict of interest.
References
- Atkinson, A.; Barnett, S.; Gorte, R.J.; Irvine, J.T.S.; Mcevoy, A.J.; Mogensen, M.; Singhal, S.C.; Vohs, J. Advanced anodes for high-temperature fuel cells. Nat. Mater. 2004, 3, 17–27. [Google Scholar] [CrossRef] [PubMed] [Green Version]
- Zhang, Q.; Du, X.; Tan, S.; Tang, D.; Chen, K.; Zhang, T. Effect of nb2o5 doping on improving the thermo-mechanical stability of sealing interfaces for solid oxide fuel cells. Sci. Rep. 2017, 7, 5355. [Google Scholar] [CrossRef] [PubMed]
- Shi, H.-Y.; Zhu, J.; Lin, Z.-J. Geometric design of anode-supported micro-tubular solid oxide fuel cells by multiphysics simulations. Chin. J. Chem. Phys. 2017, 30, 411–417. [Google Scholar] [CrossRef]
- Zhao, F.; Virkar, A. Dependence of polarization in anode-supported solid oxide fuel cells on various cell parameters. J. Power Sources 2005, 141, 79–95. [Google Scholar] [CrossRef]
- Seuba, J.; Deville, S.; Guizard, C.; Stevenson, A.J. Mechanical properties and failure behavior of unidirectional porous ceramics. Sci. Rep. 2016, 6, 24326. [Google Scholar] [CrossRef] [PubMed] [Green Version]
- Laurencin, J.; Delette, G.; Lefebvre-Joud, F.; Dupeux, M. A numerical tool to estimate sofc mechanical degradation: Case of the planar cell configuration. J. Eur. Ceram. Soc. 2008, 28, 1857–1869. [Google Scholar] [CrossRef]
- ANSYS Workbench Version 14.5 User's Guide; ANSYS: Canonsburg, PA, USA, 2012.
- Nakajo, A.; Wuillemin, Z.; Van herle, J.; Favrat, D. Simulation of thermal stresses in anode-supported solid oxide fuel cell stacks. Part I: Probability of failure of the cells. J. Power Sources 2009, 193, 203–215. [Google Scholar] [CrossRef]
- Pratihar, S.K.; Sharma, A.D.; Maiti, H.S. Electrical behavior of nickel coated ysz cermet prepared by electroless coating technique. Mater. Chem. Phys. 2005, 96, 388–395. [Google Scholar] [CrossRef]
- Ji, Y.; Kilner, J.; Carolan, M. Electrical properties and oxygen diffusion in yttria-stabilised zirconia (ysz)–lasrmno (lsm) composites. Solid State Ion. 2005, 176, 937–943. [Google Scholar] [CrossRef]
- Radovic, M.; Lara-Curzio, E. Elastic properties of nickel-based anodes for solid oxide fuel cells as a function of the fraction of reduced nio. J. Am. Ceram. Soc. 2004, 87, 2242–2246. [Google Scholar] [CrossRef]
- Serincan, M.F.; Pasaogullari, U.; Sammes, N.M. Thermal stresses in an operating micro-tubular solid oxide fuel cell. J. Power Sources 2010, 195, 4905–4914. [Google Scholar] [CrossRef]
- Liu, C.; Huntz, A.M.; Lebrun, J.-L. Origin and development of residual stresses in the ni-nio system: In-situ studies at high temperature by X-ray diffraction. Mater. Sci. Eng. A 1993, 160, 113–126. [Google Scholar] [CrossRef]
- Mori, M.; Yamamoto, T.; Itoh, H. Thermal expansion of nickel-zirconia anodes in solid oxide fuel cells during fabrication and operation. J. Electrochem. Soc. 1998, 145, 1374–1381. [Google Scholar] [CrossRef]
- Faes, A.; Lund Frandsen, H.; Pihlatie, M.; Kaiser, A.; Goldstein, D.R. Curvature and strength of ni-ysz solid oxide half-cells after redox treatments. J. Fuel Cell Sci. Technol. 2010, 7, 1–7. [Google Scholar] [CrossRef]
- Cutler, R. Ceria-lanthanum strontium manganite composites for use in oxygen generation systems. Solid State Ion. 2003, 159, 9–19. [Google Scholar] [CrossRef]
- Tucker, M.C.; Cheng, L.; DeJonghe, L.C. Glass-containing composite cathode contact materials for solid oxide fuel cells. J. Power Sources 2011, 196, 8435–8443. [Google Scholar] [CrossRef]
- Hashin, Z. A variational approach to the theory of the elastic behaviour of multiphase materials. J. Mech. Phys. Solids 1963, 11, 127–140. [Google Scholar] [CrossRef]
- Ramakrishnan, N.; Arunachalam, V.S. Effective elastic moduli of porous solids. J. Mater. Sci. 1990, 25, 3930–3937. [Google Scholar] [CrossRef]
- Kerner, E.H. The elastic and thermo-elastic properties of composite media. Proc. Phys. Soc. Sect. B 1956, 69, 808–813. [Google Scholar] [CrossRef]
- Vaßena, R.; Czech, N.; Mallener, W.; Stamm, W.; Stöver, D. Influence of impurity content and porosity of plasma-sprayed yttria-stabilized zirconia layers on the sintering behaviour. Surf. Coat. Technol. 2001, 141, 135–140. [Google Scholar] [CrossRef]
- Nakajo, A.; Stiller, C.; Härkegård, G.; Bolland, O. Modeling of thermal stresses and probability of survival of tubular sofc. J. Power Sources 2006, 158, 287–294. [Google Scholar] [CrossRef]
- Montross, C.S.; Yokokawa, H.; Dokiya, M. Thermal stresses in planar solid oxide fuel cells due to thermal expansion differences. Br. Ceram. Trans. 2002, 101, 85–93. [Google Scholar] [CrossRef]
- Radovic, M.; Lara-Curzio, E. Mechanical properties of tape cast nickel-based anode materials for solid oxide fuel cells before and after reduction in hydrogen. Acta Mater. 2004, 52, 5747–5756. [Google Scholar] [CrossRef]
- Selçuk, A.; Atkinson, A. Strength and toughness of tape-cast yttria-stabilized zirconia. J. Am. Ceram. Soc. 2000, 83, 2029–2035. [Google Scholar] [CrossRef]
- Ni, D.-W.; Charlas, B.; Kwok, K.; Molla, T.T.; Hendriksen, P.V.; Frandsen, H.L. Influence of temperature and atmosphere on the strength and elastic modulus of solid oxide fuel cell anode supports. J. Power Sources 2016, 311, 1–12. [Google Scholar] [CrossRef] [Green Version]
- Liu, X.; Martin, C.L.; Bouvard, D.; Di Iorio, S.; Laurencin, J.; Delette, G.; Rödel, J. Strength of highly porous ceramic electrodes. J. Am. Ceram. Soc. 2011, 94, 3500–3508. [Google Scholar] [CrossRef]
- Frandsen, H.L.; Makowska, M.; Greco, F.; Chatzichristodoulou, C.; Ni, D.W.; Curran, D.J.; Strobl, M.; Kuhn, L.T.; Hendriksen, P.V. Accelerated creep in solid oxide fuel cell anode supports during reduction. J. Power Sources 2016, 323, 78–89. [Google Scholar] [CrossRef] [Green Version]
- Li, J.; Kong, W.; Lin, Z. Theoretical studies on the electrochemical and mechanical properties and microstructure optimization of micro-tubular solid oxide fuel cells. J. Power Sources 2013, 232, 106–122. [Google Scholar] [CrossRef]
- Chen, D.; Lin, Z.; Zhu, H.; Kee, R.J. Percolation theory to predict effective properties of solid oxide fuel-cell composite electrodes. J. Power Sources 2009, 191, 240–252. [Google Scholar] [CrossRef]
- Timurkutluk, B.; Timurkutluk, C.; Mat, M.D.; Kaplan, Y. A review on cell/stack designs for high performance solid oxide fuel cells. Renew. Sustain. Energy Rev. 2016, 56, 1101–1121. [Google Scholar] [CrossRef]
- Yuan, C.; Luo, T.; Li, J.; Meng, X.; Qian, J.; Ye, X.; Zhan, Z.; Xia, C.; Wang, S. Infiltrated porous ysz as a cathode active layer for cathode-supported solid oxide fuel cells. Electrochem. Commun. 2014, 46, 40–43. [Google Scholar] [CrossRef]
- Khazaee, I.; Rava, A. Numerical simulation of the performance of solid oxide fuel cell with different flow channel geometries. Energy 2017, 119, 235–244. [Google Scholar] [CrossRef]
Figure 1.
Principal stress distribution in the anode-electrolyte-cathode assembly: (a) at the room temperature (RT); (b) at 973 K (OT).
Figure 1.
Principal stress distribution in the anode-electrolyte-cathode assembly: (a) at the room temperature (RT); (b) at 973 K (OT).

Figure 2.
Effective mechanical properties of porous electrode: (a) Comparison of theoretical and experimental thermal expansion coefficient (TEC) of Ni-YSZ anode; (b) Comparison of theoretical and experimental TEC of NiO-YSZ anode; (c) TEC of LSM-YSZ cathode; (d) Young’s modulus of Ni-YSZ anode at OT; (e) Young’s modulus of NiO-YSZ anode at RT; (f) Young’s modulus of LSM-YSZ cathode at OT and RT.

Figure 3.
Effects of volume fraction of Ni in Ni-YSZ anode at OT (black line), NiO-YSZ anode at RT (red line), and OT (blue line) on (a) the failure probability of anode; (b) the compressive stress strength ratio of electrolyte; (c) the compressive stress strength ratio of cathode.
Figure 3.
Effects of volume fraction of Ni in Ni-YSZ anode at OT (black line), NiO-YSZ anode at RT (red line), and OT (blue line) on (a) the failure probability of anode; (b) the compressive stress strength ratio of electrolyte; (c) the compressive stress strength ratio of cathode.

Figure 4.
Effects of volume fraction of LSM on the mechanical stabilities of SOFC components: (a) the failure probability of anode; (b) the compressive stress strength ratio of electrolyte; (c) the compressive stress strength ratio of cathode. Results for the Ni-YSZ anode at OT, the NiO-YSZ anode at RT and at OT are shown in black, red, and blue, respectively.

Figure 5.
Effects of the anode layer thickness on (a) the anode failure probability; (b) the compressive stress strength ratio of the electrolyte; (c) the compressive stress strength ratio of the cathode. Results corresponding to the Ni-YSZ anode at OT and the NiO-YSZ anode at RT are shown in black and red, respectively.

Figure 6.
Effects of the cathode layer thickness on (a) the anode failure probability; (b) the compressive stress strength ratio of the electrolyte; (c) the compressive stress strength ratio of the cathode. Results corresponding to the three anode layer thicknesses of Hanode = 0.4, 1.0, and 1.2 mm are shown in black, red, and blue, respectively.

Figure 7.
Effects of the electrolyte layer thickness on (a) the anode failure probability; (b) the compressive stress strength ratio of the electrolyte; (c) the compressive stress strength ratio of the cathode. Results corresponding to the three anode layer thicknesses of Hanode = 0.4, 1.0, and 1.2 mm are shown in black, red and blue, respectively.


Table 1.
Mechanical properties of dense materials (RT = room temperature).
| Material | Young’s Modulus/GPa | Poisson Ratio | TEC/10−6 K−1 | Density/103 Kg m−3 | Grain Size/μm |
|---|---|---|---|---|---|
| YSZ (RT) | 215 [8] | 0.317 [8] | 10.3 [9] | 6.04 [10] | 0.3 |
| YSZ (1073 K) | 185 [8] | ||||
| Ni | 200 [11] | 0.313 [12] | 16.9 [9] | 8.9 [12] | |
| NiO (RT) | 220 [13] | 0.31 | 14.1 [14] | 6.67 [15] | 0.2–0.4 |
| LSM | 95 [16] | 0.32 [12] | 12.4 [17] | 6.57 [10] | 0.2–0.4 |
Table 2.
Weibull parameters and compressive strengths of solid oxide fuel cell (SOFC) materials [8,25,26,27].
| Material | Weibull Moduli, m | Weibull Strength, σ0/MPa | Reference Volume, V0/mm3 | Porosity/% | Compressive Strength/MPa |
|---|---|---|---|---|---|
| Ni/YSZ (1073 K) | 14.5 | 124 1 | 0.73 | 35 | |
| NiO/YSZ (298 K) | 14.9 | 272 | 0.8 | 13 | |
| NiO/YSZ (1073 K) | 6.1 | 115 | 1.0 | 13 | |
| Electrolyte (298 K) | 6.7 | 446 | 0.35 | 1–4 | 1000 |
| Electrolyte (1173 K) | 8.0 | 282 | 0.270 | 1–4 | 235 (973 K) |
| Cathode (298 K) | 7.0 | 52 | 1.210 | 10–15 | 100 MPa |
| Cathode (1073 K) | 4.0 | 75 | 2.810 | 10–15 | 23.5 (973 K) |
1 Ni/YSZ is reduced at 1073 K.
Table 3.
Main geometric parameters of the repeating SOFC.
| Anode Thickness/mm | Electrolyte Thickness/mm | Cathode Thickness/mm | Interconnect Thickness/mm |
|---|---|---|---|
| 1 | 0.01 | 0.09 | 1 |
| Volume Fraction of Ni/% | Volume Fraction of LSM/% | Porosity of Anode after Reduction/% | Porosity of Cathode/% |
| 0.445 | 0.479 | 0.4 | 0.4 |
Table 4.
Comparison of the anode failure probability and the compressive stress strength ratios of the electrolyte and the cathode for the anode-, cathode-, and electrolyte-supported cells.
Table 4.
Comparison of the anode failure probability and the compressive stress strength ratios of the electrolyte and the cathode for the anode-, cathode-, and electrolyte-supported cells.
| Anode-Supported | Anode | Electrolyte | Cathode |
|---|---|---|---|
| Thickness/mm | 1 | 0.01 | 0.1 |
| Failure probability | 2.4 × 10⁻¹¹ | ||
| Compressive stress strength ratio | 0.63 | 0.61 | |
| Cathode-Supported | Anode | Electrolyte | Cathode |
| Thickness/mm | 0.1 | 0.01 | 1 |
| Failure probability | 7.8 × 10⁻⁷ | ||
| Compressive stress strength ratio | 0.47 | 0.34 | |
| Electrolyte-Supported | Anode | Electrolyte | Cathode |
| Thickness/mm | 0.1 | 0.15 | 0.01 |
| Failure probability | 4.1 × 10⁻⁶ | ||
| Compressive stress strength ratio | 0.35 | 0.0017 |
© 2018 by the authors. Licensee MDPI, Basel, Switzerland. This article is an open access article distributed under the terms and conditions of the Creative Commons Attribution (CC BY) license (http://creativecommons.org/licenses/by/4.0/).
Share and Cite
MDPI and ACS Style
Fang, X.; Zhu, J.; Lin, Z. Effects of Electrode Composition and Thickness on the Mechanical Performance of a Solid Oxide Fuel Cell. Energies 2018, 11, 1735. https://doi.org/10.3390/en11071735
AMA Style
Fang X, Zhu J, Lin Z. Effects of Electrode Composition and Thickness on the Mechanical Performance of a Solid Oxide Fuel Cell. Energies. 2018; 11(7):1735. https://doi.org/10.3390/en11071735
Chicago/Turabian StyleFang, Xiurong, Jiang Zhu, and Zijing Lin. 2018. "Effects of Electrode Composition and Thickness on the Mechanical Performance of a Solid Oxide Fuel Cell" Energies 11, no. 7: 1735. https://doi.org/10.3390/en11071735
Note that from the first issue of 2016, this journal uses article numbers instead of page numbers. See further details here.