Three-Dimensional Visualization Solution to Building-Energy Diagnosis for Energy Feedback


Abstract
:1. Introduction
- (1)
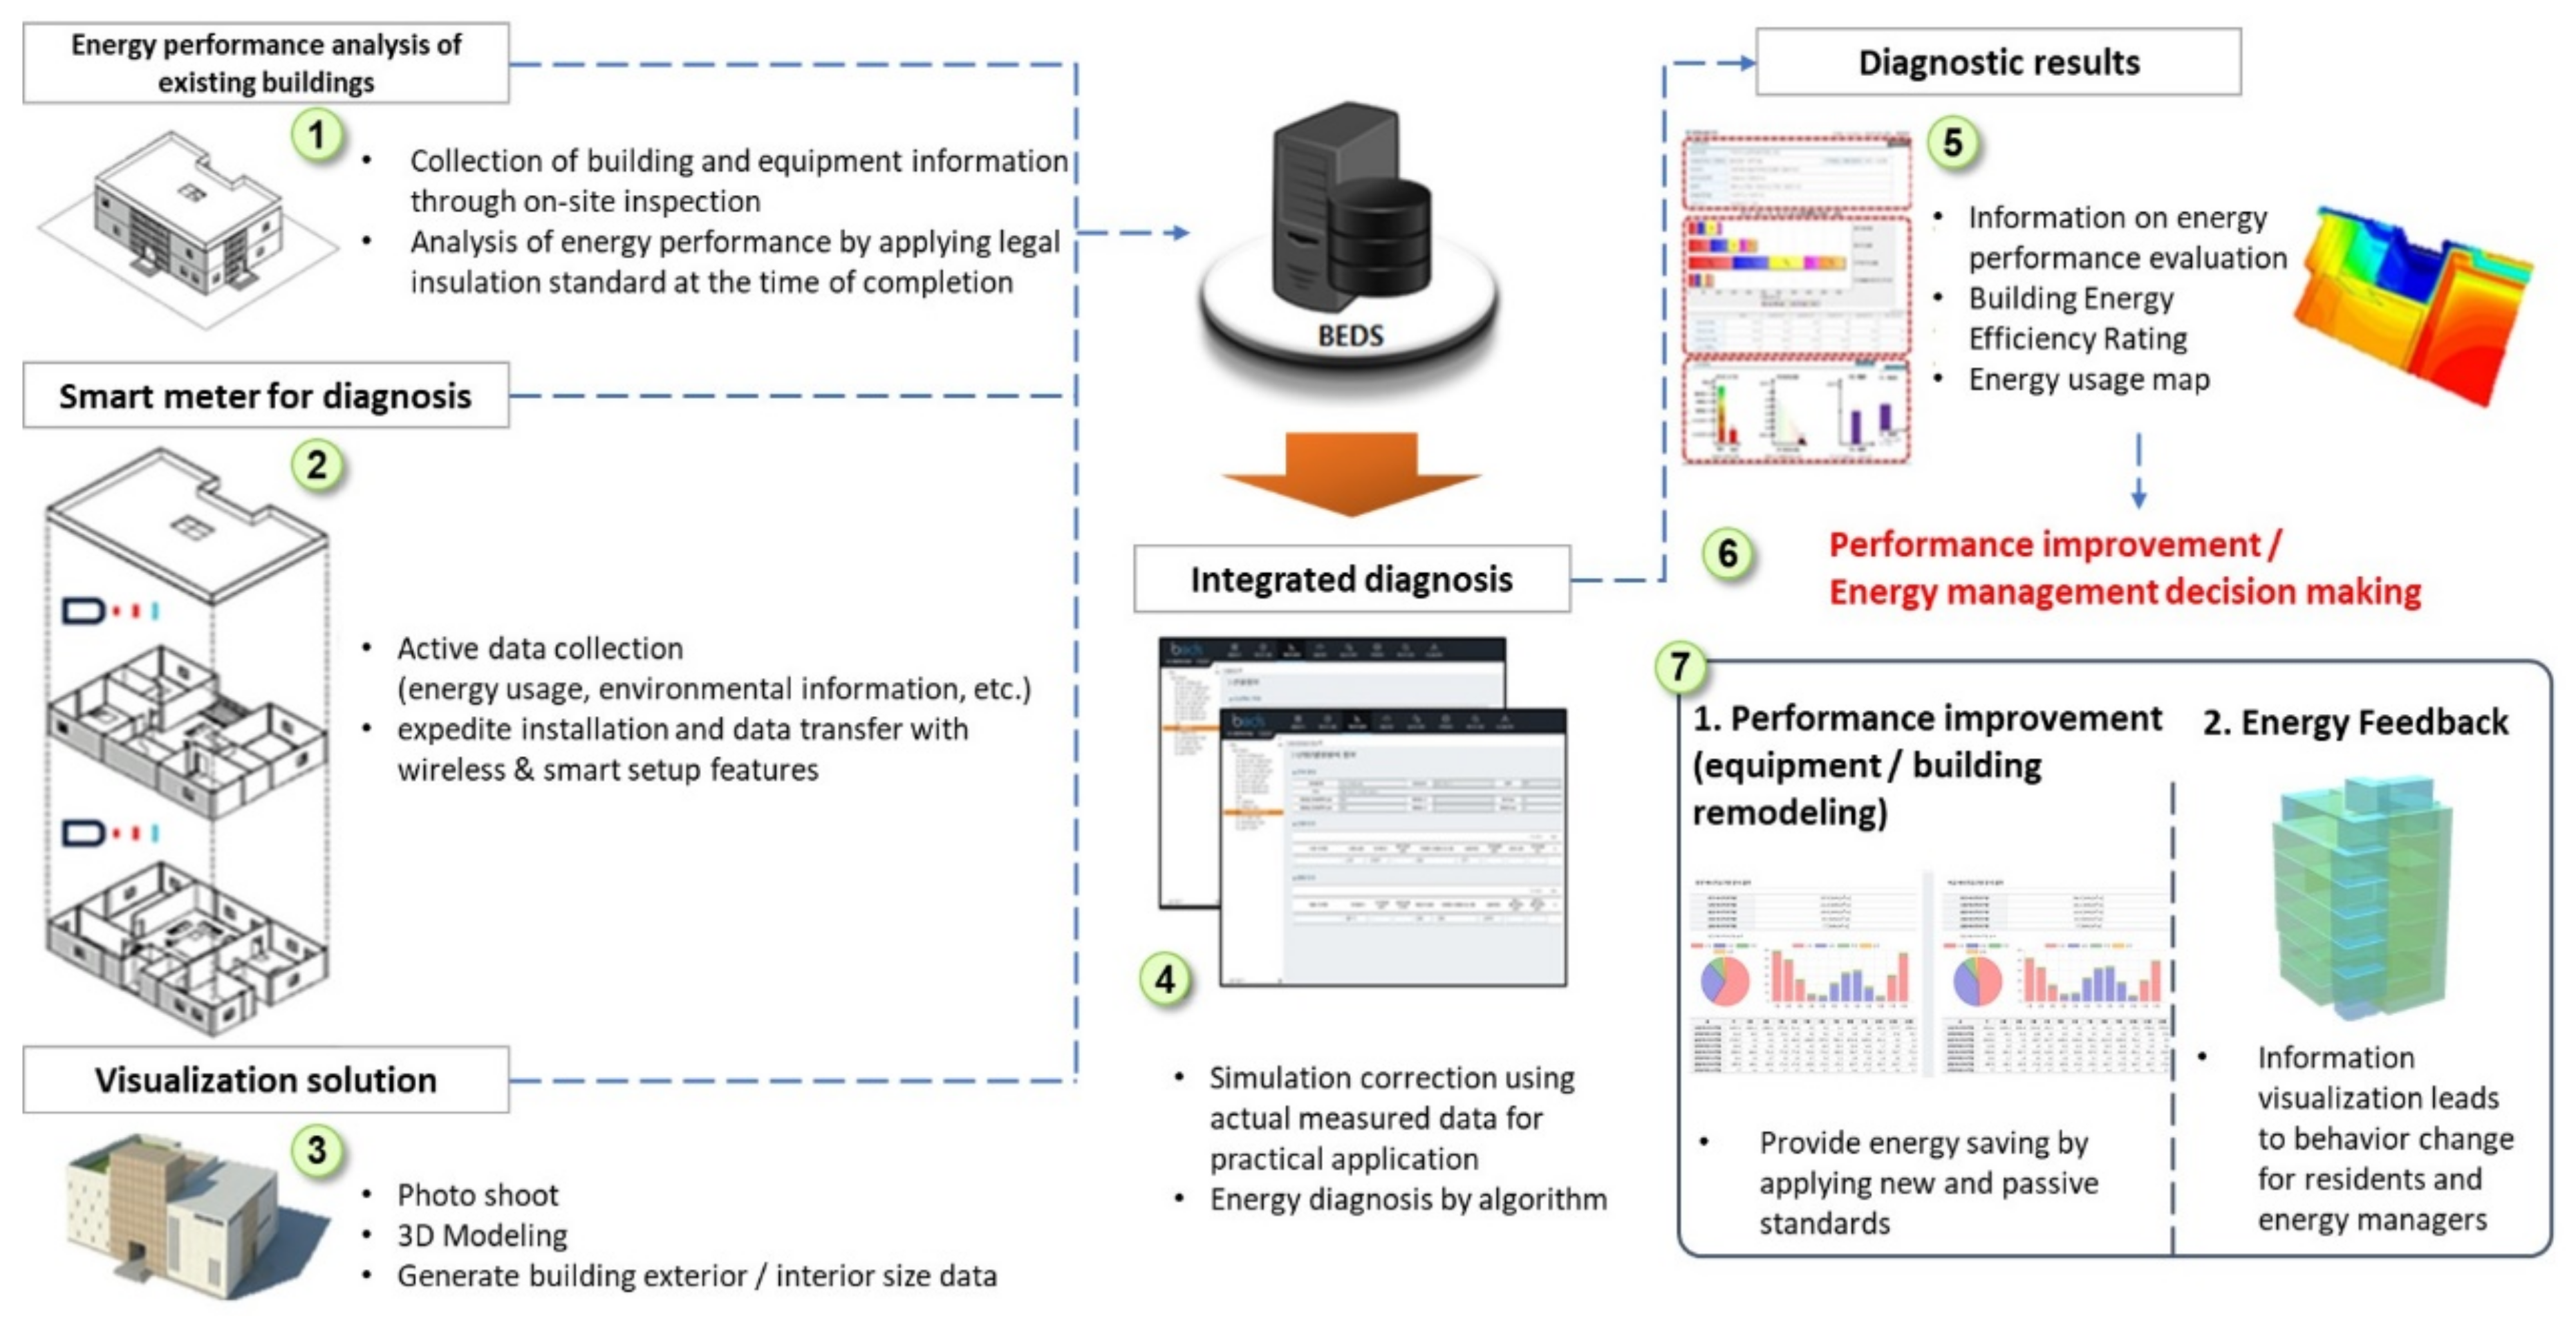
- Perform building-energy diagnosis for existing buildings that are expected to have low efficiency.
- (2)
- Input diagnostic data into an energy simulation program for showing the amount of energy that can be saved if specific elements are improved.
- (3)
- Develop a building-energy, three-dimensional (3D) visualization solution to efficiently provide the given information (Figure 1).
2. Research Method
2.1. Energy Efficiency Diagnosis
- (1)
- Diagnose buildings with on-site inspection to gain architecture and facility information.
- (2)
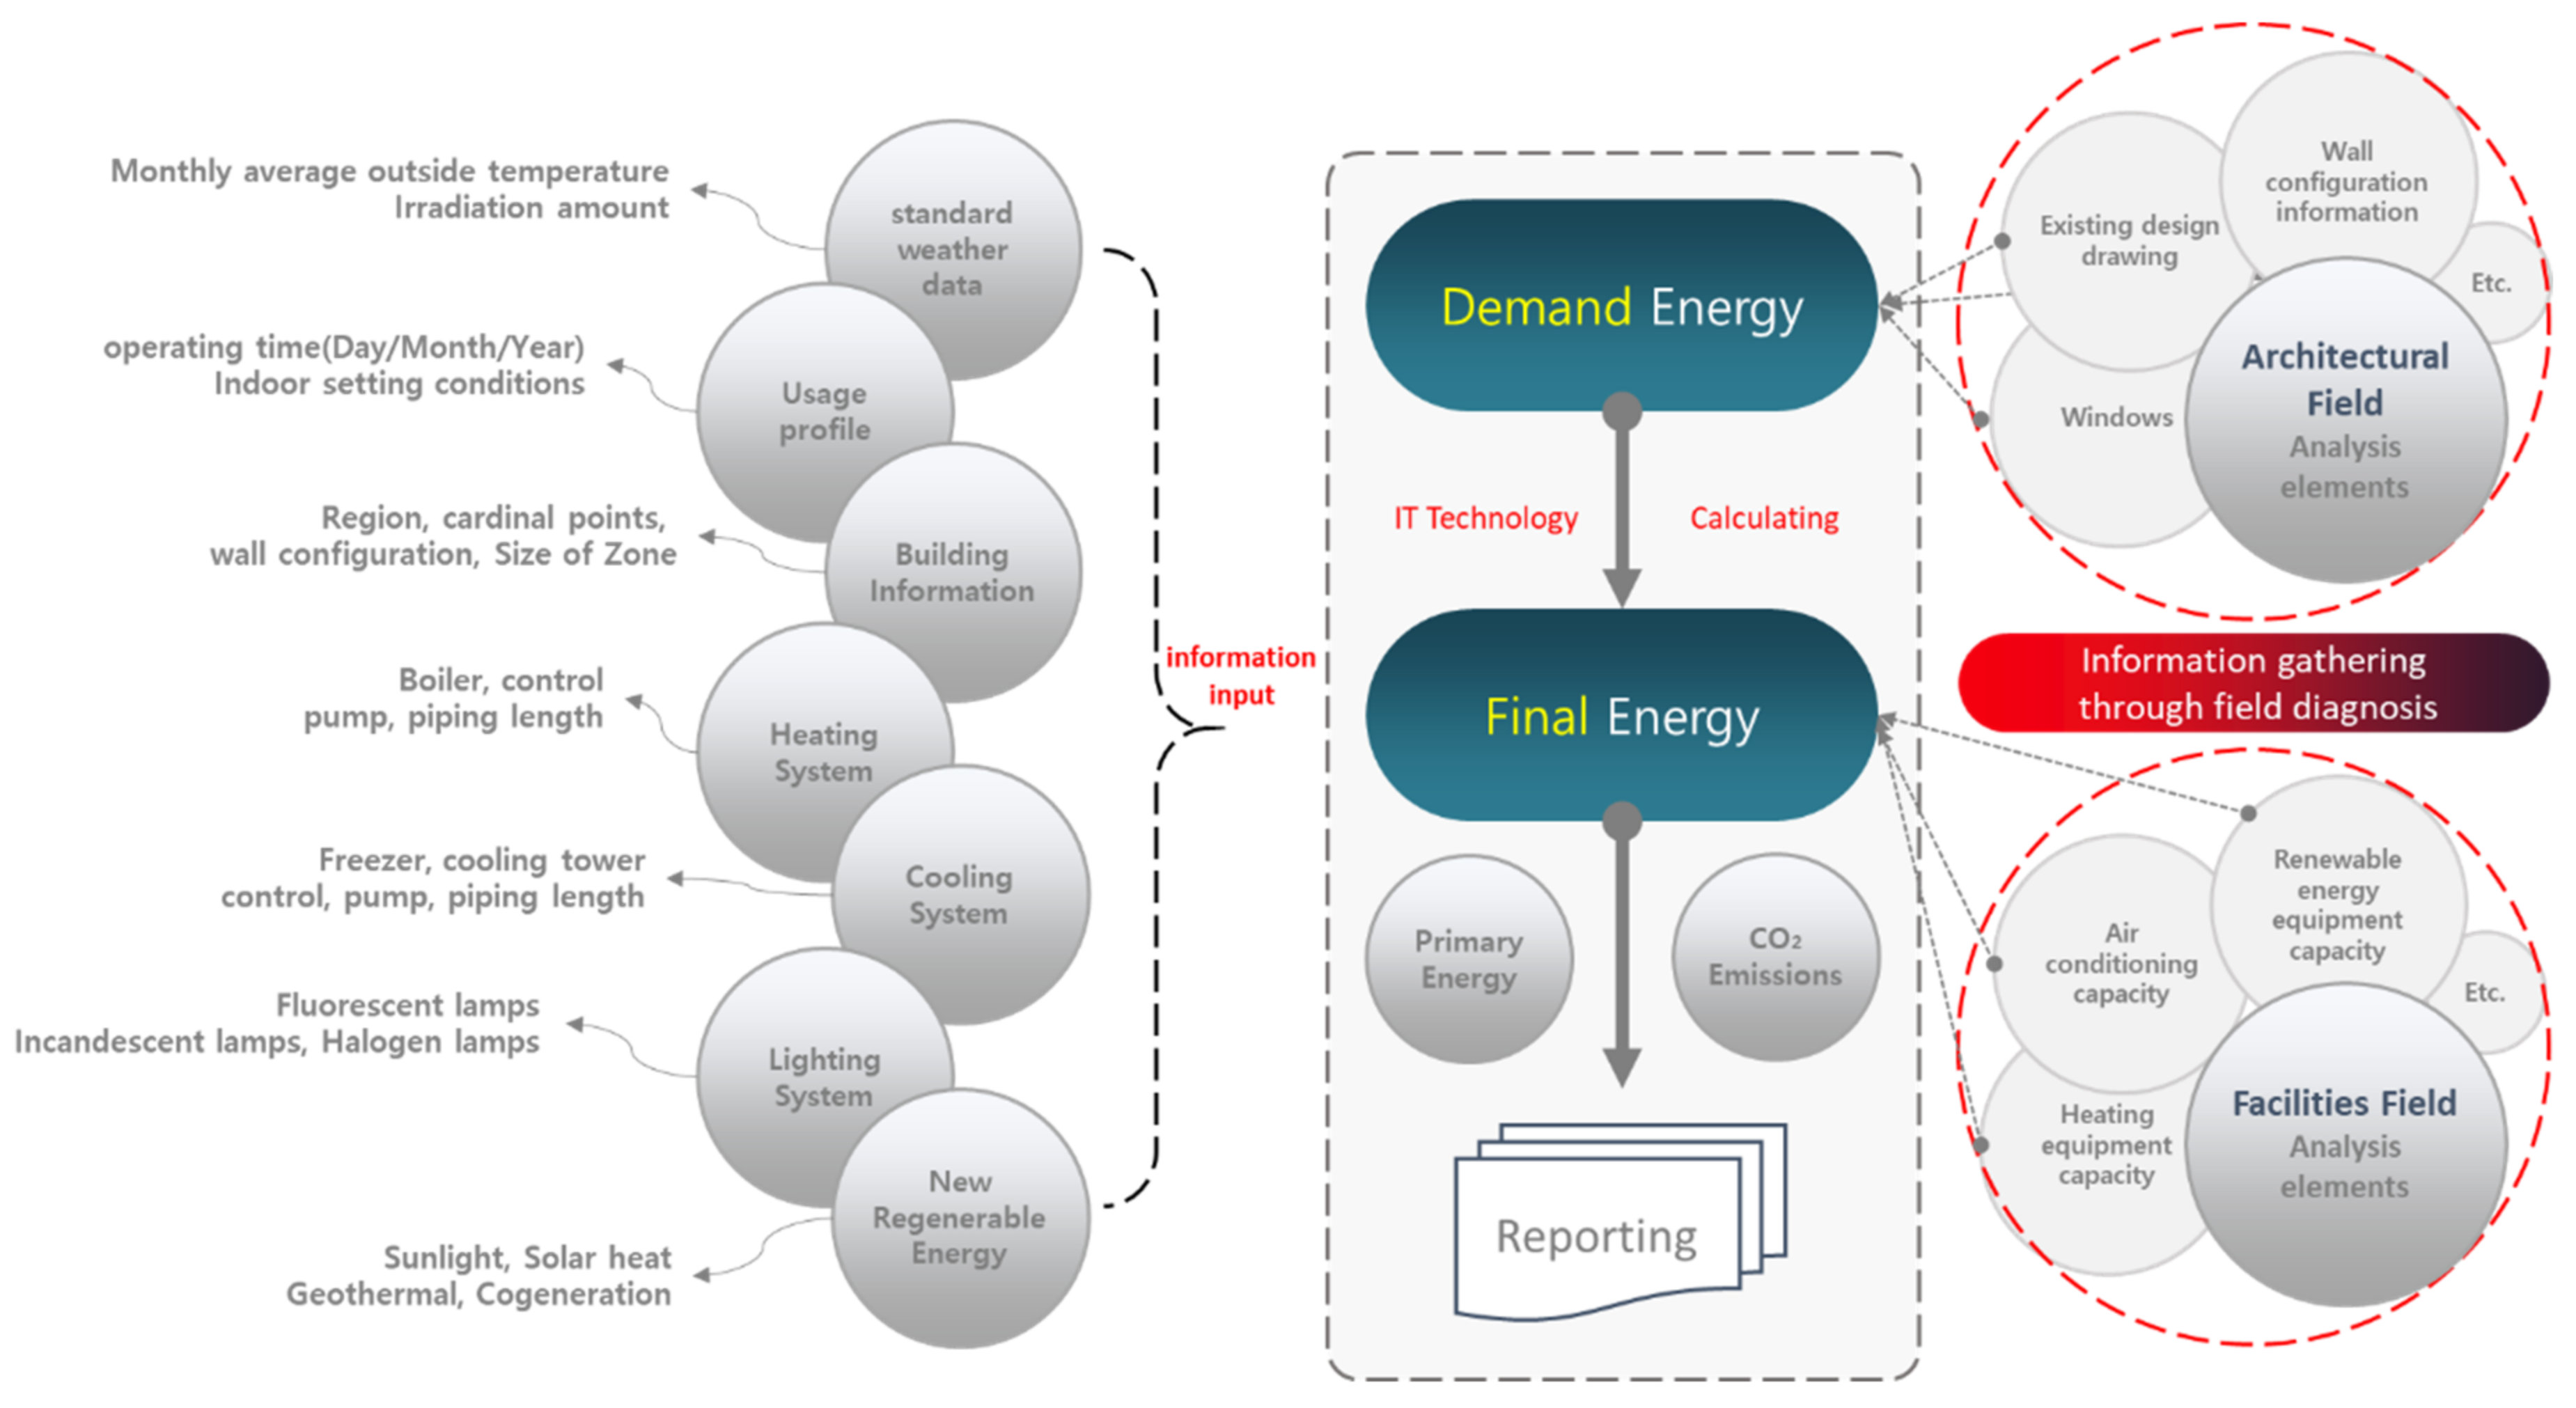
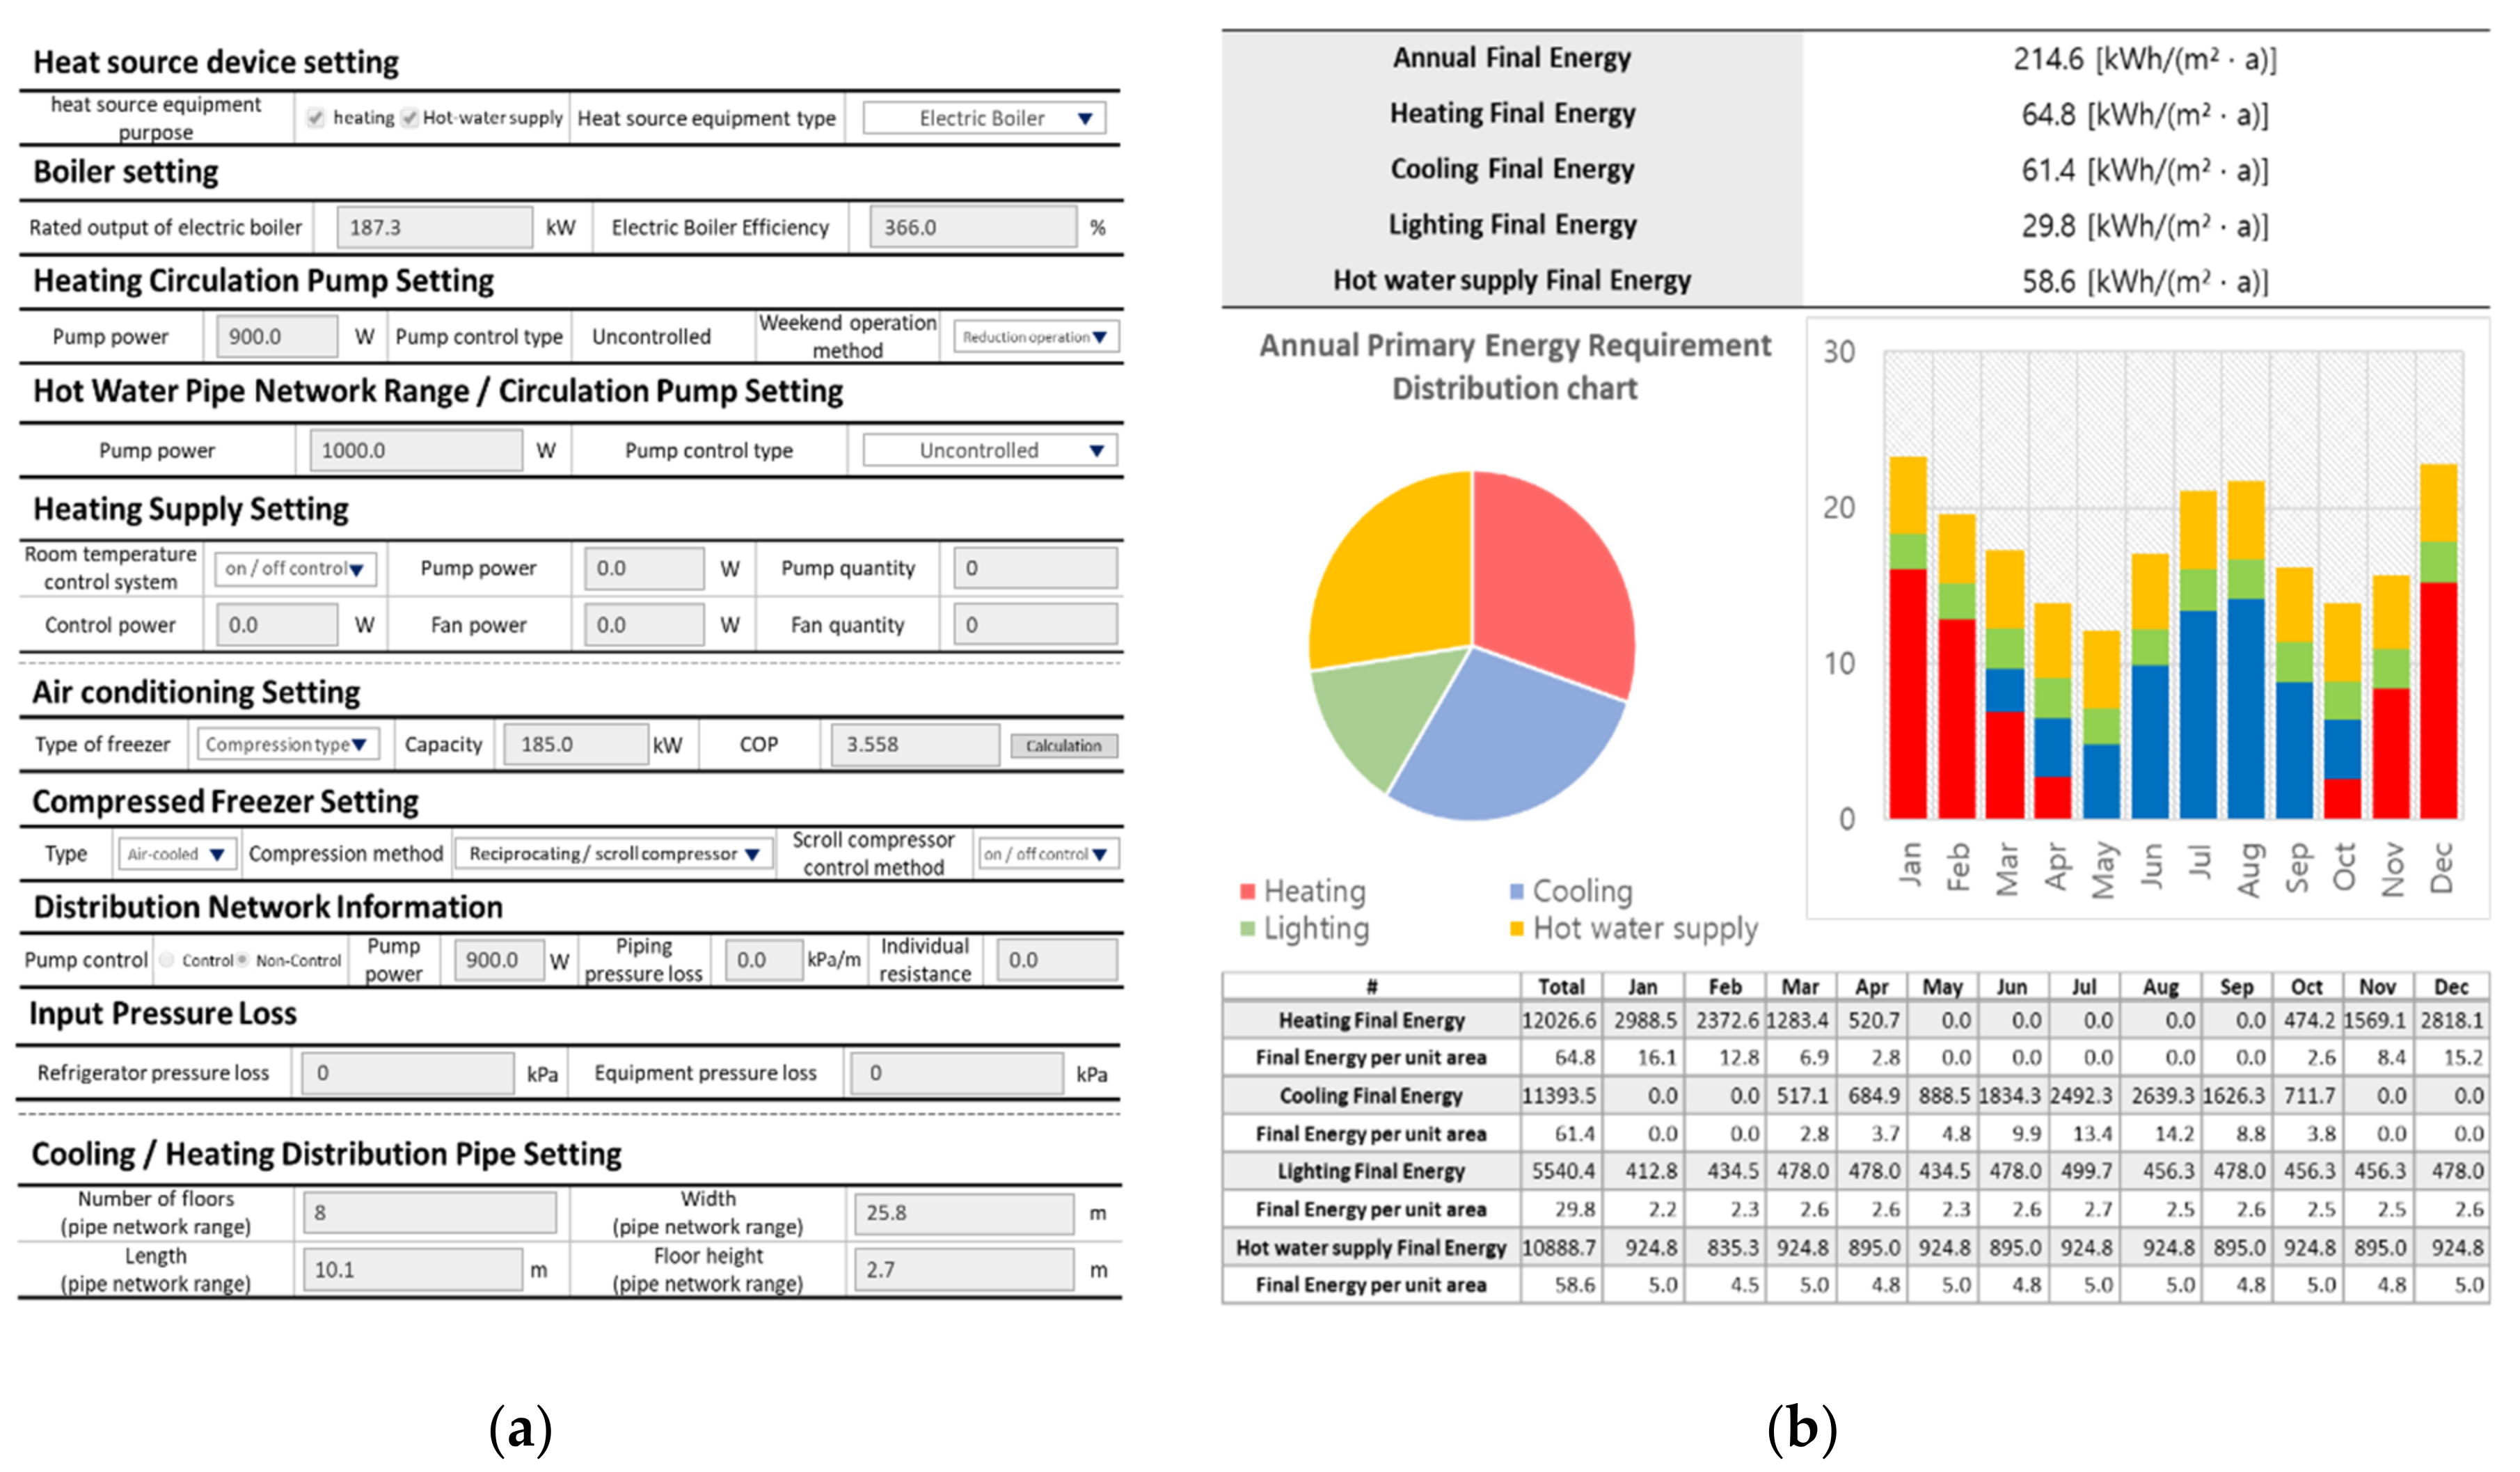
- Calculate the energy demand and final energy of an existing building from energy simulation as input for its structural data (Table 2).
- (3)
- Calibrate them with consideration paid to the actual energy usage, which is measured by the diagnostic smart meter (Figure 2).
- (4)
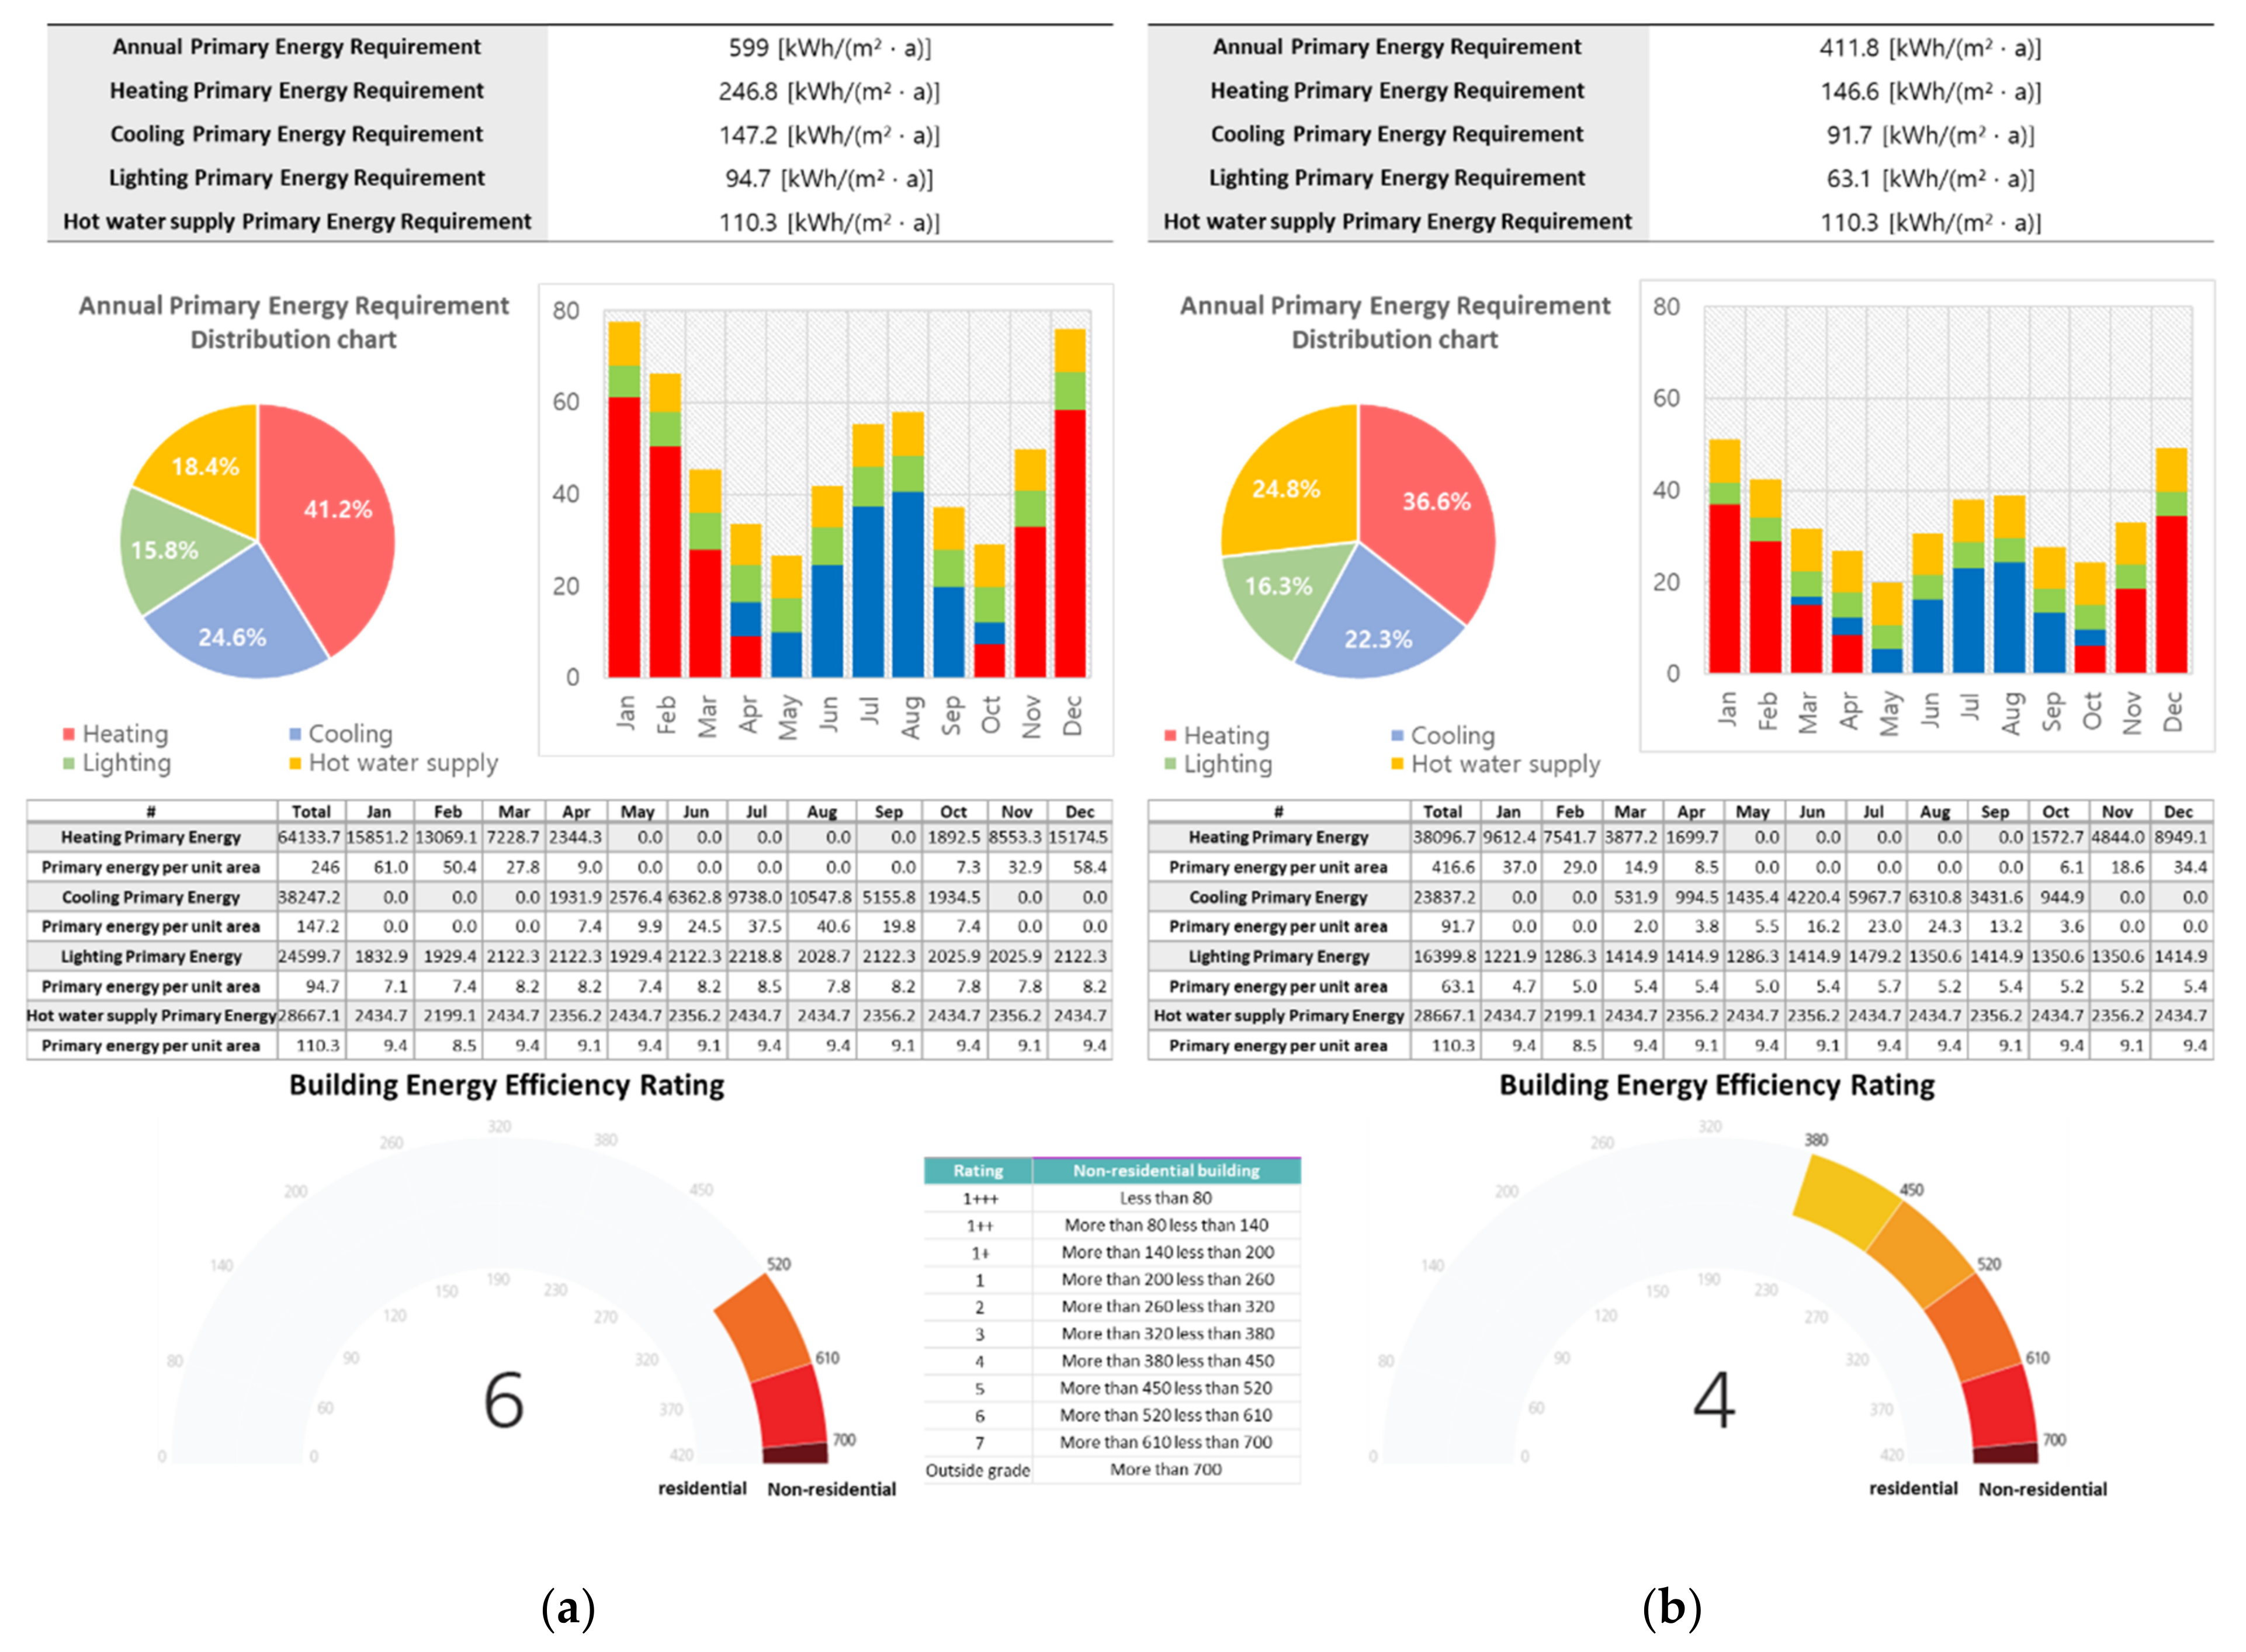
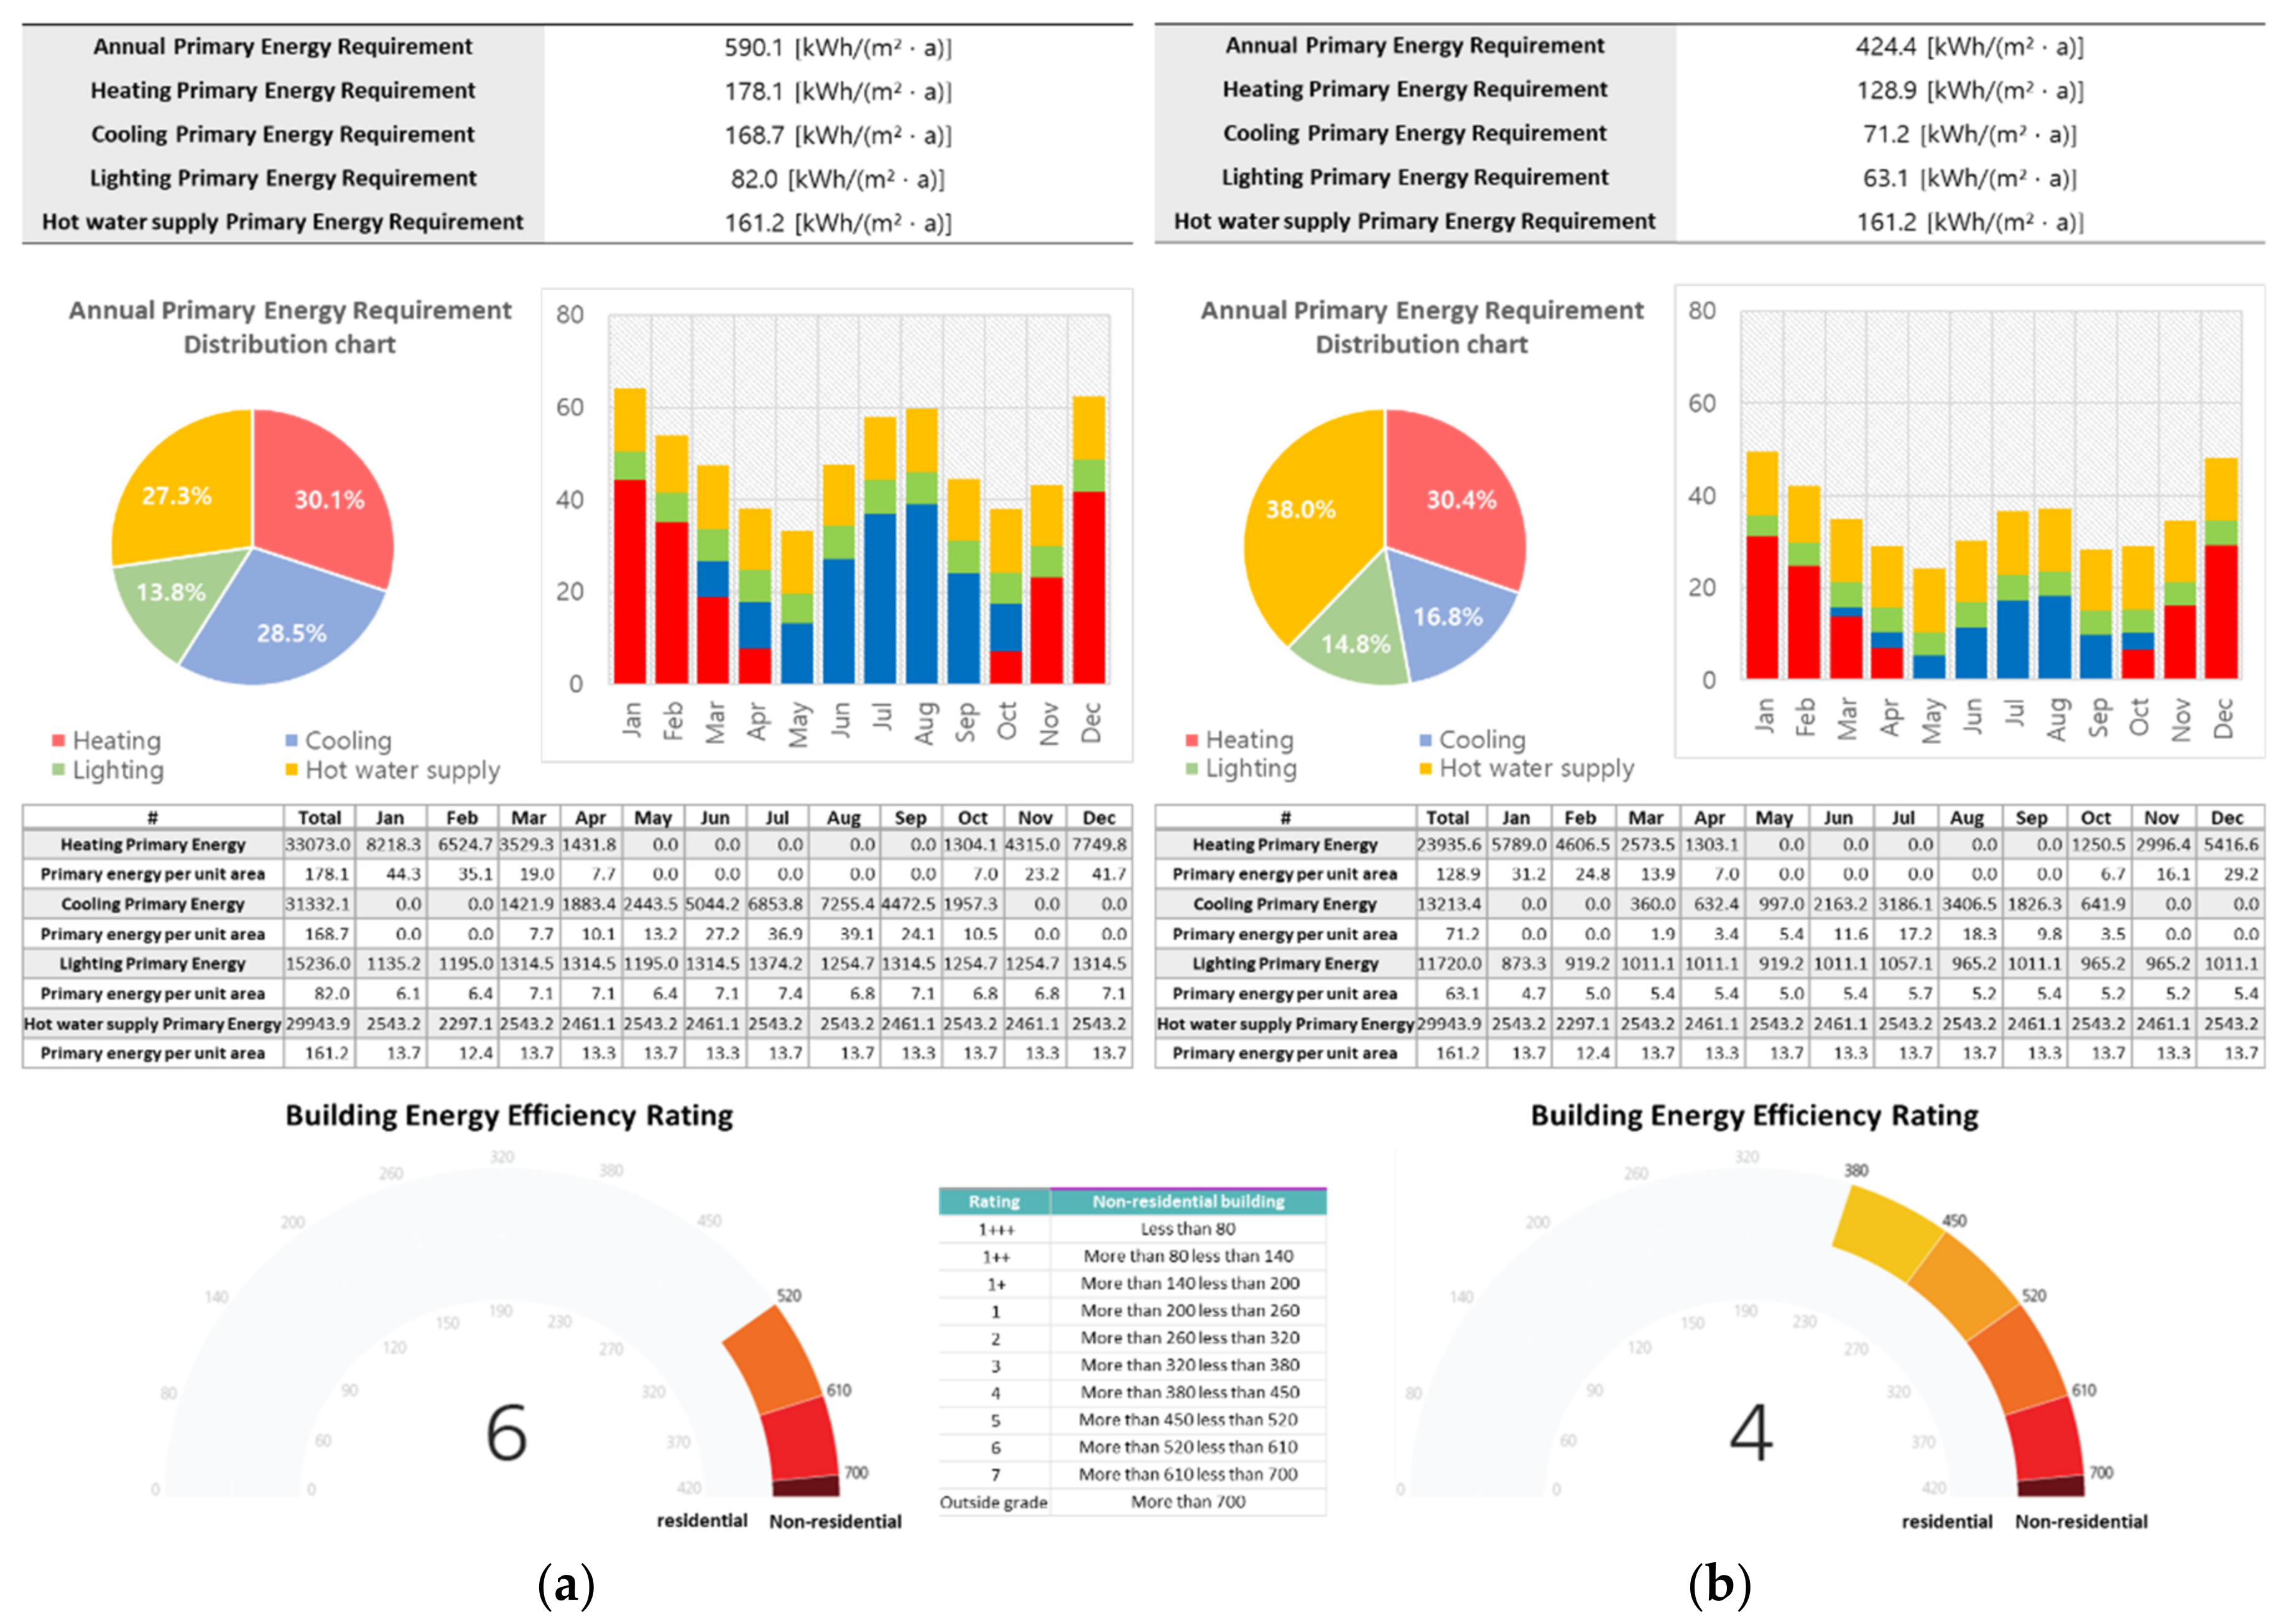
- Obtain the building’s final energy data after applying the conversion factor to the primary energy and then assign a building-energy efficiency rating according to grading system.
- (5)
- Recalculate energy demand, final energy, and primary energy of the building after enacting the building-energy efficiency improvement scenarios to secure an improved rating.
2.2. Energy Simulation
- is the heating energy demand for building zone (kWh)
- is the cooling energy demand for building zone (kWh)
- is the sum total of all heat sinks in the building zone (kWh)
- is the sum total of all heat sinks in the building zone (kWh)
- is the utilization factor of the heat sources
- is the heat transferred from the building elements into the building zone during periods of reduced operation on weekends and during holiday periods (kWh)
- is the generator heat output to the heating system in the building (kWh)
- is the control and emission loss of the heating system (kWh)
- is the distribution loss of the heating system (kWh)
- is the storage loss of the heating system (kWh)
- is the delivered energy for the heat generator (kWh)
- is the generation loss of the heating system to the installation space (kWh)
- is the quantity of regenerative energy used (kWh)
- is the heating primary energy for building zone (kWh)
- is the delivered energy for each energy service (kWh)
- is the primary energy factor
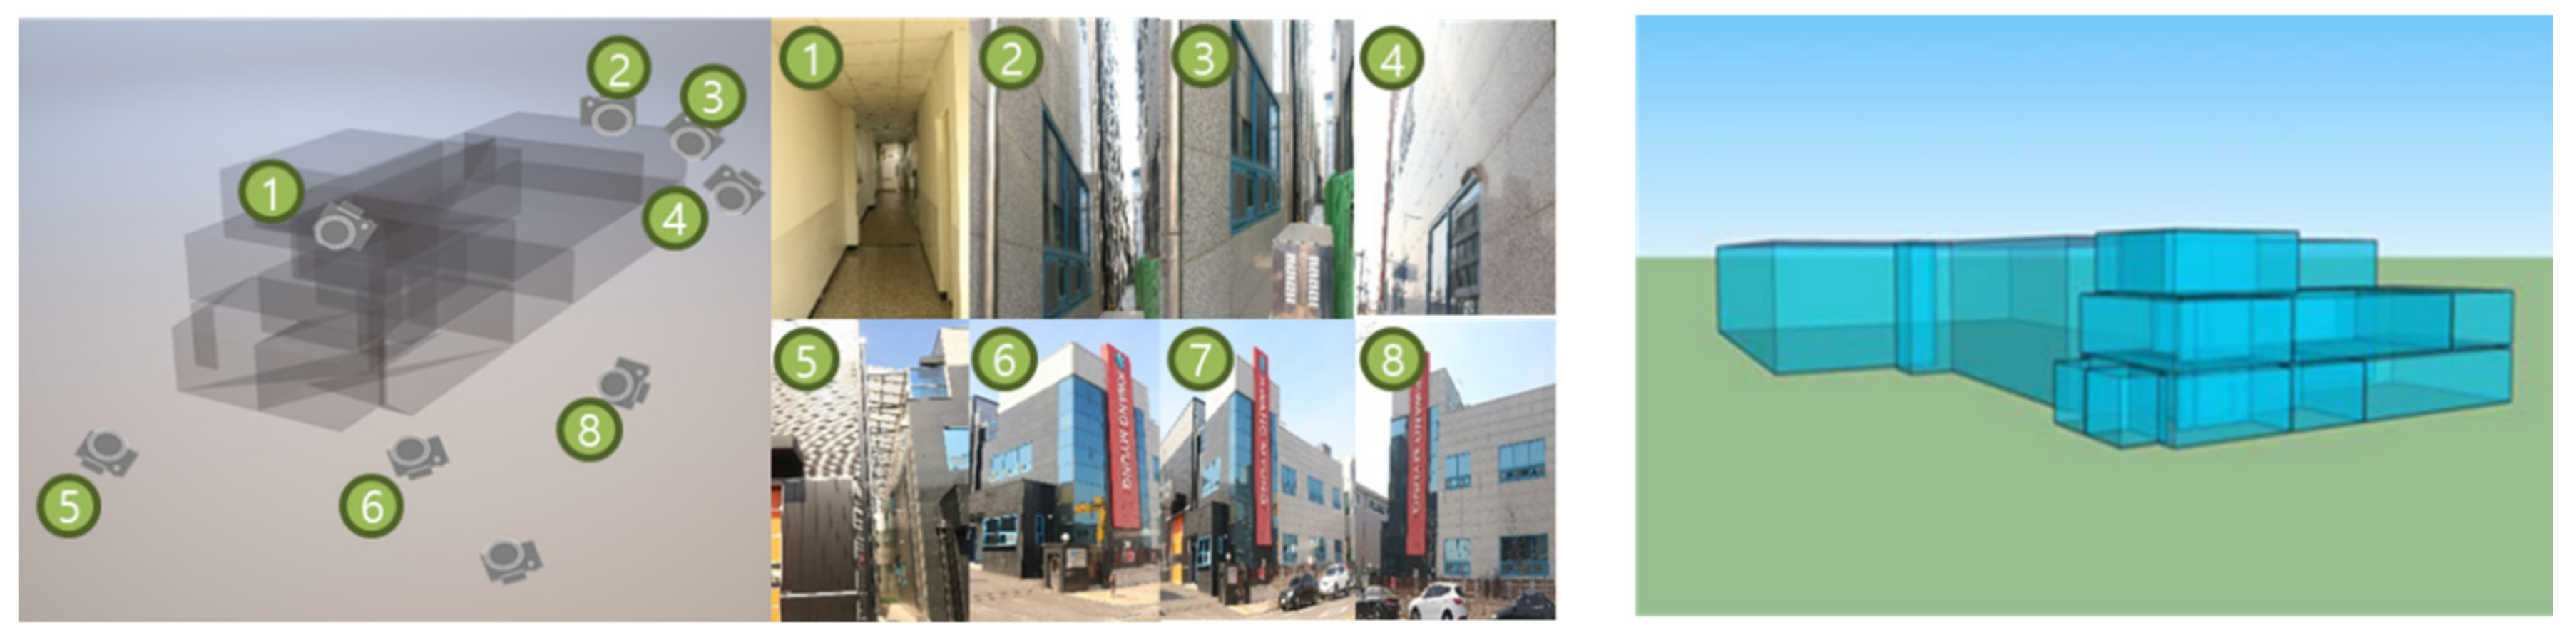
2.3. Close-Range Photogrammetry-Based 3D Models
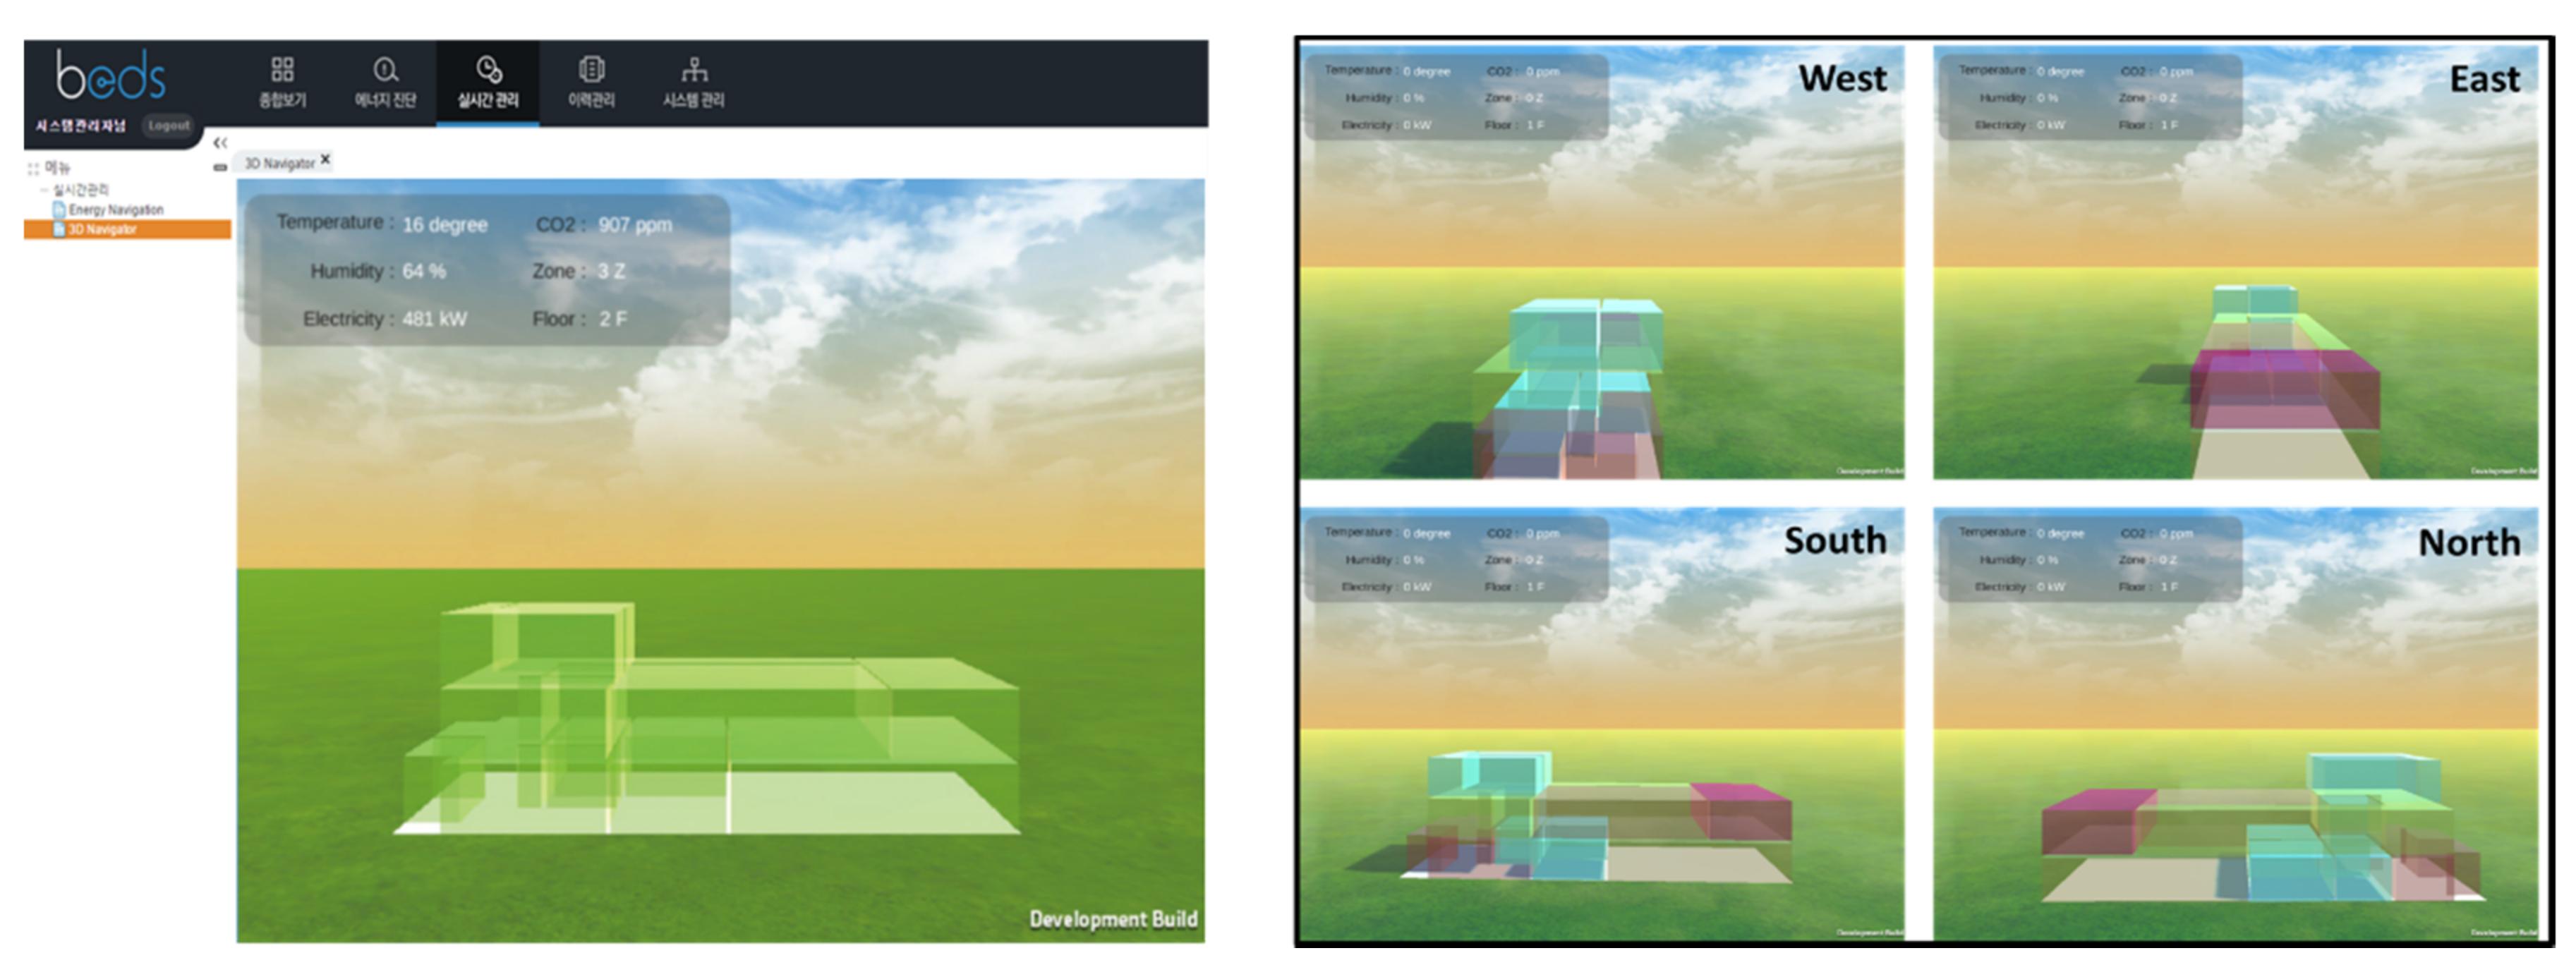
2.4. Information Visualization
3. Implementation
3.1. Testbeds
3.2. Build Cloud-Based Database
3.3. Diagnosis and Improvement of Building-Energy Performance
3.4. Close-Range Photogrammetric-Based 3D Models and Energy Visualization
3.5. Discussion
4. Conclusions
- The developed solution provides diagnosis information from a proposed energy simulation. In the solution, energy prediction information can be calculated and presented on a webpage via input numerical data according to actual or virtual change of architectural and facility information. When replacing with high-efficiency equipment, it is possible to provide reliable energy-saving information instead of ambiguous information through the simple input of the equipment information from all users.
- The energy diagnosis was performed on two testbeds and the results were analyzed. Based on the analyzed results, building energy improvement plans were applied and the energy saving rates were measured at about 30% and 28%, respectively.
- Although the solution does not automatically derive the optimum improvement direction of the building energy, it can show the energy-saving amount according to variable building improvement scenarios depending on the users. In the sense of the energy feedback, intuitive information supporting methods enhances user motivation to more effectively manage energy consumption.
- To increase the effect of this energy feedback, we developed a 3D visualization solution that can be also applied to buildings without architectural drawing information. Considering visualization is effective in energy feedback, intuitive and real-time measured information would likely have a positive impact on energy savings.
Author Contributions
Acknowledgments
Conflicts of Interest
References
- IEA. World Energy Outlook 2017; IEA publications: Paris, France, 2018; ISBN 978-92-64-28205-6. [Google Scholar]
- Intergovernmental Panel on Climate Change. Climate Change 2014: Synthesis Report; Intergovernmental Panel on Climate Change Publications: Geneva, Switzerland, 2014; ISBN 978-92-9169-143-2. [Google Scholar]
- Perez-Lombard, L.; Ortiz, J.; Pout, C. A Review on Buildings Energy Consumption Information. Energy Build. 2008, 40, 394–398. [Google Scholar] [CrossRef]
- John, P.; Jolanta, K.; Sonja, N. Disaster Risk Management and Climate Change Adaptation in Europe and Central Asia; Global Facility for Disaster Reduction and Recovery: Washington, DC, WA, USA, 2010. [Google Scholar]
- Thomas, V.; López, R. Global Increase in Climate-Related Disasters. SSRN 2015. [Google Scholar] [CrossRef] [Green Version]
- Conti, J.; Holtberg, P.; Doman, L.E.; Smith, K.A.; Sullivan, J.O.; Vincent, K.R.; Barden, J.L.; Martin, P.D.; Mellish, C.M.L.; Kearney, D.R.; et al. International Energy Outlook 2011; U.S. Energy Information Administration, Government Publication Office: Washington, DC, USA, 2011. [Google Scholar]
- Doukas, H.; Patlizianas, K.D.; Iatropoulos, K.; Psarrass, J. Intelligent building energy management system using rule sets. Build. Environ. 2007, 42, 3562–3569. [Google Scholar] [CrossRef]
- Jung, D.-K.; Lee, D.; Park, S. Energy Operation Management for Smart City using 3D Building Energy Information Modeling. Int. J. Precis. Eng. Manuf. 2014, 15, 1717–1724. [Google Scholar] [CrossRef]
- Mantha, B.R.K.; Menassa, C.C.; Kamat, V.R. A taxonomy of data types and data collection methods for building energy monitoring and performance simulation. Adv. Build. Energy Res. 2016, 10, 263–293. [Google Scholar] [CrossRef]
- Papanicolas, C.; Lange, M.A.; Flylaktos, N.; Montenon, A.; Kalouris, G.; Fintikakis, N.; Fintikaki, M.; Kolokotsa, D.; Tsirbas, K.; Pavlou, C.; Vasilakopoulou, K.; Santamouris, M. Design, construction and monitoring of a near-zero energy laboratory building in Cyprus. Adv. Build. Energy Res. 2014, 9, 140–150. [Google Scholar] [CrossRef]
- Kamari, A.; Corrao, R.; Kirkegaard, P.H. Sustainability focused decision-making in building renovation. Int. J. Sustain. Built Environ. 2017, 6, 330–350. [Google Scholar] [CrossRef]
- Liu, Y.; Liu, T.; Ye, S.; Liu, Y. Cost-benefit analysis for Energy Efficiency Retrofit of existing buildings: A case study in China. J. Clean. Prod. 2018, 177, 493–506. [Google Scholar] [CrossRef]
- Innovative Empire State Building Program Cuts $7.5M in Energy Costs over Past Three Years. Available online: http://www.webcitation.org/6zHIcXJGB (accessed on 14 August 2014).
- Darby, S. The Effectiveness of Feedback on Energy Consumption. A Review for DEFRA of the Literature on Metering, Billing and Direct Displays; Environmental Change Institute, University of Oxford: Oxford, UK, 2006. [Google Scholar]
- Darby, S. Energy feedback in buildings: Improving the infrastructure for demand reduction. Build. Res. Inf. 2008, 36, 499–508. [Google Scholar] [CrossRef]
- Ehrhardt-Martinez, K.; Donnelly, K.A.; Laitner, S. Advanced Metering Initiatives and Residential Feedback Programs: A Meta-Review for Household Electricity-Saving Opportunities; Technical Report E105; American Council for an Energy-Efficient Economy (ACEE): Washington, DC, USA, 2010. [Google Scholar]
- Lehrer, D.; Vasudev, J. Visualizing Energy Information in Commercial Buildings: A Study of Tools, Expert Users, and Building Occupants; Center for the Built Environment, University of California, Berkeley: Berkeley, CA, USA, 2011; pp. 1–41. [Google Scholar]
- Choi, M.K. Research Reports: A Study on the Apt Bill Redesign for Contributing to the Change of Energy Saving Behavior. J. Korean Soc. Des. Cult. 2011, 17, 583–598. [Google Scholar]
- Pahl, S.; Goodhew, J.; Boomsma, C.; Sheppard, S.R.J. The Role of Energy Visualization in Addressing Energy Use: Insights from the eViz Project. Front. Psychol. 2016, 7, 92. [Google Scholar] [CrossRef] [PubMed]
- Gardner, G.; Stern, P.C. Environmental Problems and Human Behavior, 2nd ed.; Pearson Custom Publishing: Boston, MA, USA, 2002. [Google Scholar]
- Kavanagh, D.J.; Andrade, J.; May, J. Imaginary relish and exquisite torture: The elaborated intrusion theory of desire. Psychol. Rev. 2005, 112, 446–467. [Google Scholar] [CrossRef] [PubMed]
- Wang, H.; Xu, P.; Lu, P.; Yuan, D. Methodology of comprehensive building energy performance diagnosis for large commercial buildings at multiple levels. Appl. Energy 2016, 169, 14–27. [Google Scholar] [CrossRef]
- Zhu, Y. Applying Computer-based Simulation to Energy Auditing: A Case Study. Energy Build. 2006, 38, 421–428. [Google Scholar] [CrossRef]
- Suh, W.J.; Park, C.S. Issues and Limitations on the Use of a Whole Building Simulation Tool for Energy Diagnosis of a Real-life Building. J. Archit. Inst. Korea 2012, 28, 273–283. [Google Scholar]
- Pisello, A.L.; Goretti, M.; Cotana, F. A method for assessing buildings’ energy efficiency by dynamic simulation and experimental activity. Appl. Energy 2012, 97, 419–429. [Google Scholar] [CrossRef]
- O’Neill, Z.; Pang, X.F.; Shashanka, M.; Haves, P.; Bailey, T. Model-based real-time whole building energy performance monitoring and diagnostics. J. Build. Perform. Simul. 2014, 7, 83–99. [Google Scholar] [CrossRef]
- Jradi, M. A dynamic energy performance-driven approach for assessment of buildings energy Renovation—Danish case studies. Energy Build. 2018, 158, 62–76. [Google Scholar] [CrossRef]
- Zhivov, A.M.; Case, M.; Liesen, R. Energy Master Planning Towards Net-Zero Energy Communities/Campuses. ASHRAE Trans. 2014, 120, 114–129. [Google Scholar]
- Lee, H.; Kim, S.; Kim, J.; Kim, J.; Jang, C. Analysis of the Building Energy Efficiency Rating Certified for Public Office Buildings. J. Korea Inst. Ecol. Archit. Environ. 2015, 15, 75–82. [Google Scholar] [CrossRef]
- Lee, A.R.; Kim, J.G.; Kim, J.H.; Jeong, H.G.; Jang, C.Y.; Song, K.D. Comparing the actual heating energy with calculated energy by the amended standard building energy rating system for apartment buildings. J. Korea Inst. Ecol. Archit. Environ. 2015, 15, 103–107. [Google Scholar] [CrossRef] [Green Version]
- Lee, D.; Cha, G.; Park, S. A Study on Data Visualization of Embedded Sensors for Building Energy Monitoring using BIM. Int. J. Precis. Eng. Manuf. 2016, 17, 807–814. [Google Scholar] [CrossRef]
- Crawley, D.B.; Hand, J.W.; Kummert, M.; Griffith, B.T. Contrasting the capabilities of building energy performance simulation programs. Build. Environ. 2008, 43, 661–673. [Google Scholar] [CrossRef] [Green Version]
- Kwak, H.J.; Jo, J.H.; Sub, S.J. Evaluation of the Reference Numerical Parameters of the Monthly Method in ISO 13790 Considering S/V Ratio. Sustainability 2015, 7, 767–781. [Google Scholar] [CrossRef] [Green Version]
- Cho, S.; Han, S.; Sung, U.; Kim, S. An Suggestion of Improvement Plan and Analysis of Comparison about the Energy Performance Evaluation Tools for Application of the Technical Package in Zero Energy Building. J. Korean Inst. Archit. Sustain. Environ. Build. Syst. 2017, 11, 319–330. [Google Scholar]
- Cho, S.; Leigh, S. Comparing Methodology of Building Energy Analysis—Comparative Analysis from steady—state simulation to data-driven Analysis. J. Korea Inst. Ecol. Archit. Environ. 2017, 17, 77–86. [Google Scholar] [CrossRef]
- Lee, A. The Comparison of Estimated Heating Energy Requirements and Actual Consumptions in Apartment Buildings According to the Changes in Building Energy Efficiency Rating System and Evaluation Tool in Korea. Master’s Thesis, Hanyang University, Seoul, Korea, 2015. [Google Scholar]
- Shin, J.; Gwon, K.; Lee, D.; Park, S. A study on CO2 emission calculation and reduction evaluation from operation of city facility. J. Korea Facil. Manag. Assoc. 2014, 9, 5–14. [Google Scholar]
- Shin, J.H.; Kim, S.S.; Cho, Y.H. An Analysis of the Heating and Cooling Energy Demand and Consumption According to the Mean Thermal Transmittance of External Wall. J. Korean Soc. Living Environ. Syst. 2016, 23, 104–112. [Google Scholar] [CrossRef]
- Truong, N.L.; Dodoo, A.; Gustavsson, L. Effects of energy efficiency measures in district-heated buildings on energy supply. Energy 2018, 142, 1114–1127. [Google Scholar] [CrossRef]
- Eicker, U.; Zirak, M.; Bartke, N.; Rodríguez, L.R.; Coors, V. New 3D model based urban energy simulation for climate protection concepts. Energy Build. 2018, 163, 79–91. [Google Scholar] [CrossRef]
- DIN Deutsches Institut für Normung e.V. Energy Efficiency of Buildings—Calculation of the Net, Final and Primary Energy Demand for Heating, Cooling, Ventilation Domestic Hot Water and Lighting—Part 1: General Balancing Procedures, Terms and Definitions, Zoning and Evaluation of Energy Sources; DIN V 18599-1; Beuth-Verlag: Berlin, Deutschland, 2011. [Google Scholar]
- Cabeza, L.F.; Palacios, A.; Serrano, S.; Ürge-Vorsatz, D.; Barreneche, C. Comparison of past projections of global and regional primary and final energy consumption with historical data. Renew. Sustain. Energy Rev. 2018, 82, 681–688. [Google Scholar] [CrossRef]
- Duro, J.A.; Padilla, E. Inequality across countries in energy intensities: An analysis of the role of energy transformation and final energy consumption. Energy Econ. 2011, 33, 474–479. [Google Scholar] [CrossRef] [Green Version]
- Reuter, M.; Patel, M.K.; Eichhammer, W. Applying ex-post index decomposition analysis to primary energy consumption for evaluating progress towards European energy efficiency targets. Energy Effic. 2017, 10, 1381–1400. [Google Scholar] [CrossRef] [Green Version]
- Dixit, M.K.; Culp, C.H.; Fernandez-Solis, J.S. Calculating primary energy and carbon emission factors for the United States’ energy sectors. RSC Adv. 2014, 4, 54200–54216. [Google Scholar] [CrossRef]
- Jiang, R.; Jauregui, D.V.; White, K.R. Close-range photogrammetry applications in bridge measurement: Literature review. Measurement 2008, 41, 823–834. [Google Scholar] [CrossRef]
- Jue, L. Research on close-range photogrammetry with big rotation angle. Int. Arch. Photogramm. Remote Sens. Spat. Inf. Sci. 2008, XXXVII, 157–162. [Google Scholar]
- Arias, P.; Ordonez, C.; Lorenzo, H.; Herraez, J.; Armesto, J. Low-cost documentation of traditional agro-industrial buildings by close-range photogrammetry. Build. Environ. 2007, 42, 1817–1827. [Google Scholar] [CrossRef]
- Taşçi, L. Deformation Monitoring in Steel Arch Bridges through Close-Range Photogrammetry and the Finite Element Method. Exp. Tech. 2015, 39, 3–10. [Google Scholar] [CrossRef]
- Cha, G.; Park, S. A study on information visualization using building information modeling. J. Korea Acad.-Ind. Coop. Soc. 2015, 16, 4170–4175. [Google Scholar] [CrossRef]
- Few, S. Tapping the Power of Visual Perception. Intelligent Enterprise, September 2004; 4–5. [Google Scholar]
- Korea Energy Economics Institute. The 11th Edition (2011) Energy Consumption Survey; Ministry of Knowledge Economy: Sejong-si, Korea, 2011. [Google Scholar]
- Swierstra, T.; Waelbers, K. Designing a Good Life: A Matrix for the Technological Mediation of Morality. Sci. Eng. Ethics 2012, 18, 156–172. [Google Scholar] [CrossRef] [PubMed]
- Moon, H.J.; Choi, M.S. Continuous commissioning through real-time simulation with a building energy monitoring system. Sens. Lett. 2014, 12, 967–973. [Google Scholar] [CrossRef]


| Rating | Residential Building | Nonresidential Building |
|---|---|---|
| Annual Primary Energy Per Unit Area (kWh/m² Year) | Annual Primary Energy Per Unit Area (kWh/m² Year) | |
| 1+++ | Less than 60 | Less than 80 |
| 1++ | More than 60 less than 90 | More than 80 less than 140 |
| 1+ | More than 90 less than 120 | More than 140 less than 200 |
| 1 | More than 120 less than 150 | More than 200 less than 260 |
| 2 | More than 150 less than 190 | More than 260 less than 320 |
| 3 | More than 190 less than 230 | More than 320 less than 380 |
| 4 | More than 230 less than 270 | More than 380 less than 450 |
| 5 | More than 270 less than 320 | More than 450 less than 520 |
| 6 | More than 320 less than 370 | More than 520 less than 610 |
| 7 | More than 370 less than 420 | More than 610 less than 700 |
| Field | Division | Item |
|---|---|---|
| Architecture | Architectural basic information | Building name, Location, Area, Bearing, Address, Floor |
| Architectural details | Wall Insulation type, Wall heat storage capacity, Night operation type, Weekend operation type, Heating method, Cooling method, Air leakage rate, Presence or absence of out-air control (OAC), Presence or absence of heat recovery ventilators, Light power density | |
| Wall/window information | Bearing, Wall area, Wall color, Window and door area | |
| Facility (heat source equipment) | Basic information | Use of heat source equipment, Heat source equipment type, Hot water supply temperature, Return water temperature |
| Boiler | Boiler type, Boiler operation method, Fuel used, Boiler rated output, Boiler efficiency, District heating type, Heat exchanger output, Heat exchanger efficiency, Rated output of electric boiler, Electric boiler efficiency | |
| Heating circulation pump | Pump power, Pump control type, Weekend operation type | |
| Hot water piping network/circulation pump | Pump power, Pump control type | |
| Heating supply | Room temperature control method, Control power, Pump power, Pump quantity, Fan power, Fan quantity | |
| Facility (cooling) air conditioning equipment information | Basic information | Refrigerator type, capacity, Coefficient of performance |
| Compressor freezer setting | Compression system, Scroll compressor control system, Cooling tower type, Coolant inlet temperature, Evaporative cooling tower type | |
| Air conditioning distribution setting | Heat transfer medium, Outlet temperature, Inlet temperature, Temperature difference | |
| Distribution network information | Pump control, Pump power, Piping pressure loss, Individual resistance | |
| Pressure loss type | Refrigerator pressure loss, Equipment pressure loss, Valve pressure loss | |
| Air conditioning distribution piping setup | Number of floors, Width, Length, Height |
| Category | EnergyPlus [32,34] | TRANSYS [32,35] | DOE-2 [32,35] | eQUEST [32,35] | |||
|---|---|---|---|---|---|---|---|
| Zone loads | Temperature | ○ | ○ | ||||
| Air flow | P | E | |||||
| Surface heat coefficient from Computational fluid dynamics | E | ||||||
| Internal thermal mass calculation | ○ | ○ | ○ | ○ | |||
| Dry bulb temperature | ○ | ○ | ○ | ||||
| Dew point temperature or humidity | ○ | ○ | ○ | ○ | |||
| Building envelope and daylighting | Outside surface convention algorithm | ○ | ○ | ○ | |||
| Inside radiation view factors | ○ | ○ | |||||
| Radiation-to-air component from convection (exterior) | ○ | ○ | ○ | ||||
| Solar gain and daylighting calculations | ○ | ○ | |||||
| Infiltration | Single-zone infiltration | ○ | ○ | ○ | ○ | ||
| ○: available and in common use | P: partially implemented | E: requires domain expertise | |||||
| Testbed 1 | Testbed 2 | |||
|---|---|---|---|---|
| Building purpose | Business Facilities/Neighborhood facilities | Business facilities | ||
| Location | Yeongmal-ro, Eunpyeong-gu, Seoul, Republic of Korea | Danwon-gu, Ansan-si, Gyeonggi-do, Seoul, Republic of Korea | ||
| Building area | Total floor area | 1889 m2 | Total floor area | 2517 m2 |
| Number of floors | 5th floor | Number of floors | 2nd floor | |
| View of the building | Panel board | View of the building | Panel board | |
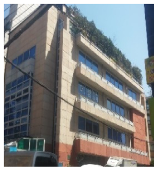 | 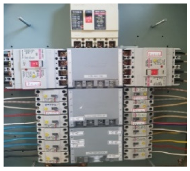 |  |  | |
| Field | Element | Input Field | Changes |
|---|---|---|---|
| Building | Performance type | Shell heat conduction ratio | Applying current legal standards (1 year → 17 years) |
| Equipment | Lighting equipment | Light density | When LED is applied (15 W/m2 → 10 W/m2) |
| Heat source equipment | Efficiency (COP) | Energy consumption efficiency first-grade product application | |
| Conveying equipment | Not applicable | Individual heating and cooling | |
| Heat recovery | Not applicable | Individual heating and cooling |
© 2018 by the authors. Licensee MDPI, Basel, Switzerland. This article is an open access article distributed under the terms and conditions of the Creative Commons Attribution (CC BY) license (http://creativecommons.org/licenses/by/4.0/).
Share and Cite
Oh, T.-K.; Lee, D.; Park, M.; Cha, G.; Park, S. Three-Dimensional Visualization Solution to Building-Energy Diagnosis for Energy Feedback. Energies 2018, 11, 1736. https://doi.org/10.3390/en11071736
Oh T-K, Lee D, Park M, Cha G, Park S. Three-Dimensional Visualization Solution to Building-Energy Diagnosis for Energy Feedback. Energies. 2018; 11(7):1736. https://doi.org/10.3390/en11071736
Chicago/Turabian StyleOh, Tae-Keun, Donghwan Lee, Minsoo Park, Gichun Cha, and Seunghee Park. 2018. "Three-Dimensional Visualization Solution to Building-Energy Diagnosis for Energy Feedback" Energies 11, no. 7: 1736. https://doi.org/10.3390/en11071736