Article

Preparation and Evaluation of a Coconut Shell-Based Activated Carbon for CO2/CH4 Separation

by
Amna Abdeljaoued
1,2,*,
Nausika Querejeta
3,
Inés Durán
3,
Noelia Álvarez-Gutiérrez
3,
Covadonga Pevida
3 and
Mohamed Hachemi Chahbani
1,4
1
LR11ES54-Laboratory of “Chemical Processes and Industrials Systems”, University of Gabes, Gabès 6029, Tunisia
2
National School of Engineers of Gabes (ENIG), University of Gabes, Omar Ibn Elkhattab Street, Zrig, Gabès 6029, Tunisia
3
Instituto Nacional del Carbón, INCAR-CSIC, c/Francisco Pintado Fe 26, 33011 Oviedo, Spain
4
Higher Institute of Applied Sciences and Technology of Gabes, University of Gabes, Omar Ibn Elkhattab Street, Zrig, Gabes 6029, Tunisia
*
Author to whom correspondence should be addressed.
Energies 2018, 11(7), 1748; https://doi.org/10.3390/en11071748
Submission received: 7 June 2018 / Revised: 24 June 2018 / Accepted: 29 June 2018 / Published: 3 July 2018
(This article belongs to the Special Issue Biomass Chars: Elaboration, Characterization and Applications Ⅱ)

Abstract

:
Biomass is a widely distributed and renewable source of carbon. The main objective of this work is to produce an activated carbon from coconut shells with suitable characteristics to separate CO2 from biogas. The textural characterization of the adsorbent has been determined. Pure component adsorption isotherms of CO2 and CH4 at 30, 50 and 70 °C have been measured. The results reveal that the activated carbon had high CO2 adsorption capacity. Equilibrium of adsorption of CO2 and CH4 adsorption on the produced activated carbon reached 8.36 mmol/g and 4.63 mmol/g, respectively, at 30 °C and 10 bars. Moreover, the performance of the produced activated carbon, as a potential adsorbent for CO2 capture from a CO2/CH4 gas mixture, has been evaluated under dynamic conditions in a dedicated fixed-bed setup. The CO2 and CH4 adsorption capacities of the produced activated carbon are estimated to be 1.86 and 0.52 mol/kg, respectively, at 30 °C and 1 bar.

1. Introduction

Biogas is a biofuel that is naturally produced by the decomposition of various types of organic matter. Upgrading of biogas has gained important attention due to the steady growth in global energy demand, coupled with the depletion of fossil fuel resources, their unaffordable prices, and the environmental damage they cause [1,2,3].
Methane and carbon dioxide are the main components of biogas. The energy value of biogas is much lower than natural gas due to the presence of carbon dioxide. Thus, to increase its heating value, the carbon dioxide content must be reduced. From the economic side, the CO2 removal is the most important step in biogas upgrading.
Capture and storage of CO2 has gained an important place in efforts to reduce greenhouse gas emissions [4,5].
Key economic and environmental factors promote the development of energy-efficient CO2 separation technologies [6].
Among the various processes proposed to remove CO2 from biogas, namely adsorption, absorption, membrane and cryogenic separation, pressure swing adsorption (PSA) processes are often used [7,8,9,10,11,12,13].
The selection of the adsorbent is a key factor for the efficient operation of a PSA unit. The properties of the adsorbents are one of the most important aspects of unit performance for a determined cycle configuration [14]. Many solid adsorbents have been investigated for the separation of CO2 from gas effluents, such as zeolites, calcium oxides, activated carbons, hydrotalcites, metal–organic framework (MOF) materials and supported amines [15,16,17,18,19,20]. Over the past few decades, the use of biomass to prepare carbon-based materials to reduce greenhouse gas emissions has attracted special attention [21,22,23,24,25,26].
In general, activated carbons can be synthesized from a wide range of biomass materials given that they present low levels of inorganic compounds (ash content) and high carbon content. Many carbon-based materials such as peat, wood, lignite, coal and nut shells are being used in the production of commercial activated carbons. The (CNS) is characterized with high lignin, high carbon content and low ash content; these properties make the material suitable for the production of microporous activated carbons [27,28].
Two conventional methods for biomass activation have been reported: physical and chemical activation procedure [29,30].
Chemical activation is considered an ineffective environmental procedure as it uses solvents to dissolve reagents, extract and wash products, separate mixtures, clean reaction apparatus and disperse products for practical applications. On the contrary, physical activation is ecological in relation to chemical activation. In the present work, a physical activation method using a single step was selected.
The activated carbon produced can be found in pellet, powder or granular form [31,32,33]. The main purpose of this work is to produce an activated carbon from dry CNS utilizing a physical activation procedure and to evaluate the textural characteristics and the performance of the produced adsorbent for CO2 separation from biogas effluents.

2. Material and Methods

2.1. Precursor Material

CNS was selected as carbon-based material for the production of the activated carbon. The carbon material was ground and sieved and particles between 1 and 3 mm were selected. The UNE 32-004-84 standard was adopted to conduct the proximate analysis using a thermogravimetric analyser TAG24 Ultimate analyses were carried out in a LECO VTF-900 and in a LECO CHNS-932, respectively.
The non-isothermal mass-loss profile of the precursor material in carbon dioxide atmosphere was determined using a thermogravimetric analyzer Setaram TGA92 (France) in order to elucidate optimal activation time and temperature.
The raw CNS was introduced in a platinum crucible (70 μL) and was dried for one hour at 100 °C in nitrogen flow; then a carbon dioxide (activating agent) flow (50 mL/min) was used to heat up the sample up to 1000 °C using a heating rate of 15 °C/min and kept at this final temperature during 30 min.

2.2. Activated Carbon Production

Once the activation conditions were selected, the production of the activated carbon was initiated. A vertical tubular kiln was used for that purpose. The raw CNS was introduced in a quartz jacketed reactor and then placed in the vertical tubular kiln. The experimental set-up has been described elsewhere [34].
After a drying step, the reactor was cleaned with N2 flow for 30 min at ambient temperature and a CO2 gas flow rate of 100 mL/min was used to heat up the system up to 900 °C at a heating rate of 10 °C/min. A thermocouple was placed in the reactor to control the temperature variation. The sample was kept at this temperature in carbon dioxide atmosphere for 73 min. Then the gas was shifted to nitrogen and the sample was cooled down to ambient temperature.
The adsorption capacity of CO2 of the synthetized activated carbon was tested in a TGA 92 thermogravimetric analyzer from Setaram following the procedure described elsewhere [35].
The produced activated carbon particles between 1 and 2 mm were selected for this study. A Micromeritics ASAP 2010 was used for the characterization of the adsorbent by N2 physical adsorption at −196 °C. A Micromeritics TriStar 3000 volumetric apparatus was used to assess the CO2 adsorption at 0 °C.
Before gas adsorption experiments, the sample was purged overnight at 100 °C under vacuum. The N2 adsorbed quantity, at a relative pressure of 0.99, was used to calculate the total pore volume (Vp). The Brunauer–Emmett–Teller (BET) equation was used to estimate the apparent surface area using the N2 adsorption isotherms at −196 °C [36]. The helium density was determined using an Accupyc 1330 equipment at 35 °C. The micropore volume (W0) was calculated using Dubinin–Radushkevich (DR) and Dubinin–Astakhov (DA) equations [37] .The average micropore width was estimated by means of the Stoeckli–Ballerini relation [38]. A Micromeritics Autopore IV 9500 mercury porosimeter was used to calculate the apparent density at 0.1 MPa.

2.3. Adsorption Isotherms

To evaluate the performance of the prepared adsorbent for biogas upgrading, adsorption isotherms of pure CO2 and CH4 experiments were conducted using a high-pressure magnetic suspension balance, Rubotherm-VTI.
Three temperatures (30, 50 and 70 °C) and pressure up to 10 bars were selected for the study. Before the adsorption experiment, the sample (approximately 1 g) was placed in the measuring cell, which was dried at 100 °C for 120 min under vacuum. The temperature was then decreased to the desired temperature, and pressurized with pure CO2 or CH4 gas. When equilibrium was achieved, the weight variation of the sample, the pressure and temperature were collected. Experiments with helium were performed to account for the buoyancy correction. CO2 and CH4 absolute quantity adsorbed at pressures up to 10 bars were calculated based on the procedure mentioned in a precedent work [39].

2.4. Breakthrough Measurements

To study the performance of the synthesized activated carbon for CO2/CH4 separation under dynamic conditions, breakthrough measurements of an equimolar gas mixture were performed in a lab-scale fixed-column packed with 5.914 g of adsorbent material. The experimental set-up is described in detail elsewhere [40].
The amount of gas flow at the exit of the fixed bed was measured using a mini CORIFLOW meter from Bronkhorst. The concentration of the outlet gas was assessed using a dual-channel micro-gas chromatograph, Varian CP-4900, fitted with a thermal conductivity detector (TCD).
The column was filled with the CNS adsorbent to evaluate the CO2/CH4 adsorption under dynamic conditions. An equimolar biogas CO2/CH4 gas mixture was fed (30 mL/min STP) to the column and the performance of the sample was evaluated under isothermal conditions (30 °C) at 1 bar. The adsorbed gases were completely desorbed by flowing 50 mL/min STP of He and increasing the column temperature to 180 °C at 1 bar.
Adsorption–desorption cycles were carried out to explore the reproducibility of the system, where adsorption was maintained until saturation was achieved and desorption was carried out until the adsorbent bed was totally regenerated. For the adsorption step, the concentrations of CO2 and CH4 in the bed effluent gas were incessantly controlled as a time-depending function (breakthrough curve), and for dynamic equilibrium, the capacity of adsorption of adsorbent was determined when the concentration of CO2 is equal to that of the feed.
Breakthrough time, tb, defined as the time required for the detection of CO2 at the exit of the column, and the adsorption capacity of CO2 at equilibrium, were calculated as the average of the values obtained from the six successive cycles [34].

3. Results and Discussion

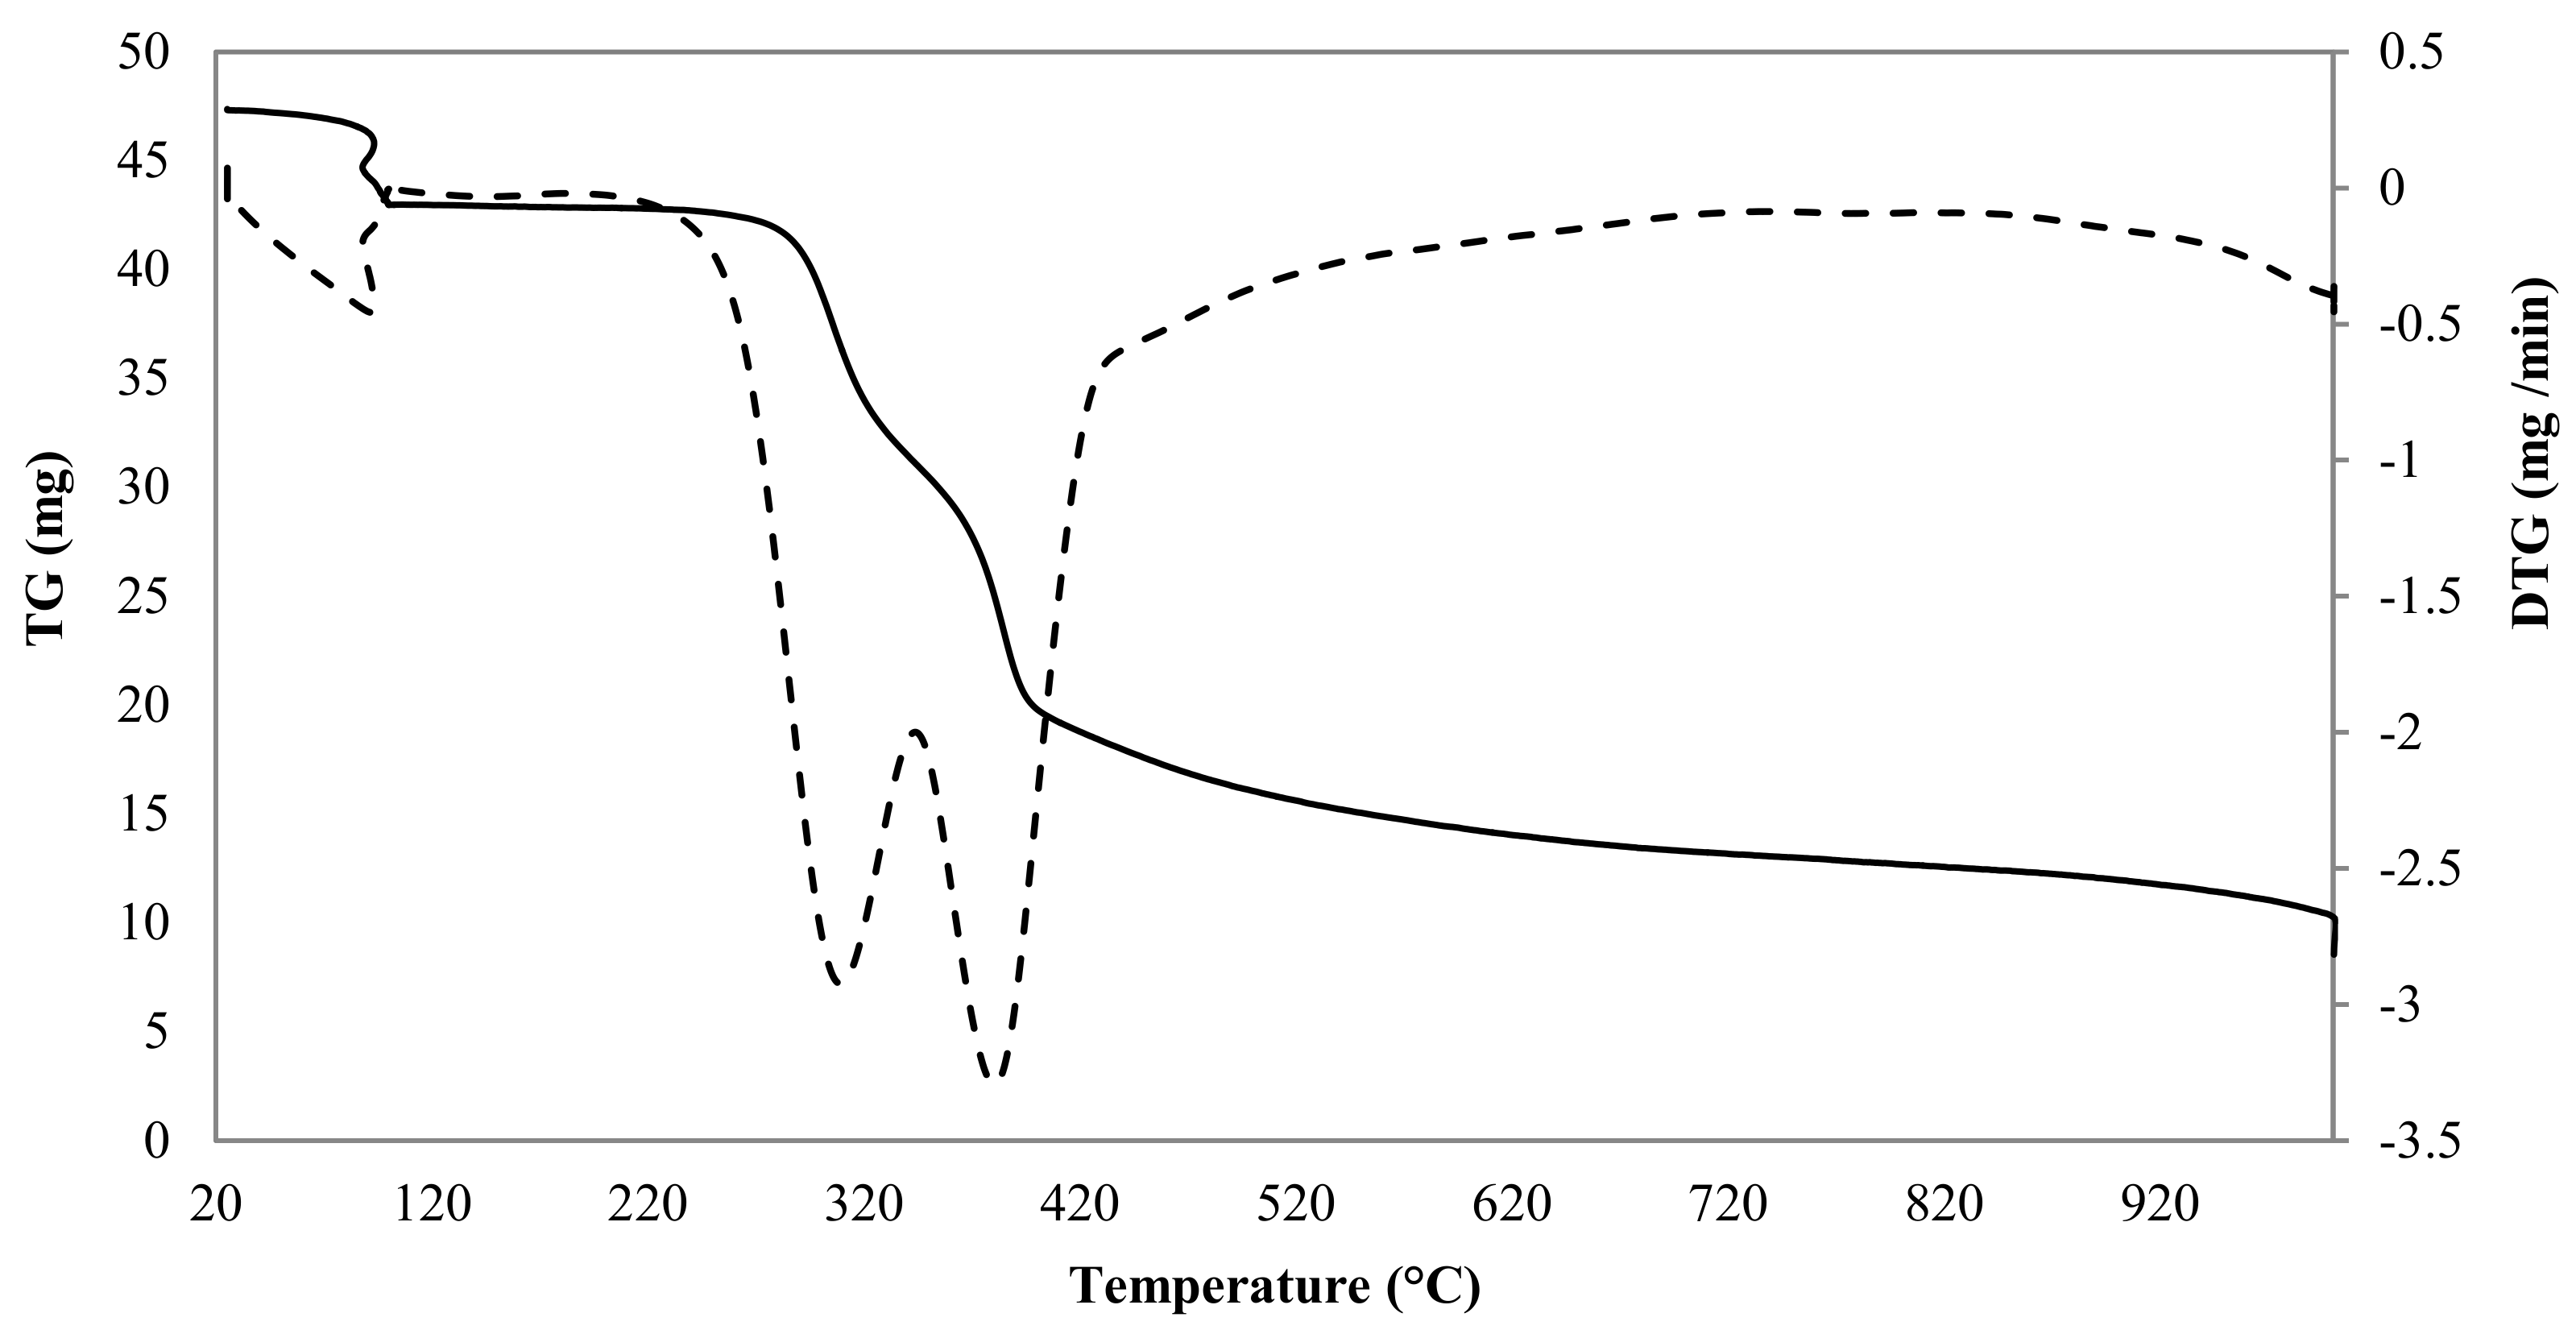
3.1. Precursor Material

The data obtained from the proximate and ultimate analyses of CNS are summarized in Table 1. Proximate analysis shows that CNS are characterized by low ash content (0.42 wt.%), which is a desirable feature for activated carbon production. Ultimate analysis shows that the raw material possesses a high carbon content (i.e., 51.6 wt.%) and low hydrogen and oxygen contents. In addition, the absence of sulfur in the raw material eliminates the possibility of sulfur dioxide emission during the production process. These data make CNS a promising material to be utilized as an activated carbon precursor.
Weight loss of the CNS during heat treatment under carbon dioxide is presented in Figure 1. This figure indicates that the greater weight losses for (CCS) mainly occur between 27 and 627 °C. The first mass loss at 100 °C corresponds to humidity and other guest molecules adsorbed on the material. Waste agricultural biomass commonly consists of cellulose, hemi-cellulose and lignin. The second and third peaks in the derivative of the thermogravimetric (TG) curve (DTG curve) represent the fragmentation of hemi-cellulose and that of cellulose, respectively.
According to the experimental results of the weight-loss profile, the activation temperature was set at 900 °C and three activation times were selected, 35, 73 and 115 min, which correspond to the following yields, as estimated from Equation (1): 21.51, 16.92, and 10.47%, respectively.
Y i e l d   ( % )   = ( m a s s   of   the   sample   after   activation   ( g ) i n i t i a l   m a s s   of   dried   sample   ( g )   ) × 100

3.2. (CNS )Activated Carbon Characterization and Evaluation

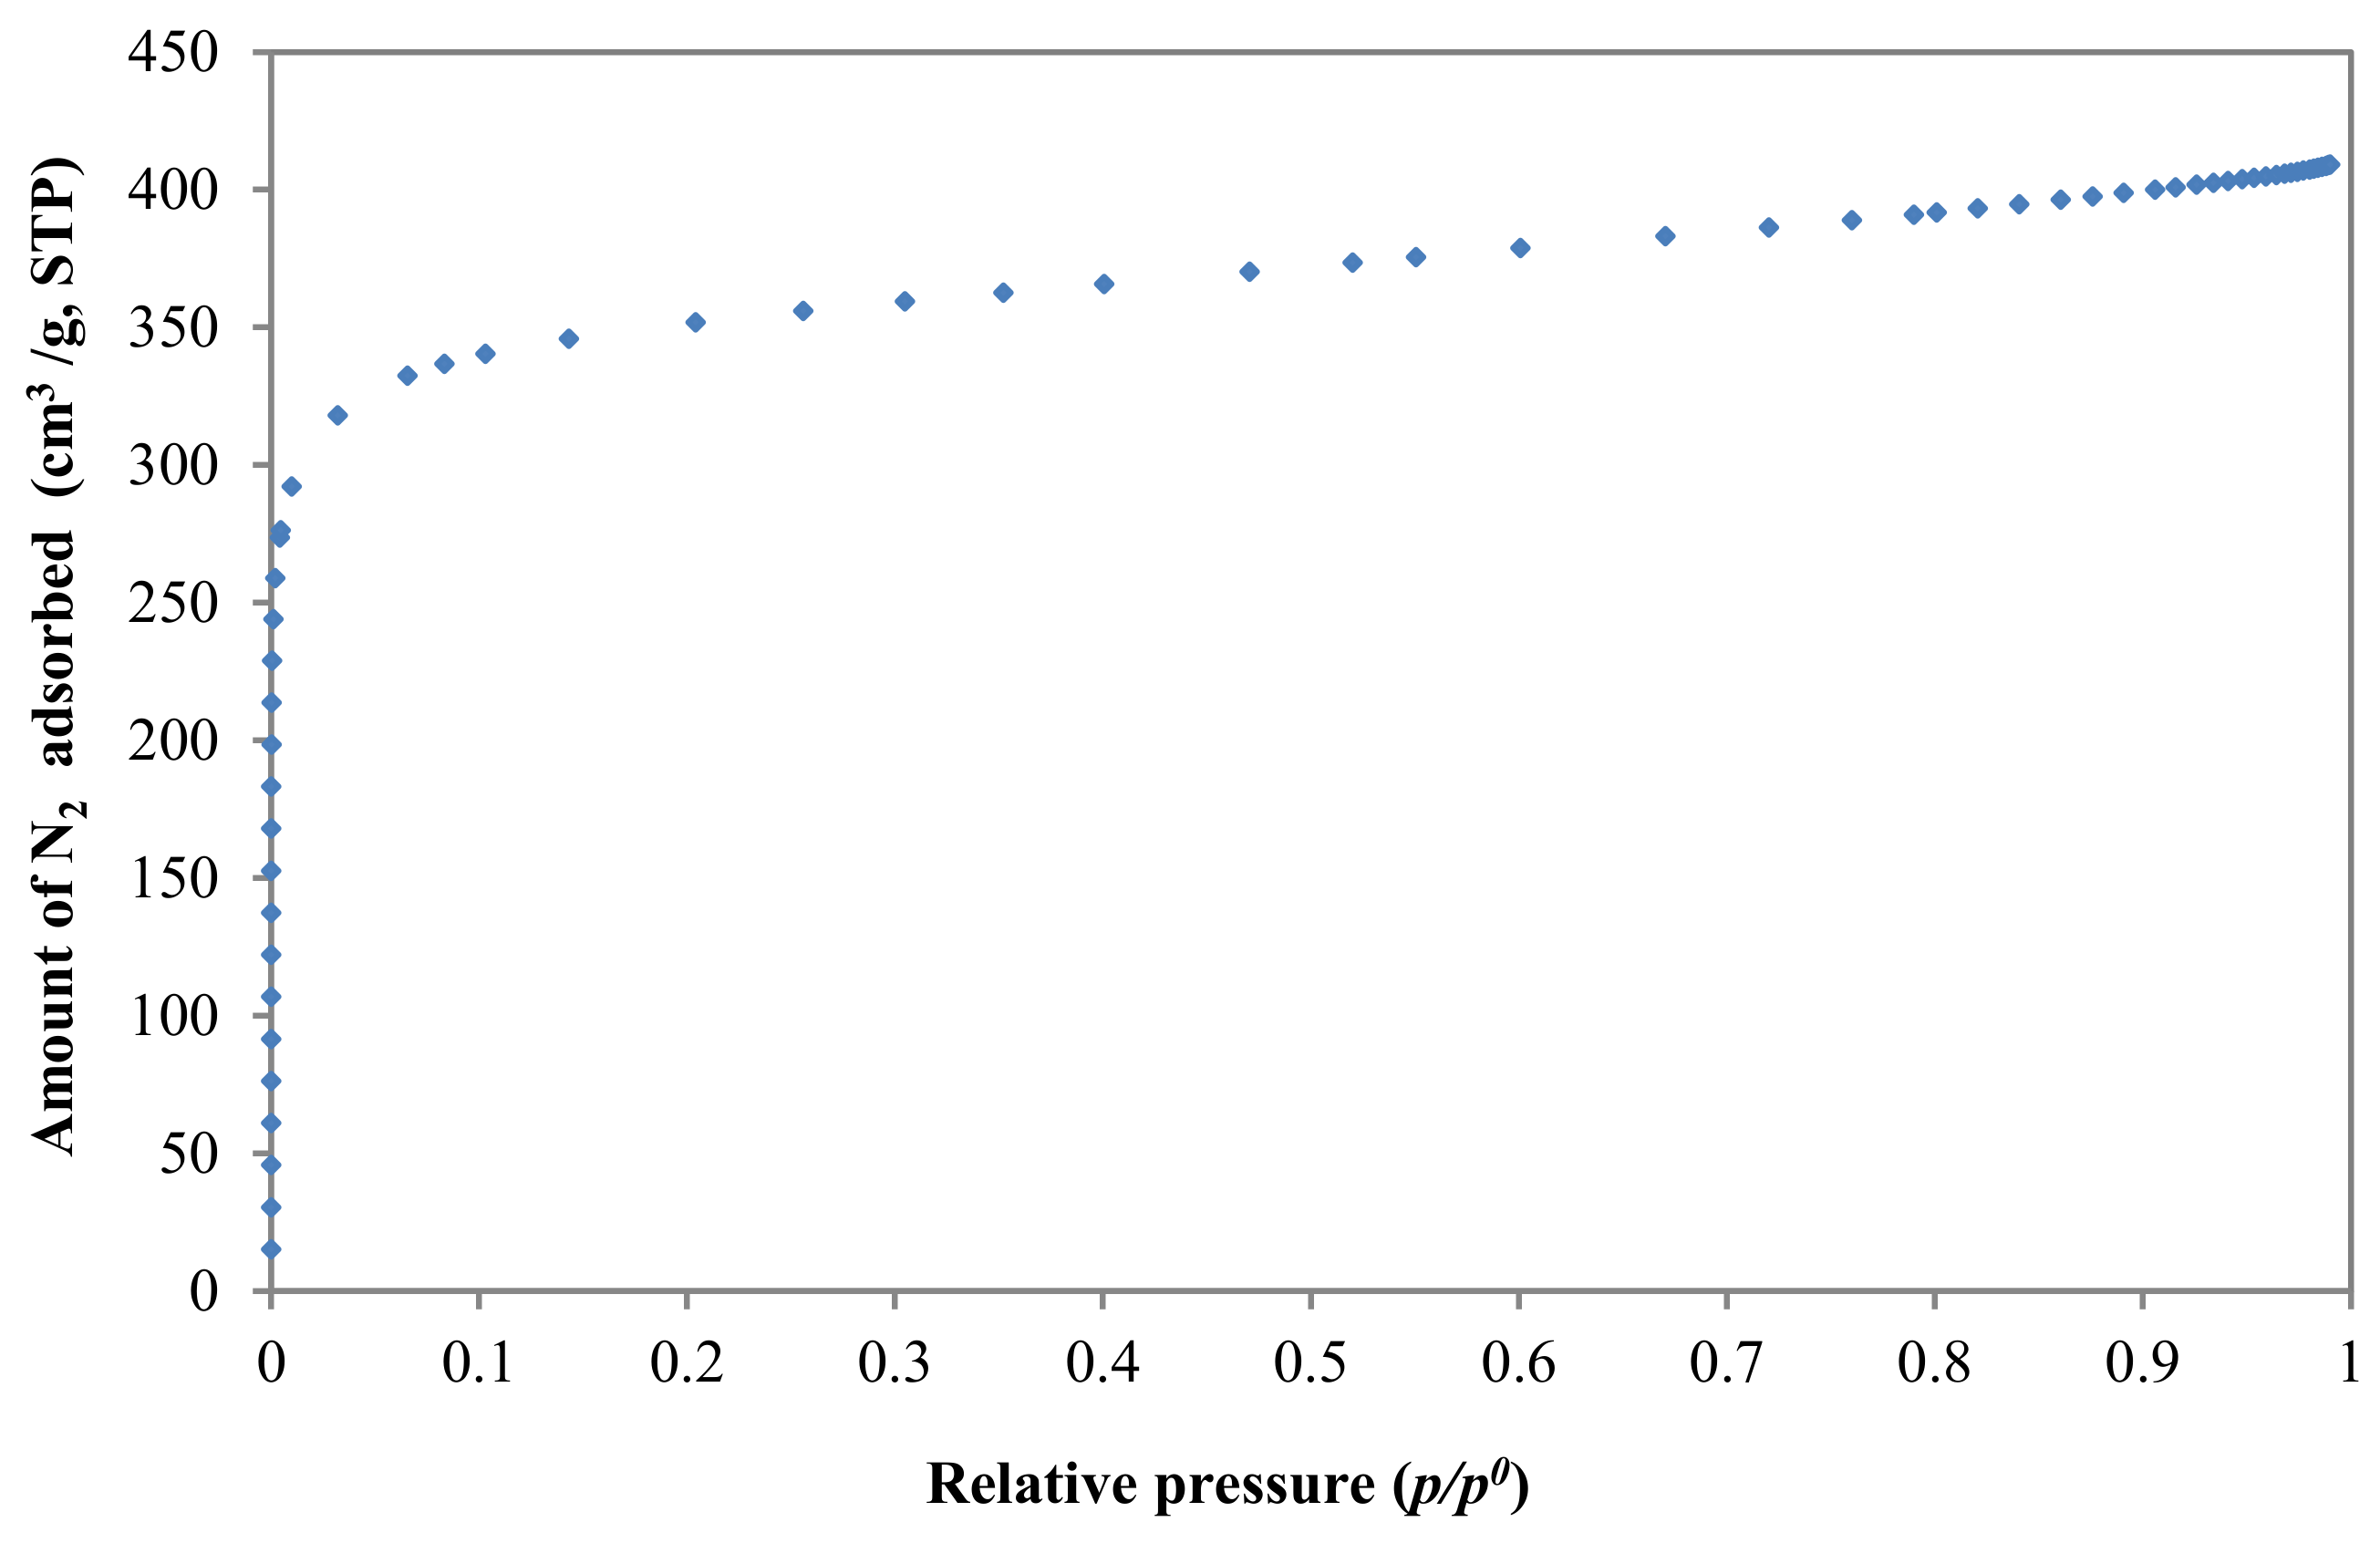
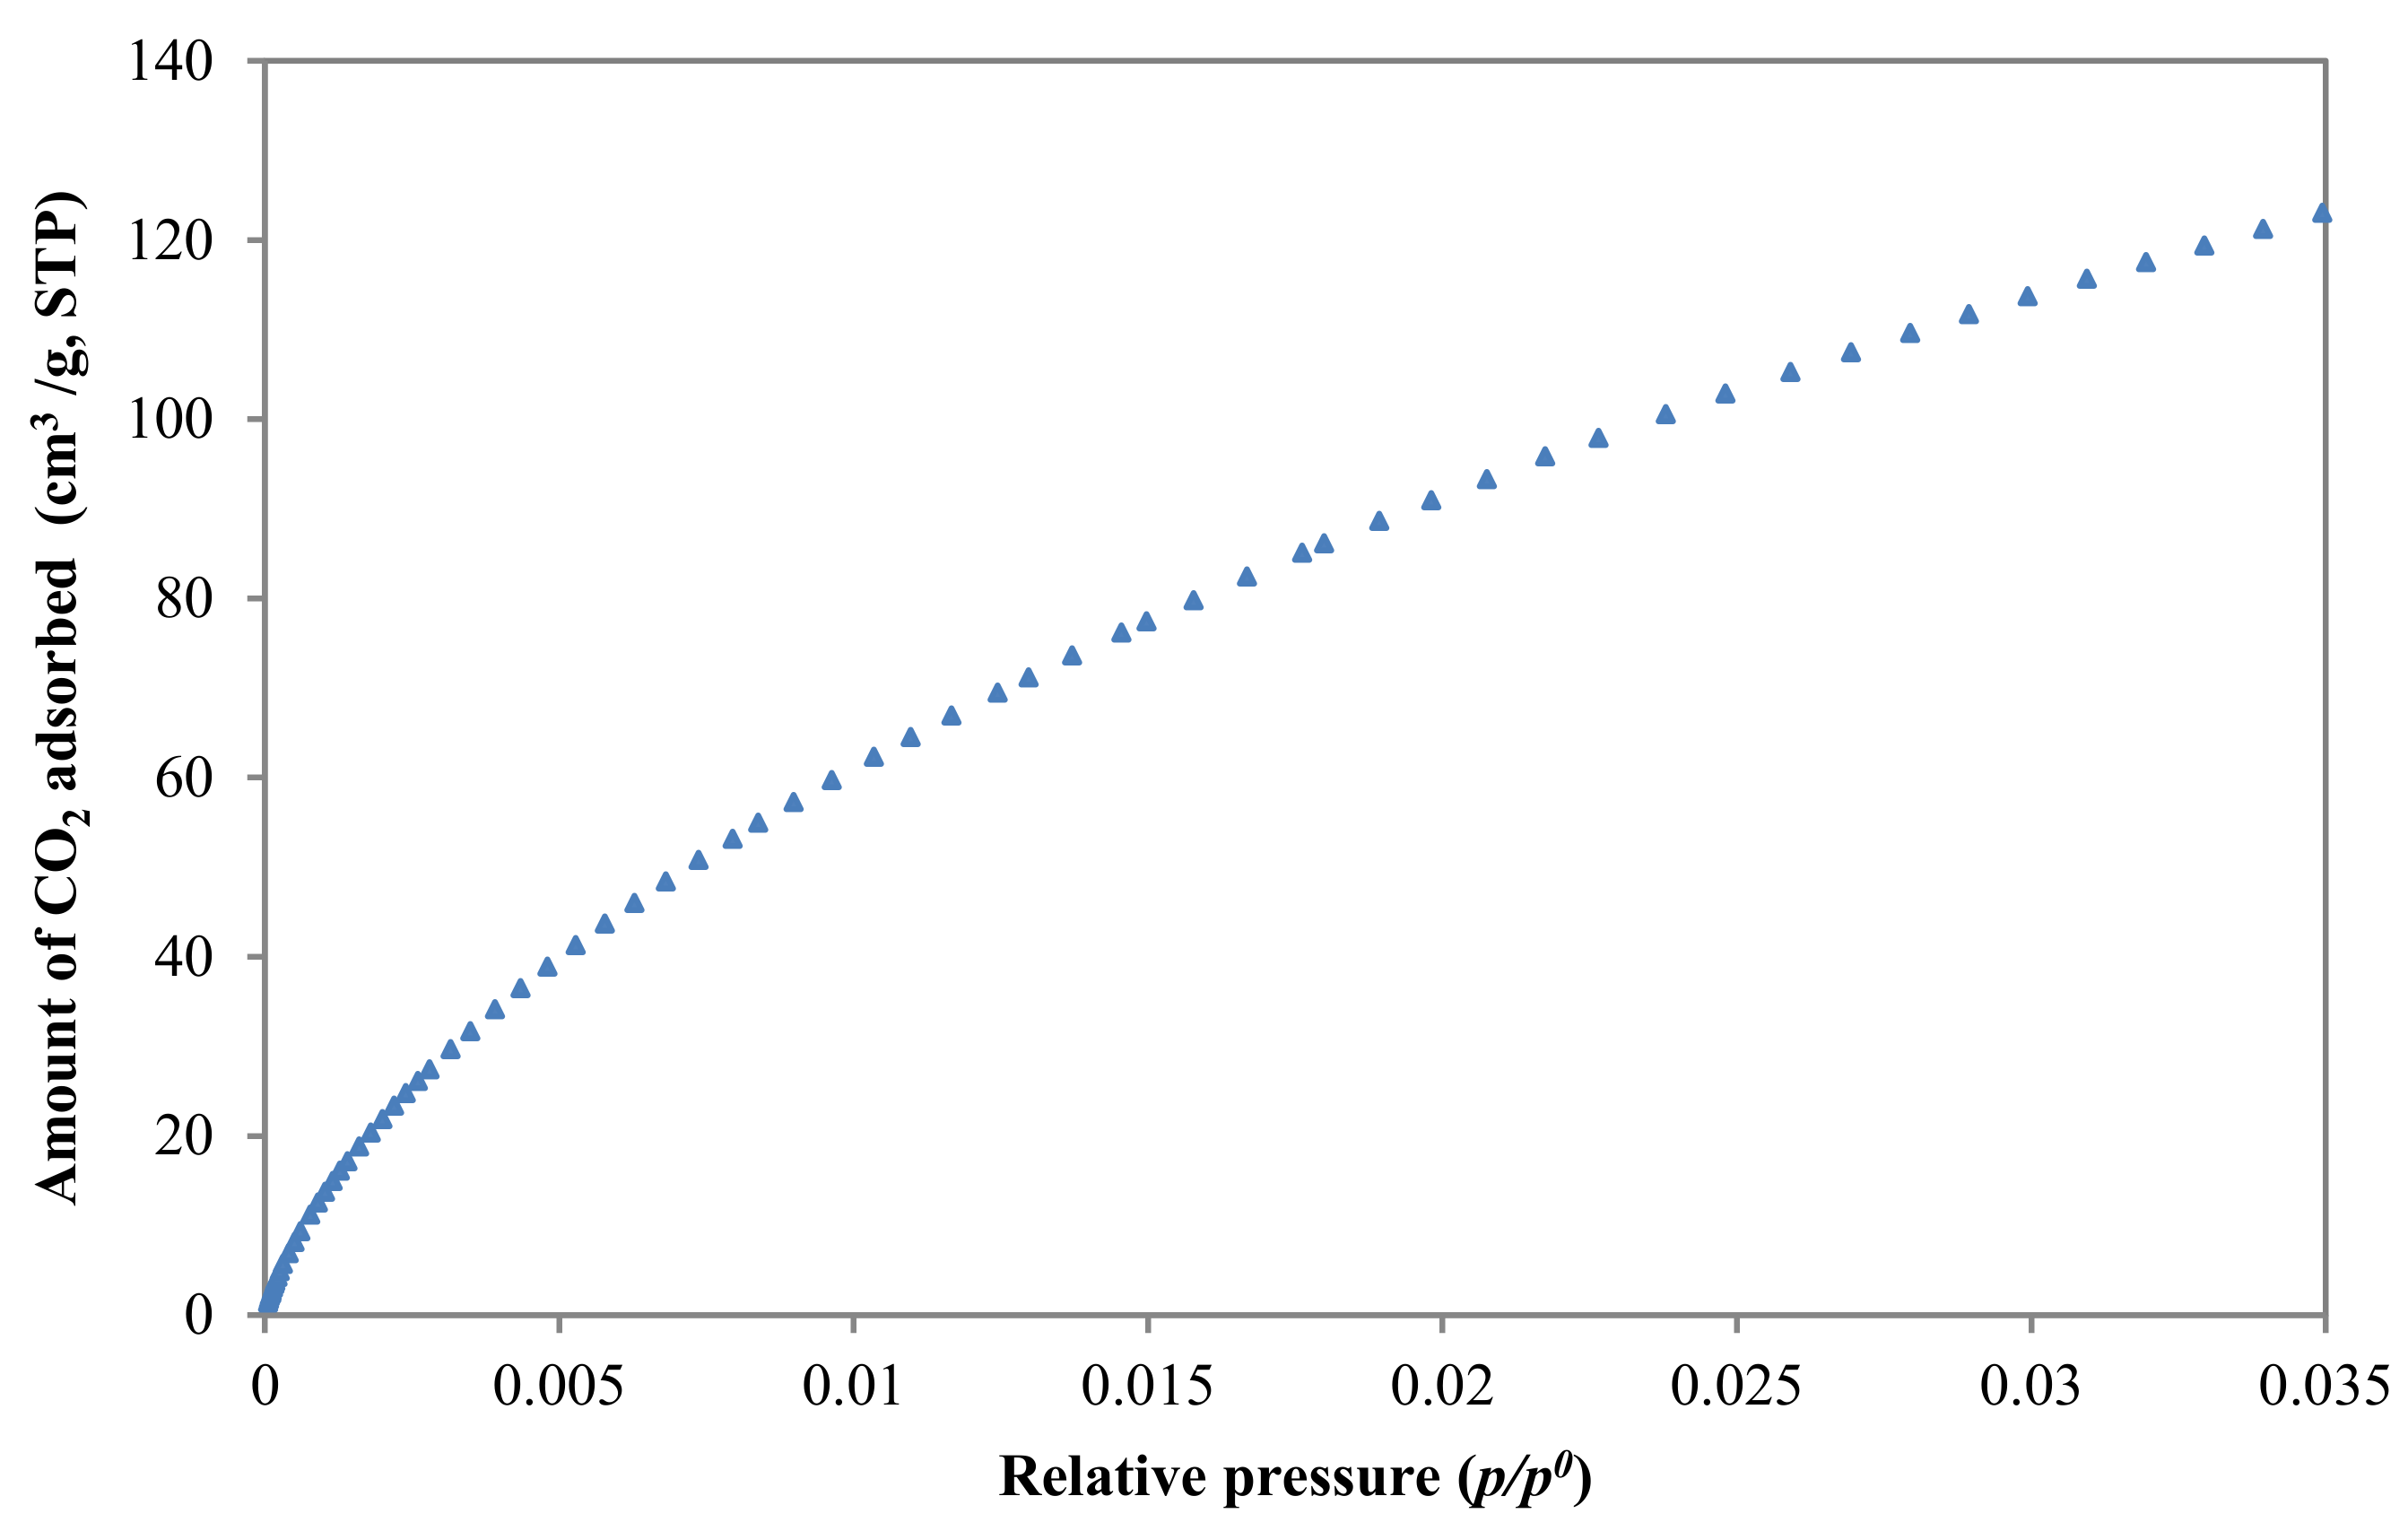
3.2.1. Textural Characterization

Figure 2 and Figure 3 represent the N2 and CO2 adsorption isotherms at −196 and 0 °C, respectively, on the activated carbon produced from CNS.
According to the International Union of Pure and Applied Chemistry (IUPAC ) classification, the N2 adsorption isotherm is of type I; this indicates that the produced activated carbon is strictly microporous. As can be noted from Figure 2, the nitrogen uptake is high at low relative pressure (p/p0 < 0.1) and can be explained by micropores filling. As expected, the use of CO2 as activating agent in a single step physical activation method mainly develops microporosity in biomass activated carbons [41].
CO2 adsorption in Figure 3 assesses the narrower microporosity (<1 nm). A wide narrow micropore size distribution characterizes the shape of the CO2 isotherm.
As can be noted from Table 2, the BET surface area estimated, 1378 m2/g is considerably high and it is on the range of a commercial biomass-based carbon (500–1500 m2/g). Micropores (W0) represent more than 85% of the whole volume of pores (Vp). It is also observed that average narrow micropore size, L0 as estimated from CO2 adsorption, is close to the average micropore size, L0 as estimated from N2 adsorption.

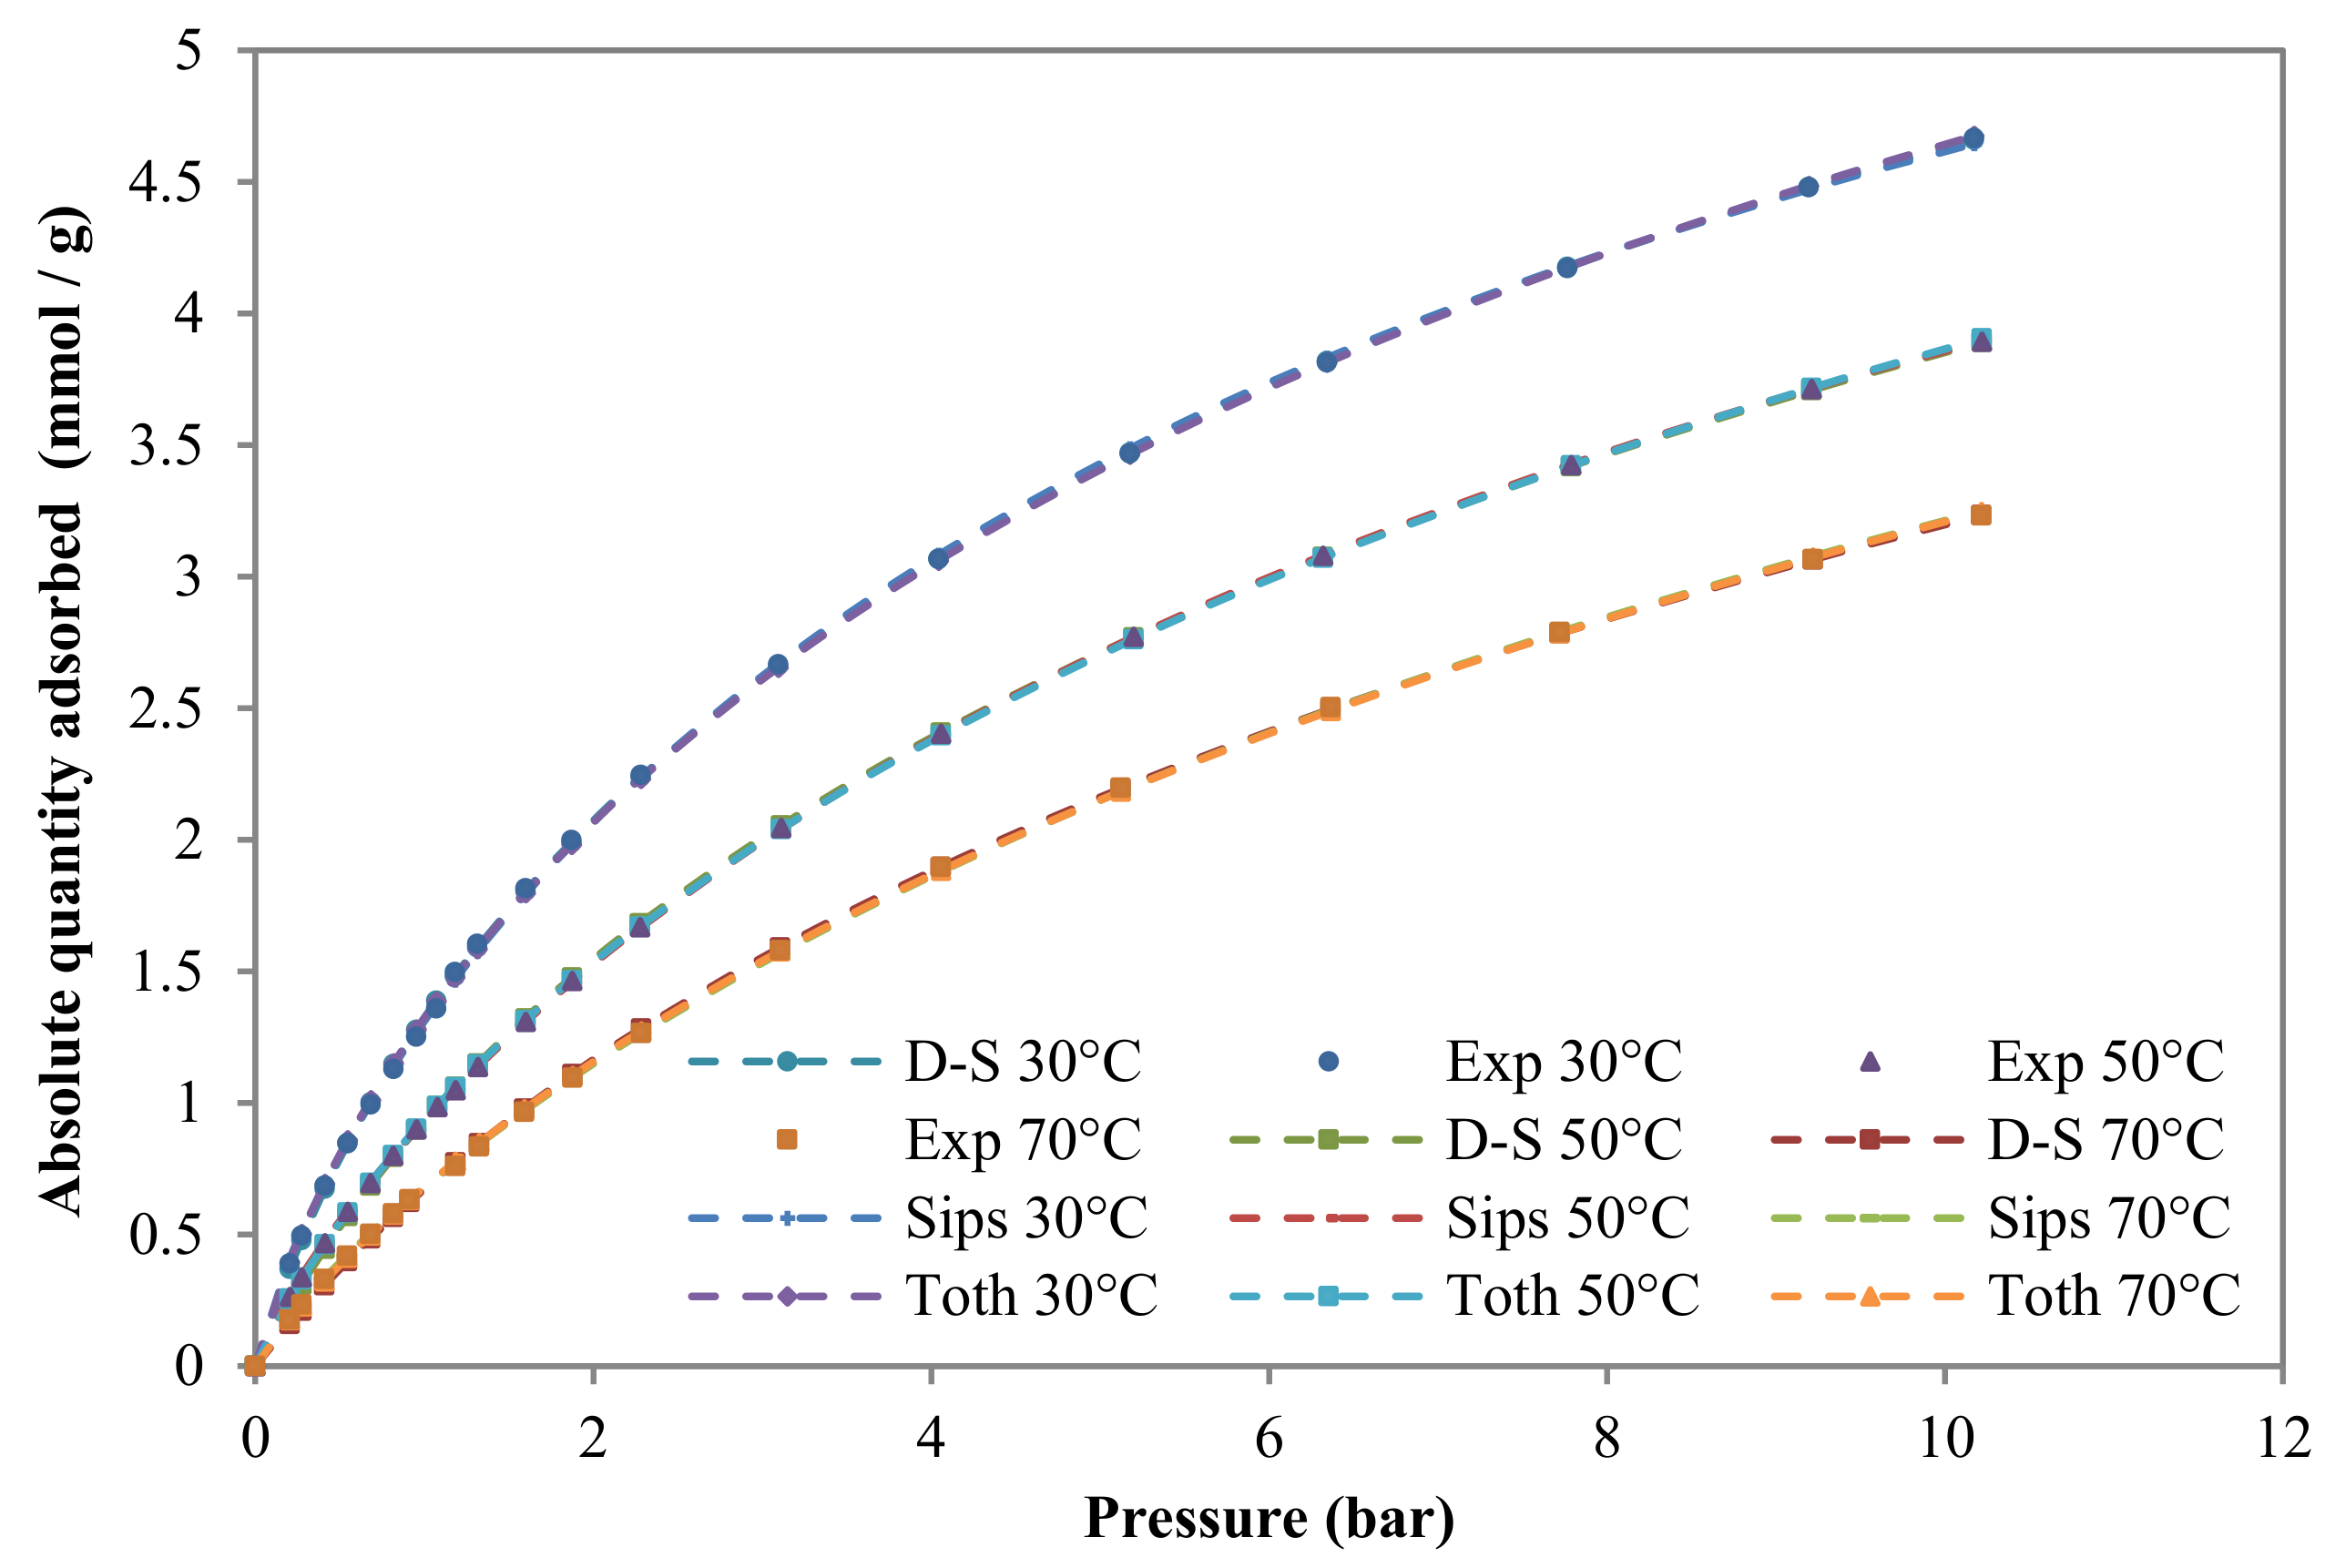
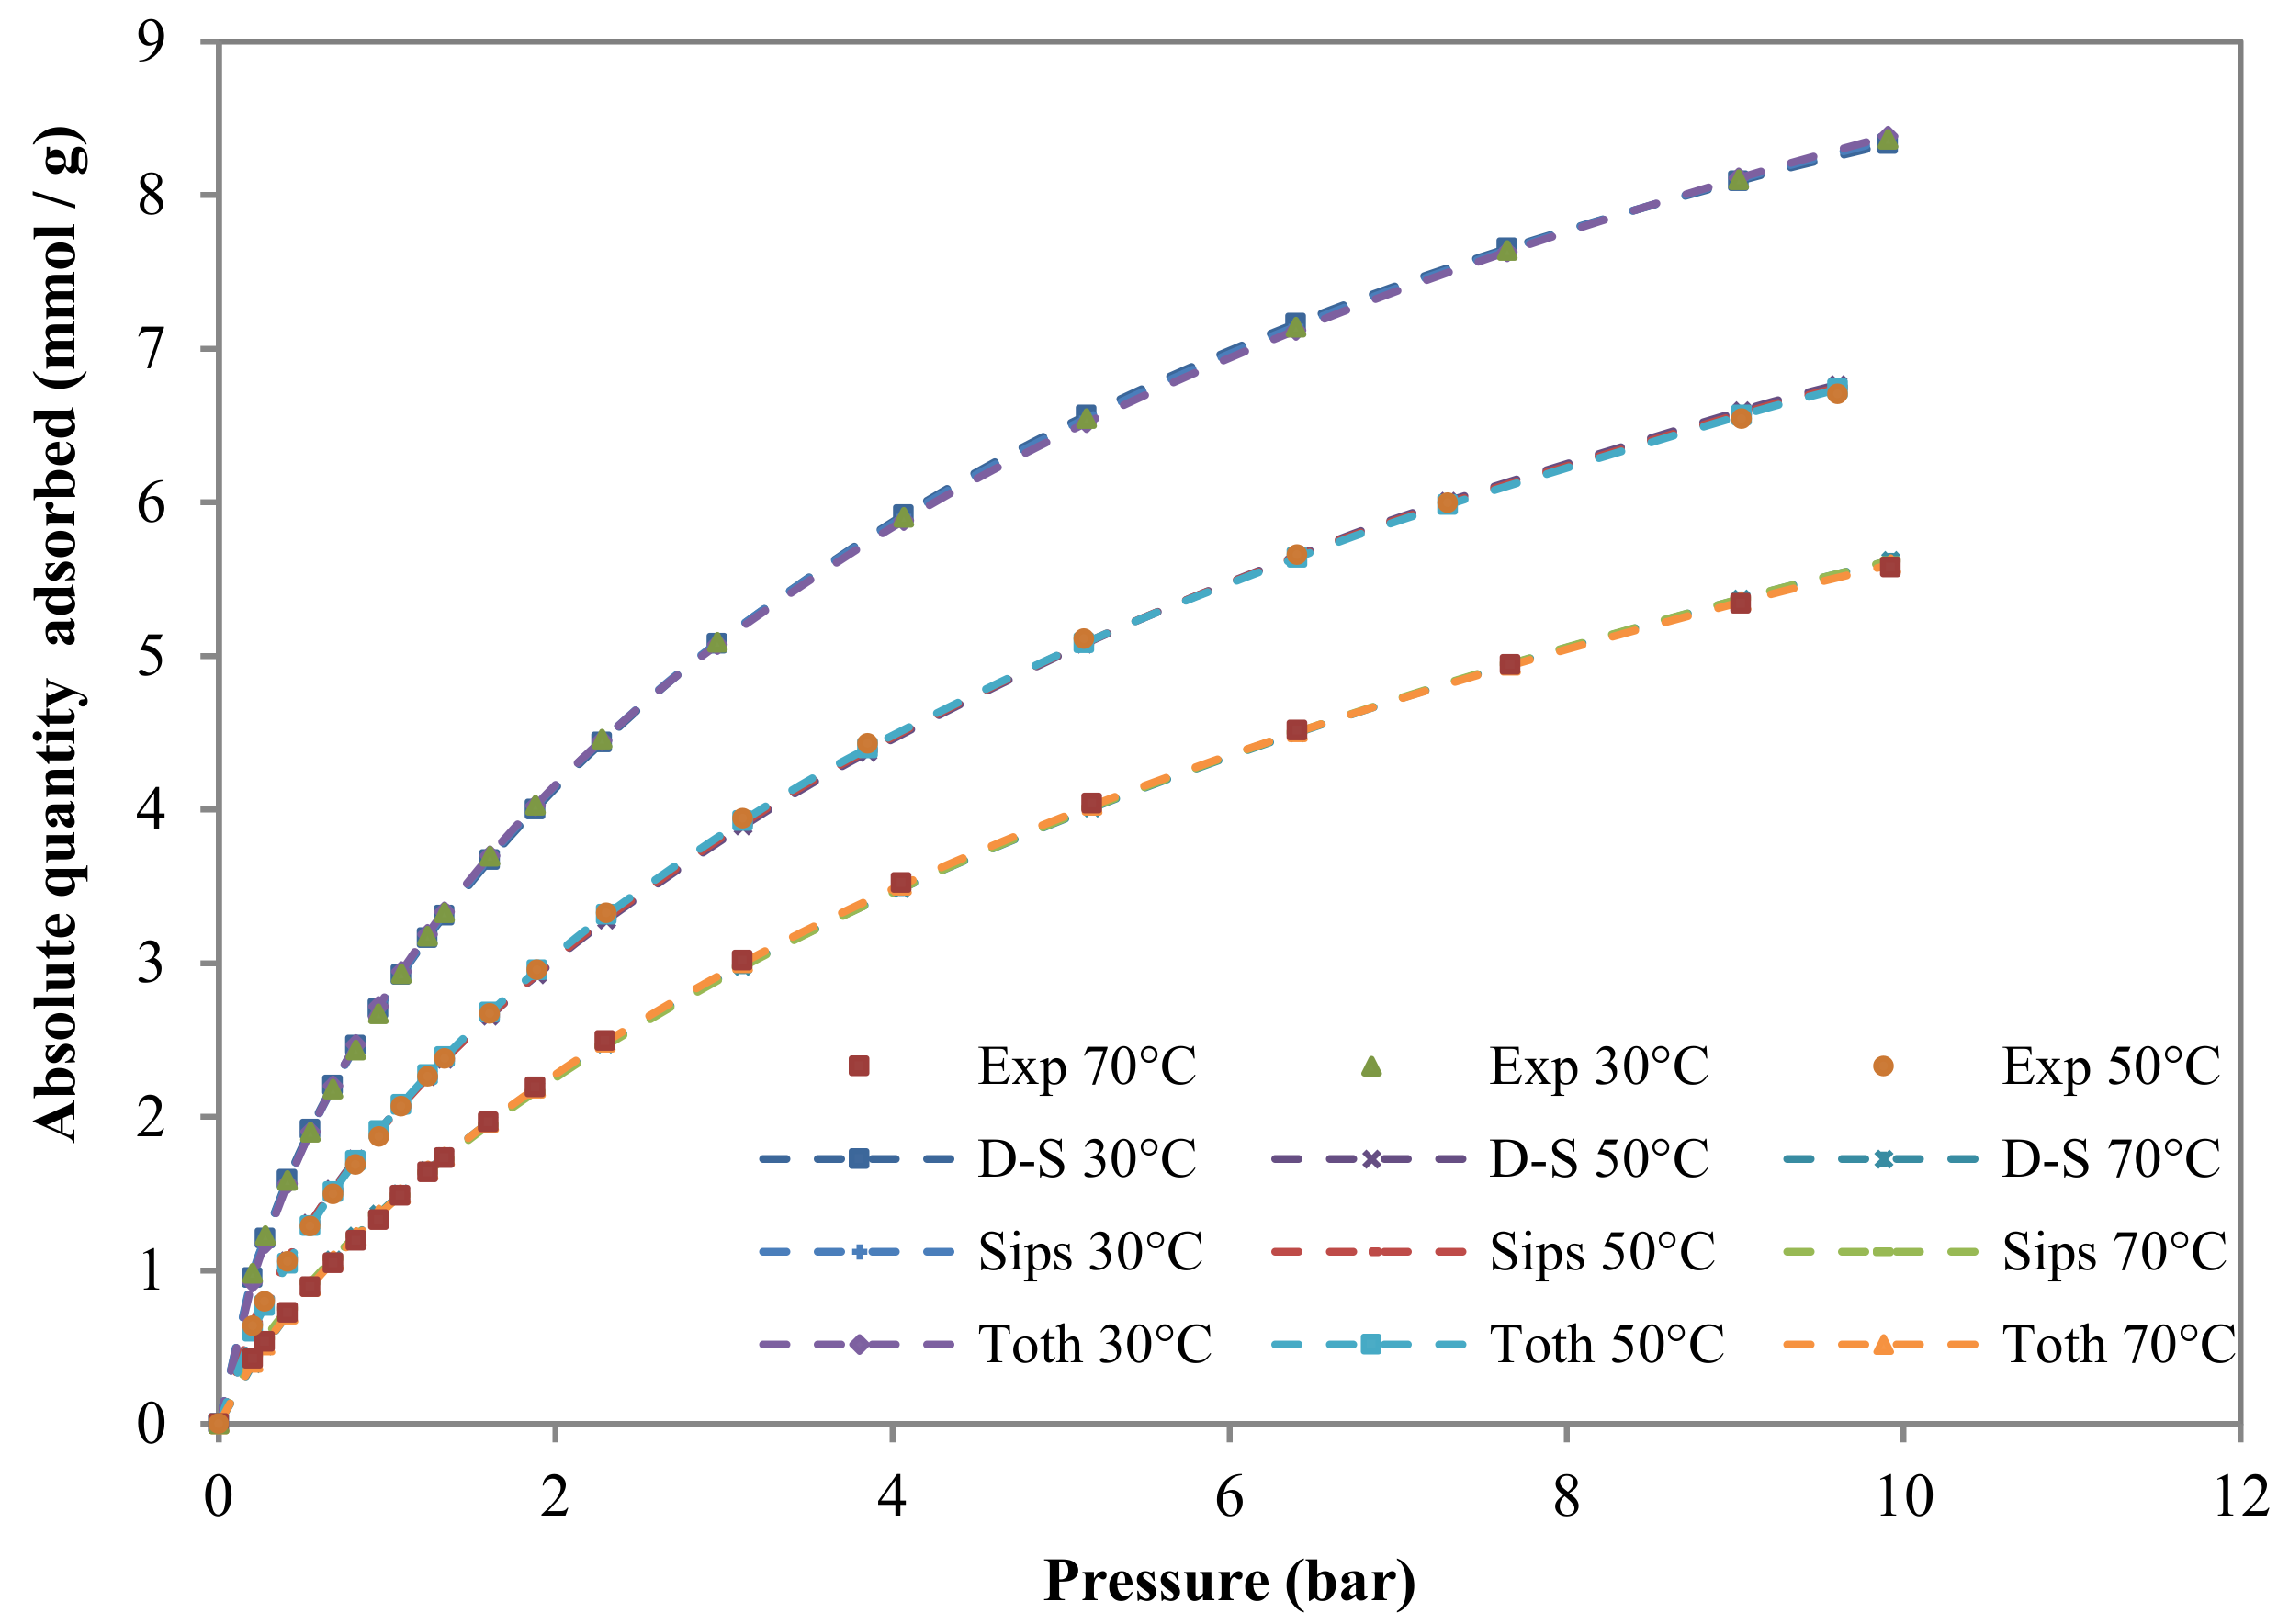
3.2.2. Adsorption Isotherms

The experimental adsorption isotherm data collected at 30, 50 and 70 °C were fit to three different models to account for the equilibrium of adsorption, namely Sips, Toth and Dual-Site Langmuir (D-S), (Equations (2)–(8)).
The first isotherm model used for the representation of the experimental data is the Sips model whose equation is given as follow [42]:
q = q s ( b P ) 1 n 1 + ( b P ) 1 n
where q (mol/g) refers to the gas adsorbed quantity and qs (mol/g) the adsorbed quantity at equilibrium, P (Pa) the adsorption pressure and b the affinity constant. The parameter n indicates the heterogeneity of the system. Generally, n value is greater than unity; thus, the higher the value of n, the more heterogeneous the system that is obtained.
qs (mol/g) was considered temperature independent whereas n and b (Pa−1) were considered temperature dependent as shown in Equations (3) and (4) [42].
b = b 0 exp [ Q R T 0 ( T 0 T 1 ) ]
1 n = 1 n 0 + α ( 1 T 0 T )
In the equations above, b0, n0 and α are the constants related to the temperature-dependent correlations; R (J/(mol.k)) is the ideal gas constant and T (K) is the temperature. Q is the isosteric heat of adsorption at a fractional loading of 0.5 and T0 (K) is the reference temperature (30 °C).
The Toth model is used as the second isotherm model for fitting the experimental results which is represented by Equation (5) [42]:
q * = q * s b * P [ 1 + ( b * P ) t ] 1 t
where q* (mol/g) is the adsorbed quantity, q*s (mol/g) is adsorbed quantity at equilibrium and P (Pa) is the adsorption pressure. b* (Pa−1) and t are characteristic of the adsorbate–adsorbent couple. Thus, as n in the Sips relation, t characterizes the heterogeneity of the system. However, t is generally less than unity.
As in the Sips relation, the dependence of the equilibrium parameters with temperature in the Toth equation must also be taken into account [42].
t = t 0 + α * ( 1 T T 0 )
In Equation (6), t0 and α* are the constants related to the temperature dependency of t. The variation of b* (Pa−1) with temperature is analogue to the dependence of b (Pa−1) in the Sips equation, but in this case, Q accounts for the isosteric heat of adsorption at a nil fractional loading.
Finally, the third isotherm model selected for the prediction of the experimental results is the Dual-Site Langmuir model (D-S) (Equation (7)). This model accounts for the heterogeneity of adsorption of a pure component on the adsorbent which is composed of two homogeneous but different energy sites [43,44,45]. All assumptions of the Langmuir model are applicable to each site, with an absence of interactions between the two.
q = q s 1 b 1 P 1 + b 1 P + q s 2 b 2 P 1 + b 2 P
where qs1 (mol/g) and qs2 (mol/g) are respectively the equilibrium adsorbed quantity at sites 1 and 2, so the adittion of those quantities define the total capacity of saturation (qs = qs1 + qs2) (mol/kg); b1 (Pa−1) and b2 (Pa−1) represent free energy parameters for sites 1 and 2 respectively, or affinity , which depend on temperature as shown in Equation (8), where the subscript j refers to free energy sites (1 or 2), b0,j are the pre-exponential factors or entropies of adsorption, and Ej (J/mol) are their energies of adsorption [42].
b j = b 0 , j exp ( E j R T ) j = 1 , 2
The comparison between experimental and fitted data of adsorption of pure CO2 and CH4 on the CNS-activated carbon is shown in Figure 4 and Figure 5. The experimental pure CO2 and CH4 adsorption isotherms of the CNS adsorbent at 30, 50 and 70 °C are represented by symbols. Sips, Toth and Dual-Site Langmuir (D-S) model fitting are represented by dashed lines with symbols.
Capacity of adsorption is an important factor to estimate the gas separation aptitude of an adsorbent. As can be noted, the CO2 uptake capacities of CO2 and CH4 increased by increasing the pressure but decreased when the temperature increased. This is the expected behaviour for a physical adsorption-based process. The activated carbon produced presents a high CO2 adsorption capacity compared to that of CH4 over the studied pressure and temperature range.
The Excel tool Solver was used to fit the experimental results to the different models, and the different values of the parameters were calculated by minimizing the minimum residual sum of squares (SSR) i.e., by reducing the gap between the model predictions and empirical amounts adsorbed at the evaluated temperatures for a specific adsorbate–adsorbent system. Equation 9 shows the objective function used in Solver.
SSR   ( % ) = T 1 T 3 i = 1 N ( q exp , i q mod , i ) 2 N × 100
where qexp,i (mol/g) and qmod,i (mol/g) are the empirical and prediction models of the amounts adsorbed, respectively, and N is the number of experimental points.
Figure 4 and Figure 5 show the results for the three models. The optimal fitting parameters and the values of the minimum residual sum of squares (SSR) are reported in Table 3.
As can be noted in Table 3, the maximum adsorption capacities predicted by the three models for CO2 are always much higher than those for CH4. Such a difference in adsorption capacity is advantageous for separation via adsorption. The Toth’s predictions of the adsorbed amounts at saturation are higher than those estimated by Sips and Dual-Site Langmuir, respectively. This difference can be justified by the fact that experimental data only correspond to fractional loadings of up to about 0.5 [46].
It is clearly observed that values of b*, b1, b2 and b are reduced with temperature increase. This supposes that, at high temperature, the attraction of molecules to the surface is weaker.
The n constant in the Sips model and the t constant in the Toth model reflect the degree of heterogeneity of the system. As can be noted in Table 3, the heterogeneity of the system remains practically unchanged with the temperature increase.

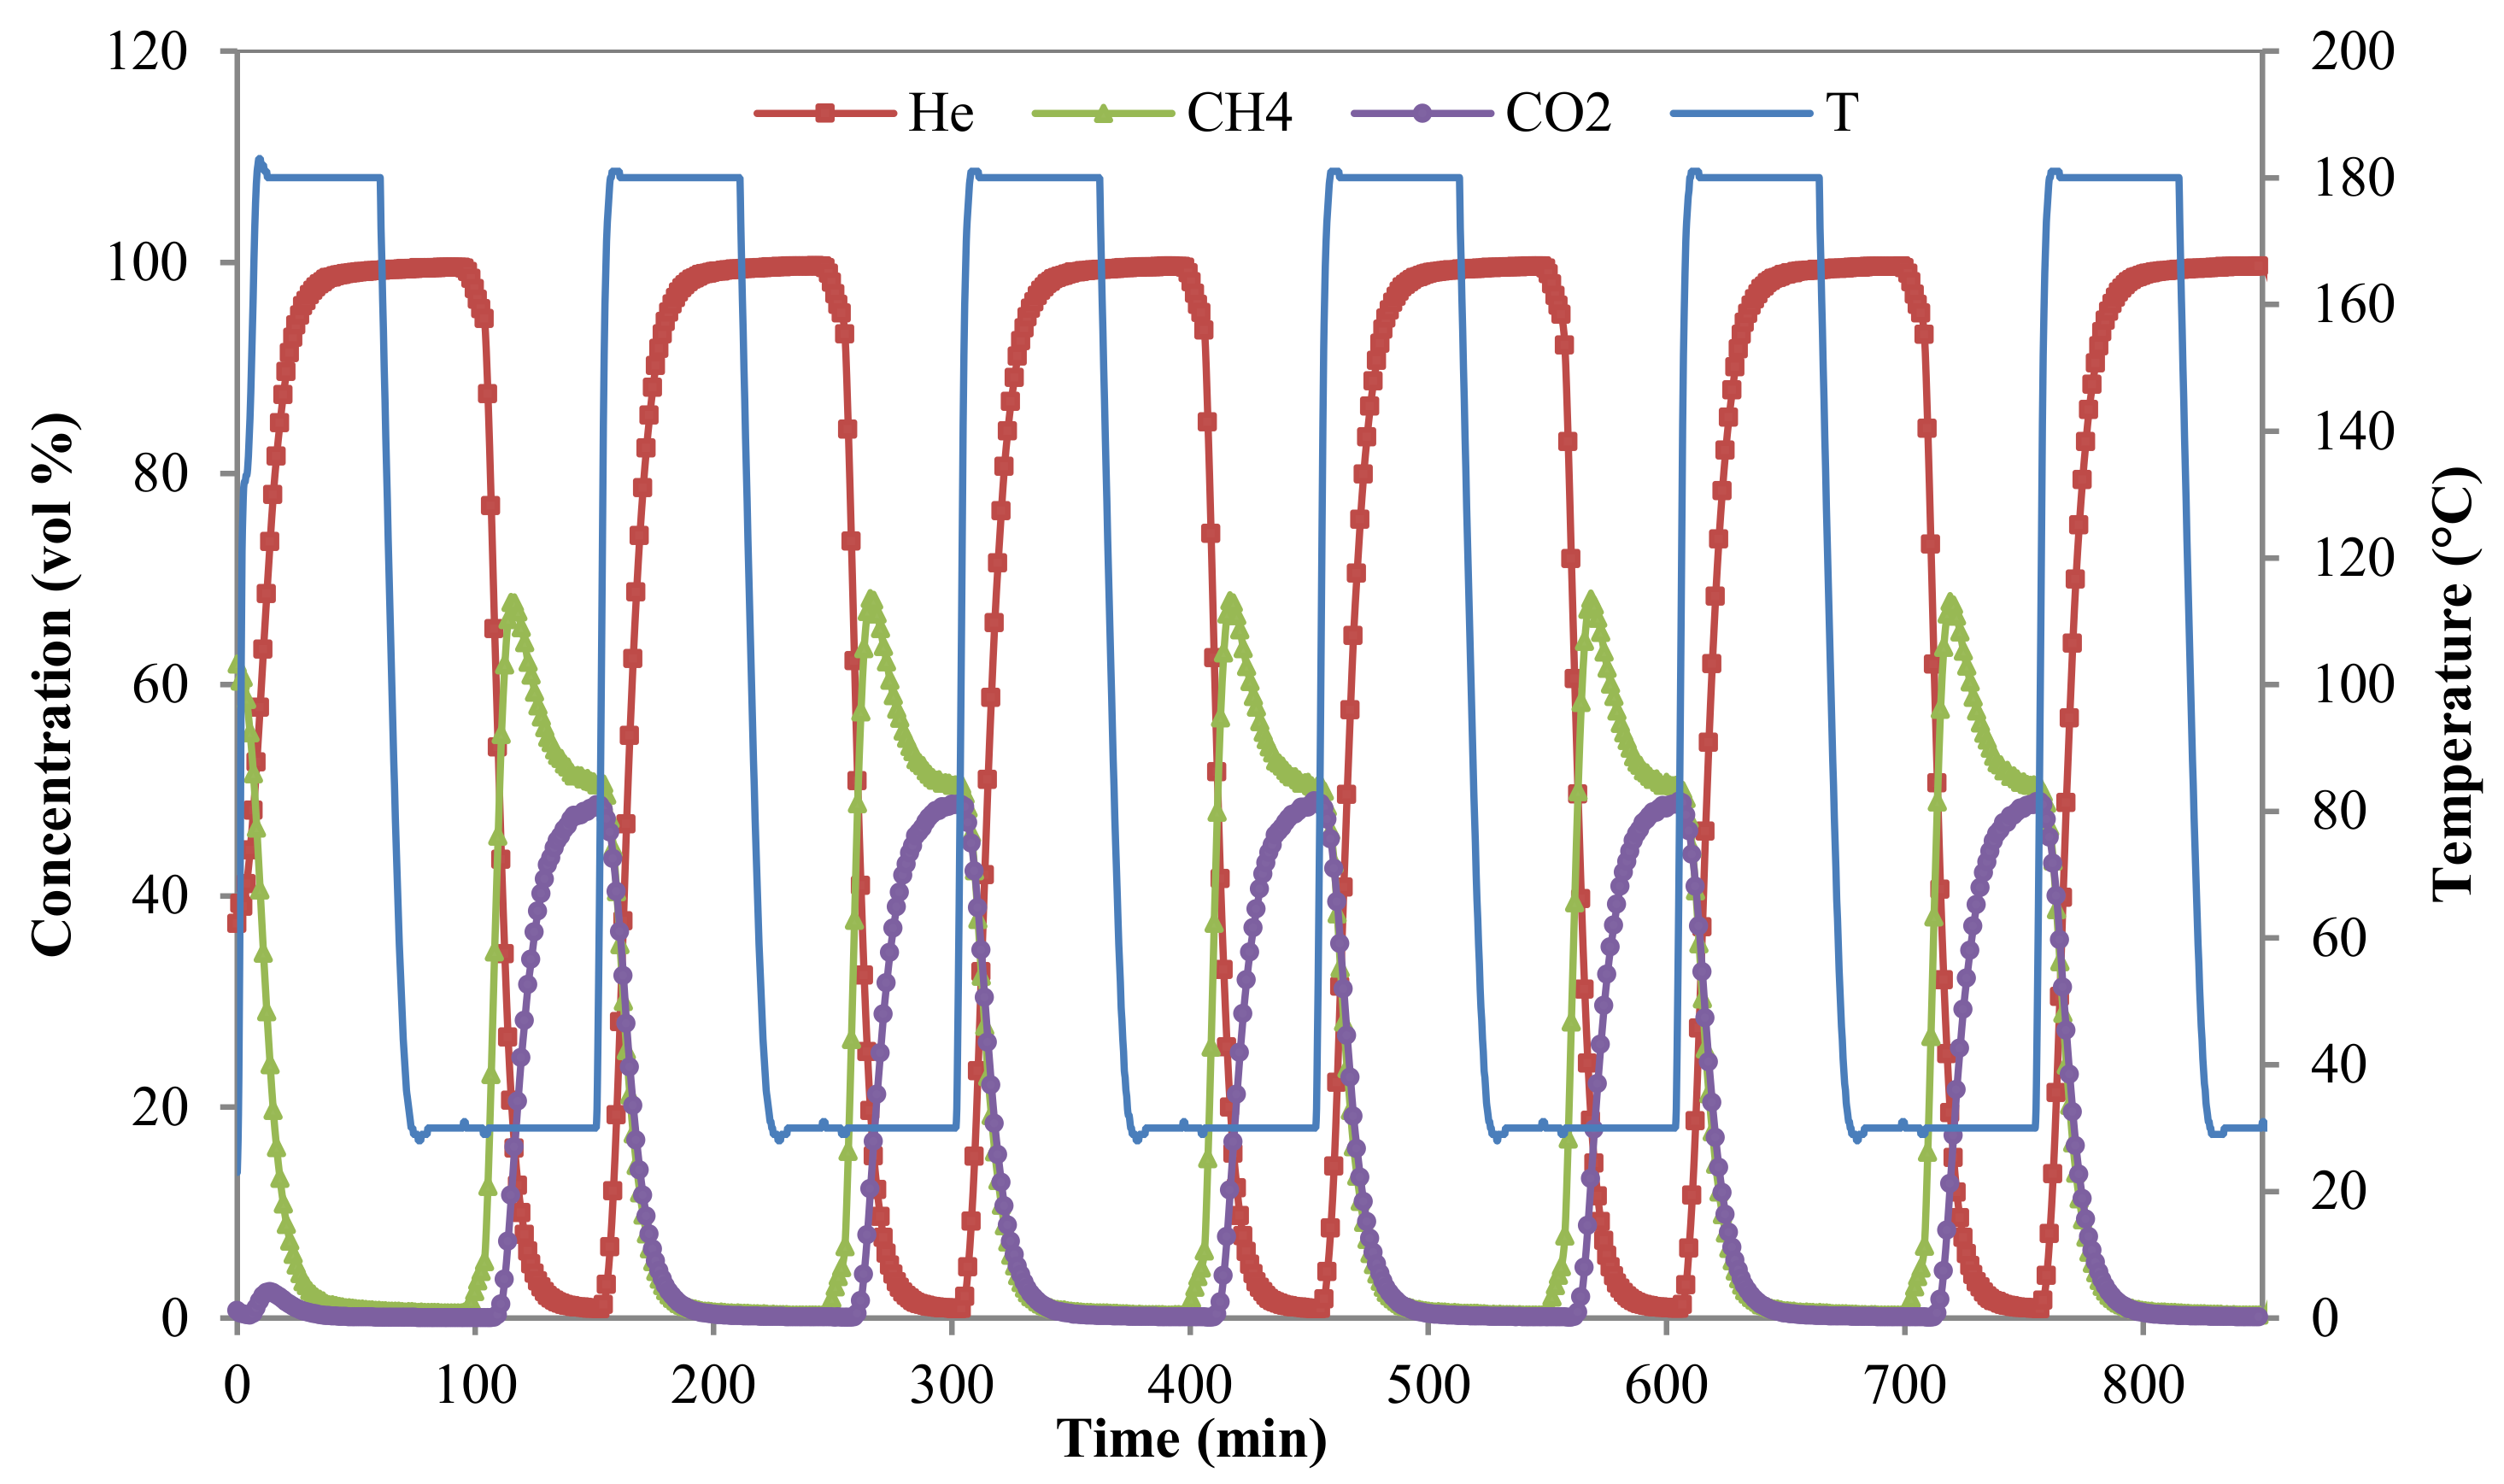
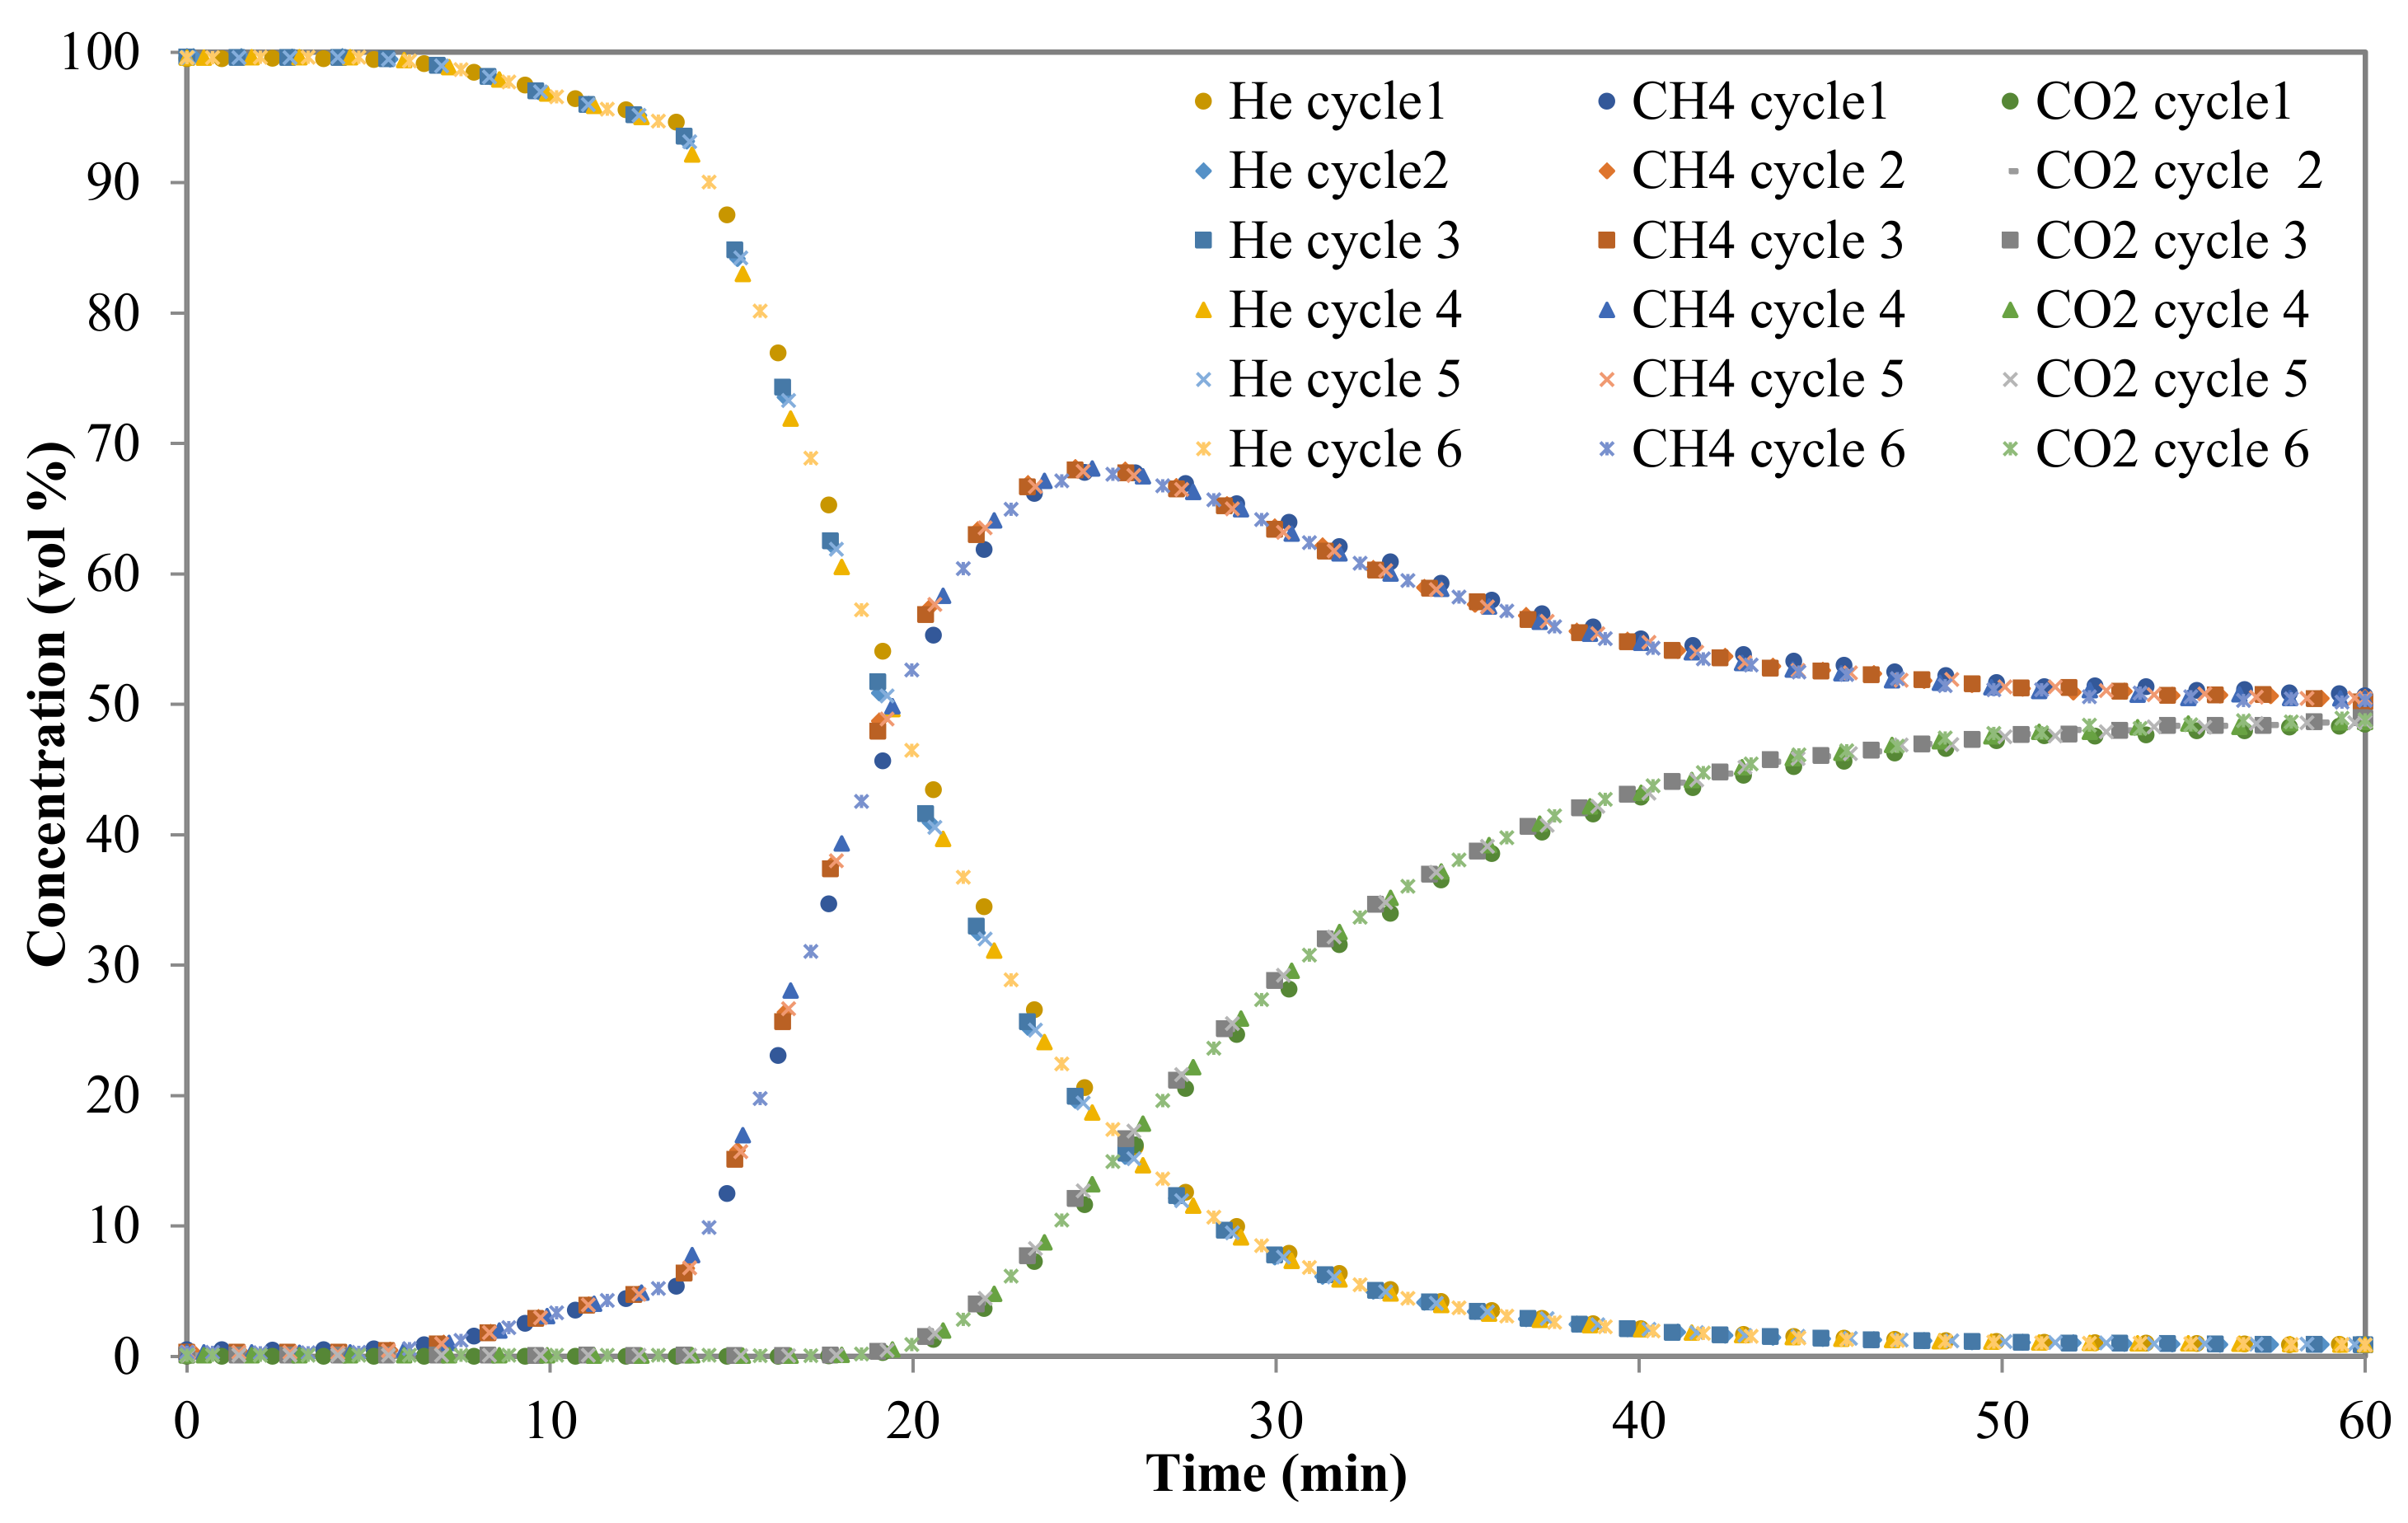
3.2.3. Breakthrough Curves

In Figure 6, it can also be noted that the CNS adsorbent bed presents a stable performance in consecutive cycling under fixed-bed operations.
Figure 7 shows an example of six-consecutive adsorption and desorption experiments for an equimolar CO2/CH4 gas mixture fed to the adsorption fixed-bed at 1 bar. It was used as carrier gas during the preconditioning and regeneration steps. It is observed that during the initial period preceding the saturation of the bed, both components in the feed gas, CO2 and CH4, are completely adsorbed on the CNS activated carbon bed. Then, as expected according to the data from the adsorption isotherms (see Figure 4 and Figure 5), CH4 breaks through first.
The CH4 breakthrough curve presents a so-called roll-up (see Figure 7). This is because the CH4 adsorbed is displaced by CO2 adsorption. This phenomenon has been previously reported for a similar separation in [47]. The strong adsorption of CO2 over CH4 can be justified by the fact that the molecules have different adsorption strength.
From Figure 7, it has to be noted that consecutive breakthrough curves overlap showing that the adsorbent was totally regenerated in each cycle and maintained a stable adsorption performance over the six successive sorption cycles. Based on the timing noted in the concentration fronts of CH4 and CO2, the CO2/CH4 gas separation is technically possible on the CNS-based activated carbon. The required time for the CO2 front to reach the column outlet is approximately 18 min, whereas CH4 need a much shorter time to breaks the column (6 min).
The adsorption capacities of CO2 and CH4 of the produced activated carbon are estimated to be 1.86 and 0.52 mol/kg, respectively, at 30 °C and 1 bar.
For the design of the PSA, it is essential to determine precisely the breakthrough time of CO2 at the adsorption pressure chosen. This could be done experimentally or using a simulation tool with a model already validated. CH4, separated from CO2, has to be collected from the bed exit during the period preceding the breakthrough of CO2. Just before CO2 breaks through, the collection of CH4 should be stopped and the bed undergoes the next step according to the retained PSA cycle design (equalization, depressurization, regeneration, etc.).

3.2.4. Adsorption Selectivity

Aiming to assess the efficiency of the produced activated carbon for CO2/CH4 separation, the adsorption selectivity (SCO2/CH4) was calculated using Equation (10) [48]
S C O 2 / C H 4 = x C O 2 x C H 4 y C H 4 y C O 2
where x refers to the molar fraction in the adsorbed phase and y refers to the molar fraction in the gas.
The selectivity of CO2 over CH4 for the CNS at 1 bar and 30 °C was approximately 3.6. It was found that the value of selectivity was comparable to that of carbon-based adsorbents [49].
Many works reported that (MOF) possess high CO2 selectivity and high CO2 working capacities compared to zeolites and carbon-based adsorbents [50,51,52]. In general, the separation of CO2/ CH4 can be affected by many parameters such as temperature and pressure.

4. Conclusions

In this work an activated carbon from dry CNS using one-pot activation procedure was produced. The results of this study showed that the activated carbon presented good development and high BET surface area. The characterization of the CNS-based activated carbon indicated that the adsorbent is basically microporous with a BET surface of 1378 m2/g. CNS can be utilized as a suitable precursor to prepare a microporous activated carbon for CO2 adsorption from biogas streams.
Pure component CO2 and CH4 adsorption isotherms were carried out at three different temperatures. As expected, CO2 is the strongest adsorbate. Afterwards, breakthrough tests consisting of six successive sorption cycles were run in a lab-scale fixed-column. The CNS based activated carbon maintains its activity during the experiments which reflect a perfect cyclability and regenerability under the evaluated conditions.
Based on the timing observed in the concentration fronts of CH4 and CO2, the gas separation of CO2/CH4 is technically feasible using the CNS-based activated carbon. For instance, the CO2 and CH4 adsorption fronts reach the outlet of the column after approximately 18 min and 6 min, respectively.
The adsorption capacities of CO2 and CH4 of the produced activated carbon are estimated to be 1.86 and 0.52 mol/kg, respectively, at 30 °C and 1 bar.
The collected preliminary data report that the synthesized CNS-adsorbent shows suitable characteristics for the CO2/CH4 separation.

Author Contributions

A.A. conducted the experimental work with the assistance of N.Q. in the sample preparation and characterization and I.D. and N.Á.-G. in the fixed-bed experiments and data processing. C.P. and M.H.C. supervised the work. All authors contributed to the writing and/or revision of the paper.

Funding

This research was funded by The Tunisian Ministry of Higher Education and Scientific Research.

Conflicts of Interest

The authors declare no conflicts of interest.

References

  1. Zheng, B.; Xu, J. Carbon Capture and Storage Development Trends from a Techno-Paradigm Perspective. Energies 2014, 7, 5221–5250. [Google Scholar] [CrossRef] [Green Version]
  2. Rodrigues, C.F.A.; Dinis, M.A.P.; Lemos de Sousa, M.J. Review of European energy policies regarding the recent “carbon capture, utilization and storage” technologies scenario and the role of coal seams. Environ. Earth Sci. 2015, 74–2553. [Google Scholar] [CrossRef]
  3. Yoro, K.O.; Sekoai, P.T. The Potential of CO2 Capture and Storage Technology in South Africa’s Coal-Fired Thermal Power Plants. Environments 2016, 3, 24. [Google Scholar] [CrossRef]
  4. Lackner, K.S.; Park, A.H.A.; Miller, B.G. Eliminating CO2 emissions from coal-fired power plants. In Generating Electricity in a Carbon-Constrained World; Academic Press: Cambridge, MA, USA, 2010; pp. 127–173. [Google Scholar]
  5. Pires, J.C.M.; Martins, F.G.; Alvim-Ferraz, M.C.M.; Simões, M. Recent developments on carbon capture and storage: An overview. Chem. Eng. Res. Des. 2011, 89, 1446–1460. [Google Scholar] [CrossRef]
  6. Zhou, K.; Chaemchuen, S.; Verpoort, F. Alternative materials in technologies for Biogas upgrading via CO2 capture. Renew. Sustain. Energy Rev. 2017, 79, 1414–1441. [Google Scholar] [CrossRef]
  7. Sarkar, S.C.; Bose, A. Role of activated carbon pellets in carbon dioxide removal. Energy Convers. Manag. 1997, 38, S105–S110. [Google Scholar] [CrossRef]
  8. Horikawa, M.S.; Rossi, F.; Gimenes, M.L.; Costa, C.M.M.; Da Silva, M.G.C. Chemical absorption of H2S for biogas purification. Braz. J. Chem. Eng. 2004, 21, 415–422. [Google Scholar] [CrossRef]
  9. Yeo, Z.Y.; Chew, T.L.; Zhu, P.W.; Mohamed, A.R.; Chai, S.P. Conventional processes and membrane technology for carbon dioxide removal from natural gas: A review. J. Natl. Gas Chem. 2012, 21, 282–298. [Google Scholar] [CrossRef]
  10. Tuinier, M.J.; van Sint Annaland, M. Biogas Purification Using Cryogenic Packed-Bed Technology. Ind. Eng. Chem. Res. 2012, 51, 5552–5558. [Google Scholar] [CrossRef]
  11. Shigaki, N.; Mogi, Y.; Haraoka, T.; Sumi, I. Reduction of Electric Power Consumption in CO2-PSA with Zeolite 13X Adsorbent. Energies 2018, 11, 900. [Google Scholar] [CrossRef]
  12. Xu, G.; Liang, F.; Yang, Y.; Hu, Y.; Zhang, K.; Liu, W. An Improved CO2 Separation and Purification System Based on Cryogenic Separation and Distillation Theory. Energies 2014, 7, 3484–3502. [Google Scholar] [CrossRef]
  13. Abdeljaoued, A.; Relvas, F.; Mendes, A.; Chahbani, M.H. Simulation and experimental results of a PSA process for production of hydrogen used in fuel cells. J. Environ. Chem. Eng. 2018, 6, 338–355. [Google Scholar] [CrossRef]
  14. Maring, B.J.; Webley, P.A. A new simplified pressure/vacuum swing adsorption model for rapid adsorbent screening for CO2 capture applications. Int. J. Greenh. Gas Control 2013, 15, 16–31. [Google Scholar] [CrossRef]
  15. Ghouma, I.; Jeguirim, M.; Sager, U.; Limousy, L.; Bennici, S.; Däuber, E.; Asbach, C.; Ligotski, R.; Schmidt, F.; Ouederni, A. The Potential of Activated Carbon Made of Agro-Industrial Residues in NOx Immissions Abatement. Energies 2017, 10, 1508. [Google Scholar] [CrossRef]
  16. Ferella, F.; Puca, A.; Taglieri, G.; Rossi, L.; Gallucci, K. Separation of carbon dioxide for biogas upgrading to biomethane. J. Clean. Prod. 2017, 164, 1205–1218. [Google Scholar] [CrossRef]
  17. Siriwardane, R.V.; Shen, M.-S.; Fisher, E.P.; Poston, J.A. Adsorption of CO2 on Molecular Sieves and Activated Carbon. Energy Fuels 2001, 15, 279–284. [Google Scholar] [CrossRef]
  18. Li, G.; Xiao, P.; Webley, P.; Zhang, J.; Singh, R.; Marshall, M. Capture of CO2 from high humidity flue gas by vacuum swing adsorption with zeolite-13X. Adsorption 2008, 14, 415–422. [Google Scholar] [CrossRef]
  19. Millward, A.R.; Yaghi, O.M. Metal-Organic Frameworks with Exceptionally High Capacity for Storage of Carbon Dioxide at Room Temperature. J. Am. Chem. Soc. 2005, 127, 17998–17999. [Google Scholar] [CrossRef] [PubMed]
  20. Furukawa, H.; Ko, N.; Go, Y.B.; Aratani, N.; Choi, S.B.; Choi, E.; Yazaydin, A.O.; Snurr, R.Q.; O’Keeffe, M.; Kim, J.; et al. Ultrahigh Porosity in Metal-Organic Frameworks. Science 2010, 329, 424–428. [Google Scholar] [CrossRef] [PubMed]
  21. Choi, S.; Drese, J.H.; Jones, C.W. Adsorbent materials for carbon dioxide capture from large anthropogenic point sources. ChemSusChem 2009, 2, 796–854. [Google Scholar] [CrossRef] [PubMed]
  22. Wei, H.; Deng, S.; Hu, B.; Chen, Z.; Wang, B.; Huang, J.; Yu, G. Granular Bamboo-Derived Activated Carbon for High CO2 Adsorption:The Dominant Role of Narrow Micropores. ChemSusChem 2012, 5, 2354–2360. [Google Scholar] [CrossRef] [PubMed]
  23. Samanta, A.; Zhao, A.; Shimizu, G.K.H.; Sarkar, P.; Gupta, R. Post-Combustion CO2 Capture Using Solid Sorbents: A Review. Ind. Eng. Chem. Res. 2012, 51, 1438–1463. [Google Scholar] [CrossRef]
  24. Jeguirim, M.; Limousy, L. Biomass Chars: Elaboration, Characterization and Applications. Energies 2017, 10, 2040. [Google Scholar] [CrossRef]
  25. Álvarez-Gutiérrez, N.; Gil, M.V.; Martínez, M.; Rubiera, F.; Pevida, C. Phenol-Formaldehyde Resin-Based Carbons for CO2 Separation at sub-atmospheric pressures. Energies 2016, 9, 189. [Google Scholar] [CrossRef]
  26. Guizani, C.; Jeguirim, M.; Valin, S.; Limousy, L.; Salvador, S. Biomass Chars: The Effects of Pyrolysis Conditions on Their Morphology, Structure, Chemical Properties and Reactivity. Energies 2017, 10, 796. [Google Scholar] [CrossRef]
  27. Heschel, W.; Klose, E. On the suitability of agricultural by-products for the manufacture of granular activated carbon. Fuel 1995, 1786–1791. [Google Scholar] [CrossRef]
  28. Kirubakaran, C.J.; Krishnaiah, K.; Seshadri, S.K. Experimental Study of the Production of Activated Carbon from Coconut Shells in a Fluidized Bed Reactor. Ind. Eng. Chem. Res. 1991, 30, 2411–2416. [Google Scholar] [CrossRef]
  29. Prauchner, M.J.; Rodríguez-Reinoso, F. Chemical versus physical activation of coconut shell: A comparative study. Microporous Mesoporous Mater. 2012, 152, 163–171. [Google Scholar] [CrossRef]
  30. Juárez-Galán, J.M.; Silvestre-Albero, A.; Silvestre-Albero, J.; Rodríguez-Reinoso, F. Synthesis of activated carbon with highly developed “mesoporosity”. Microporous Mesoporous Mater. 2009, 117, 519–521. [Google Scholar] [CrossRef]
  31. Bartocci, P.; Bidini, G.; Saputo, P.; Fantozzi, F. Biochar pellet carbon footprint. Chem. Eng. Trans. 2016, 50, 217–222. [Google Scholar] [CrossRef]
  32. Orrego-Romero, A.F.; Arbeláez-Pérez, O.F.; Bustamante-Londoño, F.; Villa-Holguín, A.L. Pelletization of catalysts supported on activated carbon. A Case Study: Clean synthesis of dimethyl carbonate from methanol and CO2. Revista Facultad de Ingeniería Universidad de Antioquia 2016, 38–47. [Google Scholar] [CrossRef]
  33. Chen, T.; Gu, W.; Li, G.; Wang, Q.; Liang, P.; Zhang, X.; Huang, X. Significant enhancement in catalytic ozonation efficacy: From granular to super-fine powdered activated carbon. Front. Environ. Sci. Eng. 2018, 12, 6. [Google Scholar] [CrossRef]
  34. Gil, M.V.; Álvarez-Gutiérrez, N.; Martínez, M.; Rubiera, F.; Pevida, C.; Morán, A. Carbon adsorbents for CO2 capture from bio-hydrogen and biogas streams: Breakthrough adsorption study. Chem. Eng. J. 2015, 269, 148–158. [Google Scholar] [CrossRef]
  35. Plaza, M.G.; González, A.S.; Pis, J.J.; Rubiera, F.; Pevida, C. Production of microporous biochars by single-step oxidation:Effect of activation conditions on CO2 capture. Appl. Energy 2014, 114, 551–562. [Google Scholar] [CrossRef]
  36. Brunauer, S.; Emmett, P.H.; Teller, E. Adsorption of gases in multimolecular layers. J. Am. Chem. Soc. 1938, 60, 309–319. [Google Scholar] [CrossRef]
  37. Dubinin, M.M. Porous structure and adsorption properties of active carbons. In Chemistry and Physics of Carbon; Walker, P.L., Ed.; Marcel Dekker Inc.: New York, NY, USA, 1966; pp. 51–119. [Google Scholar]
  38. Stoeckli, F.; Ballerini, L. Evolution of microporosity during activation of carbon. Fuel 1991, 70, 557–559. [Google Scholar] [CrossRef] [Green Version]
  39. García, S.; Pis, J.J.; Rubiera, F.; Pevida, C. Predicting mixed-gas adsorption equilibria on activated carbon for precombustion CO2 capture. Langmuir 2013, 29, 6042–6052. [Google Scholar] [CrossRef] [PubMed]
  40. García, S.; Gil, M.V.; Martín, C.F.; Pis, J.J.; Rubiera, F.; Pevida, C. Breakthrough adsorption study of a commercial activated carbon for pre-combustion CO2 capture. Chem. Eng. J. 2011, 171, 549–556. [Google Scholar] [CrossRef]
  41. Rodríguez-Reinoso, F.; Molina-Sabio, M.; González, M.T. The use of steam and CO2 as activating agents in the preparation of activated carbons. Carbon 1995, 33, 15–23. [Google Scholar] [CrossRef]
  42. Do, D.D. Adsorption Analysis: Equilibria and Kinetics; Imperial College Press: London, UK, 1998. [Google Scholar]
  43. Langmuir, I. The adsorption of gases on plane surfaces of glass, mica and platinum. J. Am. Chem. Soc. 1918, 40, 1361–1403. [Google Scholar] [CrossRef]
  44. Ritter, J.A.; Bhadra, S.J.; Ebner, A.D. On the use of the dual process Langmuir model for correlating unary equilibria and predicting mixed-gas adsorption equilibria. Langmuir 2011, 27, 4700–4712. [Google Scholar] [CrossRef] [PubMed]
  45. Bhadra, S.J.; Ebner, A.D.; Ritter, J.A. On the use of the dual process Langmuir model for predicting unary and binary isosteric heats of adsorption. Langmuir 2012, 28, 6935–6941. [Google Scholar] [CrossRef] [PubMed]
  46. Esteves, I.A.; Lopes, M.S.; Nunes, P.M.; Mota, J.P. Adsorption of natural gas and biogas components on activated carbon. Sep. Purif. Technol. 2008, 62, 281–296. [Google Scholar] [CrossRef]
  47. Álvarez-Gutiérrez, N.; García, S.; Gil, M.V.; Rubiera, F.; Pevida, C. Dynamic performance of biomass-based carbons for CO2/CH4 separation. Approximation to a pressure swing adsorption process for biogas upgrading. Energy Fuels 2016, 30, 5005–5015. [Google Scholar] [CrossRef]
  48. Ruthven, D.M.; Farooq, S.; Knaebel, K.S. Pressure Swing Adsorption; VCH Publishers: New York, NY, USA, 1994. [Google Scholar]
  49. Álvarez-Gutiérrez, N.; Gil, M.V.; Rubiera, F.; Pevida, C. Adsorption performance indicators for the CO2/CH4 separation: Application to biomass-based activated carbons. Fuel Proc. Technol. 2016, 142, 361–369. [Google Scholar] [CrossRef]
  50. Ben-Mansour, R.; Habib, M.; Bamidele, O.; Basha, M.; Qasem, N.; Peedikakkal, A.; Laoui, T.; Ali, M. Carbon Capture by Physical Adsorption: Materials, Experimental Investigations and Numerical Modeling and Simulations—A Review. Appl. Energy 2016, 161, 225–255. [Google Scholar] [CrossRef]
  51. Xu, X.; Zhao, X.; Sun, L.; Liu, X. Adsorption separation of carbon dioxide, methane, and nitrogen on Hβ and Na-exchanged β-zeolite. J. Natl. Gas Chem. 2008, 17, 391–396. [Google Scholar] [CrossRef]
  52. Altintas, C.; Avci, G.; Daglar, H.; Azar, A.N.V.; Velioglu, S.; Erucar, I.; Keskin, S. A database for CO2 Separation Performances of MOFs based on Computational Materials Screening. ACS Appl. Mater. Interfaces 2018. [Google Scholar] [CrossRef] [PubMed]
Figure 1. Mass loss and rate of mass loss profiles for CNS. The solid line corresponds to the thermogravimetric (TG) curve and the dashed line represents the derivative of the curve (DTG).
Energies 11 01748 g001
Figure 2. Adsorption isotherm of N2 at −196 °C for the synthetized adsorbent.
Energies 11 01748 g002
Figure 3. Adsorption isotherms of CO2 at 0 °C for the synthetized adsorbent.
Energies 11 01748 g003
Figure 4. CH4 isotherm at different temperatures (dashed line with symbols for Sips, Dual-Site Langmuir and Toth models predictions and symbols for experimental data).
Energies 11 01748 g004
Figure 5. CO2 isotherm at different temperatures (dashed line with symbols for Sips, Dual-Site Langmuir and Toth models fitting and symbols for experimental results).
Energies 11 01748 g005
Figure 6. Breakthrough experiments composed of six successive sorption cycles for an equimolar CO2/CH4 gas mixture at 1 bar. (Solid lines with symbols represent the concentration profiles of CH4, CO2 and He. The blue solid line represents the temperature).
Energies 11 01748 g006
Figure 7. Breakthrough curves for a 50/50 vol % CO2/CH4 binary gas mixture at 1 bar. (Symbols represent CO2 and CH4 concentrations for different cycles).
Energies 11 01748 g007
Table 1. Proximate and ultimate analyses of the raw (CNS).
Proximate Analysis (wt.%)Ultimate Analysis (wt.%, daf)
SampleMoistureAsh (db)CHNSO
CNS12.550.4251.65.60.1042.7
db: dry basis; daf: dry ash free basis.
Table 2. Main textural characteristics of the produced CNS-activated carbon.
AdsorbateVp (cm3/g)SBET (m2/g)Dubinin
nSmic (m2/g)L0 (nm)E0 (kJ/mol)W0 (cm3/g)
N20.631378210431.0421.760.54
CO2--1.7711260.8424.220.47
Table 3. Sips, Dual-Site Langmuir, and Toth-fitting parameters models to CO2 and CH4 pure component adsorption isotherms for the CNS-activated carbon.
ModelComponentT (°C)qs1, qs2, qs and qs*(mol/kg)b1, b2, b and b*(kPa)n (Sips) t(Toth) α
α *
SSR (%)
Dual-siteCH4301.006.630.0137--0.04
0.0012
500.0078--
0.0008
700.0049--
0.0006
CO2301.8610.500.0235--0.20
0.0017
500.0133--
0.0010
700.0078--
0.0006
SipsCH4308.320.00131.210.250.03
500.00081.20
700.00061.18
CO23014.250.00161.300.220.12
500.00091.31
700.00061.29
TothCH43011.640.00220.540.210.03
500.00130.56
700.00080.57
CO23020.730.00390.470.120.13
500.00220.47
700.00130.48

