An Improved Algorithm for Optimal Load Shedding in Power Systems
by
 ,
,
Raja Masood Larik
1,2,* ,
,
Mohd Wazir Mustafa
1, 
Muhammad Naveed Aman
3,
Touqeer Ahmed Jumani
1,4,
Suhaib Sajid
5 and
Manoj Kumar Panjwani
5,6 1
School of Electrical Engineering, Universiti Teknologi Malaysia, Johor Bharu Skudai 81310, Malaysia
2
Department of Electrical Engineering, NED University of Engineering and Technology Karachi, Sindh 75270, Pakistan
3
Department of Computer Science, National University of Singapore, Singapore 119077, Singapore
4
Mehran University of Engineering and Technology SZAB campus Khairpur Mirs, Sindh 66020, Pakistan
5
School of Electrical and Electronic Engineering, North China Electric Power University, Beijing 102206, China
6
Department of Energy Systems Engineering, Sukkur IBA University Pakistan, Sindh 65200, Pakistan
*
Author to whom correspondence should be addressed.
Energies 2018, 11(7), 1808; https://doi.org/10.3390/en11071808
Submission received: 10 June 2018
/
Revised: 30 June 2018
/
Accepted: 3 July 2018
/
Published: 10 July 2018
(This article belongs to the Section F: Electrical Engineering)
Abstract
:A blackout is usually the result of load increasing beyond the transmission capacity of the power system. A collapsing system enters a contingency state before the blackout. This contingency state is characterized by a decline in the bus voltage magnitudes. To avoid blackouts, power systems may start shedding load when a contingency state occurs called under voltage load shedding (UVLS). The success of a UVLS scheme in arresting the contingency state depends on shedding the optimum amount of load at the optimum time and location. This paper proposes a hybrid algorithm based on genetic algorithms (GA) and particle swarm optimization (PSO). The proposed algorithm can be used to find the optimal amount of load shed for systems under stress (overloaded) in smart grids. The proposed algorithm uses the fast voltage stability index (FVSI) to determine the weak buses in the system and then calculates the optimal amount of load shed to recover a collapsing system. The performance analysis shows that the proposed algorithm can improve the voltage profile by 0.022 per units with up to 75% less load shedding and a convergence time that is 53% faster than GA.
1. Introduction
The transition from traditional Supervisory Control and Data Acquisition (SCADA)-based power systems to more intelligent smart grids has picked up pace in many developed and developing countries. Moreover, the increasing demand for electric power has put a lot of pressure on the systems responsible for the operation and control of the highly complex power networks that exist today. Smart grids enable the real-time collection and processing of grid measurements such as voltages and currents at the various buses. The introduction of high-speed measuring devices such as the phasor measurement units (PMUs) has played a major role in improving the monitoring, operation, and control of the modern power grids. PMUs can report power measurements at rates as high as 50 samples per seconds for systems operating at 50 Hz. This enables the energy management systems (EMS) to get real-time models for the power system state for better operation, monitoring, and control of the complex power networks.
The increasing stress on the traditional power systems has resulted in increased blackouts [1]. One of the main causes of power blackouts is voltage instability which is attributed to insufficient generation as well as transmission capacities. In situations where the transmission capacity is not enough for the system to operate normally, power systems employ load shedding mechanisms to reduce the load on the transmission network. The other major challenges faced by power system operators include a change in the nature of loads, the performance of the on load tap changer transformer, the dependency on generation positioned remotely away from load centers, natural load growth, and the influence of protection and control systems. In these situations, the system may start moving toward collapse. However, before the collapse, the system enters into a contingency state. A system is said to be in a contingency state if the load on the system exceeds to a certain limit or a sudden change in the load value occurs leading to an outage of a transmission line or a generator [2].
The stability of a system is dependent on the voltage profile of the power network [3,4]. When a system starts moving toward collapse, one of the indicators is the decline in bus voltages, as the voltage magnitude depends on the reactive power circulating in the system. Therefore, usually when the voltage magnitudes on various buses start to decline, motors are used to recover the voltage magnitude by increasing the amount of reactive power. However, in case of contingency conditions, the existing reactive power sources are not sufficient to stabilize the voltage profile. Moreover, factors such as unexpected load increments or component outages can worsen the situation further. Similarly, voltage instability may not only influence the local load area but may also spread to the adjacent areas in an interconnected power system, commonly known as cascading failures.
Traditionally under-voltage load shedding (UVLS) [3] has been used to recover systems in contingency states and avoid a voltage collapse or blackout. UVLS has been proven to be a robust tool in stabilizing systems suffering from low voltage magnitudes [5,6]. The success of UVLS in stabilizing a system depends on the optimality of the amount, time and location for load shedding. Shedding lesser or more than the required amount of load does not arrest voltage instability and may even lead to a voltage collapse or over frequency problems, respectively. Similarly, shedding load at the wrong place may cause unnecessary interruption, loss of customer trust, and the utility revenue [7]. The time instant at which load shedding needs to be performed is also very crucial as discussed in [8].
Existing techniques for UVLS in smart grids are either based on genetic algorithms (GA) or particle swarm optimization (PSO) algorithms [9]. However, while genetic algorithms may produce accurate results in terms of the optimal amount of load shed, PSO is famous for its fast convergence time. Therefore, the GA based algorithms have high accuracy but require more time to get the optimal solution. Similarly, PSO based algorithms are fast but may fail in arresting the contingency condition. To solve this issue this paper proposes a hybrid technique based on GA and PSO using the state measurements from the PMUs in a smart grid. It is observed that hybrid techniques perform well for large and complex power systems and produce more optimal and higher-quality solutions than individual techniques [10]. The proposed technique uses the fast voltage stability index (FVSI) to select and shed the optimal load on the weak buses. The voltage stability margin is highly influenced by the weakest buses in an interconnected power system [11]. Therefore, the identification of weak buses is necessary for the planning and operation of power systems. A weak bus is defined as a bus whose load-bearing capability is very low and the voltage magnitude is close to collapse identified by a high FVSI value of the lines connected to it.
This paper focuses on developing an algorithm for undervoltage load shedding. The main contributions of this paper are as follows: (i) A hybrid approach using GA as the main framework for the algorithm while employing PSO to improve the selection process; and (ii) Introducing the voltage stability criteria into the objective function of the proposed algorithm.
The rest of the paper is organized as follows. We discuss the related work in Section 2, and Section 3 provides the background for this work. Section 4 presents the problem formulation for the proposed algorithm. Section 5 presents the proposed load shedding algorithm, and Section 6 presents a performance analysis and the simulation results of the proposed algorithm. Finally, Section 7 concludes the paper.
2. Literature Review
A concrete approach offering the least amount and finest location of load shedding was presented in [7]. The proposed technique uses a multi-stage and non-linear approach to find the minimum load shed at each stage [12]. Genetic algorithms (GA) were executed in the Hydro-Quebec system to estimate the amount of load shed in [13,14], but the approach is unable to grip a broader range of load behavior, different scenarios, and short-term voltage instability problems. GA was utilized to investigate for optimal supply restoration approach in the network of distribution system [15]. Likewise, an alternative study [16], showed an optimization tool built on GA to estimate and perform load shed. To solve steady state load shedding problem a novel application of the GA presented in [17]. A new adaptive load shedding technique using GA is proposed in [18]. However, all these techniques suffer from long convergence times due to the use of GA.
An optimal load shedding strategy based on PSO minimization of power loss and load shed is presented in [19]. An implementation of PSO to evaluate optimal UVLS in competitive electricity markets is analyzed in [20]. Similarly, an improved model for optimal UVLS using PSO is presented in [21]. The proposed method minimizes the service interruption cost by considering static stability margin and its sensitivity. In another work, a load shedding technique for contingency situations using PSO and the analytical hierarchy process is presented in [22]. The authors of [23] used dynamic voltage security and PSO for UVLS to provide sufficient voltage stability margin. However, all these techniques based on PSO suffer from two major problems. First, they result in sub-optimal load shed, and second, they make a strong assumption regarding load dynamics.
Optimal Power Flow (OPF) methodologies are used in dynamic simulations by some researchers [5,6,24,25,26]. Even though using load dynamics gives better information about load characteristics, it results in longer computation and calculation times. Similarly, the authors of [27,28], concluded that it is not feasible to fit load dynamics in an optimization framework due to the long simulation times.
Many hybrid techniques for optimal UVLS have been proposed. PSO was combined with simulated annealing (SA) to tackle the UVLS problem efficiently in [29]. The technique was tested on the IEEE 14 and 118 bus test systems. However, this technique can only be used for long-term voltage stability and is unsuitable for short-term voltage collapse. Similarly, PSO and linear programming (LP) were combined to resolve the issues of low convergence and eliminate transmission line overloading in [30]. The technique was implemented on the IEEE 14 bus system and had a fast convergence time. However, it was unable to solve non-linear problems. A technique based on modal analysis and PSO to achieve optimal load shedding and voltage stability was proposed in [26]. However, the proposed technique works well on transmission networks only. To prevent voltage instability a new integer value model for optimal load shedding was achieved through hybrid discrete PSO by considering multiple objectives in [31]. However, the proposed method suffered from long convergence time due to too many objectives.
The most relevant technique in literature is [32]. In this technique, the authors propose the use of a hybrid algorithm based on GA and PSO. It uses PSO as the main framework and employs the reproduction technique of GA to produce the best child. However, this technique has the following drawbacks: First, the cross-over operator of GA is time consuming resulting in longer convergence time. Second, it does not consider the voltage stability constraint resulting in suboptimal load shedding.
Thus, there are three main issues with existing techniques: (1) techniques that use GA have high accuracy but suffer from long convergence times, (2) techniques that use dynamic simulations require long simulations to obtain the optimal amount of load shedding, and (3) hybrid techniques can achieve fast convergence but either suffer from suboptimal results or have limited applicability. To address these issues, this paper proposes a hybrid technique based on the GA and PSO algorithms with the following properties:
- High Accuracy: The proposed algorithm can significantly improve the voltage magnitudes of the power system buses while shedding the least amount of load. The high accuracy comes from utilizing GA in the proposed algorithm.
- Fast Convergence: The proposed algorithm uses PSO to speed up the operation of GA i.e., it replaces the time consuming local search mechanism of GA with the highly efficient global search mechanism of PSO. This results in fast convergence for the proposed algorithm.
3. Preliminary Background
3.1. Fast Voltage Stability Index
Consider the two bus network shown in Figure 1. The FVSI value Fij for the line connecting bus i and j can be calculated as follows:
where Xij and Zij are, respectively, the line reactance and impedance values between line i and j. Qj is the reactive power flow at bus j, and Vi is the voltage at bus i.
FVSI can be used to identify critical areas in large and complex power systems. In particular, it can be used to determine the point of voltage collapse, maximum permissible load, weak buses and the most critical line in an interconnected system. FVSI is considered a strong index for analyzing the on-line voltage stability assessment in power systems [33]. To show that FVSI can identify the weak buses in an interconnected power system, we simulated an IEEE 30 bus system in MATLAB (developed by Mathworks, University of New Mexico, Albuquerque, NM, USA) and plotted the FVSI value and the voltage magnitude for the most critical line against the reactive power and is presented in the Section 6 of the study. It can be observed that the FVSI value for the line increases as the voltage drops. Therefore, FVSI can be used to indicate the weak buses in the system.
3.2. Genetic Algorithms
GAs have obtained substantial attention as a robust stochastic search algorithm [9]. The algorithm is based on the biology of natural evolution by applying the “survival of the fittest” rule to a set of the population, yielding superior estimates of the solution in a continuous cycle on the limit of predetermined constraints. Based on an individual’s level of fitness, each generation (solution) produces a new set of estimations. The resulting set of individuals (solutions) is superior in terms of their adaptation to the given conditions [34,35].
GA uses multiple iterations to evolve a population of candidate solutions (called individuals) into a better solution to an optimization problem. Each individual has set of chromosomes i.e., a set of properties which can be altered and mutated to form better solutions. GA usually starts with an initial population of randomly generated individuals. The population in an iteration is called its generation. The fitness of each individual is evaluated using the objective function of the optimization problem being solved to stochastically form a set of fit individuals. The selected set of fit individuals is then used to form the next generation by modifying or randomly mutating each individual’s chromosomes. This process continues until we reach a specified number of generation (iteration) or a predefined optimum value for the objective function is achieved. The steps for the GA algorithm are given below:
- Initialization: Generate an initial population of random chromosomes of size N: x1, x2, ...…, xN.
- Fitness: The fitness function creates the basis for choosing chromosomes that will be coupled during reproduction. Calculate the fitness of each individual chromosome: f(x1), f(x2), ……, f(xN).
- Selection: Parent chromosomes are selected with a probability related to their fitness.
- Crossover: Selected parents are crossed with probability Pcross resulting in a new child.
- Mutation: New child modified with probability Pmut.
- Acceptance and Replacement: Accept new children if found better in fitness than the previous generation.
- Termination Criteria: If a maximum number of iterations reached or best solution achieved terminate the algorithm. Otherwise, go to step 2.
3.3. Particle Swarm Optimization
In 1995, Kennedy and Eberhard introduced Particle Swarm Optimization (PSO) [36,37]. Inspired by the social behavior of birds flocking and fish schooling, a swarm intelligence technique, PSO was established to be fast and robust in resolving large-scale non-linear multi-objective optimization problems.
PSO starts with an initial population (called a swarm) of randomly generated particles (solutions). In every iteration, these particles are moved around by following two best values. The first one called pbest (for particle best) is the best solution (fitness) that the current particle has achieved so far. The second one called the gbest (for global best) is the best solution achieved by any of the particles in the population so far. Formally, let f: ℝn → R be the objective function that needs to be minimized. A vector of real numbers (the particles) is given to the objective function as an input to get the objective function value. The goal is to find a set of particles a such that f(a) ≤ f(b) for all b in the search space i.e., the objective function value of the next generation is lower (better) then the objective function value of the given candidate solution. The steps of the PSO algorithm are given below.
- Initialization: Produce an initial population of random generated particles of size M: y1, y2, ......, yM
- Fitness: The criteria for choosing particles is based on their fitness. Calculate the fitness of each individual particle. f(y1), f(y2), ...... f(yM)
- Selection: Update each particle’s personal best solution Ppbest by comparing the current Ppbest with f(yi).
- Velocity Update: Update the velocity for all particles using the PSO velocity equation
- Position Update: Update the position for all particles using the PSO position equation
- Evaluation: Evaluate the fitness function of all particles (with updated position and velocity) and find and update the global best solution Pgbest.
- Termination Criteria: If a maximum number of iterations reached or best solution achieved terminate the algorithm. Otherwise, go to step 2.
4. Problem Formulation
In this section, we represent UVLS as an optimization problem. We then use this optimization problem to propose the algorithm for UVLS in Section 5.
The two main objectives for UVLS are as follows: (1) minimize the total amount of load shed at the selected buses (FLS), and (2) minimize the voltage drop at all buses (FVD). We can formalize this optimization problem as follows:
Subject to:
where the set of notations is given in Table 1. Note that Equation (2) represents the objective function. Equations (3) and (4) represent the equality constraints for active and reactive powers. Similarly, Equations (5) and (6) represent the inequality constraints for the minimum/maximum active and reactive powers at the generation buses. Moreover, Equation (7) is the inequality constraint to maintain the voltage between the allowable range of minimum and maximum voltages. Finally, Equation (8) represents the inequality constraint to limit the amount of load shedding on any bus to 5%–20%. We propose an improved UVLS algorithm based on this optimization problem in the next section.
5. Proposed UVLS Algorithm
In this section, we describe the proposed algorithm to calculate the optimal amount of load shed for the power system in the contingency state.
In the field of optimization, hybrid metaheuristics have emerged with superior results in terms of best fitness and computation time. The two most common used optimization algorithms are the GA and PSO with their pros and cons. However, GA is popular for the accuracy of the solution it generates. However, GA suffers from long convergence times [12]. Similarly, PSO is popular for its short convergence time but may not always converge to the best solution. GA and PSO have been shown to be well suited for generator and line outage cases [9]. Therefore, by proposing a hybrid scheme based on GA and PSO in this work, it is expected to combine the strengths of these techniques and produce a better algorithm than either of the algorithms deployed alone. The proposed algorithm effectively utilizes the values of FVSI index (threshold values) for selection of weak buses. Moreover, the comprehensive methodology can be seen in the flowchart as shown in Figure 2.
Algorithm 1 shows the proposed algorithm to obtain the optimal amount of load shed. The steps are explained below.
- (1)
- An initial population of size Psize is initialized with random candidate solutions.
- (2)
- Repeat for NIter number of iterations
- (i)
- Optimize the current population using PSO i.e., move the particles in the population towards the global best solution in PSO.Select weak buses based on above threshold values of FVSI
- (ii)
- Initialize an empty array Parents.
- (iii)
- Sort the population in ascending order of cost function for each candidate solution and select Psize − Ksize candidate solution with the minimum cost and add them to an array named Parents.
- (iv)
- Initialize an empty array Children.
- (v)
- For each pair of parents P1 and P2 in Parents
- (a)
- Produce two off springs Child1 and Child2 using the GA crossover function with probability Pcross.
- (b)
- Apply the GA mutation function on Child1 with probability Pmut.
- (c)
- Apply the GA mutation function on Child2 with probability Pmut.
- (d)
- Add Child1 and Child2 to the array Children.
- (vi)
- Replace the current population with Children keeping Ksize candidate solutions from the current population. This produces the next generation.
- (vii)
- Evaluate the cost function on all the candidate solutions in the new population.
- (viii)
- Find and assign the candidate solution which gives the minimum value of the cost function to Sbest.
- (3)
- Return the best solution Sbest.
The steps for the PSO function are as follows:
- (1)
- Calculate the size of the population Npar.
- (2)
- Initialize the global best solution Pgbest to a maximum value φ.
- (3)
- For each particle P in the population repeat the following steps:
- (i)
- Initialize the particle’s best solution Ppbest to a maximum value φ.
- (ii)
- Calculate the velocity of the current particle using PSO’s velocity function.
- (iii)
- Calculate the position of the current particle using PSO’s position function.
- (iv)
- If the current position evaluates into a lower value of the cost function as compared to Ppbest then assign this value to Ppbest.
- (v)
- If the particle’s current best solution has a lower value as compared to Pgbest then assign this value to Pgbest.
- (vi)
- Update the current particle’s position in the population i.e., replace the current particle (candidate solution) with the optimized solution.
The longer convergence time of GA is attributed to its time consuming local search mechanism. To solve this issue, the proposed algorithm replaces the local search mechanism of GA with the global search mechanism of PSO as shown in line 3 of Algorithm 1. After obtaining the global solutions using PSO, the resulting optimum values are employed by GA to obtain the optimum value of load shed.
| Algorithm 1. Algorithm for Obtaining Optimal Load Shed | |
| Input: Popsize, Ksize, NIter, Pcross, Pmut | |
| Output: SB | |
| 1 | Pop ← Initialize random population (Psize) |
| 2 | for iter = 1 to NIter do |
| // Update Population using PSO function | |
| 3 | Pop = PSO (Pop) |
| 4 | Parents = [] |
| // Selection | |
| 5 | Parents ← Select Parents Based on Minimum Cost from Population |
| // Crossover | |
| 6 | Children ← [] |
| 7 | for each P1, P2 ∈ Parents do |
| 8 | Child1, Child2 ← Crossover (P1, P2, Pcross) |
| // Mutation | |
| 9 | Child1 ← Mutate (Child1, Pmut) |
| 10 | Child2 ← Mutate (Child2, Pmut) |
| 11 | Add Child1 and Child2 to Children |
| 12 | end |
| // Replace Population with New Generation and keep Ksize Candidates from current Generation | |
| 13 | Pop ← Replace (Pop, Children, Ksize) |
| 14 | θ ← f (population) |
| 15 | Sbest ← Candidate Solution with a minimum value of θ |
| 16 | end |
| 17 | Return Sbest |
| 18 | Function PSO (Pop) |
| // Calculate the Size of the Population | |
| 19 | Npar ← Size(Pop) |
| 20 | Pgbest = φ |
| // Randomly move Particles to the optimal Solution | |
| 21 | for each P ∈ Population do |
| 22 | Ppbest = φ |
| 23 | PVel ← Update Velocity (PVel, Ppbest, Pgbest) |
| 24 | PPos ← Update Position (PPos, PVel) |
| 25 | if f (PPos) ≤ Ppbest then |
| 26 | Ppbest ← f (PPos) |
| 27 | if Ppbest ≤ Pgbest then |
| 28 | Pgbest ← Ppbest |
| // Update the Current Particle’s Position in the Population. | |
| 29 | Pop(P) ← PPos |
| 30 | end |
| 31 | end |
| 32 | end |
| 33 | Return Pop |
6. Performance Analysis and Results
In this section, we evaluate the performance of the proposed load shedding scheme by performing simulations in MATLAB using the MATPOWER toolbox [38]. The simulations were tested on the IEEE 30-bus test system shown in one line diagram Figure 3.
Figure 4 shows the FVSI index values of all 41 lines against 1.6 loading factor. It is observed that there are seven lines whose FVSI values exceeds 0.25 (set as the threshold value for the selection of weak buses) as shown in Table 2 and termed as a critical line. Moreover, it is observed that the voltage of these busses connected to the critical lines drops below the normal value as shown in Figure 5. This shows that the busses connected to the critical lines can be termed as weak. The information of weak buses is given in Table 2.
To appreciate the significance of FVSI in identifying the weak buses we simulated the IEEE30-bus test system and plotted the voltage magnitudes and FVSI values against increasing values of reactive power (which captures the effect of increasing reactive load on the system) for bus number 30. Note that the voltage magnitude is adversely affected by the amount of reactive power. The corresponding plot is shown in Figure 5, which shows that FVSI values increase as the voltage magnitude of the bus decreases. Thus, FVSI values can be used to identify the weak buses in the system.
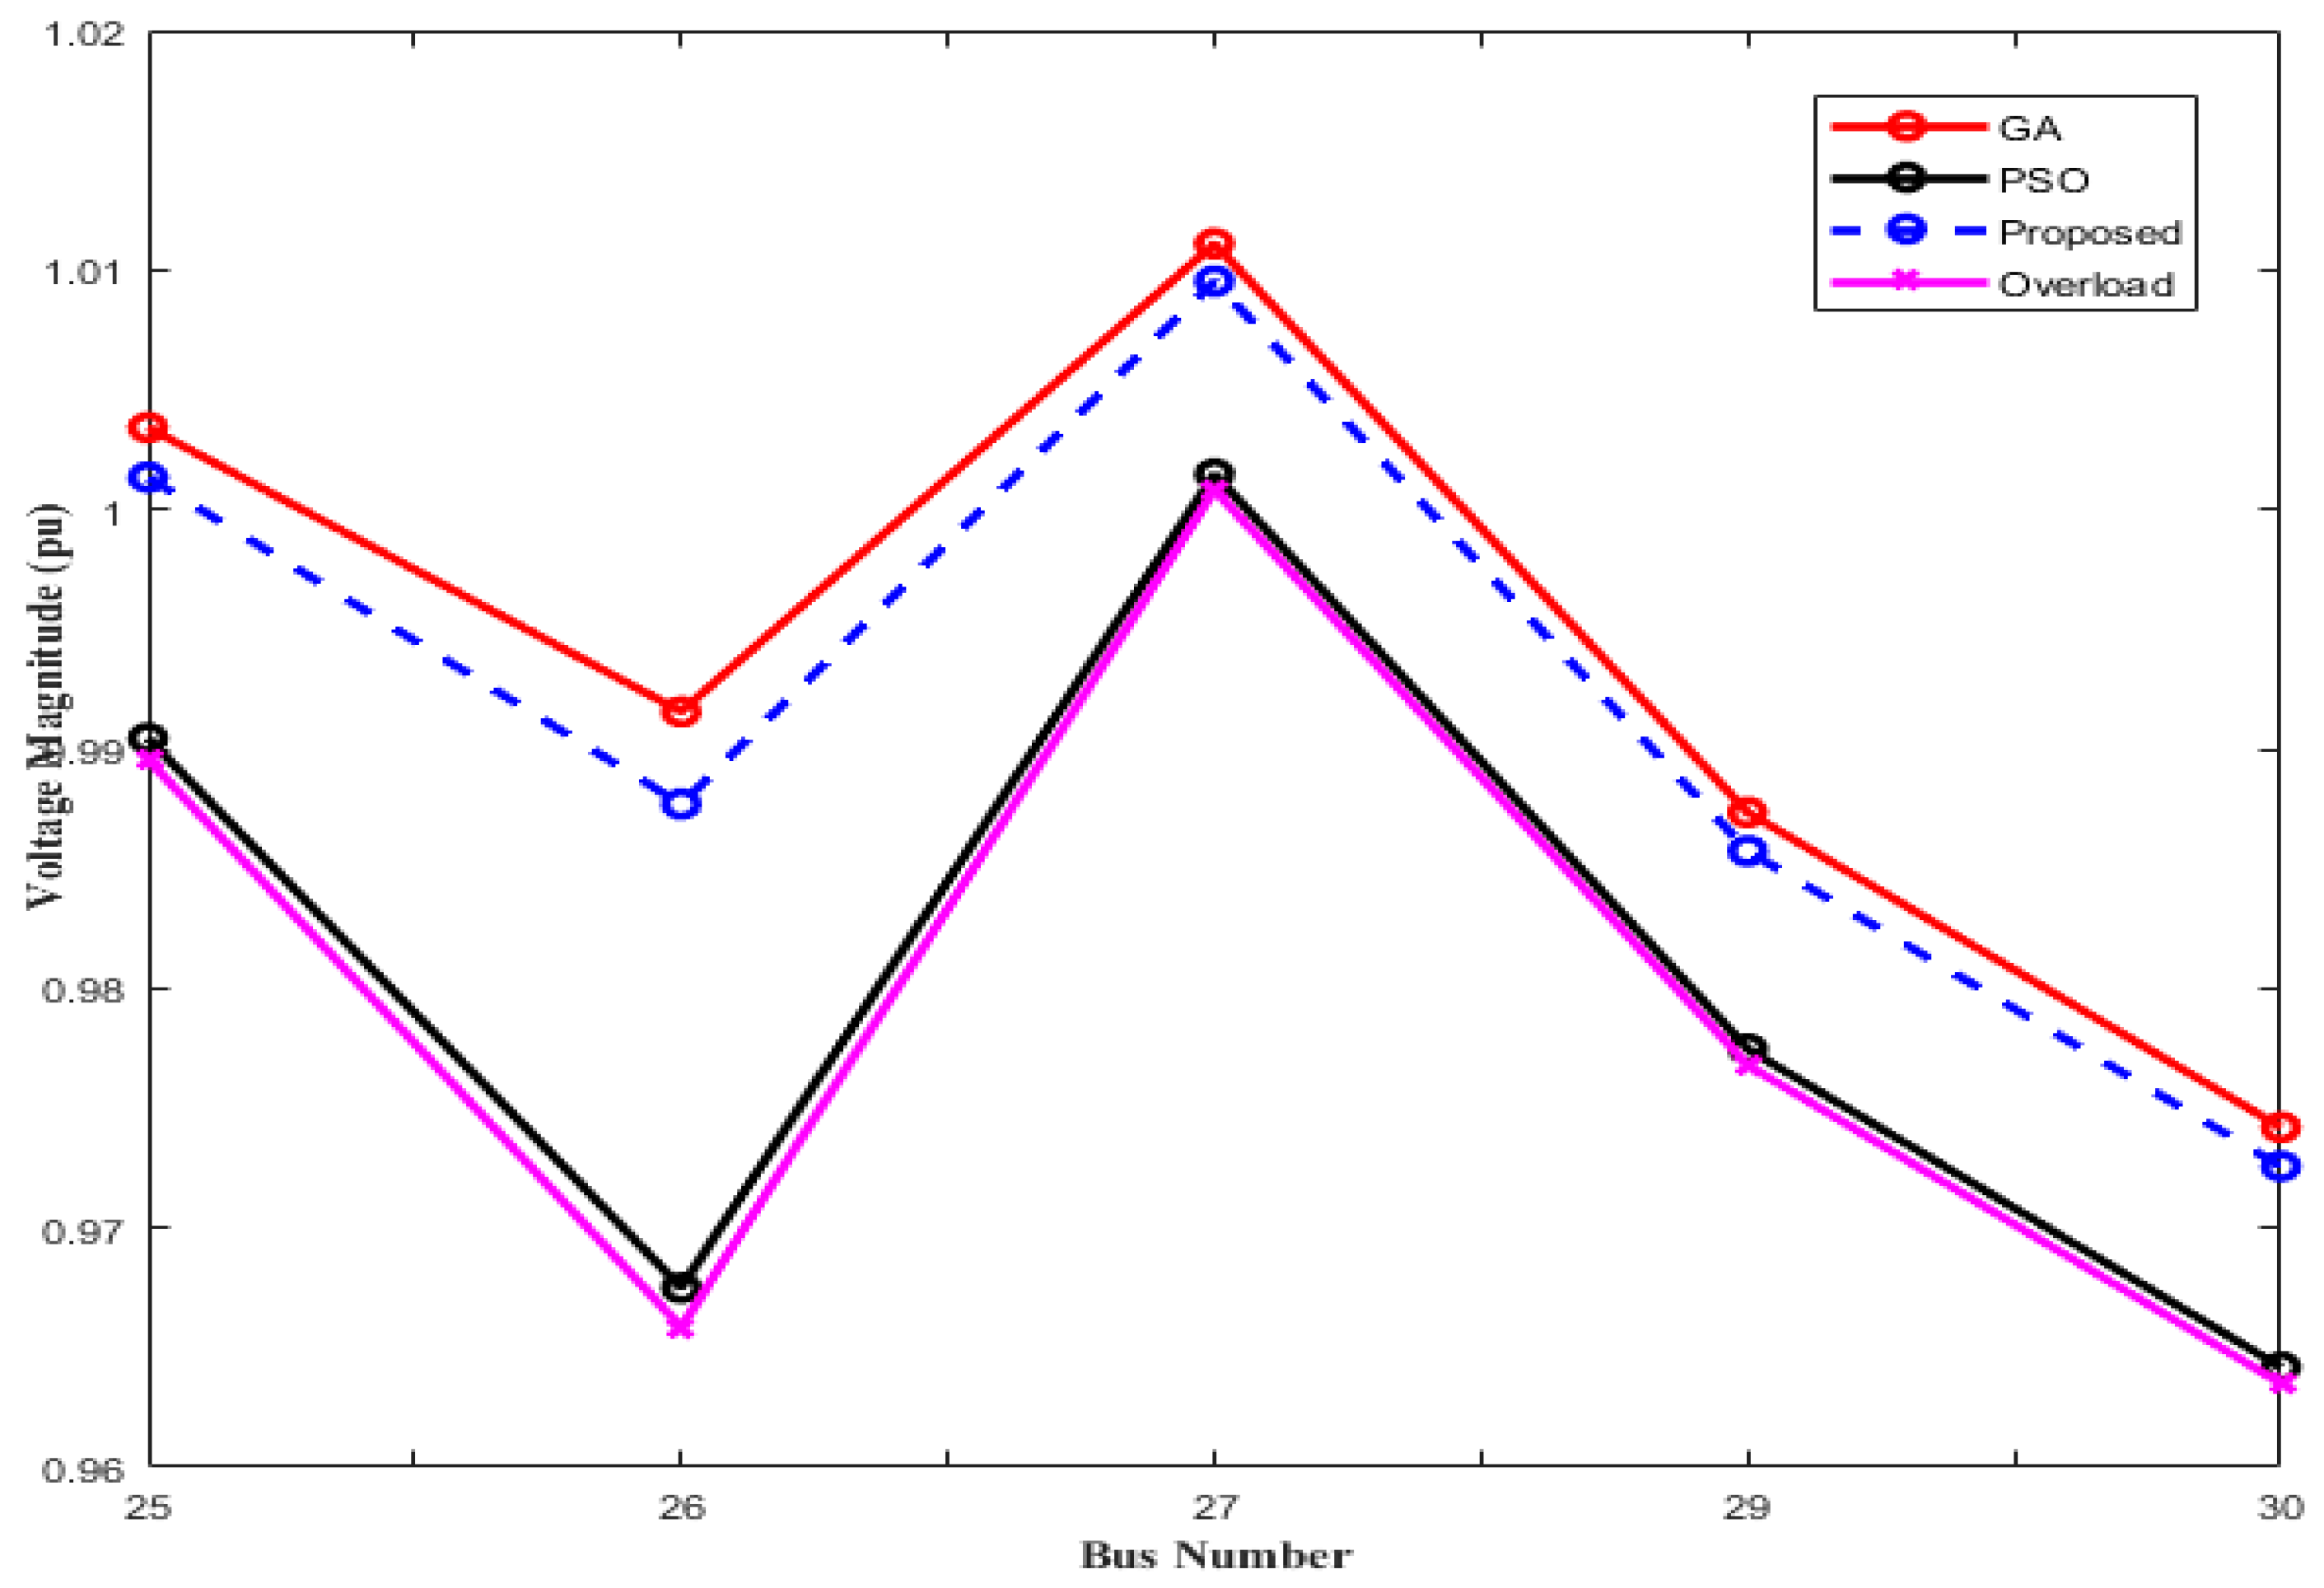
Real-time estimation of power transmission line impedance parameters presented in [39]. Performance and accuracy investigation of two-step algorithm for power system state and line temperature estimation presented in [40]. To asses the performance of the proposed algorithm, we compare it with the GA and PSO algorithms applied individually to the current scenario. GA and PSO are adopted as a reference in view of the fact that many state-of-the-art techniques are instantiations of these two algorithms. We simulated the IEEE 30 bus system with a loading factor of 1.6 which corresponds to 60% overloading. The results for the voltage magnitudes for the five weak buses are shown in Figure 6. This figure shows that the proposed algorithm can maintain a voltage magnitude approximately equal to the GA solution. However, the proposed algorithm clearly outperforms PSO in maintaining a better voltage profile. For example, there is an improvement of 2.1% and 2.3% of the voltage magnitude for bus 26 over the voltage magnitude resulting from applying PSO, and no optimization, respectively.
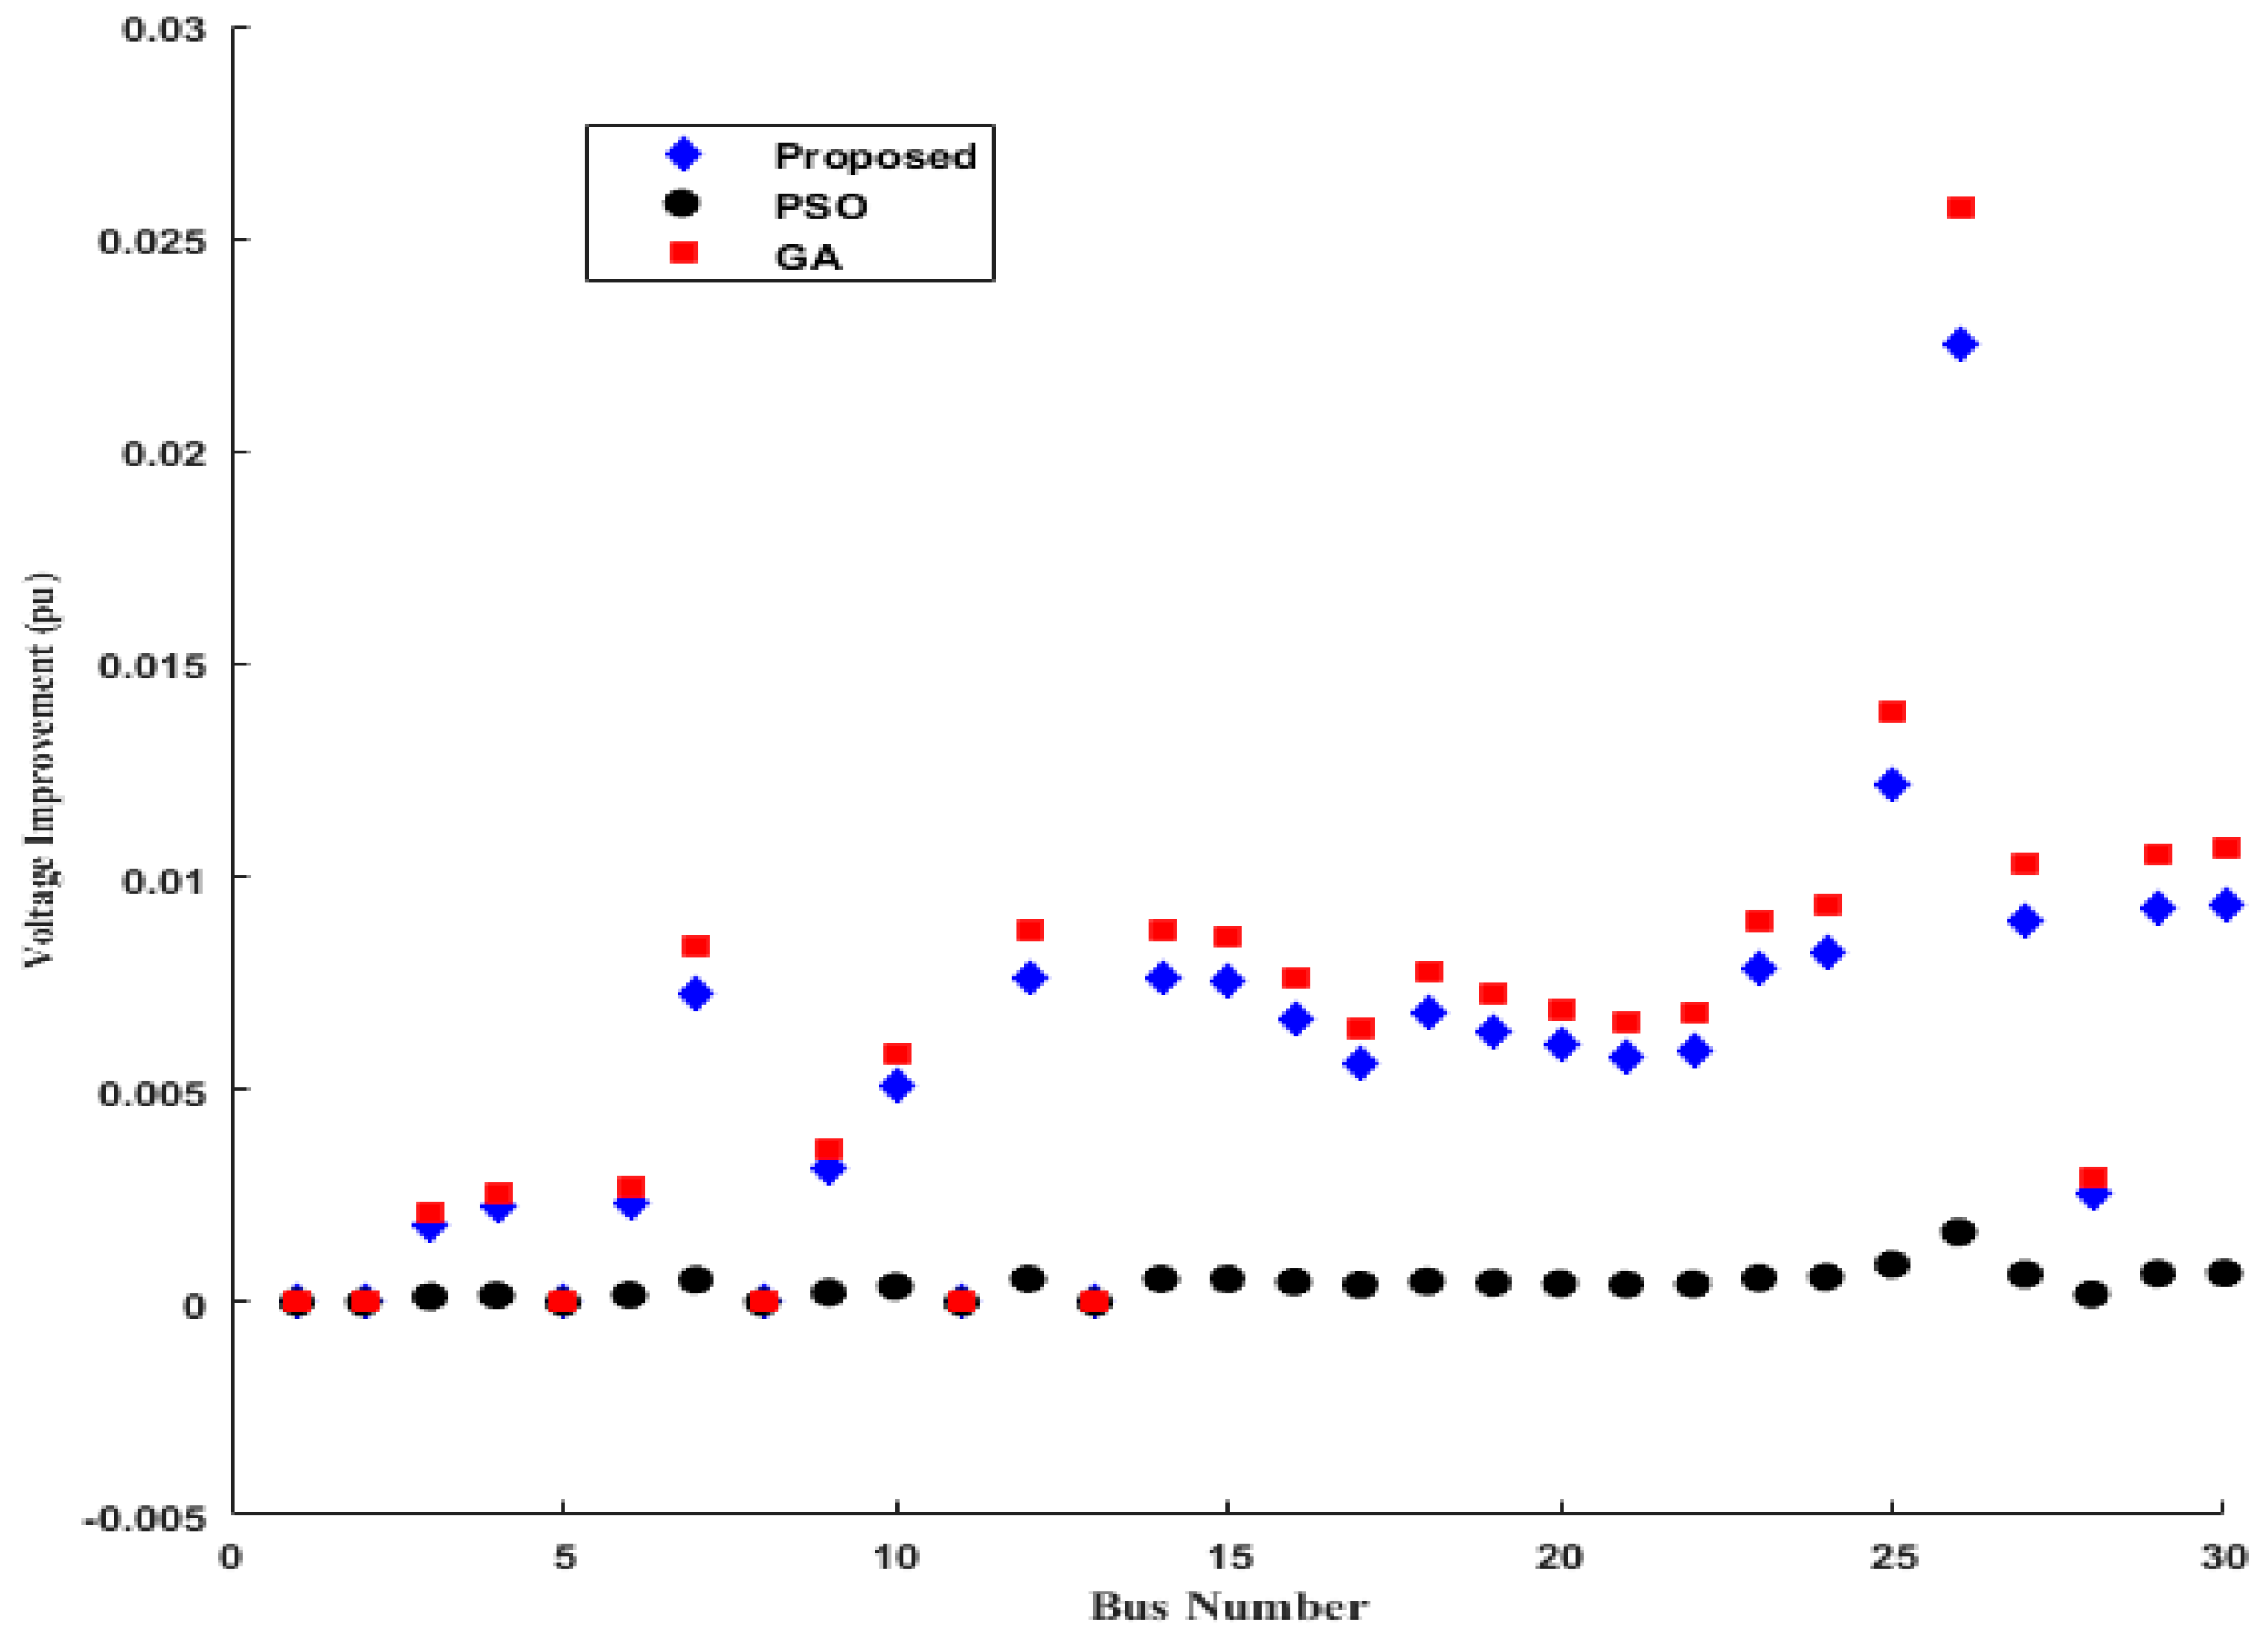
Figure 7 shows the improvement of the voltage profile as compared to the overload case with no optimization for the 30 buses using GA, PSO, and the proposed algorithm. We observe that PSO results in negligible improvement while GA and the proposed algorithm result in significant improvement in the voltage magnitudes of the various buses. For example, the proposed algorithm improved the voltage magnitude of bus 26 by 0.0222 per units, while, GA improved the voltage magnitude for this bus by 0.0257 per units.
Similarly, Figure 8 plots the voltage magnitude at the weakest bus i.e., bus 26 against an increasing value of loading factor. Thus, we study the trend of voltage magnitude as we increase the load on the buses. We observe that GA and the proposed algorithm have successfully maintained the voltage magnitude of bus 26 close to 1 per unit. However, PSO fails to recover the voltage magnitude and we see a significantly lower voltage magnitude at bus 26 when we increase the load.
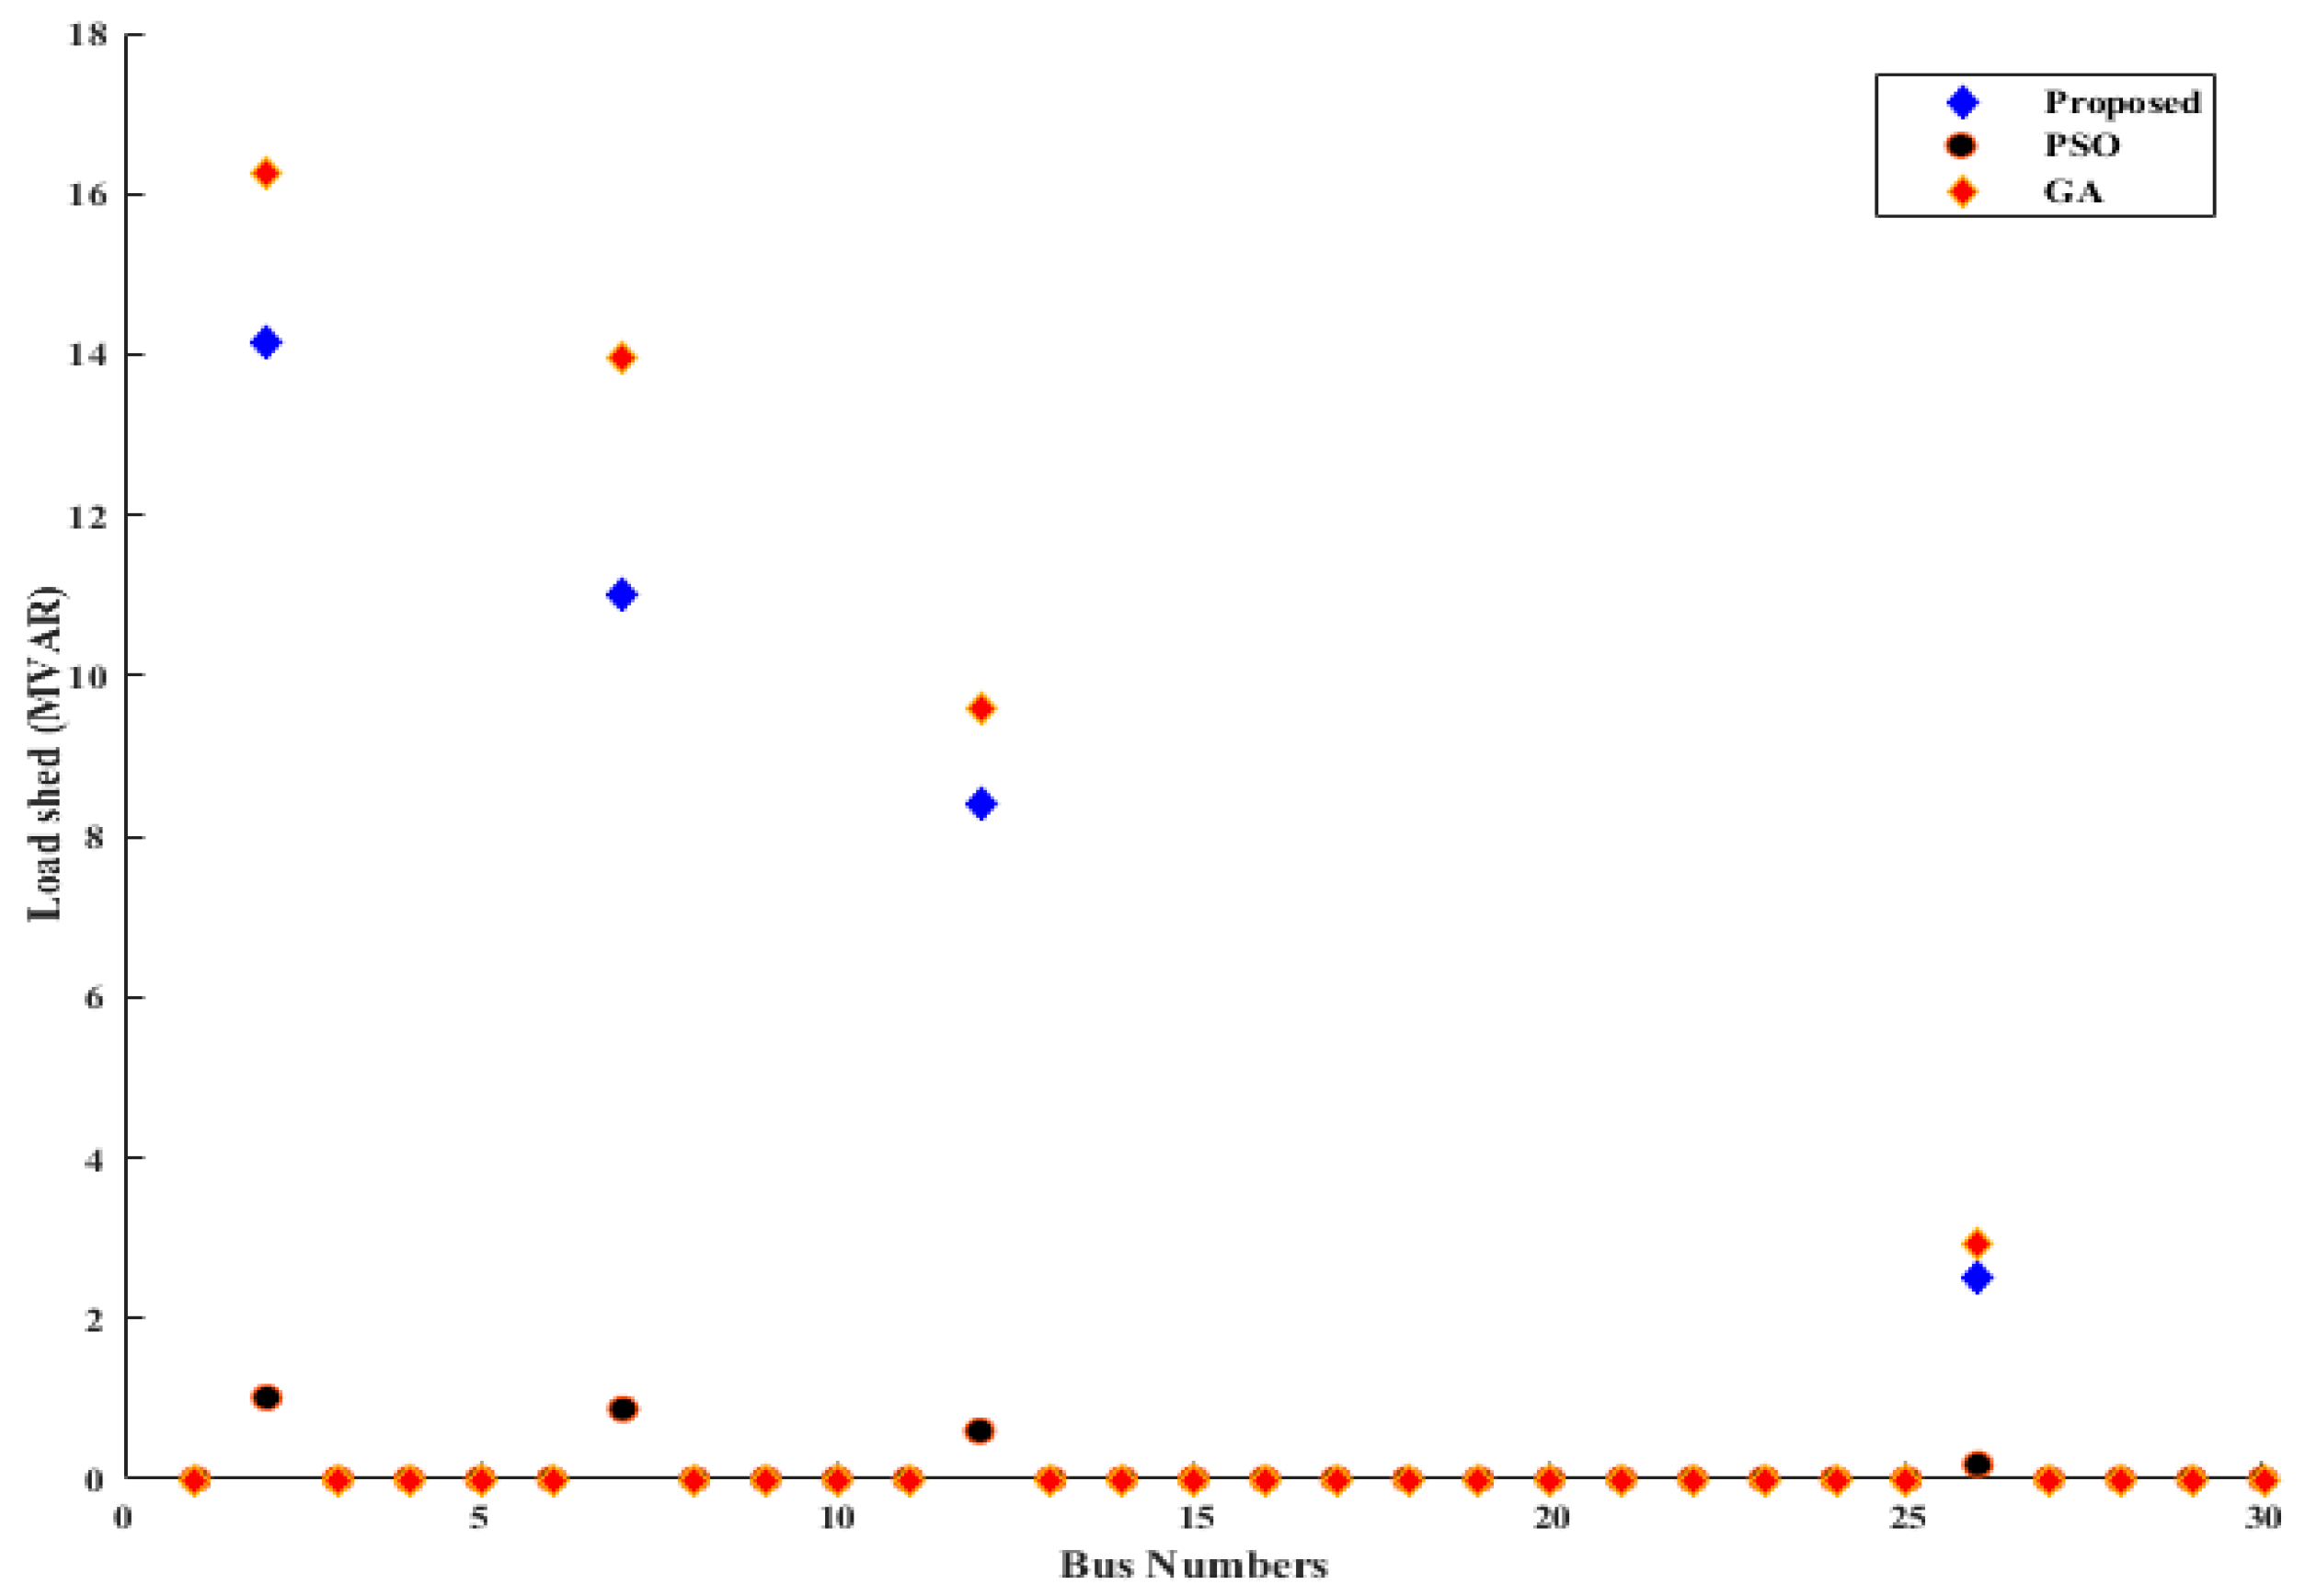
Figure 9, shows the amount of load shedding done by GA, PSO, and the proposed algorithm on each bus. We observe that GA resulted in the most load shed with a total amount of load shedding of 16.256 MVARs (reactive power mega volts amperes) The proposed algorithm resulted in a total load shed of 13.5432 MVARs, while PSO shed the least amount of load i.e., 1.016 MVARs. This shows that the proposed algorithm resulted in 17% less load shed as compared to GA. However, the proposed algorithm is still able to maintain a voltage profile comparable to GA as shown in Figure 6. Moreover, PSO resulted in under-shedding due to which it was not able to improve the voltage profile.
Figure 10 shows the total amount of load shedding on five weak buses against the loading factor. We observe that the proposed algorithm resulted in significantly lower load shedding as compared to GA. For example, with an overloading of 30%, the proposed algorithm resulted in 75% lesser load shedding as compared to GA. Similarly, PSO resulted in under-shedding of load and could not arrest the voltage decline.
To evaluate the convergence time of the three algorithms we refer to Figure 11. This figure shows the convergence plots for PSO, GA, and the proposed algorithm. The three algorithms were run on an intel core i7-7700 HQ CPU @ 2.8 Ghz running Windows 10. We observe that PSO converges in the least number of iterations i.e., nine with a computation time of 3.60 s, while the proposed algorithm converges in 13 iterations with a computation time of 13.30 s. However, GA requires 23 iterations to converge with a computation time of 28.56 s. This shows that proposed algorithm clearly outperforms GA in terms of convergence time.
7. Conclusions
This paper proposed a UVLS algorithm for power systems. The proposed algorithm can significantly improve the voltage profile of a power system in a contingency state and avoid a blackout. The proposed algorithm combines the advantages of GA and PSO algorithms to produce a hybrid. The proposed algorithm achieves higher accuracy by employing GA while uses the global search mechanism of PSO to reduce the local search time of GA, which results in a fast convergence rate. The weak buses for load shedding are selected using the FVSI values. The results show that the proposed algorithm and GA can significantly improve the voltage magnitude of weak buses. However, PSO could not arrest the voltage decline. Although the proposed algorithm and GA resulted in approximately the same voltage magnitudes for the weak buses, the proposed algorithm reduced the amount of load shedding by up to 75% as compared to GA. Moreover, the convergence time of the proposed algorithm is also 53% faster than GA. This shows that the proposed UVLS algorithm can be used in real time as an effective tool to recover a system in a contingency state.
Author Contributions
All authors contributed to bringing the manuscript to its current state. Their contributions include study design, the detailed survey of the literature, development of the model, results, and analyses for the completion of this study.
Acknowledgments
The authors would like to acknowledge the facilities provided by Universiti Teknologi Malaysia for the accomplishment of this work and Ministry of Education (MoE) of Malaysia for their financial support under vote number GUP UTM 17H10. RML is also thankful to NED University of Engineering and Technology Sindh, Pakistan for providing financial assistance by Human Resource Development under the scheme “Strengthening of NED University of Engineering and Technology, Mega-M3” of the Higher Education Commission (HEC), Pakistan.
Conflicts of Interest
The authors declare no conflict of interest.
References
- Andersson, G.; Donalek, P.; Farmer, R.; Hatziargyriou, N.; Kamwa, I.; Kundur, P.; Martins, N.; Paserba, J.; Pourbeik, P.; Sanchez-Gasca, J.; et al. Causes of the 2003 major grid blackouts in North America and Europe, and recommended means to improve system dynamic performance. IEEE Trans. Power Syst. 2005, 20, 1922–1928. [Google Scholar] [CrossRef]
- Charoenphan, B.; Audomvongseree, K. Optimal load shedding scheme under contingency condition considering voltage stability problem. In Proceedings of the 2010 International Conference on Electrical Engineering/Electronics Computer Telecommunications and Information Technology (ECTI-CON), Chiang Mai, Thailand, 19–21 May 2010; pp. 1006–1010. [Google Scholar]
- Taylor, C.W. Concepts of undervoltage load shedding for voltage stability. IEEE Trans. Power Deliv. 1992, 7, 480–488. [Google Scholar] [CrossRef] [Green Version]
- Arnborg, S.; Andersson, G.; Hill, D.J.; Hiskens, I.A. On undervoltage load shedding in power systems. Int. J. Electr. Power Energy Syst. 1997, 19, 141–149. [Google Scholar] [CrossRef]
- Ladhani, S.S.; Rosehart, W. Under voltage load shedding for voltage stability overview of concepts and principles. In Proceedings of the 2004 IEEE Power Engineering Society General Meeting, Denver, CO, USA, 6–10 June 2004; pp. 1597–1602. [Google Scholar]
- Van Cutsem, T.; Moors, C.; Lefebvre, D. Design of load shedding schemes against voltage instability using combinatorial optimization. In Proceedings of the 2002 IEEE Power Engineering Society Winter Meeting, New York, NY, USA, 27–31 January 2002; pp. 848–853. [Google Scholar]
- Moors, C.; Lefebvre, D.; van Cutsem, T. Design of load shedding schemes against voltage instability. In Proceedings of the 2000 IEEE Power Engineering Society Winter Meeting, Singapore, 23–27 January 2000; pp. 1495–1500. [Google Scholar]
- Lefebvre, D.; Moors, C.; van Cutsem, T. Design of an undervoltage load shedding scheme for the Hydro-Québec system. In Proceedings of the 2003 IEEE Power Engineering Society General Meeting, Toronto, ON, Canada, 13–17 July 2003. [Google Scholar]
- Laghari, J.; Mokhlis, H.; Bakar, A.; Mohamad, H. Application of computational intelligence techniques for load shedding in power systems: A review. Energy Convers. Manag. 2013, 75, 130–140. [Google Scholar] [CrossRef]
- Lopes, J.P.; Wa, W.C.; Proença, L. Genetic algorithms in the definition of optimal load shedding strategies. In Proceedings of the International Conference on Electric Power Engineering, PowerTech Budapest 99, Budapest, Hungary, 29 August–2 September 1999; p. 154. [Google Scholar]
- Sauer, P.; Pai, M. Power system steady-state stability and the load-flow Jacobian. IEEE Trans. Power Syst. 1990, 5, 1374–1383. [Google Scholar] [CrossRef]
- Irving, M.; Luan, W.; Daniel, J. Supply restoration in distribution networks using a genetic algorithm. Int. J. Electr. Power Energy Syst. 2002, 24, 447–457. [Google Scholar] [CrossRef]
- Guichon, M.; Melo, M.; Nieto, A.C.; Vignolo, M.; Yedrzejewski, N. Automatic Load Shedding Calculated with genetic algorithms-DAC-CMAG. In Proceedings of the 2012 Sixth IEEE/PES Transmission and Distribution: Latin America Conference and Exposition (T&D-LA), Montevideo, Uruguay, 3–5 September 2012; pp. 1–7. [Google Scholar]
- Al-Hasawi, W.M.; El Naggar, K.M. Optimum steady-state load-shedding scheme using genetic based algorithm. In Proceedings of the 11th IEEE Mediterranean Electrotechnical Conference, (MELECON 2002), Cairo, Egypt, 7–9 May 2002; pp. 605–609. [Google Scholar]
- Sanaye-Pasand, M.; Davarpanah, M. A new adaptive multidimensioanal load shedding scheme using genetic algorithm. In Proceedings of the Canadian Conference on Electrical and Computer Engineering, Saskatoon, SA, Canada, 1–4 May 2005; pp. 1974–1977. [Google Scholar]
- Karimi, M.; Mokhlis, H.; Bakar, A.; Laghari, J.; Shahriari, A.; Aman, M. Combination of adaptive and intelligent load shedding techniques for distribution network. In Proceedings of the 2012 IEEE International Power Engineering and Optimization Conference (PEDCO), Melaka, Malaysia, 6–7 June 2012; pp. 57–61. [Google Scholar]
- Dolan, M.J.; Davidson, E.M.; Kockar, I.; Ault, G.W.; McArthur, S.D. Distribution power flow management utilizing an online optimal power flow technique. IEEE Trans. Power Syst. 2012, 27, 790–799. [Google Scholar] [CrossRef]
- Zabaiou, T.; Dessaint, L.-A.; Kamwa, I. Preventive control approach for voltage stability improvement using voltage stability constrained optimal power flow based on static line voltage stability indices. IET Gener. Transm. Distrib. 2014, 8, 924–934. [Google Scholar] [CrossRef]
- He, F.; Wang, Y.; Chan, K.W.; Zhang, Y.; Mei, S. Optimal load shedding strategy based on particle swarm optimization. In Proceedings of the 8th International Conference on Advances in Power System Control, Operation and Management (APSCOM 2009), Hong Kong, China, 8–11 November 2009; pp. 1–6. [Google Scholar]
- Hosseini-Bioki, M.; Rashidinejad, M.; Abdollahi, A. An implementation of particle swarm optimization to evaluate optimal under-voltage load shedding in competitive electricity markets. J. Power Sources 2013, 242, 122–131. [Google Scholar] [CrossRef]
- Amraee, T.; Mozafari, B.; Ranjbar, A. An improved model for optimal under voltage load shedding: particle swarm approach. In Proceedings of the 2006 IEEE Power India Conference, New Delhi, India, 10–12 April 2006; p. 6. [Google Scholar]
- Rad, B.F.; Abedi, M. An optimal load-shedding scheme during contingency situations using meta-heuristics algorithms with application of AHP method. In Proceedings of the 11th International Conference on Optimization of Electrical and Electronic Equipment, Brasov, Romania, 22–24 May 2008; pp. 167–173. [Google Scholar]
- Mozafari, B.; Amraee, T.; Ranjbar, A. An approach for under voltage load shedding using particle swarm optimization. In Proceedings of the 2006 IEEE International Symposium on Industrial Electronics, Montreal, QC, Canada, 9–13 July 2006; pp. 2019–2024. [Google Scholar]
- Tinney, W.; Bright, J.; Demaree, K.; Hughes, B. Some deficiencies in optimal power flow. IEEE Trans. Power Syst. 1988, 3, 676–683. [Google Scholar] [CrossRef]
- Sadati, N.; Zamani, M.; Mahdavian, H.R.F. Hybrid particle swarm-based-simulated annealing optimization techniques. In Proceedings of the IECON 2006—32nd Annual Conference on IEEE Industrial Electronics, Paris, France, 6–10 November 2006; pp. 644–648. [Google Scholar]
- Jalilzadeh, S.; Hosseini, S.H.; Derafshian-Maram, M. Optimal load shedding to prevent voltage instability based on multi-objective optimization using modal analysis and PSO. In Proceedings of the 2010 International Congress on Ultra Modern Telecommunications and Control Systems and Workshops (ICUMT), Moscow, Russia, 18–20 October 2010; pp. 371–376. [Google Scholar]
- Mollah, K.; Bahadornejad, M.; Nair, N.; Ancell, G. Automatic under-voltage load shedding: A systematic review. In Proceedings of the 2012 IEEE Power and Energy Society General Meeting, San Diego, CA, USA, 22–26 July 2012; pp. 1–7. [Google Scholar]
- Ellis, A.; Kosterev, D.; Meklin, A. Dynamic load models: Where are we? In Proceedings of the 2005/2006 IEEE PES Transmission and Distribution Conference and Exhibition, Dallas, TX, USA, 21–24 May 2006; pp. 1320–1324. [Google Scholar]
- Sadati, N.; Amraee, T.; Ranjbar, A. A global particle swarm-based-simulated annealing optimization technique for under-voltage load shedding problem. Appl. Soft Comput. 2009, 9, 652–657. [Google Scholar] [CrossRef]
- Hagh, M.T.; Galvani, S. Minimization of load shedding by sequential use of linear programming and particle swarm optimization. Turk. J. Electr. Eng. Comput. Sci. 2011, 19, 551–563. [Google Scholar]
- Ahmadi, A.; Alinejad-Beromi, Y. A new integer-value modeling of optimal load shedding to prevent voltage instability. Int. J. Electr. Power Energy Syst. 2015, 65, 210–219. [Google Scholar] [CrossRef]
- Ojaghi, M.; Azari, M.; Valujerdi, A.C. Robust UVLS scheme to improve transmission line performance considering interruption cost and voltage stability index. In Proceedings of the 2014 IEEE International Conference on Industrial Technology (ICIT), Busan, South Korea, 26 February–1 March 2014; pp. 541–546. [Google Scholar]
- Musirin, I.; Rahman, T.A. Estimating maximum loadability for weak bus identification using FVSI. IEEE Power Eng. Rev. 2002, 22, 50–52. [Google Scholar] [CrossRef]
- Baker, J.E. Adaptive selection methods for genetic algorithms. In Proceedings of the International Conference on Genetic Algorithms and Their Applications, Pittsburgh, PA, USA, 24–26 July 1985; pp. 101–111. [Google Scholar]
- Grefenstette, J.; Gopal, R.; Rosmaita, B.; van Gucht, D. Genetic algorithms for the traveling salesman problem. In Proceedings of the First International Conference on Genetic Algorithms and Their Applications, Pittsburgh, PA, USA, 24–26 July 1985; pp. 160–168. [Google Scholar]
- Eberhart, R.; Kennedy, J. A new optimizer using particle swarm theory. In Proceedings of the Sixth International Symposium on Micro Machine and Human Science (MHS’95), Nagoya, Japan, 4–6 October 1995; pp. 39–43. [Google Scholar]
- Shi, Y.; Eberhart, R. A modified particle swarm optimizer. In Proceedings of the 1998 IEEE International Conference on Evolutionary Computation Proceedings and IEEE World Congress on Computational Intelligence, Anchorage, AK, USA, 4–9 May 1998; pp. 69–73. [Google Scholar]
- Zimmerman, R.D.; Murillo-Sanchez, C.E. MATPOWER, A MATLAB Power System Simulation Package. 2007. Available online: http://www.pserc.cornell.edu/matpower/manual.pdf (accessed on 6 May 2018).
- Ritzmann, D.; Wright, P.S.; Holderbaum, W.; Potter, B. A method for accurate transmission line impedance parameter estimation. IEEE Trans. Instrum. Meas. 2016, 65, 2204–2213. [Google Scholar] [CrossRef]
- Wydra, M. Performance and Accuracy Investigation of the Two-Step Algorithm for Power System State and Line Temperature Estimation. Energies 2018, 11, 1005. [Google Scholar] [CrossRef]
Figure 1.
Two bus power system.

Figure 2.
Flow chart of the proposed method.

Figure 3.
IEEE 30-bus test system.

Figure 4.
Fast voltage stability index (FVSI) values against 1.6 loading factor.

Figure 5.
The trend of voltage magnitude and FVSI values with increasing reactive power. MVARs: reactive power mega volts amperes.
Figure 5.
The trend of voltage magnitude and FVSI values with increasing reactive power. MVARs: reactive power mega volts amperes.

Figure 6.
Voltage magnitude of the five weak buses with a loading factor of 1.6. GA: genetic algorithms, PSO: particle swarm optimization.
Figure 6.
Voltage magnitude of the five weak buses with a loading factor of 1.6. GA: genetic algorithms, PSO: particle swarm optimization.

Figure 7.
Voltage improvement compared to the overload voltage with no optimization.

Figure 8.
Voltage magnitude of bus 26 versus loading factor.

Figure 9.
Load shed on each bus.

Figure 10.
Total load shedding versus loading factor.

Figure 11.
Convergence time.


Table 1.
Notations.
| Notation | Description |
|---|---|
| Pib and Pia | Post-contingency and pre-contingency active power demand at bus i, respectively. |
| Vib and Via | Post-contingency and pre-contingency voltage magnitudes at bus i, respectively. |
| Nbus | Set of all buses. |
| Bsel | Set of buses selected for load shedding. |
| BGen | Set of generation buses. |
| Pi and Qi | Active and reactive power of bus i, respectively. |
| Gij and Bij | Real and imaginary part of the (i; j)th element in the bus admittance matrix, respectively. |
| Pimin and Pimax | Minimum and maximum real power generations at bus i, respectively. |
| Qimin and Qimax | Minimum and maximum reactive power generations at bus i, respectively. |
| Vimin and Vimax | Minimum and maximum allowed voltage at bus i, respectively. |
Table 2.
Top five weakest buses associated with higher values of fast voltage stability index (FVSI).
Table 2.
Top five weakest buses associated with higher values of fast voltage stability index (FVSI).
| Nos. | Line Number | FVSI Value | Bus No. |
|---|---|---|---|
| 1 | 8 | 0.2506 | 26 |
| 2 | 13 | 0.3134 | 27 |
| 3 | 16 | 0.2662 | 29 |
| 4 | 18 | 0.2604 | 30 |
| 5 | 34 | 0.3327 | 30 |
| 6 | 36 | 0.2823 | 26 |
| 7 | 38 | 0.2502 | 25 |
© 2018 by the authors. Licensee MDPI, Basel, Switzerland. This article is an open access article distributed under the terms and conditions of the Creative Commons Attribution (CC BY) license (http://creativecommons.org/licenses/by/4.0/).
Share and Cite
MDPI and ACS Style
Larik, R.M.; Mustafa, M.W.; Aman, M.N.; Jumani, T.A.; Sajid, S.; Panjwani, M.K. An Improved Algorithm for Optimal Load Shedding in Power Systems. Energies 2018, 11, 1808. https://doi.org/10.3390/en11071808
AMA Style
Larik RM, Mustafa MW, Aman MN, Jumani TA, Sajid S, Panjwani MK. An Improved Algorithm for Optimal Load Shedding in Power Systems. Energies. 2018; 11(7):1808. https://doi.org/10.3390/en11071808
Chicago/Turabian StyleLarik, Raja Masood, Mohd Wazir Mustafa, Muhammad Naveed Aman, Touqeer Ahmed Jumani, Suhaib Sajid, and Manoj Kumar Panjwani. 2018. "An Improved Algorithm for Optimal Load Shedding in Power Systems" Energies 11, no. 7: 1808. https://doi.org/10.3390/en11071808
Note that from the first issue of 2016, this journal uses article numbers instead of page numbers. See further details here.