A Review of Projected Power-to-Gas Deployment Scenarios


Department of Mechanical Engineering, Khalifa University of Science and Technology, P.O. Box 2533, Abu Dhabi, UAE
*
Author to whom correspondence should be addressed.
Energies 2018, 11(7), 1824; https://doi.org/10.3390/en11071824
Submission received: 19 May 2018
/
Revised: 25 June 2018
/
Accepted: 6 July 2018
/
Published: 12 July 2018
(This article belongs to the Special Issue Power-to-Gas Energy Storage Technologies)
Abstract
:Technical, economic and environmental assessments of projected power-to-gas (PtG) deployment scenarios at distributed- to national-scale are reviewed, as well as their extensions to nuclear-assisted renewable hydrogen. Their collective research trends, outcomes, challenges and limitations are highlighted, leading to suggested future work areas. These studies have focused on the conversion of excess wind and solar photovoltaic electricity in European-based energy systems using low-temperature electrolysis technologies. Synthetic natural gas, either solely or with hydrogen, has been the most frequent PtG product. However, the spectrum of possible deployment scenarios has been incompletely explored to date, in terms of geographical/sectorial application environment, electricity generation technology, and PtG processes, products and their end-uses to meet a given energy system demand portfolio. Suggested areas of focus include PtG deployment scenarios: (i) incorporating concentrated solar- and/or hybrid renewable generation technologies; (ii) for energy systems facing high cooling and/or water desalination/treatment demands; (iii) employing high-temperature and/or hybrid hydrogen production processes; and (iv) involving PtG material/energy integrations with other installations/sectors. In terms of PtG deployment simulation, suggested areas include the use of dynamic and load/utilization factor-dependent performance characteristics, dynamic commodity prices, more systematic comparisons between power-to-what potential deployment options and between product end-uses, more holistic performance criteria, and formal optimizations.
1. Introduction
Depleting fossil fuels, climate change and energy security issues are prompting transformations in energy strategies worldwide. With a projected global annual consumption increase of 2.6% from 2012 to 2040, renewables are becoming the fastest-growing energy source for electricity generation [1]. The European Union (EU) has taken a lead in renewable deployment, with a target of 20% renewables in its overall energy consumption by 2020, and an agreement by EU countries of its extension to 27% by 2030 [2,3]. Based on the EU Reference Scenario 2016 [4], the share of net renewable electricity generation is projected to rise to 37%, 43% and 53% by 2020, 2030, and 2050, respectively. Given their resource potential and favorable economics, wind and solar photovoltaics are anticipated to play a major role [4,5,6]. With increased penetration of renewables having daily and seasonal output variations, it is anticipated that substantial excess electricity will be generated when production exceeds demand [7]. This will cause congestion and instability in electricity transmission systems, unless power curtailments or other remedial measures are applied [7]. EU Directive 2009/28/EC asserts the use of appropriate grid and market-related operational measures for member states in order to minimize the curtailment of electricity produced from renewable energy sources [2]. In this regard, the large-scale storage of excess electricity could play a key role in effectively utilizing resources and contribute to the decarbonization of energy systems, while stabilizing electricity networks [8]. The development of power-to-X (PtX) processes for the conversion of surplus electricity to other energy carriers and useful chemicals [8] has attracted considerable attention. In particular, power-to-gas (PtG) is considered to hold significant potential, in terms of storage capacity, storage duration and seasonal capability, electricity to energy carrier conversion efficiency, energy carrier density and portability, and cost, in comparison with other storage technologies (e.g., flywheels, batteries, pumped hydroelectric storage, compressed air energy storage) [9,10,11,12,13]. In this article, a review of projected PtG deployment scenarios proposed to date at regional- and distributed scales is presented. To provide context to these scenarios, which may require to be evaluated against alternative PtX options, a brief overview of PtX and PtG conversion routes is presented in Section 2, which closes with the specific objectives of the present article.
2. Power-to-X Overview
PtX may be defined as a group of conversion technologies that enable the conversion of excess electricity in energy systems having large shares of fluctuating renewables (generally, >30% [14]) to energy carriers for use in other sectors [15,16]. In addition to PtG, these technologies include power-to-chemicals (PtC), power-to-electricity (PtE), power-to-heat (PtH) and power-to-liquids (PtL) [17,18,19,20], as depicted in Figure 1. A particular PtX conversion route may be selected based on demand for a specific product (X), technical process performance characteristics, levelized cost and environmental impact in comparison with alternative solutions [21].
PtG involves low- or high-temperature electrolysis of water to produce hydrogen, either as a final product injected into the gas grid, or directly fueling applications (e.g., industrial, mobility, power or water production), or as an intermediate product which may be converted to either synthetic natural gas (SNG) or syngas via methanation with carbon dioxide (CO2) [17,18,19]. Possible CO2 sources include biomass and fossil-based power plants, industrial facilities (e.g., steel, cement) and air [15]. Depending upon the CO2 source, specific separation processes, storage and transport options may be required, having different technical feasibilities and cost [15]. PtL involves either electrolysis of water for hydrogen production and subsequent methanation, co-electrolysis of water and CO2, or CO2 electrochemical reduction, to produce liquid hydrocarbons, and further refinement to specific fuels or chemicals [22,23]. The synthesized liquids may be used as fuels in mobility (e.g., methanol, dimethyl ether) or as chemicals (e.g., methanol) in process industries [17,18,19]. In PtH, heat pumps, electric boilers or furnaces are typically used to convert power to heat [18], which may be of interest principally to regions with high heat demand [20,24] or industrial facilities for steam production [22].
PtG conversion pathways and interaction with the electricity and gas infrastructures are represented in more detail Figure 2, as well as possible PtG product end-uses in industrial facilities, power, transport, district and water systems, and heat/material integration options. When injected into the gas network, hydrogen concentration can affect the integrity of distribution pipelines and performance of end-use equipment (i.e., boilers, burners, power, combined heat and power (CHP)) [25]. Thus, the maximum amount of hydrogen that can be injected into the natural gas grid varies regionally depending on natural gas quality standards for end-use equipment. For instance, a maximum of 6% H2 by volume in the gas distribution network is specified in France, while Germany and Holland allow for 10% and 12%, respectively [26]. The use of hydrogen or SNG in priority for industrial and mobility uses, rather than their reconversion to power, avoids additional efficiency losses [27]. However, hydrogen applications are presently and in the near future limited by the lack of dedicated hydrogen storage and distribution infrastructure [28].
Depending upon the PtG conversion route and economic context, the use of PtG by-products (e.g., O2, heat) and heat/material integration between PtG and external processes, may be required to enhance profitability. In this regard, Figure 2 also highlights possible heat and material (i.e., H2, O2, CO2) flows within the PtG plant and between the PtG plant and industrial, power, transport, district and water systems. High-temperature electrolysis can take as input thermal energy from either methanation or external heat-rejecting processes (in addition to an electricity input). Depending upon its amount and grade, PtG heat rejection could be used externally, for example, for the desorption of amine-based CO2 capture processes, district heating, water treatment/desalination and other heat-driven applications. The PtG oxygen by-product could fuel oxygen-fed processes in chemicals and metals manufacturing, and oxyfuel combustion [28].
Apart from supporting high levels of intermittent renewable energy penetration, PtX technologies could contribute to reduce the expansion of the electricity network [29] and reduce energy transmission losses, which are approximately four times lower for gas pipelines than power lines [10]. Furthermore, the variety of potential transformation pathways and products in Figure 1 and Figure 2 can enable a more sustainable use of resources by connecting the electricity, heating/cooling, district, industrial and transport sectors in smart energy systems [30]. In this regard, PtX may facilitate the operation of isolated energy systems (that supply electricity, heat/cooling and transport fuels) in topographically difficult and/or remote regions.
PtG processes and technologies have been previously described in dedicated review articles [29,31,32,33,34,35,36,37,38]. Buttler and Spliethoof [31] reviewed water electrolysis fundamentals, and commercially-available electrolysis systems for application to PtG, while Bensmann et al. [32] discussed PtG electrolyzer configurations and operating pressure levels. Rönsch et al. [33] reviewed methanation technologies and reactor systems. Götz et al. [29] and Ghaib and Ben-Fares [34] provided overviews of power-to-methane sub-processes [29,34], economics [29] and CO2 sources [34]. Gahleitner [35] compiled PtG pilot plants for stationary applications, with emphasis on hydrogen production processes, while Bailera et al. [36] reviewed power-to-methane laboratory, pilot and demonstration projects. Maroufmashat and Fowler [37] described power-to-gas conversion pathways in terms of technologies, efficiency and technical benefits, as well as Canadian regional-specific energy policy recommendations for PtG implementation. Blanco and Faaij [38] evaluated the role of PtG and other storage technologies in energy systems, focusing on electricity storage requirements. Additional PtG technology reviews are available in textbooks and reports authored by government and research organizations [28,39,40,41]. Collectively, these reviews have provided broad and critical assessments of PtG processes, technological development and potential roles. Other reviews have focused on specific PtG aspects, such as hydrogen fuel enrichment [25].
To the authors’ best knowledge, no review of published PtG deployment scenarios into existing and future energy systems, both at regional/national- and distributed scale, has been previously presented, which is the focus of this article. The extension of the PtG concept to nuclear-assisted, renewable hydrogen production incorporating electrolytic and/or thermochemical-based processes, and their associated deployment schemes, is also discussed. For the purpose of this article, a PtG deployment scenario refers to a PtG application environment, energy sources, PtG processes and their material/heat integration with other processes, PtG products and their end-uses, and PtG system integration with electricity and gas distribution networks and other sectors, such as industrial, transportation, districts, and water systems. The main objectives of this work are to: (i) provide an overview of practical PtG deployment schemes investigated to date at regional- and distributed scale (e.g., industrial/power facilities), and a collective insight into their projected techno-economic-environmental feasibilities; (ii) highlight promising synergy options between PtG installations, and power, industrial, district and water systems, that could contribute to improved utilization of resources, economics, and decarbonization; and (iii) identify challenges and research and development needs in the design and analysis of PtG deployment schemes. A geographical overview of the reviewed regional/national-scale, distributed-scale, and nuclear-assisted PtG deployments is provided in Figure 3.
3. PtG Deployment into Energy Systems
PtG deployment scenarios may be categorized according to two broad types, with the common objectives of maximizing the use of electricity generation and corresponding resources and reducing environmental emissions. In the first type of scenario, PtG is deployed into a specific regional or nation-wide energy system with the additional objective to contribute stabilizing the grid to mitigate the effects of excess electricity caused by a substantial share of fluctuating sources (generally, renewables), and improve the security of energy supplies. In the second type of scenario, PtG is integrated in the energy value chain of industrial or small-scale power facilities, or other distributed installations, for increased profitability. Regional/nation-wide and distributed-scale PtG deployment studies are compiled in Table 1 and Table 2, respectively, in terms of deployment geographical location or environment, timeline, product(s), sources of renewable power and CO2, process type and efficiency, and energy/material integration(s) between PtG installations and external systems/facilities, when applicable. These works were classified as PtG deployment studies, based on their documentation of the above deployment scenario information. To differentiate PtG deployment schemes that lead to hydrogen as a sole product (i.e., with no SNG/syngas co-production) from non-PtG hydrogen production schemes, only studies involving hydrogen production from electricity in energy systems having fluctuating power generation were considered. A description of all PtG deployment analyses worldwide is not feasible within a single article; instead the studies highlighted here, which collectively capture most of these efforts, are intended to serve as direction for further PtG-related deployment analyses in other regional and distributed energy systems, and/or using improved PtG deployment design, modeling and assessment approaches.
3.1. Regional to National-Scale
In this Section, regional/national PtG deployment studies are grouped by deployment geographical location, beginning with European countries having the most significant involvements in renewable energy and PtG research/implementation based on published work (i.e., Germany, Spain, Denmark, UK), followed by Canada, USA, Australia, East Asia and the World. To reflect developments, PtG deployment studies within a given region are sorted by publication date from year 2010 onwards, which follows the proposal of the PtG concept by Sterner in 2009 [42]. For clarity in Table 1, all studies are listed by chronological order, with geographical location, timeline, and PtG energy/material sources, products, and processes tabulated. Such an organization was adopted in absence of consistent trends permitting to group studies based on specific deployment aspects (i.e., timeline, PtG energy/material sources, PtG products, PtG processes). However, the review presented in this and subsequent sections is synthesized in Section 5 in terms of PtG deployment scale, geographical location, PtG products, power and CO2 sources, PtG products and sub-processes, energy/material integration, economics and modeling/optimization methodologies.
It should be noted that although comparing the progress of various countries in PtG development/implementation is not the objective and beyond the scope of the present article, published PtG activity in China, India, the USA, and Japan, although major energy players, is limited in comparison with activity in other countries for which published PtG deployments are discussed in this section. Götz et al. [29] recently comment that despite their number of biogas plants, China and the USA (the latter benefiting from significant natural gas reserves), have displayed little interest in PtG. The potential need, feasibility and benefits of PtG in India are currently considered questionable [89]. Although Japan has actively developed hydrogen production/utilization systems, several factors would impair the feasibility of PtG in this country. These factors include little excess electricity anticipated by 2030, the lack of sufficiently developed electricity and gas networks in areas having large solar/wind energy availability, tight natural gas standards that would constrain hydrogen and SNG blending, and limited underground storage capacity [90]. In general, geographic advantages for PtG implementation include availability of sufficient, adequate underground storage capacity for PtG products, such as in Germany, The Netherlands, UK, Spanish peninsula, US, and Canada [38,55], and sufficient gas network development/integration for PtG product distribution, such as in the European North, Baltic and Mediterranean seas [70].
3.1.1. Germany
Germany aims at increasing its generation of electricity from renewable sources to 50% and 80% by 2030 and 2050, respectively, from approximately 32% in 2015, with emphasis on wind power as the largest single share of renewable electricity [35,91,92,93].
Jentsch et al. [54] performed a scenario-based analysis to determine both the economically optimum PtG capacity and spatial deployment technology option in Germany’s energy mix, assuming 85% renewable intervention (i.e., wind, solar PV, biogas, run-of-river hydroelectricity, geothermal), with no timeline specified. PtG, PtH and short-term energy storage systems were compared in terms of their effectiveness in storing excess electricity. PtH end-use was modeled as electric heaters and served to improve flexibility over CHP units. Using a unit commitment model of the German transmission grid, the economically optimum PtG capacity that minimized the difference between PtG benefits and the variable costs of power and heat production, for an assumed power-to-SNG efficiency of 62% and PtG investment cost of 750 €/kW, was found to be in the range of 6 to 12 GW. PtG was found to provide economic benefits, but a combination of PtG and PtH was optimum. For the optimum PtG capacity identified, the economically preferable location of the PtG plant was found to be adjacent to the region from which surplus electricity is exploited (i.e., Northern Germany), to reduce transmission losses. However, among other factors, it was highlighted that the local availability and cost of the CO2 feedstock, and internal heat recycling between methanation and electrolysis, could lead to different optimum locations.
Moskalenko et al. [55] identified optimum PtG installation locations in Saxony-Anhalt, depending on the availabilities of renewable energy resources (i.e., wind and solar PV), gas network, and CO2 sources, using a genetic algorithm (GA) based optimization. Saxony-Anhalt is the largest electricity exporting region in Germany, and also the largest importer of natural gas. As of 2011, the region had already reached 40% share of renewable energy, including over 50% share of wind power (i.e., 3.8 GW) and 1.3 GW of PV installations. Owing to an extensive regional gas distribution and storage infrastructure, SNG was selected as PtG product. Existing biogas (60% CH4, 35% CO2) plants (currently 397 nos) would supply the CO2 requirement for PtG biological methanation. The optimization objective was to minimize the total investment and operational cost of PtG related to electrolysis (i.e., electricity consumption) and methanation (i.e., feedstock), depending on the locations of PtG units. The optimum PtG units locations were either close a SNG injection point, or close to a gas storage point. The results suggested that by implementing PtG technology for SNG production, Saxony-Anhalt could secure its complete natural gas demand without gas imports [55].
Assuming 80% renewable energy electricity in Germany’s future energy system, short-term (5 h) and long-term storage (17 days) capacity requirements of 70 GWh for and 7.5 TWh have been predicted, which could be provided using synthetic gas [15]. However, PtG transformation and/or utilization pathways can significantly affect the overall efficiency and economics of the process [15]. Schiebahn et al. [15] compared three alternative PtG options technically and economically, namely direct injection of either hydrogen or SNG into the natural gas grid, or utilization of hydrogen in a dedicated hydrogen infrastructure in fuel cell vehicles for road transport and industrial processes in Germany. These options were primarily for the purpose of storing excess wind electricity for total on-shore and off-shore generation capacities of 169 GW and 70 GW, respectively. 84 GW electrolyzer capacity, in conjunction with 70% and 80% electrolysis and methanation efficiencies, respectively, were considered. For the mobility option, a park of 9800 vehicle refueling stations was envisaged, with a new 51,000 km long pipeline distribution network, and 27–90 TWhH2 storage salt caverns. The above three candidate PtG end-uses were compared in terms of the levelized production costs of the synthetic gases. The price of excess electricity converted was found to have a critical impact. Injection of either H2 or SNG into the natural gas grid was found to be uneconomical due to their production costs being several times higher than that of conventional natural gas. The use of either hydrogen or SNG for industry was not advantageous either. The economically most attractive PtG conversion pathway and end-use was found to be hydrogen for fuel cell vehicles, due to both vehicle efficiency and gasoline prices [15].
Kötter et al. [57] evaluated the economic benefits of a PtG system in the Rhineland-Palatinate region in 2030, which represents 1% of Germany’s land area, assuming 100% renewable energy share (i.e., wind, solar PV, hydropower, biogas). This rural region has already reached 59% renewable energy penetration and has a gas storage infrastructure of large capacity. Quantifying the cost of PtG was of interest particularly in comparison with PtH, pumped hydrostorage and lithium ion batteries. The precedence of an energy storage option was based on the corresponding conversion pathway efficiency. Biogas heating plants were the main source of CO2, in absence of local CO2-intense industries. A dynamic energy system model and optimization of the levelized cost of electricity (LCOE) was developed, using a black box solver with a reinforcement learning algorithm. The cost analysis incorporated capital expenditure (CAPEX), operating expenditure (OPEX), interest rate, and depreciation for twenty year lifetime, and sought to identify the optimum wind, PV, lithium-ion, CHP, PtH, and both CO2 and crude biogas storage capacities. The PtG system was assumed to have near-infinite storage capacity and 60% overall efficiency (i.e., electrolyzer and methanation efficiencies of 75% and 80%, respectively). A quasi-linear correlation was identified between the PtG CAPEX and LCOE. PtG was found to be more economically competitive than lithium-ion batteries, which have smaller capacities, up to a threshold PtG CAPEX (i.e., 2500 €/kW), above which the trend was opposite [57].
Estermann et al. [64] analyzed the deployment of PtG in Bavaria, which currently has a high solar PV intervention and 2330 anaerobic digestion biogas plants powering CHP. The PtG plants were deployed in the vicinity of biogas CHP plants, partly powered by CHP and partly by excess solar electricity. The objectives were to quantify the time-dependent rate of surplus electricity generation in low-voltage grids, and to determine the optimum number, capacities and operation of electrolyzers based on factors including CHP hydrogen fuel requirement, CHP CO2 production, extent of the gas distribution network, and profiles of gas consumption versus excess solar electricity generation profiles. Based on available time series electricity data for 2012, with a temporal resolution of fifteen minutes for electricity generation and demand, future load profiles were calculated in accordance with the anticipated installed solar power capacities over the period 2015–2025. It was estimated that in for example 2025, surplus solar electricity would be generated during 27% of the year at 5 GW peak rate. Because of limitations in the gas distribution network, only 20% of households could be served by SNG, but this could significantly reduce fossil gas consumption. Furthermore, seasonal peaks in gas consumption would not occur simultaneously with excess solar electricity generation. Based on the above limitations, the optimum peak capacity and number of electrolyzer units for low voltage grid application were determined to be 300 kW (~500 nos), and up to 700 kW (~500 nos) for medium voltage grid application. Additional MW-capacity electrolysers connected to the medium voltage grid would be required in densely populated areas. On account of the sharp solar PV generation profiles, approximately 20% of excess electricity could be absorbed in year 2025 by a total PtG capacity of 370 MW, operated at modest utilization factors.
Robinius et al. [73] analyzed the coupling of the power and transport sectors using FCVs and a dedicated hydrogen pipeline network in the German 2050 energy system, as well as PtG potential for several scenarios. Renewables included onshore and offshore wind, solar PV, hydropower and biomass. Whereas the majority of studies analyze deployment scenarios based on a lumped macroscale approach, in which the sum of all electricity generation and demand profiles in a given regional/national energy system is assigned to a single node, Robinius et al. [73] applied a detailed spatial resolution. Hourly residual electric loads were predicted at municipality level. The geographical distribution of wind turbines in year 2050 was optimized to initially obtain the maximum number of turbines (i.e., ~1.6 M) and then to minimize turbine LCOE. The 2050 geographical distribution of PV installations was scaled from their existing 2014 distribution. Hydropower distribution was determined based on rainfall data. A range of wind and PV capacities were analyzed, at constant hydropower and biomass capacities. Negative residual loads (i.e., excess electricity) were found to be concentrated in the country’s Northern regions, whereas positive residual loads (i.e., insufficient renewable generation relative to demand) were essentially located in Western regions. Based on the calculated residual loads, local grid transmission capacity, type and number of non-renewable power installations and electricity import/export requirements, an optimization of transmission and dispatch was performed to eliminate residual loads or obtain negative residual loads, at minimum cost. Different economic scenarios were considered, that involved premium prices for FCVs relative to fossil-powered vehicles, value-added tax on FCVs, taxation abatements for FCVs, and tax on FCV hydrogen consumption. The national geographical distribution of hydrogen consumption was predicted. The design of a 12,104 km long hydrogen pipeline network was optimized by minimizing the distances between hydrogen production sites (i.e., coal gasification and offshore wind installations) and consumption sites (i.e., refueling stations). The amount of residual load was shown to be significantly affected by the model spatial resolution (i.e., municipality versus county level). Up to 6.6 Mtons of hydrogen could be synthesized from excess electicity using 125 GW electrolysis capacity. Part of the hydrogen production (3.1 Mtons) was assumed to fuel FCVs (75% of the road traffic), leaving a significant hydrogen availability for the chemical industry, such as for ammonia and methanol synthesis.
McKenna et al. [87] analyzed the potential of power-to-hydrogen and -SNG for injection into the gas network in Badden-Württemberg in 2016–2050, with wind and solar PV as fluctuating renewables. Following on from an initial macro-economic analysis, the authors undertook a more detailed, spatially-resolved, decentralized municipality-level analysis of the potentials of power-to-hydrogen and -SNG in the same region in year 2040. This permitted the potential occurrence of excess electricity to be identified locally and to account for the local gas and electricity infrastructure capacities. Assuming that SNG is produced only during hours of negative residual load where electricity carries zero fee, the cost of SNG was predicted to compete economically with natural gas. However, it was found that certain regions with high wind and PV generation potential only offered moderate opportunities for hydrogen gas network injection due to limited network capacity and hydrogen concentration restrictions in the network. It was proposed to either transport the hydrogen produced to other regions having no predicted negative residual load but large gas network capacities, or to convert the hydrogen to SNG. Biogas and fossil power plants, and glass and cement production facilities were considered as potential CO2 sources for methanation. Based on the locations of these CO2 sources relative to projected PtG plants, the potential need for liquid CO2 transportation or CO2 separation from air was highlighted.
Grueger et al. [74] quantified the potential of alkaline electrolyzers and fuel cells for re-electrification in mitigating the effects of wind power forecast errors, and in supplying secondary reserve power, for a 100 MW wind power plant in Brandenburg, Germany. The electrolytic hydrogen was solely used to aliment fuel cells that provided reserve power. The wind plant operator was considered to take part in a day-ahead electricity market using wind power forecast data. Forecast errors were modeled using a mixed weighted normal Laplace probability distribution function. Measured wind farm generation and market bidding data from year 2013 were employed. Fixed electrolyzer capacities of 300–1500 kW and fuel cell power outputs of 150–700 kW were considered. Ideal electrolyzer and fuel cell dynamic operation, and constant, load-independent efficiencies were assumed. The hydrogen consumption expenditure, hydrogen production income, and income from reduced forecast errors and secondary reserve provision, were calculated over an annual period to derive the net equivalent annual cost and specific hydrogen production/consumption costs. Hydrogen storage capacity constraints, and hydrogen storage/compression expenditures and taxes were not accounted for. A 200 kW fuel cell and a 700 kW electrolyzer could avoid 17% of forecast errors for a 100 MW wind installation. However, the electrolyzer operational hydrogen production costs were estimated to be up to 2.4 times higher than the hydrogen price required for economically feasible fuel cell operation (i.e., 1.25 €/kg). It was suggested to market electrolytic hydrogen in refueling stations, for which higher hydrogen prices would be viable. Fuel cells were not found to be viable for secondary reserve power provision. Such an analysis could be extended in future work to additional hydrogen uses, PtG products, and a wider geographical base, using further developed electricity generation/consumption and economic models taking into consideration a greater range of influencing parameters, as discussed in [74].
3.1.2. Spain
From approximately 37% renewable share of gross power generation in 2016 (mostly wind, hydro, solar PV and thermal), Spain intends to reach 90–100% by 2050, and in the meantime 27% renewables in overall energy consumption by 2030 [94,95].
The Spanish power generation system is characterized by a high penetration of renewables, but limited grid interconnections [52]. The significant amount of surplus electricity generated currently results in low power installation capacity factors, which are mitigated by converting surplus electricity via hydrostorage or exporting it abroad. Gutiérrez-Martín and Guerrero-Hernández [52] investigated the balancing of the Spanish electrical grid by large-scale integration of hydrogen production using polymer electrolyte membrane (PEM) electrolysis, in an energy system with 42% renewable penetration (i.e., wind, solar thermal, PV, hydro, nuclear). Hydrogen was either converted back to electricity for peak shaving, or used in fuel cell vehicles. The electricity demand and structure of power generation were forecasted using a daily-average analysis until 2020, based on 2009 data from the power operator. Several future hydrogen production scenarios were evaluated for different power supply versus demand gap profiles, to determine the optimum capacity and operation of alkaline electrolyzers, including utilization factor, using a dynamic electrolyzer model. A critical generation-demand ratio parameter was identified to determine the power generation requirement to meet the forecasted daily demand profiles. The conversion of hydrogen back to power was found to result in excessive energy losses. However, the PtG system could convert surplus electricity generated from renewables (i.e., wind and hydro) to hydrogen, to fuel over three millions of fuel cell vehicles, with a net annual reduction of over 4 Gton of CO2 emissions (relative to 2009 levels). Using 53 nos. 50 MW electrolyzer units, the scheme could become profitable after three years.
Gutiérrez-Martín et al. [58] refined the electricity and generation profiles and electrolysis physical model employed in [52] to predict the current-voltage characteristics and hydrogen production cost of advanced alkaline electrolyzers. This permitted electrolyzer current density to be adjusted in relation to its utilization factor in each time period. Several base-load and fluctuating electricity production scenarios were analyzed in conjunction with the power demand to determine the number and capacity of electrolyzers to store excess electricity at national-scale, for unspecified hydrogen end-uses potentially including heat, power, synthetic fuel production and grid injection. It was found that 300 nos. 50 MW electrolyzer units could be deployed in the country, at locations that could potentially correspond to decommissioned conventional power plants, wind farms and/or end-user sites.
Gutierrez-Martin and Rodriguez-Anton [65] extended previous work [52,58] to include catalytic SNG production from alkaline hydrogen, to absorb 90% of excess electricity generation in the 2050 Spanish energy sector. SNG was assumed to be injected into the gas grid and re-converted to power. Assuming free-of-charge excess electricity, the levelized costs of hydrogen, SNG and power were estimated at 0.52 €/kgH2, 0.26 €/Nm3SNG and 51.4 €/MWhe, respectively. In the case of surplus electricity priced at 25 €/MWhe, the cost of power was estimated to rise to 132.5 €/MWhe. However, at wholesale electricity prices, the cost of hydrogen would range from 2.6 to 5.9 €/kgH2, with the upper bound cost applicable to industrial users. The environmental emissions of the power-to-SNG-to-power conversion chain were evaluated at 34.9 gCO2/kWhe, most of which was contributed by materials manufacturing, and CO2 capture and storage losses. Despite the synthetic gas cost estimates obtained, PtG was anticipated to become likely unavoidable to enable the integration of large renewable power shares in the future.
Bailera and Lisbona [88] presented predictions of excess electricity and PtG capacity requirements in 2020–2050 in Spain for four different energy scenarios, involving different fuel mixes (i.e., wind, hydro, solar CSP/PV, natural gas, coal, nuclear, biomass, with some marine and geothermal), and different average annual electricity demand growths (1.36–1.80%). Two energy scenarios from four permitted to restrict the global mean ambient air temperature rise to 2 °C by 2100. Nuclear plants provided base load power, while biomass, coal and natural gas served as backup power to bridge production and demand. The daily variability of wind generation was accounted for, while solar and hydro-electricity generations were modeled assuming monthly-average daily patterns. The 2050 annual excess electricity was estimated to range from 1.4 to 13.5 TWh depending on the energy scenario considered and wind power variability, and was essentially produced from March to June. The corresponding PtG capacity estimates to absorb 90% of annual excess electricity spanned 7.0 to 19.5 GW. It was suggested to place PtG facilities in the vicinity of renewable installations to reduce network transmission losses and congestion. Hydrogen was assumed to fuel part of transportation, and peak load power generation was suggested as a possible SNG end-use. Analyses of SNG material requirements, PtG facility sizing and spatial distribution, and an optimization approach were recommended as future work.
3.1.3. Denmark
Denmark has actively driven the implementation of wind power, achieving 432 GW capacity and 42% wind share in its electricity generation in 2015 [75]. The country aims at zero fossil energy by 2050, which will be achieved in steps including 50% wind share in power generation by 2020, 100% renewables in power and heating by 2030, and phasing out coal power [96].
Ridjan et al. [56] evaluated the production costs of PtG-SNG and PtL-methanol in comparison with first/second generation biodiesel, second generation bioethanol, and biogas in a 100% renewable 2050 Danish energy system with emphasis on wind. Their focus was not on planning aspects such as PtG/PtL capacities and spatial distributions, but on evaluating the potential economic viability of the PtG/PtL products for heavy load and long-distance transport (e.g., trucks, maritime) in comparison with other transport fuels. Unlike in the majority of PtG works, which have assumed low-temperature electrolysis processes, solid oxide steam electrolysis and steam/CO2 co-electrolysis-based production pathways were investigated. Although a developing technology, co-electrolysis is highly efficient, can recycle substantial amounts of CO2, and can process biogas directly with no CO2 separation, to produce quasi carbon-neutral synthetic fuels. In addition, co-electrolysis could enable the flexible production of different synthetic liquid fuels (e.g., DME, jet fuel, methanol) by adjusting the hydrogen-to-carbon ratio of the co-electrolytic syngas product. Furthermore, solid oxide electrolysis cells can operate in reversed, fuel cell mode to produce electricity and thermal power from hydrogen and other fuels. In [56], the CO2 for either hydrogenation after steam electrolysis to produce SNG, or for co-electrolysis to produce syngas (and subsequently methanol via a catalytic process), was captured from biomass plant combustion products. The electrolytic processes were driven by surplus off-shore wind electricity, and are outlined in more detail in [97] for methanol and DME synthesis. An EnergyPLAN software model of the Danish energy system, focusing on the portion of the transport sector that cannot be fulfilled electrically, was used to minimize fossil fuel (i.e., natural gas) consumption. The model balanced excess electricity production and gas supply-demand. PtG/PtL capital costs consisted of wind power, electrolysis and SNG/methanol chemical synthesis plants. The PtG-SNG and PtL-methanol fuels were found to incur higher specific (i.e., per unit chemical energy) production costs than first generation biodiesel (which involves a simple and efficient process), but lower than the cost of second generation bioethanol. PtG-SNG specific cost was found to be lower than that of PtL-methanol, due to a lower hydrogen and thus input electricity requirement. For both PtG-SNG and PtL-methanol, the costs consisted essentially of electricity, followed by fuel handling/CO2 emissions, then (co)electrolyzer, chemical synthesis and carbon capture costs. Both SNG and methanol had higher production costs via PtG/PtL than via biomass hydrogenation, due to a higher electricity requirement, and despite lower biomass consumption. However when incorporating CO2 emission costs, the production costs of PtG-SNG and PtL-methanol were close to that petrol, suggesting their potential to replace this transport fuel, thus addressing climate change, energy security, and limited biomass availability in a 100% renewable energy system.
Ridjan et al. [97] showed that co-electrolysis and steam electrolysis to produce PtL-methanol or PtL-DME enabled the lowest consumption of biomass in the Danish 2050 transport sector, compared with biodiesel and biomass hydrogenation. In addition, co- and steam electrolysis, with total electrolyzer capacity requirements of ~22 and ~18 MW, respectively, used more wind electricity than the other above two transport fuel production pathways. For a given installed wind power capacity, co-electrolysis followed by steam electrolysis also permitted the largest reduction in surplus electricity. However, steam- and co-electrolysis were anticipated to carry higher annual transport fuel costs given the lower maturity of these technologies.
Temporal fluctuations in wind power generation impact grid stability, require backup conventional power and its cycling, and lead to volatile electricity prices. Hou et al. [75] evaluated, from an economic investment perspective, the integration of either an alkaline or PEM-based 10–100 MW power-to-hydrogen plant with a 72 MW off-shore wind farm. Electrolytic hydrogen was produced from excess/low-cost wind electricity to stabilize the electricity network and electricity prices, fuel mobility/industry, and/or re-generate electricity using a 0.2–0.7 kWe PEM fuel cell. An optimization methodology of the simplified power sector (i.e., twenty nos wind turbines, electrolyzers, hydrogen storage tanks, compressors, fuel cells) was developed. This methodology combined sequential quadratic programming for the optimization of equipment operation (including the amount of electricity to be converted or re-generated) and an adaptive particle swarm algorithm for power-to-hydrogen and fuel cell equipment selection and sizing. Danish 2015 hourly electricity prices were assumed. The return on investment (i.e., net present value) associated with several scenarios (i.e., power-to-hydrogen-to-power for electricity market arbitrage, or power-to-hydrogen for product sale to mobility/industry), were compared. For the assumed hydrogen and electricity price ranges, selling electrolytic hydrogen directly as a fuel (preferably, rather than on the heating fuels market) was found to be profitable, but not its reconversion to power. It was suggested to also consider in future work the impacts of hydrogen distribution options, rather than solely hydrogen production, as well as ancillary grid services, government support, and the evolution of hydrogen demand markets, on the return on investment.
Zeng et al. [76] optimized the projected joint expansions of the Western Danish gas distribution and electricity sectors in 2016–2024. Both wind and natural gas power installations were expanded to gradually reduce the existing coal power capacity. The electricity sector and gas network were linked by-directionally through gas power and power-to-methane plants. Three scenarios were simulated, differentiated by their assumed annual wind power growth rates (2–5%). The network topology (i.e., locations of new gas power and power-to-methane plants among assumed two and three possible locations, respectively, gas storage, compressors, pipelines, CO2 transportation pipelines from power to PtG installations), power generation capacity and introduction time of new equipment, as well as electricity and synthetic gas dispatch, were optimized. The objective was to minimize the sum of investment and operational costs, using a modified binary particle swarm algorithm combined with an interior point method. PtG was shown to reduce operational expenditure through reduced wind curtailment, gas consumption and environmental emissions.
3.1.4. United Kingdom
The UK has committed to increase its renewables penetration in total energy consumption to 15% by 2020 and 27% by 2030, to enable 80% reduction in CO2 emissions by 2050, relative to 1990 level [77]. Towards these targets, on- and off-shore wind power capacities of 21 GW and up to 37.5 GW, respectively, are anticipated by 2035 [60].
Barton and Gammon [43] investigated three potential UK energy supply pathways for hydrogen production, with emphasis on either clean coal, fluctuating renewable energy and nuclear power, for annual periods between 2007 and 2050. Each energy provision pathway was required to reduce greenhouse gas emissions by 80% by 2050, reduce hydrocarbon imports and enable stable electrical grid operation. The renewable energy sources included on and off-shore wind, solar PV, solar thermal, tidal and wave energy, biomass, waste, and hydropower. Hydrogen possible end-uses consisted of industrial, transport, and power applications, gas grid injection and conversion to other fuels. Using a future energy scenario assessment (FESA) software model, it was found that regardless of the energy scenario considered, by including mobility as a possible hydrogen end-use, lower CO2 emissions and primary energy consumption would be achieved than if this end-use was not considered. This suggested the use of hydrogen for transport as an alternative to energy-intensive and costly carbon capture and storage (CCS) for reducing CO2 emissions.
To evaluate the operational impact of PtG on the electrical and gas transmission networks, Clegg and Mancarella [59] developed an integrated electricity-gas grid model for the simulation of electricity and gas grids operational interdependencies. The model included a two-stage optimal power flow dispatch model coupled with a transient gas network model. The UK’s electrical transmission network, with a predicted installed generation capacity including 48% of wind energy in 2030, was considered for evaluating the technical, economic and environmental aspects of deploying PtG. PtG facilities having 1 GWH2 and 1 GWSNG production capacities, and 1 GWH2 storage, for product injection into the gas network, were assumed in one of three location types, namely gas terminals, congested gas nodes or congested electrical nodes. The efficiencies of hydrogen and SNG production were taken as 73% and 64%, respectively (including gas compression at 80 bar for distribution). The electrical and gas networks interacted through gas-fired power plants as well as PtG installations, with the latter accounting for limitations of the gas network to absorb the produced synthetic gas. The model quantified the avoided wind curtailment, gas consumption, and CO2 emissions (through both avoided gas combustion and CO2 consumption for methanation), and the de-congestioning of the electrical and gas grids, through PtG. Several case studies were presented aiming at different objectives, including minimizing PtG operational cost, maximizing the avoided greenhouse gases emissions, and electrical or gas grid decongestion. The results suggested that PtG deployment in the vicinity of gas network terminals could avoid wind power curtailment by producing hydrogen for direct gas network injection or SNG production, without disrupting the operation of the gas network. In addition, the strategic placement of PtG SNG facilities was found to reduce the gas compression requirement to overcome gas distribution pressure drops [59].
Qadrdan et al. [60] optimized the operation of the UK’s gas and electricity networks in a high wind electricity generation scenario in year 2020. Without adequate demand-supply matching measures, fluctuations in wind electricity production would impose frequent transient operation of gas power plants and increase the variabilities of gas flow and demand. A combined gas and electricity network model was employed to minimize the total operating expenditure of both integrated networks in fulfilling the gas and electricity demands. The cost components included gas feedstock and storage, electricity generation costs (i.e., fuel and varying operation), gas supply/distribution cost and unserved energy cost. Gas-fueled power plants, electrically-powered gas compressors and 70% efficient-electrolyzers acted as links between the electricity and gas grids. The electrolyzers served to convert excess wind power to hydrogen injected into the gas network, hence to avoid electricity curtailment, improve the gas grid integrity and lifetime, and decrease the reliance of natural gas imports and their price volatility. To reduce computational expenses, the model iteratively performed separate calculations for the power and gas networks, rather than through a simultaneous, coupled network optimization. When restricting the maximum hydrogen content to 5% (volume %) in the gas grid, PtG could reduce wind curtailment by 27% and 62% for typical high and low demand days, respectively. When unrestricting hydrogen concentration, all curtailment could be eliminated. PtG operation was mainly required in morning periods of low demand and high wind generation. For the low-demand day, the maximum aggregated hourly PtG capacity reached 4.4 and 12 GW when restricting and unrestricting maximum hydrogen concentration to 5% in the gas grid, respectively. PtG units were mostly required in the Northern part of the country (i.e., Scotland, North England and Wales), due to significant wind generation and gas network capacities. By substituting part of the gas demand, electrolytic hydrogen contributed to decrease gas flow and compression work at gas terminals. PtG was found to reduce the combined network operating expenditure by 7–8% depending on demand and whether hydrogen concentration in the gas grid was constrained. The upper bound hydrogen concentration that minimized the combined gas and electricity network operating expenditure was found to be 3%, leading to a recommendation that the maximum allowable 0.1% hydrogen content in the gas network (as per regulatory constraints) should be reconsidered.
Qadrdan et al. [77] enhanced their combined gas and electricity network model [60] using a rolling methodology to simultaneously optimize the coupled power and gas networks, so as to more realistically model the time-dependent operation of energy storage systems and improve computational efficiency. The effectiveness of three alternative options (i.e., gas-fired plants with improved flexibility, pumped hydroelectricity storage, and PtG) to tackle electrical grid balancing issues arising from the incorporation of large-capacity wind generation in the UK in 2030 was compared. 6 GW electrolysis capacity with an efficiency of 70% was considered for producing hydrogen to be injected into the gas network. The electrolyzers were assumed to be located at any potential busbar and corresponding gas node of the electricity and gas network, respectively. The amount of hydrogen produced by electrolysis was optimized as part of the cost minimization procedure. PtG was found to enable the largest avoidance in wind curtailment in winter, closely followed by hydrostorage, but the opposite trend was observed in summer due to a lower hydrogen demand than in winter. At an overall 42% PtG efficiency (including reconversion of hydrogen to power in combined cycle gas turbines), higher energy losses and consequently higher operational costs were incurred than for hydrostorage; PtG’s cost however remained lower than for the flexible gas-fired power plants option, partly due to their low capacity factor. Grid-scale hydroelectricity storage could enable the largest reduction in operational cost (i.e., up to 3 and 12 million USD in a typical summer and winter week, respectively). However, it was highlighted that PtG would offer the advantage of distributing hydrogen rather than electricity, which reduces grid congestion.
Ameli et al. [78] also applied the combined gas and electricity network model of Qadrdan et al. [77] to explore the relative potentials of electrochemical and power-to-hydrogen storage to improve the flexibility of the UK’s 2030 energy system with substantial wind and solar fluctuating power. For the same fixed installed storage capacity for each technology, PtG was found to avoid a significantly larger amount of wind curtailment than batteries, particularly in a typical winter week, where curtailment could be completely eliminated, unlike with batteries. However, for the same assumed specific capital cost, electrochemical storage was anticipated to lead to a greater reduction in the operating cost of the combined electricity and gas networks than PtG. This was most evident in winter, and was attributed to the reduced participation of peaking power facilities. The PtG-induced cost reduction was more pronounced in summer than in winter due to a combination of low demand and more curtailment avoidance. The optimization of PtG technical characteristics (e.g., capacity, distribution) was not within the scope of the work.
3.1.5. Ireland
The Republic of Ireland aims at 40%, 12% and 10% share of renewable electricity, heat and transport energy by 2020 [79]. As of 2012, 74% and 8% of renewable power were from wind energy and biomass, respectively [79]. However, in the same year only 2% of the total wind energy generation could be dispatched due to grid limitations [61]. Additional fluctuating electricity in the form of 0.5 GW ocean energy is planned for 2020 [79]. By 2020, it is anticipated that 7 to 14% of wind electricity (i.e., up to 2.5 GWh annually assuming 30% capacity factor) will be curtailed in the island of Ireland [79]. Ireland currently has 95 GW pumped hydroelectricity storage capacity, with limited sites available for expansion [61], and is developing a 268 MW compressed air energy storage station [61]. Ireland currently exports excess fluctuating electricity to the UK, but due to unfavorable electricity pricing and for domestic CO2 emissions reduction purposes, is looking for alternative electricity storage solutions. Ireland’s plans of compressed natural gas vehicles (CNGs) for 2020 would result in an annual gas requirement of 305 Mm3 (11.6 PJ) [79].
Ahern et al. [61] analyzed the potential future role of PtG for SNG production in the Republic of Ireland’s 2030 energy system, for a high level of renewable penetration dominated by wind, that would contribute approximately 6.8 GW (50%) of the total installed power generation capacity. Key aspects included an assessment of renewable electricity resources for hydrogen production, identification of CO2 sources for SNG production, determination of optimal PtG systems’ models, evaluation of renewably produced SNG as a transport fuel, and PtG country-specific economics. The energy system, and electricity and gas markets were modeled using mixed integer linear programming. A cost minimization was performed to determine the optimum shares of conventional and renewable generation and pumped hydrostorage capacity, under technical/operational constraints related to electricity demand, minimum and maximum unit power plant outputs and ramp rates, and gas distribution infrastructure. An overall electricity-to-methane conversion efficiency of 60% was assumed (accounting for 75% and 80% efficiencies for electrolysis and methanation, respectively). Potential CO2 sources considered were ambient air, thermal power plants with full carbon capture, anaerobic digestion biogas plants fed by agricultural slurries, slaughter waste, the organic content of municipal solid waste, and surplus grass. The feasibility of a PtG process was found to rely on the existence of both low-cost electricity for electrolysis and low-cost CO2 sources for SNG production. Low-cost electricity consisted of surplus wind electricity (generated during off-peak demand periods), while low-cost CO2 was sourced from anaerobic digestors producing biogas. The use of biological methanation would also eliminate the need for conventional biogas upgrading. An optimal energy system model was proposed including two concurrent approaches of balancing the electric grid: (i) the use of biogas-fed CHP plants to produce electricity and heat in synchronization with the electricity and heat demand profiles (an alternative to biogas storage for subsequent CHP electricity generation); (ii) the use of PtG SNG for gas network injection and end-use in transport. Based on a comparison of two future energy scenarios (i.e., with and without PtG), the deployment of 50 MW PtG capacity was estimated to save approximately 5% of wind power curtailment representing 3.7 million € annually [61]. When sold as transport fuel, the produced bio-methane could generate revenues in the range of 0.68 €/Nm3–1.37 €/Nm3 and meet 10% of the transport sector energy demand. An additional 8% of this demand could be met by converting the CO2 content of the biogas to SNG via methanation. Biogas and PtG plants should be co-located. The proposed model would require the construction of new biogas plants in the country, which is currently at an initial phase.
Vo et al. [79] further analyzed the economic and environmental benefits of deploying PtG technology in Ireland specifically for different anaerobic digestion feedstocks used for biogas production. Surplus power curtailment due to high levels of fluctuating wind power was estimated at 2175 GWh per annum. Biomethane (i.e., SNG) was produced via PtG as a form of biogas upgrading. The CO2 requirement for methanation was sourced from anaerobic digestion of biological feedstocks (predominantly from agricultural slurries, slaughter waste, organic portion of municipal solid waste, grass, and limited seaweed feedstock), with a combined potential capacity of 430.6 Mm3 CO2/annum. This amount of CO2 would require 1722 Mm3/annum H2 to be upgraded in a biological PtG system, with a total of 7653 GWh electricity requirement per annum for electrolysis. Given the estimated amount of wind curtailment in 2020 (i.e., up to 2.5 GWh annually), it was highlighted that the maximum PtG capacity requirement would be defined by wind curtailment and not by biogas availability. The use of biogas CO2 to produce SNG via PtG from avoided wind curtailment would save 211 kton of equivalent CO2 emissions per year in 2020. The PtG biomethane output could fulfill 89% of the gas demand for CNGVs, and avoid 866 kton of equivalent CO2 emissions per year in 2020 by replacing fossil diesel. At an assumed carbon tax rate of 20 €/ton CO2, this could generate 17 M€ of annual tax revenues.
3.1.6. France
As of 2013, France had 40 GW renewable electricity generation capacity (25 GW hydro, 8 GW wind, 5 GW solar), and 63 GW nuclear electricity capacity with an annual utilization factor at 73%. To reduce excess electricity generation and better follow the daily demand profile, advanced reactor control techniques are applied, with several nuclear plants regularly shut down. This reduces the return on nuclear capital investment, and can increase the volume of effluent nuclear waste generated. Other measures include curtailment and electricity exports (i.e., 52 TWh of the total 402 TWh nuclear generation), but the latter will no longer be sufficient with higher renewable shares in the future [25]. France targets 40% and 32% of renewables in electricity generation and final energy consumption, respectively, by 2030, with 30% reduction in fossil fuel consumption by 2030 relative to 2012 level. Nuclear generation will be limited to 63 GW, which will represent 50% of total electricity generation, compared with 80% in 2013.
To absorb large future shares of excess renewable and nuclear electricity, Scamman and Newborough [26] evaluated the potential deployment of PtG in the French energy system. The feasibility of converting excess nuclear electricity into either hydrogen or SNG via PtG for either mobility applications, injection into the grid, or underground storage to help decarbonizing the French energy system, was discussed based on the amount of excess nuclear electricity generated over the period 2011–1013, rather than attempting to predict future renewable and nuclear capacities [26]. Nuclear load profiles based on datasets for years 2011, 2012 and 2013 were employed for this analysis. The magnitudes of transport fuels, gas and electricity demands were similar, but the gas consumption profile had the largest seasonal variations. It was found that to meet the complete hydrogen demand for mobility, plus a 5% hydrogen concentration in the gas grid, a 2050 PtG strategy would require less than half of the currently generated excess nuclear electricity. It was suggested that up to 6 GW of electrolysis capacity would meet 2030’s mobility fuel and gas grid injection demands, while “valley filling” low-production periods of the weekly 2013 nuclear generation profile. On the other hand, 20 GW electrolysis capacity would be required to valley-fill the annual 2013 nuclear load profile—this would comfortably meet both the mobility and 5% gas grid injection demands. In parallel, most of the hydrogen produced could be converted to SNG, which would reduce natural gas consumption by 7%. Further techno-economic research was recommended.
3.1.7. Switzerland
With approximately 56% hydroelectricity and 40% nuclear power in 2014, the Swiss electricity sector is close to being decarbonized [98]. However, hydroelectricity causes seasonal variations in generation, while a solution is needed to replace nuclear plants after their phasing out.
For the 2015–2030 Swiss energy system, Parra et al. [66] compared the techno-economic performance (i.e., life cycle efficiency, capacity factor, levelized cost and value, and internal rate of return) of PtG systems utilizing alkaline or PEM electrolyzers and chemical methanation, for capacities of 25 kW to 1 MW. The systems produced either hydrogen or SNG for gas grid injection at up to 75 bar. In addition, electrolysis and methanation heat were assumed to be supplied to district heating, and oxygen to industry. The provision of grid stability in the primary frequency control market was also a source of revenue. Unlike most of the PtG regional deployment investigations in Table 1, the scope of the study excluded any energy scenario-based analysis. The levelized cost of electricity supply was found to be 5% to 15% lower for AEL-based than PEM-based power-to-hydrogen, at MW- and kW-scale, respectively. Although PEM electrolysis had higher efficiency than AEL, the better durability of AEL systems resulted in larger gas production and consequently higher levelized value than for PEM-based power-to-hydrogen. SNG production resulted in 15% to 30% higher levelized costs at MW- and kW-scale, respectively, compared with hydrogen production, suggesting that SNG production may be more economically justifiable at MW-scale. However, hydrogen injection into gas transmission networks would be limited by its maximum 3–10% allowable concentration depending on location.
Parra et al. [80] expanded their previous PtG techno-economic evaluation [66] to a techno-economic-environmental assessment of 1 MW PtG systems over the 2015–2010 period in Switzerland. Whereas environmental analyzes are generally limited to emissions, the authors performed a life cycle assessment [80]. The PtG systems operated based on AEL or PEM electrolysis, and thermo-chemical methanation. Either hydrogen or SNG were produced and injected into the gas transmission network, at 10% concentration in natural gas in the former case. PtG installations were assumed to operate at full capacity during low-cost electricity periods. In absence of fossil power plants in Switzerland, the necessary CO2 for methanation was sourced from either ambient air or biogas upgrading, with the latter assumed to bear no cost nor any environmental impact. Revenues from sales of PtG electrolysis heat (50–80 °C) and methanation heat (250–500 °C) to district heating systems were considered during the heating season. The heat was produced using gas boilers fed by either a hydrogen-natural gas mixture, SNG or natural gas. When CO2 was sourced from the atmosphere, PtG heat rejection was used for CO2 capture. Oxygen and grid stability were supplied to industry and the electricity market, respectively. It was found that to bring environmental benefits over standard natural gas production, PtG systems should be powered by “clean” electricity (i.e., preferably wind-, solar- or hydro-generated). Power-to-hydrogen was found to offer lower environmental impact than power-to-SNG. In the case of SNG production, CO2 sourced from a biogas upgrading process reduced environmental impact by 2–9% relative to captured CO2. However, even with biogenic carbon, the combustion of SNG would have a larger environmental impact that that of conventional Swiss natural gas. This was attributed to electrolysis driven by Swiss wholesale electricity carrying a larger environmental penalty than conventional natural gas production. 90% of PtG environmental impact was associated with the amount and type of electricity generation in the case of hydrogen as a PtG product, while 90% of environmental impact arose from CO2 sourcing in the case of SNG production. Both economic viability and environmental performance improved with system capacity. For 1 MW PtG plant, heat and oxygen utilization were required to enable profitability.
3.1.8. Alpine Region
Mesfun et al. [81] explored the economic feasibilities of PtG and PtL processes to convert surplus renewable electricity to SNG (as a district heating fuel substitute), methanol (as a gasoline substitute for transportation) in the Alpine region, including Austrian, French, German, Italian, Slovenian, and Swiss territories. The renewable mix consisted of biomass (converted to heat, power, and biofuels, using biomass steam turbines, CHP, and integrated gasification combined cycles), constant hydroelectric power, solar PV and wind. Natural gas and coal-fired installations provided back-up and base-load power, respectively. The constraints imposed by the Alpine terrain topology and environmentally protected areas were taken into consideration to determine the possible locations of future power plants. Solid oxide co-electrolysis of water and CO2 was used to produce syngas, with was further converted to SNG and methanol at an assumed total 70% efficiency. Possible pre-determined PtG and PtL plant locations were assumed to be close to CO2 sources (i.e., centralized/distributed thermal power generation plants) to avoid CO2 transportation. Rather than assuming a fixed renewable power share, the production of renewable electricity, as well SNG and methanol, was calculated to minimize the total cost of the energy supply network using a mixed integer linear programming model. This optimization was undertaken as a function of carbon prices (0–200 €/ton) and fossil fuel prices (0–100% higher than market prices), using actual 2010 electricity demand data and a high energy demand/supply grid spatial resolution. Excess electricity production was estimated to range from 0.85 to 65 GW (0–93 TWh) for a total annual demand of 530 TWh. Intermittent renewable electricity share (i.e., solar PV, wind) and synthetic fuel production were found to increase at high carbon and fossil fuel prices, whereas low carbon prices led to higher natural gas and hydroelectricity production, and power curtailment. Due to the respective applications of methanol (i.e., transport) and SNG (i.e., heating), hence corresponding displaced fossil fuel prices, methanol production was favored over SNG production. Up to 11% of the gasoline consumption could be replaced by methanol, over the range of carbon and fossil fuel prices considered. In addition, up to 15 million tons of CO2 could be sinked annually by PtG/PtL, while fossil fuel replacement by renewables for transportation, heating and power generation could reduce CO2 emissions by 22 to 103 million tons annually.
3.1.9. Italy
As of 2015, the Italian power generation sector (i.e., 120 GW capacity) included in its annual generation (i.e., 317 GWh) 58% thermal power, 14% hydroelectricity, 7% solar, 4% on-shore wind, and 2% geothermal, with the rest of the demand met through electricity imports [82]. The geographical shape of the country restricts the implementation of a meshed electricity grid in central geographical areas, and would affect the potential of energy storage technologies.
Guandalini et al. [82] assessed the power-to-hydrogen potential from on-shore wind and solar PV in the Italian 2050 energy system. Wind and solar PV capacities of 9 to 49 GW and 19 to 98 GW, respectively, in conjunction with annual demands of either 290 or 350 TWh, were assumed in five different future energy scenarios. The PtG potential assessment was based on the estimated residual load. A positive residual load is the portion of the electric load that needs to be met by conventional or controllable renewable power installations after fluctuating renewables, which are prioritized. A negative residual load resulting from excess fluctuating renewable generation refers to excess electricity, and implies the need for storage, in this instance via PtG. Assuming no grid balancing, annual excess electricity was found to range from 2 GWh (0.7% annual demand) to 51 GWh (17.6%) depending on energy scenario. Larger amounts of excess electricity generation were observed at high wind to PV ratios than at the same PV to wind ratio, due to wind power being more desynchronized with daily demand. At 51 GWh excess electricity, it was found that either ~5% of Italy’s current natural gas consumption for heating, or 7% of its current transportation fuel consumption, could be replaced by electrolytic hydrogen used in fuel cell vehicles. The avoided transportation fuel would represent the annual consumption of 6.5 million cars or 95,000 buses. It was also found that saturation of the transmission lines could result in up to 50% higher synthetic gas production.
Nastasi and Lo Basso [67] presented generic, coupled electricity and heat production strategies at national, district and building level that involved the integration of electrolytic hydrogen utilization technologies. PtG aspects focused on hydrogen applications, rather than the planning of PtG implementation details in a specific regional/geographic energy system. Four hydrogen end-uses were proposed to support renewable electricity generation shares of 25–50% in modeled generic energy system structures representing national-scale (e.g., Italian) power and heating sectors over the next two decades. In absence of either a hydrogen network, or hydrogen vehicles and associated legislation, hydrogen was not considered for use as a pure fuel, and the transportation sector was excluded from the energy systems’ models. Instead, hydrogen acted in four possible roles as: a natural gas blending fuel (i.e., 20% hydrogen by volume) for gas network distribution and combustion, either in CHP for electricity and heat production, or in gas engine-driven heat pumps for heating applications; a working fluid in metal hydride adsorption heat pumps driven by electrolyzer heat and employed in heating applications; a feedstock for catalytic SNG production. The electrolytic hydrogen applications proposed by the authors in distributed district and building environments are discussed in Section 3.2. The fraction of hydrogen energy use (relative to the energy demand) allocated to each hydrogen application was optimized as a function of renewable share by minimizing primary energy consumption. SNG synthesis was found to require the highest hydrogen use of all four types of hydrogen applications. However, higher primary energy savings were obtained for the above three other hydrogen applications. This was attributed to the use of hydrogen for heating in gas-driven heat pumps, and the positive effect of hydrogen blending on CHP efficiency. The effect of using hydrogen-enriched natural gas on the combustion efficiency of conventional and condensing boilers was also investigated by the authors in [99].
3.1.10. Belgium
Belgium targets 13% and 21% share of renewables in its overall energy and electricity generation by 2020, with electricity production comprised of 48% biomass, 45% wind, 5% solar PV, 2% hydro and <1% geothermal [100].
Vandewalle et al. [62] analyzed the interactions between hypothetical large-scale electricity, gas and CO2 infrastructures using a mixed-integer linear programming model of a simplified energy system with a high share of fluctuating renewable power. This system consisted of the electricity, gas and CO2 infrastructures, PtG installations, and back-up gas generators with CCS. Equal solar PV and wind electricity generations were assumed. Power-to-methane was used to store excess solar/wind electricity, with SNG injected into the gas network for re-electrification and other domestic uses, and to provide captured CO2 for hydrogenation. Actual demand, power generation and gas demand data from the Belgian energy system were employed. The total annualized investment and operating/maintenance cost of the energy system was minimized under constraints including operating characteristics of the power generators. Renewable power production costs, curtailment, excess electricity price and CO2 sourcing costs were omitted. The renewable power share of the minimum cost-energy system was estimated at 69% and 76% without and with PtG, respectively, when including the residual load covered by SNG/natural gas-fired power plants. At the minimum operating cost identified, PtG could not fully eliminate curtailment. Renewable generation and PtG integration were found to result in increased temporal variability of the gas demand and imports, requiring increased flexibility of the gas network. It was concluded that by reducing the gas demand, renewable power could lead to lower import gas prices that could be largely influenced by SNG cost. PtG also reduced the need for CO2 storage through CO2 sinking for SNG synthesis but was expected to require a complex CO2 transmission/storage network. Overall this work highlighted the increased extent and complexity of the interactions between the electricity, gas and CO2 domains, in the presence of high renewable shares and PtG. Future modeling improvements identified include extending the analysis to a broader range of electricity generation technologies at various shares in alternative scenarios, inclusion of other (i.e., non-power) sectors of the energy system, analysis of PtG capacity sizing/distribution, a broader range of candidate PtG applications, long-term rather than spot market pricing for imported gas, and the effects of uncertainties. The results could aid in improving the operation and regulation of the power, gas and CO2 systems, and related policy making.
Belderbos et al. [83] investigated the effects of the fluctuating electricity remaining demand on storage capacity requirements. The remaining demand was defined as the difference between demand and production at a given time, in a system having optimized renewable power and storage capacities. Two different types of storage technologies, namely disjointed and integrated, were contrasted. Disjointed technologies had charging/discharging power and energy storage capacities that can be optimized independently, such as PtG SNG synthesis (charging/storage) and SNG-fired power generation (discharging). Batteries were considered as an integrated charging/storage and discharging technology. The optimum combination of both types of storage technologies to handle a given remaining load was determined by minimizing storage and renewable electricity generation investment costs, on account of technical storage technology constraints, for renewable power shares of up to 100%. This optimization was undertaken using as input actual demand and on/off-shore wind and solar PV generation data from the Belgian power sector. Disjointed storage was found to be necessary for remaining demands requiring large energy-to-power storage capacity ratios (i.e., monthly/seasonal demand-production mismatch patterns, that normally occur at high renewable shares, such as >50%). By contrast, integrated storage was found to be required for remaining demands with large power-to-energy storage capacity ratios (i.e., daily/weekly mismatch patterns that would occur at smaller renewable shares). Such an analysis, particularly if extended to the actual, complete energy system and storage deployment details, can assist in the planning of storage investments.
3.1.11. Finland
Finland has reached an overall renewable energy consumption of 32% including 40% share in power generation, and targets 38% overall renewable share by 2020 to meet its committed 80–95% GHG emissions reduction compared to 1990 levels, resulting in zero GHG emissions [68]. Finland has a number of electricity grid interconnections with neighboring countries, enabling electricity imports primarily and exports.
Child and Breyer [68] examined Finland’s integrated future energy system in 2050 with power, heating/cooling, and mobility as interacting components. They defined eight re-carbonized energy system scenarios for Finland, aimed at both eliminating or reducing overall CO2 emissions, and replacing fossil carbon-based fuels with either synthetic ones or with fuels derived from biogenic sources. Analyzed at hourly resolution, the scenarios combined varying capacities (i.e., low to high) of nuclear, biomass and other renewables, collectively representing up to 100% share of the installed power generation capacity. Up to 42.5 GW wind, 35 GW solar PV, 3.5 GW hydropower, and 9 GW biomass-based CHP capacities were considered, along with up to 4.3 GW nuclear power capacity. The flexibility of the energy system in terms of accommodating high shares of variable renewable energy generation, with varying levels of nuclear power and forest biomass-based CHP, was analyzed using EnergyPlan software, focusing on the role of PtG (with H2 and SNG as products), PtL, and other energy storage technologies. An efficiency of 73% for electrolysis was assumed. CO2 for methanation was sourced from air, and methanation heat was employed for district heating. PtG capacities of up to 32.3 GW and 0.6 GW for SNG and H2 production were considered, respectively. It was found that 100% renewable energy scenario would be feasible and would result in a system having the lowest Finnish energy system overall annual cost at 24.1 b€/annum, whereas increased shares of nuclear power would drive cost upwards. PtG (up to 15 GW) and PtL (up to 10 TWhth) could offer robust and flexible storage solutions for excess power generated from intermittent renewable resources. The Finnish energy system would attain a high degree of independence, with natural gas imports eliminated.
3.1.12. Latvia
Latvia currently has 37% renewable power, mainly hydropower, the possible expansion of which is geographically constrained. Latvia still relies on natural gas imports from Russia for heating and power generation [69]. The country has gas and electricity interconnections with neighboring countries. Zoss et al. [69] analyzed the potentials of PtG and pumped hydrostorage in Latvia for reaching its 20-20-20 target by 2020 (i.e., 20% reduction in greenhouse gas emissions, 20% overall renewable share, and 20% improvement in energy efficiency). The total installed wind capacity in 2010 (i.e., 1.6 GW) could not be fed to the grid without modifications to the transmission and distribution systems. As potential solutions, power-to-SNG and pumped hydrostorage were compared in terms of energy density, available volumetric storage capacity, and available energy storage capacity. The current pumped hydrostorage capacity was estimated at 4.1 TWh, while PtG storage capacity from existing wind installations could attain 22.6 TWh but at a lower volumetric energy density than hydrostorage. Specific seasonal operational limitations were identified for each energy storage technology. Thus, the operation of SNG-driven CHP would be limited in summer due to a low heat demand, while the operation of pumped hydrostorage would be restricted during floods in spring. Although pumped hydrostorage would be preferable in terms of technology maturity, PtG’s potential advantages would include synergies with industries and the diversification of CHP gas supplies for increased energy security. Further analysis was recommended to evaluate the economic viability of PtG.
3.1.13. European Union
As of 2014, the EU had reached 14% and 23% of renewable energy penetration in its overall energy consumption and power sector, respectively [101]. 20% and 27% renewables in overall energy consumption are planned for 2020 and 2030, respectively [2,3]. According to the trends in the EU Reference Scenario 2016 [4], renewables would represent 24% and 31% of the energy mix by 2030 and 2050, respectively. In net power generation, 43% and 53% of renewables are expected by 2030 and 2050, including 36% of wind and solar combined in 2050 [4]. Other energy scenarios and roadmaps, such as [102], assume 100% renewable energy generation by 2050, and it is also anticipated that this may be achieved earlier [54].
Steinke et al. [54] analyzed a 2050 energy scenario for the EU with 100% renewable electricity generated by wind and solar energy. The backup power requirement was quantified as a function of grid extensions and storage capacity. This analysis was undertaken using annual wind and PV generation profiles predicted at optimal shares of wind and PV (i.e., 65% and 35%, respectively) to minimize the distance to the load, as determined in [103]. The total power system cost per energy unit, including renewable fluctuating and backup power, grid transmission/distribution, storage and re-electrification costs were compared for three storage options, namely pumped hydro storage, batteries or power-to-methane for re-electrification. Power-to-methane-to-electricity having an assumed 30% efficiency, was found to exhibit the highest storage and overall system costs, but led to the smallest backup power capacity requirement. It was concluded that power fluctuations should be reduced prior to storage when selecting power-to-methane as a storage option.
Meylan et al. [70] evaluated the raw material demands (i.e., water, CO2 and metal catalyst) for converting excess electricity essentially from solar and wind to SNG, assuming 80% penetration of renewable electricity consumption in Europe by 2050. The reconversion of SNG for power generation was analyzed, although other possible end-uses of SNG were mentioned (i.e., transport, chemicals for industry). A total alkaline and PEM electrolysis capacity of 45 GW with 2000 full load hours (FLh) was assumed, as well as 6 kWh/m3 H2 energy consumption and approximately 10 kg of deionized process water requirement per kg of H2 produced, for absorbing 90 TWh of surplus electricity. Ambient air and biogas plants were considered as sustainable sources of CO2 for methanation. As the electrolyzer types (i.e., AEL and PEM) considered were low-temperature, the methanation heat was assumed to be used for either biogas production, capturing CO2 from atmospheric or from flue gases, rather than to support a high-temperature hydrogen production process. With an individual PtG electrolyzer capacity of 20 MW, 2250 nos electrolyzer units would be required across Europe to absorb the excess electricity. The overall power-to-power yield (including reconversion of SNG to power) was estimated at 37%. Based on the analysis conducted, the renewable power-to-methane plants would require 45 Mtons of water (i.e., 7 Mtons for electrolysis and 38 Mtons for cooling), 6.31 Mtons of CO2 and either 32.72 tons of Nickel or 8.22 tons of platinum group metal (PGM) catalysts for absorbing 90 TWh surplus electricity annually. The water requirement was not estimated to be a concern, in comparison with water consumption by current natural gas and biogas power plants, and biofuel production, as well as considering water savings from transitioning to renewables. The amount of CO2 producible from biogas plants was estimated to be sufficient to produce 6.31 Mtons of CO2. The production of nickel could also comfortably meet the estimated catalyst requirement, unlike platinum group metals. It was recommended to consider abundant catalyst materials in the development of PtG technologies, and to further evaluate chemicals requirement for membrane electrolytes.
3.1.14. Canada
As of 2013–2016, the shares of renewables in the Canadian energy and power sector were of approximately 27% and 66%, essentially consisting of base-load hydroelectricity (i.e., 63% of total electricity generation), with supplemental wind (i.e., 2%) and solar generation (i.e., <1%) [12,104,105,106]. Approximately 80% of the country’s 2016 annual electricity production was zero carbon (including nuclear, hydro, wind, solar), with a recommended 100% goal in 2050 (also including biomass and tidal) [107]. The country’s 2050 decarbonization scenario proposed by the Canadian Council on Renewable Electricity also includes the adoption of electric vehicles [105]. Ontario’s electricity sector, in which PtG deployment options have been recently investigated [63,71,72,84], currently relies significantly on base-load nuclear power and hydroelectricity [104], with approximately 40% of renewables (hydro, wind, solar) and 90% of total energy generation from clean sources (when also including nuclear) [84,105]. Ontario also represents 40% of the Canadian natural gas consumption, has a large natural gas underground storage capacity, and exports a significant amount of excess electricity to other states at undervalued tariffs [63].
Walker et al. [12] applied an analytical hierarchy process (AHP) to compare the suitability of PtG and other energy storage technologies (e.g., flywheels, batteries, pumped hydroelectric storage, compressed air energy storage) for small- to large scale applications, including residential and bulk energy storage, and utility-scale frequency regulation. AHP was applied as a decision tool to the selection of the best storage technology, with this decision objective broken down into weighted criteria. These criteria included seasonal storage capability, duration range of energy storage, efficiency, cost, portability, energy density, applicability to fueling mobility, and consumer acceptability. PtG was found to be favored for large-scale uses (i.e., bulk, distributed and commercial storage including for hydrogen-fueled mobility, renewables integration, frequency regulation), but less suitable for kW-scale applications such as residential energy storage, where batteries scored higher than PtG. Study [12] did not involve any Canadian regional scenario-based analysis, but provided a generic technology screening methodology with preliminary results on the suitability of PtG, prior to the detailed evaluation of PtG deployment schemes.
Mukherjee et al. and Walker et al. [63,71,72,84] subsequently evaluated economically and environmentally several power-to-hydrogen deployment options in Canadian regional energy systems. The PtG installations were assumed to be installed in the vicinity of natural gas pressure reduction stations in Ontario. Mukherjee et al. and Walker at al. common goals were to reduce (i) electricity exports and (ii) CO2 emissions at end-users sites by switching natural gas with hydrogen-enriched natural gas, which was distributed via the natural gas network (<5% hydrogen concentration by volume). The enriched natural gas was used for residential heating [84]. Additional goals were to (iii) decrease CO2 emissions by replacing steam methane reforming (SMR) with PtG processes to produce hydrogen for petroleum refining [70], (iv) supply hydrogen to a fuel cell vehicle (FCV) re-fueling station [84], and (v) provide electricity grid demand-response management [71,84]. Hydrogen was produced using either alkaline [63] or PEM [71,72,84] electrolysis. These analyzes were undertaken using a mixed integer non-linear programming approach, with gas demand, and fuel and electricity pricing data for periods of six months up to several years within the 2009–2013 period.
Mukherjee et al. [63] optimized the size of alkaline-based PtG hydrogen production and storage components to minimize total cost. The minimization of CO2 emissions at the hydrogen-enriched natural gas users’ end was handled as an optimization constraint having varying weights. $3.8–10 million revenues were generated through 2.3–6.1% reduction in electricity exports, and $0.05–0.14 million revenues through avoidance of 3.5–9.4 metric tons of CO2 emissions, over six month period.
Mukherjee et al. [71] optimized the net present value of a 2 MW PEM-based PtG plant, with a targeted CO2 emission avoidance incorporated as an optimization constraint. Selling hydrogen-enriched natural gas at the Henry Hub natural gas spot price and electricity grid demand-response management, the investment was not found to be profitable for the nominal CO2 emission target considered. However, by relaxing this constraint by approximately 70%, a payback period of less than twelve years could be achieved.
Walker et al. [72] investigated the economic profitability (i.e., simple payback period and internal rate of return) of a 2–40 MW PEM-based PtG plant to provide hydrogen for petroleum refining, rather than via SMR, using MATLAB. The value of electrolytic hydrogen was benchmarked with that of natural gas, and equivalent prices of ethanol and SMR hydrogen. Although power-to-hydrogen could not compete with natural gas prices, it could be viable in comparison with industrial SMR hydrogen and renewable ethanol, at high electrolyzer capacities. Furthermore, more significant revenues could be generated by selling hydrogen to industry or mobility users.
Mukherjee et al. [84] maximized a single cash flow objective for a 2 MW PEM-based power-to-hydrogen plant for (i) reducing CO2 emissions at natural gas end-user facilities via hydrogen-enriched natural gas; (ii) grid electricity demand-supply balancing; and (iii) supplying hydrogen to a FCV station for 254 vehicles. The hydrogen was delivered at 30 bar for injection into low-pressure natural gas pipelines, and at 350 bar to a FCV refueling installation. Ontario’s current pricing regulations were employed, accounting for dynamic (i.e., hourly) electricity prices. The fueling of FCVs was found to provide the largest revenue share. However, the proposed PtG deployment scheme was not found be economically profitable under existing pricing mechanisms, with payback times exceeding the PtG system lifetime (i.e., twenty years). New, reasonable economic incentives that increased the values of PtG services were determined to enable their profitability within eight to ten years.
3.1.15. The States of California, New York and Washington, and the USA
As of 2017, the USA’s primary energy consumption comprised approximately 36% petroleum, 28% natural gas, 14% coal, 11% renewable energy and 8% nuclear energy. Renewables essentially consisted of biomass (45%), hydroelectric power (25%), and wind (21%), complemented by solar (6%) and geothermal (2%) generation. Electricity was produced at 34% from natural gas, followed by 30% coal, 20% nuclear, 15% renewables and <1% petroleum. Renewable electricity itself is dominated by hydroelectric and wind power, with significantly smaller shares of biomass, solar and geothermal electricity [108]. In 2012, the US Department of Energy’s National Renewable Energy Laboratory (NREL) reported several 2050 electricity sector scenarios with 30–90% renewable shares, focusing on 80% share, with simulation results suggesting its technical and economic feasibility [109]. In their 2016/2017 updated scenarios [110,111], NREL considered 33 to 59% renewable electricity production share for 2050, with a mid-case scenario at ~44% share. The more conservative Energy Information Administration’s 2018 reference projections for 2050 anticipate that renewables (including hydroelectric, biomass, solar, wind) would supply 27% of electricity generation, although solar PV and wind technologies combined would account for 64% of the total generation growth through 2050 [112]. IRENA’s recent 2050 roadmap includes 63% and 78% shares of renewables in US overall primary energy supply and power, respectively [113].
Jacobson et al. [46,47,48,49] proposed and evaluated the technical, economic and social benefits of a 100% wind water sunlight (WWW) roadmap to implement the use of on- and off-shore wind, hydropower, CSP, geothermal, solar PV, tidal, and wave, for electricity and electrolytic hydrogen production to meet the entire electricity, mobility, heating/cooling, and industrial energy demands of New York [46], California [47] and Washington [49] States, and the contiguous USA [48] in 2050. These studies built upon methodologies developed and applied at global scale in [44,45], and led to similar overall, qualitative conclusions. No direct reference to PtG nor power-to-thermal was made in [44,45,46,47,48,49], where PtG/PtH are part of a range of storage technologies to ensure grid reliability (i.e., solar thermal heat storage via soil, PtH combined with soil and water, power-to-cold via ice, and electricity storage via phase change materials, hydropower reservoirs, pumped hydro, batteries, and hydrogen). Hydrogen was produced electrolytically at an assumed 70% efficiency, after all electricity storage and thermal storage capacities were charged, and stored in either compressed gas or liquefied form [44]. The electrolytic hydrogen was mainly used for mobility, in fuel cell- and hybrid fuel cell-battery powered transportation, when batteries were not economical (i.e., for long-range and heavy ground transport, shipping, and air transport). Some electrolytic hydrogen was combusted for industrial high-grade heat [46,47,48,49] and building heat [46] generation. Distributed, rather than remote electrolysis, was suggested to avoid energy losses in hydrogen distribution [47]. Additional flexibility was provided by demand response management to displace peak loads, and frequency regulation. The WWW roadmap was compared with a business-as-usual scenario for each state that involved the continued use of fossil, nuclear and bio fuels, in terms of economics and social benefits.
The findings of a recent development of Jacobson et al. works [46,47,48,49] for Washington State [49] is summarized below. To place this work in context, as of 2014, the state had 26% share of renewables in total energy consumption (i.e., 16% of hydro, 6% of biomass, and 4% of other renewables) [114]. Electricity generation was provided by hydro (69%), natural gas (10%), nuclear (8%), wind (6%), coal (6%), and biomass (<1%), and others sources including petroleum and solar (<2%). The recommended greenhouse gas emissions limits for 2020, 2035 and 2050 are 1990 emission levels, 40% below 1990 levels, and 80% below 1990 levels, respectively [115]. For the Washington State 2050 energy system, Jacobson et al. [49] found hydro, on-shore wind, and utility-scale solar to be the most economically competitive WWS electricity generation technologies, and solar thermal for heat generation. Compared with a business-as-usual scenario, the WWW scenario enabled 40% reduction in overall power demand due to a combination of electrification (rather than combustion), avoided energy consumption for mining, transporting, and refining fossil fuels, and energy efficiency actions. Further benefits included stabilization of energy prices, and almost complete elimination of the atmospheric pollution and climate change costs associated with energy conversion. This translated to annual direct energy, health and global climate costs savings of ~85 USD, ~950 USD and ~4200 USD per inhabitant, respectively. Energy policy recommendations were made to implement the proposed roadmap.
While studies [46,47,48,49] included power-to-hydrogen and PtH among a range of enabling technologies for 100% renewable energy systems, PtG/PtH were not their focus. Consequently limited PtG/PtH details were documented, and their specific benefits not isolated. The proposed WWW roadmaps are discussed further in [116,117].
3.1.16. Australia
Australia is actively deploying solar PV and wind power generation to prepare the phasing out of its coal capacity, which currently generates two thirds of the country’s electrical power [118]. If Australia’s current PV and wind penetration growth rates are sustained, renewable electricity generation (also including hydroelectricity, solar thermal, geothermal, and ocean) could attain 50% share by 2030 [118]. The reduction of coal and gas power generation capacity factors will adversely impact the economics of these installations, and their ancillary service provisions will require to be substituted by alternative grid stabilization measures at high fluctuating renewable share, with pumped hydro energy storage evaluated in [118]. Australia is also investing in the development of water electrolyzers, and has recently began hydrogen injection trials into its gas network [119].
Laslett et al. [85] simulated a 100% renewable power generation sector in the South West of Western Australia. They assessed grid reliability for several scenarios involving different capacities of wind, solar PV and concentrated solar tower (CST) with 15 h thermal energy storage, and different levels of assumed average power sector energy efficiency (i.e., 20–40%). As the region does not possess substantial hydroelectricity, its power demand and grid stability are met by conventional installations (i.e., coal, natural gas, gas/liquid mix) and spinning capacity. No CST is currently implemented in the region. Depending on the 2030 scenario considered, distributed household/commercial-scale batteries with a combined regional capacity of 0.1–166 GWh, or 2.5–3.2 GW CST with thermal energy storage, and/or 450 MW power-to-methane for gas grid injection and re-conversion to power, were evaluated as energy storage options. PtG was included in a high wind 2030 scenario with solar PV, assuming 20% round trip efficiency. The required CST with thermal energy storage capacity was evaluated as a function of the distributed battery storage capacity (i.e., 0–40 GWh), with or without installation of 450 MW PtG capacity. In winter months, reduced solar and wind energy availability required to be compensated by additional capacity, resulting in excess capacity in summer. It was concluded that a balanced combination of solar PV, wind and battery storage, in conjunction with energy efficiency improvement actions, would be the most rapidly achievable solution. In addition, at 80% wind power generation share, either significant distributed or seasonal storage (i.e., PtG) capacity were found to be required, and the relative proportions of each type of storage was anticipated to strongly rely on economic considerations, as well as future PtG efficiency and operational flexibility improvements.
3.1.17. East Asia
Gulagi et al. [86] analyzed four different 100% renewable East Asian (including Australia, China, Japan, Korea) energy scenarios in year 2030, with the region subdivided into twenty sub-areas. The power generation installations consisted of solar PV and CSP, on-shore wind, hydroelectric power, biomass, waste-to-energy, geothermal plants and SNG-fed gas turbine plants, with electricity generation/demand simulated on an hourly basis. Batteries, pumped hydro storage, compressed air and power-to-methane with CO2 sourced from air were considered for energy storage. The scenarios differed in terms of inter-regional energy systems interconnections, SNG uses (i.e., seawater reverses osmosis, industrial gas demand, electricity generation in gas turbines) and whether Australia acted as a renewable SNG production/liquefaction and trading hub for the region or not. The annual total capital and operating costs (including generation, curtailment, storage and transmission) of the energy system consisting of the power, residential, commercial, and industrial sectors, were minimized using linear interior-point optimization. A 100% renewable 2030 East Asian energy system including 50% PV and 30% wind share was found to be feasible in terms of covering the electricity, renewable SNG and water desalination demands, and would economically be competitive compared with a coal-based energy system. A fully integrated North-South region would not significantly reduce the total energy system costs, essentially due to the cost of long distance electricity transmission. However, the lowest costs were achieved for the fully integrated regional scenario when SNG was exported from West Australia to East China and Japan. The authors concluded that Australia could become an exporter of liquefied SNG to Asia, where a 100% renewable energy system could be economically advantageous compared with nuclear and carbon capture from fossil sources and storage.
3.1.18. World
To maintain a global temperature rise well below 2 °C relative to pre-industrial times, IRENA’s 2050 roadmap projects 66% and 85% shares of renewables in global overall primary energy supply and the power sector, respectively, compared to 15% and 25% in 2017, respectively [113]. Jacobson et al. [50] envisage that 80% and 100% of the current global energy sector would require to be converted to a zero-emission one by 2030 and 2050, respectively, to avoid both air pollution mortality/morbidity and 1.5 °C global temperature rise.
Jacobson and co-workers applied their WWW methodology, summarized earlier in Section 3.1.15 for U.S. states, at global scale in [44,45,50,51]. As previously noted, the conversion of power to hydrogen and heat were not referred to as PtG/PtH, and were a sub-set of energy conversion and storage technologies (including underground rock/water heat storage, ice/water cold storage, batteries). Tidal and wave electricity generations were assumed to be deployed only in a few regions [50]. In addition to using liquefied hydrogen combustion [44,45], aircrafts were assumed to be either fully electrified or hybridized (i.e., fuel cell-electric) [50]. Jacobson et al. [51] complemented [50] with an analysis of demand-supply matching for three WWW 2050 scenarios placing different level of emphasis on each storage technology. Hydrogen was produced from approximately 7% of the end-use electrical load in two scenarios [51]. Compared with a business-as-usual scenario, the WWW roadmap developed for 139 countries in 20 regions was projected to avoid 1.5 °C global warming, reduce the electricity demand by 42.5% [50,51] to 57.9% [51], stabilize commodity prices, enable 24.3 million net job creations, avoid 3.5 million annual deaths in 2050, and 22.8 to 28.5 trillion of air pollution and climate-related costs [50]. These social costs represented approximately 25% of those in the business-as-usual scenario [51]. Energy policy recommendations were made to implement the proposed roadmap.
The regional-scale PtG deployment scenarios reviewed in this section, which are discussed further in Section 5, have been essentially motivated by energy efficiency improvements, environmental and energy security concerns. The linkages between the electrical and gas distribution networks, as well as between the power generation and energy consuming sectors, were central aspects of these scenarios, as they influenced PtG processes, products and their end-uses, technical-economic-environmental benefits, and modeling methodologies. By contrast, the PtG deployments for industrial or small-scale power facilities reviewed in the next section have been largely motivated by increased profitability, in the context of increasingly cost-competitive renewables and rising conventional fuel prices, opportunities of process capital and operational efficiency improvements, and opportunities of new, high-value added products enabled or facilitated by changes in processes. For these reasons, the contents of such studies typically shifts from macro-level modeling at regional-scale, to process-level modeling at a distributed scale.
3.2. Distributed-Scale
Distributed-scale PtG deployments are discussed in Section 3.2.1, Section 3.2.2, Section 3.2.3, Section 3.2.4, Section 3.2.5, Section 3.2.6, Section 3.2.7, Section 3.2.8 and Section 3.2.9 by type of PtG deployment environment, which typically consists of an industrial manufacturing or small-scale power plant. Similarly to the regional deployment studies in Table 1, distributed-scale deployments are listed in chronological order in Table 2, with the deployment environment, power source, PtG processes, products and their-uses, and material/energy integrations tabulated.
3.2.1. PtG and Coal Power Plant Integration
The need for excess electricity storage in Germany arises due to increasing renewable shares and the consequent reduction in the operational load of lignite-fired power plants (LPPs), which increases electricity cost. Buchholz et al. [120] investigated the coupling of a 80 MW alkaline-based PtG-SNG plant and conventional 800 MW lignite power plant to store excess energy and improve LPP economic viability. As the PtG plant absorbs excess LPP loads, the LPP can operate at fixed load and avoid the additional operating expenses associated with load-following. In addition, the LPP lifetime is improved. Three candidate methanation thermal configurations (i.e., isothermal, adiabatic and mixed) were compared in terms of capital and operating expenses, operability, controllability, technology maturity, safety and flexibility. The former was selected due its lower capital equipment requirement. The heat rejected by the methanation reactor was recycled for steam production, either as feed to the LPP or to the amine-based LPP fuel gas CO2 capture. The number of heat exchangers and heating/cooling utilities were minimized using a heat integration pinch analysis. The cooling water for temperature control of the methanation process was extracted from the LPP pre-boiler feed water stream. When using SNG to produce electricity to reduce the LPP boiler heat duty, the overall power-to-power efficiency was estimated at 29%. The corresponding reduction in LPP lignite consumption was found to be negligible (i.e., less than 1% by mass). From a dynamic operation perspective, the CO2 capture was found to be the limiting process. Based on SNG prices versus natural gas prices, the PtG-LPP hybridization was only found to be profitable when accounting for the reduction in LPP operating costs due to its operation at fixed load when coupled with PtG, instead of load-following when operating as stand-alone. Both future reductions in electrolysis cost and increasing renewable shares were anticipated to improve the value of this hybridization.
3.2.2. PtG and Kraft Pulp Mill/Biodiesel Production Plant Integrations
Both CO2 capture and oxygen consumption have paramount importance for pulp mill energy performance. Breyer et al. [121] followed an integrated value chain approach for evaluating the economic benefits that could be generated by integrating a PtG plant with either an existing pulp mill or a biodiesel production plant in Finland. The PtG plant supplied oxygen to the kraft and paper mill, and it was also proposed to utilize methanation heat for a CO2 capture process. The kraft pulp mill produced wood-derived CO2 for methanation and deionized make-up water for electrolysis. The use of electrolytic hydrogen for methanation or bio-diesel production (to increase the value of bio-diesel) from pulp and paper mill by-products were compared. In addition, it was suggested to use the electrolyzer for grid frequency containment regulation. Finding a standardized profitable business case for PtG was found to be difficult, however, with progress in PtG technology, it was anticipated that profitable business models could be achieved by 2020. It was recommended that all possible sources of revenue should be exploited, including the produced PtG gases in markets where they would attain the highest possible value (e.g., mobility), the PtG oxygen by-product, PtG grid services, and that the PtG plant should be driven by low-cost electricity and operated at a high load utilization factor.
Kuparinen and Vakkilainen [128] compared the techno-economic feasibility of several renewable-based fuels, including alkaline-based power-to-hydrogen, producer gas, and biomass fuels (i.e., torrefied biomass, lignin, pulverized biomass) derived from the biomass residues of wood handling operations at kraft pulp mills in South America. Such fuels were destined to replace fossil fuels (i.e., fuel oil in this study, and natural gas in other cases) for combustion in lime kiln operations, which are the only fossil fuel-consuming operations in kraft pulp mills. Typically, excess renewable electricity produced by the kraft pulp mill is sold, while excess heat (in the form of hot water or steam, rather than flue gas for safety purposes) is used to produce paper and power in a steam turbine. Instead, it was proposed to use the excess renewable electricity to drive alkaline electrolytic hydrogen production, or drying/gasification, torrefaction, lignin extraction or wood pulverization processes. In parallel it was proposed to use the excess heat to produce alternative biofuels/biochemicals. The electrolytic hydrogen could cover 72% of the lime kiln heat demand (>800 °C) and serve as feedstock together with the producer gas, torrefied wood and pulverized wood processed using excess heat, to produce both biofuels to drive lime kiln operations and bioproducts. By contrast, the use of biofuels as fuel oil replacement could cover the complete lime kiln energy demand. The electrolytic oxygen was employed for delignification and bleaching operations. The economic benefits of the alternative fuel replacement options investigated were found to be highly dependent on the local prices of the fossil fuel displaced and electricity. The break-even fuel oil price for which the alternative fuels became profitable was found to be the lowest for biocoal, producer gas and pulverized wood, and the highest for lignin. Whereas for those fuel alternatives, the break-even fuel oil price was weakly sensitive to electricity price, the break-even fuel oil price significantly increased with electricity price in the case of electrolysis. Depending upon the electricity price, the break-even fuel oil price was either the highest or second highest for power-to-hydrogen. At current crude oil prices (i.e., ~62 USD/bbl in the first quarter of 2018 [134], which defines the break-even fuel oil price (i.e., ~35 USD/MWh), the electricity price would require to be below ~10 USD/MWh for electrolytic hydrogen to be profitable, with the value of electrolytic oxygen (i.e., 50 USD/tO2) accounted for. Low-cost electricity, higher on-site oxygen consumption, future reductions in electrolysis cost, and/or progress in SOE, were listed as factors that could enable the profitability of power-to-hydrogen.
3.2.3. PtG and Biomass Combined Heat and Power Plant Integrations
Tsupari et al. [123] presented a detailed analysis of a PtG process incorporating a 10 MW electrolyzer integrated with an existing 300 MWfuel biomass co-fired (i.e., peat and forest residues) CHP plant in Finland. The CHP plant incorporated a boiler to co-fire peat and forest residues, and could flexibly handle moist feedstocks and mixed feedstocks. The CHP facility provided electricity and CO2 for the electrolysis and methanation processes, respectively. In turn, the PtG process supplied part of the oxygen enrichment to the CHP plant combustion process. Oxygen enrichment enabled increased fuel processing capacity, which was used to generate additional electricity in a steam cycle and heat for district heating. This thermal energy partly replaced the heat normally generated by district boilers. The PtG plant was assumed to operate only during low-cost electricity periods and could provide frequency control to the grid. When applied, this service, together with SNG production, were the most important sources of income. However, at current renewable integration levels in the country, the size of the frequency control market was concluded to be too limited. The revenues from electrolysis oxygen utilization in the CHP plant were found to be highly dependent on the price of the additional heat produced by the CHP plant for district heating. In addition, high CO2 prices were found to improve profitability, but reduced the value of oxygen due to an increase in peat-fueled CHP operating cost, when electricity prices did not increase. The plant capital cost and electricity price were the most significant expenses. This CHP-PtG integration could only be profitable in less than ten years for the higher electrolysis efficiency value (70% versus 62% base case) or higher SNG price in Finland, based on local electricity prices. Analyzing several market scenarios, it was found that the same PtG concept could however lead to profitable business cases in Germany, where electricity cost is lower than in Finland [123].
In parallel, the same authors [124] pre-screened and discussed the techno-economic feasibility of several conceptual industrial PtX integrations schemes, including PtG, in the short term and on a location-generic rather than location-specific basis, in sectors including pulp and paper, CHP, water purification, oil refining and iron/steel. The use of at least three PtG products (i.e., heat, steam and oxygen), as well as avoidance of electricity distribution and CO2 provision costs, were recommended for improved economic viability. A number of options for heat, steam and oxygen utilization were reviewed. Although transport fuels were thought to be the most profitable PtX products, it was concluded that PtG schemes were close to also becoming economically viable projects, subject to the promotion of carbon-neutral CO2 via supporting measures, such as increasing CO2 prices.
3.2.4. PtG and Oxyfuel Combustion Boiler Integrations
Bailera et al. [122] evaluated the global efficiency of a PtG plant coupled with a coal-fired oxyfuel combustion boiler. The electrolytic oxygen was used to reduce the electricity demand of the air separation unit (ASU) formerly used to supply oxygen to the oxyfuel boiler. The boiler flue gases (CO2, O2) and electrolytic hydrogen were fed to a chemical methanation reactor to produce SNG, with no requirement for CO2 separation. A minimum characteristic ratio of 1.33 between the thermal energy of the electrolytic hydrogen produced and the boiler heat output was identified to completely eliminate the need for the ASU. At this operating point, the overall hybrid plant first-law efficiency was estimated at 59.8–65%. When increasing the above characteristic ratio to 2.3 to also achieve complete oxyfuel boiler CO2 utilization by the methanation process (hence zero boiler-induced CO2 emissions), the oxyfuel boiler system efficiency increased, due to elimination of both the ASU and CO2 storage compressor. However, the overall hybrid PtG-oxyfuel boiler efficiency reduced to 55.5–61.1%, due to PtG efficiency being lower than that of the oxyfuel boiler. At the characteristic ratio of 2.3, the avoided boiler-induced CO2 emissions amounted 2570 tons per unit net MWth thermal energy input to the boiler, in addition to the avoided ASU emissions. At this operating point 946 tons of SNG would be produced per unit net MWth energy input to the boiler. It was suggested to use the heat rejection from methanation for either other processes or in the hybrid plant for improved on-site efficiency.
Bailera et al. [125] also proposed and analyzed a hybrid PtG and biomass-fed oxy-combustion system producing SNG in Spain, as a function of system size (i.e., 0.01–1 MW scale PtG) and operating conditions. The key motivations for this integration were to avoid the cost of CO2 capture from power plants or industry, and to use a carbon-neutral CO2 source (i.e., biomass as a replacement of coal). A renewable energy source was assumed to drive the electrolysis process, with the oxygen by-product fed to the oxy-fuel boiler. The overall efficiency of PtG could be improved by 29.7% by saving the power consumption of an ASU for the oxy-combustor through utilization of the oxygen produced by electrolysis, and by fully consuming the CO2 produced by the oxy-combustor for methanation. The technical and economic feasibility of several applications of the proposed hybrid PtG–biomass oxy-combustion system were discussed, namely household heating, district heating, industrial boilers, direct biomass combustion power plants, and co-firing. Only district heating and industrial applications were found to be feasible under the conditions of the study; these applications could utilize waste heat recovered from the hybrid PtG plant compression trains and methanation. The pulp and paper and chemical sectors were suggested as examples of potential medium grade heat end-users.
The heat and material (i.e., oxygen, CO2) integration approaches employed in [122,125] were also applied to a low-temperature electrolysis based power-to-SNG plant hybridized with either an oxyfuel boiler, a sub-critical Rankine or combined cycle power plant in [126]. The power cycle steam was generated using heat recovered from the methanation plant. The overall first-law efficiencies of the integrated systems were compared for several boiler fuels and power plant fuels (i.e., coal, biomass, natural gas), and relative electrolyzer and oxycombustion unit size ratios. Compared with either a SNG- or coal-fired boiler, a biomass-fed boiler led to smaller electrolyzer sizes to cover the oxyfuel process oxygen requirements, due to the higher oxygen fraction in the biomass. With a SNG-fueled boiler, a smaller electrolyzer size than for either biomass- or coal-fueled boilers could process the complete oxyfuel exhaust gas CO2, due to the lower carbon to hydrogen ratio in SNG. Furthermore for a SNG-fueled combined cycle, a smaller electrolyzer size permitted to meet the combustion oxygen demand due to a lower fuel requirement than for less efficient coal or biomass-fed sub-critical power plants. Based on the cost and size of commercially-available electrolyzers (i.e., <2 MW), hence their required number when hybridized to supply oxygen to and sink CO2 from external applications, SNG-fueled oxycombustion systems for industrial and district heating were recommended as the most feasible applications. The maximum practical hybrid system sizes were determined to be those of PtG integrated with small-scale combined cycles. Less efficient sub-critical power cycles would lead to excessive system sizes. An overall efficiency of up to 67.5% was obtained for a hybrid PtG and small-scale combined cycle plant, by using a pinch analysis to optimize the methanation plant heat exchanger network and recover 88% of the hydrogenation heat rejection to generate steam for the Rankine cycle. Exergy-based analyses were suggested as extensions in future work.
3.2.5. PtG and Electrochemical Production Plant Integration
Bailera et al. [127] presented a hybridization of PtG and electrochemical plant production processes, with the objective to replace the current synthesis of ammonia by that of SNG, a higher-value product. Aside ammonia, the plant currently also produces hydrogen peroxide and hydrochloric acid. In this approach, hydrogen is not produced using electricity directly, which avoids the capital investment associated with electrolyzers. Instead, the hydrogen by-product of certain chemical electrolytic processes in existing sodium chlorate (NaClO3), chlorine (Cl2) and potassium hydroxide (KOH) production lines, is used for hydrogenation of CO2 captured from the plant boilers’ flue gases. This hybridization involves integration of catalytic methanation reactors with the existing electrochemical plant. The heat of methanation is recovered to both reduce the energy expenditure associated with amine-based CO2 capture and produce 238 kg/h of medium pressure steam at 180 °C for on-site consumption in the electrochemical plant. The PtG plant consumes over 85% of the electrochemical plant’s hydrogen by-product and approximately 60% of the emitted CO2, to produce 519 m3 per hour of SNG (NTP), and can operate for over 6000 h annually. The electrochemical plant uses renewable electricity as a source of energy and mostly operates during low-cost electricity periods. The net present value, internal rate of return and capital recovery period were estimated at 4.8 M€, 9% and eight years, respectively, by including both the SNG (29 €/MWh) and medium pressure steam (24.6 €/MWh) as income.
3.2.6. PtG and Oil Refinery Integration
Al-Subaie et al. [129] evaluated the economic viability and avoided CO2 emissions of producing hydrogen for Canadian oil refineries from existing low-carbon, surplus electricity sources via PtG, rather than via SMR. The objectives were to avoid wind electricity curtailments and electricity exports, and reduce the life cycle emissions of SMR. An optimization was performed to identify the optimum electrolysis production scheme configuration and operating conditions to meet the hourly hydrogen demand of a refinery, while minimizing the total annual hydrogen production and storage costs. Hourly Canadian electricity prices were considered as well as a fixed carbon price. Although the sale or use of electrolytically produced oxygen for oxygen-enrichment of refinery processes (e.g., fluid catalytic cracking, sulfur recovery, furnace heating, waste water treatment) would reduce the cost of PtG-based hydrogen production, this was not included in the economic analysis. At low natural gas prices (that typically represent 52–68% of the cost of hydrogen production by SMR), reforming was found to offer a lower hydrogen cost than PtG. However, PtG could enable a significant reduction in CO2 emissions associated with SMR, thereby contributing to the decarbonization of petroleum fuels. For a refinery processing 100,000 bbl of crude oil per day, the production of 25 MMscfd of hydrogen via PtG would be equivalent to eliminating almost 35,000 gasoline-fueled road vehicles. Unlike for the other distributed PtG deployments in Table 2, no material/heat integration was assumed between the PtG plant and external installations, other than through the provision of hydrogen for the refinery. However, the sale or use of electrolytically produced oxygen for oxygen-enrichment of refinery processes (e.g., fluid catalytic cracking, sulfur recovery, furnace heating, waste water treatment) was envisaged to enhance the cost competitiveness of PtG-based hydrogen production.
3.2.7. PtG and District/Building Integrations
Nastasi and Lo Basso [67] proposed several electrolytic hydrogen uses in generic national energy systems (Section 3.1.9), as well as in generic district and building environments for application over the next two decades. Hydrogen was blended with natural gas for combustion in CHP units for heat and electricity generation, and in gas engines to drive adsorption heat pumps for heating. Hydrogen also served as a working fluid in metal hydride adsorption heat pumps driven by electrolyzer heat and employed in heating applications, and for catalytic SNG production. Low-temperature electrolysis heat losses were used to regenerate the regeneration hydride of the metal hydride heat pumps, through thermal integration between the power-to-hydrogen system and heating application. In this approach, the electrolyzer co-generates hydrogen and thermal energy, thereby raising its efficiency above unity. CO2 for SNG synthesis was captured from combustion processes, thereby realizing a closed-loop (quasi of fully)-neutral carbon cycle.
Using a methodology similar to that of [67], De Santoli et al. [130] evaluated applications of natural gas-blended electrolytic hydrogen in existing European buildings rather than new constructions, in terms of primary energy savings. The blended hydrogen was employed as a combustion fuel to drive CHP and adsorption gas-driven heat pumps, when building-integrated solar PV and hybrid PV-thermal collector (PVT) modules could not be fitted on roof surfaces. These electrolytic hydrogen uses reduced the need for additional renewable power plants. Nastasi and Lo Basso [131] extended their heat provision strategies to different temperature levels in existing building mixes based in Rome, Berlin, and Copenhagen, for renewable electricity generation shares of 25–50% representative of the next two decades. The building energy models were characterized by different power-to-heat ratios and heat consumptions at each temperature level. The natural gas-blended hydrogen was combusted in CHP to provide high temperature heat (70–120 °C) and in gas engines to supply medium temperature heat (60–65 °C), as a replacement of conventional boilers. The highest renewable heat share was obtained for the Copenhagen urban model, despite its high proportion of low-temperature heat consumption. This was attributed to the fuel switching directly impacting all medium and high-temperature heat supplies, and indirectly grid electricity savings. Unlike in [67], where electrolyzer heat was recovered to drive adsorption metal hydride heat pipes, and unlike in other distributed PtG deployments, particularly PtG-CHP integrations [123], no heat/material (e.g., oxygen) integration options were reported in [130,131]. In addition, economics were indirectly addressed through primary energy savings rather than monetary metrics.
3.2.8. PtG and Winery Integration
The energy requirements of the wine industry for irrigation, farming, processing, and transportation exhibit significant seasonal and daily variations, and are currently provided by fossil fuels. Wineywards and wineries are often located in remote areas. Carroquino et al. [132] proposed the use of solar PV electricity to cover the energy demand of a Spanish vineyard irrigation pumping system and the waste water treatment plant of a winery. To stabilize the micro-electricity grid, excess solar electricity was stored using a combination of a ~129 kWh battery and alkaline-based power-to-hydrogen plant, for short-term and longer term storage, respectively. The electrolytic water feedstock was purified using reverse osmosis. The produced hydrogen was compressed at 200 bar (109 m3 storage capacity), stored in a refueling station and used on-site in hybrid battery electric-PEM fuel cell vehicles. The efficiency of the solar PV-to-vehicle wheels conversion chain was estimated at 24.6% to 30.5%. 72 MWh of solar PV electricity was generated annually, of which 6.4 MWh was converted to 1214 m3 of hydrogen. Solar PV electricity generation was found to both be economically viable, and avoid 1010 L of diesel consumption and 2.7 annual tons of CO2 emissions, in comparison with the current use of grid power and diesel generators.
3.2.9. Pilot PtG Plant and Compressed Natural Gas Vehicle Refueling Network Integration
Finally, in terms of industrial pilot PtG installations, it is worth noting that among the number of European-based PtG demonstration projects listed in [135], the largest operational one (i.e., 6.3 MW capacity), Audi’s CO2-neutral e-gas mobility system [135,136], is an industrial initiative. This PtG facility produces SNG from hydrogen synthesized by alkaline electrolysis from a standalone wind power plant, and CO2 from an organic waste-fueled biogas plant. The SNG is delivered to compressed natural gas (CNG) service stations via gas pipelines.
Similarly, the planned 6 MW Linz (AT)—H2FUTURE [135,137] PtG demonstration project will convert renewable electricity with a large share of hydroelectricity to hydrogen using a flexible-load PEM electrolyzer, for both injection into the internal gas network of Voestalpine Linz steel industry, and grid balancing.
4. Nuclear-Assisted Renewable Power-to-Hydrogen Deployment
The PtG literature has focused on the conversion of excess, fluctuating renewable electricity primarily using electrolysis, with less attention to other low-carbon power sources and other hydrogen synthesis options. Nuclear power generation is a low-emission technology which can contribute to support the transition to renewable-based energy systems. Total excess electricity may be produced from a combination of fossil and renewable sources, with the time-varying portion of electricity that causes grid instability either generated by fluctuating renewables, or in for example the French power sector, by advanced reactor controls to follow power demand profiles [26].
Nuclear-assisted hydrogen production schemes combining thermochemical water splitting driven by nuclear reactor waste heat, and nuclear power-driven high-temperature electrolysis, have been presented in [138,139,140,141]. Orhan et al. [141] suggested the copper–chlorine (Cu–Cl) cycle as a promising low-temperature process for integration with a wide range of nuclear reactors. The compatibility of the Cu–Cl cycle with heat sources at 500–550 °C could reduce the need for heat-resistant materials and facilitate its application to nuclear heat-driven hydrogen production.
Such nuclear power-driven hydrogen production schemes may be hybridized with renewable power-driven electrolysis. Figure 4 illustrates the integration of (i) low-temperature water electrolysis from either nuclear or renewable electricity; (ii) high-temperature water electrolysis from renewable and nuclear electricity; and (iii) thermochemical water splitting from renewable (e.g., concentrated solar) and nuclear power plant waste heat. Although such hybrid hydrogen production schemes have generally not been explicitly referred to as PtG, but rather as energy storage using nuclear-assisted renewable hydrogen production [141], they can be considered a generalization or extension of the PtG concept. Power conditioning and controls could direct the power generated by the integrated renewable–nuclear power infrastructure to either the grid or a hydrogen production unit [141].
Hydrogen production could also be extended to SNG production as illustrated in Figure 4. Due to direct heat utilization, the nuclear fuel to thermo-chemical hydrogen production pathway could be of higher efficiency (i.e., up to 60% [140]) than the conversion of a fuel or energy source to electricity first and then to hydrogen via electrolysis [139].
Previously proposed hybrid hydrogen production schemes from nuclear and renewable electrical/thermal power [138,139,140,141] are summarized in Table 3, in terms of geographical location, energy source, and hydrogen production process and end-use.
Forsberg [138] proposed the production of hydrogen and oxygen from low-price, off-peak nuclear electricity and reactor waste heat using electrolysis and/or thermo-chemical cycles for storage and later use in advanced hydrogen–oxygen steam cycles, or for replacing natural gas by hydrogen in combined cycles or fuel cells during peak (i.e., high-price) electricity periods. Underground hydrogen storage in man-made and pressure-compensated caverns, and porous rocks with impermeable cap rocks, was envisaged for potential application in the United States (US). The applicability of this concept would be facilitated by large electricity price demarcations between low and high demand periods, low-cost hydrogen and oxygen storage, and conversion of hydrogen and oxygen to electricity at high efficiency.
Naterer et al. [139] studied the synergistic roles of off-peak nuclear power-driven and renewable-driven (i.e., wind, solar, tidal) electrolysis in distributed locations, and centralized nuclear reactor heat-driven thermochemical water splitting using a copper–chlorine (Cu-Cl) cycle for hydrogen production in Canada. Although thermo-chemical hydrogen production could offer higher efficiency than the production of electricity first and subsequently of hydrogen via electrolysis, it was suggested that electrolysis may be economically preferable during low electricity price periods and in conjunction with the existence of variable output renewables. The systematic combination of electrolysis and thermochemical hydrogen production processes could make the water-based production of hydrogen more economically viable than using steam-fossil methane reforming [139].
O’Brien [140] proposed a conceptual high-temperature (~850 °C) SOE-based steam electrolysis system powered by both off-peak, low-cost electricity generated by an advanced nuclear reactor, and a high temperature heat source from either the primary helium reactor coolant, concentrated solar or biomass gasification installations, for large-scale production of hydrogen. This concept was thought to be more cost-effective than renewable electricity-driven electrolysis in the immediate future. The SOE system could also perform co-electrolysis of steam and carbon dioxide, with the produced syngas converted to synthetic liquid fuels. Petroleum upgrading and ammonia production were the main uses of hydrogen envisaged in the near term, while mobility and synthetic liquid fuel production were proposed in the longer term.
Orhan et al. [141] presented integrated system approaches to couple nuclear and renewable energy systems (i.e., wind, solar, hydro, geothermal electricity/heat) for hydrogen production to meet a variable energy demand. One of the hydrogen production schemes proposed was based on serially-operated, constant-load nuclear reactors coupled with variable-load, flexible production solar-plants. Orhan et al. [142] subsequently evaluated the overall, system-level energy and exergy efficiencies of such a scheme. The study was motivated by the United Arab Emirates (UAE) upcoming launch of 1.4 GW nuclear reactor in 2017, and three additional reactors by 2020 leading to a total of 5.6 GW nuclear capacity, to meet the country’s rising energy demand while reducing its CO2 emissions. As acknowledged in [141], one of the main technological barriers of using hydrogen is the lack of a safe storage system, which could be overcome by converting H2 to CH4 via methanation.
Unlike the PtG deployment studies compiled in Table 1 and Table 2, that involved energy scenario-based analyses to quantify practical PtG technical, economic and environmental benefits, the proposed power-to-hydrogen and heat-to-hydrogen schemes in Table 3 are essentially at a conceptual or earlier evaluation phase. However with further progress in thermochemical splitting technologies, these concepts could be incorporated with PtG in future large-scale, low-carbon energy storage deployment scenarios.
5. Research Trends and Future Opportunities
Based on the foregoing review of technical, economic and environmental assessments of PtG deployment scenarios projected up to 2050, the following collective research trends are identified, leading to suggested future research opportunities. These insights are categorized under the following PtG thematic areas:
- Deployment scales, geographical locations and power sources
- Products
- Sub-processes
- CO2 sources
- Energy/material integrations
- Economics
- Modeling/optimization methodologies
5.1. PtG Deployment Scales, Geographical Locations and Power Sources
5.1.1. Research Trends
The majority of PtG deployment studies have focused on regional to national-level implementations, rather than distributed, facility-scale implementations. While most of the proposed regional/national PtG deployments have been surplus grid electricity-driven, industrial and small to medium power plant-scale PtG implementations make use of either regional grid or on-site renewable electricity that is not necessarily surplus. The additional use of non-surplus power facilitates PtG integration with quasi continuous industrial/power generation processes, and enables more economically viable PtG plant utilization factors.
Most deployment scenarios have been based in Europe, reflecting progress in renewable energy implementation. For some major energy players elsewhere, limited PtG activity may be associated with: (i) uncertainties about or no expected significant future excess electricity generation; (ii) focus on other potential storage options; (iii) insufficient electricity and gas network development/integration close to fluctuating power installations; (iv) limited PtG product underground storage capacity; and/or (v) strict natural gas standards that would constrain gas blending.
Because of geographical location, technology maturity and favorable economics, wind and solar PV have been the dominant sources of excess fluctuating power in large-scale deployment schemes, with hydroelectricity, biomass and nuclear power as additional components of the clean energy mixes. In facility-scale PtG deployment schemes, documented power sources have also included low-cost hydroelectricity, unspecified renewable mixes and CHP.
The reported PtG plant capacities have ranged from 1 to 80 MW in distributed-scale deployment schemes, and 0.2 to 110 GW in national/regional schemes.
5.1.2. Future Opportunities
There is scope to extend PtG deployment studies to other energy systems including in new geographical locations, susceptible of integrating large shares of fluctuating renewable power, generated by potentially different conversion technologies minimally or not analyzed in proposed PtG deployments to date (e.g., concentrated solar power, hybrid renewable power). Such studies would involve demand and generation profiles different from those reported to date, different PtG/PtX product and end-use requirements, and different economic and environmental context. Additional challenges in the analysis of PtG deployments may be encountered in developing renewable-based economies, such as limited energy planning, policies/regulations, and data availability, and less developed electrical/gas infrastructures, in comparison with more developed, renewable-oriented economies.
There is also a need for further distributed-scale PtG deployment evaluations, involving synergies with a broader variety of industrial facilities and other sectors.
5.2. PtG Products
5.2.1. Research Trends
SNG was produced in the majority of proposed PtG scenarios, either as a sole product or in parallel with hydrogen. This reflects the availability of a natural gas distribution, storage and end-use infrastructure, in spite of the additional thermodynamic losses and cost incurred for the conversion of hydrogen to SNG. Industrial PtG implementations have the distinct advantage of enabling the use of hydrogen on-site in manufacturing processes and/or utilities, thereby avoiding hydrogen transportation/distribution. In general, likely profitable outputs identified in deployment studies include the use of hydrogen and synthetic PtL fuels in mobility (which will be facilitated by increasing fossil transport fuel prices), and power-to-heat in energy systems with high residential/district or industrial heat demands.
5.2.2. Future Opportunities
From the present review, it transpires that most deployment studies, when considered individually, have not evaluated the full range of relevant PtG deployment options, and competing PtX products, storage and flexibility options for a given deployment environment. Ultimately, the technically, economically and/or environmentally optimum solution in a given energy system may be a customized mix of PtX technologies and products, storage and flexibility options. Therefore, there is a need for broader technical-economic-environmental PtG feasibility assessments, involving a more systematic, concurrent evaluation of alternative PtX solutions, on a case-by-case basis for specific application environments.
As previously noted, previous studies indicate as candidate promising PtX products hydrogen and PtL fuels for mobility, and power-to-heat for district, industrial and commercial uses.
However, with regard to power-to-hydrogen, there is a recognized need to better understand the effects of hydrogen concentration in blended natural or synthetic gas on end-use system performance. Also, the feasibility of future hydrogen applications relies on the large-scale deployment of developing technologies (e.g., hydrogen-fueled vehicles, hydrogen storage/distribution). PtG deployment modeling assumptions are documented in Section 5.7.
Distributed-scale PtG could find niche applications for the production of high-value PtC/PtL products in the chemical and petrochemical industries, with potentially higher profitability than regional/national hydrogen/SNG uses. Considering their experience in hydrogen (by)production and complex processes, such industries could potentially act as seed for the future development of hydrogen-based economies. In oil/gas producing regions, which have initiated less aggressive energy transitions than others, renewable gas faces direct competition with either conventional or unconventional gas (i.e., shale, tight, coalbed methane), or sour/acid gas reserves that have now become exploitable. The possible timeline for transitioning from fossil fuel refining to synthetic fuel and petro(chemical) production in preparation for a post-oil age may vary widely among the fossil fuel producers, depending upon the nature of local fossil and renewable resources, economic market forces, energy/environmental policies, legislation, social acceptance and education. Understanding the competition between PtG products (i.e., hydrogen, SNG), and conventional/unconventional natural gas in terms of their driving forces may assist in forecasting and developing the PtG market.
Based on this review, there is also a lack of deployment scenarios for regions facing high space/process cooling demands, and/or high water desalination/treatment demands in association with water scarcity/quality issues. Both types of demands are anticipated to be exacerbated with climate change, suggesting power-to-cooling (a form of power-to-thermal) and power-to-water as potential application areas. Certain energy systems with significant cooling and water demands will also have concentrated solar power generation potential, a category of fluctuating renewable power hardly considered in previously projected PtG deployments. However, the provision cost of desalinated/treated water in water scarce regions could challenge PtG feasibility, unless water recycling is applied, and further developments enable seawater/brine electrolysis, which is currently at laboratory stage evaluation.
5.3. PtG Processes
5.3.1. Research Trends
Although alkaline electrolyzers are presently the most mature, reliable and cost-effective systems, polymer electrolyte membrane and solid oxide electrolysis, despite their technical and economic uncertainties, hold potential in terms of improved dynamic performance and efficiency, respectively. When reported, alkaline and/or polymer electrolyte membrane electrolysis were selected in almost all deployment scenarios, whereas solid oxide electrolysis was rarely considered. In industrial PtG implementations, alkaline electrolysis was more frequently reported than other electrolysis processes, potentially reflecting the industry’s preference towards mature and lower cost processes. When selected, high-temperature electrolysis was part of co-electrolysis-based PtL pathways, rather than solely PtG schemes, or part of hybrid thermochemical hydrogen production schemes. Solid oxide electrolysis cell efficiency, direct operability on biogas with no prior CO2 separation, and its potential to support the flexible synthesis of different PtL fuels by adjusting the hydrogen-to-carbon ratio of the co-electrolytic syngas product, were key reasons for selecting this technology.
Hybrid hydrogen production processes, such as conceptual integrations of electrolytic and thermochemical hydrogen production from a mix of renewable and nuclear electricity/heat sources, have been proposed in a few studies to date, with no accompanying energy scenario-based modeling.
Catalytic methanation offers heat integration options and higher capacities than biological processes, but the latter are advantageous in terms of efficiency, use of biogenic CO2 towards carbon neutrality, tolerance to impurities, and transient operation. When specified, chemical and biological methanation received comparable attention in regional/national power-to-SNG deployment studies, whereas distributed studies tend to focus on catalytic methanation, which may reflect the advancement of the technology and attractive energy integrations with industrial processes.
Rather than specifying PtG conversion processes, certain studies only report power-to-hydrogen efficiencies in the range of 62–80%, and methanation efficiencies of generally 80%, for deployment timelines up to 2050. Overall power-to-SNG conversion efficiencies of 49–65% were reported in regional/national-level deployments. Thus the majority of analyses have relied on assumed, constant first-law efficiencies that may not accurately reflect equipment load nor utilization factor, nor future technology performance. In addition, prescribed efficiencies were adopted rather than optimizing efficiency as part of the deployment analysis.
Bulk PtG product storage options, which are important to balance summer and winter demand at regional/national scale and mitigate potential geopolitical instabilities, are also not widely documented nor evaluated. When reported, above-ground tank hydrogen/SNG storage was the most frequently envisaged option, potentially due to the availability of mature tank technology and its provision of a comparison standard. Oxygen storage is rarely raised in PtG deployment scenarios. In regions such as Germany, UK, the Spanish peninsula and Ontario (Canada), PtG activity levels correlate with low-carbon electricity generation, underground storage capacity, and gas distribution infrastructure development.
5.3.2. Future Opportunities
Given the emphasis of projected PtG deployments on low-temperature electrolysis to date, future deployment studies involving solid oxide electrolysis and co-electrolysis could explore new heat/pressure integration opportunities with external processes, operation in both electrolysis and fuel cell mode, and a broader range of PtX products (e.g., PtC/PtL/PtH).
Hybrid hydrogen production processes could enable the flexible use of different power/heat sources, as well as PtG efficiency improvements, subject to further development in water splitting technologies (e.g., low/high-temperature electrolysis, co-electrolysis, thermochemical splitting). Thus extensions of PtG processes to integrated electrolytic and thermochemical hydrogen production, powered by a mix of renewable and nuclear electricity/heat sources, merit further evaluation at both process- and deployment level through energy scenario-based analyses.
More attention could be given to the evaluation of PtG product and by-product (i.e., oxygen) storage options (including type, sizing, spatial distribution, economics) in scenario-based deployment analyses. The suitability of a PtG product storage option (e.g., liquid/gas tanks, underground topology, hydrogen binding with other chemicals), depends upon the specific PtG product end-use (e.g., stationary versus mobile), safety and economics. Hydrogen mobility, low volumetric energy density and reactivity pose challenges for storage. Hydrogen liquefaction and liquid hydrogen storage/conversion are energy-intensive and may primarily serve space-constrained applications, such as mobile/portable. Salt caverns and depleted oil/gas fields are considered to be the most promising underground storage option, while uncertaintities exist regarding the suitability of aquifiers and porous rock formations, in terms of gas tightness and potential reactivity with the stored gas, requiring significant further investigation.
Finally, a more systematic documentation of PtG processes and operating/performance characteristics would enhance the interpretation and reproducibility of PtG deployment modeling results. Possible areas of improvements in PtG process modeling methodologies are suggested in Section 5.7.
5.4. PtG CO2 Sources
5.4.1. Research Trends
A variety of CO2 sourcing options for SNG production has been considered to date. These options include biogenic CO2, reflecting a low-carbon approach, as well as capture from fossil and SNG-fueled power plants, industrial processes and atmospheric air, and unspecified sources. In distributed-scale PtG deployments, CO2 was sourced from CHP and oxy-combustion boiler flue gases, kraft pulp mills, and other carbon-intensive industrial facilities. CO2 sourcing assumptions involve important practical (i.e., transportation and storage-related) and cost uncertainties. The synthesis of SNG and synthetic carbon-based PtL fuels, and their conversion to power, heat and other uses, are anticipated to require a future CO2 transmission network that could be as complex as the gas network.
5.4.2. Future Opportunities
Uncertainties in the technical and economic feasibility of CO2 transportation and storage, require further technological progress to be addressed. The design, operation and optimization analysis of future CO2 transmission networks, interacting with the power, gas, industrial and other sectors, could add value to PtG deployments.
5.5. PtG Energy/Material Integrations
5.5.1. Research Trends
Energy/material integration was only considered in a minority of regional/national deployment studies, in the form of PtG heat utilization for district/building heating or CO2 capture, and industrial oxygen use.
By contrast, the majority of distributed-scale PtG deployment schemes have been based on synergies between PtG and power/industrial facilities, and consequently have envisaged or incorporated a wider range of energy/material integration options, including:
- Use of low-temperature electrolysis heat losses for district/building heat supply
- Use of methanation heat for high-temperature electrolysis, CO2 capture, steam production, thermal power generation, district heating, waste water treatment, and industrial processes in general
- Utilization of electrolytic oxygen in oxy-combustion boilers and power plants, and industrial processes such as furnace heating and kraft pulp milling
- Use of deionized water from pulp mills, or condensed water from methanation products, for electrolysis
- CO2 capture from CHP plants, oxy-combustion boilers and power plants, kraft pulp mills, oil refining, and iron/steel manufacturing; CO2 utilization for methanation, enhanced oil recovery and other high-value CO2 sinks
5.5.2. Future Opportunities
Although many types of PtG energy/material integrations are possible, including those listed above, not all of them have been incorporated in PtG deployment modeling works, while others have only been applied in a limited number of deployment scenarios, despite their highlighted benefits. Examples of energy/material integration options that have collectively received limited or no attention in PtG deployment works include:
- Use of low-temperature electrolysis or methanation heat losses for district/building heat production (limited number of studies to date), district/building cooling/refrigeration, waste water treatment, desalination, and a wider range of industrial applications
- Thermal coupling of high-temperature electrolysis with catalytic methanation, which has been reported in detailed simulations of power-to-methane plants, and could be considered in future PtG deployment studies, particularly at distributed-scale:
- ○
- Heat recycling from catalytic methanation reaction products, feed compression trains, and condensed water to provide part of the electrolysis electricity demand in endothermal electrolysis mode, and/or part of the electrolysis feed hydrogen pre-heating duty
- ○
- In exothermal electrolysis mode, recycling of electrochemical reaction heat losses to supply part of the electrolyzer feed pre-heating duty
- Pressurized electrolysis operation to substitute part of the methanation feed compression work by less energy-consuming pressurization of the electrolyzer feed water
- CO2 capture from oil refining, iron/steel manufacturing, and cement production, for methanation
5.6. PtG Economics
5.6.1. Research Trends
Significant uncertainties exist in future PtG capital costs, while its operating costs strongly depend on the local electricity tariff, plant efficiency and utilization factor, and CO2 cost for power-to-SNG, and must be evaluated on a case-by-case basis. Although the majority of PtG implementation options investigated to date were not found to be profitable at the time of their evaluation, certain distributed-scale PtG schemes were found to approach or already achieve economic viability. Increasing renewable electricity generation shares are anticipated to generate stronger and more complex interactions between the power, gas and future CO2 networks, that will contribute to set electricity, PtG product, natural gas and CO2 prices.
5.6.2. Future Opportunities
PtG cost reduction efforts should primarily focus on electrolysis, followed by hydrogen storage, as well as heat/material recycling and careful assessments of PtG economic-environmental performance in specific deployment scenarios. Further exploration of the interactions between the power, gas and future CO2 networks, that will contribute to set electricity, PtG product, natural gas and CO2 prices, are suggested. Also, exploring the interactions between PtG hydrogen/SNG, and conventional, unconventional and sour natural gas may assist in planning and developing the PtG market.
5.7. PtG Modeling/Optimization Methodologies
5.7.1. Research Trends
Collectively, PtG optimizations have not investigated the full range of relevant PtG performance criteria. The majority of investigations have focused on economic criteria (e.g., levelized cost, levelized value, internal rate of return, paypack period), with a few investigations prioritizing practical feasibility. Several studies acknowledge that the economic analyses undertaken should be refined through incorporation of additional cost factors. However, significant uncertainties exist in cost parameters, associated with developing technologies and long analysis timelines (i.e., up to 2050). Environmental impact assessments have typically been confined to CO2 emissions, with limited holistic environmental impact minimizations. Almost any PtG deployment optimization has been single-objective, with additional goals handled as constraints in certain instances.
Due to a combination of modeling uncertainties, computational expenses and/or exploratory nature of the work, PtG deployment scenarios have relied on important assumptions and simplifications, including:
- PtG deployment in isolated power sectors or energy systems with restricted cross-sectorial interactions; regional energy (in)dependence
- Restricted range of competing flexibility options (e.g., alternative PtG product and/or by-product end-uses, alternative PtX options (e.g., PtH/PtL/PtC), alternative short/long-term storage options, demand-side management)
- Limited model spatial/temporal resolution
- Power, gas and CO2 network development and integration
- Reliance on developing technologies at large scale, such as for pure/blended hydrogen transportation and utilization, hydrogen mobility, hydrogen storage, heat storage, CO2 sourcing/transportation
- Constant PtG process efficiencies (i.e., load-independent, utilization factor-independent) and constant commodity prices, rather than handled as dependent or optimized variables
- PtG products’ and competing energy carriers’ demand growth rates
- PtG costs, competing fuel prices (e.g., fossil, biomass, nuclear), (excess) electricity prices, carbon prices, ancillary grid service revenues, influence of storage and government support on prices
5.7.2. Future Opportunities
The modeling simplifications/assumptions listed above suggest areas of modeling improvements. In addition, a broader range of relevant PtG performance criteria should be considered for PtG deployment optimization, including in multi-objective optimizations. Additional candidate optimization objectives not previously investigated and identified from this review include exergy- and exergoeconomic-based performance criteria, particularly for deployment schemes involving material/heat integrations, as well as full life cycle-, reliability-, operational safety- and risk-based metrics.
6. Concluding Remark
Despite the extensive body of PtG development and research efforts invested to date, substantial work remains in the area of PtG process development to improve system thermodynamic, environmental and economic performance, but also in the more systematic evaluation of PtG deployment scenarios, to incorporate improved modeling, assessment and optimization methodologies, applied to a broader range of deployment options. Future advances in PtG process efficiency, heat/material integration, operational flexibility, and reliability/durability, as well as cost reductions, will be crucial to enable successful PtG implementations and the wider adoption of this technology. These challenges are not unsurmountable, as suggested by the number of existing and planned demonstration projects that reflect confidence in the potential of PtG technology. The outcomes of such demonstration projects should greatly contribute to the on-going development, assessment and deployment of this technology to support more energy-independent, decarbonized and sustainable economies.
Author Contributions
V.E. proposed the topical area, reviewed the complete literature, wrote the entire manuscript, and sourced a substantial portion of the references. T.G. sourced the remainder of the references and initiated portions of the related write-up.
Funding
This research received no external funding.
Acknowledgments
The financial support of The Petroleum Institute LTR grant No. 14502 is gratefully acknowledged. The cost of open access publishing is covered by the first author.
Conflicts of Interest
The authors declare no conflict of interest.
Abbreviations
| AEL | alkaline electrolysis |
| ASU | air separation unit |
| CC | combined cycle |
| CCS | carbon capture and storage |
| CHP | combined heat and power |
| CNGV | compressed natural gas vehicle |
| CPV | concentrated solar photovoltaic |
| CSP | concentrated solar power |
| FCV | fuel cell vehicle |
| HHV | higher heating value |
| HT | high temperature |
| LHV | lower heating value |
| LT | low temperature |
| N/A | not applicable |
| NG | natural gas |
| N/R | not reported |
| PEM | polymer electrolyte membrane |
| PFC | primary fuel consumption |
| PtG | power to gas |
| PtH | power to heat |
| PtL | power to liquid fuel |
| PV | photovoltaic |
| RE | Renewable energy |
| SOE | solid oxide electrolysis |
| SNG | synthetic natural gas |
References
- U.S. Energy Information Administration (EIA). International Energy Outlook 2016; DOE/EIA-0484(2016); EIA: Washington, DC, USA, 2016; Volume 0484. Available online: www.eia.gov/forecasts/ieo/pdf/0484(2016).pdf (accessed on 15 May 2018).
- European Parliament. Directive 2009/28/EC of the European Parliament and of the Council of 23 April 2009. Off. J. Eur. Union 2009, 140, 16–62. [Google Scholar]
- European Commission. Proposal for a Directive of the European Parliament and of the Council on the Promotion of the Use of Energy from Renewable Sources (Recast). COM/2016/0767 Final/2—2016/0382 (COD). 23 February 2017. Available online: https://eur-lex.europa.eu/legal-content/EN/TXT/PDF/?uri=CELEX:52016PC0767R(01)&from=EN (accessed on 15 May 2018).
- European Commission. EU Reference Scenario 2016. Energy, Transport and GHG Emissions Trends to 2050. Main Results. Available online: https://ec.europa.eu/energy/sites/ener/files/documents/20160712_Summary_Ref_scenario_MAIN_RESULTS%20%282%29-web.pdf (accessed on 20 June 2018).
- Pleßmann, G.; Erdmann, M.; Hlusiak, M.; Breyer, C. Global energy storage demand for a 100% renewable electricity supply. Energy Procedia 2014, 46, 22–31. [Google Scholar] [CrossRef]
- Becker, S.; Frew, B.A.; Andresen, G.B.; Zeyer, T.; Schramm, S.; Greiner, M.; Jacobson, M.Z. Features of a fully renewable US electricity system: Optimized mixes of wind and solar PV and transmission grid extensions. Energy 2014, 72, 443–458. [Google Scholar] [CrossRef] [Green Version]
- Denholm, P.; Hand, M. Grid flexibility and storage required to achieve very high penetration of variable renewable electricity. Energy Policy 2011, 39, 1817–1830. [Google Scholar] [CrossRef]
- Lund, P.D.; Lindgren, J.; Mikkola, J.; Salpakari, J. Review of energy system flexibility measures to enable high levels of variable renewable electricity. Renew. Sustain. Energy Rev. 2015, 45, 785–807. [Google Scholar] [CrossRef] [Green Version]
- Baumann, C.; Schuster, R.; Moser, A. Economic potential of power-to-gas energy storages. In Proceedings of the 2013 10th International Conference on the European Energy Market (EEM), Stockholm, Sweden, 27–31 May 2013. [Google Scholar]
- Zakeri, B.; Syri, S. Electrical energy storage systems: A comparative life cycle cost analysis. Renew. Sustain. Energy Rev. 2015, 42, 569–596. [Google Scholar] [CrossRef]
- Aneke, M.; Wang, M. Energy storage technologies and real life applications—A state of the art review. Appl. Energy 2016, 179, 350–377. [Google Scholar] [CrossRef]
- Walker, S.B.; Mukherjee, U.; Fowler, M.; Elkamel, A. Benchmarking and selection of power-to-gas utilizing electrolytic hydrogen as an energy storage alternative. Int. J. Hydrogen Energy 2016, 41, 7717–7731. [Google Scholar] [CrossRef]
- Specht, M.; Baumgart, F.; Feigl, B.; Frick, V.; Stürmer, B.; Zuberbühler, U. Storing Bioenergy and Renewable Electricity in the Natural Gas Grid. Forschungs Verbund Erneuerbare Energien (FVEE) AEE Topics 2009. pp. 69–78. Available online: http://www.fvee.de/fileadmin/publikationen/Themenhefte/th2009-1/th2009-1_05_06.pdf (accessed on 15 May 2018).
- Martinez-Duart, J.M.; Hernandez-Moro, J.; Serrano-Calle, S.; Gomez-Calvet, R.; Casanova-Molina, M. New frontiers in sustainable energy production and storage. Vacuum 2015, 122, 369–375. [Google Scholar] [CrossRef]
- Schiebahn, S.; Grube, T.; Robinius, M.; Tietze, V.; Kumar, B.; Stolten, D. Power to gas: Technological overview, systems analysis and economic assessment for a case study in Germany. Int. J. Hydrogen Energy 2015, 40, 4285–4294. [Google Scholar] [CrossRef]
- German National Academy of Sciences Leopoldina, National Academy of Science and Engineering Acatech, Union of the German Academies of Sciences and Humanities. Flexibility Concepts for the German Power Supply in 2050. Ensuring Stability in the Age of Renewable Energies; Position Paper; Byfield, S., Vetter, D., Eds.; German National Academy of Sciences Leopoldina: Halle, Germany, 2016; Available online: http://www.acatech.de/de/publikationen/publikationssuche/detail/artikel/flexibility-concepts-for-the-german-power-supply-in-2050-ensuring-stability-in-the-age-of-renewable.html (accessed on 15 May 2018).
- Pearson, R.J.; Eisaman, M.D.; Turner, J.W.G.; Edwards, P.P.; Jiang, Z.; Kuznetsov, V.L.; Littau, K.A.; di Marco, L.; Taylor, G.S.R. Energy storage via carbon-neutral fuels made from CO2, Water, and Renewable Energy. Proc. IEEE 2012, 100, 440–460. [Google Scholar] [CrossRef]
- Sternberg, A.; Bardow, A. Power-to-what?—Environmental assessment of energy storage systems. Energy Environ. Sci. 2015, 8, 389–400. [Google Scholar] [CrossRef]
- Ausfelder, F.; Christian, B.; Martin, B.; Sigmar, B.; Angelika, H.; Renate, H.; Wolfram, K.; Falko, M.; Anja, M.; Marcell, P.; et al. Position Paper Energy Storage Systems—The Contribution of Chemistry. Chem. Ing. Tech. 2015. [Google Scholar] [CrossRef]
- Böttger, D.; Götz, M.; Lehr, N.; Kondziella, H.; Bruckner, T. Potential of the power-to-heat technology in district heating grids in Germany. Energy Procedia 2014, 46, 246–253. [Google Scholar] [CrossRef]
- Varone, A.; Ferrari, M. Power to liquid and power to gas: An option for the German Energiewende. Renew. Sustain. Energy Rev. 2015, 45, 207–218. [Google Scholar] [CrossRef] [Green Version]
- ENEA Consulting. The Potential of Power-to-Gas; ENEA Consulting; ENEA: Paris, France, 2016; Available online: https://www.enea-consulting.com/en/the-potential-of-power-to-gas/ (accessed on 15 May 2018).
- Ridjan, I.; Mathiesen, B.V.; Connolly, D. Terminology used for renewable liquid and gaseous fuels based on the conversion of electricity: A review. J. Clean. Prod. 2016, 112, 3709–3720. [Google Scholar] [CrossRef]
- Salpakari, J.; Mikkola, J.; Lund, P.D. Improved flexibility with large-scale variable renewable power in cities through optimal demand side management and power-to-heat conversion. Energy Convers. Manag. 2016, 126, 649–661. [Google Scholar] [CrossRef] [Green Version]
- Kouchachvili, L.; Entchev, E. Power to gas and H2/NG blend in SMART energy networks concept. Renew. Energy 2018, 125, 456–464. [Google Scholar] [CrossRef]
- Scamman, D.; Newborough, M. Using surplus nuclear power for hydrogen mobility and power-to-gas in France. Int. J. Hydrogen Energy 2016, 41, 10080–10089. [Google Scholar] [CrossRef]
- Reiter, G.; Lindorfer, J. Global warming potential of hydrogen and methane production from renewable electricity via power-to-gas technology. Int. J. Life Cycle Assess. 2015, 20, 477–489. [Google Scholar] [CrossRef]
- Lehner, M.; Tichler, R.; Steinmüller, H.; Koppe, M. Power-to-Gas: Technology and Business Models; Springer: Berlin, Germany, 2014; Volume 39, ISBN 978-3-319-03994-7. [Google Scholar]
- Götz, M.; Lefebvre, J.; Mörs, F.; McDaniel Koch, A.; Graf, F.; Bajohr, S.; Reimert, R.; Kolb, T. Renewable power-to-gas: A technological and economic review. Renew. Energy 2016, 85, 1371–1390. [Google Scholar] [CrossRef]
- Connolly, D.; Lund, H.; Mathiesen, B.V. Smart Energy Europe: The technical and economic impact of one potential 100% renewable energy scenario for the European Union. Renew. Sustain. Energy Rev. 2016, 60, 1634–1653. [Google Scholar] [CrossRef]
- Buttler, A.; Spliethoff, H. Current status of water electrolysis for energy storage, grid balancing and sector coupling via power-to-gas and power-to-liquids: A review. Renew. Sustain. Energy Rev. 2018, 82, 2440–2454. [Google Scholar] [CrossRef]
- Bensmann, B.; Hanke-Rauschenbach, R.; Müller-Syring, G.; Henel, M.; Sundmacher, K. Optimal configuration and pressure levels of electrolyzer plants in context of power-to-gas applications. Appl. Energy 2016, 167, 107–124. [Google Scholar] [CrossRef]
- Rönsch, S.; Schneider, J.; Matthischke, S.; Schlüter, M.; Götz, M.; Lefebvre, J.; Prabhakaran, P.; Bajohr, S. Review on methanation—From fundamentals to current projects. Fuel 2016, 166, 276–296. [Google Scholar] [CrossRef]
- Ghaib, K.; Ben-Fares, F.Z. Power-to-Methane: A state-of-the-art review. Renew. Sustain. Energy Rev. 2018, 81, 433–446. [Google Scholar] [CrossRef]
- Gahleitner, G. Hydrogen from renewable electricity: An international review of power-to-gas pilot plants for stationary applications. Int. J. Hydrogen Energy 2013, 38, 2039–2061. [Google Scholar] [CrossRef]
- Bailera, M.; Lisbona, P.; Romeo, L.M.; Espatolero, S. Power to Gas projects review: Lab, pilot and demo plants for storing renewable energy and CO2. Renew. Sustain. Energy Rev. 2017, 69, 292–312. [Google Scholar] [CrossRef]
- Maroufmashat, A.; Fowler, M. Transition of Future Energy System Infrastructure; through Power-to-Gas Pathways. Energies 2017, 10, 1089. [Google Scholar] [CrossRef]
- Blanco, H.; Faaij, A. A review at the role of storage in energy systems with a focus on Power to Gas and long-term storage. Renew. Sustain. Energy Rev. 2018, 81, 1049–1086. [Google Scholar] [CrossRef]
- Smolinka, T.; Günther, M.; Garche, J.; Fraunhofer, I.S.E. NOW-Studie “Stand und Entwicklungspotenzial der Wasserelektrolyse zur Herstellung von Wasserstoff aus Regenerativen Energien”. 2011. Available online: http://www.hs-ansbach.de/uploads/tx_nxlinks/NOW-Studie-Wasserelektrolyse-2011.pdf (accessed on 15 May 2018).
- Grond, L.; Schulze, P.; Holstein, J. Systems Analyses Power to Gas: A Technology Review; DNV KEMA Energy & Sustainability; KEMA: Groningen, The Netherlands, 2013. [Google Scholar]
- Persson, T.; Murphy, J.; Liebetrau, J.; Trommler, M.; Toyama, J. A Perspective on the Potential Role of Biogas in Smart Energy Grids; International Energy Agency (EIA) Bioenergy; EIA: Washington, DC, USA, 2014; p. 28. ISBN 978-1-910154-13-7. [Google Scholar]
- Sterner, M. Bioenergy and Renewable Power Methane in Integrated 100% Renewable Energy Systems. Limiting Global Warming by Transforming Energy Systems; University of Kassel: Kassel, Germany, 2009; ISBN 978-3-89958-798-2. [Google Scholar]
- Barton, J.; Gammon, R. The production of hydrogen fuel from renewable sources and its role in grid operations. J. Power Sources 2010, 195, 8222–8235. [Google Scholar] [CrossRef]
- Jacobson, M.Z.; Delucchi, M.A. Providing all global energy with wind, water, and solar power, Part I: Technologies, energy resources, quantities and areas of infrastructure, and materials. Energy Policy 2011, 39, 1154–1169. [Google Scholar] [CrossRef]
- Delucchi, M.A.; Jacobson, M.Z. Providing all global energy with wind, water, and solar power, Part II: Reliability, system and transmission costs, and policies. Energy Policy 2011, 39, 1170–1190. [Google Scholar] [CrossRef]
- Jacobson, M.Z.; Howarth, R.W.; Delucchi, M.A.; Scobie, S.R.; Barth, J.M.; Dvorak, M.J.; Klevze, M.; Katkhuda, H.; Miranda, B.; Chowdhury, N.A.; et al. Examining the feasibility of converting New York State’s all-purpose energy infrastructure to one using wind, water and sunlight. Energy Policy 2013, 57, 585–601. [Google Scholar] [CrossRef]
- Jacobson, M.Z.; Delucchi, M.A.; Ingraffea, A.R.; Howarth, R.W.; Bazouin, G.; Bridgeland, B.; Burkart, K.; Chang, M.; Chowdhury, D.; Cook, R.; et al. A roadmap for repowering California for all purposes with wind, water, and sunlight. Energy 2014, 73, 875–889. [Google Scholar] [CrossRef]
- Jacobson, M.Z.; Delucchi, M.A.; Cameron, M.A.; Frew, B.A. Low-cost solution to the grid reliability problem with 100% penetration of intermittent wind, water, and solar for all purposes. Proc. Natl. Acad. Sci. USA 2015, 112, 1560–1565. [Google Scholar] [CrossRef] [PubMed]
- Jacobson, M.Z.; Delucchi, M.A.; Bazouin, G.; Dvorak, M.J.; Arghandeh, R.; Bauer, Z.A.F.; Cotte, A.; de Moor, G.M.T.H.; Goldner, E.G.; Heier, C.; et al. A 100% wind, water, sunlight (WWS) all-sector energy plan for Washington State. Energy 2016, 86, 85–88. [Google Scholar] [CrossRef]
- Jacobson, M.Z.; Delucchi, M.A.; Bauer, Z.A.F.; Goodman, S.C.; Chapman, W.E.; Cameron, M.A.; Bozonnat, C.; Chobadi, L.; Clonts, H.A.; Enevoldsen, P.; et al. 100% Clean and Renewable Wind, Water, and Sunlight All-Sector Energy Roadmaps for 139 Countries of the World. Joule 2017, 1, 108–121. [Google Scholar] [CrossRef]
- Jacobson, M.Z.; Delucchi, M.A.; Cameron, M.A.; Mathiesen, B.V. Matching demand with supply at low cost in 139 countries among 20 world regions with 100% intermittent wind, water, and sunlight (WWS) for all purposes. Renew. Energy 2018, 123, 236–248. [Google Scholar] [CrossRef]
- Gutiérrez-Martín, F.; Guerrero-Hernández, I. Balancing the grid loads by large scale integration of hydrogen technologies: The case of the Spanish power system. Int. J. Hydrogen Energy 2012, 37, 1151–1161. [Google Scholar] [CrossRef]
- Steinke, F.; Wolfrum, P.; Hoffmann, C. Grid vs. storage in a 100% renewable Europe. Renew. Energy 2013, 50, 826–832. [Google Scholar] [CrossRef]
- Jentsch, M.; Trost, T.; Sterner, M. Optimal use of Power-to-Gas energy storage systems in an 85% renewable energy scenario. Energy Procedia 2014, 46, 254–261. [Google Scholar] [CrossRef]
- Moskalenko, N.; Lombardi, P.; Komarnicki, P. Multi-criteria optimization for determining installation locations for the power-to-gas technologies. In Proceedings of the IEEE Power and Energy Society (PES) General Meeting, National Harbor, MD, USA, 27–31 July 2014; ISBN 978-1-4799-6415-4/14. [Google Scholar]
- Ridjan, I.; Mathiesen, B.V.; Connolly, D. Synthetic fuel production costs by means of solid oxide electrolysis cells. Energy 2014, 76, 104–113. [Google Scholar] [CrossRef]
- Kötter, E.; Schneider, L.; Sehnke, F.; Ohnmeiss, K.; Schröer, R. Sensitivities of power-to-gas within an optimised energy system. Energy Procedia 2015, 73, 190–199. [Google Scholar] [CrossRef]
- Gutierrez-Martin, F.; Ochoa-Mendoza, A.; Rodriguez-Anton, L.M. Pre-investigation of water electrolysis for flexible energy storage at large scales: The case of the Spanish power system. Int. J. Hydrogen Energy 2015, 40, 5544–5551. [Google Scholar] [CrossRef] [Green Version]
- Clegg, S.; Mancarella, P. Integrated modeling and assessment of the operational impact of power-to-gas (P2G) on electrical and gas transmission networks. IEEE Trans. Sustain. Energy 2015, 6, 1234–1244. [Google Scholar] [CrossRef]
- Qadrdan, M.; Abeysekera, M.; Chaudry, M.; Wu, J.; Jenkins, N. Role of power-to-gas in an integrated gas and electricity system in Great Britain. Int. J. Hydrogen Energy 2015, 40, 5763–5775. [Google Scholar] [CrossRef]
- Ahern, E.P.; Deane, P.; Persson, T.; Gallachóir, B.Ó.; Murphy, J.D. A perspective on the potential role of renewable gas in a smart energy island system. Renew. Energy 2015, 78, 648–656. [Google Scholar] [CrossRef]
- Vandewalle, J.; Bruninx, K.; D’haeseleer, W. Effects of large-scale power to gas conversion on the power, gas and carbon sectors and their interactions. Energy Convers. Manag. 2015, 94, 28–39. [Google Scholar] [CrossRef] [Green Version]
- Mukherjee, U.; Elsholkami, M.; Walker, S.; Fowler, M.; Elkamel, A.; Hajimiragha, A. Optimal sizing of an electrolytic hydrogen production system using an existing natural gas infrastructure. Int. J. Hydrogen Energy 2015, 40, 9760–9772. [Google Scholar] [CrossRef]
- Estermann, T.; Newborough, M.; Sterner, M. Power-to-gas systems for absorbing excess solar power in electricity distribution networks. Int. J. Hydrogen Energy 2016, 41, 13950–13959. [Google Scholar] [CrossRef]
- Gutierrez-Martin, F.; Rodriguez-Anton, L.M. Power-to-SNG technology for energy storage at large scales. Int. J. Hydrogen Energy 2016, 41, 19290–19303. [Google Scholar] [CrossRef]
- Parra, D.; Patel, M.K. Techno-economic implications of the electrolyser technology and size for power-to-gas systems. Int. J. Hydrogen Energy 2016, 41, 3748–3761. [Google Scholar] [CrossRef]
- Nastasi, B.; Lo Basso, G. Hydrogen to link heat and electricity in the transition towards future Smart Energy Systems. Energy 2016, 110, 5–22. [Google Scholar] [CrossRef]
- Child, M.; Breyer, C. Vision and initial feasibility analysis of a recarbonised Finnish energy system for 2050. Renew. Sustain. Energy Rev. 2016, 66, 517–536. [Google Scholar] [CrossRef]
- Zoss, T.; Karklina, I.; Blumberga, D. Power to gas and pumped hydro storage potential in Latvia. Energy Procedia 2016, 95, 528–535. [Google Scholar] [CrossRef]
- Meylan, F.D.; Moreau, V.; Erkman, S. Material constraints related to storage of future European renewable electricity surpluses with CO2 methanation. Energy Policy 2016, 94, 366–376. [Google Scholar] [CrossRef]
- Mukherjee, U.; Walker, S.B.; Fowler, M.; Elkamel, A. Power-to-gas in a demand response market. Int. J. Environ. Stud. 2016, 73, 390–401. [Google Scholar] [CrossRef]
- Walker, S.B.; van Lanen, D.; Fowler, M.; Mukherjee, U. Economic analysis with respect to Power-to-Gas energy storage with consideration of various market mechanisms. Int. J. Hydrogen Energy 2016, 41, 7754–7765. [Google Scholar] [CrossRef]
- Robinius, M.; Otto, A.; Syranidis, K.; Ryberg, D.S.; Heuser, P.; Welder, L.; Grube, T.; Markewitz, P.; Tietze, V.; Stolten, D. Linking the power and transport sectors—Part 2: Modelling a sector coupling scenario for Germany. Energies 2017, 10, 957. [Google Scholar] [CrossRef]
- Grueger, F.; Möhrke, F.; Robinius, M.; Stolten, D. Early power to gas applications: Reducing wind farm forecast errors and providing secondary control reserve. Appl. Energy 2017, 192, 551–562. [Google Scholar] [CrossRef]
- Hou, P.; Enevoldsen, P.; Eichman, J.; Hu, W.; Jacobson, M.Z.; Chen, Z. Optimizing investments in coupled offshore wind–electrolytic hydrogen storage systems in Denmark. J. Power Sources 2017, 359, 186–197. [Google Scholar] [CrossRef]
- Zeng, Q.; Zhang, B.; Fang, J.; Chen, Z. A bi-level programming for multistage co-expansion planning of the integrated gas and electricity system. Appl. Energy 2017, 200, 192–203. [Google Scholar] [CrossRef]
- Qadrdan, M.; Ameli, H.; Strbac, G.; Jenkins, N. Efficacy of options to address balancing challenges: Integrated gas and electricity perspectives. Appl. Energy 2017, 190, 181–190. [Google Scholar] [CrossRef]
- Ameli, H.; Qadrdan, M.; Strbac, G. Techno-economic assessment of battery storage and Power-to-Gas: A whole-system approach. Energy Procedia 2017, 142, 841–848. [Google Scholar] [CrossRef]
- Vo, T.T.Q.; Xia, A.; Wall, D.M.; Murphy, J.D. Use of surplus wind electricity in Ireland to produce compressed renewable gaseous transport fuel through biological power to gas systems. Renew. Energy 2016, 105, 495–504. [Google Scholar] [CrossRef]
- Parra, D.; Zhang, X.; Bauer, C.; Patel, M.K. An integrated techno-economic and life cycle environmental assessment of power-to-gas systems. Appl. Energy 2017, 193, 440–454. [Google Scholar] [CrossRef]
- Mesfun, S.; Sanchez, D.L.; Leduc, S.; Wetterlund, E.; Lundgren, J.; Biberacher, M.; Kraxner, F. Power-to-gas and power-to-liquid for managing renewable electricity intermittency in the Alpine Region. Renew. Energy 2017, 107, 361–372. [Google Scholar] [CrossRef]
- Guandalini, G.; Robinius, M.; Grube, T.; Campanari, S.; Stolten, D. Long-term power-to-gas potential from wind and solar power: A country analysis for Italy. Int. J. Hydrogen Energy 2017, 42, 13389–13406. [Google Scholar] [CrossRef] [Green Version]
- Belderbos, A.; Virag, A.; D’haeseleer, W.; Delarue, E. Considerations on the need for electricity storage requirements: Power versus energy. Energy Convers. Manag. 2017, 143, 137–149. [Google Scholar] [CrossRef]
- Mukherjee, U.; Walker, S.; Maroufmashat, A.; Fowler, M.; Elkamel, A. Development of a pricing mechanism for valuing ancillary, transportation and environmental services offered by a power to gas energy system. Energy 2017, 128, 447–462. [Google Scholar] [CrossRef]
- Laslett, D.; Carter, C.; Creagh, C.; Jennings, P. A large-scale renewable electricity supply system by 2030: Solar, wind, energy efficiency, storage and inertia for the South West Interconnected System (SWIS) in Western Australia. Renew. Energy 2017, 113, 713–731. [Google Scholar] [CrossRef]
- Gulagi, A.; Bogdanov, D.; Fasihi, M.; Breyer, C. Can Australia Power the Energy-Hungry Asia with Renewable Energy? Sustainability 2017, 9, 233. [Google Scholar] [CrossRef]
- McKenna, R.C.; Bchini, Q.; Weinand, J.M.; Michaelis, J.; König, S.; Köppel, W.; Fichtner, W. The future role of Power-to-Gas in the energy transition: Regional and local techno-economic analyses in Baden-Württemberg. Appl. Energy 2018, 212, 386–400. [Google Scholar] [CrossRef]
- Bailera, M.; Lisbona, P. Energy storage in Spain: Forecasting electricity excess and assessment of power-to-gas potential up to 2050. Energy 2018, 143, 900–910. [Google Scholar] [CrossRef]
- Kar, S.K. Renewable Power to Gas in India: How far from reality? Energyworld. Economics Times. 19 April 2017. Available online: https://energy.economictimes.indiatimes.com/energy-speak/renewable-power-to-gas-in-india-how-far-from-reality/2293 (accessed on 15 May 2018).
- The Institute of Energy Economics (IEE), Japan. Is Power to Gas Feasible in Japan? IEEJ 2016. Available online: https://eneken.ieej.or.jp/data/6549.pdf (accessed on 15 May 2018).
- United Nations. Department of Economic and Social Affairs. Sustainable Development Knowledge Platform. 2010. Available online: https://sustainabledevelopment.un.org/index.php?page=view&type=99&nr=24&menu=1449 (accessed on 15 May 2018).
- International Renewable Energy Agency (IRENA). Renewable Energy Prospects: Germany. November 2015. Available online: http://www.irena.org/DocumentDownloads/Publications/IRENA_REmap_Germany_report_2015.pdf (accessed on 15 May 2018).
- European Commission. Eurostat Statistics Explained. Table 3—Share of Electricity from Renewable Sources in Gross Electricity Consumption_2004–2016. Available online: http://ec.europa.eu/eurostat/statistics-explained/images/d/de/Table_3-Share_of_electricity_from_renewable_sources_in_gross_electricity_consumption_2004-2016.png (accessed on 20 June 2018).
- European Environment Agency (EEA). Renewable Energy in Europe 2017. Recent Growth and Knock-on Effects. EEA Report No 23/2017. Available online: https://www.eea.europa.eu/publications/renewable-energy-in-Europe (accessed on 20 June 2018).
- Monitor Deloitte. A sustainable energy model for Spain in 2050. Policy Recommendations for the Energy Transition. May 2016. Available online: https://www2.deloitte.com/content/dam/Deloitte/es/Documents/estrategia/Deloitte_ES_Estrategia_Modelo-Energetico-Informe-Ingles.pdf (accessed on 15 May 2018).
- Heinisch, V.; Tuan, L.A. Effects of power-to-gas on power systems: A case study of Denmark. In Proceedings of the 2015 IEEE PowerTech Conference, Eindhoven, The Netherlands, 2 June–2 July 2015. [Google Scholar] [CrossRef]
- Ridjan, I.; Mathiesen, B.V.; Connolly, D. The feasibility of synthetic fuels in renewable energy systems. Energy 2013, 57, 76–84. [Google Scholar] [CrossRef] [Green Version]
- Kannan, R.; Turton, H. Long term climate change mitigation goals under the nuclear phase out policy: The Swiss energy system transition. Energy Econ. 2016, 55, 211–222. [Google Scholar] [CrossRef]
- Lo Basso, G.; Nastasi, B.; Garcia, D.A.; Cumo, F. How to handle the Hydrogen enriched Natural Gas blends in combustion efficiency measurement procedure of conventional and condensing boilers. Energy 2017, 123, 615–636. [Google Scholar] [CrossRef]
- International Energy Agency. National Renewable Energy Action Plan (NREAP). Available online: https://www.iea.org/policiesandmeasures/pams/belgium/name-39458-en.php (accessed on 20 June 2018).
- Danish Energy Agency. Energy and Climate Policies Beyond 2020 in Europe—Overall and Selected Countries. October 2015. Available online: https://ens.dk/sites/ens.dk/files/Globalcooperation/eu_energy_and_climate_policy_overview.pdf (accessed on 15 May 2018).
- McKinsey, KEMA, The Energy Futures Lab at Imperial College London, Oxford Economics, European Climate Foundation. Roadmap 2050: A Practical Guide to a Prosperous, Low-Carbon Europe: Technical Analysis. 2010, Volume I. Available online: http://www.roadmap2050.eu/ (accessed on 15 May 2018).
- Heide, D.; von Bremen, L.; Greiner, M.; Hoffmann, C.; Speckmann, M.; Bofinger, S. Seasonal optimal mix of wind and solar power in a future, highly renewable Europe. Renew. Energy 2010, 35, 2483–2489. [Google Scholar] [CrossRef]
- Canadian Electricity Association. Vision 2050. The Future of Canada’s Electricity System. 2014. Available online: https://electricity.ca/wp-content/uploads/2014/03/Vision2050.pdf (accessed on 15 May 2018).
- Canadian Council on Renewable Electricity. Canada’s Advantage: A Vision for Renewable Electricity in Canada. November 2016. Available online: http://renewableelectricity.ca/wp-content/uploads/2016/12/CAN_16_VisionReport.pdf (accessed on 15 May 2018).
- International Renewable Energy Agency (IRENA). IRENA’s Renewable Energy Roadmap—Renewable Energy Policy Targets for REmap Countries. 2016. Available online: http://www.irena.org/-/media/Files/IRENA/REmap/Methodology/RE-Targets_Summary-REmap_14mar2016.pdf?la=en&hash=0F4822283142D71E6E2F429CB9EF998C14A05CFF (accessed on 15 May 2018).
- Canadian Council on Renewable Electricity. Recommendations for a Pan-Canadian Framework for Clean Growth and Climate Change 14 June 2016. Available online: http://canwea.ca/wp-content/uploads/2017/03/canadasrenewableelectricityadvantage-submissionJune2016.pdf (accessed on 15 May 2018).
- US Energy Information Administration (EIA). US Energy Consumption by Source and Sector. 2017. Available online: https://www.eia.gov/energyexplained/index.php?page=us_energy_home (accessed on 20 June 2018).
- National Renewable Energy Laboratory. Renewable Electricity Futures Study. Executive Summary. 2012. Available online: https://www.nrel.gov/docs/fy13osti/52409-ES.pdf (accessed on 20 June 2018).[Green Version]
- Cole, W.; Mai, T.; Logan, J.; Steinberg, D.; McCall, J.; Richards, J.; Sigrin, B.; Porro, G. 2016 Standard Scenarios Report: A, U.S. Electricity Sector Outlook. National Renewable Energy Laboratory. Available online: https://www.nrel.gov/docs/fy17osti/66939.pdf (accessed on 20 June 2018).
- Cole, W.; Mai, T.; Richards, J.; Das, P.; Donohoo-Vallett, P. 2017 Standard Scenarios Report: A, U.S. Electricity Sector Outlook. NREL/TP-6A20-68548; 17 October 2017. Available online: https://www.nrel.gov/docs/fy18osti/70328.pdf (accessed on 20 June 2018).
- US Energy Information Administration (EIA). Annual Energy Outlook 2018 with projections to 2050. 6 February 2018. Available online: https://www.eia.gov/outlooks/aeo/ (accessed on 20 June 2018).
- International Renewable Energy Agency (IRENA). Global Energy Transformation. A Roadmap to 2050. 2018. Available online: https://www.irena.org/-/media/Files/IRENA/Agency/Publication/2018/Apr/IRENA_Report_GET_2018.pdf (accessed on 20 June 2018).
- Washington Department of Commerce, Energy Office. 2017 Biennial Energy Report and State Energy Strategy Update. December 2016. Available online: http://www.commerce.wa.gov/wp-content/uploads/2017/03/Commerce-Biennial-Energy-Report-2017.pdf (accessed on 20 June 2018).
- Washington State Department of Ecology, Washington Greenhouse Gas Emission Reduction Limits. Report Prepared under RCW 70.235.040. December 2016; Publication No. 16-01-010. Available online: https://fortress.wa.gov/ecy/publications/documents/1601010.pdf (accessed on 14 June 2018).
- Gilbraith, N.; Jaramillo, P.; Tong, F.; Faria, F. Comments on Jacobson et al.’s proposal for a wind, water, and solar energy future for New York State. Energy Policy 2013, 60, 68–69. [Google Scholar] [CrossRef]
- Jacobson, M.Z.; Howarth, R.W.; Delucchi, M.A.; Scobie, S.R.; Barth, J.M.; Dvorak, M.J.; Klevze, M.; Katkhuda, H.; Miranda, B.; Chowdury, N.A.; et al. Response to comment on paper examining the feasibility of changing New York state’s energy infrastructure to one derived from wind, water, and sunlight. Energy Policy 2013, 62, 1212–1215. [Google Scholar] [CrossRef]
- Blakers, B.; Lu, B.; Stocks, M. 100% renewable electricity in Australia. Energy 2017, 133, 471–482. [Google Scholar] [CrossRef]
- Australian Government. Australian Renewable Energy Agency. Power to Gas Trial to Inject Hydrogen into Australia’s Gas Grid. Available online: https://arena.gov.au/news/power-gas-trialto-inject-hydrogen-australias-gas-grid/ (accessed on 15 May 2018).
- Buchholz, O.S.; van der Ham, A.G.J.; Veneman, R.; Brilman, D.W.F.; Kersten, S.R.A. Power-to-gas: Storing surplus electrical energy. A design study. Energy Procedia 2014, 63, 7993–8009. [Google Scholar] [CrossRef]
- Breyer, C.; Tsupari, E.; Tikka, V.; Vainikka, P. Power-to-Gas as an emerging profitable business through creating an integrated value chain. Energy Procedia 2015, 73, 182–189. [Google Scholar] [CrossRef]
- Bailera, M.; Lisbona, P.; Romeo, L.M. Power to gas-oxyfuel boiler hybrid systems. Int. J. Hydrog. Energy 2015, 40, 10168–10175. [Google Scholar] [CrossRef]
- Tsupari, E.; Kärki, J.; Vakkilainen, E. Economic feasibility of power-to-gas integrated with biomass fired CHP plant. J. Energy Storage 2016, 5, 62–69. [Google Scholar] [CrossRef]
- Kärki, J.; Tsupari, E.V.; Vakkilainen, E. The most promising business cases for P2X deployment in renewable energy systems. In Proceedings of the 10th International Renewable Energy Storage Conference (IRES 2016), Düsseldorf, Germany, 15–17 March 2016. [Google Scholar]
- Bailera, M.; Lisbona, P.; Romeo, L.M.; Espatolero, S. Power to Gas-biomass oxycombustion hybrid system: Energy integration and potential applications. Appl. Energy 2016, 167, 221–229. [Google Scholar] [CrossRef]
- Bailera, M.; Kezibri, N.; Romeo, L.M.; Espatolero, S.; Bouallou, L.M.; Lisbona, P. Future applications of hydrogen production and CO2 utilization for energy storage: Hybrid Power to Gas-Oxycombustion power plants. Int. J. Hydrogen Energy 2017, 42, 13625–13632. [Google Scholar] [CrossRef]
- Bailera, M.; Espatolero, S.; Lisbona, P.; Romeo, L.M. Power to gas-electrochemical industry hybrid systems: A case study. Appl. Energy 2017, 202, 435–446. [Google Scholar] [CrossRef]
- Kuparinen, K.; Vakkilainen, E. Green Pulp Mill: Renewable Alternatives to Fossil Fuels in Lime Kiln Operations. BioResources 2017, 4031–4048. [Google Scholar] [CrossRef]
- Al-Subaie, A.; Maroufmashat, A.; Elkamel, A.; Fowler, M. Presenting the implementation of power-to-gas to an oil refinery as a way to reduce carbon intensity of petroleum fuels. Int. J. Hydrogen Energy 2017, 42, 19376–19388. [Google Scholar] [CrossRef]
- De Santoli, L.; Lo Basso, G.; Nastasi, B. The Potential of Hydrogen Enriched Natural Gas deriving from Power-to-Gas option in Building Energy Retrofitting. Energy Build. 2017, 149, 424–436. [Google Scholar] [CrossRef]
- Nastasi, B.; Lo Basso, G. Power-to-Gas integration in the Transition towards Future Urban Energy Systems. Int. J. Hydrogen Energy 2017, 42, 23933–23951. [Google Scholar] [CrossRef]
- Carroquino, J.; Roda, V.; Mustata, R.; Yago, J.; Valino, L.; Lozano, A.; Barreras, F. Combined production of electricity and hydrogen from solar energy and its use in the wine sector. Renew. Energy 2018, 122, 251–263. [Google Scholar] [CrossRef]
- Kopyscinski, J.; Schildhauer, T.J.; Biollaz, S.M.A. Production of synthetic natural gas (SNG) from coal and dry biomass—A technology review from 1950 to 2009. Fuel 2010, 89, 1763–1783. [Google Scholar] [CrossRef]
- Market Watch. Available online: https://www.marketwatch.com/investing/future/clk8/charts (accessed on 15 May 2018).
- The European Power to Gas Platform. Power-to-Gas (Demonstration) Projects in Europe. 2017. Available online: http://www.europeanpowertogas.com/demonstrations (accessed on 15 May 2018).
- Audi Media Center. Audi Balanced Mobility. Available online: https://www.audi-mediacenter.com/en/clean-safe-and-connected-audi-at-michelin-challenge-bibendum-in-berlin-2744/audi-balanced-mobility-2782 (accessed on 15 May 2018).
- FCH Europa. Hydrogen Meeting Future Needs of Low Carbon Manufacturing Value Chains. Available online: http://www.voestalpine.com/group/en/media/press-releases/2017-02-07-voestalpine-siemens-and-verbund-are-building-a-pilot-facility-for-green-hydrogen-at-the-linz-location/ (accessed on 15 May 2018).
- Forsberg, C.W. Economic implications of peak vs. base-load electric costs on nuclear hydrogen systems. In Proceedings of the American Institute of Chemical Engineers Fall Meeting, San Francisco, CA, USA, 13–18 November 2006. [Google Scholar]
- Naterer, G.F.; Fowler, M.; Cotton, J.; Gabriel, K. Synergistic roles of off-peak electrolysis and thermochemical production of hydrogen from nuclear energy in Canada. Int. J. Hydrogen Energy 2008, 33, 6849–6857. [Google Scholar] [CrossRef]
- O’Brien, J.E. Large scale hydrogen production from nuclear energy using high temperature electrolysis. In Proceedings of the 14th International Heat Transfer Conference, Washington, DC, USA, 8–13 August 2010; pp. 1–22. [Google Scholar]
- Orhan, M.F.; Dincer, I.; Rosen, M.A.; Kanoglu, M. Integrated hydrogen production options based on renewable and nuclear energy sources. Renew. Sustain. Energy Rev. 2012, 16, 6059–6082. [Google Scholar] [CrossRef]
- Orhan, M.F.; Kahraman, H.; Babu, B.S. Approaches for integrated hydrogen production based on nuclear and renewable energy sources: Energy and exergy assessments of nuclear and solar energy sources in the United Arab Emirates. Int. J. Hydrogen Energy 2017, 42, 2016–2616. [Google Scholar] [CrossRef]
Figure 1.
Schematic diagram of PtX conversion routes. DME = dimethyl ether. MeOH = methanol.

Figure 2.
Schematic diagram of PtG conversion routes, product end-uses, and integration options with electricity/gas infrastructures and other sectors. CC = combined cycle, CCS = carbon capture and storage, CHP = combined heat and power, CNGV = compressed natural gas vehicle, FCV = fuel cell vehicle, HT = high temperature, LT = low temperature, NG = natural gas.

Figure 3.
Geographical overview of regional/national-scale, distributed-scale, and nuclear-assisted PtG deployments compiled in Tables 1–3. The values in parentheses (X, Y, Z) indicate the number of regional/national, distributed and nuclear-assisted published PtG deployment studies, respectively, for a given geographical region.

Figure 4.
Conceptual hybrid renewable and nuclear power-based hydrogen and SNG production.


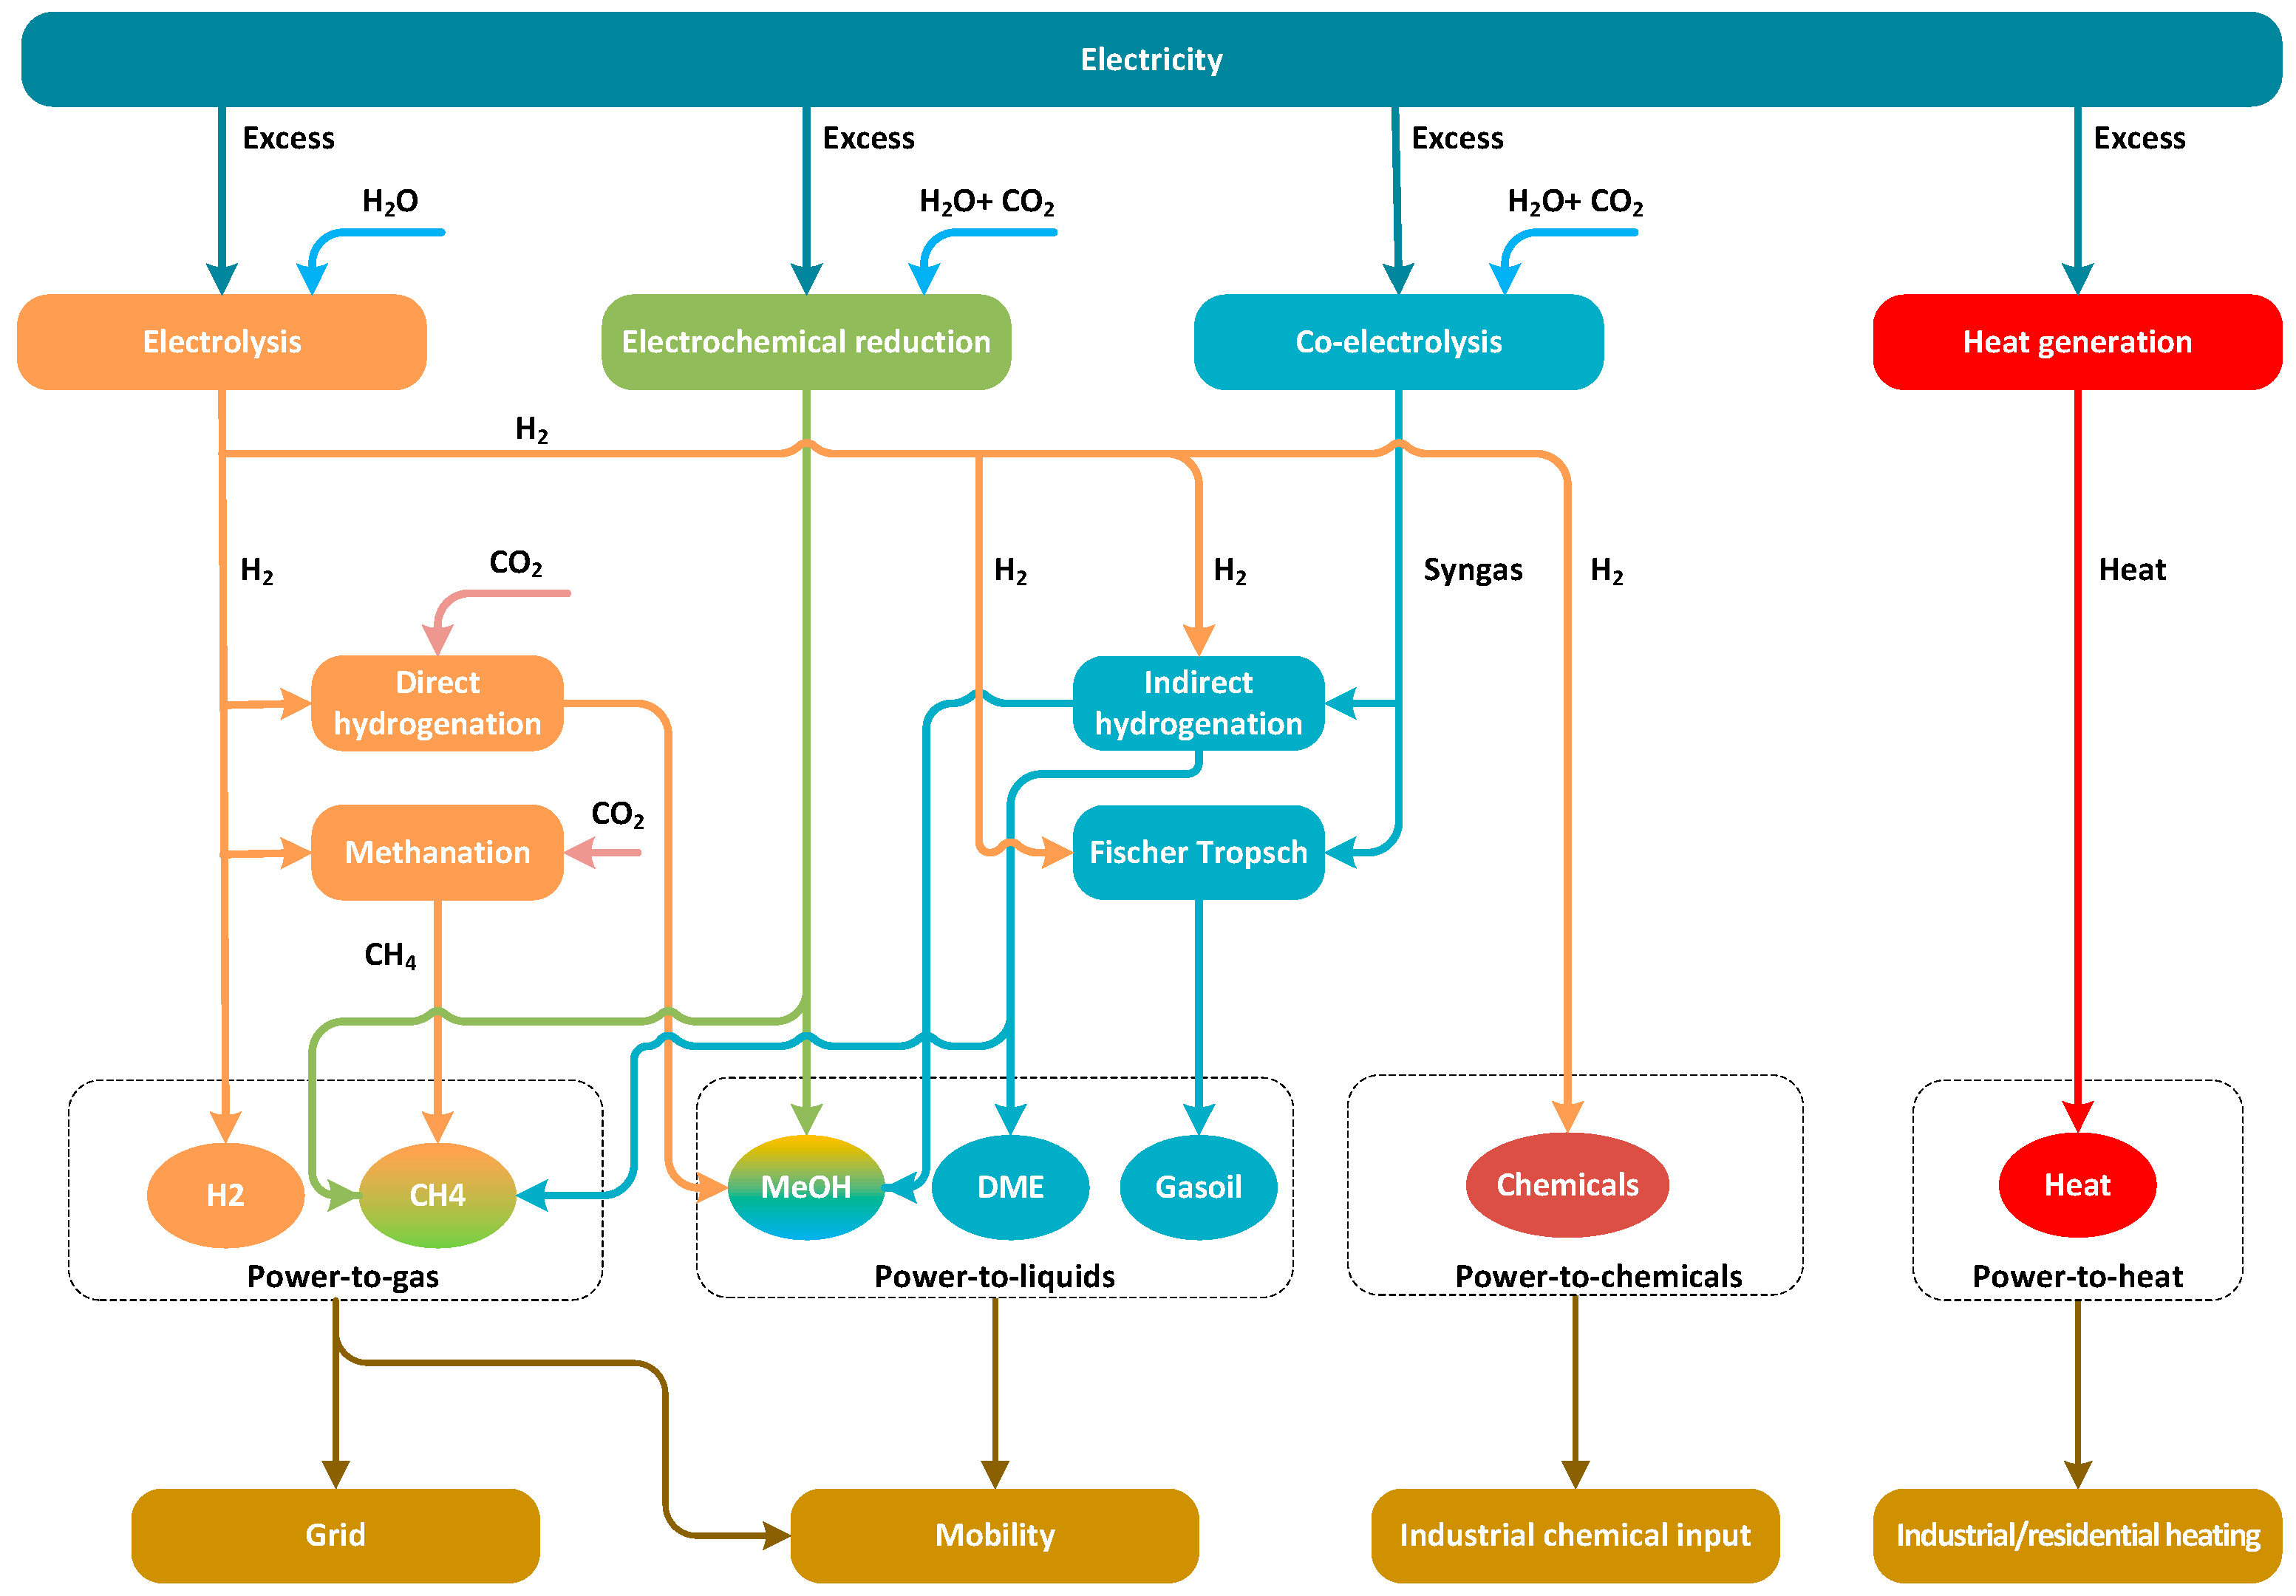
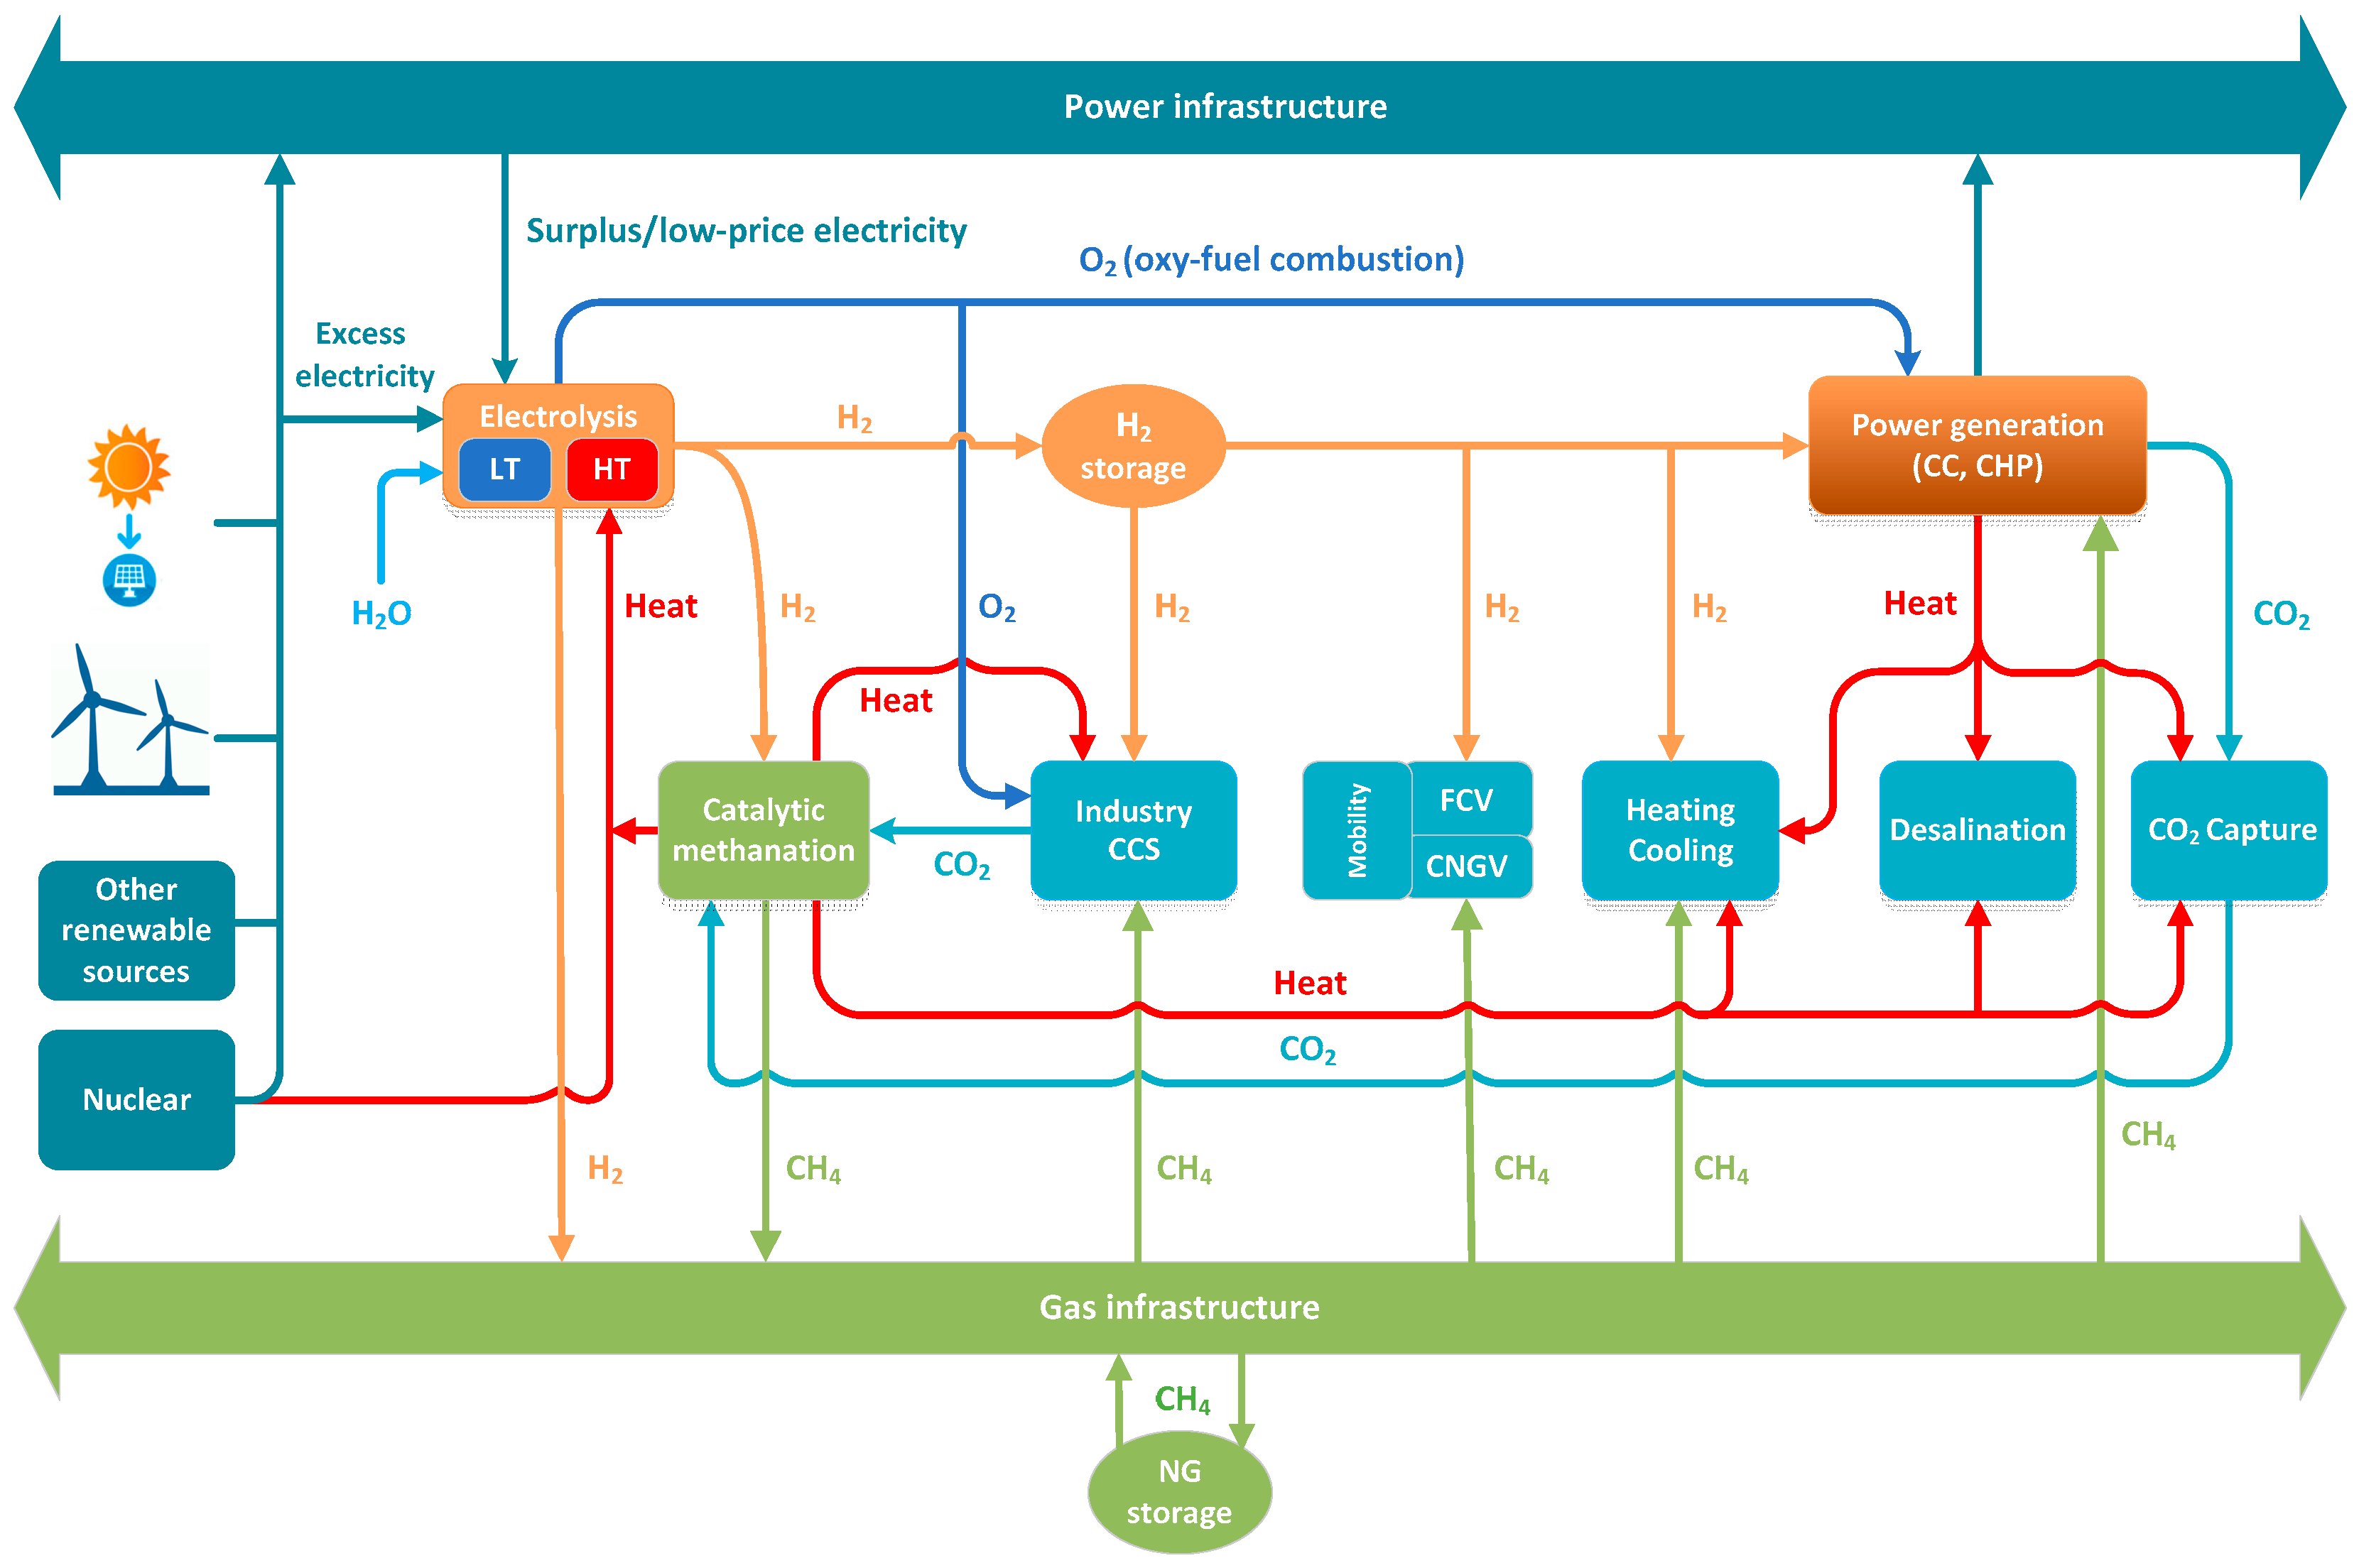
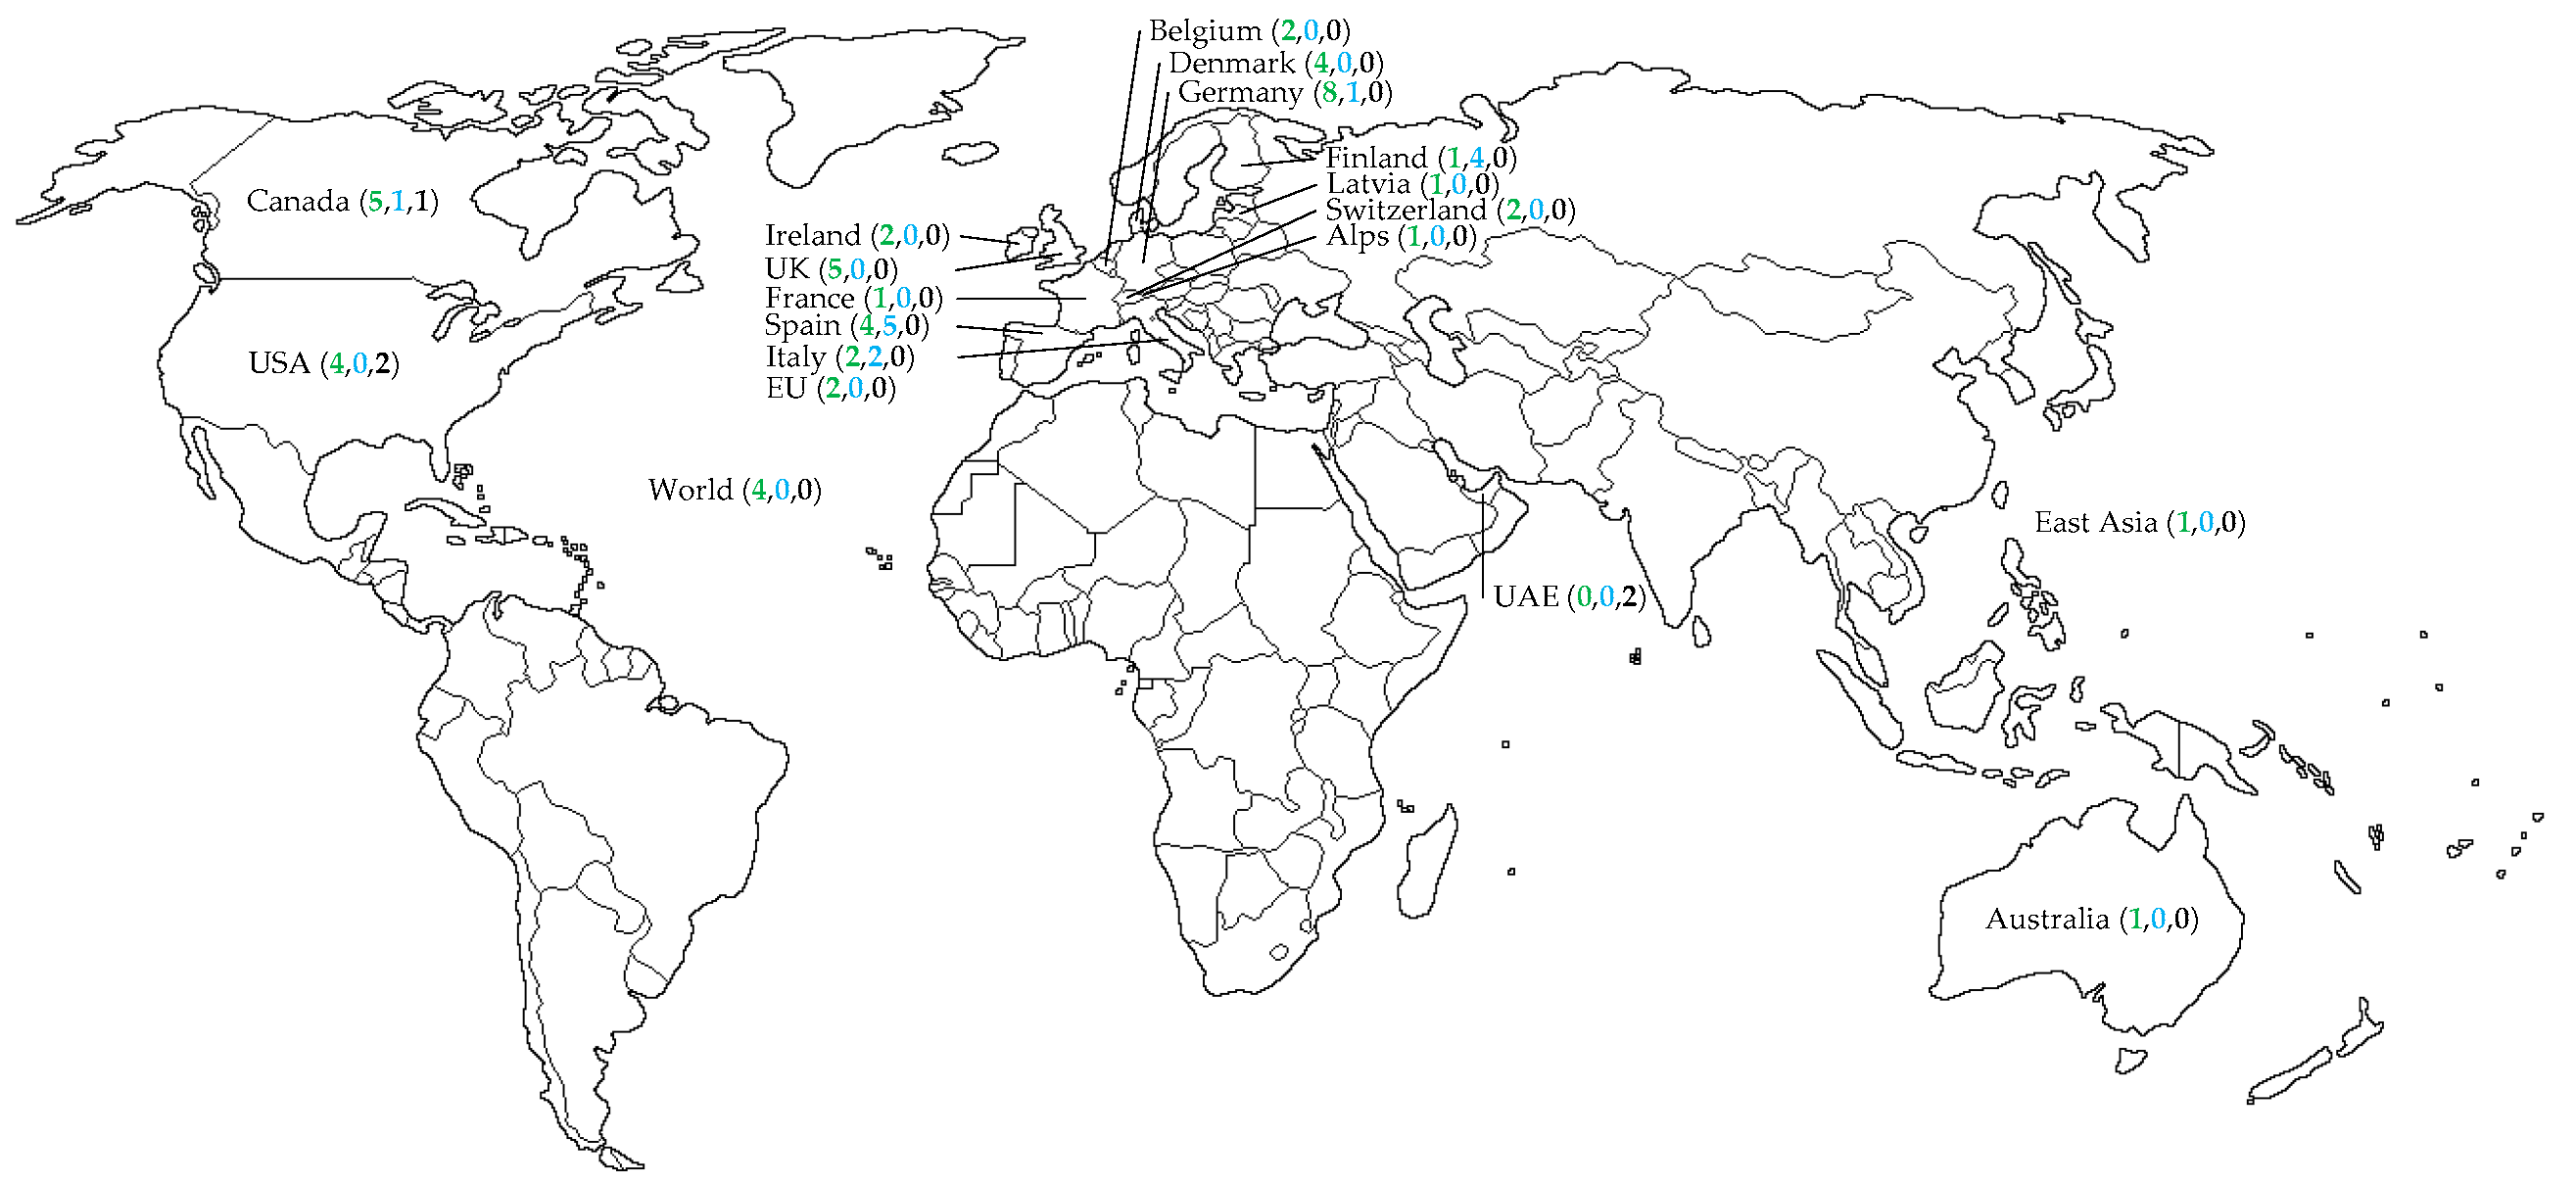
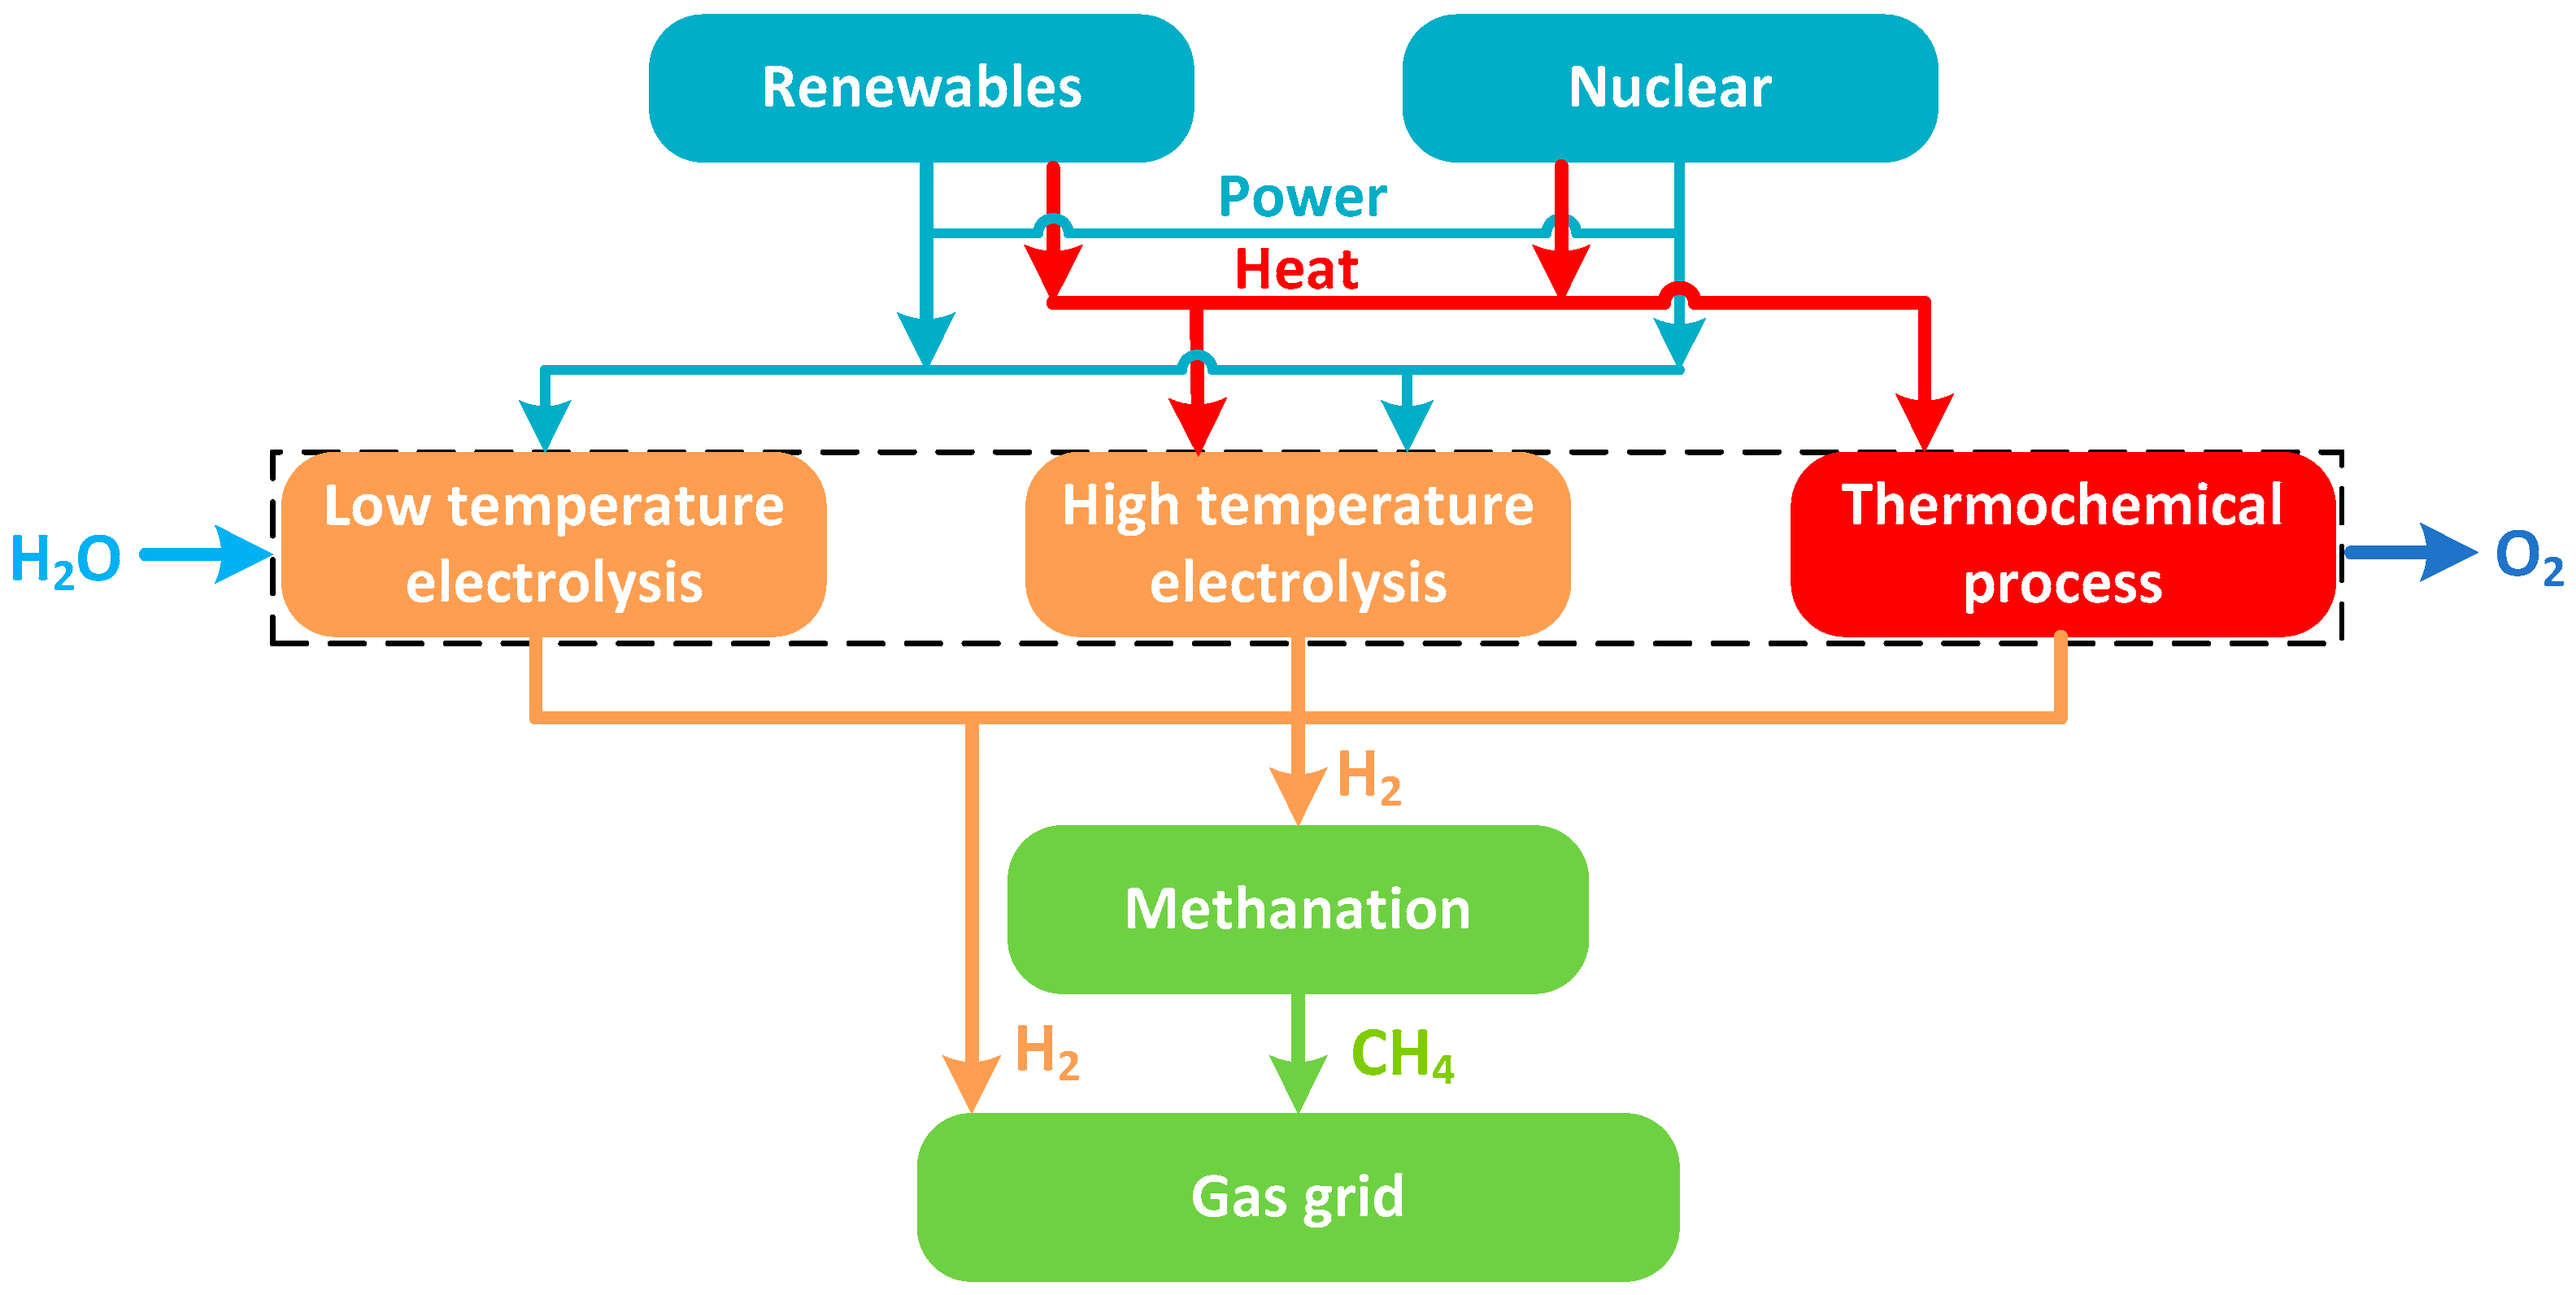
Table 1.
Summary of published analyzes of PtG deployment scenarios at regional- and national scale.
| Study | Geographical Location, Timeline, and Renewable Electricity Share | Surplus/Low-Cost Electricity Source | PtG Product(s) and End-Use(s) | H2 Production Process, Capacity (Nm3/h or W) and Efficiency | Methanation Process, Efficiency and CO2 Source |
|---|---|---|---|---|---|
| Barton and Gammon (2010) [43] | UK; 2050; RE N/R | Solar PV, solar thermal, tidal energy, wave energy, on/off-shore wind, biomass, waste, hydroelectricity | H2 for mobility, industry, power, gas grid injection and conversion to other fuels | Process N/R; Capacities of 61.4 GW and 107.1 GW for “high renewable share” and “high nuclear share” scenarios, respectively | N/A |
| Jacobson et al. (2011, 2013–2018) [44,45,46,47,48,49,50,51] | California, New York, and Washington states, USA; All USA; World; 2050; 100% RE | On/off-shore wind, hydropower, CSP, geothermal, solar PV, tidal, wave | H2 for ground, sea and air transportation; industrial and building heat generation | Process and capacity N/R; 70% efficiency | N/A |
| Gutiérrez-Martín and Guerrero-Hernández (2012) [52] | Spain; 2011–2020; 42% RE | Wind, solar thermal, solar PV, hydroelectricity, nuclear | H2 for mobility or power (peak shaving) | 53 nos. 50 MW PEM electrolyzers; efficiency N/R | N/A |
| Steinke et al. (2013) [53] | Europe; 2050; 100% RE | Wind, solar PV | SNG for re-electrification | N/R | Process N/R; 30% power-to-SNG-to-power efficiency; CO2 source N/R |
| Jentsch et al. (2014) [54] | Germany; Timeline N/R; 85% RE | Wind, solar PV, biogas, run of river hydroelectricity, geothermal | SNG, N/R | N/R | Process N/R; 62% power-to-SNG efficiency; CO2 availability and cost for methanation not included in analysis |
| Moskalenko et al. (2014) [55] | Saxony-Anhalt, Germany; Timeline N/R; RE N/R | Wind, solar PV | SNG; end-use N/R | N/R | Biological methanation; Efficiency N/R; biogas plant CO2 |
| Ridjan et al. (2014) [56] | Denmark; 2050; 100% RE | Off-shore wind | SNG and PtL-methanol for transport | SOE and co-electrolysis; Capacity N/R; 73% and 77% SOE and co-electrolysis efficiency, respectively | Catalytic; Efficiency N/R; Biomass post-combustion capture |
| Schiebahn et al. (2015) [15] | Germany; Timeline N/R; RE N/R | On/off-shore wind capacities of 169 GW and 70 GW, respectively | H2 and SNG for gas grid injection and mobility | Process and capacity N/R; 70% efficiency | Process N/R; 80% methanation efficiency; CO2 from fossil power plants, biomass, industrial processes and atmospheric air |
| Kötter et al. (2015) [57] | Rhineland-Palatinate, Germany; 2030; 100% RE | Wind, solar PV, hydroelectricity, biomass | SNG, N/R | Process and capacity N/R; 75% electrolysis efficiency | Biological methanation (80% efficiency); 60% power-to-SNG efficiency; Biogas process-derived CO2 |
| Gutiérrez-Martín et al. (2015) [58] | Spain; Timeline N/R; 31% RE | Wind, solar thermal, solar PV, hydroelectricity, nuclear | H2 potentially for heating, power, synthetic fuel production or gas grid injection | 300 nos 50 MW AEL (efficiency calculated) | N/A |
| Clegg and Mancarella (2015) [59] | UK; 2030; 48% RE | Wind | H2 and SNG for gas grid injection | Process and capacity N/R; 73% efficiency | Process N/R; 73% power-to-H2 and 64% power-to-SNG efficiencies; CO2 source N/R |
| Qadrdan et al. (2015) [60] | UK; 2020; RE N/R | Wind | H2 for gas grid injection | Process N/R; ~5–12 GW capacity; 70% efficiency | N/A |
| Ahern et al. (2015) [61] | Republic of Ireland; 2030; RE N/R | Wind | SNG for transport | Process and capacity N/R; 75% efficiency | Biological; 80% efficiency; 60% power-to-SNG efficiency; Anaerobic digestion biogas-derived CO2 |
| Vandewalle et al. (2015) [62] | Belgium; Timeline N/R; 69–76% RE (wo/w PtG) | Equal solar PV and wind generation shares | SNG for re-electrification and other domestic uses | Low-temperature; 7 MW capacity; Efficiency N/R | Process N/R; 65% power-to-SNG efficiency; 50% power-to-SNG-power efficiency; CO2 capture from gas-fired power plants |
| Mukherjee et al. (2015) [63] | Ontario, Canada; 2012–2013; ~40% RE | Grid electricity including nuclear, hydroelectricity, wind | H2 for gas grid injection for residential heating | AEL; 61.4 Nm3/h @ 290 kW; Efficiency N/R | N/A |
| Estermann et al. (2016) [64] | Bavaria, Germany; 2025; RE N/R | Solar PV | SNG for gas grid injection | Process N/R; 370 MW combined capacity to absorb 20% of excess solar energy; Efficiency N/R | Biological; Efficiency N/R; Biogas process-derived CO2 |
| Gutiérrez-Martín and Rodriguez-Anton (2016) [65] | Spain; 2050; RE N/R | Wind, solar, hydroelectricity, nuclear | H2 for energy storage, grid balancing and SNG production; SNG for gas grid injection and re-electrification | AEL; Capacity N/R; 62.3% efficiency | Catalytic; 83.3% efficiency; 48.9% power-to-SNG efficiency; 30.8% power-to-SNG-to-power efficiency |
| Scamman and Newborough (2016) [26] | France; 2050; RE N/A | Excess nuclear | H2 and possibly SNG for underground cavern storage, grid injection and mobility | Process and capacity N/R; energy demand of 60 kWh/kg (66% HHV efficiency) at part load, or 55 KWh/kg (72% HHV efficiency) at full load | Process/efficiency N/R; Biogas CO2 suggested |
| Parra et al. (2016) [66] | Switzerland; 2015–2030; RE N/R | Unspecified wholesale renewables and non-renewables | H2 and SNG for gas grid injection; electrolysis/methanation heat for district heating; O2 for industry | AEL (85% efficiency) or PEM; Capacity N/R; Efficiency calculated | Catalytic; 85% efficiency; Unspecified CO2 source |
| Nastasi and Lo Basso (2016) [67] | Generic national energy system (e.g., Italy); 2016–2035; 25–50% RE | Unspecified renewables | H2 blended with natural gas for gas network distribution, combustion in CHP for electricity/heating and in adsorption gas-driven heat pumps for heating; as a working fluid in adsorption metal hydride heat pumps; SNG for CHP | Low-temperature process; Capacity N/R; 70% electrolysis efficiency | Catalytic; Efficiency N/R; CO2 captured from combustion products |
| Child and Breyer (2016) [68] | Finland; 2050; 100% RE | On/off-shore wind, solar PV, hydroelectricity, biomass | H2 and SNG; CHP; PtL, heat of methanation for district heating | Process and capacity N/R; 73% efficiency | Methanation process/efficiency N/R; 80% SNG-to-liquid fuel efficiency; CO2 from air |
| Zoss et al. (2016) [69] | Latvia; 2020; 20% RE | Wind | SNG; N/R | N/R | N/R |
| Meylan et al. (2016) [70] | Europe; 2050; 80% RE | Primarily wind and solar | SNG; N/R; methanation heat for biogas production or CO2 capture | AEL and PEM; 6 kWh/m3H2 energy demand | Process N/R; Biogas CO2; Ambient air and flue gases as potential CO2 sources |
| Mukherjee et al. (2016) [71] | Ontario, Canada; 2012–2013; ~40% RE | Grid electricity including nuclear, hydroelectricity, wind | H2 for gas grid injection; grid electricity demand-supply balancing | 2 MW PEM; Efficiency N/R | N/A |
| Walker et al. (2016) [72] | Ontario, Canada; 2009–2013; ~40% RE | Grid electricity including nuclear, hydroelectricity, wind | H2 for petroleum refining | 2–40 MW PEM; Efficiency N/R | N/A |
| Robinius et al. (2017) [73] | Germany; 2050; Unspecified high RE | On/off-shore wind, solar PV | H2 distributed to network of FCV refueling stations via dedicated H2 pipeline | Process and capacity N/R; 70% efficiency | N/A |
| Grueger et al. (2017) [74] | Brandenburg, Germany; 2013; 25.3% | Wind | H2 for reconversion to electricity using PEM fuel cell | 0.3–1.5 MW AEL per 100 MW wind farm; 60% efficiency | N/A |
| Hou et al. (2017) [75] | Denmark; 2015; 432 GW wind capacity equivalent to 42% wind share | 72 MW off-shore wind | H2 for sale to mobility/ industry, or on-site reconversion to electricity using PEM fuel cell | AEL or PEM; Capacity optimized (10–100 MW); 4.9 or 5.5 kWh/Nm3 (AEL), 6.1 kWh/Nm3 (PEM) | N/A |
| Zeng et al. (2017) [76] | Denmark; 2016–2024; up to 66% wind share (2024) | Wind | SNG injected into regional gas network | Process and capacity N/R; Efficiency N/R | Process N/R; Efficiency N/R; CO2 from power plants |
| Qadrdan et al. (2017) [77] | UK; 2030; RE N/R | Wind | H2; N/R | Process N/R; 6 GW capacity; 70% efficiency | N/A |
| Ameli et al. (2017) [78] | UK; 2030; RE N/R | Wind, solar PV | H2 for gas grid injection | Process and efficiency N/R; ~5–15 GW capacity | N/A |
| Vo et al. (2017) [79] | Island of Ireland; 2020; 40% RE | Wind | SNG for transport | Process and capacity N/R; 75% efficiency | Biological methanation; Efficiency N/R; Anaerobic digestion biogas-derived CO2 |
| Parra et al. (2017) [80] | Switzerland; 2015–2025, RE N/R | Either unspecified Swiss wholesale renewables and non-renewables, Swiss wind, Swiss solar, or European electricity | H2 and SNG for gas grid injection; electrolysis/methanation heat for district heating or atmospheric CO2 capture; O2 for industry | PEM; Capacity N/R; Calculated efficiency | Thermo-chemical methanation; 80% efficiency; Biogas process-derived CO2 or CO2 from air |
| Mesfun et al. (2017) [81] | Alpine region; Timeline N/R; 28–53% RE | Grid electricity including solar PV, wind, hydroelectricity, biomass | SNG for district heating; methanol for transportation | Solid oxide co-electrolysis; Up to 65 TWh annual methanol production capacity; Efficiency N/R | Process and capacity N/R; 70% power-to-SNG and power-to-methanol efficiency |
| Guandalini et al. (2017) [82] | Italy; 2050; 62–71% RE | Solar PV, on-shore wind | H2 for either gas grid injection or natural gas replacement for heating, as industrial feedstock or for mobility | AEL or PEM; Capacity N/R; 70% efficiency | N/A |
| Belderbos et al. (2017) [83] | Belgium; Timeline N/R; 50–100% RE | On/off-shore wind, solar PV | SNG | N/R | Process and capacity N/R; 60% power-to-SNG (charging) efficiency; 47% SNG-to-power (discharging, combined cycle with CCS) efficiency; CO2 captured from gas-fired power plants |
| Mukherjee et al. (2017) [84] | Ontario, Canada; 2012–2013; ~40% RE | Grid electricity including nuclear, hydroelectricity, wind, solar | H2 for grid injection; grid electricity demand-supply balancing; fueling FCVs | 2 MW PEM; Efficiency N/R | N/A |
| Laslett et al. (2017) [85] | South West Interconnect System of Western Australia; 2030; 100% RE | Solar PV/CSP, wind | SNG for grid injection and reconversion to electricity | Process and efficiency N/R; 450 MW capacity | Process N/R; 20% power-to-SNG-to-power efficiency |
| Gulagi et al. (2017) [86] | East Asia; 2030; 100% RE | Solar PV/CSP, on-shore wind, hydroelectric power, biomass, waste-to-energy, geothermal plants | SNG | Process N/R; 97–499 GW; 84% efficiency N/R | Process N/R; 77% efficiency; CO2 scrubbing from air |
| McKenna et al. (2018) [87] | Baden-Württemberg, Germany; 2016–2050; RE N/R | Wind, solar PV | H2 and SNG for grid injection | Process and capacity N/R; 70–80% efficiency | Process dependent upon CO2 source (i.e., biogas/fossil power plants, glass and cement production facilities, air); 68% power-to-SNG efficiency |
| Bailera et al. (2018) [88] | Spain; 2020–2050; 63% RE in 2050 | Wind, hydro, solar PV/CSP, biomass, marine, geothermal | H2 for transportation; SNG for peak load electricity production | N/R | N/R |
Note: AEL = alkaline electrolysis. N/A = not applicable. N/R = not reported. PEM = polymer electrolyte membrane electrolysis. RE = renewable share. SOE = solid oxide electrolysis.
Table 2.
Summary of published investigations of distributed-scale PtG deployment scenarios.
| Study | Distributed Energy System | Electricity Source | PtG Product(s) and End-Use(s) | H2 Production Process, Capacity (Nm3/h or W) and Efficiency | Methanation Process and CO2 Source | Energy/Material Integration between PtG Plant and External Systems/Facilities |
|---|---|---|---|---|---|---|
| Buchholz et al. (2014) [120] | Lignite-fired power plant (LPP); The Netherlands | 10% of LPP electrical capacity, representing surplus grid electricity mix including unspecified fluctuating renewables | SNG for gas grid injection | 80 MW AEL (4.9 kWh/Nm3H2); Efficiency N/R | Chemical methanation; amide-based CO2 capture from LPP flue gas; Power-to-SNG efficiency of 53.5%; Power-to-power efficiency of 29.4% | PtG integration with 800 MW LPP; heat of methanation used for steam production, either for LPP or for CO2 capture from LPP fuel gas; Excess LPP load absorbed by PtG reduces LPP operating costs |
| Breyer et al. (2015) [121] | Kraft pulp mill, sludge waste water treatment plant; Finland | Hydroelectricity | H2 for either SNG production of for use in bio-diesel plant; SNG for gas grid injection; electrolyzer for grid frequency containment | Process and efficiency N/R; 9.6 MW | Process N/R; 1.2 or 9.6 MW methanation capacity; wood-based CO2 from kraft pulp mill | PtG oxygen used in kraft pulp mill or sludge waste water treatment plant; methanation heat proposed for CO2 capture; pulp mill provides bio-CO2 for methanation and deionized water for electrolysis; bio-diesel produced from by-products of pulp and paper mill |
| Bailera et al. (2015) [122] | Unspecified industrial plant; Spain | Unspecified electricity mix including fluctuating renewables (not limited to excess electricity) | SNG (>95% molar purity) for gas network injection | AEL; 4.3–4.9 kWh/Nm3H2 or 61.2–69.7% efficiency | Chemical methanation (TREMP process) between oxyfuel boiler flue gas (CO2, O2) and electrolytic H2; 72% methanation efficiency; Power-to-SNG efficiency of ~45.5–51.5% | PtG hybridization with oxycombustion coal boiler in unspecified industrial plant; PtG oxygen used in coal-fired oxy-fuel boiler; heat of methanation proposed for use in either the hybrid PtG-oxyfuel boiler system and/or in external processes |
| Tsupari et al. (2016) [123] | Biomass (i.e., peat and forest residues) co-fired CHP plant; Finland | Low-cost electricity from CHP | SNG (99% purity) for gas grid injection, industrial use or gas filling stations | Process N/R; 10 MW; 62% or 70% efficiency | Process N/R; H2-to-SNG conversion efficiency of 83%; 1% of average flow of CHP flue gases used as CO2 source | PtG oxygen used in biomass or co-fired CHP plant; CHP plant provides electricity for electrolysis or the grid, and CO2 for methanation; CHP plant provides heat for power generation in a steam power cycle and for district heating |
| Kärki et al. (2016) [124] | Oil refineries, iron and steel production plants, CHP plants, waste water treatment plants; geographical location N/R | Unspecified renewables | H2 for oil refineries or steel mills; SNG and synthetic fuels | AEL (67% efficiency) or SOE (77% efficiency) | Process N/R; Efficiency N/R; CO2 from carbon intensive industries | PtG integrated with oil refining, iron and steel industries, CHP and waste water treatment; PtG heat and steam used in CHP, heat used in pulp mills or waste water treatment; oxygen used for enriched combustion or liquefied and sold; CO2 for methanation from biogas production, pulp mill, iron or steel industry |
| Bailera et al. (2016) [125] | Households, districts, industry, power plants; Spain | Unspecified renewables | SNG (95.6% molar purity) | AEL; 4.3–4.9 kWh/Nm3H2; 62% efficiency | Chemical methanation (TREMP process); Efficiency N/R; CO2 from oxy-combustion boiler flue gas | 0.01–1 MW scale PtG integrated with ASU and oxy-combustion boiler to serve either households, district heating, industry, or power plants; PtG oxygen used in oxy-fuel boiler; heat of methanation proposed for district heating and other process industries |
| Bailera et al. (2017) [126] | Districts, industry, power plants; Spain | Unspecified renewables | SNG (95.2% molar purity) | AEL; 4.4 kWh/Nm3H2; 68.1% efficiency | Chemical methanation (TREMP process); Efficiency N/R; CO2 from oxy-combustion boiler or power plant flue gas | 0.02–438 MW scale PtG integrated with ASU and either oxy-combustion boiler to serve either households, district heating, or industry, or with sub-critical Rankine or combined cycle power plant; PtG oxygen used in oxy-fuel system; heat of methanation for Rankine cycle steam generation |
| Bailera et al. (2017) [127] | Electrochemical (EC) plant; Spain | Unspecified renewables | SNG (95.2% molar purity) | Chemical electrolytic H2 by-production from existing EC plant processes; 6 MW H2 output | Chemical methanation (TREMP process); Efficiency N/R; CO2 from boiler flue gas | Hybridization between PtG and EC plant, involving integration of methanation reactors; H2 by-product of existing EC plant chemical electrolytic processes used for hydrogenation of CO2 captured from boilers’ flue gases; Heat of methanation recovered for both CO2 capture and steam production |
| Kuparinen and Vakkilainen (2017) [128] | Kraft pulp mill; South America | Excess electricity from biomass (wood) processed on-site | H2 as a replacement of fuel oil to provide 72% of lime kiln heat demand, as well as heat for biomass drying, gasification, torrefaction, lignin extraction and wood pulverization processes; H2 as feedstock for on-site biofuel/bioproducts synthesis | AEL; Efficiency N/R | N/A | PtG O2 used for on-site for delignification and bleaching operations |
| Al-Subaie et al. (2017) [129] | Oil refinery; Ontario, Canada | Nuclear base-load; renewables including wind and solar | H2 for oil refinery processes | 1 MW PEM; Efficiency N/R | N/A | None in analysis, but sale or use of PtG oxygen for oxygen-enrichment of refinery processes (e.g., fluid catalytic cracking, sulfur recovery, furnace heating, waste water treatment) proposed. |
| Nastasi and Lo Basso (2016) [67] | Districts and existing buildings; Europe | Unspecified renewables | H2 blended with natural gas for combustion in CHP for electricity/heating production and in gas engines to drive adsorption heat pumps for heating; as a working fluid in adsorption metal hydride heat pumps; for SNG production to fuel CHP | Low-temperature process; 70% efficiency | Catalytic; Efficiency N/R; CO2 captured from H2-natural gas blend combustion products | Low-temperature electrolysis heat used to drive metal hydride adsorption heat pumps; CO2 for SNG synthesis captured from blended hydrogen-natural combustion in CHP and gas engines driving adsorption heat pumps |
| De Santoli et al. (2017) [130], Nastasi and Lo Basso (2017) [131] | Existing buildings in Europe, including in Rome (Italy), Berlin (Germany), Copenhagen (Denmark) | Renewables including solar | H2 blended with natural gas for combustion in CHP for electricity/heating production, and in gas engines to drive adsorption heat pumps for heating | Low-temperature process; Efficiency N/R | N/A | None |
| Carroquino et al. (2018) [132] | Vineyard and winery waste water treatment plant; Spain | Solar PV | H2 for on-site hybrid battery-PEM fuel cell (BEV-PEMFCV) vehicle | 2.3 kW AEL (500 Nl/h at 30 bar); efficiency N/R | N/A | PtG integrated with battery tank for long- and short-term energy storage, respectively |
Note: AEL = alkaline electrolysis. ASU = air separation unit. N/R = not reported. PEM = polymer electrolyte membrane electrolysis. SOE = solid oxide electrolysis. TREMP = Topsøe Recycle Energy-efficient [133].
Table 3.
Summary of nuclear-assisted power-to-hydrogen deployment schemes.
| Study | Geographical Location, Timeline | Electricity Source | Heat Source | H2 End-Use(s) | H2 Production Process and Efficiency |
|---|---|---|---|---|---|
| Forberg (2006) [138] | US; timeline N/R; solar thermal | Nuclear, solar thermal | Nuclear | Power generation using H2–O2 water-steam power cycles, oxy-combustion, combined cycles or fuel cells, oil refining; chemical industry | Electrolysis (~50% current–70% future efficiency); thermochemical decomposition |
| Naterer et al. (2008) [139] | Ontario, Canada; 2008 | Nuclear, wind, solar, tidal | Nuclear | Mobility (FCVs), gas grid injection | Electrolysis (30% primary nuclear fuel-to-H2 conversion efficiency); Cu-Cl thermochemical decomposition (43–54% efficiency) |
| O’Brien (2010) [140] | US; timeline N/R | Nuclear, wholesale grid | Nuclear, concentrated solar, biomass gasification | Petroleum upgrading, ammonia production, mobility, synthetic liquid fuels | SOE (up to 51% electricity-to-H2 efficiency); Thermochemical decomposition (up to 61% heat-to-hydrogen efficiency) |
| Orhan et al. (2012) [141] | Location N/R; Timeline N/R | Nuclear, solar, wind, hydroelectricity, geothermal | Nuclear, solar thermal geothermal | Mobility, fuel cells, H2–O2 steam power cycles, oil refining, ammonia production, domestic heating/cooking | Low- or high-temperature electrolysis; Cu-Cl thermochemical decomposition; Efficiency N/R |
| Orhan et al. (2017) [142] | UAE; timeline N/R | Nuclear, solar collectors, solar concentrators | Nuclear | Regenerative fuel cells | Specific process N/R; 35% overall efficiency |
Note: Cu-Cl = copper chlorine. FCV = fuel cell vehicle. N/R = not reported. SOE = solid oxide electrolysis.
© 2018 by the authors. Licensee MDPI, Basel, Switzerland. This article is an open access article distributed under the terms and conditions of the Creative Commons Attribution (CC BY) license (http://creativecommons.org/licenses/by/4.0/).
Share and Cite
MDPI and ACS Style
Eveloy, V.; Gebreegziabher, T. A Review of Projected Power-to-Gas Deployment Scenarios. Energies 2018, 11, 1824. https://doi.org/10.3390/en11071824
AMA Style
Eveloy V, Gebreegziabher T. A Review of Projected Power-to-Gas Deployment Scenarios. Energies. 2018; 11(7):1824. https://doi.org/10.3390/en11071824
Chicago/Turabian StyleEveloy, Valerie, and Tesfaldet Gebreegziabher. 2018. "A Review of Projected Power-to-Gas Deployment Scenarios" Energies 11, no. 7: 1824. https://doi.org/10.3390/en11071824
Note that from the first issue of 2016, this journal uses article numbers instead of page numbers. See further details here.