Gas Content Evaluation of Coalbed Methane Reservoir in the Fukang Area of Southern Junggar Basin, Northwest China by Multiple Geophysical Logging Methods

Abstract
:1. Introduction
2. Geological Settings
2.1. Structural Settings
2.2. Stratigraphic Characteristics
3. Methodology
3.1. Kim Method with Proximate Analysis Data
3.2. Langmuir Method
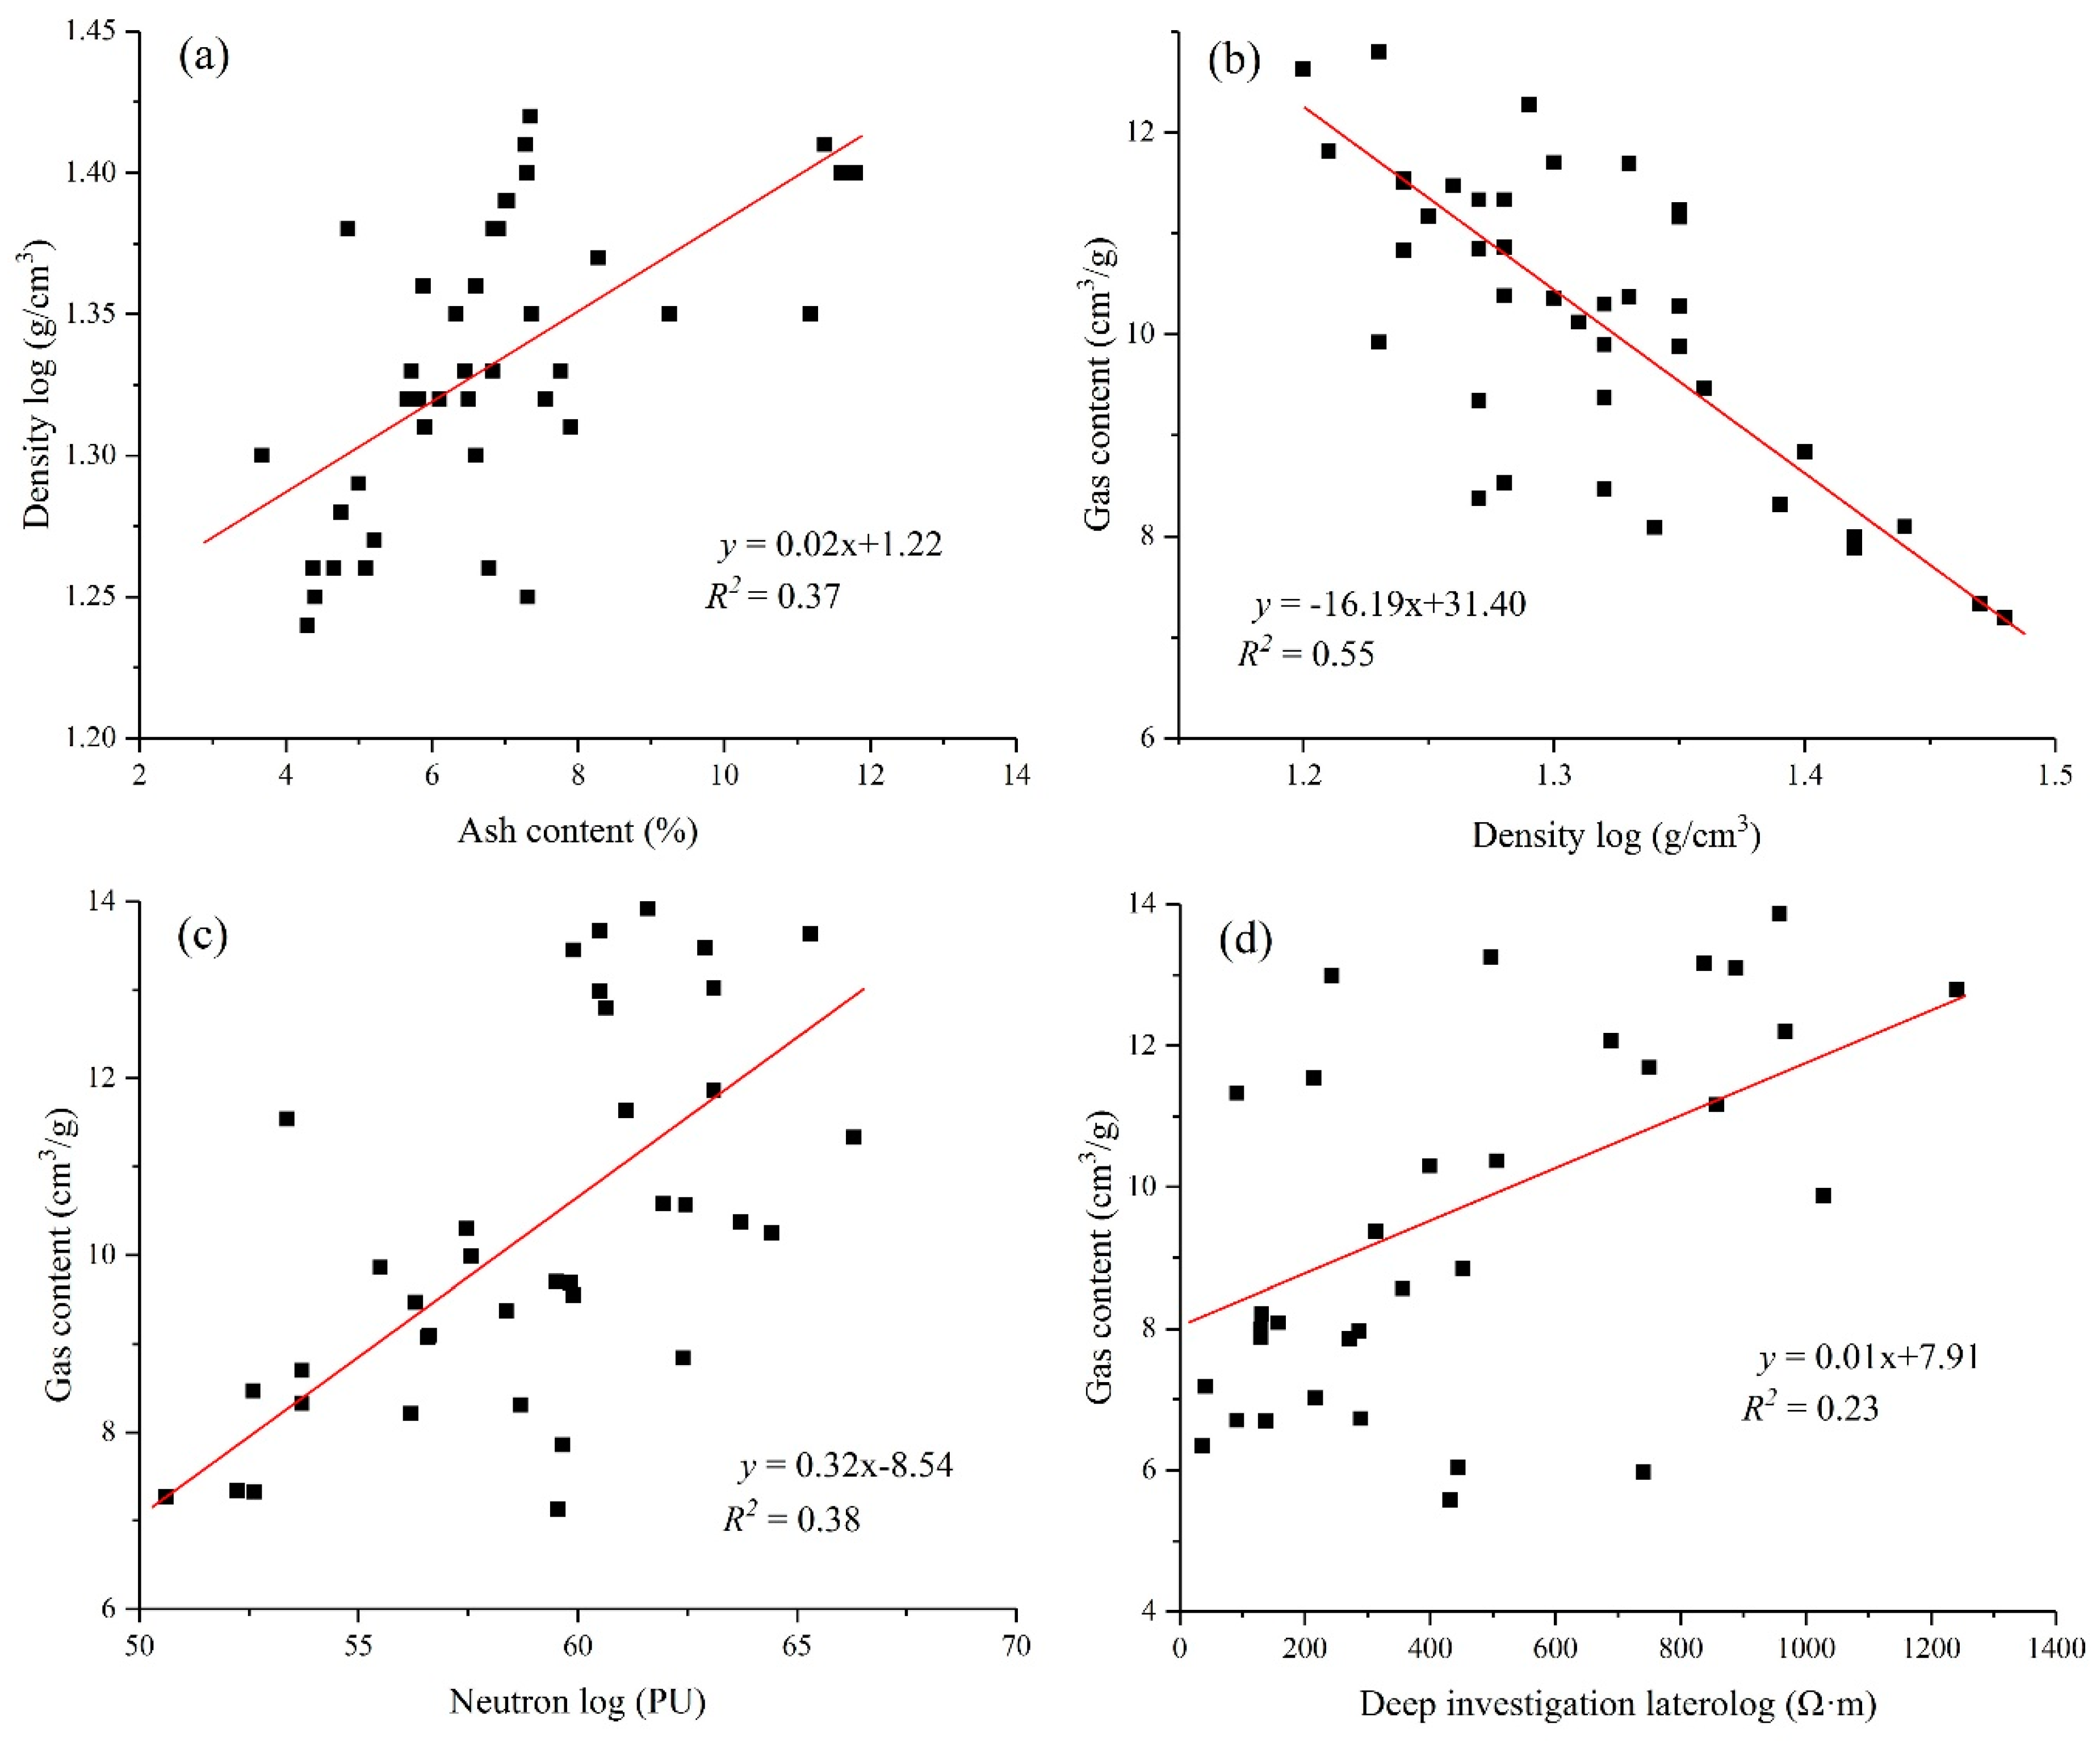
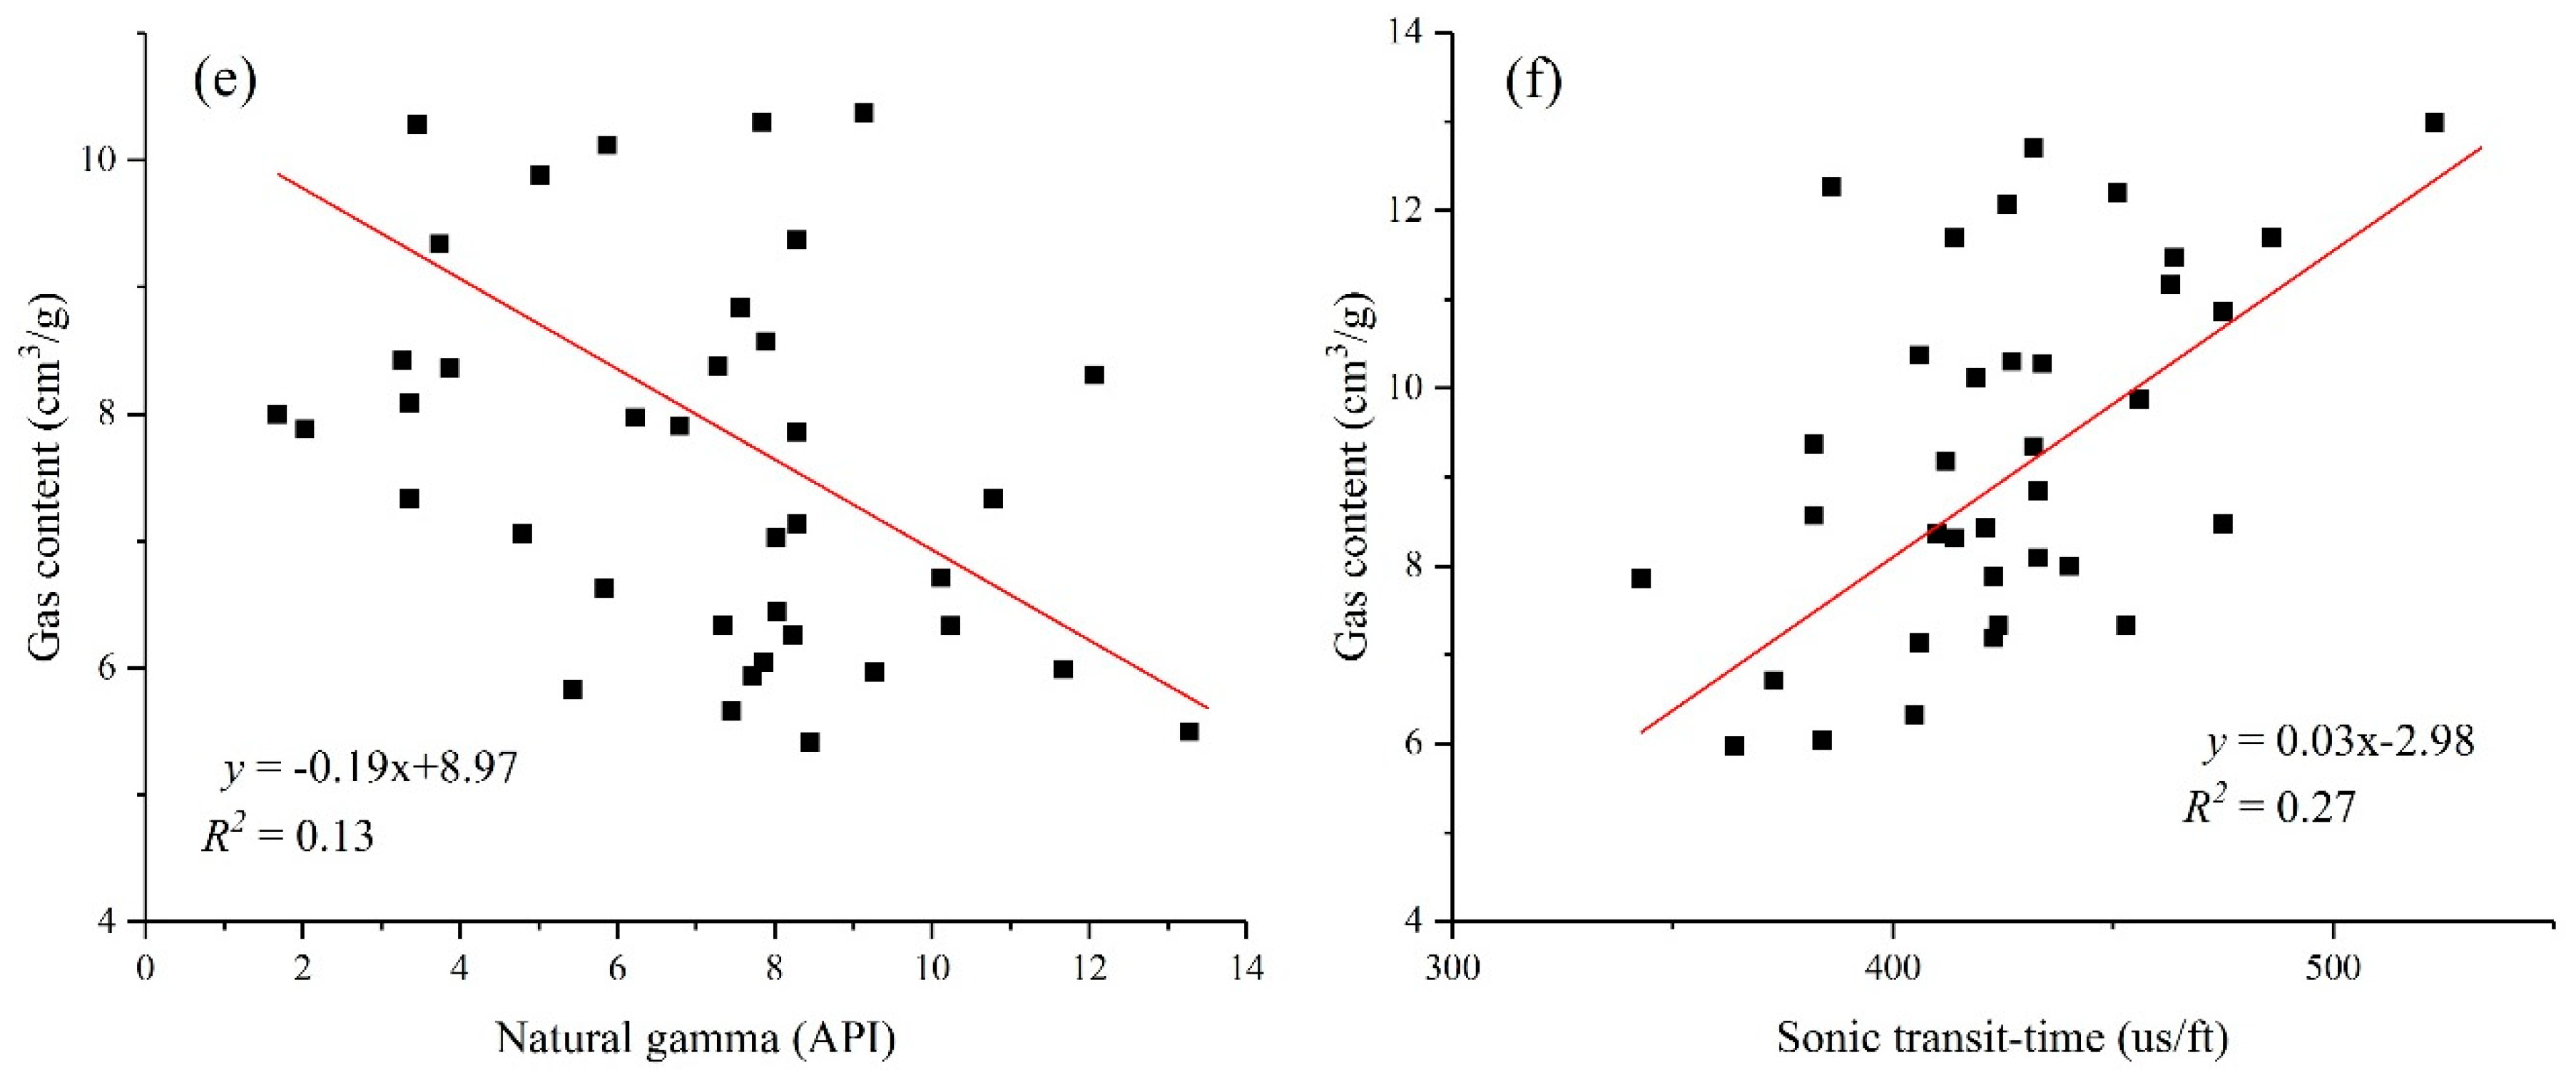
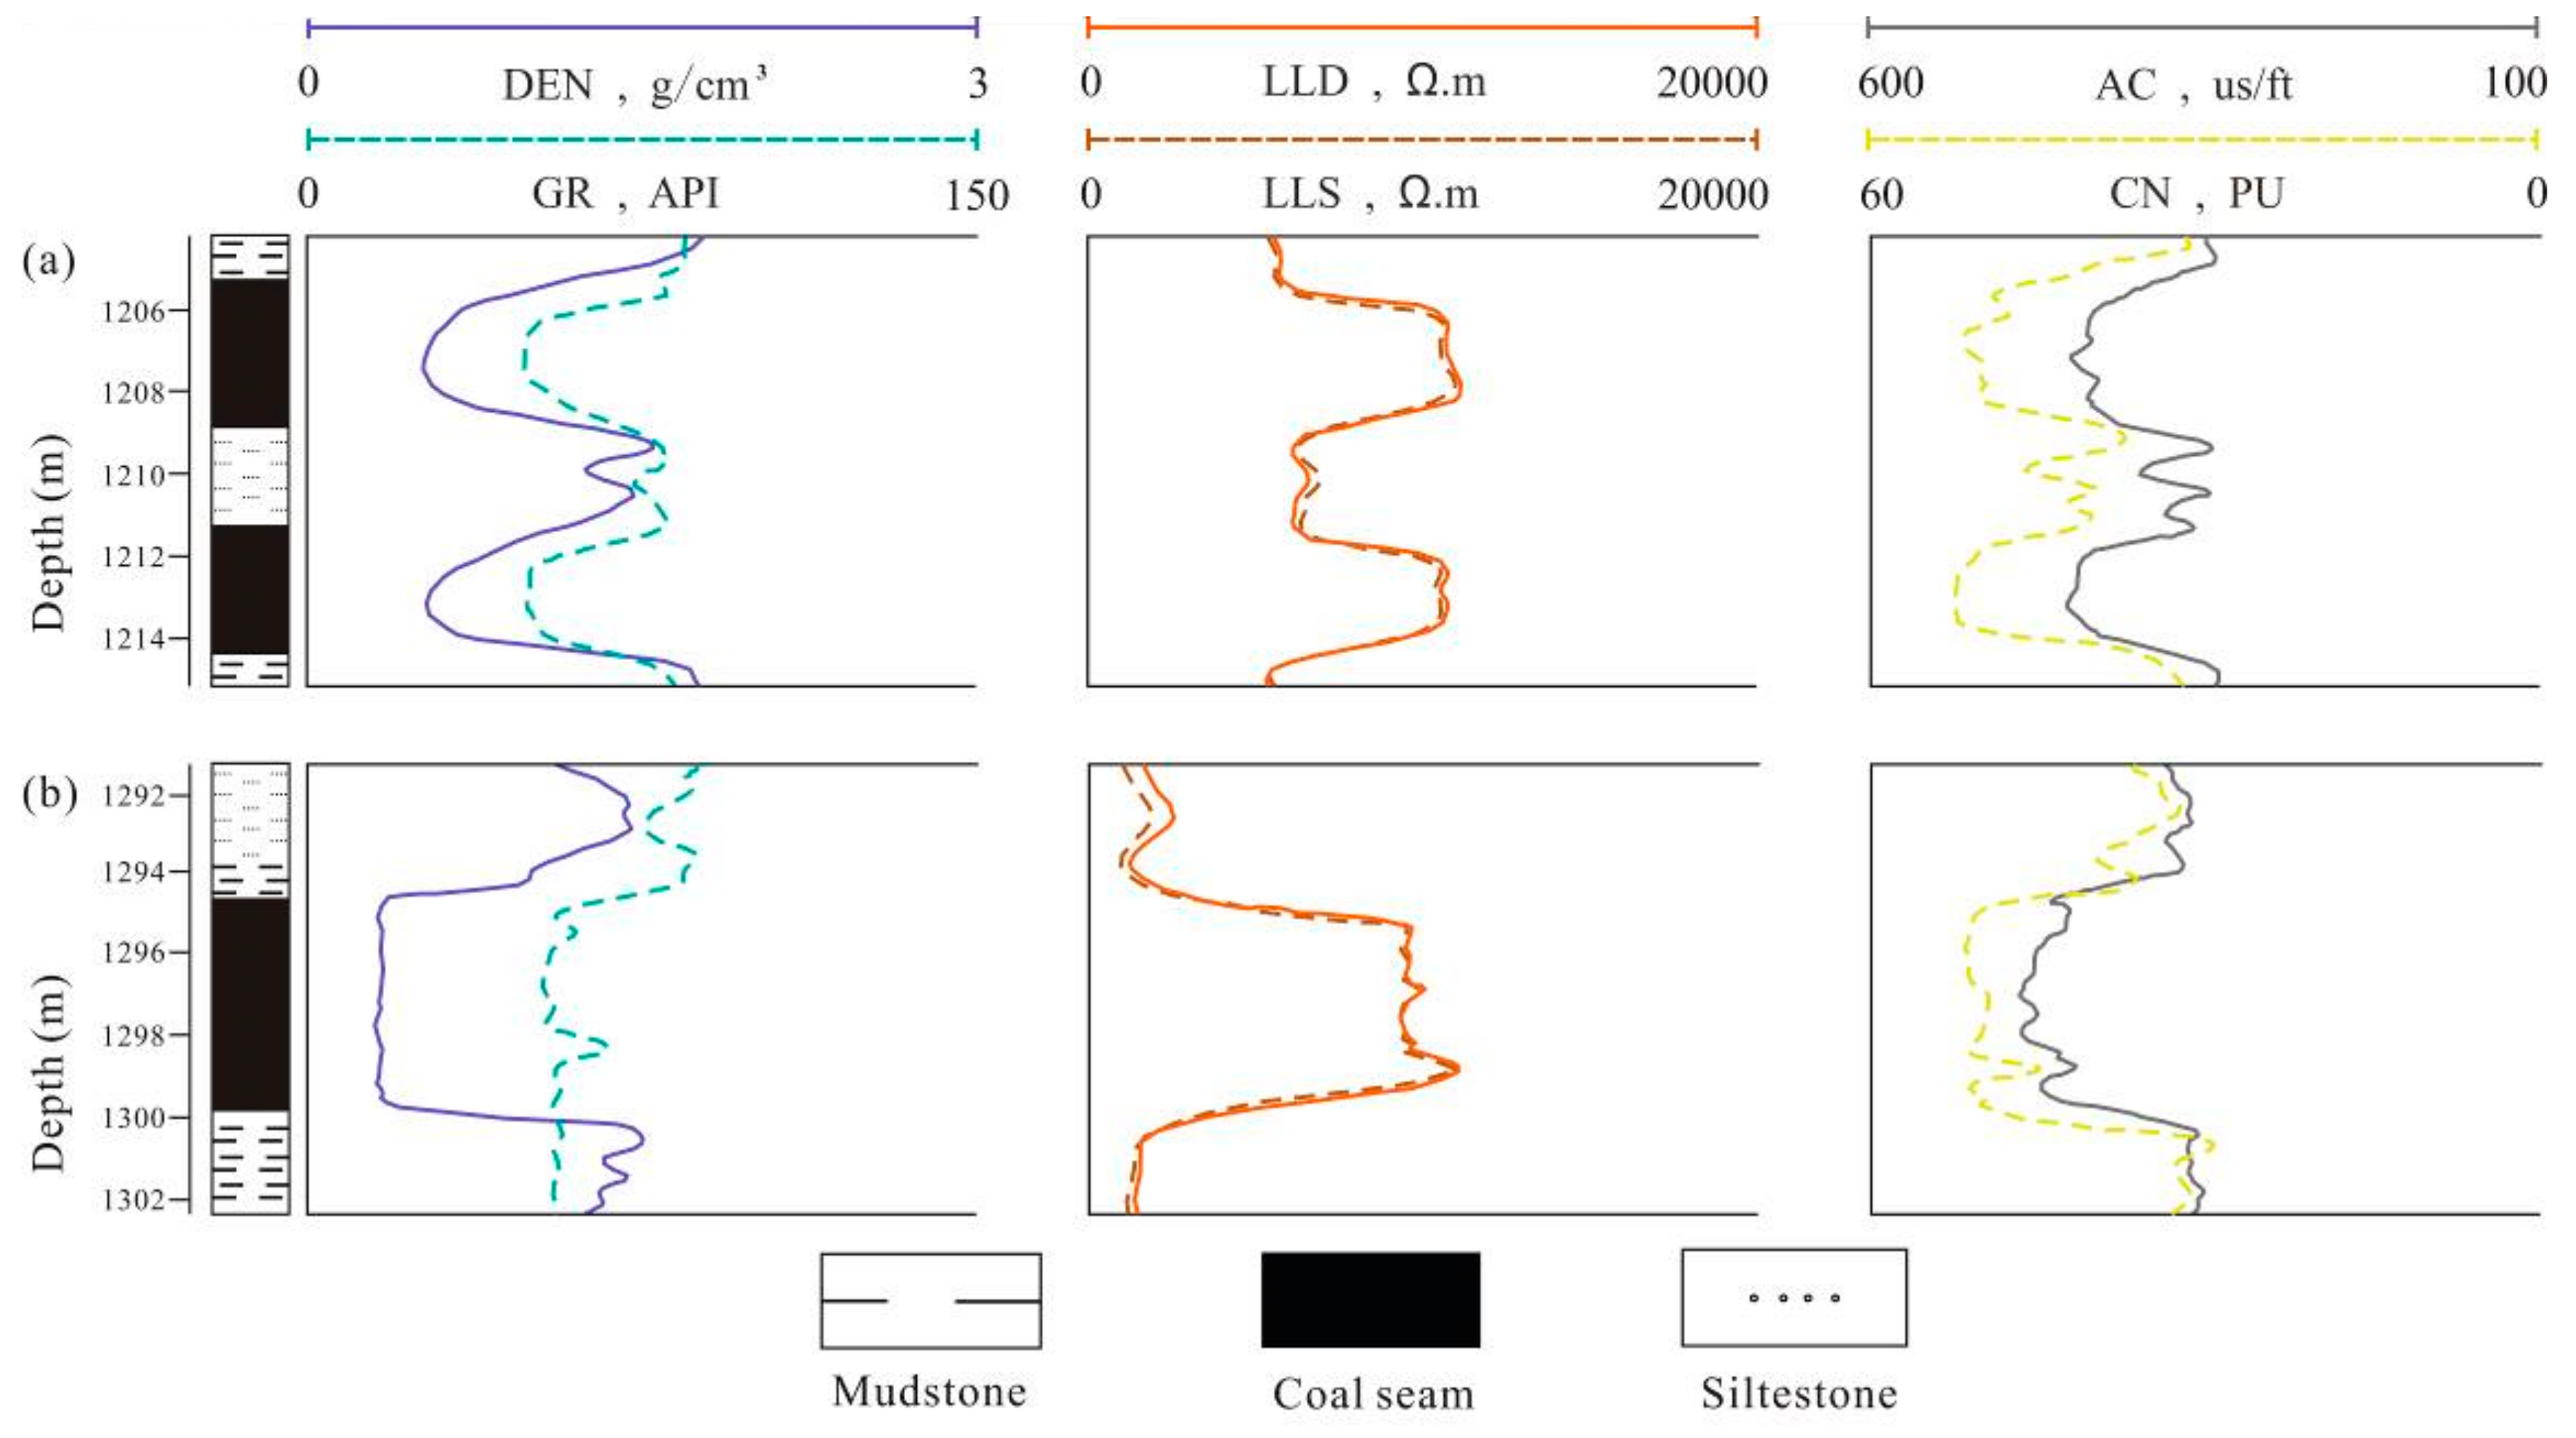
3.3. Well Logging Method
4. Results and Discussion
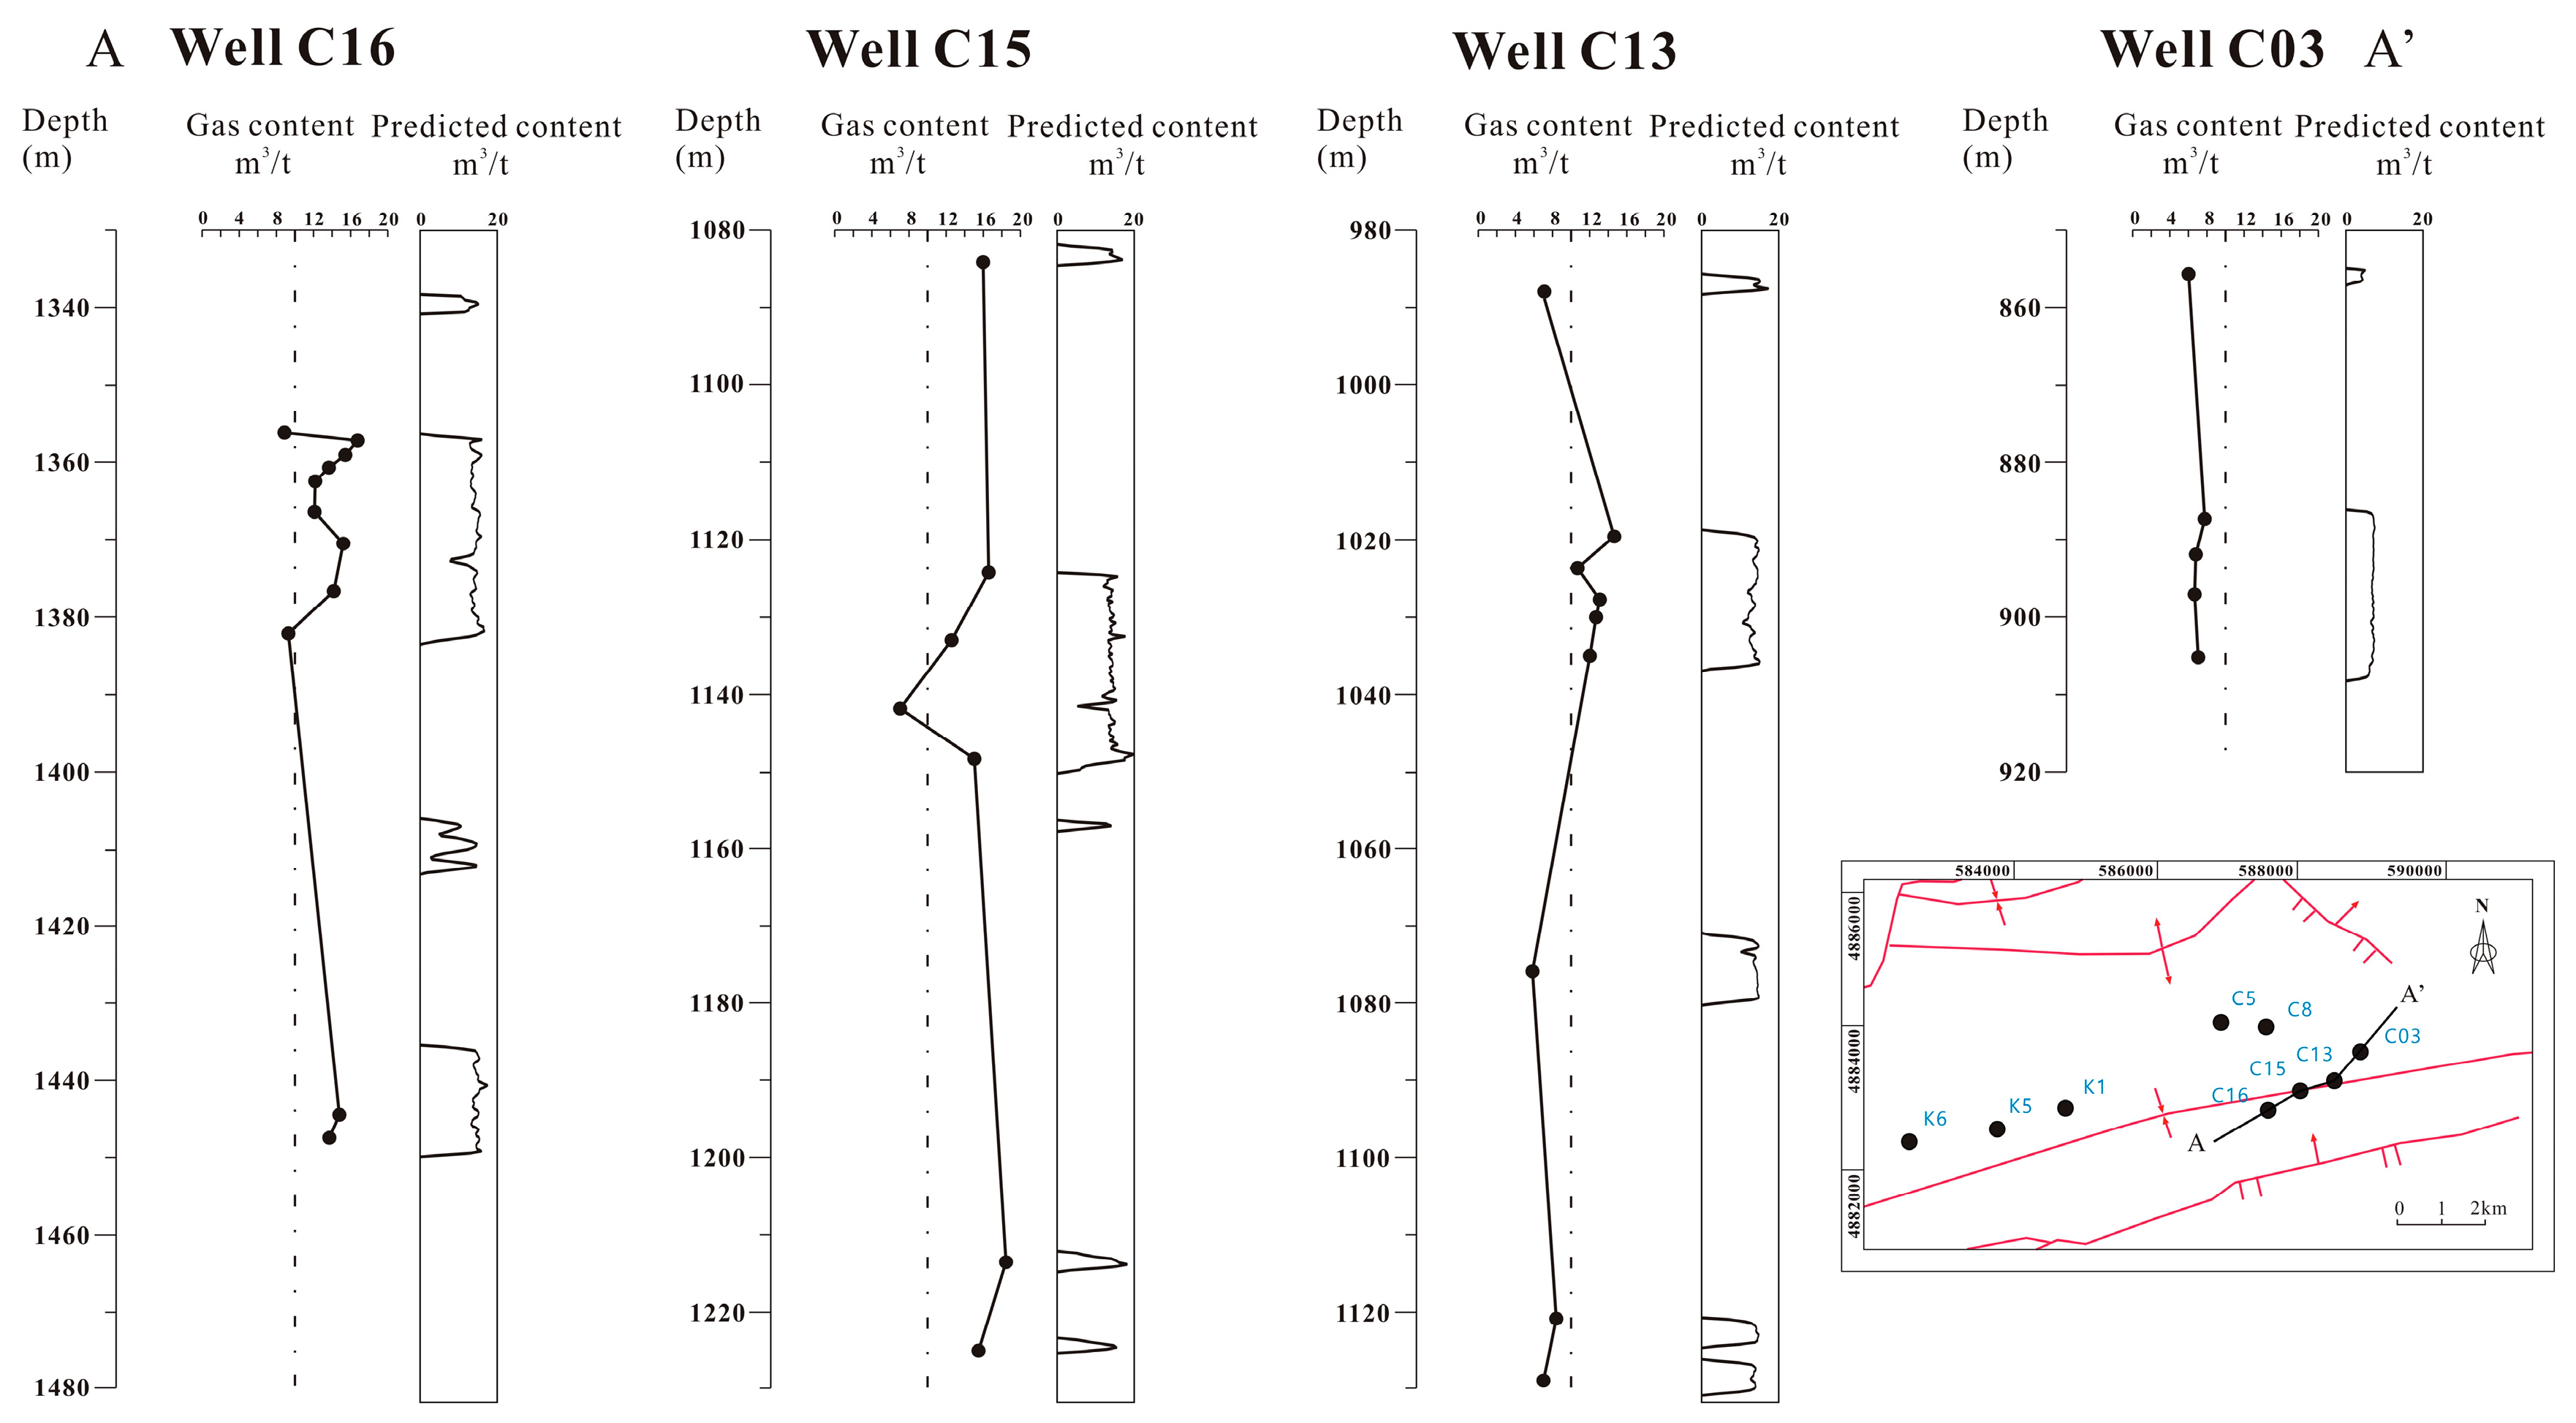
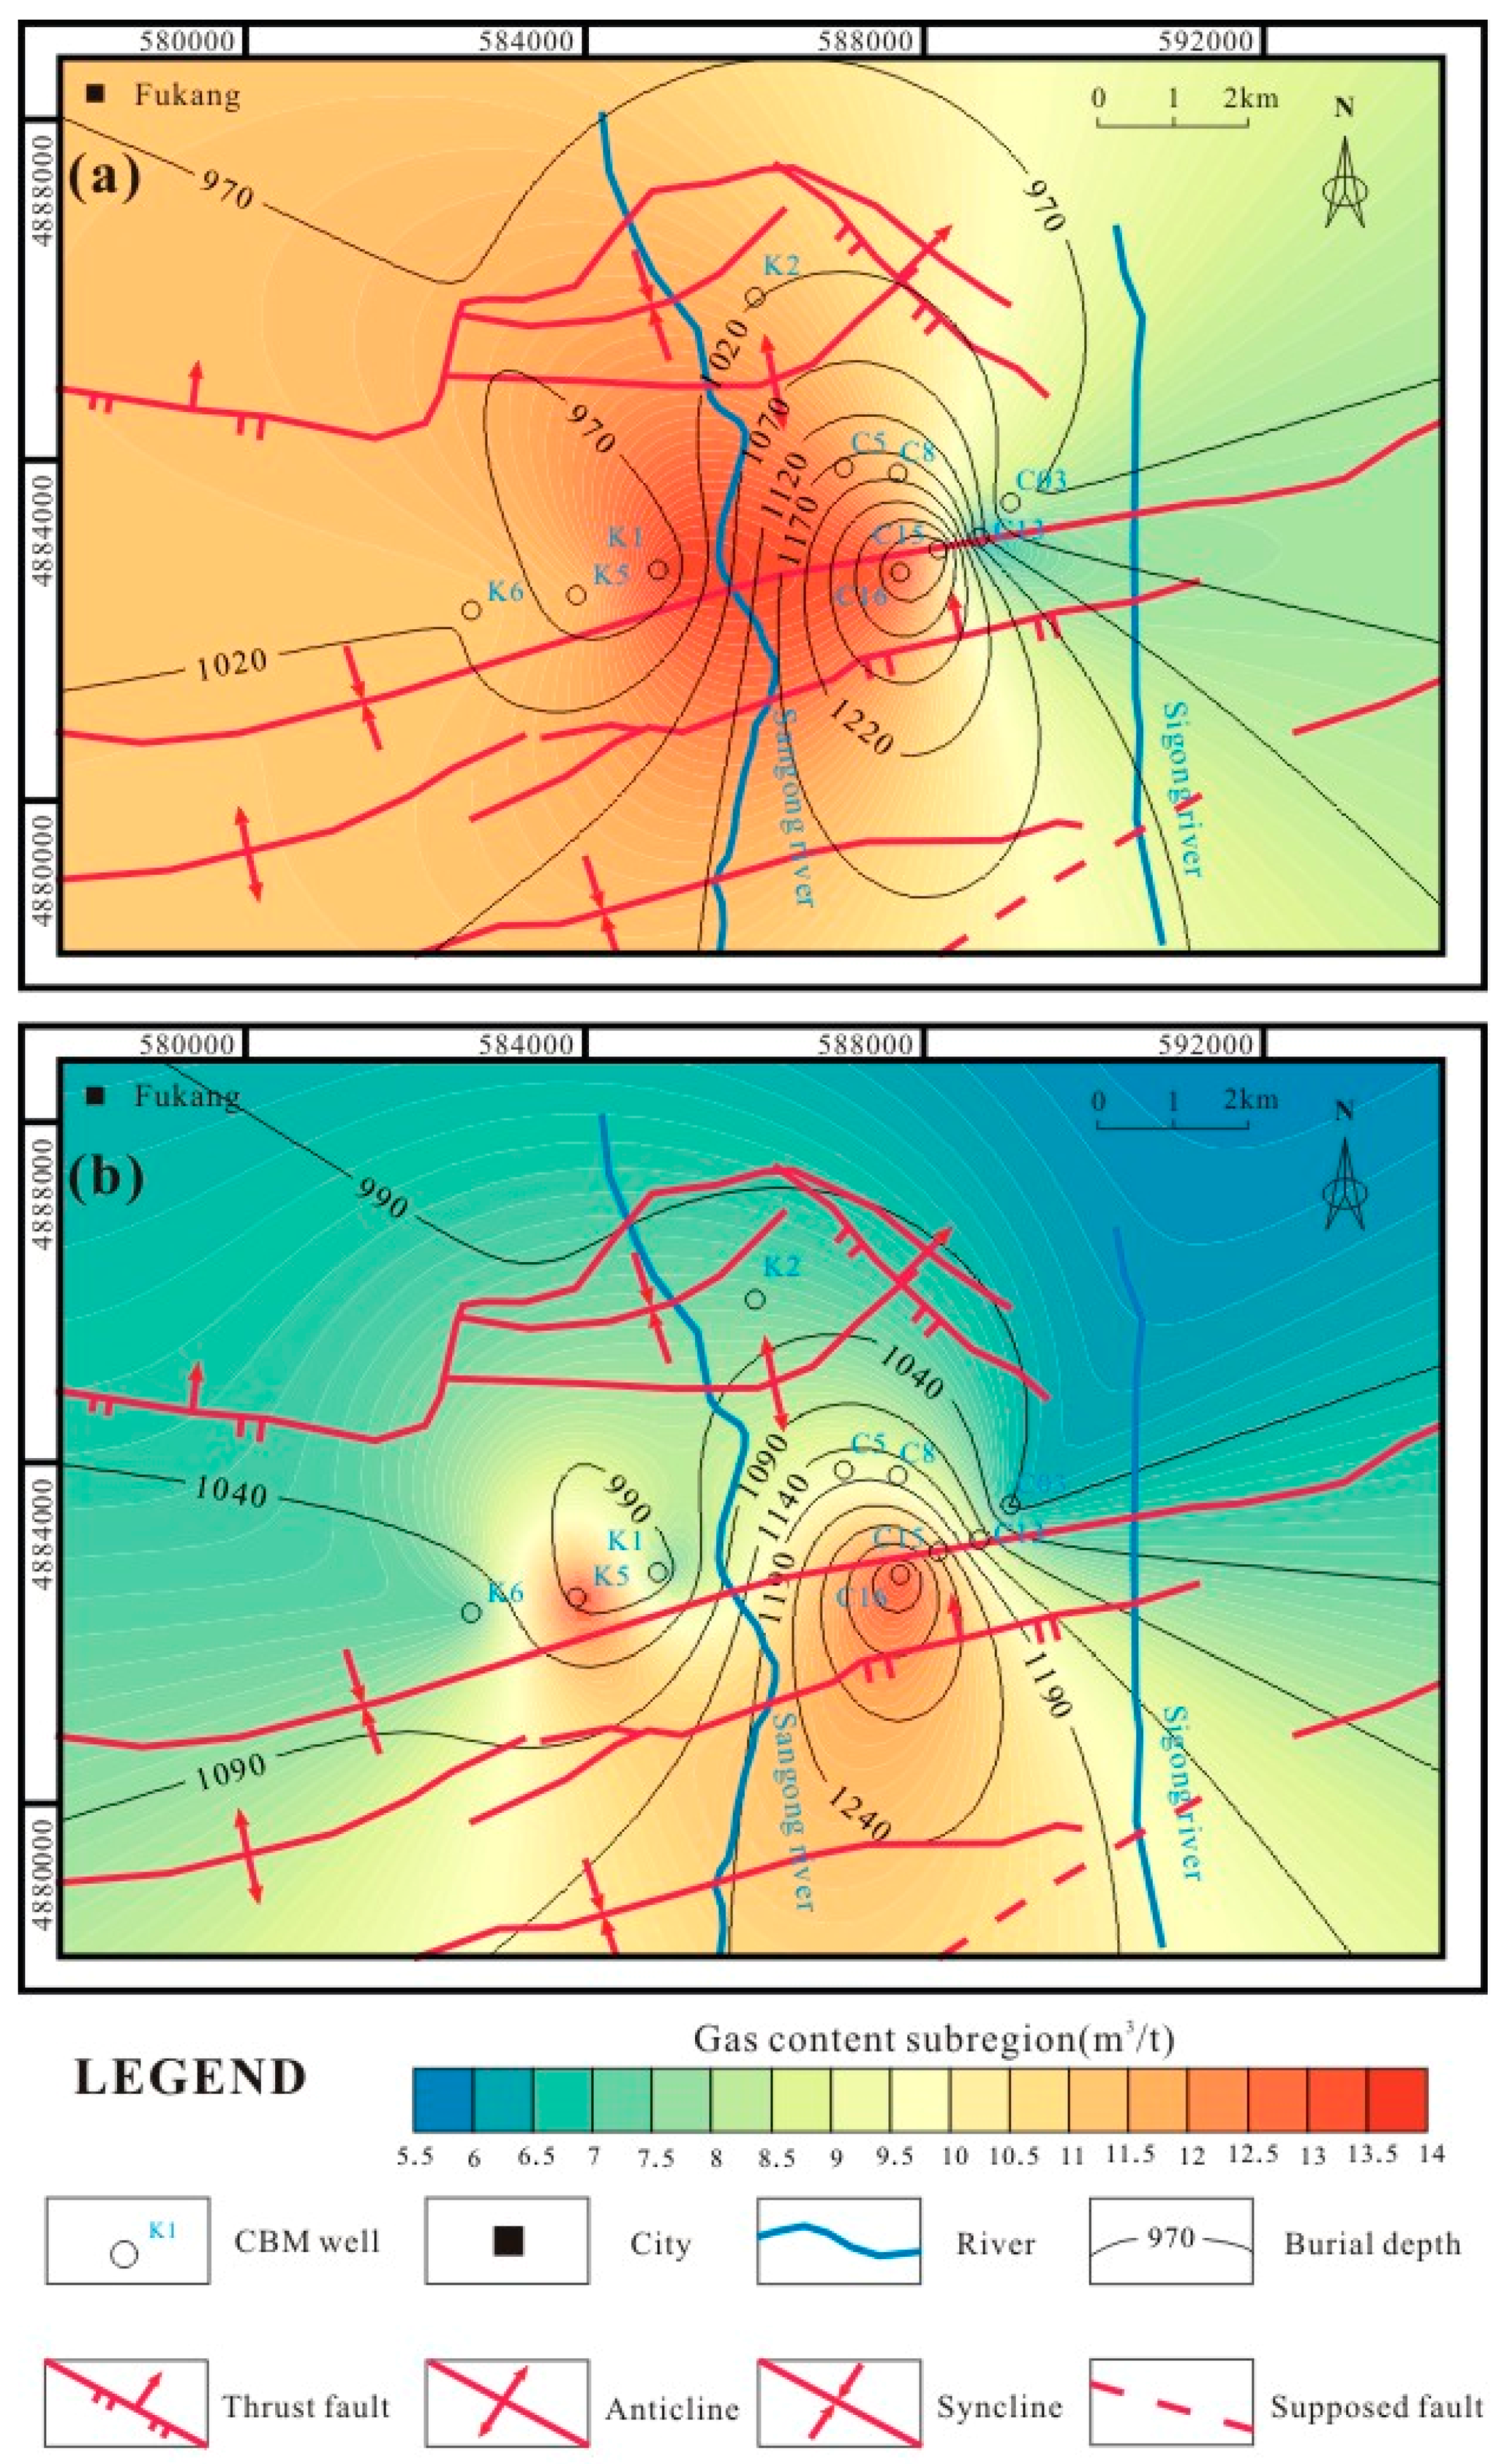
4.1. Gas Content Distribution
4.2. Geological Factors Affecting Gas Content
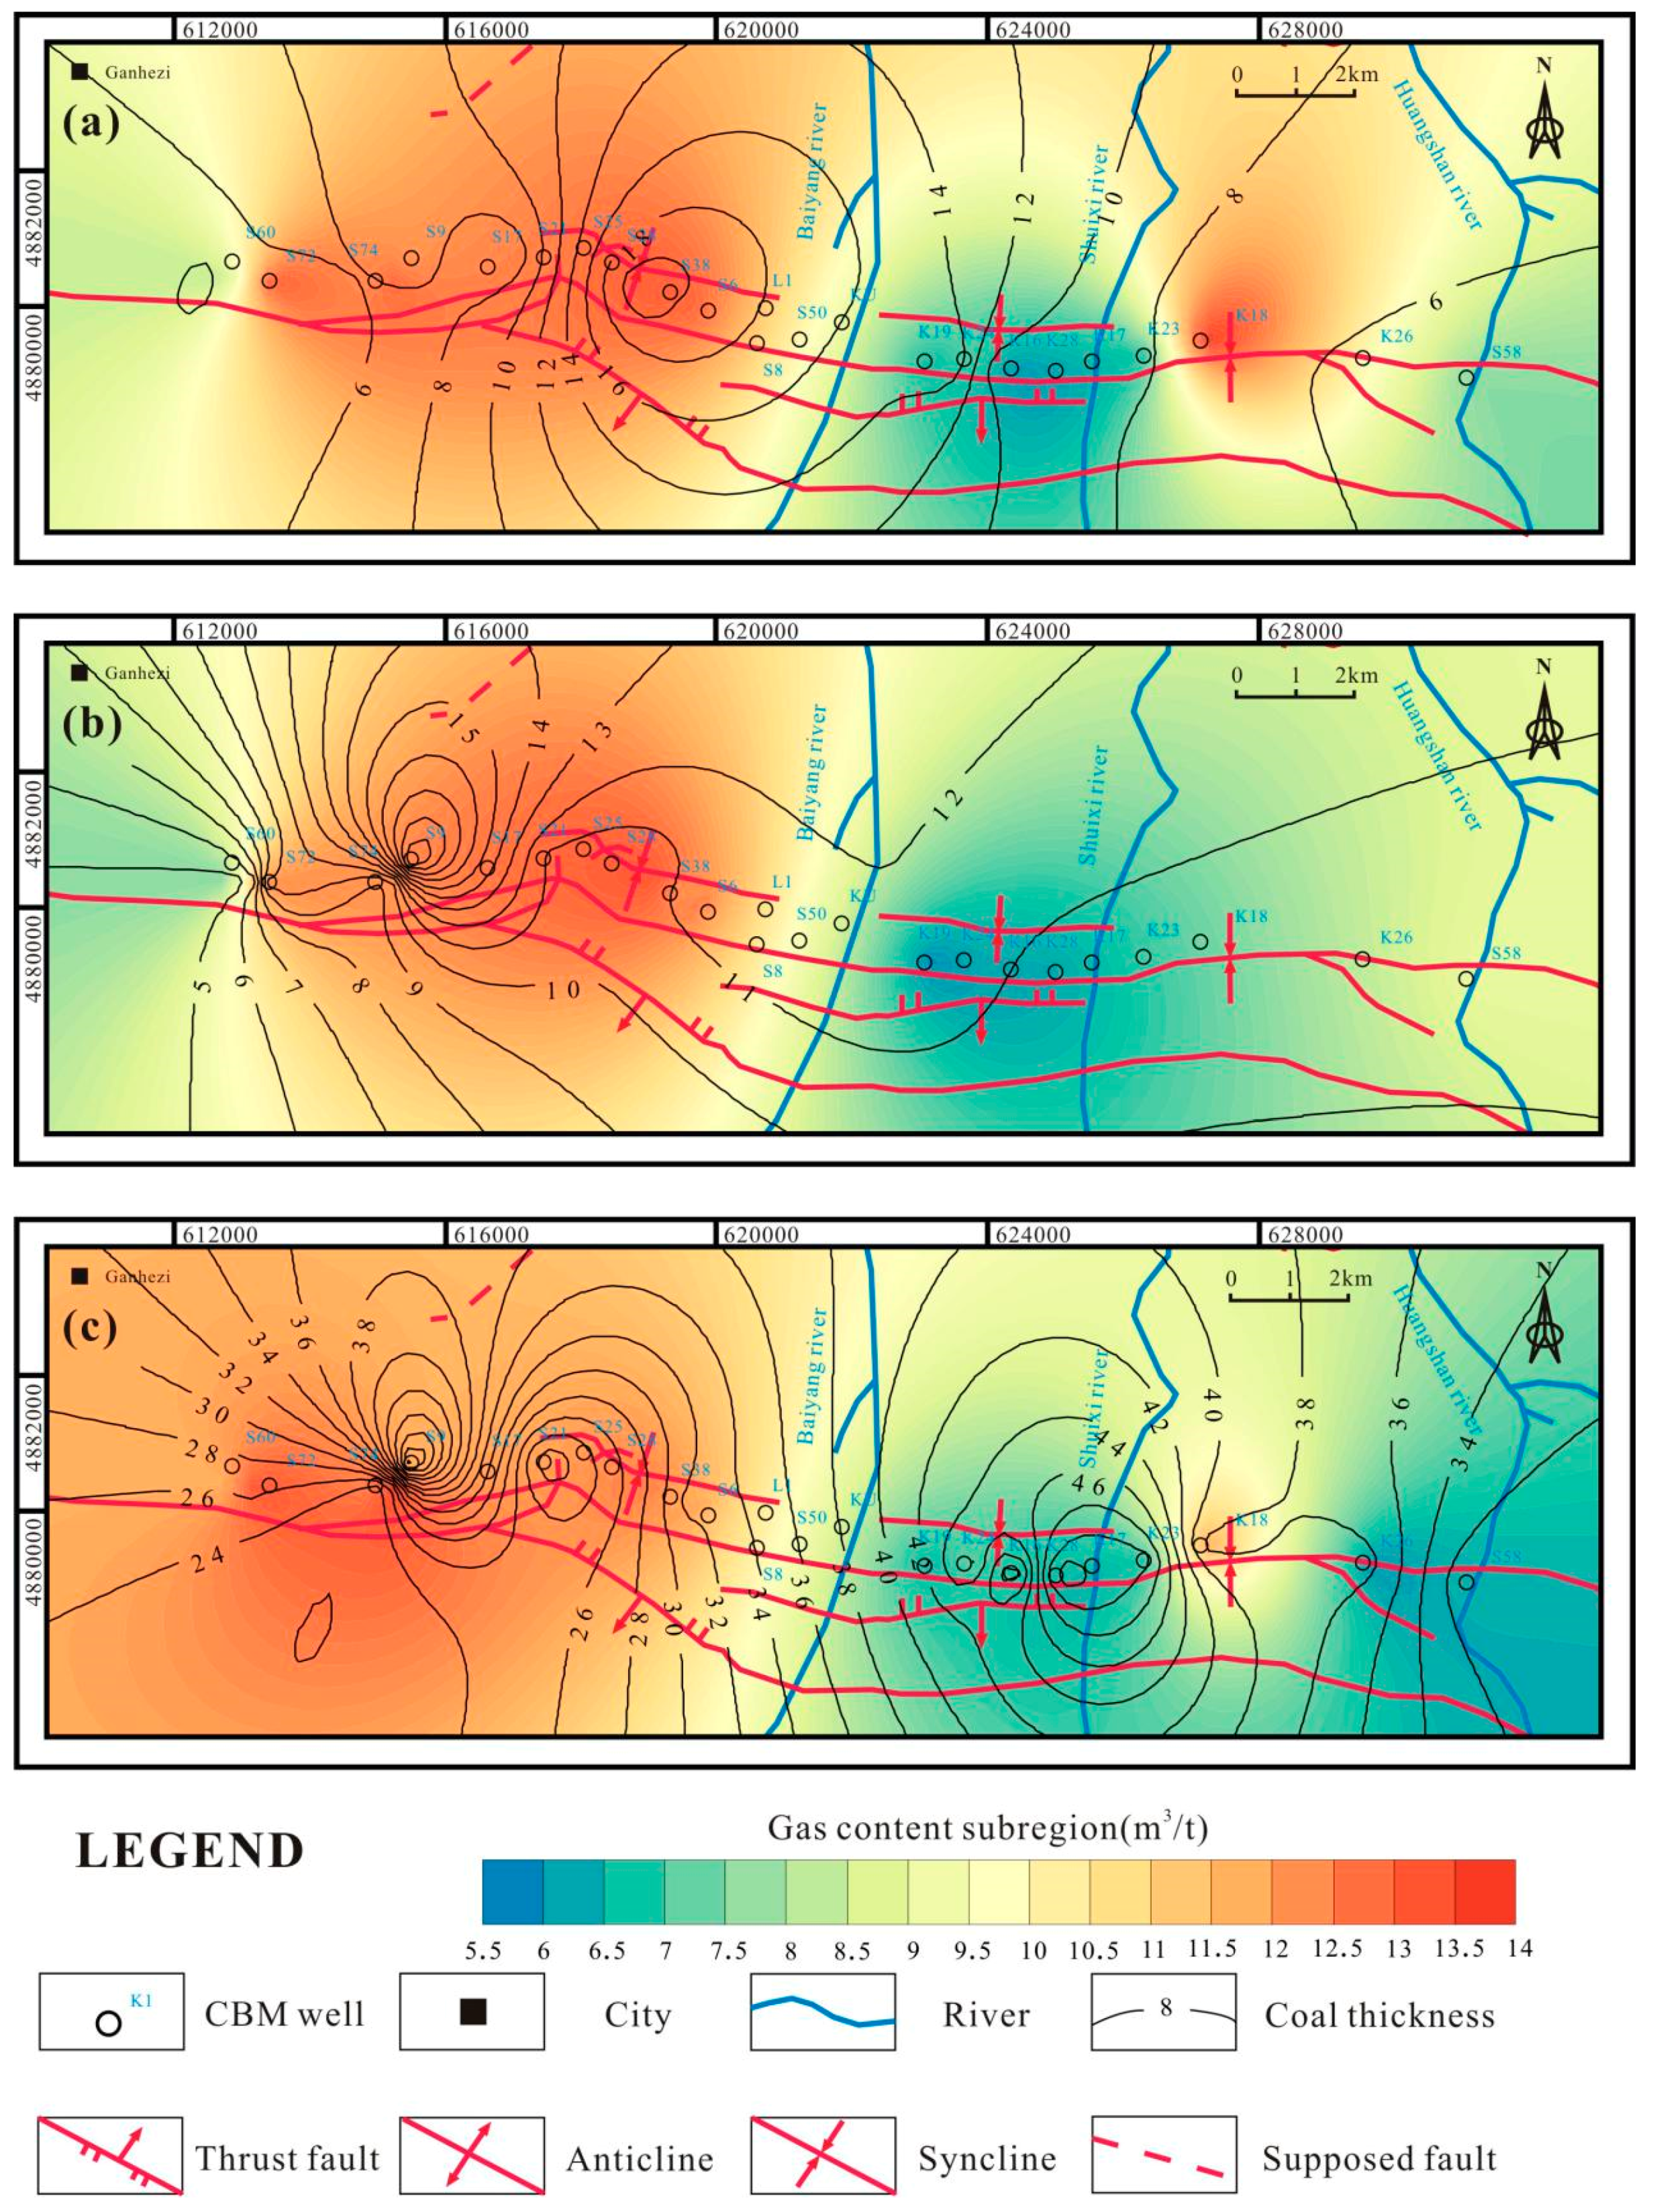
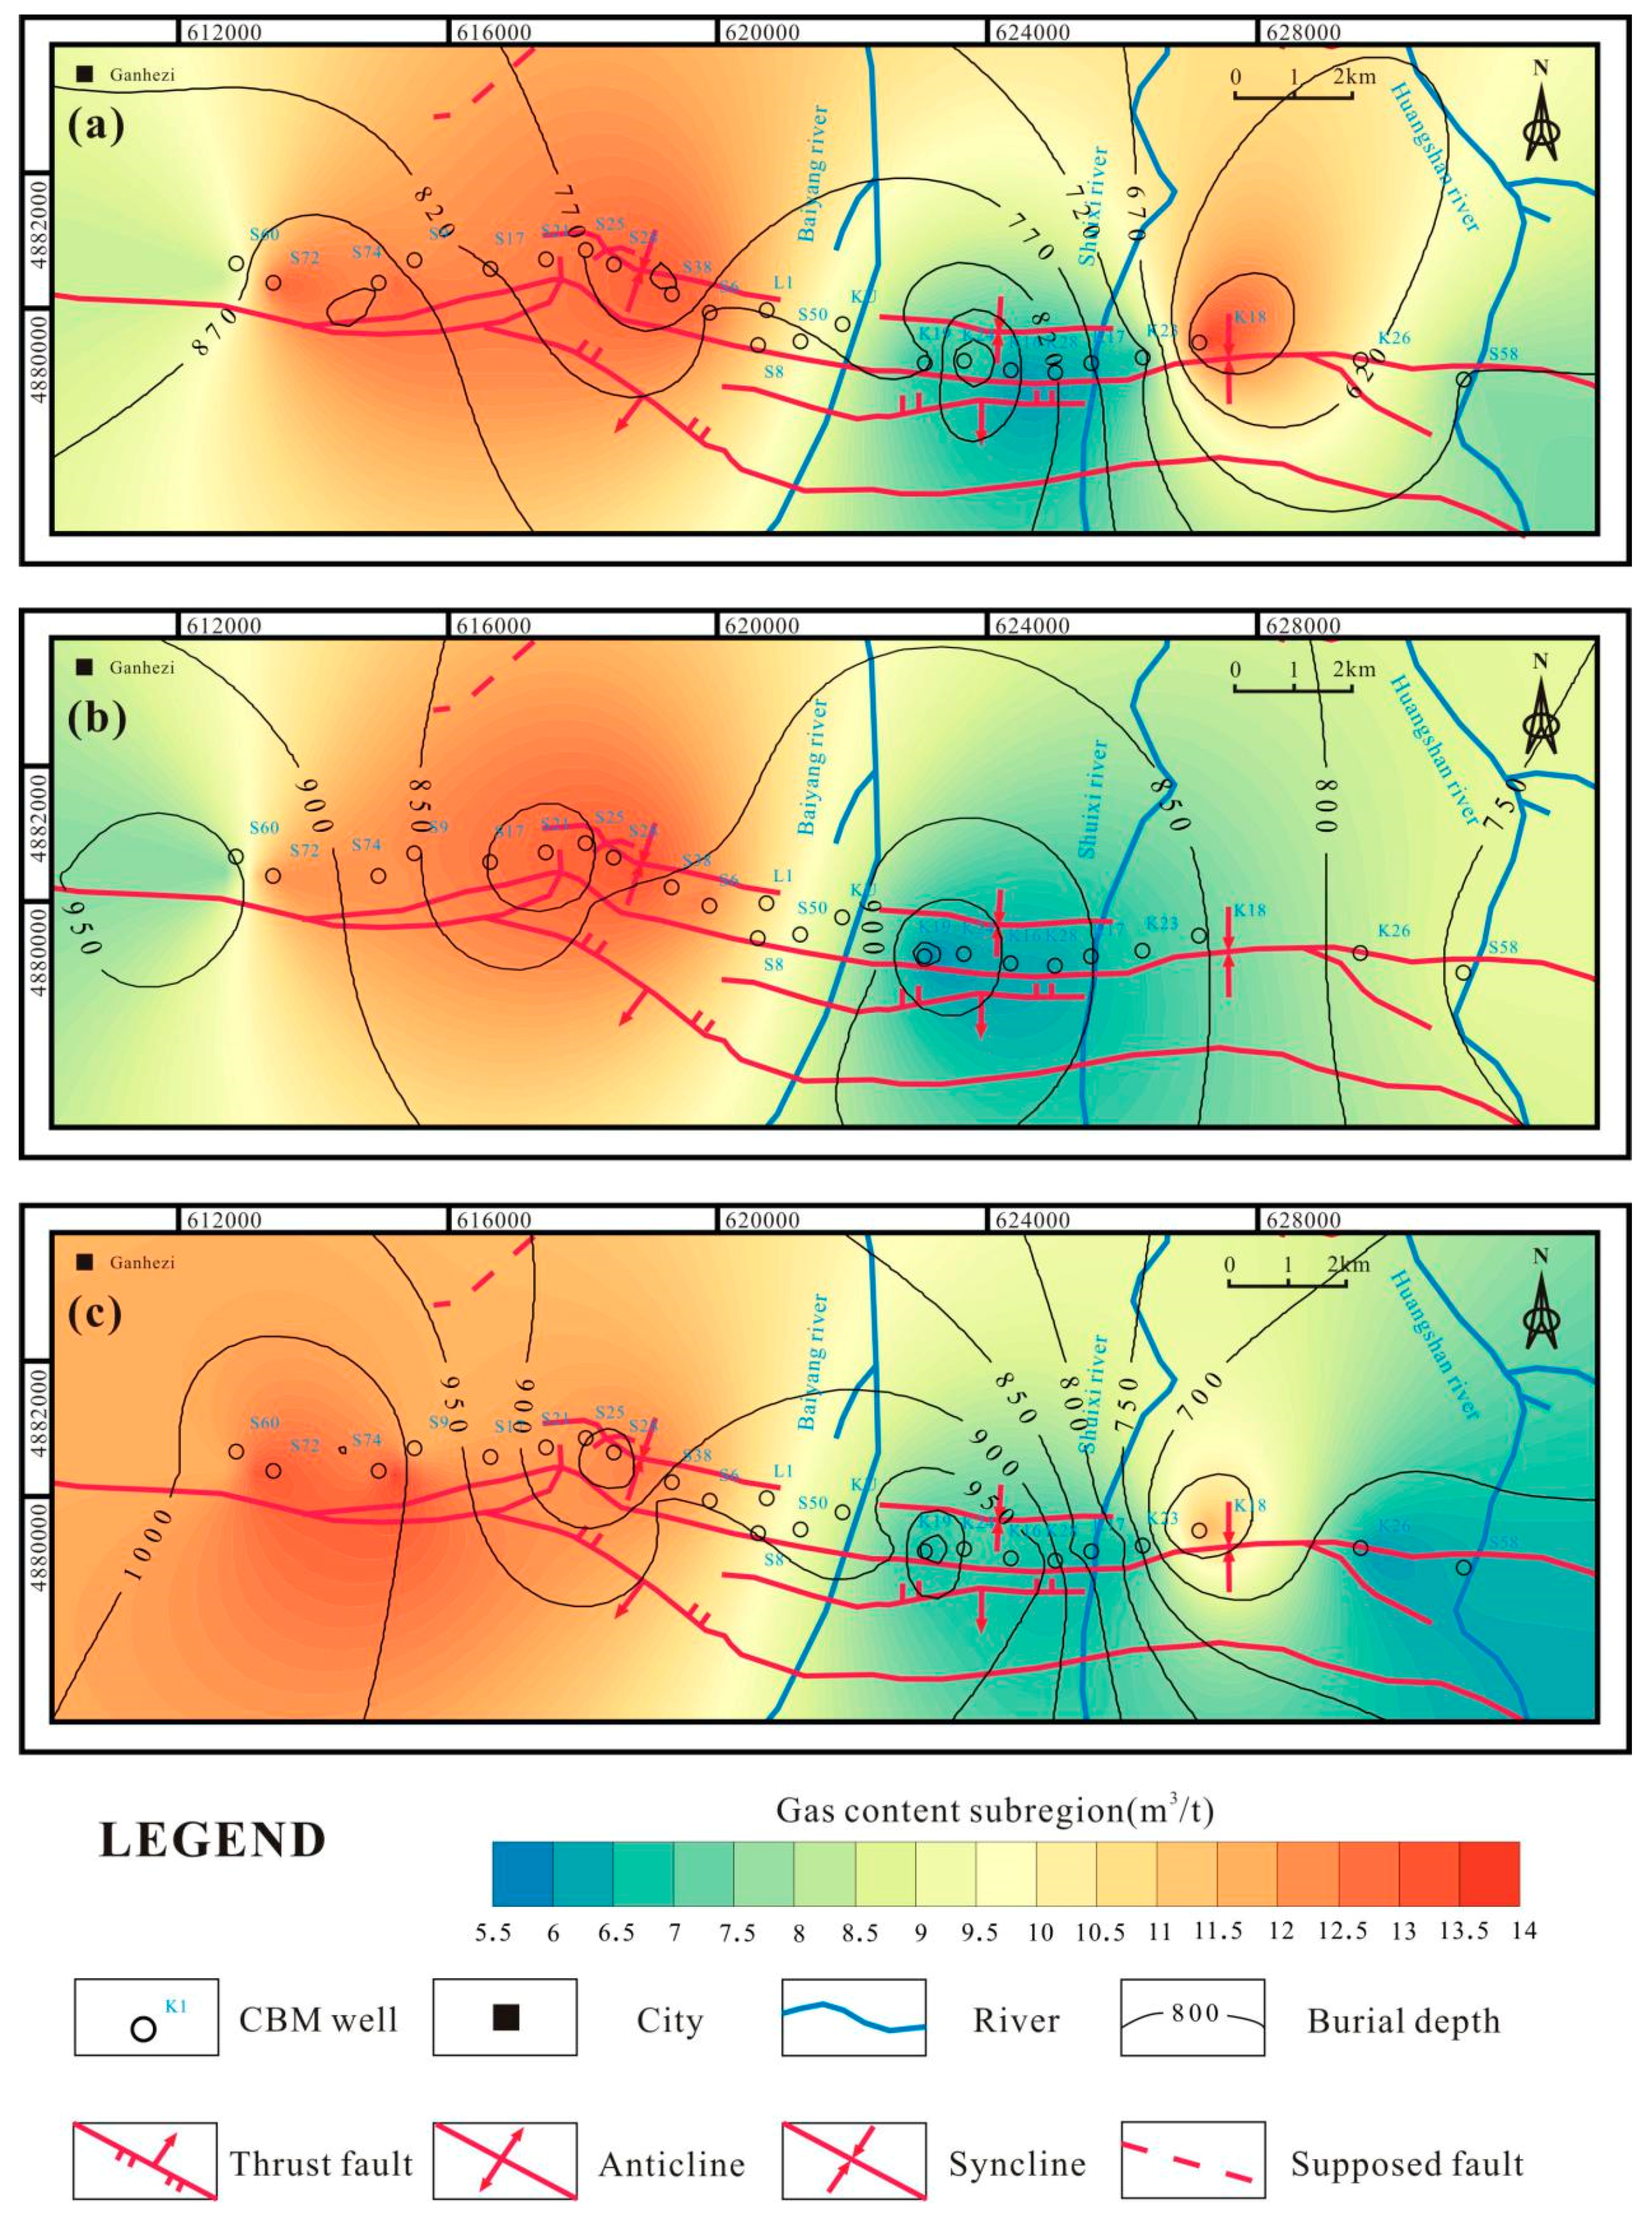
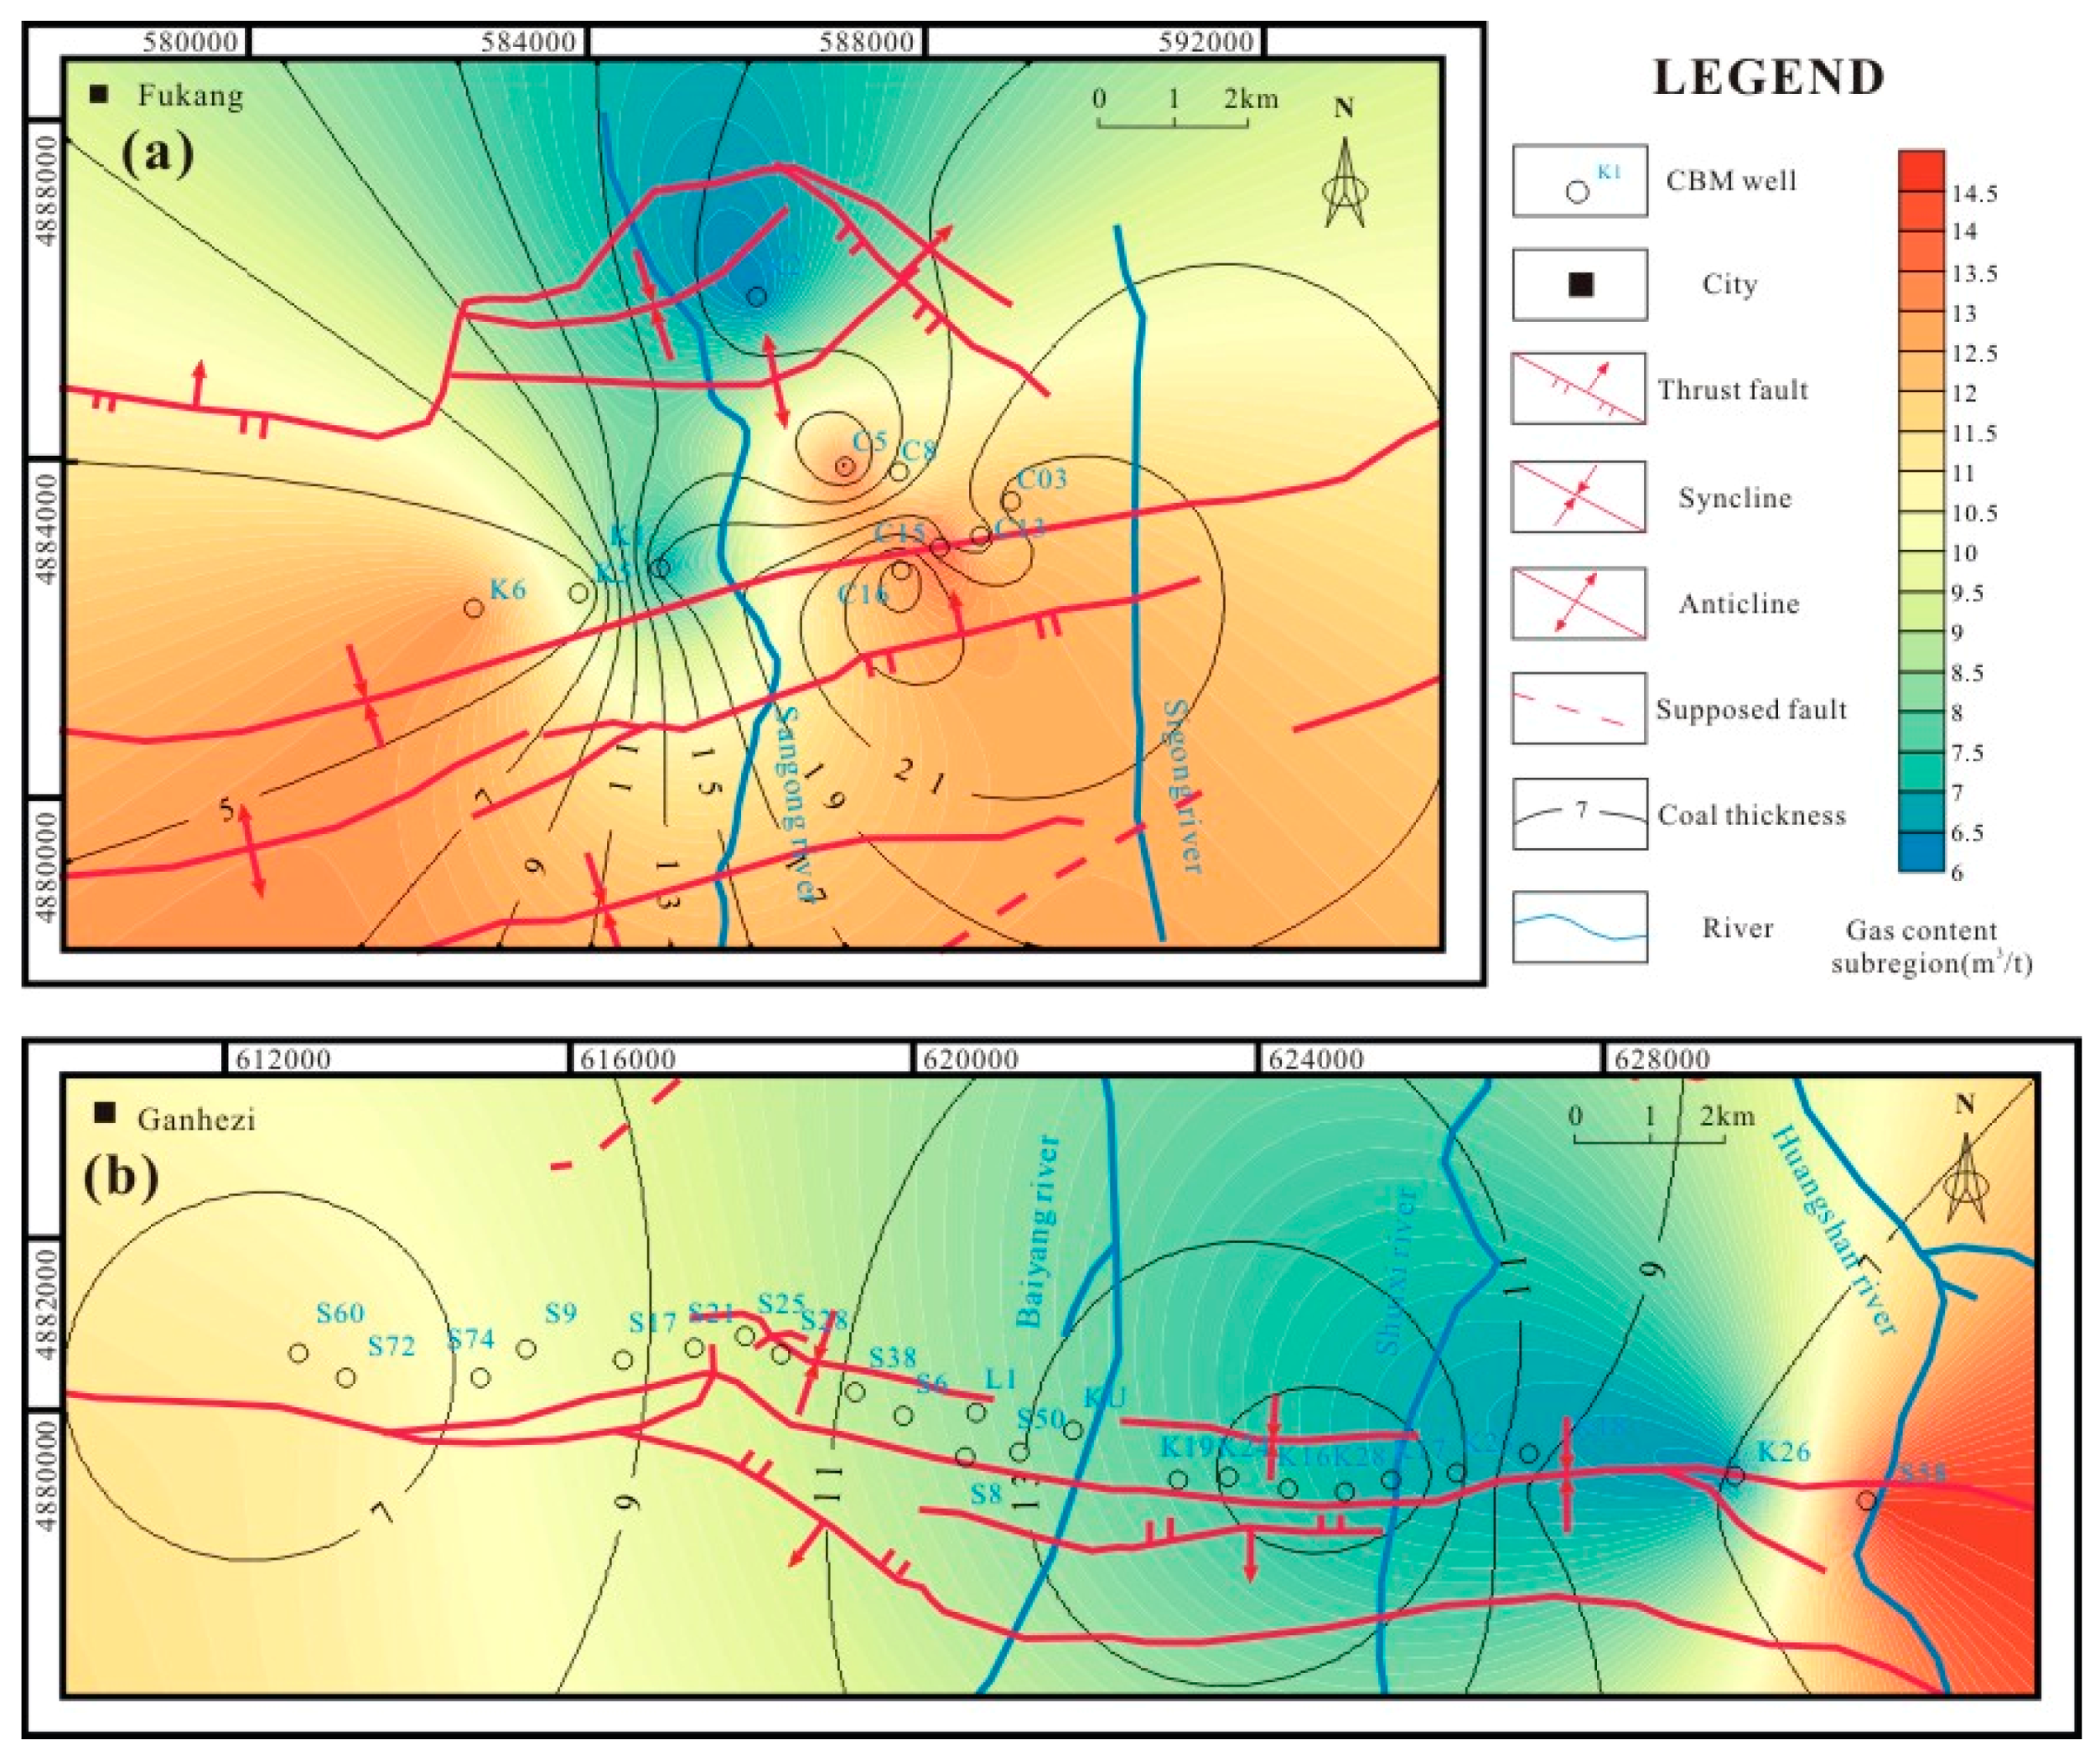
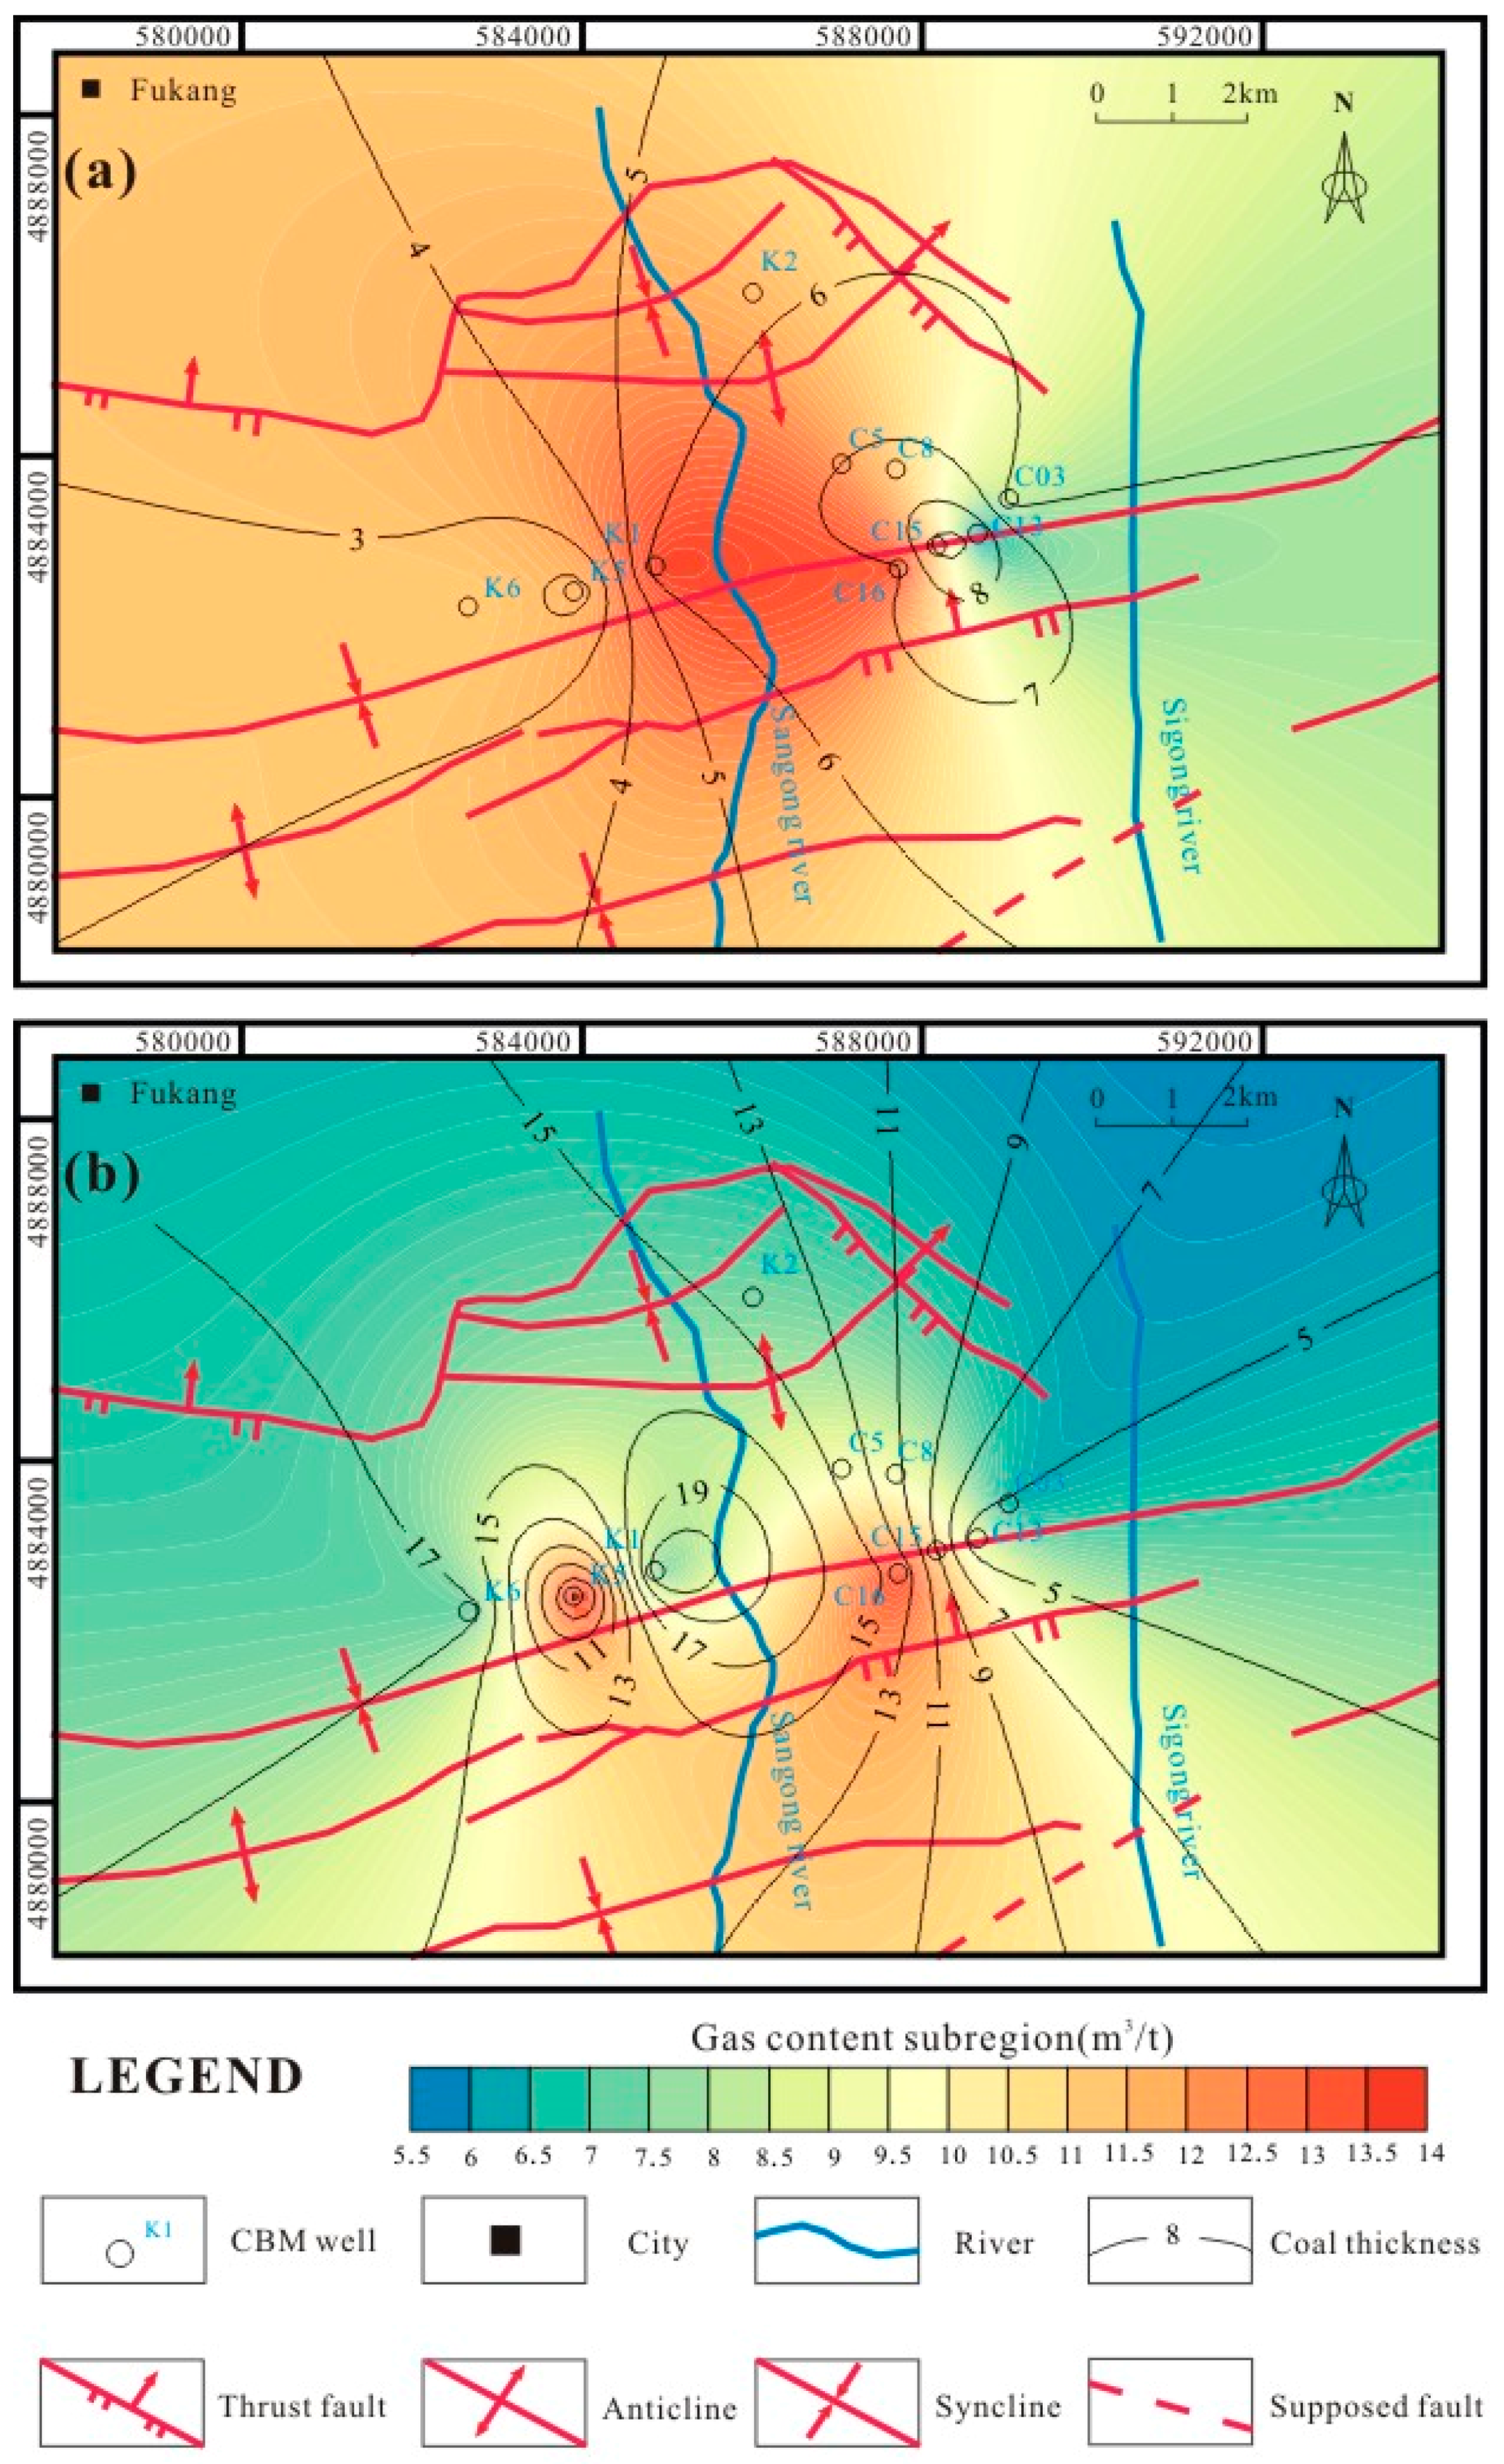
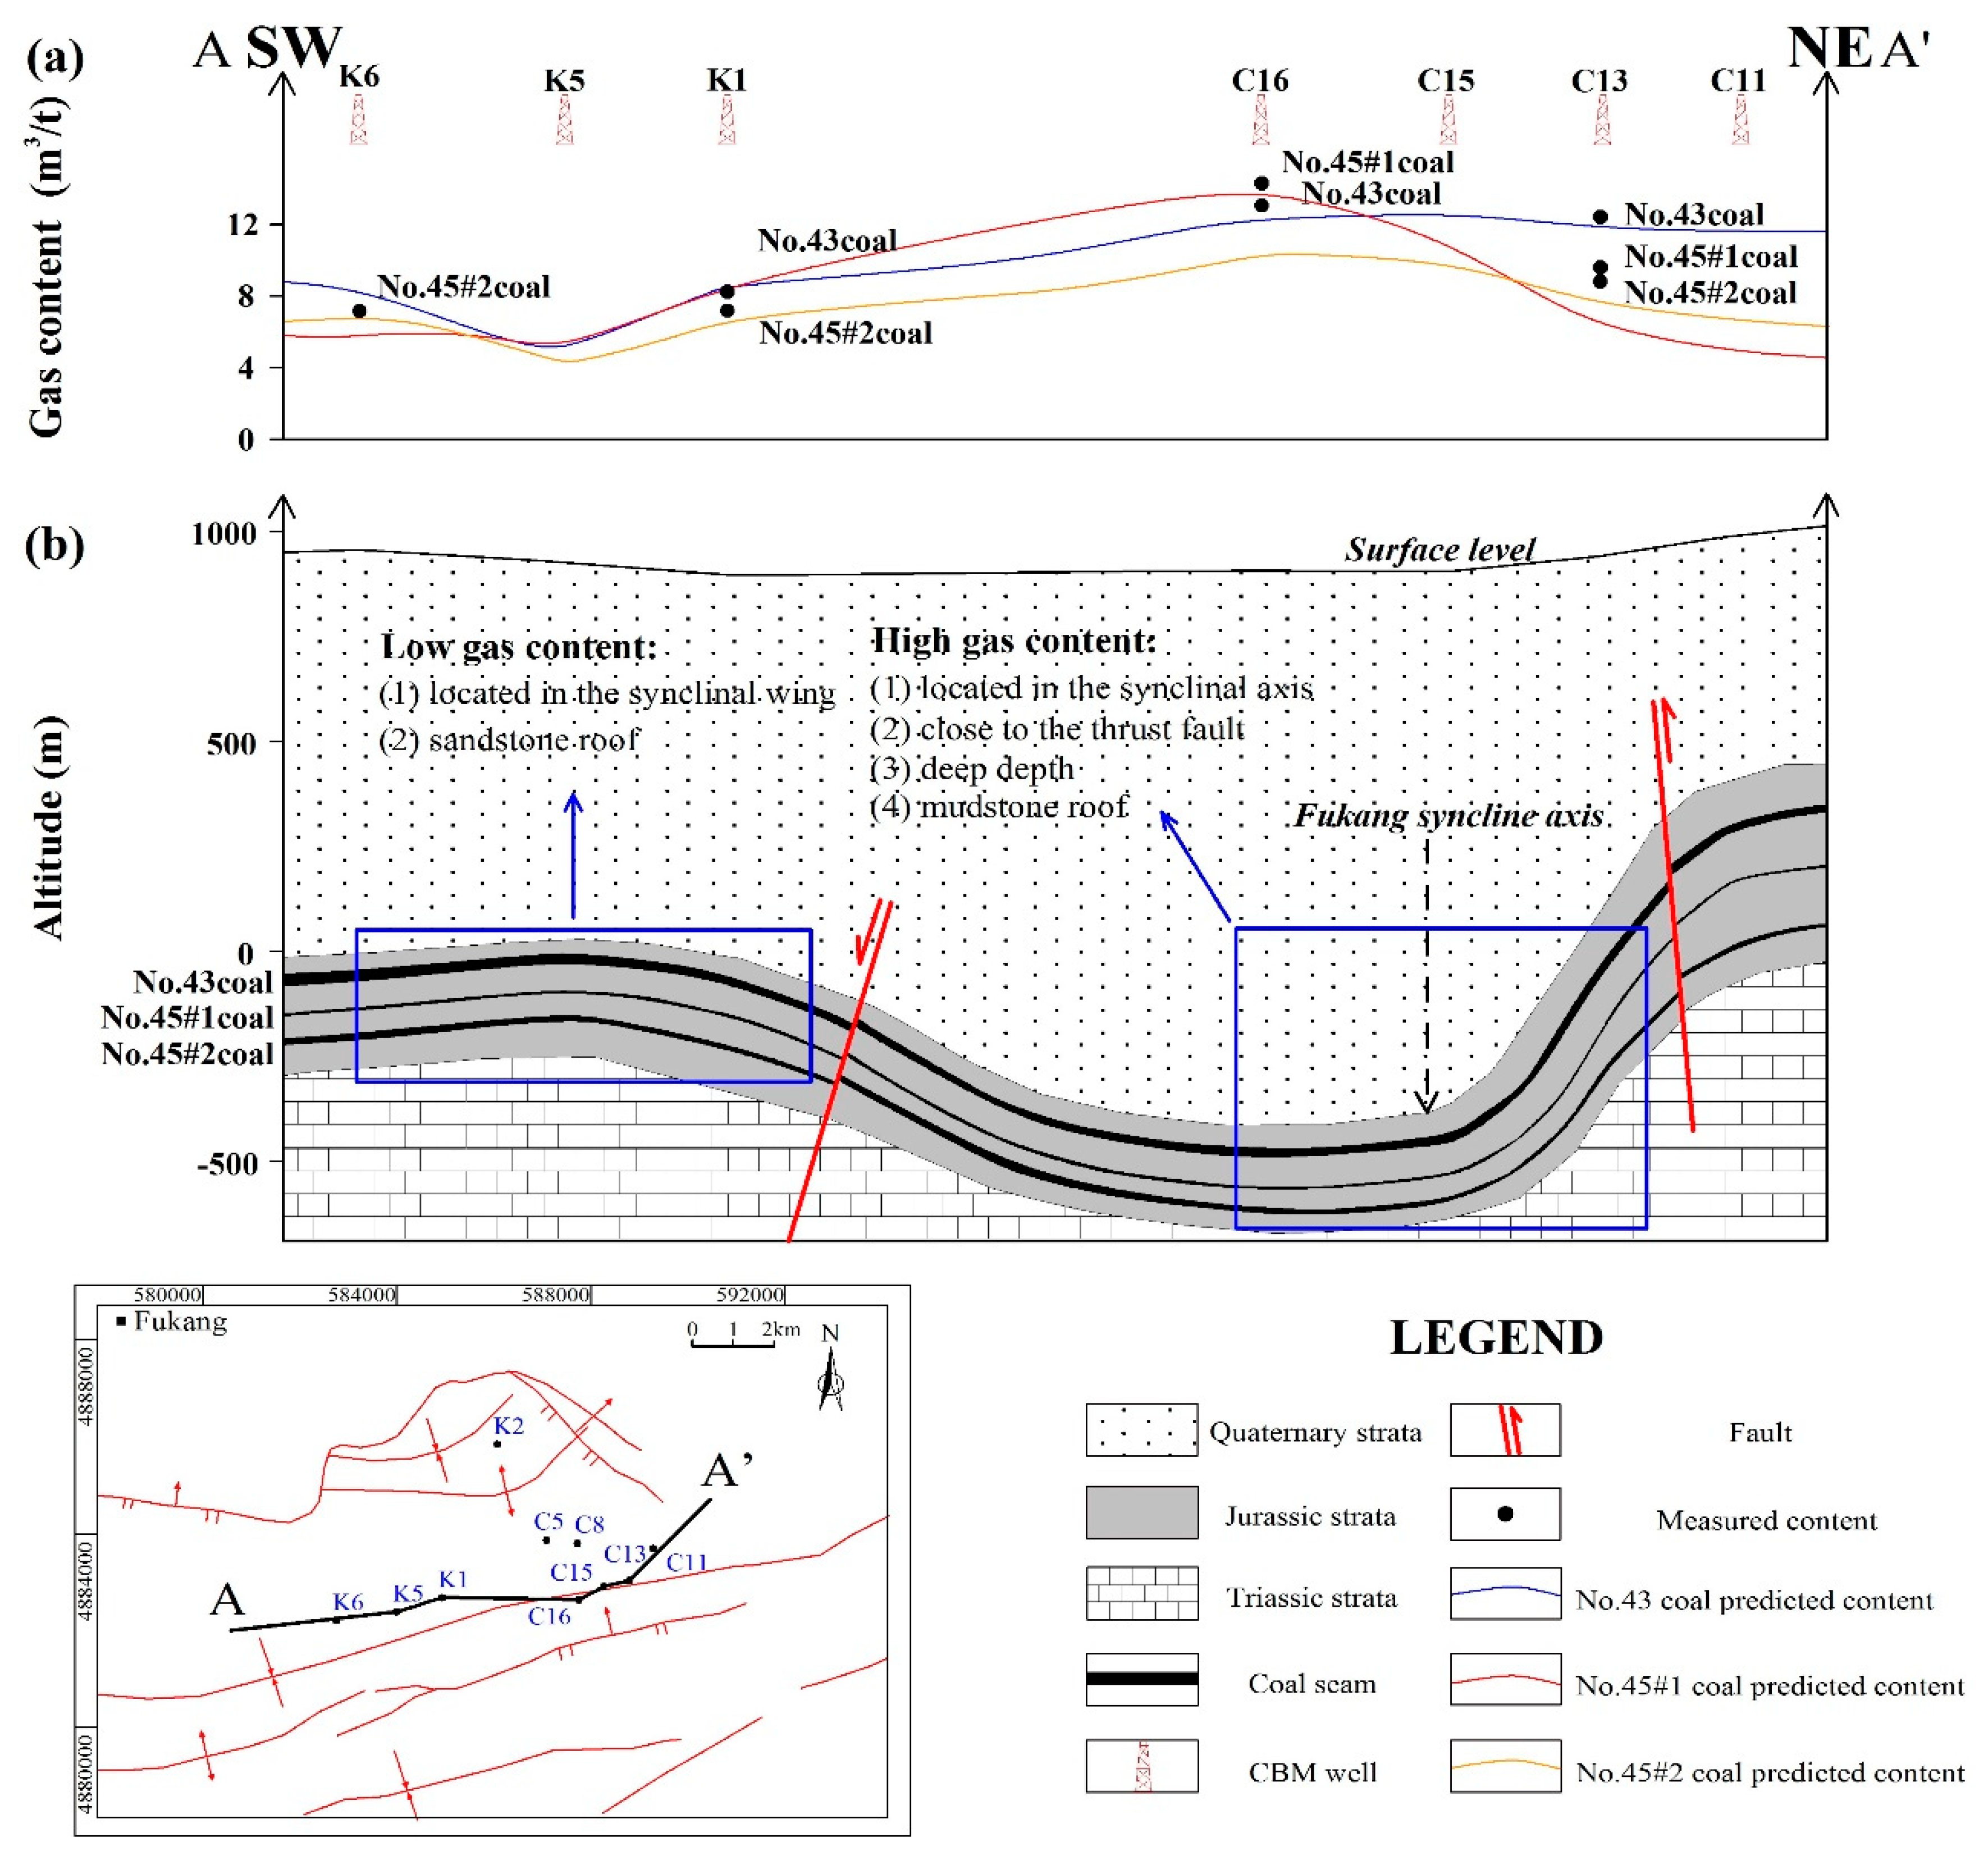
4.2.1. Geological Structure Controls
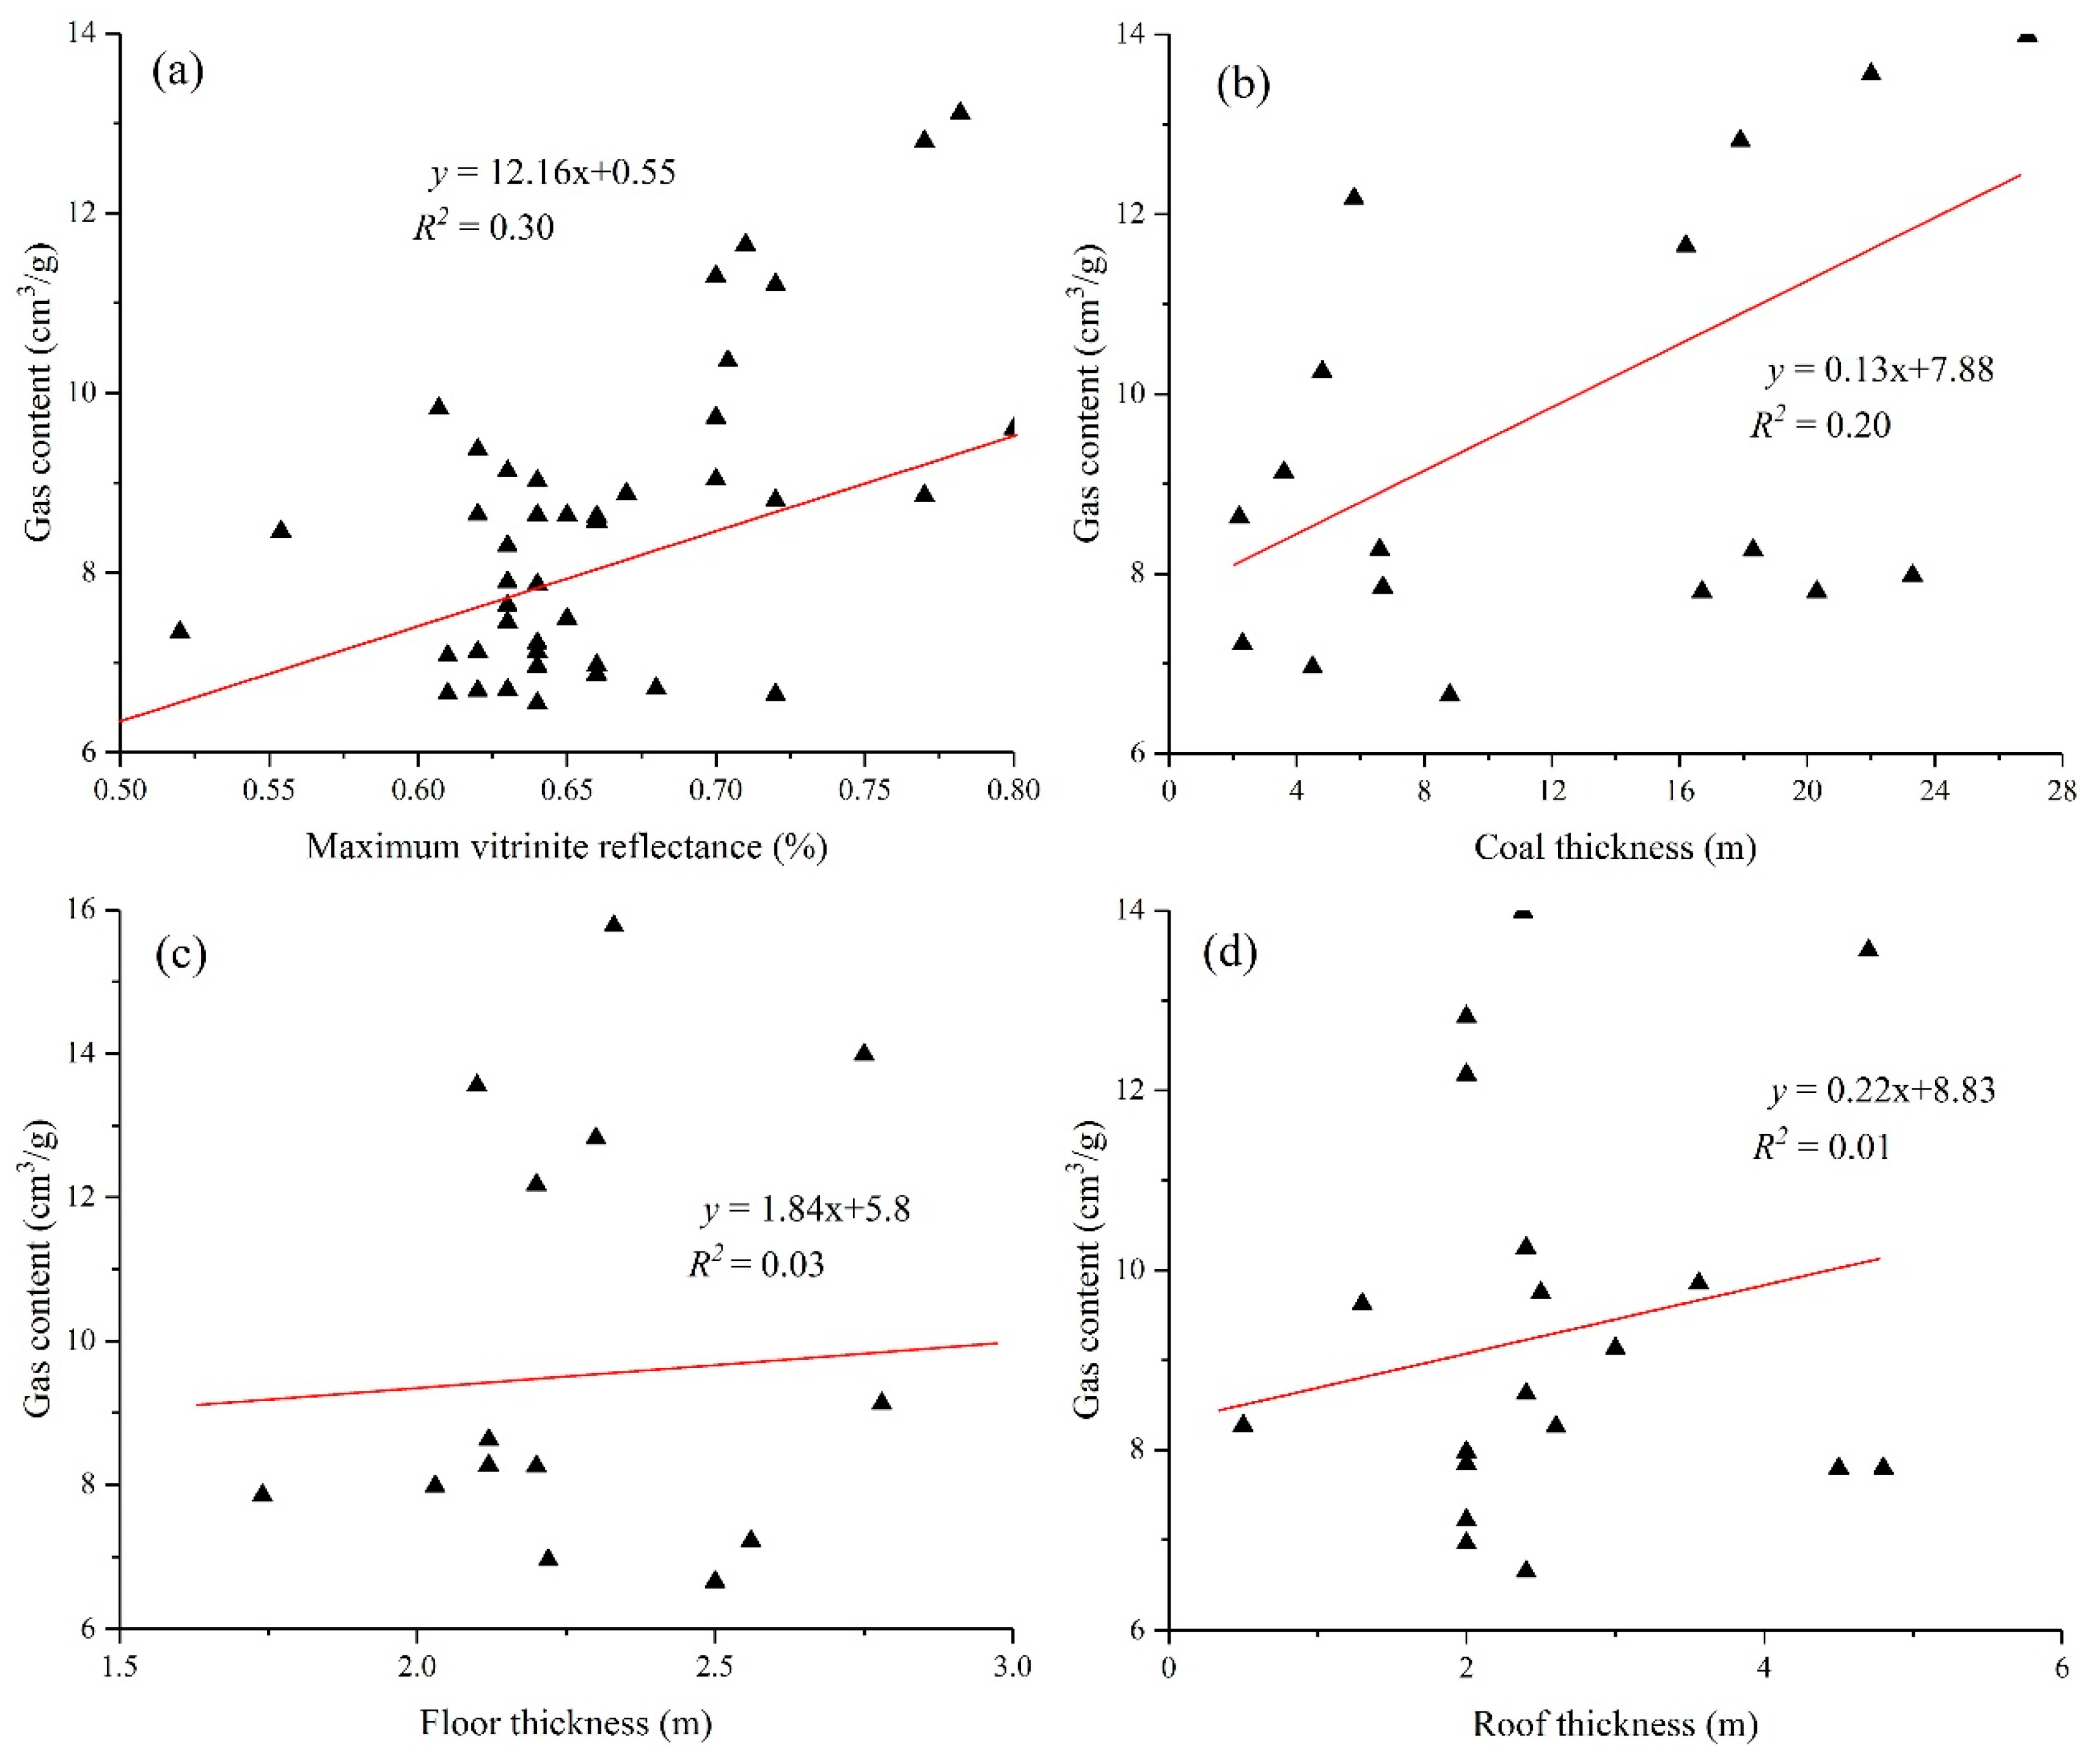
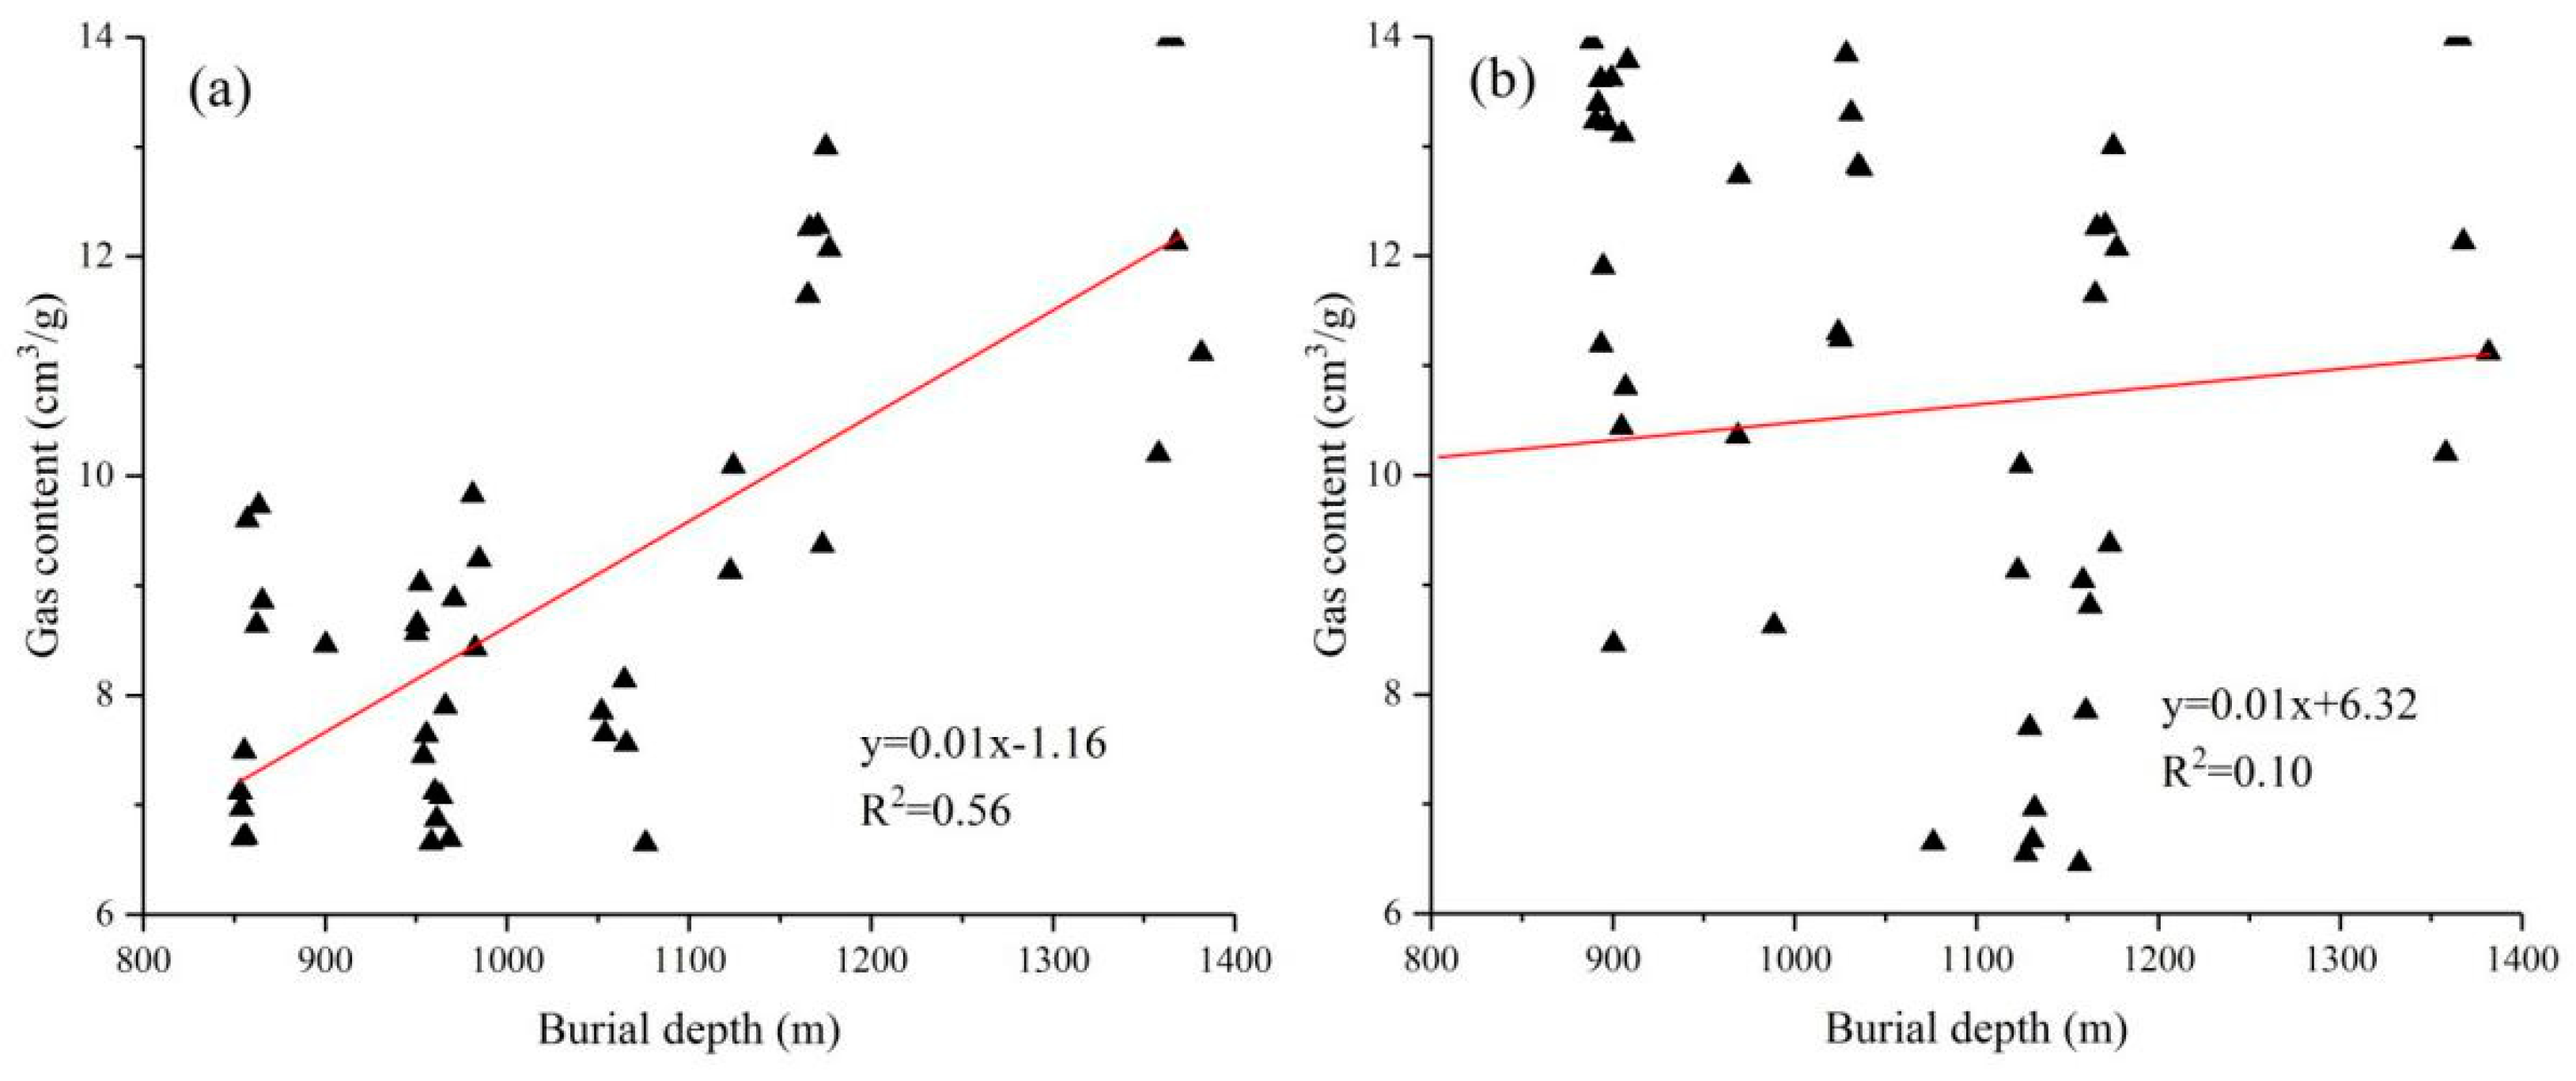
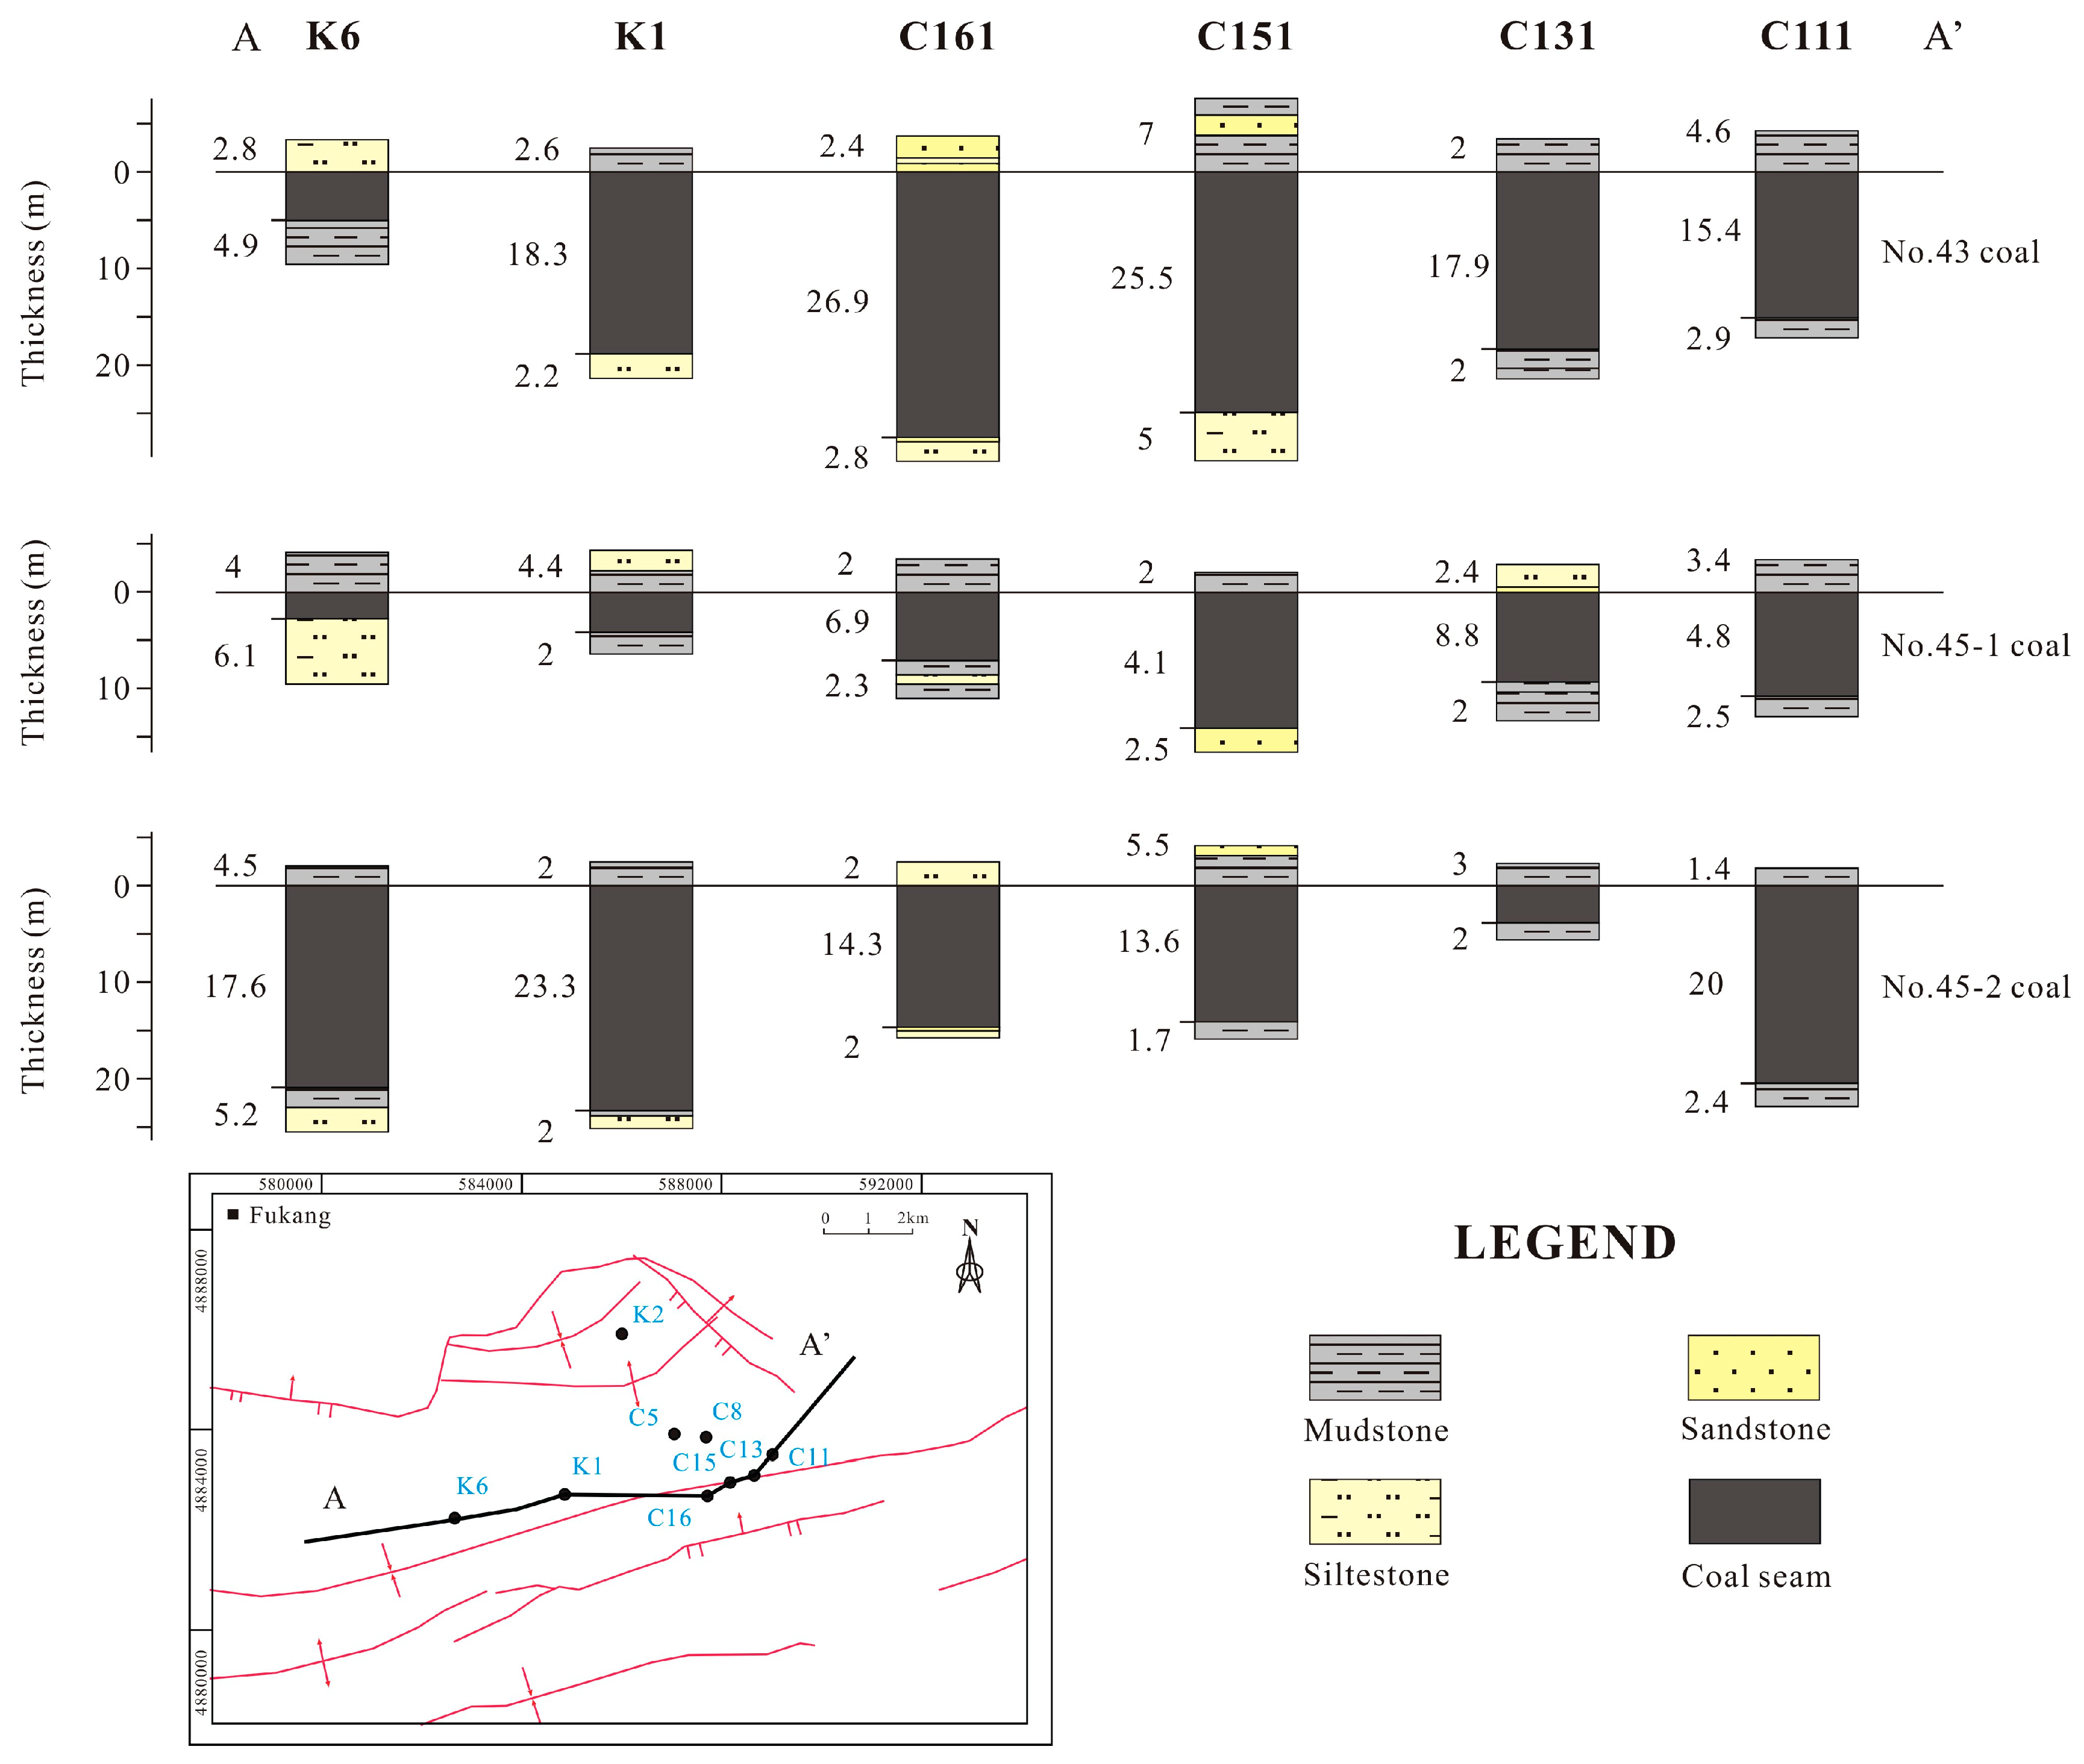
4.2.2. Coal Thickness and Burial Depth
4.2.3. Coal Metamorphism and Roof Lithology
4.3. Geological Controlling Scenarios of Gas Content
5. Conclusions
Author Contributions
Funding
Conflicts of Interest
References
- Liu, D.M.; Yao, Y.B.; Tang, D.Z.; Tang, S.H.; Che, Y. Coal reservoir characteristics and coalbed methane resource assessment in Huainan and Huaibei coalfields, Southern North China. Int. J. Coal Geol. 2009, 79, 97–112. [Google Scholar] [CrossRef]
- Yao, Y.B.; Liu, D.M.; Tang, D.Z. A comprehensive model for evaluating coalbed methane reservoir in China. J. Geol. Sci. China 2008, 82, 1253–1270. [Google Scholar]
- Yao, Y.B.; Liu, D.M.; Tang, D.Z. Preliminary evaluation of the coalbed methane production potential and its geological controls in the Weibei Coalfield, Southeastern Ordos Basin, China. Int. J. Coal Geol. 2009, 78, 1–15. [Google Scholar] [CrossRef]
- Fu, H.J.; Tang, D.Z.; Xu, T.; Xu, H.; Tao, S.; Li, S.; Yin, Z.Y.; Chen, B.L.; Zhang, C.; Wang, L.L. Characteristics of pore structure and fractal dimension of low-rank coal: A case study of Lower Jurassic Xishanyao coal in the southern Junggar Basin, NW China. Fuel 2017, 193, 254–264. [Google Scholar] [CrossRef]
- Zhang, J.Y.; Liu, D.M.; Cai, Y.D.; Pan, Z.J.; Yao, Y.B.; Wang, Y.J. Geological and hydrological controls on the accumulation of coalbed methane within the No. 3 coal seam of the southern Qinshui Basin. Int. J. Coal Geol. 2017, 182, 94–111. [Google Scholar] [CrossRef]
- Karacan, C.Ö.; Ulery, J.P.; Goodman, G.V.R. A numerical evaluation on the effects of impermeable faults on degasification efficiency and methane emissions during underground coal mining. Int. J. Coal Geol. 2008, 75, 195–203. [Google Scholar] [CrossRef]
- Cai, Y.D.; Liu, D.M.; Yao, Y.B.; Li, J.Q.; Qiu, Y.K. Geological controls on prediction of coalbed methane of No.3 coal seam in Southern Qinshui Basin, North China. Int. J. Coal Geol. 2011, 88, 101–112. [Google Scholar] [CrossRef]
- Pashin, J.C.; Mcintyre-Redden, M.R.; Mann, S.D.; Kopaska-Merkel, D.C.; Varonka, M.; Orem, W. Relationships between water and gas chemistry in mature coalbed methane reservoirs of the Black Warrior Basin. Int. J. Coal Geol. 2013, 126, 92–105. [Google Scholar] [CrossRef]
- Li, Z.T.; Liu, D.M.; Ranjith, P.G. Geological controls on variable gas concentrations: A case study of the northern Gujiao Block, northwestern Qinshui Basin, China. Mar. Petrol. Geol. 2017, 2, 1–15. [Google Scholar] [CrossRef]
- Zou, Z.; Liu, D.M.; Cai, Y.D.; Wang, Y.J.; Li, J.P. Geological Factors and Reservoir Properties Affecting the Gas Content of Coal Seams in the Gujiao Area, Northwest Qinshui Basin, China. Energies 2018, 11, 1044. [Google Scholar] [CrossRef]
- Zhao, J.L.; Tang, D.Z.; Xu, H.; Lu, Y.M.; Tao, S. High production indexes and the key factors in coalbed methane production: A case in the Hancheng block, southeastern Ordos Basin, China. J. Petrol. Sci. Eng. 2015, 130, 55–67. [Google Scholar] [CrossRef]
- Yu, F.S.; Li, X.J.; Li, D.H.; Feng, Z.C.; Li, X.L. Simulation for the Controlling Factors of Structural Deformation in the Southern Margin of the Junggar Basin. Acta Geol. Sin-Engl. 2012, 86, 842–853. [Google Scholar]
- Estimating Methane Content of Bituminous Coalbeds from Adsorption Data. Available online: https://www.cdc.gov/niosh/mining/works/coversheet217.html (accessed on 11 July 2018).
- Hawkins, J.M.; Schraufnagel, R.A.; Olszewsk, A.J. Estimating coalbed gas content and sorption isotherm using well log data. In Proceedings of the SPE Annual Technical Conference and Exhibition, Washington, DC, USA, 4–7 October 1992. [Google Scholar]
- Karacan, C.Ö. Elastic and shear moduli of coal measure rocks derived from basic well logs using fractal statistics and radial basis functions. Int. J. Rock Mech. Min. Sci. 2009, 46, 1281–1295. [Google Scholar] [CrossRef]
- Fu, X.H.; Qin, Y. Evaluation of gas content of coalbed methane reservoirs with the aid of geophysical logging technology. Fuel 2009, 88, 2269–2277. [Google Scholar] [CrossRef]
- Siron, D.L.; Segall, M.P. Influences of depositional environment and diagenesis on geophysical log response in the South Carolina Coastal Plain: Effects of sedimentary fabric and mineralogy. Sediment Geol. 1997, 108, 163–180. [Google Scholar] [CrossRef]
- Wang, Y.J.; Liu, D.M.; Cai, Y.D.; Yao, Y.B.; Zhou, Y.F. Evaluation of structured coal evolution and distribution by geophysical logging methods in the Gujiao block, northwest qinshui basin, China. J. Nat. Gas Sci. Eng. 2018, 51, 210–222. [Google Scholar] [CrossRef]
- Mavor, M.J.; Close, J.C.; McBAne, R.A. Formation evaluation of exploration coalbed-methane wells. SPE Form. Eval. 1994, 9, 285–294. [Google Scholar] [CrossRef]
- Hou, J.; Zou, C.C.; Huang, Z.H.; Xiao, L. Comparison of gas content evaluation methods in the log interpretation of coalbed methane. Adv. Mater. Res. 2013, 734, 1362–1366. [Google Scholar] [CrossRef]
- Bhanja, A.K.; Srivastava, O.P. A new approach to estimate CBM gas content from well logs. In Proceedings of the SPE Asia Pacific Oil and Gas Conference and Exhibition, Perth, Australia, 20–22 October 2008. [Google Scholar]
- Liu, Z.D.; Zhao, J.Z. Quantitatively evaluating the CBM reservoir using logging data. J. Geophys. Eng. 2016, 13, 59–69. [Google Scholar] [CrossRef]
- Peng, C.; Zou, C.C.; Zhou, T.N.; Li, K.; Yang, Y.Q.; Zhang, G.H.; Wang, W.W. Factors affecting coalbed methane (CBM) well productivity in the Shizhuangnan block of southern Qinshui basin, North China: Investigation by geophysical log, experiment and production data. Fuel 2017, 191, 427–441. [Google Scholar] [CrossRef]
- Sun, P.; Wang, B.; Sun, F.J.; Zhen, G.Q.; Li, G.Z.; Wang, H.Y.; Liu, H.L.; Deng, Z. Research on reservoir patterns of low-rank coal-bed methane in China. Acta Pet. Sin. 2009, 30, 648–652. (In Chinese) [Google Scholar]
- Liu, C.L.; Wang, X.H.; Liu, K.; Wang, J.; Guo, H.; Sun, Z.Q. Occurrence features of coalbed methane in inclined coal seam of Junggar Basin, Xinjiang. Adv. Mater. Res. 2014, 868, 696–699. [Google Scholar] [CrossRef]
- Fu, H.J.; Tang, D.Z.; Xu, H.; Xu, T.; Chen, B.L.; Hu, P.; Yin, Z.Y.; Wu, P.; He, G.J. Geological characteristics and CBM exploration potential evaluation: A case study in the middle of the southern Junggar Basin, NW China. J. Nat. Gas. Sci. Eng. 2016, 30, 557–570. [Google Scholar] [CrossRef]
- Guo, J.G.; Pang, X.Q.; Guo, F.T.; Wang, X.L.; Xiang, F.C.; Jiang, F.J.; Wang, P.W.; Xu, J.; Hu, T.; Peng, W.L. Petroleum generation and expulsion characteristics of lower and middle. Can. J Inform. Lib. Sci. 2014, 51, 537–557. [Google Scholar]
- Yuan, Y.; Tang, Y.; Shan, Y.S.; Zhang, J.Q.; Cao, D.Y.; Wang, A.M. Coalbed methane reservoir evaluation in the Manas mining area, southern Junggar Basin. Energ. Explor. Exploit. 2018, 36, 114–131. [Google Scholar] [CrossRef]
- Fu, H.J.; Tang, D.Z.; Xu, T.; Xu, H.; Tao, S.; Zhao, J.L.; Chen, B.L.; Yin, Z.Y. Preliminary research on CBM enrichment models of low-rank coal and its geological controls: A case study in the middle of the southern Junggar Basin, NW China. Mar. Petrol. Geol. 2017, 83, 97–110. [Google Scholar] [CrossRef]
- Zheng, G.D.; Ma, X.X.; Guo, Z.F.; Hilton, D.R.; Xu, W.; Liang, S.Y.; Fan, Q.H.; Chen, W.X. Gas geochemistry and methane emission from Dushanzi mud volcanoes in the southern Junggar Basin, NW China. J. Asian Earth Sci. 2017, 149, 184–190. [Google Scholar] [CrossRef]
- Chen, B.; Arakawa, Y. Elemental and Nd-Sr isotopic geochemistry of granitoids from the west Junggar foldbelt (NW China), with implications for Phanerozoic continental growth. Geochim. Cosmochim. Acta 2005, 5, 1307–1320. [Google Scholar] [CrossRef]
- Luo, X.R.; Wang, Z.M.; Zhang, L.Q.; Yang, W.; Liu, L.J. Overpressure generation and evolution in a compressional tectonic setting, the southern margin of Junggar Basin, northwestern China. AAPG Bull. 2007, 91, 1123–1139. [Google Scholar] [CrossRef]
- SAC. Heating and Desorption Method in Coalbed Methane Content Determination; GB/T 28753-2012; China National Standardization Management Committee: Beijing, China, 2012.
- Xiaoyan, L.; Suian, Z.; Xiaozhong, S.; Qiang, W.; Jie, Y. Method of Determining Coalbed Gas Content; GB/T 19559-2008; China National Standardization Management Committee: Beijing, China, 2008.
- Mardon, S.M.; Eble, C.F.; Hower, J.C.; Takacs, K.; Mastalerz, M.; Bustin, R.M. Organic petrology, geochemistry, gas content and gas composition of Middle Pennsylvanian age coal beds in the Eastern Interior (Illinois) Basin: Implications for CBM development and carbon sequestration. Int. J. Coal Geol. 2014, 127, 56–74. [Google Scholar] [CrossRef]
- Tixier, M.P.; Alger, R.P. Log evaluation of nonmetallic mineral deposits. Geophysics 1970, 35, 124–142. [Google Scholar] [CrossRef]
- Zhang, Z.Q. On coalbed methane industrial components and gas content calculation model in heshun area. Well Log. Technol. 2013, 37, 99–102. (In Chinese) [Google Scholar]
- Huang, Z.H.; Zou, C.C.; Yang, Y.Q.; Zhang, G.H.; Wang, W.W. Coalbed Methane Reservoir Evaluation from Wireline Logs in TS District, Southern Qinshui Basin. Geoscience 2012, 26, 1275–1282. (In Chinese) [Google Scholar]
- Scott, A.R. Hydrogeologic factors affecting gas content distribution in coal beds. Int. J. Coal Geol. 2002, 50, 363–387. [Google Scholar] [CrossRef]
- Drobniak, A.; Mastalerz, M.; Rupp, J.; Eaton, N. Evaluation of coalbed gas potential of the Seelyville coal member, Indiana, USA. Int. J. Coal Geol. 2004, 57, 265–282. [Google Scholar] [CrossRef]
- Ruppert, L.F.; Hower, J.C.; Ryder, R.T.; Levine, J.R.; Trippi, M.H.; Grady, W.C. Geologic controls on thermal maturity patterns in Pennsylvanian coal-bearing rocks in the Appalachian basin. Int. J. Coal Geol. 2010, 81, 169–181. [Google Scholar] [CrossRef]
- Cai, Y.D.; Liu, D.M.; Zhang, K.M.; Elsworth, D.; Yao, Y.B.; Tang, D.Z. Preliminary evaluation of gas content of the No. 2 coal seam in the Yanchuannan area, southeast Ordos basin, China. J. Pet. Sci. Eng. 2014, 122, 675–689. [Google Scholar] [CrossRef]
- Salmachi, A.; Bonyadi, M.R.; Sayyafzadeh, M.; Haghighi, M. Identification of potential locations for well placement in developed coalbed methane reservoirs. Int. J. Coal Geol. 2014, 131, 250–262. [Google Scholar] [CrossRef]
- Salmachi, A.; Karacan, C.Ö. Cross-formational flow of water into coalbed methane reservoirs: Controls on relative permeability curve shape and production profile. Environ. Earth Sci. 2017, 76, 200–216. [Google Scholar] [CrossRef] [PubMed]
- Salmachi, A.; Rajabi, M.; Reynolds, P.; Yarmohammadtooski, Z.; Wainman, C. The effect of magmatic intrusions on coalbed methane reservoir characteristics: A case study from the Hoskissons coalbed, Gunnedah Basin, Australia. Int. J. Coal Geol. 2016, 165, 278–289. [Google Scholar] [CrossRef]
- Salmachi, A.; Dunlop, E.; Rajabi, M.; Yarmohammadtooski, Z.; Begg, S. Investigation of permeability change in ultra-deep coal seams using time-lapse pressure transient analysis: A pilot project in the Cooper Basin, South Australia. AAPG Bull. 2018, 6, 36–49. [Google Scholar]
- Zhu, S.; Salmachi, A.; Du, Z. Two phase rate-transient analysis of a hydraulically fractured coal seam gas well: A case study from the ordos basin, china. Int. J. Coal Geol. 2018, 195, 47–60. [Google Scholar] [CrossRef]
- Salmachi, A.; Dunlop, E.; Rajabi, M. Drilling data of deep coal seams of the Cooper Basin: Analysis and lessons learned. J. Aust. Pet. Prod. Explor. Assoc. 2018, 58, 381–394. [Google Scholar] [CrossRef]
- Salmachi, A.; Haghighi, M. Temperature effect on methane sorption and diffusion in coal: Application for thermal recovery from coal seam gas reservoirs. J. Aust. Pet. Prod. Explor. Assoc. 2012, 52, 291–300. [Google Scholar] [CrossRef]


| Method | Name | Suitable Conditions | Specific Model |
|---|---|---|---|
| Statistical analysis method | Wang Z.W., 2010 | ||
| Pan H.P., 1998 | |||
| Fu X.H., 2009 | |||
| Langmuir equation method | Hawkins J.M., 1992 | ||
| If lack of Langmuir experiment data | |||
| Conventional ash content measurement method | Kim A.G., 1977 | The maximum pressure is 930 psi | |
| If is assumed to equal the hydrostatic head | |||
| Assuming the pressure is homogeneous | |||
| Mavor M.J., 1995 | |||
| Mullen M.J., 1990 |
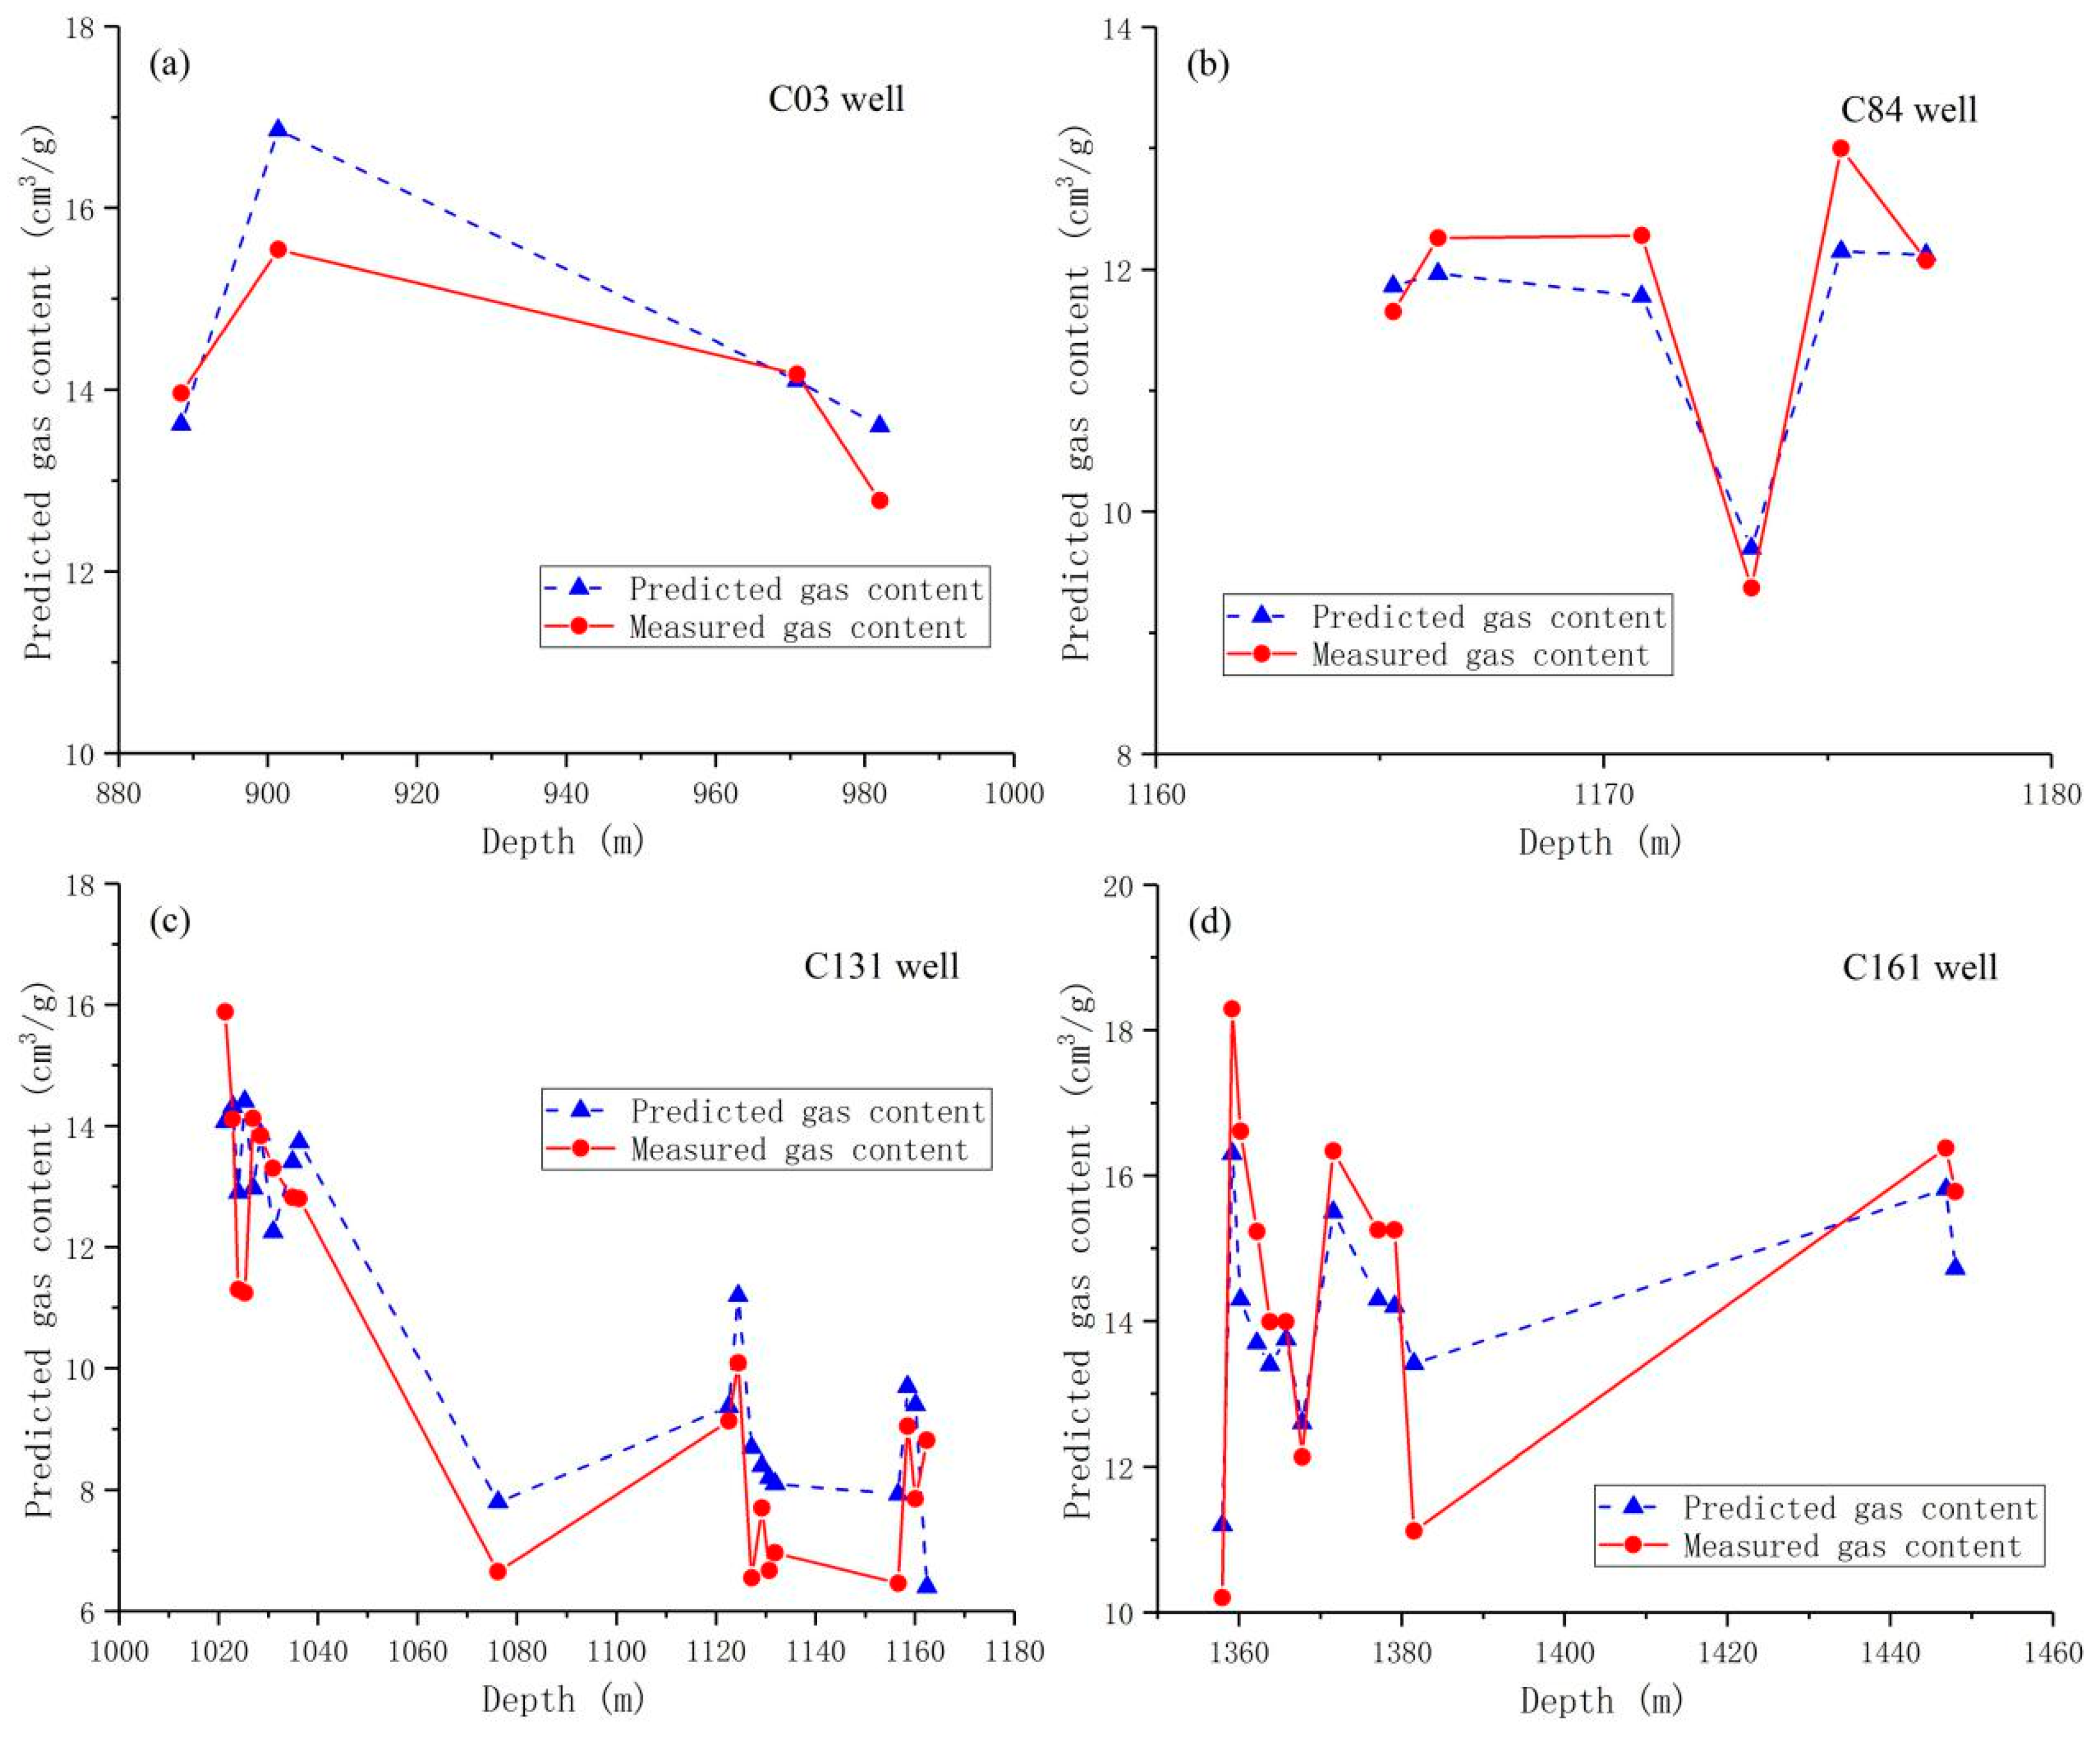
| Well | Seam Number | Depth (m) | (%) | Measured (cm3/g) | Predicted QP (cm3/g) | (%) |
|---|---|---|---|---|---|---|
| C84 | 43 | 1165.6 | 71.5 | 11.65 | 11.03 | 5.32 |
| 1173.6 | 9.37 | 11.05 | 17.93 | |||
| C131 | 42 | 989 | 45.1 | 8.63 | 7.16 | 17.03 |
| 43 | 1024.3 | 66.6 | 11.3 | 14.7 | 30.09 | |
| 1036.5 | 12.8 | 12.09 | 5.55 | |||
| 45-1 | 1076.5 | 41.5 | 9.65 | 7.56 | 21.86 | |
| 45-2 | 1122.9 | 47.1 | 9.13 | 9.01 | 1.31 | |
| C161 | 43 | 1360.6 | 63.3 | 15.61 | 13.5 | 13.52 |
| 1377.6 | 15.25 | 13.57 | 11.02 | |||
| 45-1 | 1447.1 | 68.6 | 15.38 | 14.4 | 6.37 |
| Well | Predicted Coalbed Gas Content, cm3/g | Samples | Correlation Coefficient | Residual Error | F |
|---|---|---|---|---|---|
| C161 | 12 | 0.94 | 1.50 | 789.72 | |
| C153 | 9 | 0.96 | 0.18 | 2163.11 | |
| C131 | 21 | 0.91 | 0.08 | 3231.81 | |
| C84 | 6 | 0.98 | 0.02 | 13714.9 |
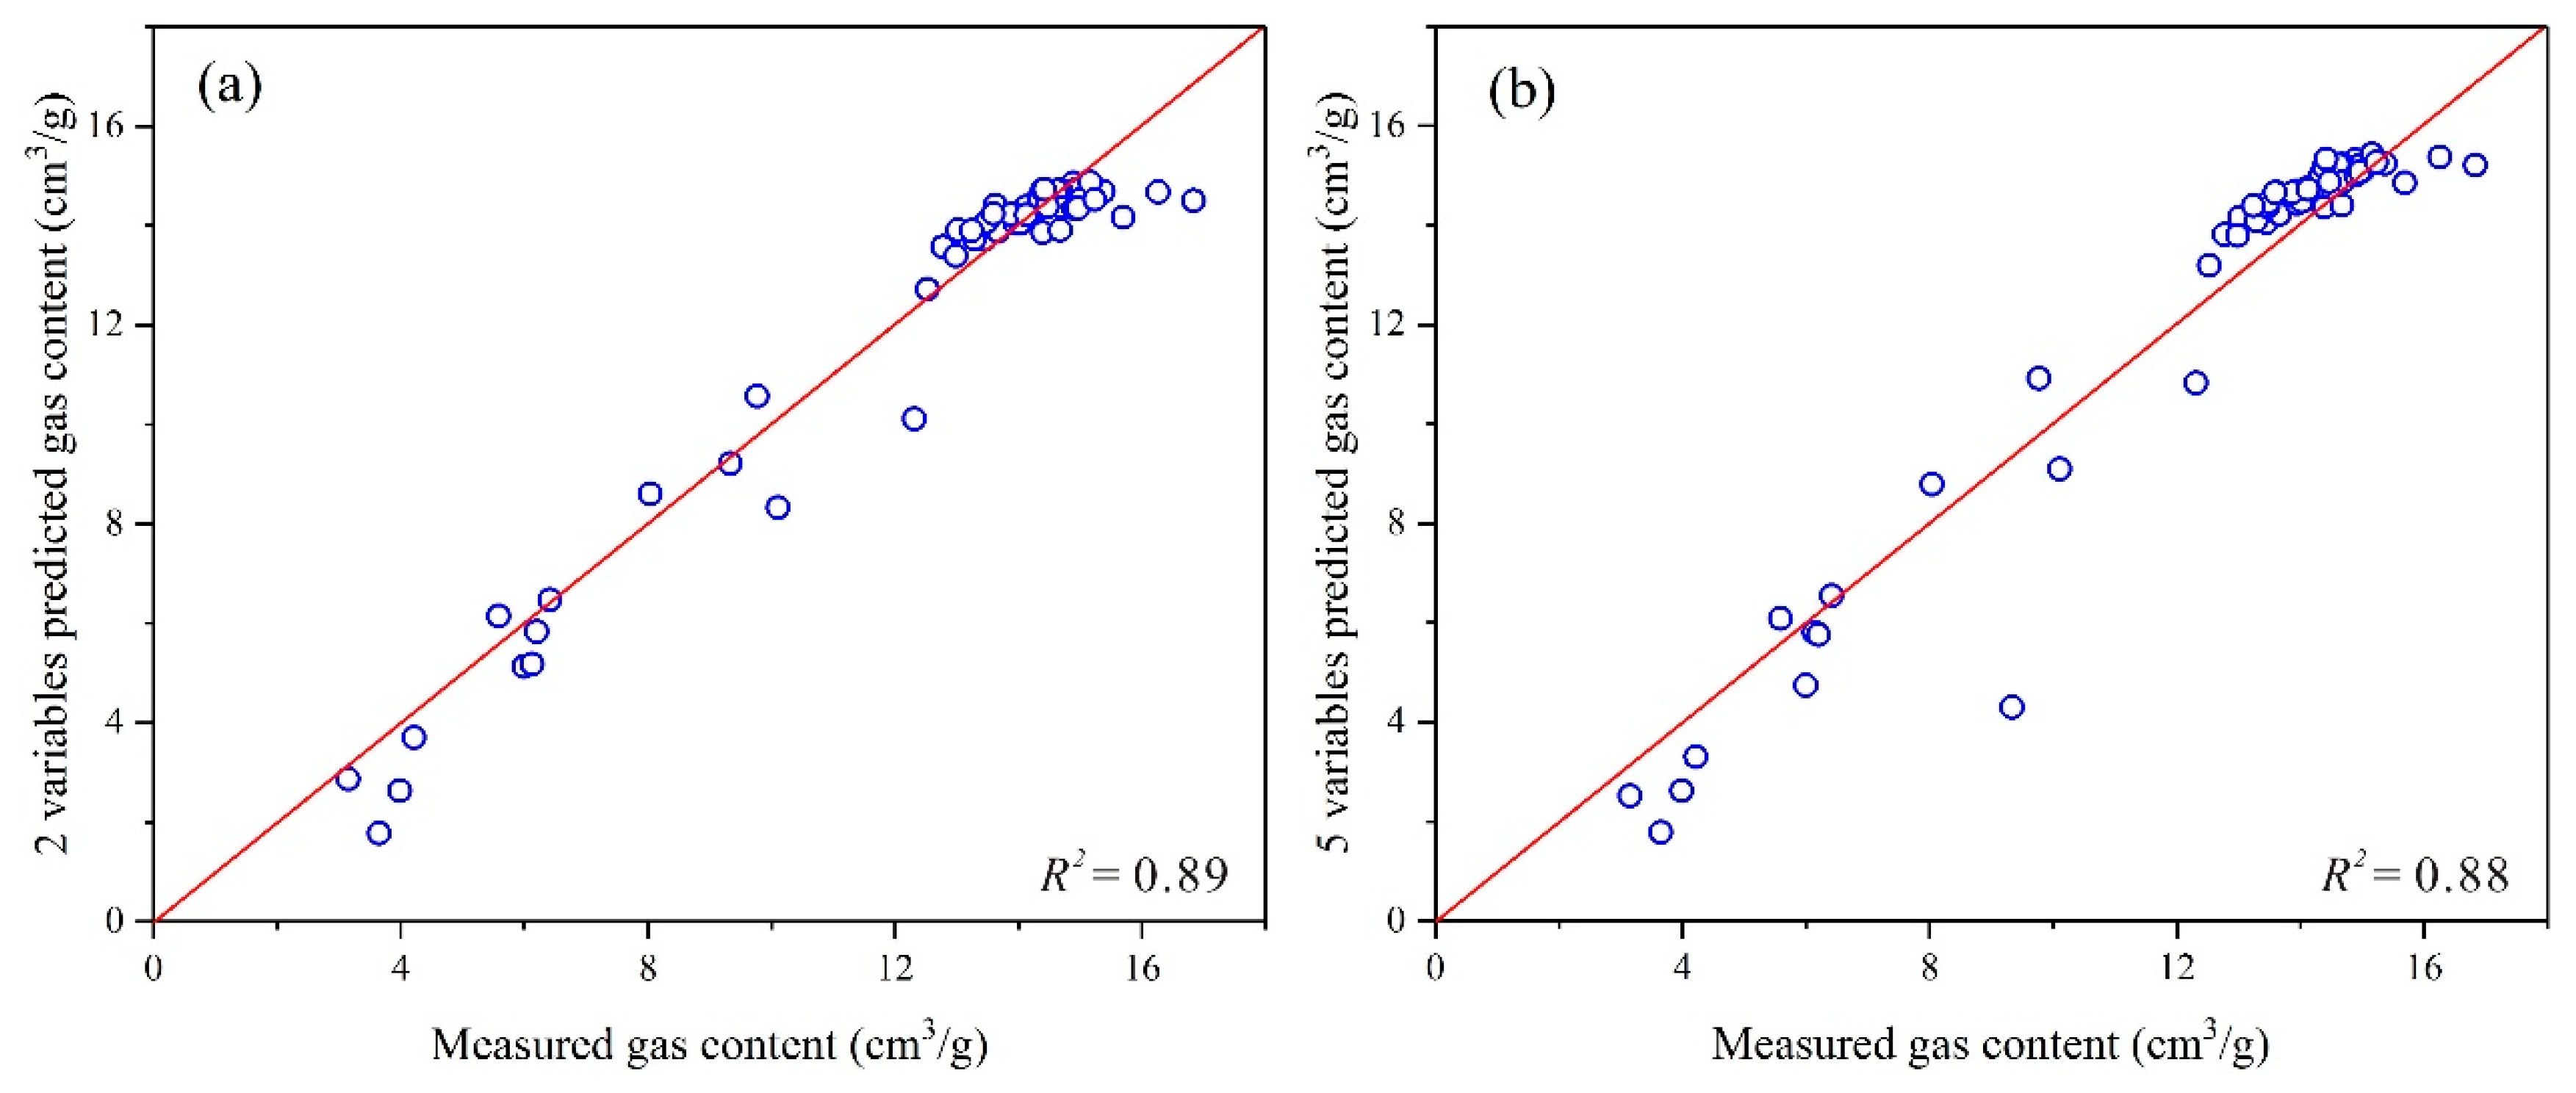
| No. | Well | Measured QM | Predicted QP | Predicted QP | ||
|---|---|---|---|---|---|---|
| (cm3/ g) | 2 Variables | 5 Variables | 2 Variables | 5 Variables | ||
| 1 | C51 | 6.00 | 5.13 | 4.74 | 14.50 | 20.99 |
| 2 | C52 | 14.89 | 14.86 | 15.31 | 0.18 | 2.82 |
| 3 | C53 | 12.31 | 10.11 | 10.82 | 17.84 | 12.09 |
| 4 | C54 | 4.22 | 3.30 | 3.70 | 21.80 | 12.23 |
| 5 | C81 | 12.77 | 13.58 | 13.81 | 6.33 | 8.18 |
| 6 | C82 | 14.13 | 14.39 | 14.74 | 1.81 | 4.34 |
| 7 | C83 | 14.90 | 14.71 | 15.11 | 1.30 | 1.41 |
| 8 | C84 | 13.45 | 13.72 | 14.05 | 1.99 | 4.48 |
| 9 | C06V | 13.67 | 13.89 | 14.22 | 1.58 | 4.04 |
| 10 | C111 | 13.02 | 13.91 | 14.16 | 6.81 | 8.72 |
| 11 | C112 | 13.63 | 14.41 | 14.65 | 5.75 | 7.49 |
| 12 | C01 | 14.19 | 14.21 | 14.62 | 0.16 | 3.02 |
| 13 | C02 | 13.29 | 13.73 | 14.09 | 3.29 | 5.99 |
| 14 | C03 | 15.37 | 14.69 | 15.24 | 4.45 | 0.86 |
| 15 | C04 | 14.97 | 14.70 | 15.20 | 1.78 | 1.56 |
| 16 | C05 | 14.66 | 14.54 | 15.04 | 0.79 | 2.59 |
| 17 | C1H | 15.69 | 14.17 | 14.85 | 9.69 | 5.34 |
| 18 | C13X | 14.34 | 14.56 | 15.02 | 1.53 | 4.72 |
| 19 | C131 | 13.95 | 14.23 | 14.68 | 1.99 | 5.26 |
| 20 | C132 | 8.04 | 8.61 | 8.79 | 7.04 | 9.28 |
| 21 | C133 | 12.99 | 13.40 | 13.79 | 3.13 | 6.15 |
| 22 | C151 | 14.39 | 13.86 | 14.36 | 3.69 | 0.18 |
| 23 | C152 | 13.95 | 14.05 | 14.44 | 0.68 | 3.48 |
| 24 | C153 | 13.92 | 14.22 | 14.57 | 2.16 | 4.69 |
| 25 | C154 | 13.48 | 14.07 | 14.37 | 4.36 | 6.63 |
| 26 | C161 | 14.03 | 14.05 | 14.47 | 0.13 | 3.13 |
| 27 | C162 | 13.87 | 14.22 | 14.66 | 2.55 | 5.68 |
| 28 | C164 | 14.68 | 14.71 | 15.23 | 0.21 | 3.75 |
| 29 | C165 | 16.26 | 14.67 | 15.37 | 9.76 | 5.47 |
| 30 | C166 | 12.53 | 12.72 | 13.18 | 1.53 | 5.21 |
| Well | Seam Number | Structural Type | Burial Depth (m) | Gas Content (Average) (m3/t) |
|---|---|---|---|---|
| C84 | 43 | wing | 1161–1178 | 9.37–13 (10.25) |
| C03 | 43 | axis | 888–910 | 8.46–15.54 (13.56) |
| C03 | 45-1 | axis | 968–986 | 8.43–14.17 (10.83) |
| C13 | 43 | axis | 1020–1038 | 11.3–15.88 (13.27) |
| C13 | 45-1 | axis | 1072–1081 | 9.65 |
| C13 | 45-2 | axis | 1122–1125 | 9.13–10.09 (9.61) |
| C16 | 43 | axis | 1357–1384 | 10.2–16.25 (14.4) |
| C16 | 45-1 | axis | 1406–1413 | 15.78–16.18 (16.08) |
| K1 | 43 | wing | 851–869 | 6.7–10.82 (8.26) |
| K1 | 45-2 | wing | 948–971 | 6.66–11.21 (7.98) |
| K2 | 43 | wing | 469–486 | 6.93–9.09 (7.8) |
| K6 | 45-2 | wing | 1050–1070 | 7.56–8.14 (7.8) |
© 2018 by the authors. Licensee MDPI, Basel, Switzerland. This article is an open access article distributed under the terms and conditions of the Creative Commons Attribution (CC BY) license (http://creativecommons.org/licenses/by/4.0/).
Share and Cite
Ge, X.; Liu, D.; Cai, Y.; Wang, Y. Gas Content Evaluation of Coalbed Methane Reservoir in the Fukang Area of Southern Junggar Basin, Northwest China by Multiple Geophysical Logging Methods. Energies 2018, 11, 1867. https://doi.org/10.3390/en11071867
Ge X, Liu D, Cai Y, Wang Y. Gas Content Evaluation of Coalbed Methane Reservoir in the Fukang Area of Southern Junggar Basin, Northwest China by Multiple Geophysical Logging Methods. Energies. 2018; 11(7):1867. https://doi.org/10.3390/en11071867
Chicago/Turabian StyleGe, Xu, Dameng Liu, Yidong Cai, and Yingjin Wang. 2018. "Gas Content Evaluation of Coalbed Methane Reservoir in the Fukang Area of Southern Junggar Basin, Northwest China by Multiple Geophysical Logging Methods" Energies 11, no. 7: 1867. https://doi.org/10.3390/en11071867