Effect of Reflector Geometry in the Annual Received Radiation of Low Concentration Photovoltaic Systems

 ,
, 
Abstract
1. Introduction
- Concentration implies losses, as the reflectivity of the reflector is never 100%. A high quality reflector has 95% reflectance, which implies 5% losses. If there are multiple reflections, the reflectance losses are compounded.
- The redirection of the rays can lead to a situation in which the light does not reach the target (receiver), leading to a steep decrease in the collector efficiency. This happens when the angle is outside of the reflectors acceptance angle or due to imperfections in the shape of the concentration.
- Concentrating collectors receive 1/C of the diffuse radiation. This means that a collector with concentration factor of two will receive 50% of the diffuse solar radiation, while a high concentration collector will receiver close to 0%. This effect is particularly relevant in locations, such as Berlin or Paris, where diffuse radiation accounts for approximately 50% of the annual solar radiation.
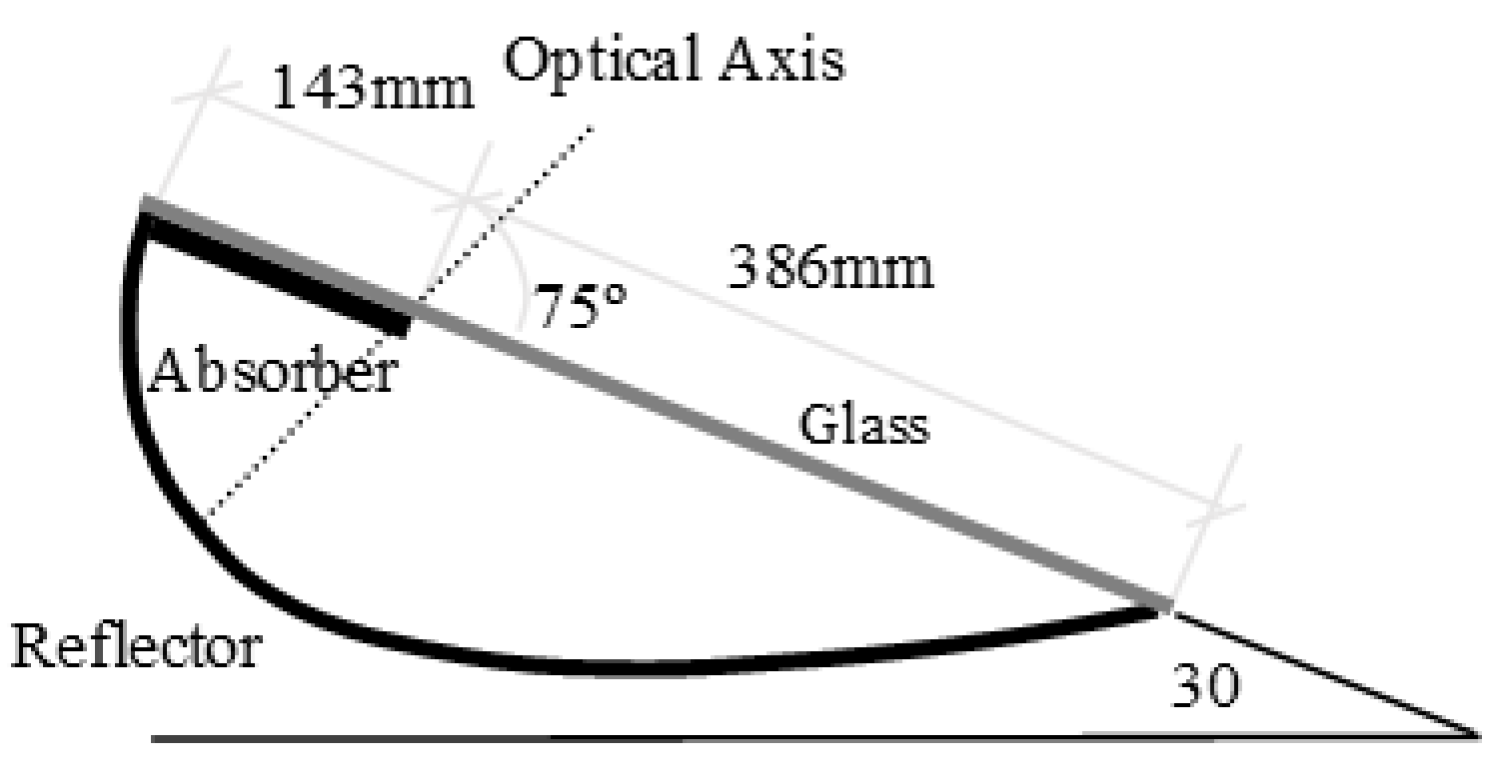
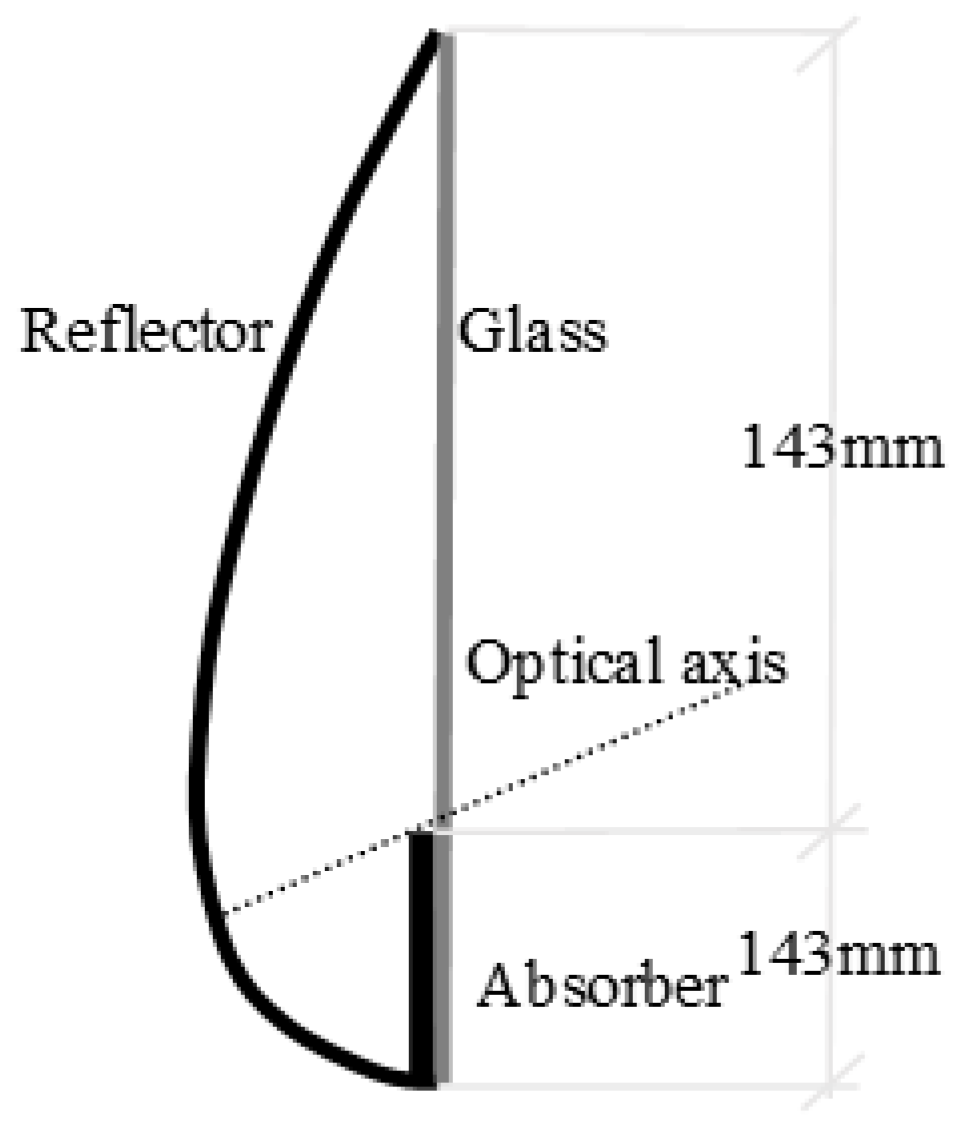
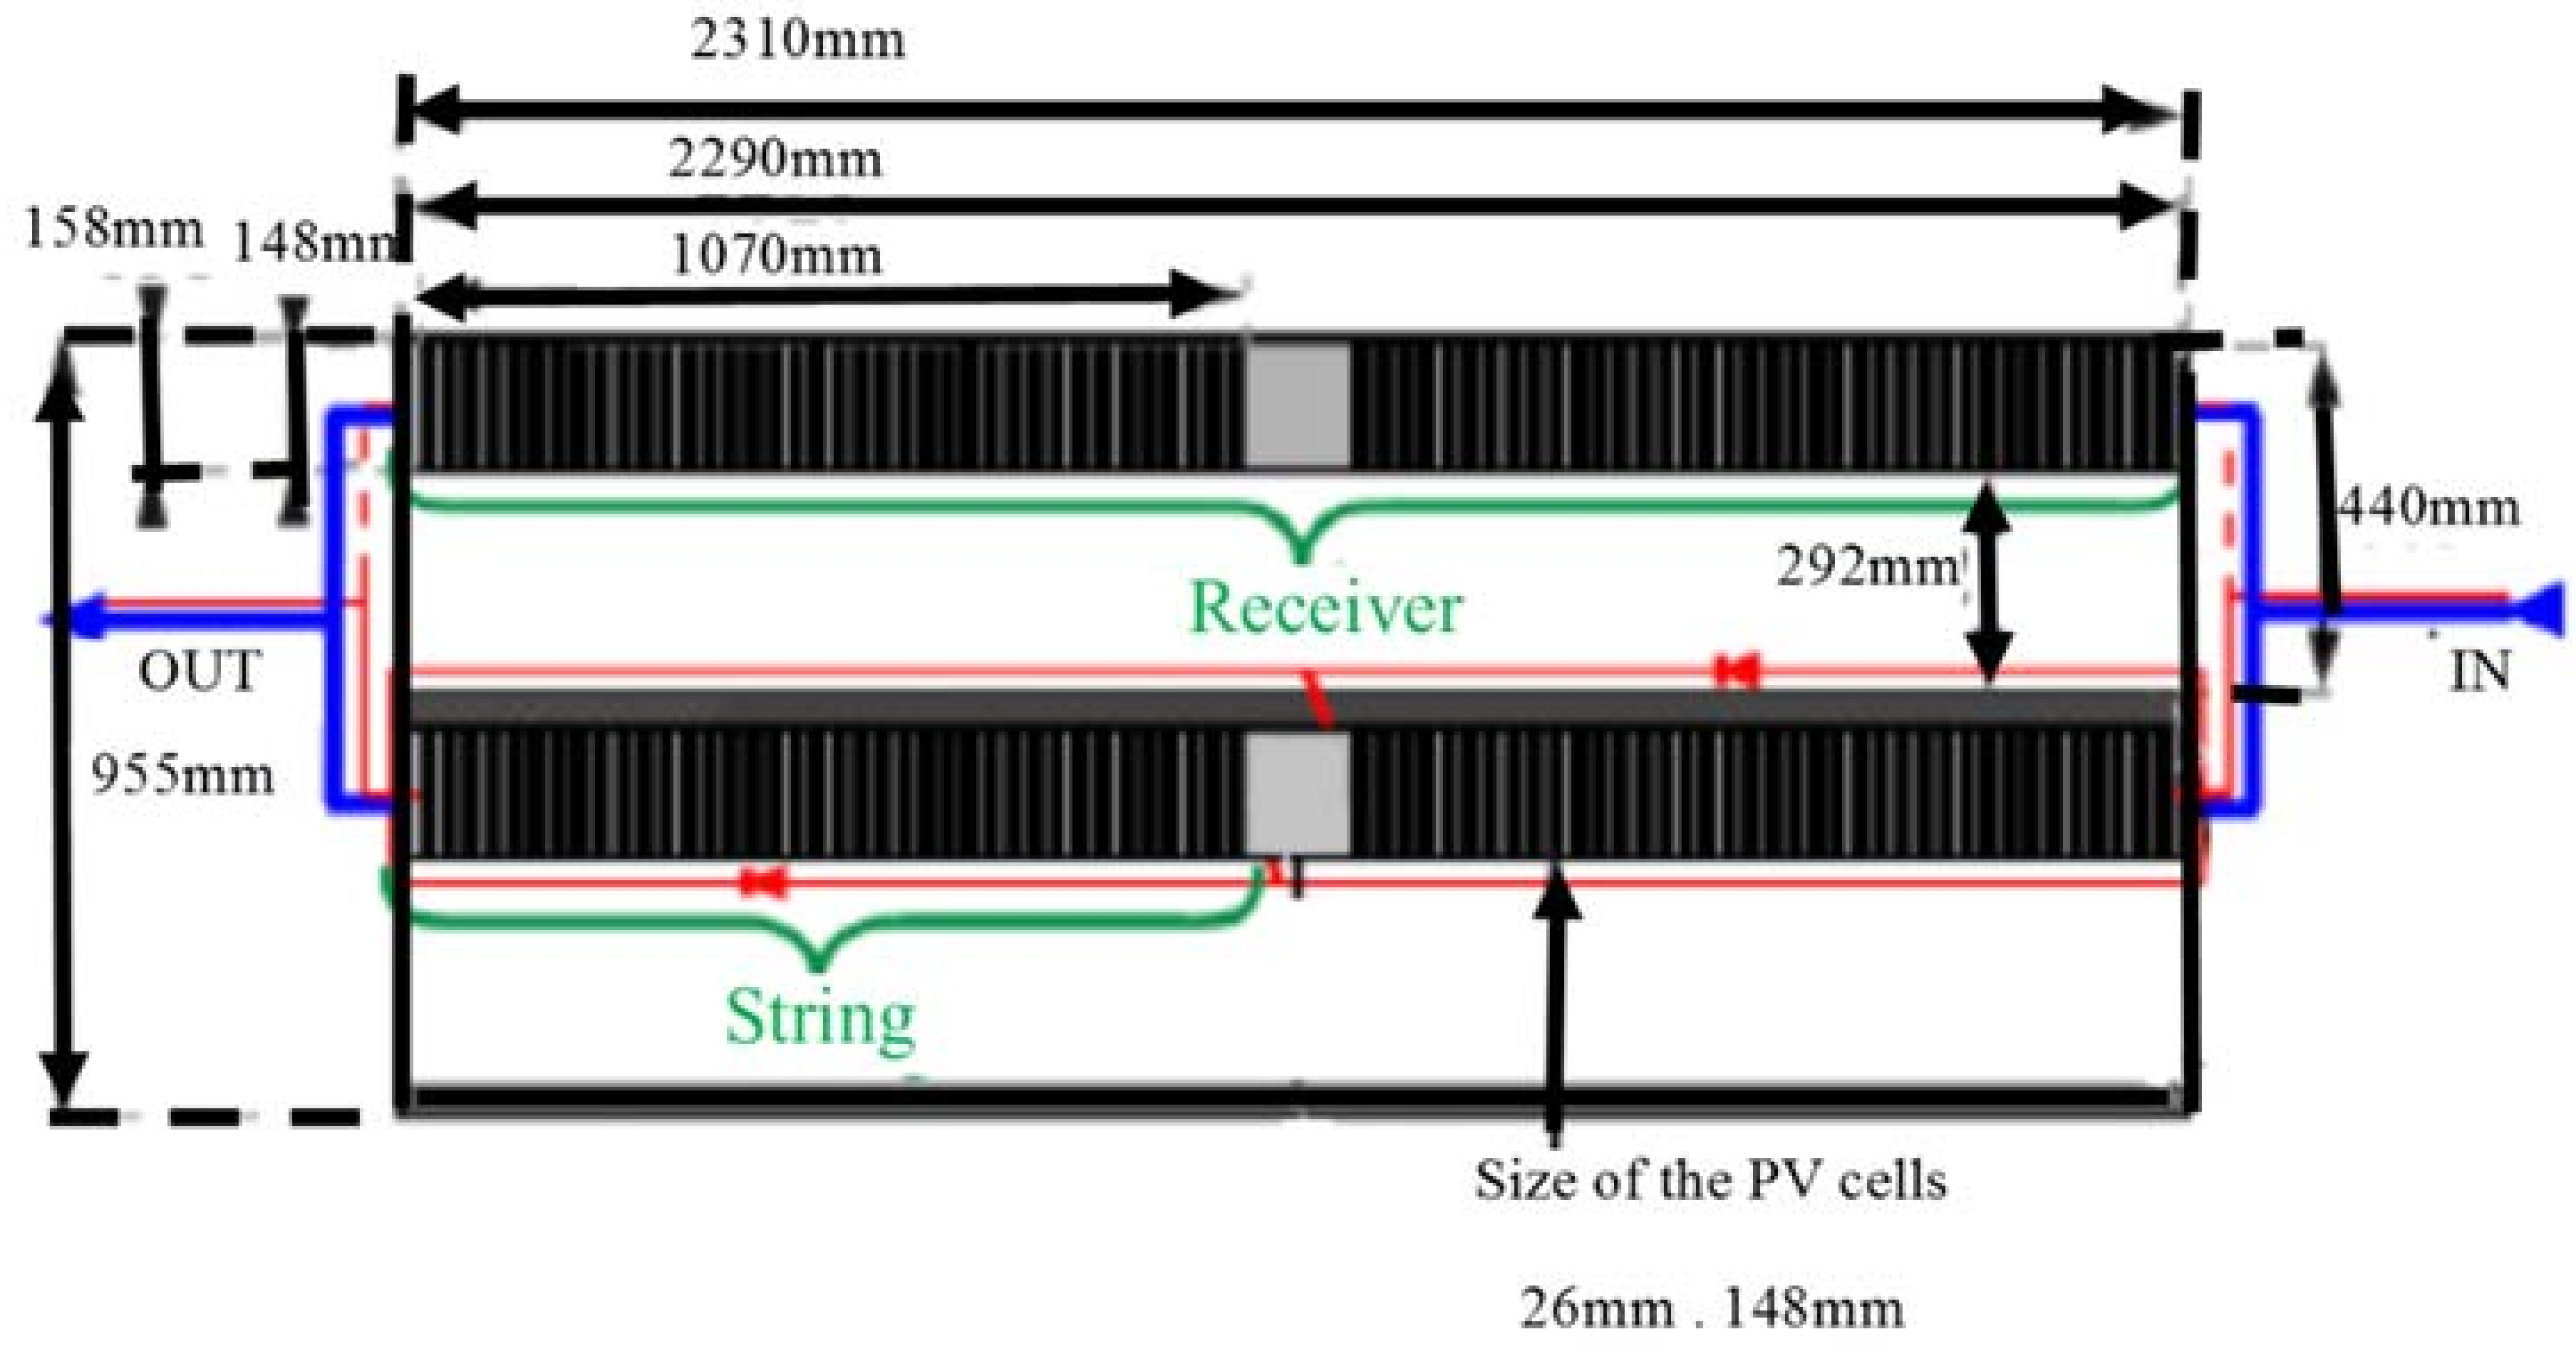
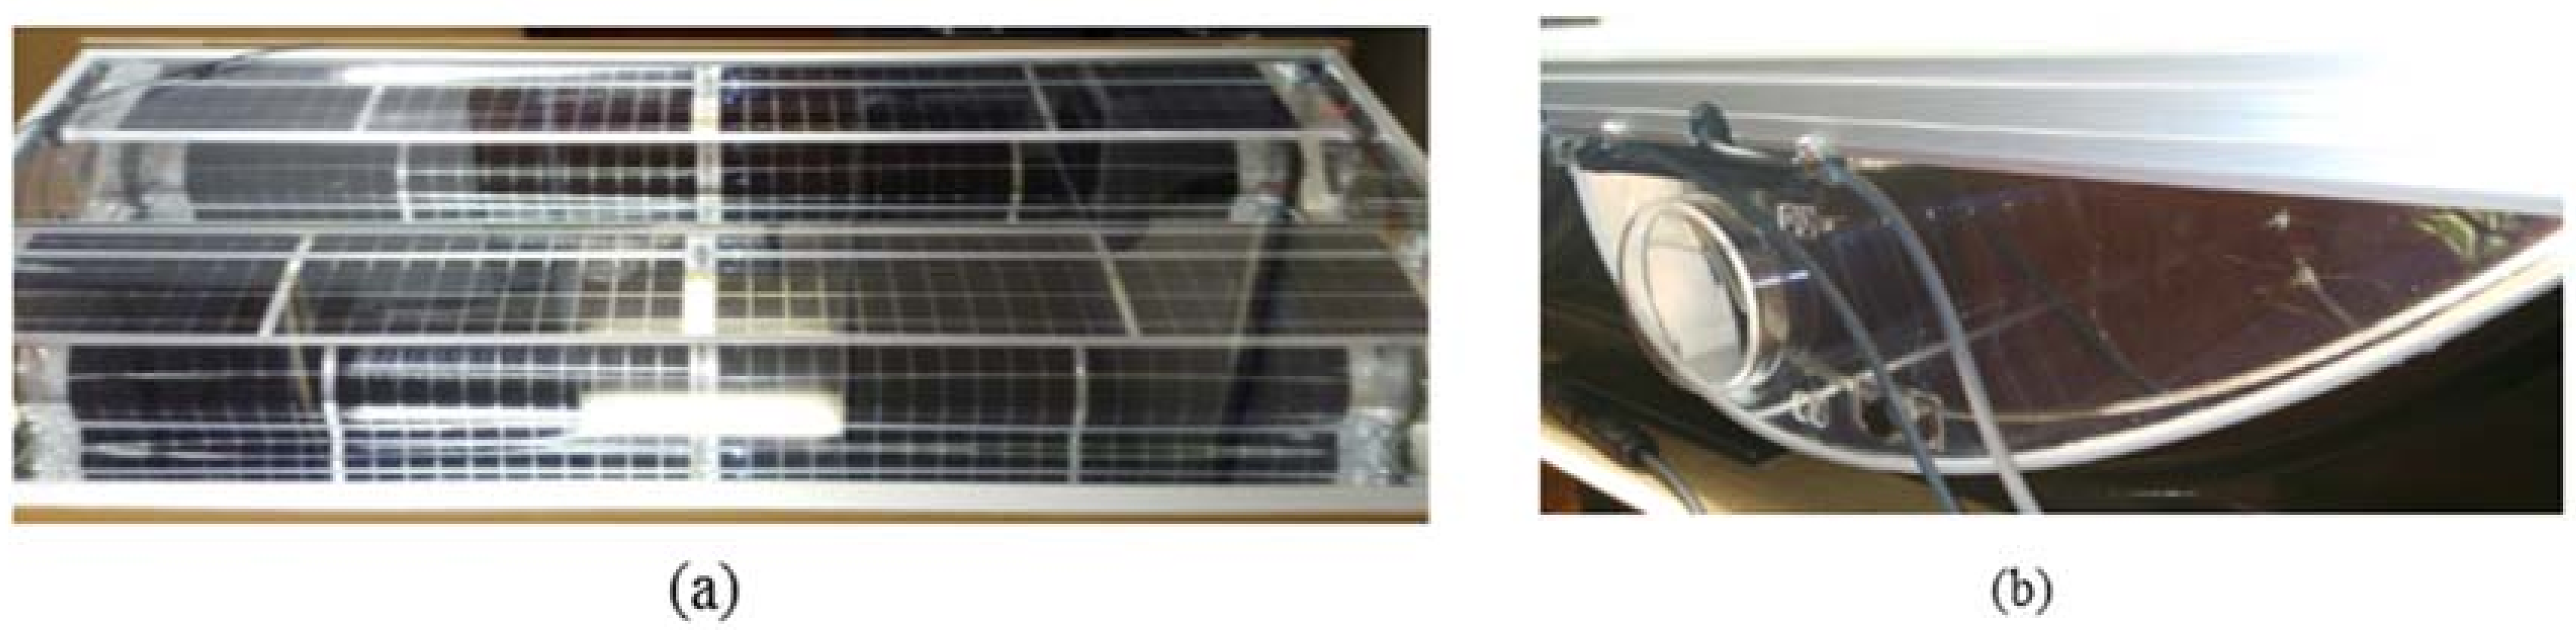
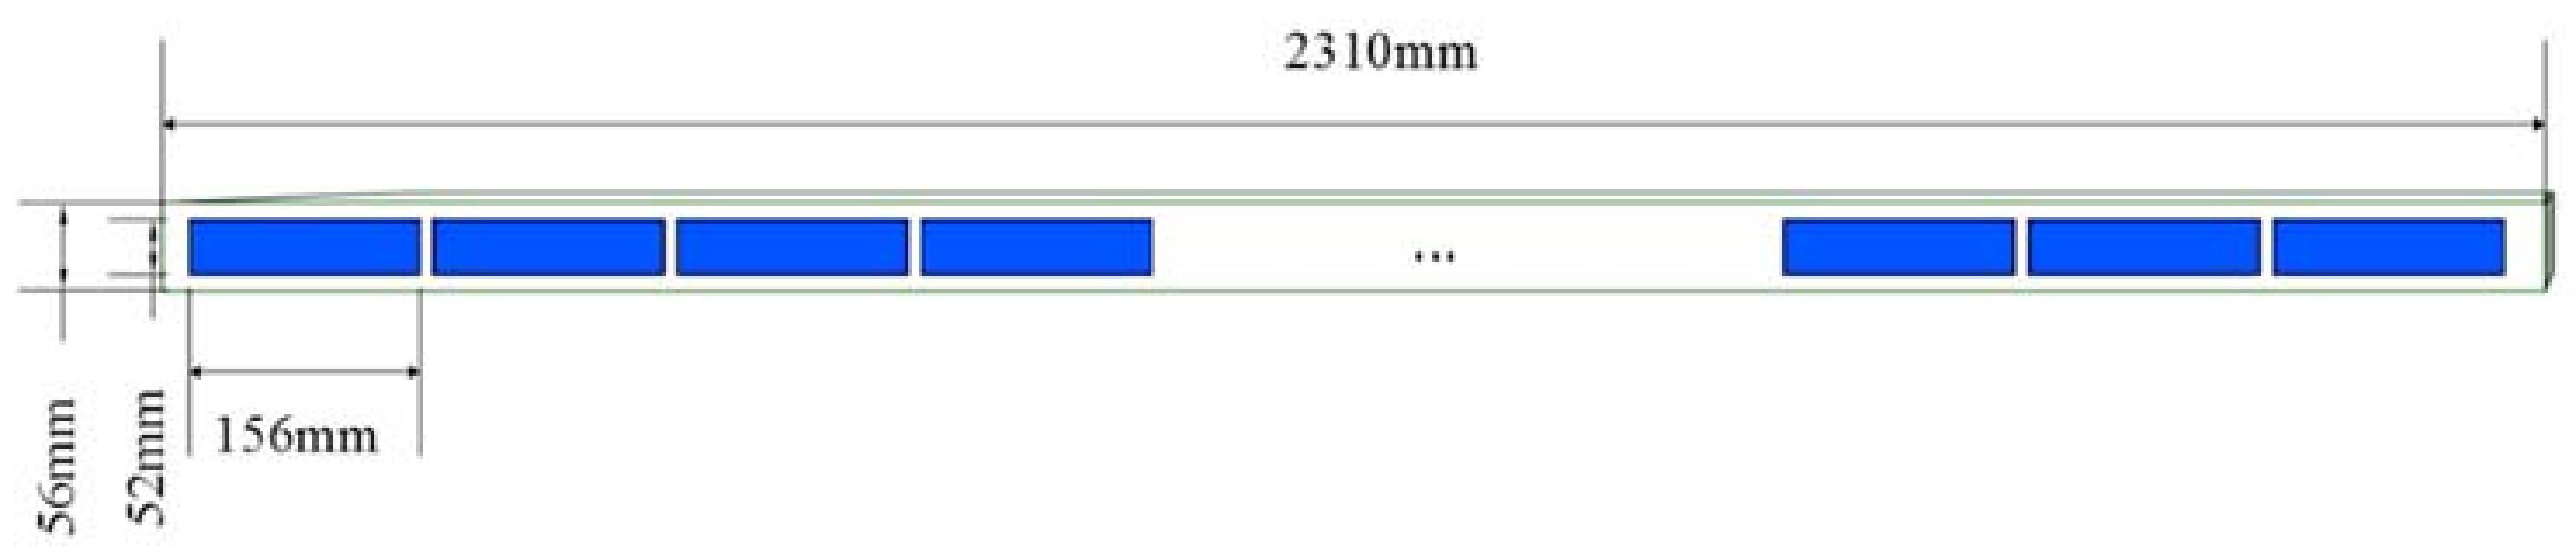
2. Solarus Concentrating Photovoltaic (C-PV) Collector
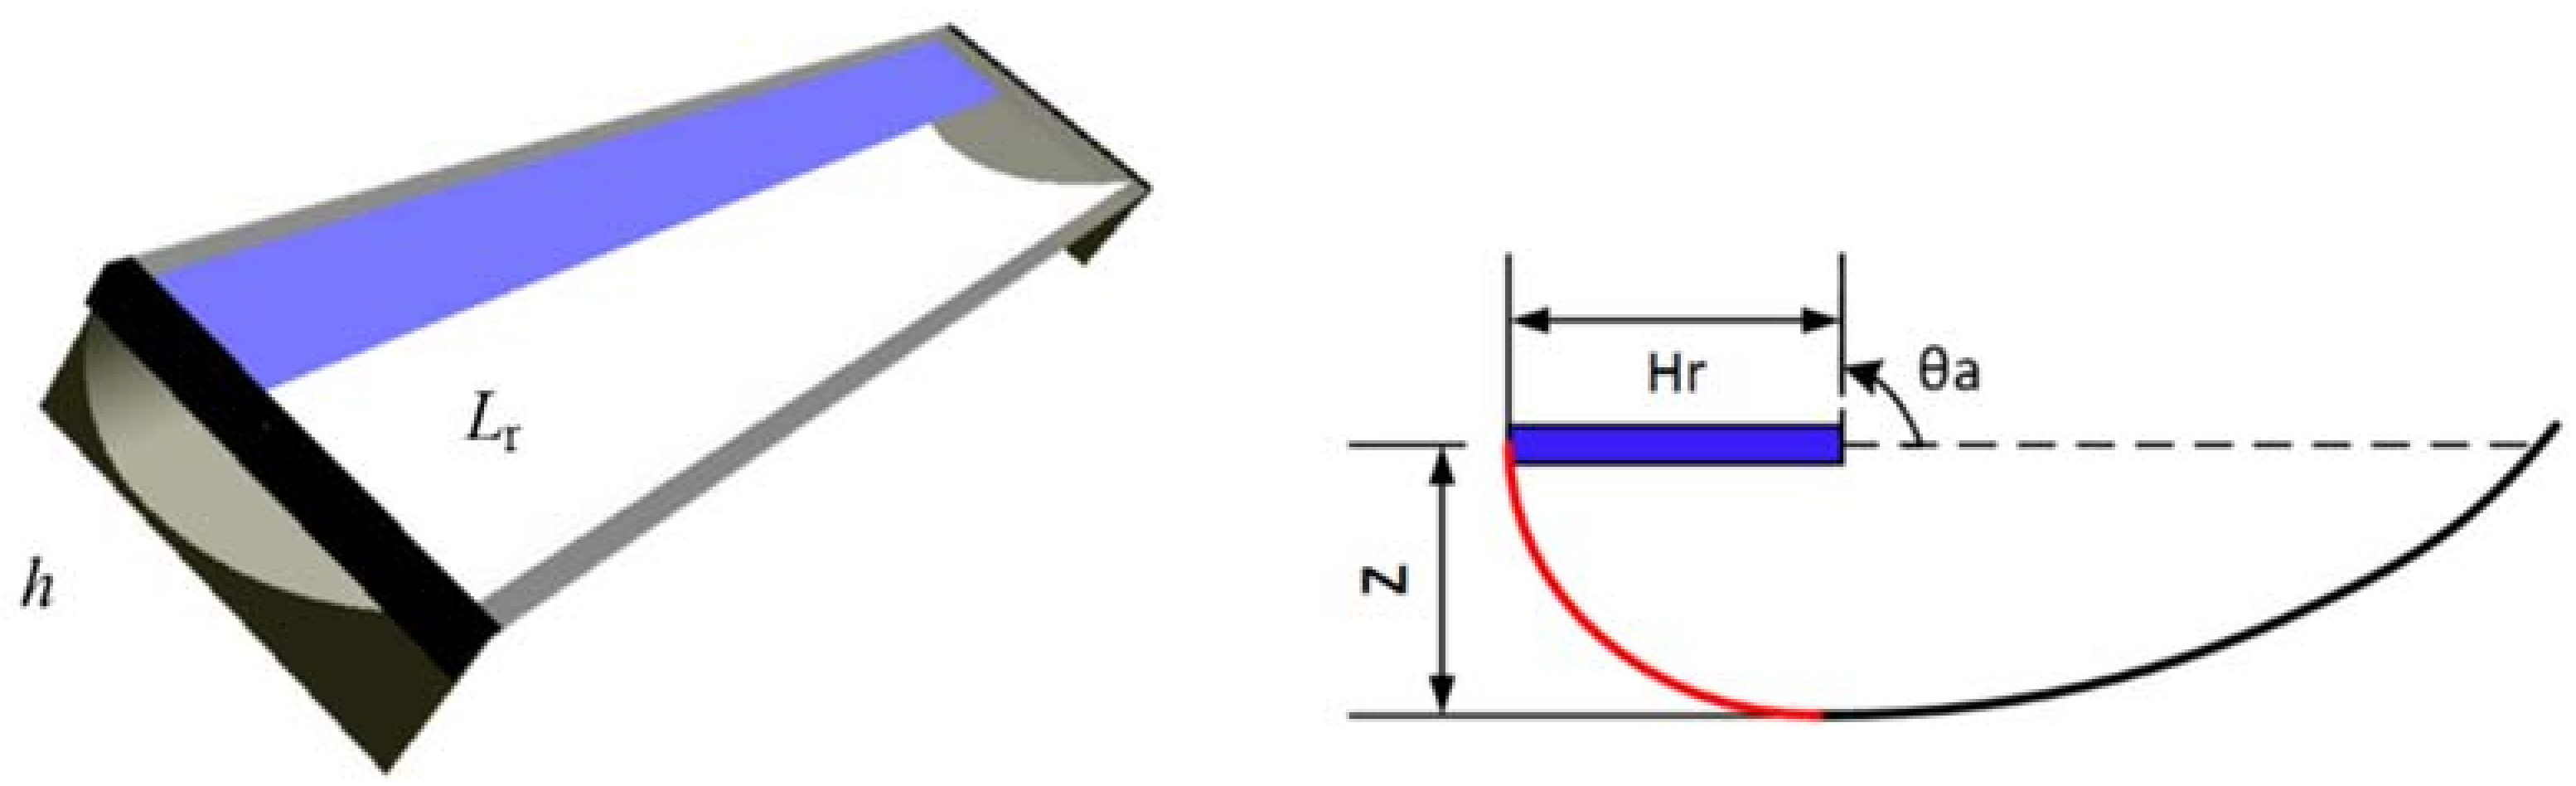
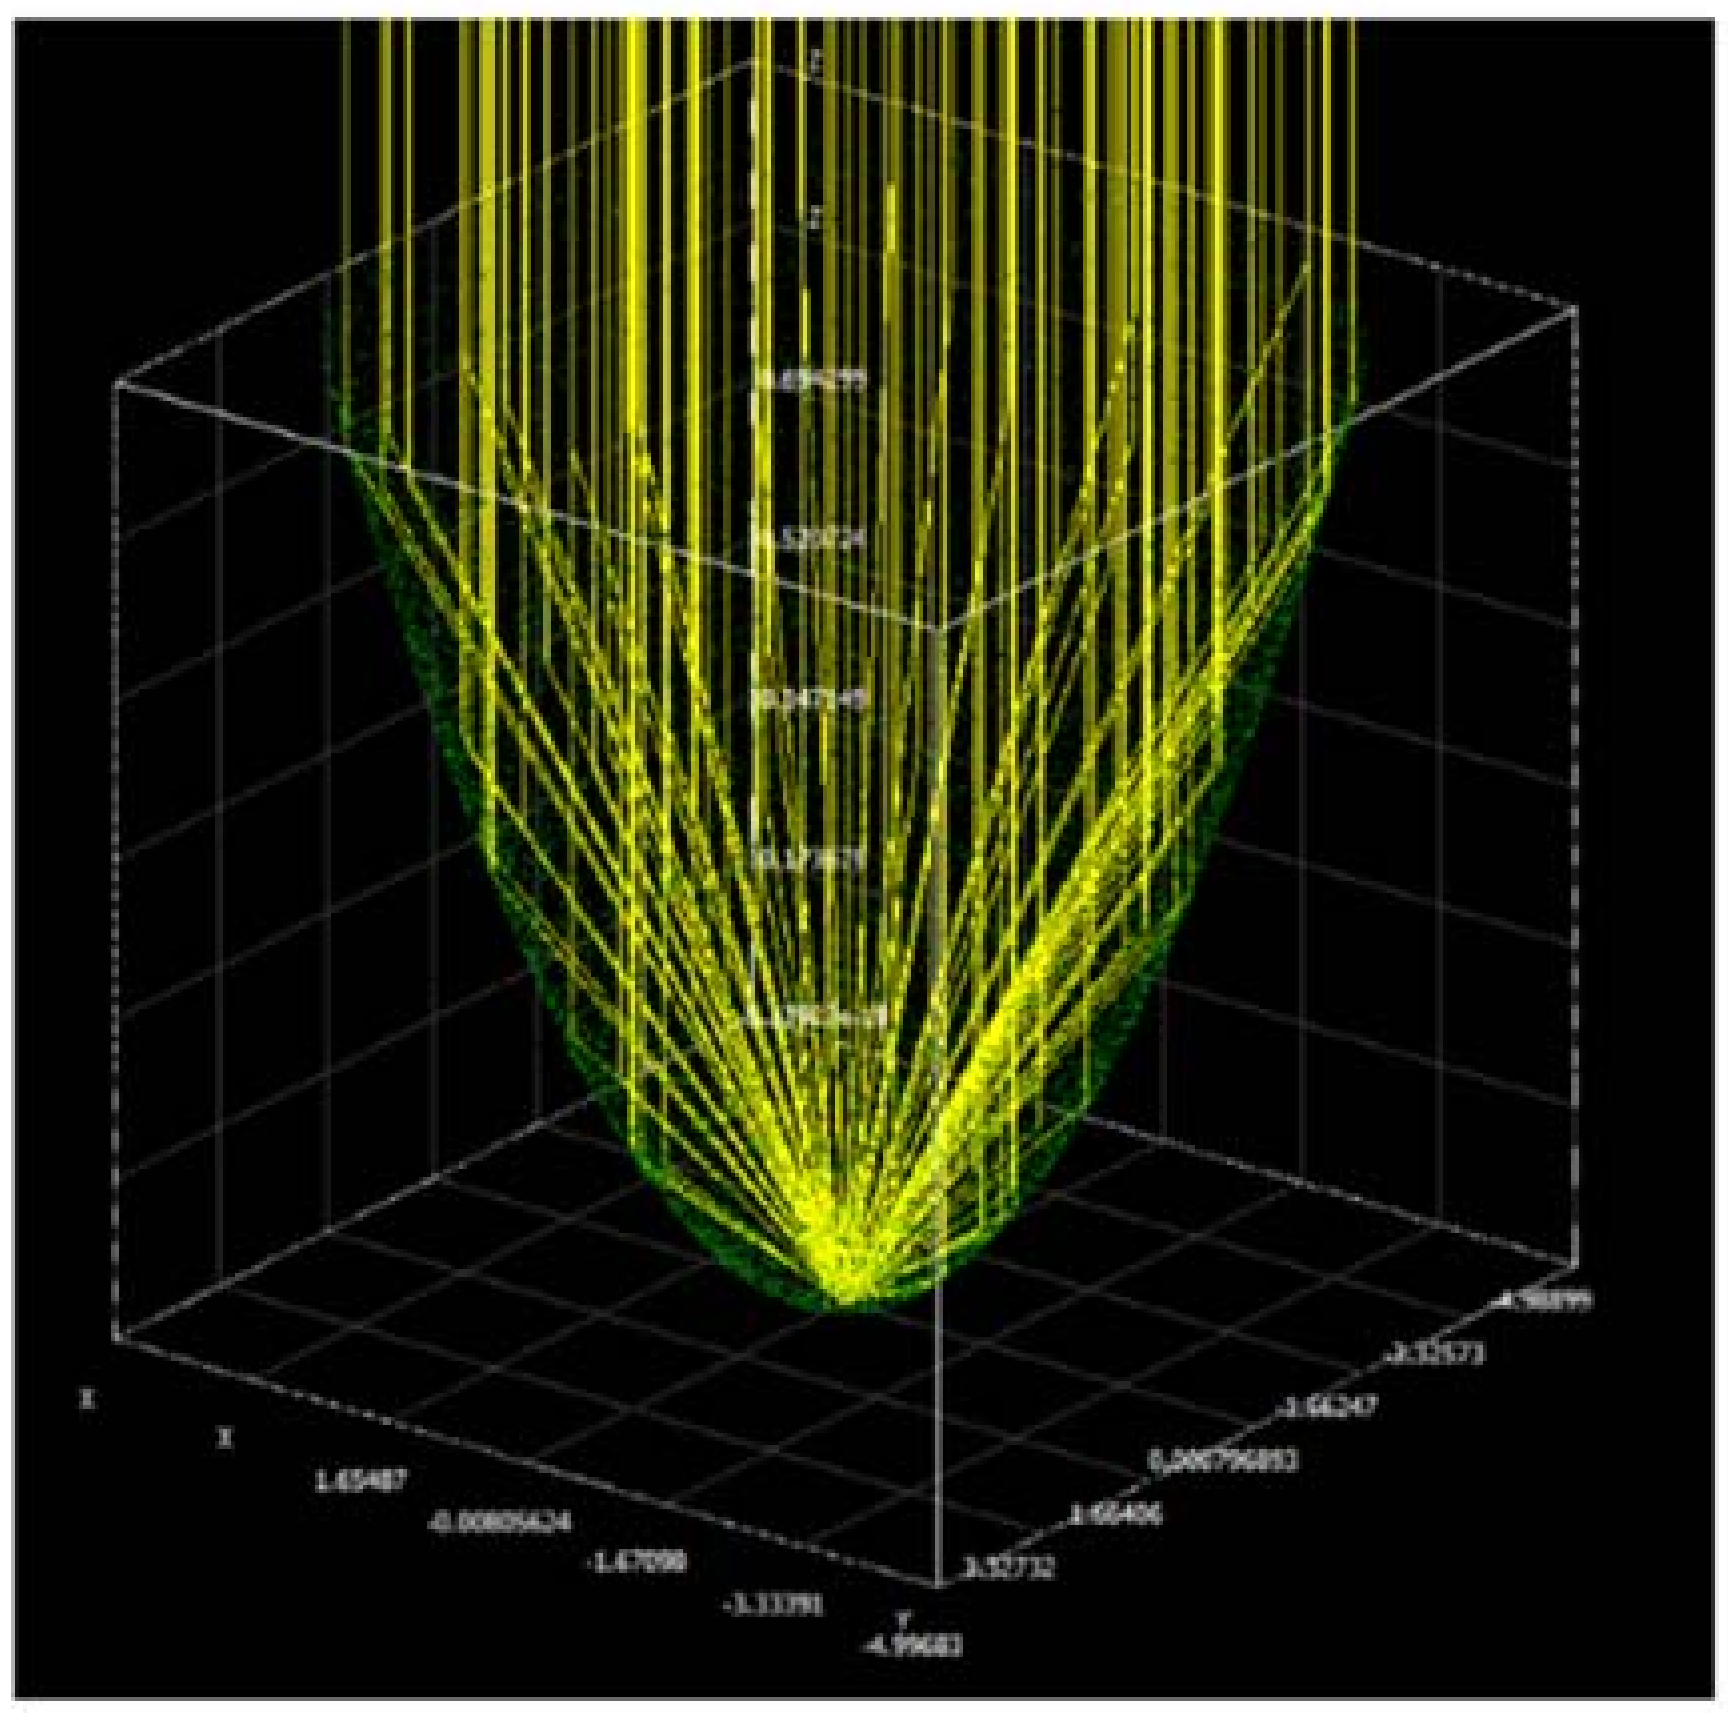
3. Efficiency Calculation Methodology and Collector Geometries
4. Results
4.1. Structures Analysed
4.2. The Latitude and Tilt Effects on the Studied Structures
4.3. Potential Choices
5. Conclusions
6. Future Work
Author Contributions
Acknowledgments
Conflicts of Interest
Nomenclature
| Aapert | aperture area of the collector (m2) |
| Arcev | receiver area (m2) |
| C | concentration factor |
| Eflat | Energy produced by the flat panel (W·h) |
| Enew | Energy produced by the new geometry (W·h) |
| Estandard | Energy produced by MaRECo structure (W·h) |
| G | gain or energy ratio |
| Ntot | number of total rays in the simulation |
| Greek Symbols | |
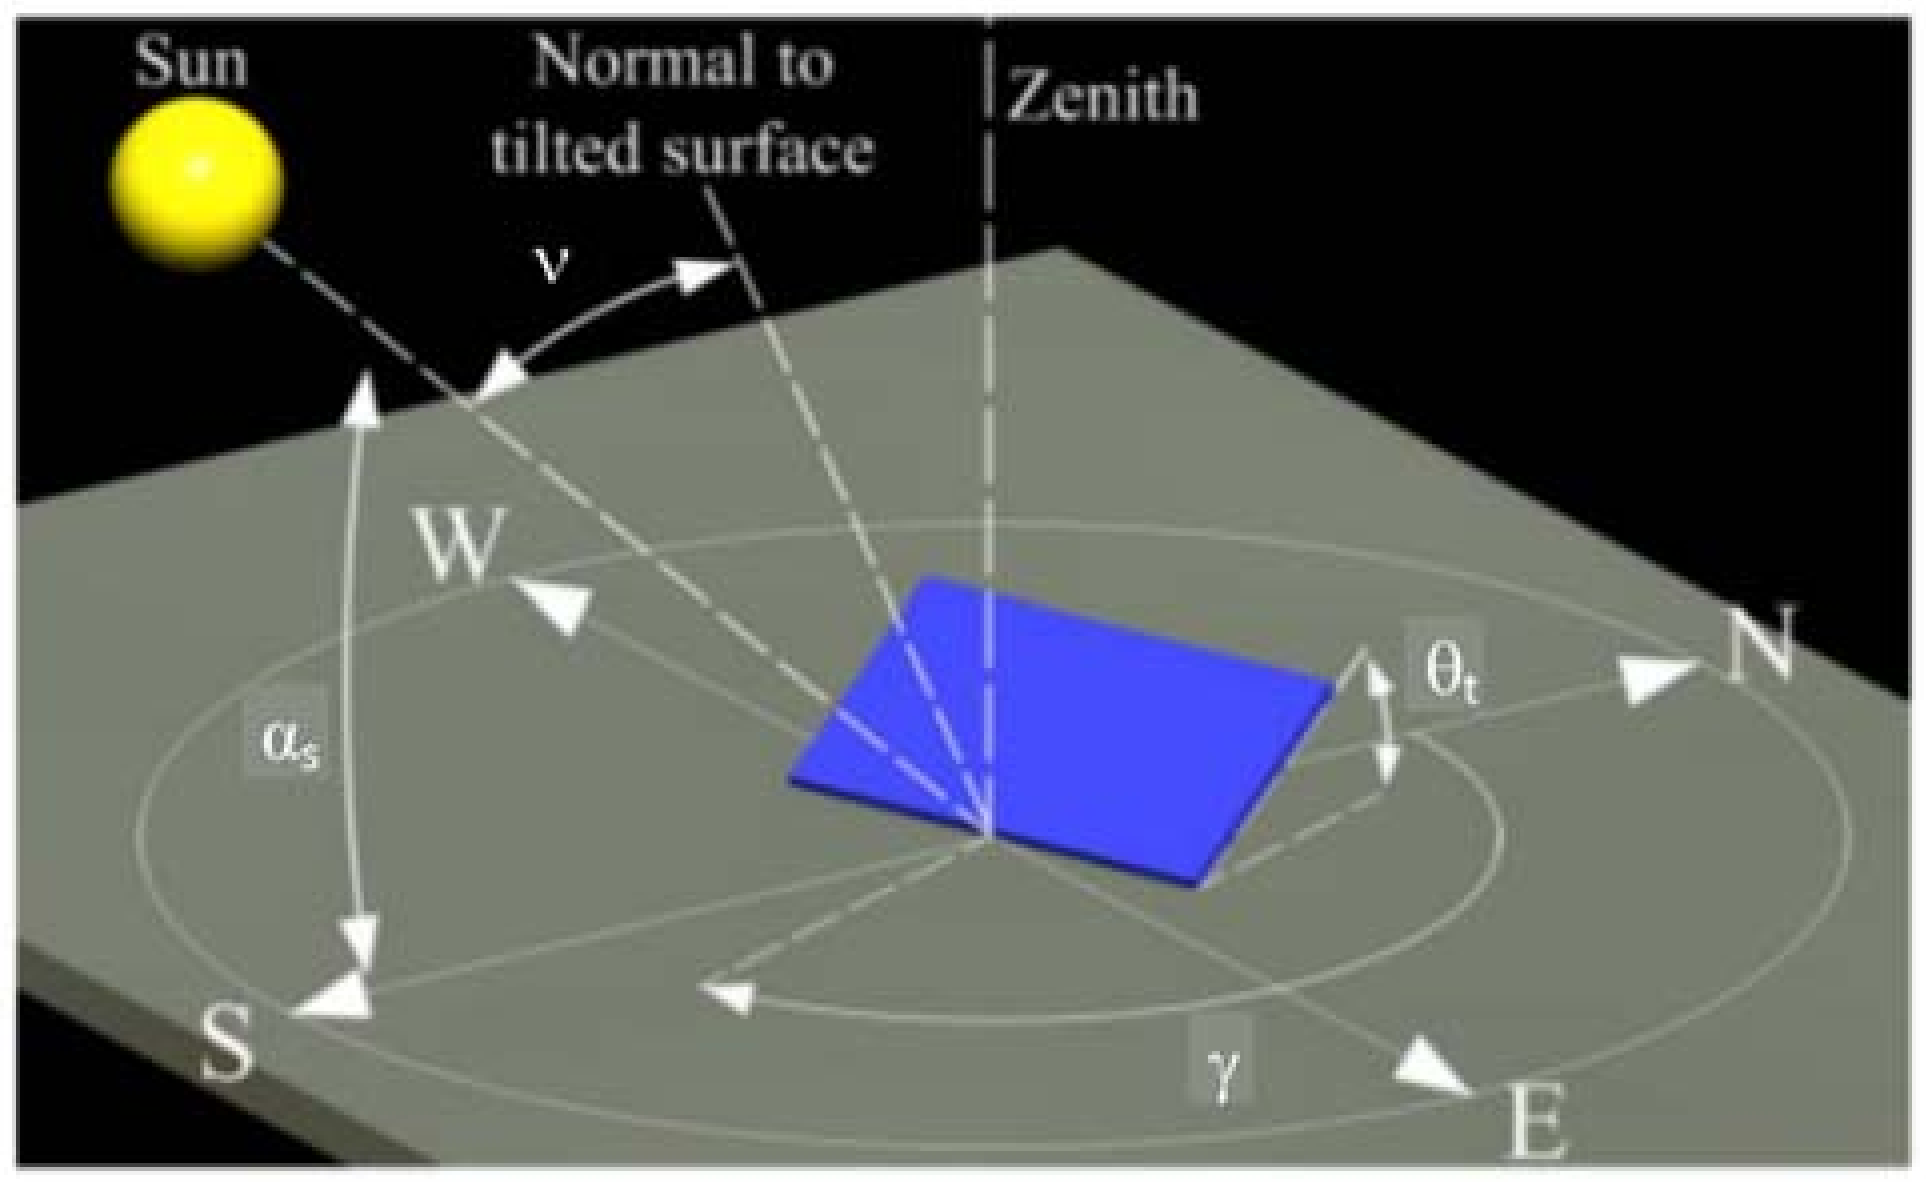
| αs | elevation solar angle (°) |
| ν | incident angle (°) |
| ηE | electrical efficiency |
| θa | acceptance angle (°) |
| θt | tilt angle of the glass cover (°) |
| Acronyms and abbreviations | |
| BP | Bypass |
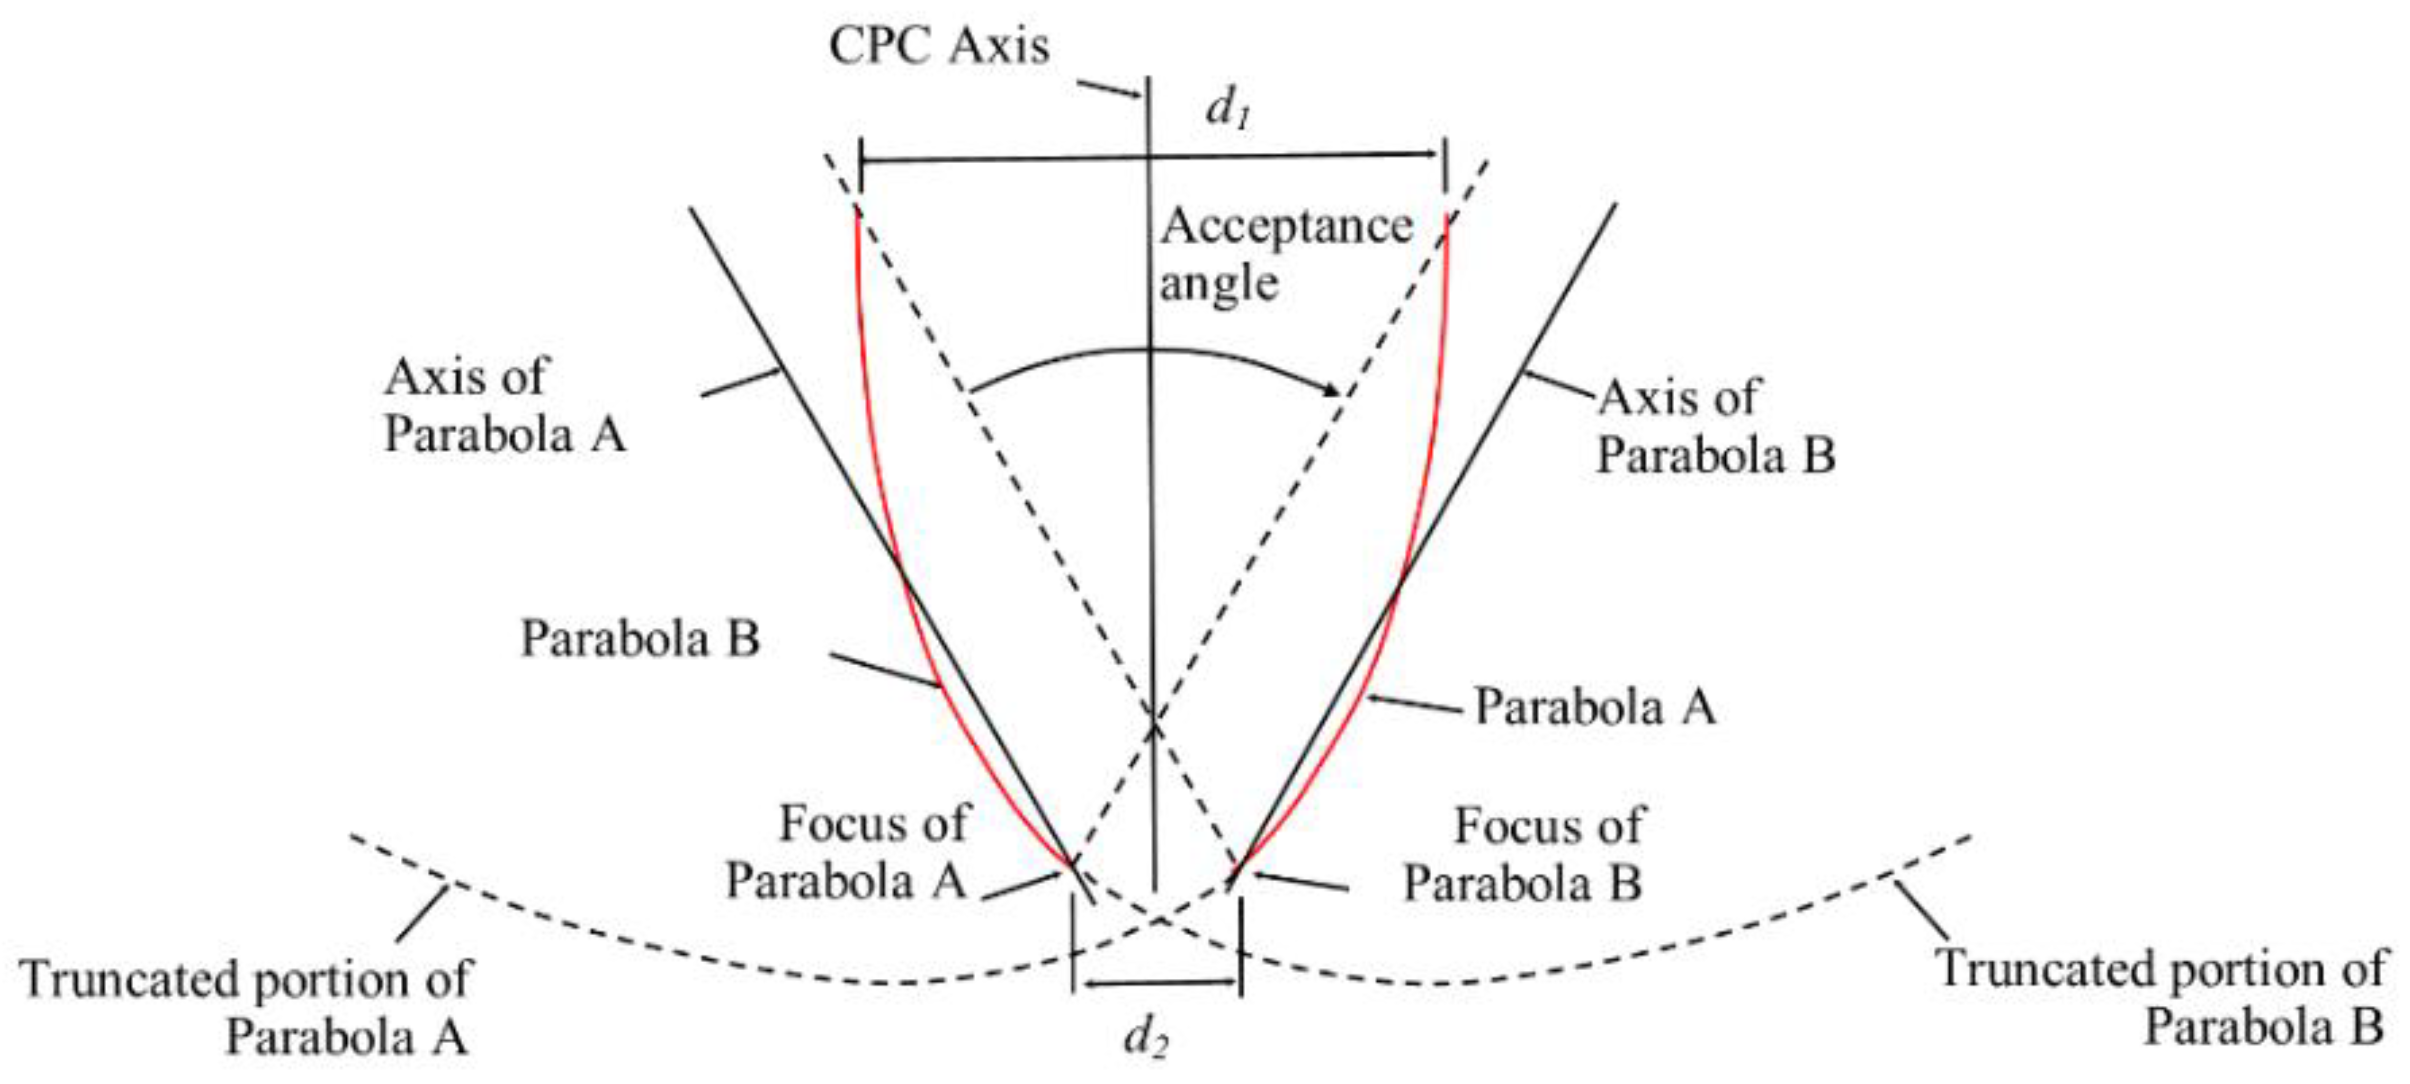
| CPC | Compound Parabolic Concentrator |
| C-PV | Concentrating Photovolaitc |
| CSP | Concentrated solar power |
| HC-PV | High Concentration Photovoltaic |
| LC-PV | Low Concentration Photovoltaic |
| MC-PV | Medium Concentration Photovoltaic |
| MaReCo | Maximum Reflector Collector |
| PV | Photovoltaic |
| PVT | Photovoltaic and Thermal |
References
- Bhor, S.J. Paris Agreement on Climate Change: A Booster to Enable Sustainable Global Development and Beyond. Int. J. Environ. Res. Public Health 2016, 13, 1134. [Google Scholar] [CrossRef] [PubMed]
- Zsiborács, H.; Baranyai, N.H.; Vincze, A.; Háber, I.; Pintér, G. Economic and Technical Aspects of Flexible Storage Photovoltaic Systems in Europe. Energies 2018, 11, 1445. [Google Scholar] [CrossRef]
- Baurzhan, S.; Jenkins, G.P. On-Grid Solar PV versus Diesel Electricity Generation in Sub-Saharan Africa: Economics and GHG Emissions. Sustainability 2017, 9, 372. [Google Scholar] [CrossRef]
- Gul, M.; Kotak, Y.; Muneer, T. Review on recent trend of solar photovoltaic technology. Energy Explor. Exploit. 2016, 34, 485–526. [Google Scholar] [CrossRef]
- Becker, R.; Thrän, D. Optimal Siting of Wind Farms in Wind Energy Dominated. Power Syst. Energies 2018, 11, 978. [Google Scholar]
- Koltun, P. Materials and sustainable development. Prog. Nat. Sci. Mater. Int. 2010, 20, 16–29. [Google Scholar] [CrossRef]
- Avgerinou, M.; Bertoldi, P.; Castellazzi, L. Trends in Data Centre Energy Consumption under the European Code of Conduct for Data Centre Energy Efficiency. Energies 2017, 10, 1470. [Google Scholar] [CrossRef]
- Zweibel, K. The Terawatt challenge for thin film PV. In Thin Film Solar Cells: Fabrication, Characterization and Application; Poortmans, J., Archipov, V., Eds.; John Wiley: Hoboken, NJ, USA, 2005; pp. 18–22. [Google Scholar]
- Kazmerski, L. Solar photovoltaics R&D: At the tipping point: A 2005 technology overview. J. Electron Spectrosc. Relat. Phenom. 2006, 150, 105–135. [Google Scholar]
- Aschilean, I.; Rasoi, G.; Raboaca, M.S.; Filote, C.; Culcer, M. Design and Concept of an Energy System Based on Renewable Sources for Greenhouse Sustainable Agriculture. Energies 2018, 11, 1201. [Google Scholar] [CrossRef]
- Arikan, E.G.; Glu, S.A.; Gazi, M. Experimental Performance Analysis of Flat Plate Solar Collectors Using Different Nanofluids. Sustainability 2018, 10, 1794. [Google Scholar] [CrossRef]
- Qiu, S.; Solomon, L.; Rinker, G. Development of an Integrated Thermal Energy Storage and Free-Piston Stirling Generator for a Concentrating Solar Power System. Energies 2017, 10, 1361. [Google Scholar] [CrossRef]
- Llamas, J.M.; Bullejos, D.; Adana, M.R. Techno-Economic Assessment of Heat Transfer Fluid Buffering for Thermal Energy Storage in the Solar Field of Parabolic Trough Solar Thermal Power Plants. Energies 2017, 10, 1123. [Google Scholar] [CrossRef]
- Tien, N.X.; Shin, S. A Novel Concentrator Photovoltaic (CPV) System with the Improvement of Irradiance Uniformity and the Capturing of Diffuse Solar Radiation. Appl. Sci. 2016, 6, 251. [Google Scholar] [CrossRef]
- Famosoa, F.; Lanzafamea, R.; Maenzaa, S.; Scanduraa, P.F. Performance comparison between Low Concentration Photovoltaic and fixed angle PV systems. In Proceedings of the 69th Conference of the Italian Thermal Engineering Association (ATI 2014), Milan, Italy, 10–13 September 2014; Volume 81, pp. 516–525. [Google Scholar]
- Khamooshi, M.; Salati, H.; Egelioglu, F.; Faghiri, A.H.; Tarabishi, J.; Babadi, S. A Review of Solar Photovoltaic Concentrators. Int. J. Photoenergy 2014, 2014. [Google Scholar] [CrossRef]
- Pérez-Higueras, P.; Muñoz, E.; Almonacid, G.; Vidal, P. High-concentrator photovoltaics efficiencies: Present status and forecast. Renew. Sustain. Energy Rev. 2011, 15, 1810–1815. [Google Scholar] [CrossRef]
- Torres, J.P.N.; Nashih, S.K.; Fernandes, C.A.F.; Leite, J.C. The effect of shading on photovoltaic solar panels. Energy Syst. 2018, 9, 195–208. [Google Scholar] [CrossRef]
- Carotenuto, P.; Curcio, S.; Manganiello, P.; Petrone, G.; Spagnuolo, G.; Vitelli, M. Algorithms and devices for the dynamical reconfiguration of PV arrays. In Proceedings of the PCIM Europe 2013, Nuremberg, Germany, 14–16 May 2013; pp. 765–772. [Google Scholar]
- Balato, M.; Constanzo, L.; Vitelli, M. Multi-Objective Optimization of PV arrays performances by means of the dynamical reconfiguration of PV modules connections. In Proceedings of the 4th International Conference on Renewable Energy Research and Applications, Palermo, Italy, 22–25 November 2015; pp. 1646–1650. [Google Scholar]
- Herrando, M.; Markides, C. Hybrid PV and solar-thermal systems for domestic heat and power provision in the UK: Techno-economic considerations. J. Appl. Energy 2016, 161, 512–532. [Google Scholar] [CrossRef]
- Tang, J.; Yu, Y.; Tang, R. A Three-Dimensional Radiation Transfer Model to Evaluate Performance of Compound Parabolic Concentrator-Based Photovoltaic Systems. Energies 2018, 11, 896. [Google Scholar] [CrossRef]
- Krishna, N.; Venkat, K.; Murugan, E. Power Analysis of non-tracking PV system with low power RTC based sensor independent solar tracking (SIST) PV system. Mater. Today Proc. 2018, 5, 1076–1081. [Google Scholar] [CrossRef]
- Barell, L.; Bidini, G.; Bonucci, F.; Castellini, L.; Castellini, S.; Ottaviano, A.; Pelosi, D.; Zuccari, A. Dynamic Analysis of a Hybrid Energy Storage System(H-ESS) Coupled to a Photovoltaic (PV) Plant. Energies 2018, 11, 396. [Google Scholar] [CrossRef]
- Gomes, J.; Luc, B.; Fernandes, C.A.F.; Torres, J.P.N.; Olsson, O.; Branco, P.J.C.; Nashih, S.K. Analysis of different C-PVT reflector geometries. In Proceedings of the IEEE International Power Electronics and Motion Control Conference (PEMC), Varna, Bulgaria, 25–28 September 2016. [Google Scholar]
- Monika, A. Solar Thermal Collectors at High Latitudes, Design and Performance of Non-Tracking Concentrators. Ph.D. Thesis, Uppsala University, Uppsala, Sweden, 2012. [Google Scholar]
- Bernanrdo, R.; Davidsson, H.; Karlsson, B. Performance Evaluation of a High Solar Fraction CPC-Collector System. Jpn. Soc. Mech. Eng. J. Environ. Eng. 2011, 6, 680–692. [Google Scholar]
- Bernardo, R.; Perers, B.; Håkansson, H.; Karlsson, B. Performance Evaluation of Low Concentrating Photovoltaic/Thermal Systems: A Case Study from Sweden. Sol. Energy 2011, 85, 1499–1510. [Google Scholar] [CrossRef]
- Bernardo, R.; Davidsson, H.; Gentile, N.; Mumba, C.; Gomes, J. Measurements of the Electrical Incidence Angle Modifiers of an Asymmetrical Photovoltaic/Thermal Compound Parabolic Concentrating–Collector. Sci. Res. Eng. 2013, 5, 37–43. [Google Scholar]
- Ngoc, T.N.; Phung, Q.N.; Tung, L.N.; Sanseverino, E.R.; Romano, P.; Viola, F. Increasing efficiency of photovoltaic systems under non-homogeneous solar irradiation using improved Dynamic Programming methods. Sol. Energy 2017, 150, 325–334. [Google Scholar] [CrossRef]
- Spence, G.; Murty, M. General ray-tracing procedure. JOSA 1962, 52, 672–676. [Google Scholar] [CrossRef]
- Wendelin, T.; Lewandowski, A.; Dobos, A. SolTrace; National Renewable Energy Laboratory (NREL): Golden, CO, USA, 2012. [Google Scholar]
- Puerto, J.M. Performance Evaluation of the Solarus AB Asymmetric Concentrating Hybrid PV/T Collector. Master’s Thesis, University of Gavle, Gavle, Sweden, 2014. [Google Scholar]
- Diwan, L. Study of Optimizations in a Novel Asymmetric Photovoltaic/Thermal Hybrid Solar Collector. Master’s Thesis, Instituto Superior Técnico, Lisboa, Portugal, 2013. [Google Scholar]
- Giovinazo, C.; Bonfiglio, L.; Gomes, J.; Karlssson, B. Ray Tracing model of an Asymmetric Concentrating PVT. In Proceedings of the Eurosun 2014-International Conference on Solar Energy and Buildings, Aix-les-Bains, France, 16–19 September 2014. [Google Scholar]
- Hossain, M.; Saidur, R.; Fayaz, H.; Rahim, N.; Islam, M.; Ahamed, J.; Rahman, M. Review on solar water heater collector and thermal energy performance of circulating pipe. Renew. Sustain. Energy Rev. 2011, 15, 3801–3812. [Google Scholar] [CrossRef]
- Li, H.; Liu, Z.; Liu, K.; Zhang, Z. Predictive Power of Machine Learning for Optimizing Solar Water Heater Performance: The Potential Application of High-Throughput Screening. Int. J. Photoenergy 2017, 2017, 1–10. [Google Scholar] [CrossRef]
- Farooqui, S.Z. Determination of Performance Measuring Parameters of an Improved Dual Paraboloid Solar Cooker. Int. J. Photoenergy 2017, 2017. [Google Scholar] [CrossRef]
- Burhana, M.; Chuaa, K.J.E.; Ng, K.C. Sunlight to hydrogen conversion: Design optimization and energy management of concentrated photovoltaic (CPV-Hydrogen) system using micro genetic algorithm. Energy 2016, 99, 115–128. [Google Scholar] [CrossRef]


| Optical Elements | Optical Properties |
|---|---|
| Reflector | Reflectance (Measured according to norm ASTM891-87) = 95% |
| Glass | Transmittance (Measured according to norm ISO9050 for solar thermal) = 95% Refractive index = 1.52 |
| Plastic gables | Transmittance = 91% Refractive index = 1.492 |
© 2018 by the authors. Licensee MDPI, Basel, Switzerland. This article is an open access article distributed under the terms and conditions of the Creative Commons Attribution (CC BY) license (http://creativecommons.org/licenses/by/4.0/).
Share and Cite
Torres, J.P.N.; Fernandes, C.A.F.; Gomes, J.; Luc, B.; Carine, G.; Olsson, O.; Branco, P.J.C. Effect of Reflector Geometry in the Annual Received Radiation of Low Concentration Photovoltaic Systems. Energies 2018, 11, 1878. https://doi.org/10.3390/en11071878
Torres JPN, Fernandes CAF, Gomes J, Luc B, Carine G, Olsson O, Branco PJC. Effect of Reflector Geometry in the Annual Received Radiation of Low Concentration Photovoltaic Systems. Energies. 2018; 11(7):1878. https://doi.org/10.3390/en11071878
Chicago/Turabian StyleTorres, João Paulo N., Carlos A. F. Fernandes, João Gomes, Bonfiglio Luc, Giovinazzo Carine, Olle Olsson, and P. J. Costa Branco. 2018. "Effect of Reflector Geometry in the Annual Received Radiation of Low Concentration Photovoltaic Systems" Energies 11, no. 7: 1878. https://doi.org/10.3390/en11071878
APA StyleTorres, J. P. N., Fernandes, C. A. F., Gomes, J., Luc, B., Carine, G., Olsson, O., & Branco, P. J. C. (2018). Effect of Reflector Geometry in the Annual Received Radiation of Low Concentration Photovoltaic Systems. Energies, 11(7), 1878. https://doi.org/10.3390/en11071878