Optimal Power Dispatch of Small-Scale Standalone Microgrid Located in Colombian Territory


Departamento de Energía Eléctrica y Automática, Universidad Nacional de Colombia, Medellín 050041, Colombia
*
Author to whom correspondence should be addressed.
Energies 2018, 11(7), 1877; https://doi.org/10.3390/en11071877
Submission received: 25 June 2018
/
Revised: 7 July 2018
/
Accepted: 12 July 2018
/
Published: 19 July 2018
(This article belongs to the Special Issue Sustainable Energy Development Strategies: Energy Efficiency and Renewables)
Abstract
:An optimal power dispatch of a small-scale standalone microgrid for remote area power supply in Colombian territory is proposed in this paper. The power dispatch is generated by an energy management system based on a mixed-integer linear programming, which minimizes the cost of operating the microgrid while fulfilling the technical constraints of its elements. The energy management system solves an optimization problem using the algebraic representation of the generators and its constraints. Basic steady-state models of the generators are selected to solve the optimization problem. The small-scale microgrid is considered for a remote area power supply in Taroa, a small settlement in La Guajira, Colombia. The microgrid is composed of photovoltaic modules, a wind generator, a diesel generator, a battery bank, and residential loads. To validate the solution, the elements of the microgrids are parameterized with information from commercial equipment. Moreover, the power dispatch obtained with the proposed solution is compared with a power dispatch generated by a heuristic algorithm, which has been previously used to dispatch power in a small-scale standalone microgrid. Results show that the cost of operating the microgrid is minimized using the proposed optimization approach: a reduction of the operating cost equal to 25.5% of the cost imposed by the heuristic algorithm is obtained.
1. Introduction
In Colombia, there are currently 2.5 million people without access to electrical energy, and those people are located in rural areas far from the interconnected power system [1]. The high cost of the infrastructure needed to provide electric power to those areas, the low payment capacity of the people living in remote areas, and the low population density have limited the Colombian government institutions’ ability to cover the basic needs for those inhabitants. However, the geographical location of Colombia provides renewable resources that can be used to produce electricity. Moreover, the concept of small-scale standalone microgrids for remote area power supply (RAPS) could be a solution to provide electricity to people living in those areas [2]. Some efforts have been made by the Colombian Institute of Planning and Promotion of Energy Solutions for Non-interconnected Areas (IPSE). In a wide revision of the potential application of rural microgrids in Colombia, the authors of [3] highlight that government should be focus on training, research and implementation of microgrids to allow their deployment in the country. In that way, the authors of [4] proposed a methodology to design microgrids taking into account the electrical regulation of the country. The methodology covers the selection of generators and feeders, and it includes power electric analysis carried out in the Power System Analysis Toolbox (PSAT 2.1.2). However, information about the design of local control systems, communication systems and energy management systems (EMS) are not included.
One of the advantages of the deployment of microgrids that include renewable resources is the reduction of carbon emissions. However, minimizing carbon emissions requires specific solutions for each possible microgrid structures. The authors in [5] proposed a collaborative power dispatching system, which maximizes the profit of a regional biomass power system. The authors compared four scenarios and observed that biomass energy could replace thermal units, carbon emissions, and coal consumption would lie at a lower level, and a pumped storage unit could adjust the load fluctuations. The analysis shown that trading strategies could reduce the carbon emissions.
However, the deployment of a certain technology raises several challenges every day. In the case of microgrid technology, some of the most remarkable challenges are driven by the concept of smart microgrids. For example, real-time analyses are required for these new structures. In [6], the authors introduced a two-stage decision process to obtain analytical formulation proper for real time applications. The authors validated the proposed method in a modified benchmark developed by the Council on Large Electric Systems (CIGRE), which consists of an isolated microgrid. In [7], the authors presented the analytical formulation of the energy management problem of an isolated microgrid and its implementation in a centralized EMS. One of highlights offered by that work is the need for detailed three-phase models of the microgrid to account for voltage limits and achieve reactive power support. At the end, the authors stated that a complete real-time model of the microgrid that includes the effects of primary controllers is required for a more detailed analysis in the assessment of different solutions. The authors of [8] propose a demand response strategy for microgrids in a smart grid condition. An optimization of the operation of dispatchable sources is developed by the EMS of a microgrid according to real-time electricity prices and the state of the microgrid. In that work, the microgrid was connected to the electricity network.
Another challenge required by the concept of microgrids is to apply the traditional analysis including the flexibility offered by new computer processors, which allow us to implement more detailed models and consequently to realize more complex analysis. For example, power flows, stability, and short circuit analysis are required to plan and operate microgrids, taking into account their specific requirements. According to [9], it is possible to apply a hybrid bird-mating optimization approach to connection decisions of distribution transformers. This solution could mitigate the voltage imbalance supplying power effectively. This solution can be considered to properly connect transformers in microgrids. The authors in [10] proposed a direct building algorithm for microgrid distribution ground fault analysis. Specifically, the authors discussed the ground fault model of a battery energy storage system as a distributed energy resource, which is appropriated for the analysis of isolated or grid-connected microgrids. In [11,12], the authors proposed a novel unsymmetrical faults analysis method with hybrid compensation for distribution systems including microgrids. In [11] three-phase models are considered to analyze the unsymmetrical faults and the modeling of a microturbine generation was discussed. Methods of analysis such as those proposed in [9,10,11,12] are required to plan and operate microgrids safely.
Another challenge raise by the microgrid concept refers to design control systems to overcome the new operating scenarios. When isolated, microgrids are controlled with a distributed topology, and new controllers are required. In this way, strategies as the one presented in [13] could be implemented. The authors designed a novel voltage controller that exhibited three reactions when integrated a vanadium redox battery with solar energy. The combination of a renewable source with a storage unit will be useful for installed microgrids in several locations in Colombia. When microgrids have reactive power requirements, regulating the voltage of the microgrid and driving the reactive power should be achieved. A suitable control to solve this issue was presented in [14]. The authors used a microgrid model that integrates wind power, photovoltaic power, fuel cell power, a static var compensator, and an intelligent power controller. In that solution, the static var compensator supplied the reactive power and regulated the voltage of the microgrid. On the other hand, the balance of real power should be fast and stable in order to operate the microgrid in a safe way and with acceptable power quality indexes. As a possible solution, in [15], the authors proposed a hybrid real power control system. The approach integrates a radial basis function network and the Elman neural network to track the maximum power point of a wind turbine and a radial basis function network to track the maximum power of a solar array. The microgrid model used to validate the proposed solution integrates a wind turbine, a photovoltaic array, and a diesel engine with a synchronous generator. Another solution to damp oscillations in a microgrid was proposed in [16]. In that case, the considered microgrid includes a microturbine generation and a battery energy storage system. The authors proposed a novel intelligent damping controller for the static synchronous compensator. The controller consists of a proportional integral derivative linear controller, an adaptive critic network, and a functional link-based novel recurrent fuzzy neural network. The results shown that the novel controller stabilized the electric system under unstable conditions.
In a higher level of control applied to microgrids, the EMS usually rules the optimal dispatch of power of the distributed sources and reduces steady-state errors in both frequency and voltage. To develop those actions, the EMS uses forecast of electricity demand, forecast of energy sources availability, measurements of state of charge (SoC) of the battery bank, electricity demand and generation, and economic information. Several publications have been focused on the design of EMS applied to microgrids. For example, in [17], the authors applied two EMSs, one based on an intelligent genetic algorithm and the other one based on a mixed integer linear programming (MILP), both aimed at defining a short-term microgrid’s economic schedule. This strategy can be applied to dispatch power in small-scale microgrids and reducing their operating costs. Similarly, the MILP approach has been used in the design of an EMS for battery-based hybrid microgrids, in which the EMS provides the optimal power references to the generators [18]. The EMS takes into account a two-stage charge procedure for batteries. Therefore, the power delivered to the grid is limited while safe operation ranges of battery charge are achieved. The protection of batteries presented in [18] could be applied to small-scale standalone microgrids in order to enlarge the lifespan of the storage units and, consequently, to reduce the cost of the microgrid. In [19], the authors present the comparison of two EMS, one based on the MILP approach and the other one based on a heuristic algorithm, which is used to solve the power dispatch problem following a set of simple rules. The heuristic algorithm was proposed to dispatch the power in an isolated microgrid with photovoltaic generators as the only renewable resource.
Two main architectures have been proposed in the literature for designing the EMS. On one hand, the centralized approach gathers the information in a central controller that analyzes the data and sends control decisions to all controllable units of the microgrid. On the other hand, the decentralized approach proposes an intelligent cooperation between the different generation units to achieve the EMS goals. In [20], the authors presented a distributed economic dispatch for a microgrid with high renewable energy penetration and demand-side management operating in grid-connected mode. The optimal dispatch approach minimizes the microgrid net cost, which includes distributed generation costs and the distributed storage costs, utility of dispatchable loads, and worst-case transaction cost due the uncertainty in renewable energy sources. The optimization problem formulated is solved in a distributed way by the local controllers of distributed generation, distributed sources, and dispatchable loads. According to [21], the centralized architecture must be used when the microgrid operates in islanded mode in a relative small geographical extension where the microgrid size is expected to remain the same.
For EMS application in islanded microgrids, deterministic, heuristic, and stochastic approaches have been reported. In deterministic approaches, the mixed-integer linear programming has been commonly used [21]. This is the case reported in [7], in which a centralized EMS for isolated microgrids was proposed and the mathematical definition of the optimization problem, using the receding horizon control technique, was detailed. Furthermore, the optimization problem programming is divided into a linear and a non-linear part using MILP and nonlinear algorithm, respectively. That work can be extended by including into the optimization problem the SoC of the storage system at the end of the day, which is an important condition to guarantee the electricity service the next day. The authors in [22] proposed an EMS with the MILP approach for an islanded microgrid. The rolling horizon strategy was considered to solve the optimization problem. That work also highlights the need for studies where the economic benefits of implementing a control strategy will be evaluated. Therefore, the power dispatch of the microgrid and the SoC of the battery bank can be aggregated to evaluate the effectiveness of the MILP approach.
The objective of this work is to propose an optimal power dispatch of a small-scale standalone microgrid for remote area power supply in Colombian territory. The optimal power dispatch is developed by an EMS, which is considered as a centralized controller that dispatches the available power of the generators in the microgrid to minimize the operating cost. The proposed EMS methodology takes into account the constraints of generators and battery bank, including the SoC boundaries during the day and a specific SoC at midnight. The EMS is formulated by means of a mixed integer linear programming approach implemented in Matlab (R2018a). The methodology is applied to a microgrid model, which is constructed with datasheet information of several generators and battery banks. The load profile is constructed with information taken from the small settlement Taroa, located in the Department of La Guajira in Colombia, which has a limited access to electrical power. The proposed MILP approach finds the optimal power dispatch for 24 h together with the SoC of the battery and the cost of operating the microgrid. Such results are compared with the results obtained using the heuristic algorithm reported in [19] applied to the same microgrid model.
The rest of the paper is organized as follows: In Section 2, a methodology for the EMS design is presented, in which six steps are proposed to develop the methodology. Section 2 includes the mathematical models of the generators and the optimization problem definition. The EMS simulation results are presented and discussed in Section 3, which includes the power dispatch, the SoC of the battery bank, and the operating cost of the microgrid for 24 h. Conclusions close the paper in Section 4.
2. Methodology
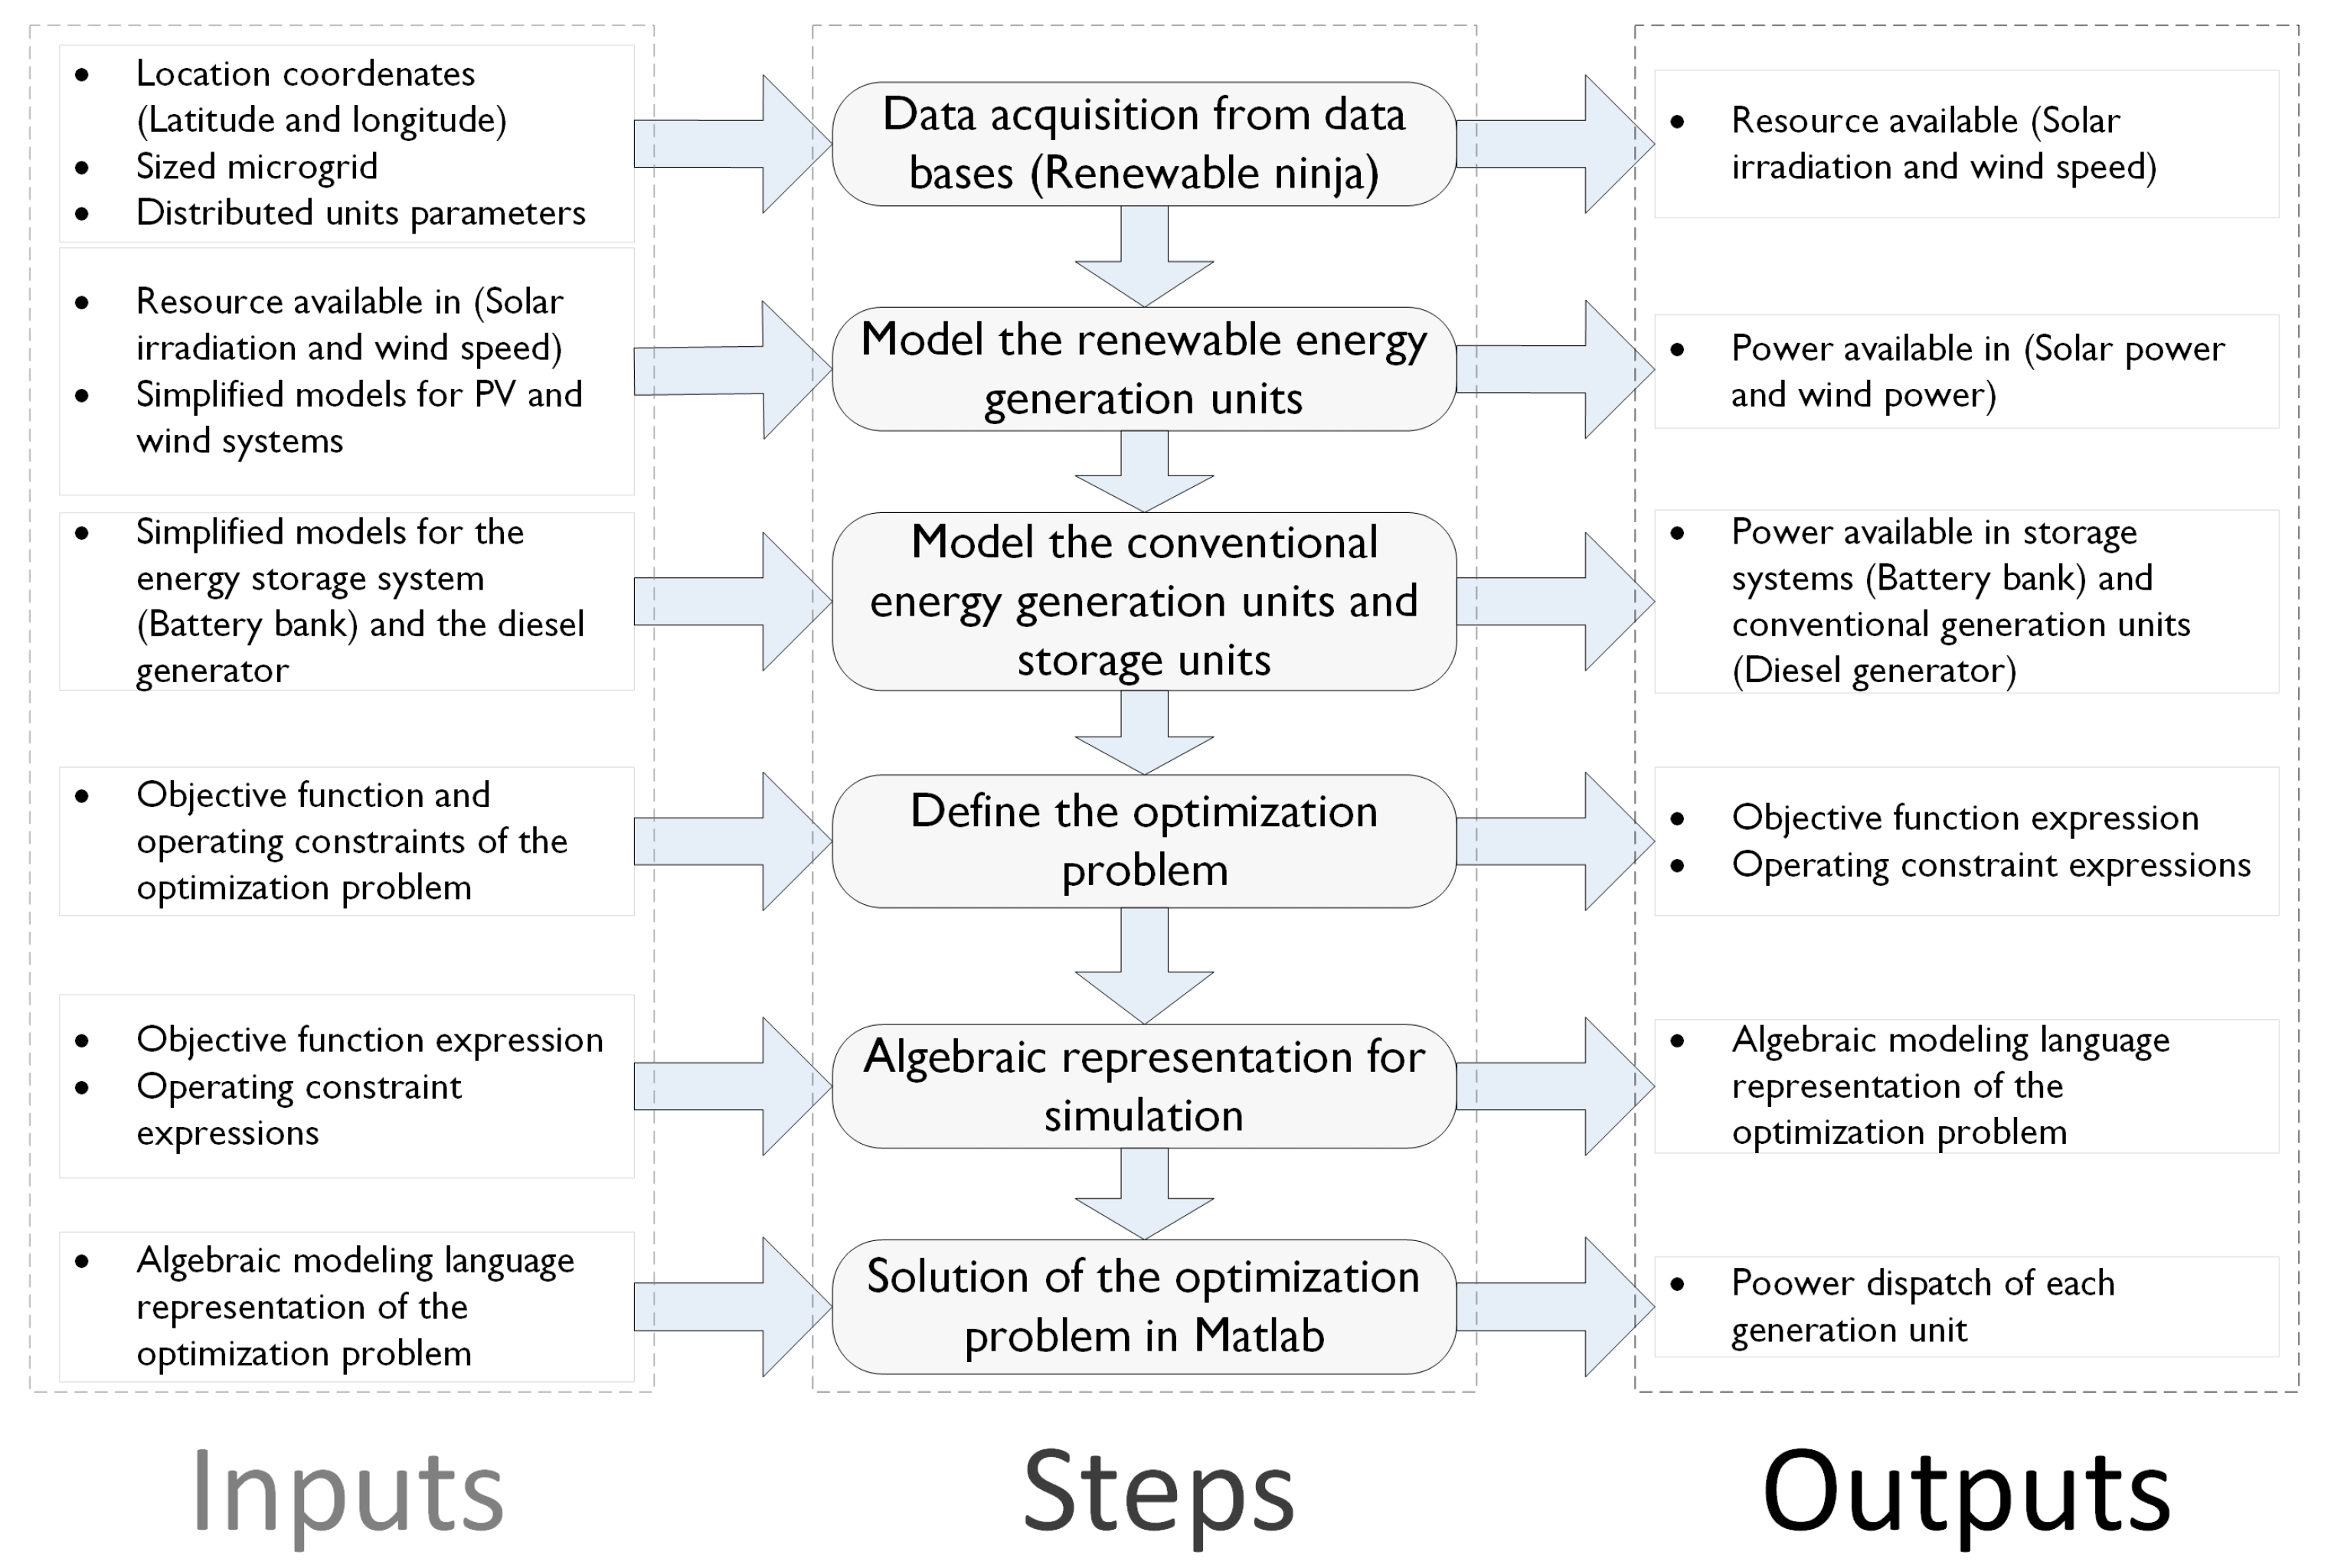
In this section, a methodology for EMS design is presented. The first step consists of acquiring forecast data of the energy resources available in the zone where the microgrid will be installed. In steps two and three, the selection or proposal of mathematical models for conventional and renewables generators and storage units is carried out. In the next step, an optimization problem is identified and consequently defined; in this step, constrains for each generator and the storage unit are defined. In the fifth step, the algebraic representation to simulate the microgrid and solve the optimization problem is presented. The optimization problem is solved, using the MILP approach implemented in Matlab, at the last step. Figure 1 summarizes those six steps, followed in the EMS design, using a flow chart. Moreover, the figure describes the main inputs and outputs of each step. In the following subsections, each step is described in detail.
2.1. Data Acquisition from Databases
Before designing the EMS, the microgrid should be sized and located. Moreover, the EMS requires forecast information of the available energy from renewable resources and the load curve. There are several databases available on internet with information about renewable resources around the word. Also, measurements can be made in the installation place of the intended microgrid installation. A very popular application on the internet is “Renewable ninja” [23], which estimates hourly data of solar and wind power together with the wind speed and solar irradiance for a location defined by a longitude and a latitude. In that application, it is possible to obtain information of several places in Colombia. In addition, the Institute of Hydrology, Meteorology and Environmental Studies (IDEAM) has interactive maps with information about the several renewables resources in Colombia [24].
To obtain the load curve, it is possible to use a standard load demand [25] or, if there is information about the number of users in the microgrid, the load profile can be estimated. In the Colombian Electrical Code [26], there is a procedure to obtain the load profile based on the maximum power per user, type of service, number of users, and electrical losses. That estimation method, presented in [4], is adopted for this work.
2.2. Modelling of Conventional and Renewables Generators and the Storage Unit
The selection of mathematical models of generators and the battery bank takes into account the strong computational effort required by the optimization process used to calculate the optimal power dispatch. In Colombia, the available non-conventional renewable energy sources are photovoltaic (PV) modules and wind turbines, which are represented using simplified steady-state models that include standard controllers to force the operation near the maximum power point. The steady-state models receive input values in time series form. Similarly, the diesel generator and the battery bank are modeled in order to represent the output power of each distributed unit. The models are described below.
2.2.1. Modelling of the Photovoltaic Module
Several models have been proposed to estimate the power of PV generators, or PV modules, with forecasting proposes [22,27,28]. In this work, the output power of the PV system PSmax is obtained as the product of solar irradiation RS and surface area of the PV generator AS. Also, a common efficiency of commercial PV panels is introduced (ηS ≈ 0.15). Equation (1) presents the mathematical expression of the PV array model, which produces a series of the maximum power in a time horizon. In such an expression, t is the current time step and T is the number of step considered for the analysis.
2.2.2. Modelling of the Wind Turbine
In [17,29], the authors estimate the output power of the wind turbine taking into account the tip speed ratio and the blade angle of the turbine rotor. In this work, the wind turbine is considered with fixed blades, and therefore the power coefficient is considered to vary with the tip speed ratio. As a result, the mathematical expression of a wind turbine producing a time series of the maximum power is presented in Equation (2). The wind power PEmax is the product of the wind speed v cubed in each time step with the swept area of the turbine blades AE, the air density ρ, and the power coefficient Cp. This coefficient depends on a conversion factor of the kinetic power into rotational power. As the Cp value in the wind turbine model is variable and it depends on the wind speed, the polynomial given in (3) is used to estimate Cp values for each v.
2.2.3. Modelling of the Battery Bank
The set of a battery bank and its power interface can be represented considering three different states of the set: charging, discharging, and stand-by [17,22,30,31]. The output power of the set PIn used with the battery bank is represented as the summation of charging PBc and discharging PBd power and an internal power consumed PIo. PBd is always positive, and PBc is always negative. Moreover, the discharging ηInd and charging ηInc efficiencies are incorporated as it is shown in Equation (4). Similar to the previous models, this representation generates a time series of the output power of the battery bank.
2.2.4. Modelling of the Diesel Generator
The output power of the diesel engine PD is estimated using Equation (5). The output power is calculated as the summation of each power value corresponding to each line segment in the non-linear characteristic curve that relates the output power and the fuel consumption of the diesel motor [22,31,32]. It should be noted that only one line segment should be activated at a given time. The mathematical steady-state model chosen to represent the diesel generator is reported in detail in [22].
In Equation (5), Pn is the power corresponding to a fuel consumption in each line segment of a characteristic curve, which is represented by means of a group of h linear segments. The amount of diesel q used to generate the diesel power PD is obtained from the non-linear characteristic curve. Thus, the amount of consumed diesel is modeled using Equation (6), where αn is the gradient of segment n, βn is the cut off of segment n in the axis of ordinates, and Bn is a variable that can be 1 to activate one line segment and can be 0 to deactivate a line segment. From here, it is concluded that the summation of the Bn values has to be equal to 1, or 0 when the diesel generator be turn off.
2.3. Optimization Problem Definition
The objective of the EMS is to provide an optimal power dispatch of the sources in the microgrid, minimizing the operating costs. Because the EMS will be applied to a small-scale microgrid located in Colombian territory, where there is governmental support for the use of renewable sources, only the costs related to the diesel usage in the power generation are taking into account in the proposed objective function (7).
In Equation (7), CD is the operating cost related with the fuel, Cst is the cost of start-up the diesel engine, and δt is the duration of the time step in hours. Next, the constraints of the problem are defined. When a power dispatch in a microgrid if solved using optimization approaches, it is usual to define the power balance as the principal constraint, which is defined in Equation (8).
In such an expression, PS is the solar power, PE is the wind power, and PL is the load demand. Moreover, additional constraints are defined for each unit of distributed generation and the unit of storage. For the PV module and the wind turbine, two boundaries are defined as reported in Equations (9) and (10).
For the diesel generator model, the activation of only one segment in the characteristic curve must be guaranteed. Therefore, the binary variables Bn is restricted as the inequalities given in Equation (11). Also, the minimum and maximum values of the power range and the produced power Pn of each line segment are included in the next inequality.
Consequently, the cost of the fuel during the operating of the diesel engine and the cost of the fuel during its start-up are defined as it is given in Equations (12) and (13), respectively, where Dprice and stprice are the prices for diesel consumption during steady-state operation and the start-up of the diesel engine, respectively.
In the solution of the optimization problem, the SoC of the battery is calculated using the recursive Equation (14). On the other hand, the boundaries of the SoC are considered as inequalities in Equation (15). The lifespan of the battery can be extended if its SoC is kept equal or above SoCmin and equal or below SoCmax. Additionally, in order to guarantee that the microgrid can supply the load demand in the mornings, a specific value for the SoC is programmed in the optimization algorithm SoCfinal. The algorithm will dispatch the battery bank keeping the SoCfinal at the end of the day and consequently the microgrid will keep stored energy for the next cycle.
Constraint (15) is introduced to guarantee power availability in the next morning, which enables to compensate the absence of solar irradiance or wind during the night, and to avoid the costly startup of the diesel generator. Equation (16) is introduced to limit the output power of the storage unit model to be in one state only, i.e., charging or discharging. Finally, the power boundaries for the battery bank are defined in Equations (17) and (18), where Bd and Bc are binary variables reporting the battery bank operation, i.e., discharging or charging state. PBd_max and PBc_max are the boundaries for the discharging and charging power of the battery, respectively.
It must be noted that the inverter power PIn, defined in Equation (4), is positive when the battery bank is working in discharging mode and negative when the battery bank is running in charging mode.
2.4. Algebraic Representation to Solve the Optimization Problem
Here, mixed integer linear programming is used to solve the optimization problem defined in step 4 of Figure 1. The MILP is selected because the model includes real variables, e.g., the dispatched solar power, and binary variables, e.g., the battery bank state. Binary variables are widely used as integer variables type in MILP and are usually codified as 1 or 0 [33]. In this case, the problem formulated is the following: provide an optimal power dispatch of the distributed units of an isolated microgrid during an operation day, divided into 24 h, which definition includes some binary variables; thus, a MILP is proposed. To program and solve the optimization problem as a MILP, the problem defined in step 4 should be written in an algebraic modeling language, as shown in Equation (19), which is a general form of that kind of representations [33].
In Equation (19), f(x,z) is the objective function, x is the vector of output variables, z is the vector of binary variables and Ci and CN are vectors with the associated costs of output and binary variables, T represents the transpose of a vector or a matrix, G is the representation of equality constraints, H is the representation of inequality constraints, and b and d are constants associated with the equality and inequality constraints, respectively. Therefore, the objective function is written as the product of the vector of costs and the vector of output variables as it is shown in Equation (20), where I is the number of output variables.
Likewise, the equality constraints are written as the product of the equality matrix coefficients and the output variables vector as give in Equation (21), where G is the algebraic representation of the equality constraints, Aeq is the equality matrix, aeq are the coefficients related to each output variable and constraint, and m is the number of equality constraints.
Similarly, H is the algebraic representation of the inequality constraints, which are written as the product of the inequality matrix coefficients and the output variables vector as given in Equation (22). In that expression, A is the inequality matrix, a is the coefficients related to each output variable and constraint, and p is the number of inequality constraints.
Because the operation of the microgrid is analyzed into 24 h, each output variable is considered different for each hour, i.e., 24 variables are programmed for each real output variable. Thus, the coefficients of C, Aeq, and A, the variables of x, and the constants of b and d, must be defined for each time step, in this case for each hour. To follow the linear algebra theory, the coefficients of C are expanded using the vector of ones given in Equation (23), and the coefficients of Aeq and A are expanded using the identity matrixes given in Equations (24) and (25).
When coefficients change through the time step, the ones are changed for the number affecting the coefficient.
2.5. Approximations and Limitations of the Proposed Optimal Power Dispatch
The planning and operation of microgrids is been supported by several analyses. Traditional analysis such as feeder capacity, power flow, stability, and short circuit can be carried out to plan and operate microgrids safely. Additionally, all the knowledge and technologies that had been used with power and distributions systems can be used in the microgrid paradigm. Last situations create a lot of scenarios to be analyzed, and therefore it is necessary that every knew solution states it scope and limitations clearly.
The EMS structure presented in this paper achieves an optimal power dispatch for small-scale standalone microgrids. The energy management system is programmed as a centralized controller that dispatches the available power of generators and a storage unit, minimizing the operating cost of the microgrid. To develop the optimization, the EMS considers the power balance in the microgrid as the main restriction. Also, maximum power extraction and ideal voltage and frequency control is considered for all the elements in the microgrid. The wind generator, the solar generator, the diesel generator, the battery bank, and the load are considered as concentrated elements and connected to a bus, i.e., feeders are neglected and, consequently, so are the feeder electrical losses.
The models of the elements in the microgrid are chosen as simplified steady-state models to reduce the computational effort of the optimization process, but we verify, in the literature review, that they are enough to receive the specific inputs and to show the real power balance in the microgrid. Another advantage of choosing simple models to represent the elements of the microgrid is that it is the simple way to transform those models to be used in real-time applications.
3. Results and Discussion
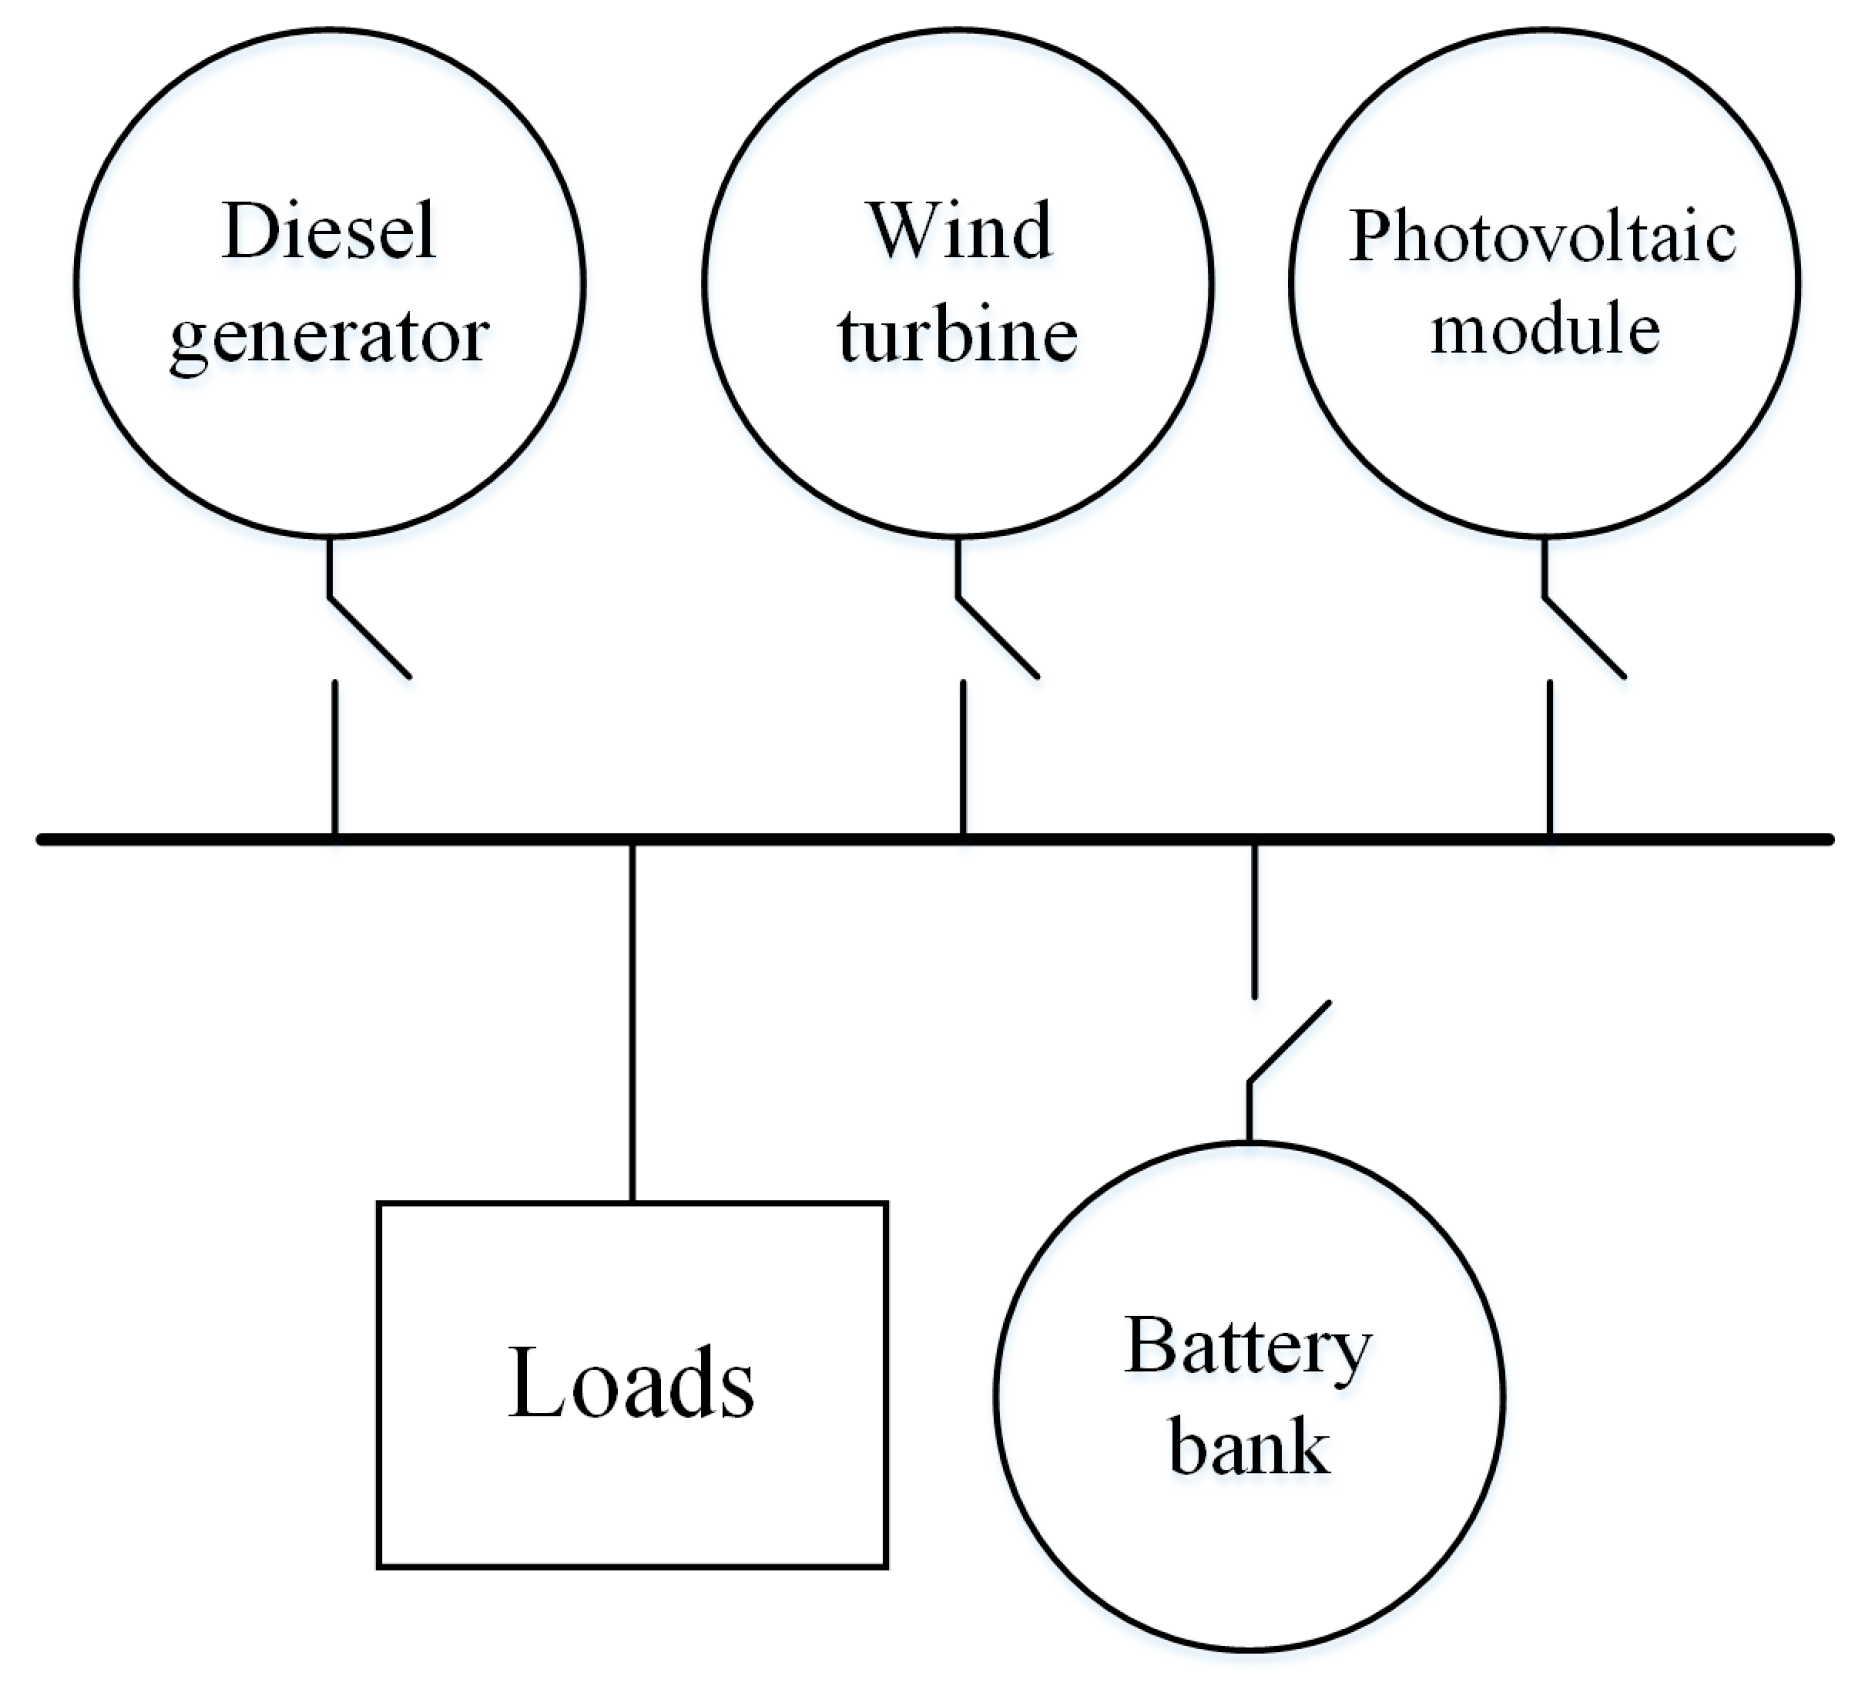
The optimal power dispatch technique proposed in this paper is applied to a realistic microgrid model. The sizing process of the sources and storage unit of the microgrid is reported in [4], where the load profile was also estimated. The study was performed using the meteorological information of the small settlement Taroa, located in la Guajira, Colombia. To support a future implementation of the microgrid, their sources and storage unit models are parametrized with commercial equipment. Moreover, to evaluate the performance of the proposed solution, the same microgrid is operated using the heuristic algorithm reported in [19] for comparison purposes. That algorithm follows a set of rules aimed to reduce the operating cost of the microgrid. Results offered by both approaches, in the form of power dispatch and operating cost calculated in American dollars, are compared to validate the development of the optimal power dispatch. To provide a fair comparison, the same power availability and load demand are used for both approaches. In Figure 2, the line diagram of the microgrid topology is presented; the diesel generator, the wind turbine, the photovoltaic module, the loads, and the battery bank are considered as concentrated elements and are connected to a bus.
3.1. Case Study
The case study consists of a microgrid formed by a PV generator, a wind generator, a battery bank, a diesel generator, and a set of loads. To develop the power dispatch, each element is considered as a concentrated one. Moreover, distribution power losses, reactive power exchange, and voltage changes in nodes of the microgrid are neglected in the dispatch calculation. To size the generators, meteorological information corresponding to the geographical coordinates 12.4° of latitude and −71.6° of longitude were used, i.e., the small settlement Taroa in Colombia. In Taroa the average temperature is 30 °C, with a maximum temperature equal to 42 °C. Moreover, the settlement is in a coastal area at 11 meters above sea level. The solar irradiance and the wind speed were obtained from the databases Surface Meteorology and Solar Energy from the National Aeronautics and Space Administration (NASA) [4]. The maximum power in the load demand curve was estimated using a Colombian regulation procedure, which is detailed in [4].
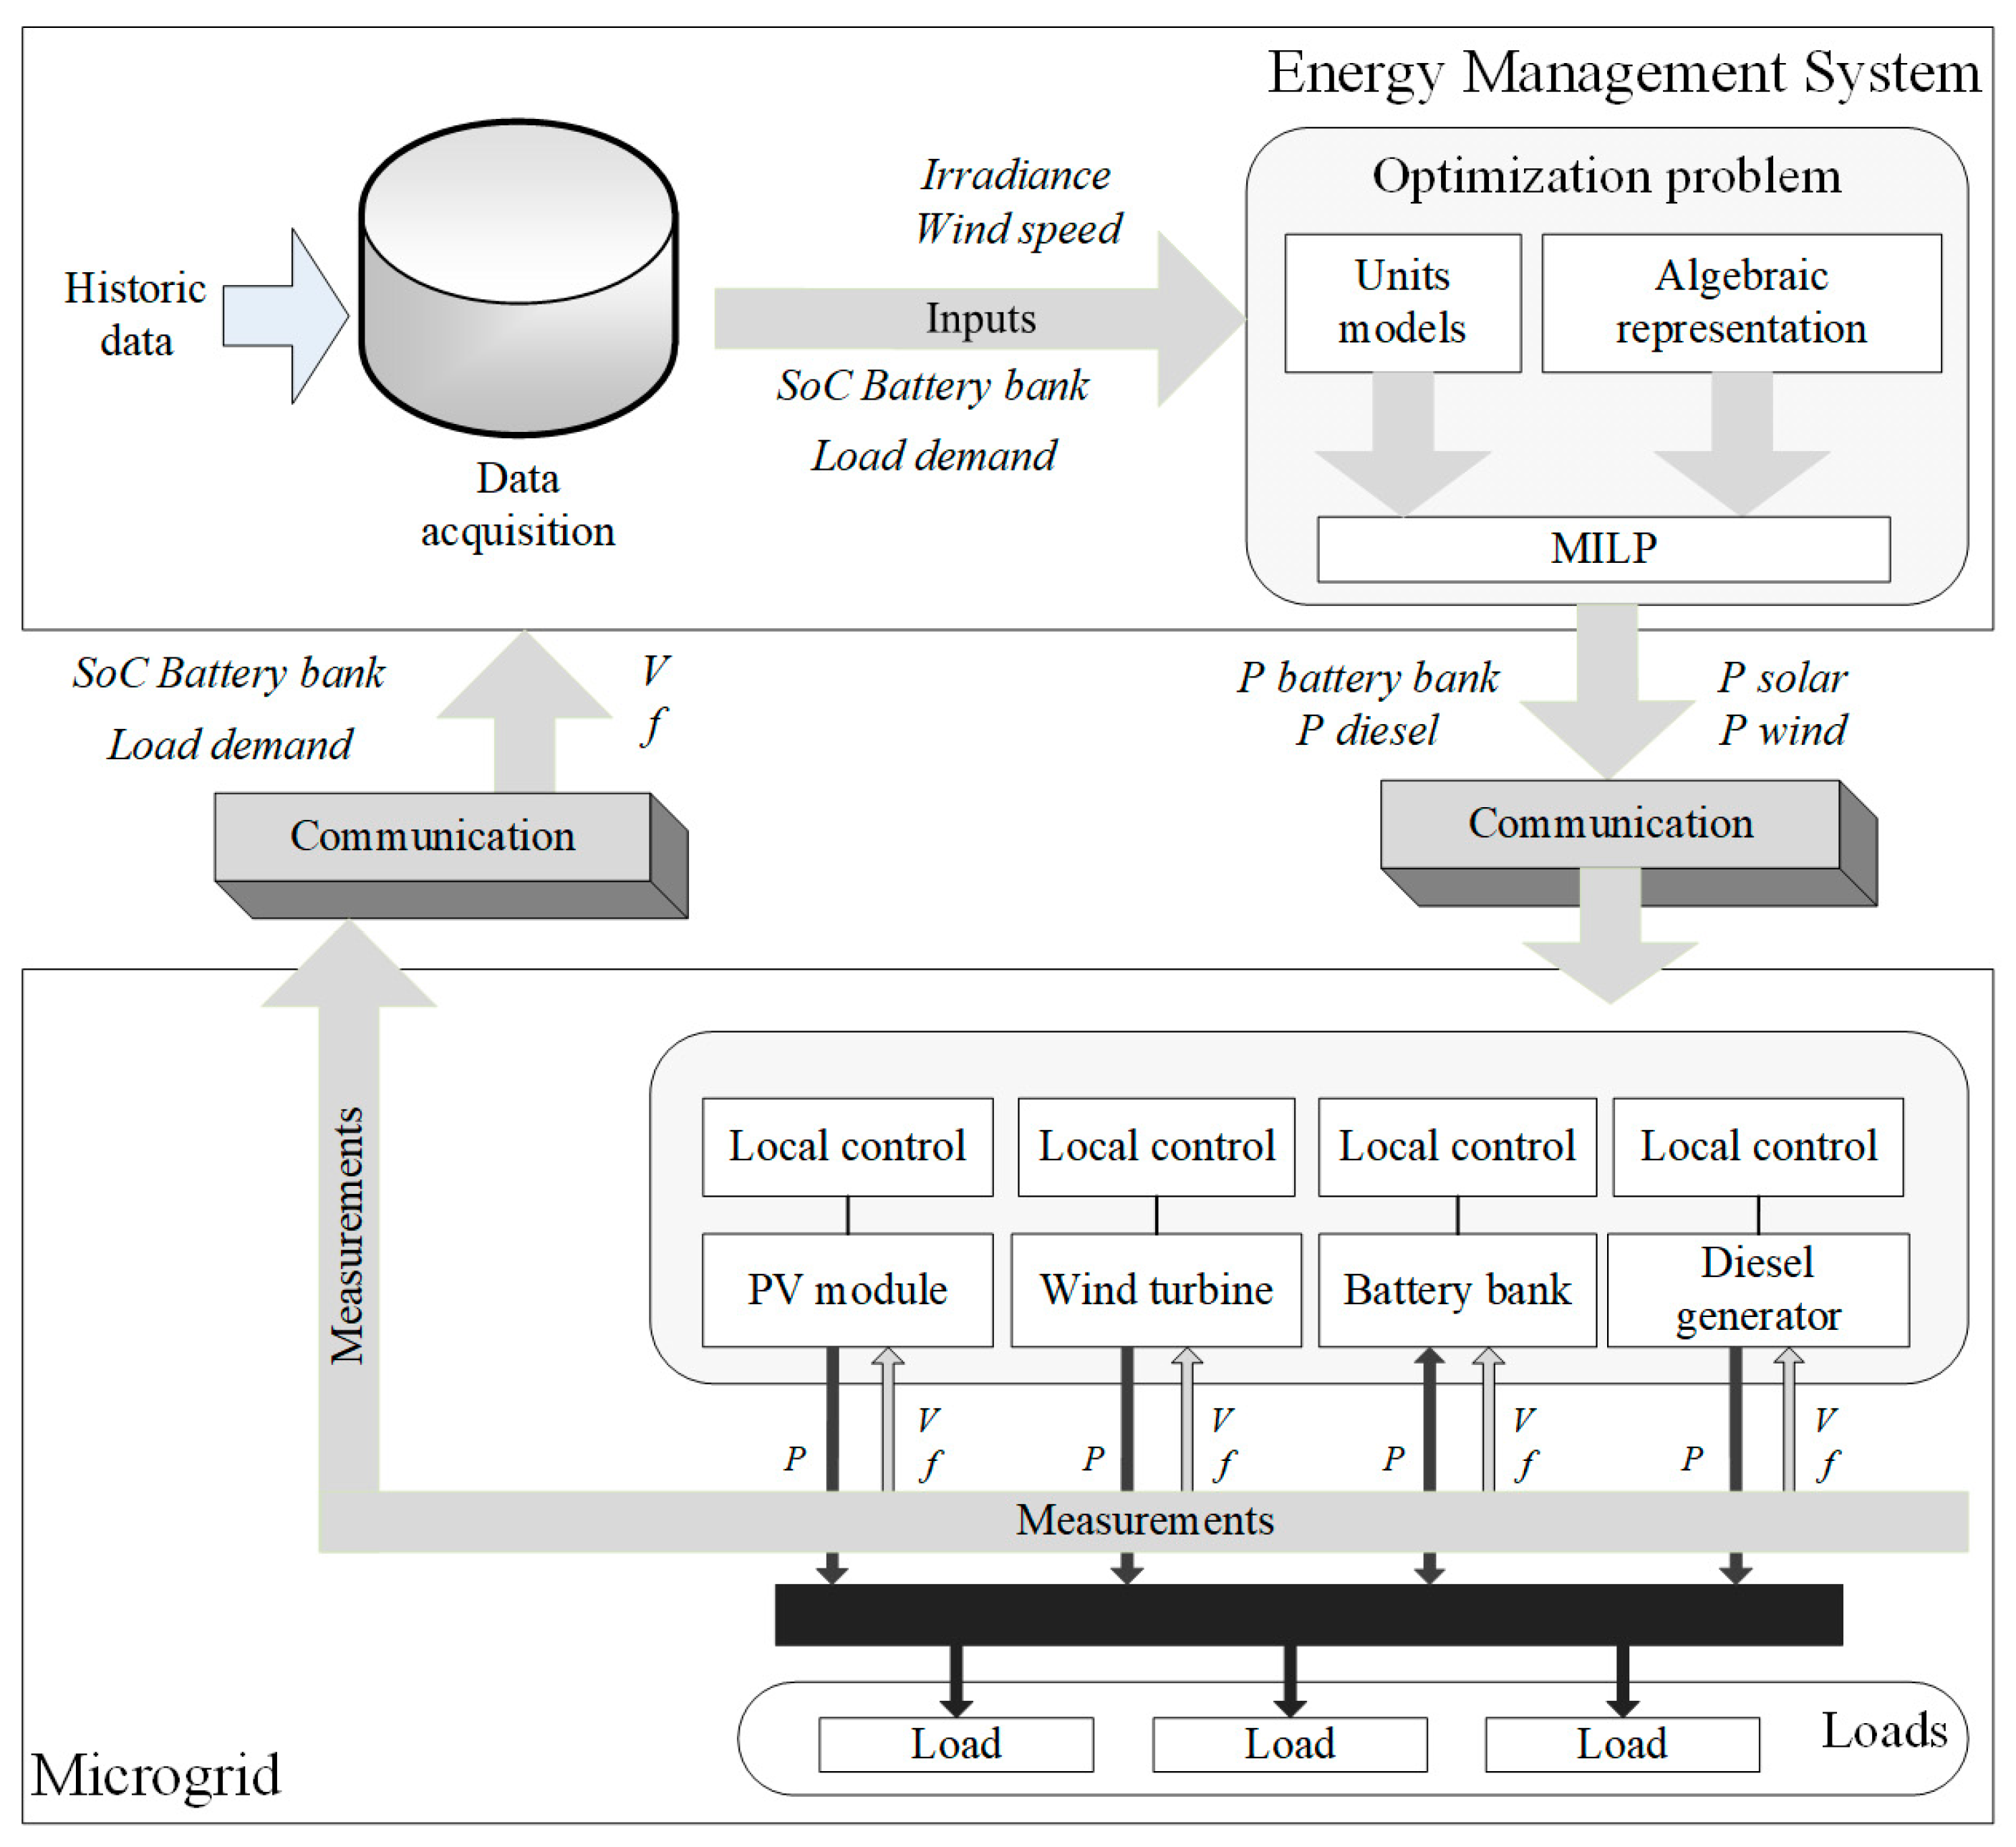
Figure 3 shows the microgrid topology and a flow diagram of both the information and measurements. In the top of Figure 3, the EMS is presented. The inputs for the EMS are the 24-h predictions of the irradiance, wind speed, state of charge of the battery, and the load demand.
In a physical microgrid, some considerations determine the selected communication system, e.g., the geographic location, electromagnetic interference, etc. Such a communication system is represented in the middle of Figure 3. In addition, the power references are sent to both the sources and the storage unit using the measurement channel. Finally, meteorological information and load profile behavior are sent to the database in order to increase and update the historic data set.
In the bottom of Figure 3, the microgrid topology is shown. The black arrows represent active power directions. For this reason, the arrow in the battery bank has two directions. The grey arrows represent the measurement and collection of several variables such as wind speed, sun irradiance, active power, SoC of the battery bank, voltage, frequency, etc. In this case, only active power and SoC of the battery bank are used to process the EMS. In this analysis, the voltage and frequency are considered constant, which means that every source has a local control that regulates those variables.
The parameters of each generator and the storage unit are obtained from commercial equipment. The selected devices match the power obtained in the sizing process described in [4]. The PV generator has maximum power of 5 kW, which is represented by 20 Sunmodule panels of 250 Wp with an efficiency of 14.91% each [34]. The wind generator has a maximum power of 3.2 kW and the rotor swept area is 14.93 m2, that information corresponds to a wind turbine Windera S of 3.2 kW [35]. The storage unit is represented with the information of three Aspen 48S of 2.2 kWh batteries [36]. Finally, the diesel generator model is parameterized with the information of a 5.3 kW GBA7L diesel generator [37]. The price of one liter of diesel is assumed to be 1 USD, and the startup price is 2 USD. Because there is not enough wind power in the mornings to totally supply the load demand, a SoC threshold is imposed in the optimization algorithm to storage energy in the battery and supply the difference between the demanded and the produced power during the first hours of the day. In the reviewed literature there is not a clear criterion to define a possible value for that limit. In this case, taking into account that the proposed approach uses this limit in the battery just at the end, a 70% SoC was selected. Heuristic and analytical methods are required to support the selection of that threshold. The parameters of the microgrid model are presented in Table 1.
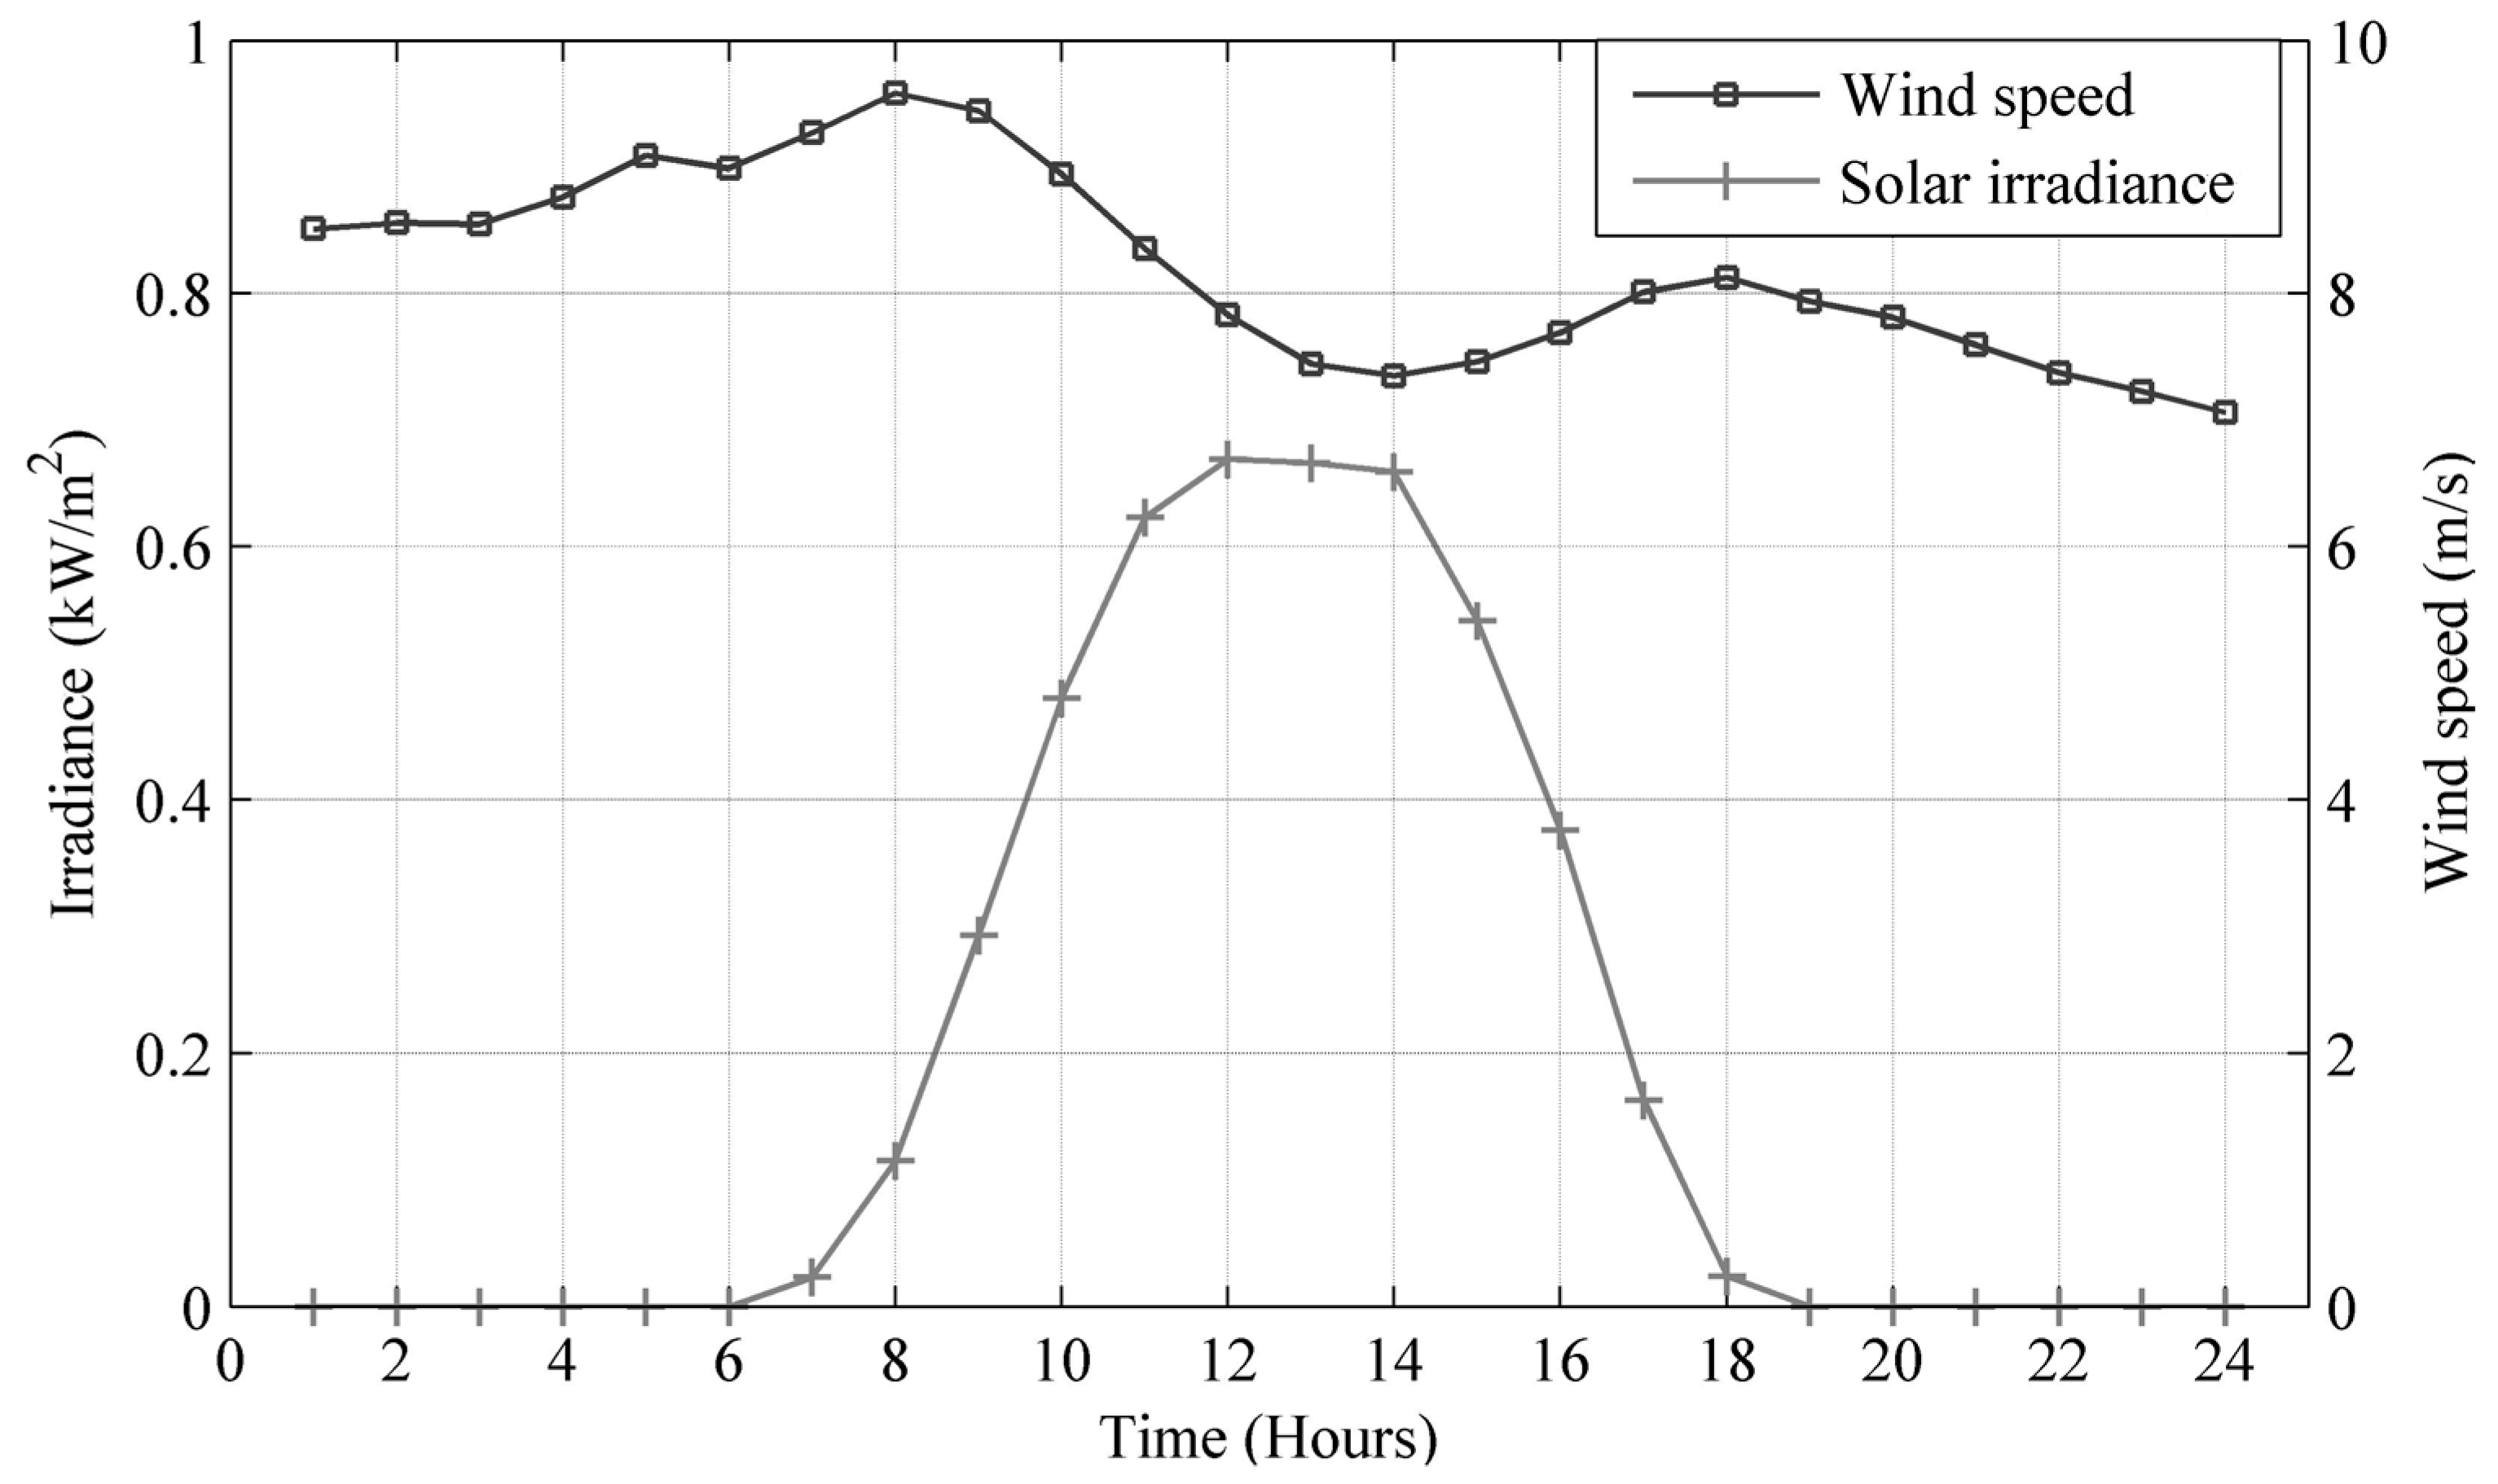
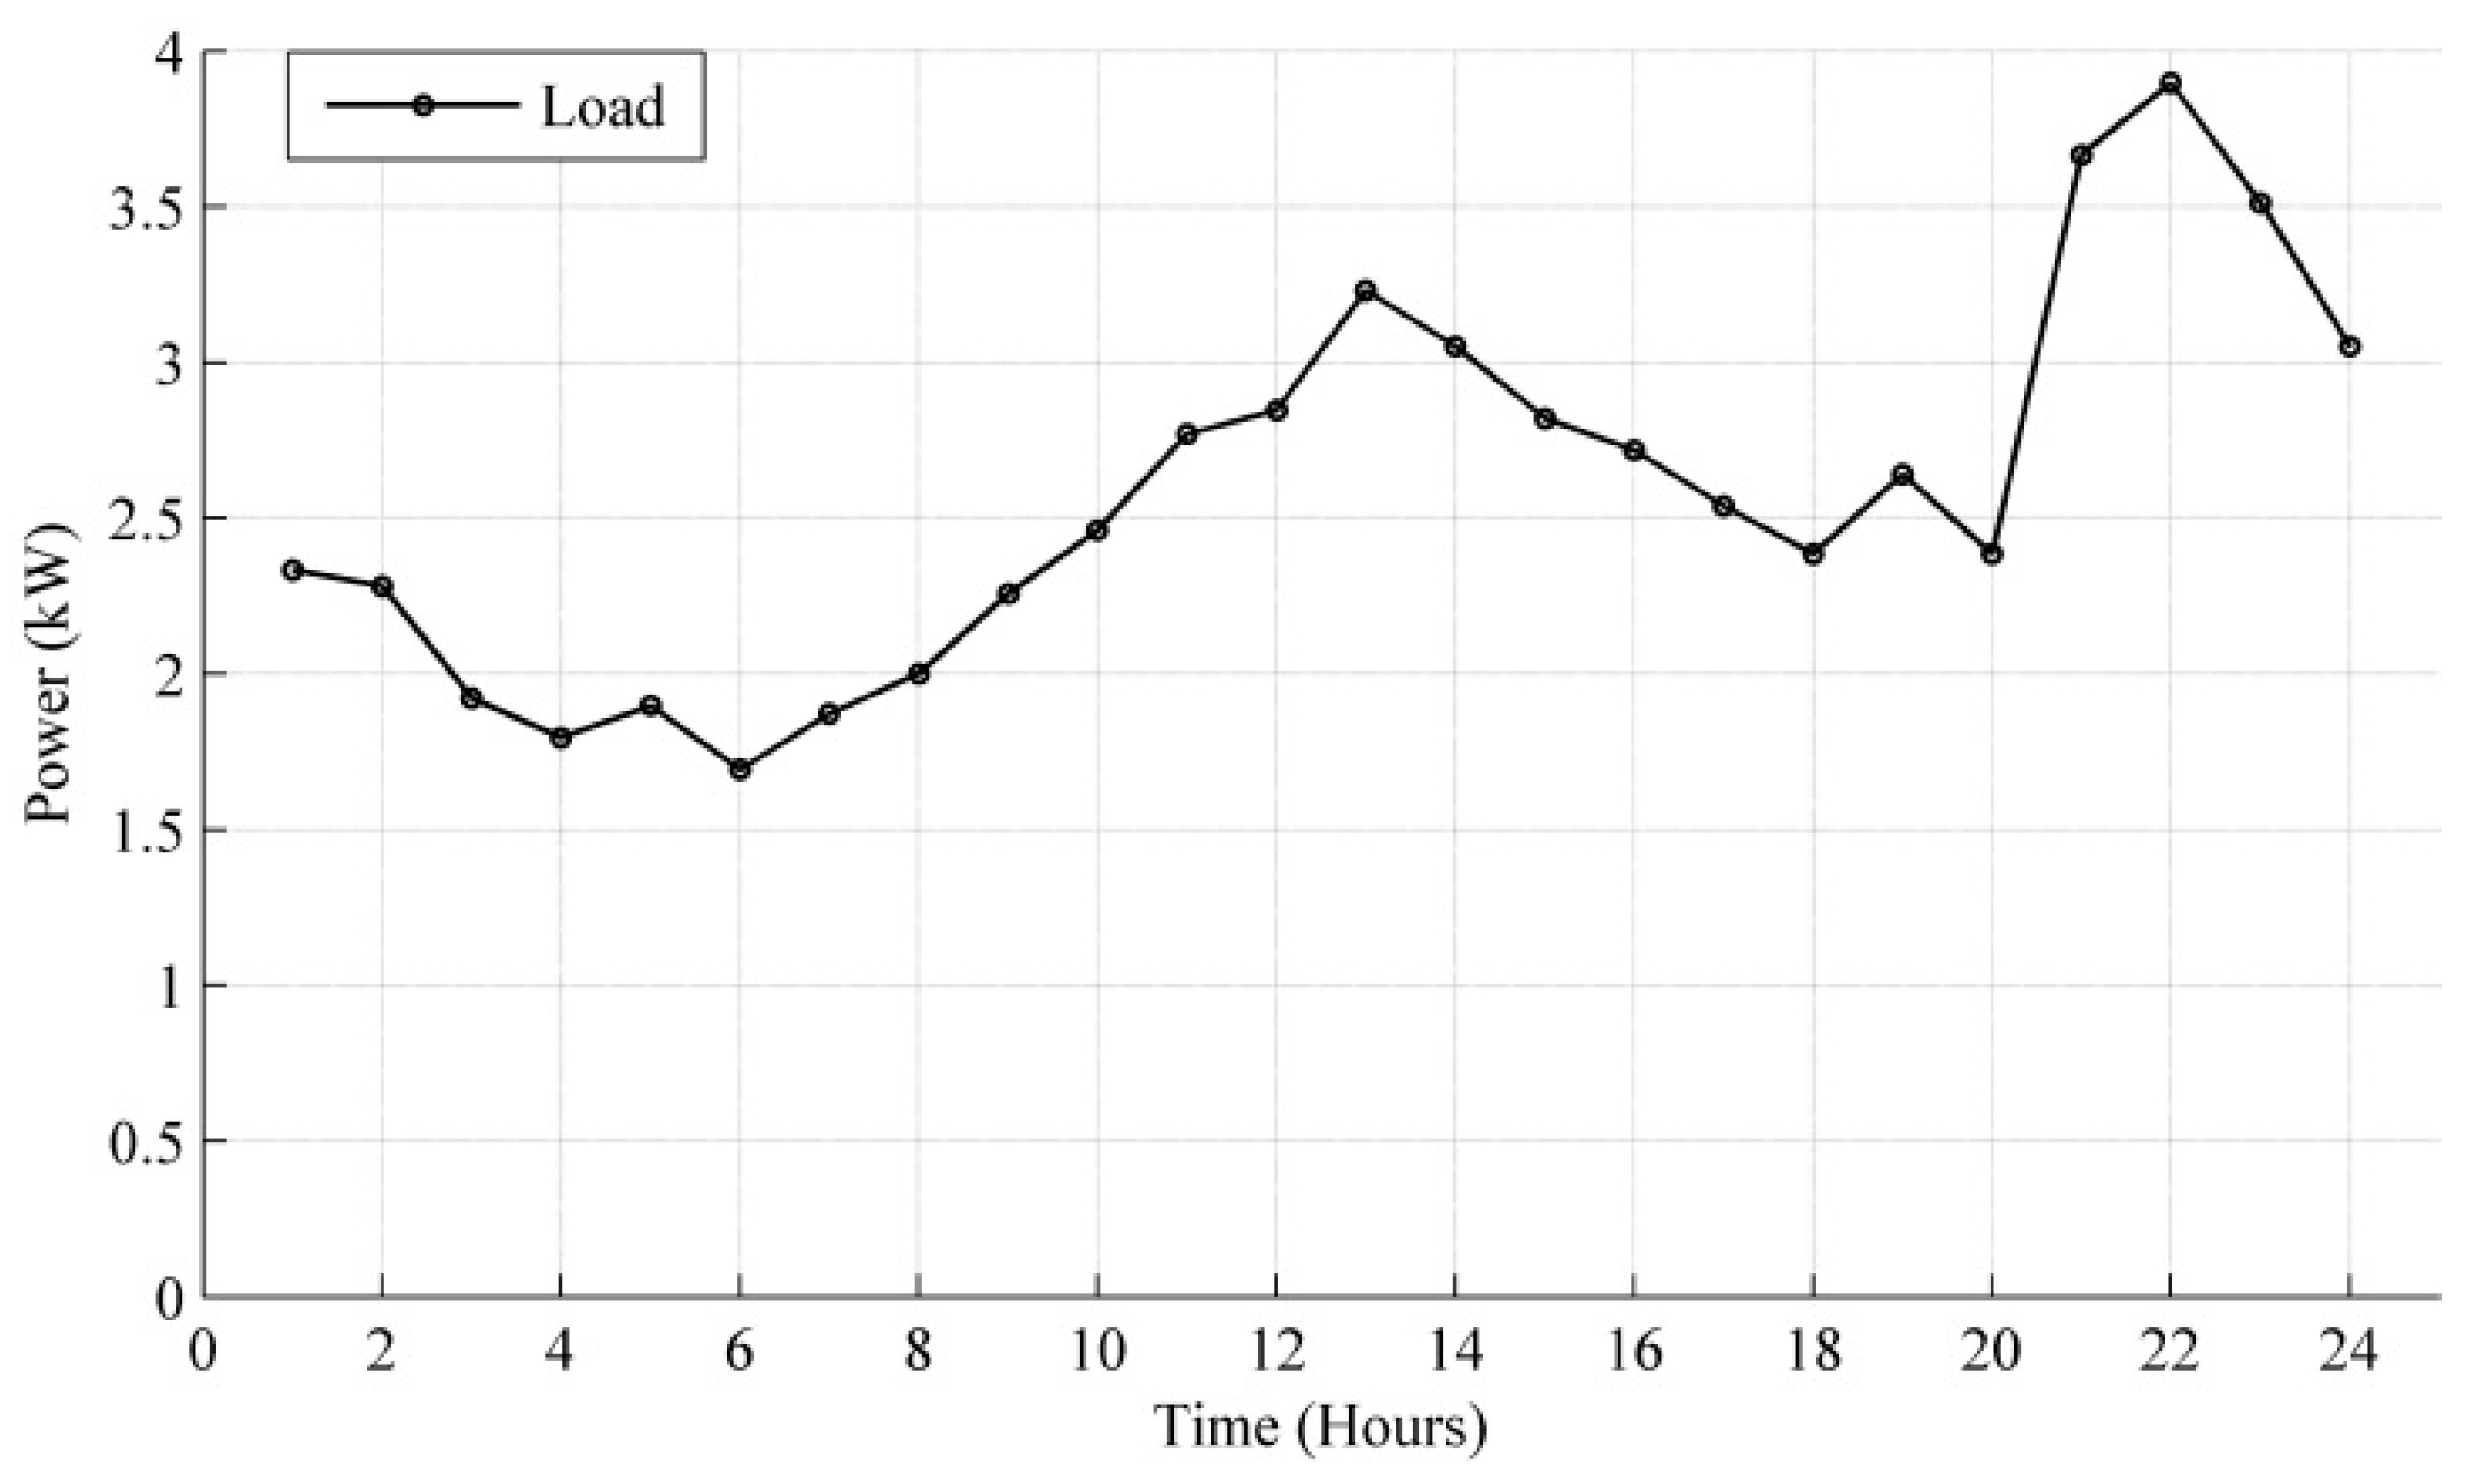
In addition, the database renewables ninja was chosen to obtain the renewable energy resources available in Taroa. Such a database was selected based on the successful experiences reported in [38,39]. Figure 4 shows the irradiance, expressed in kW/m2, and the wind speed, expressed in m/s, corresponding to 24-h average prediction in the region of Taroa. Moreover, Figure 5 shows a load profile calculated for some Colombian non-interconnected areas, which are completely remotes from urban cities and are inhabited by native cultures that are rich in customs that differ from the customs practiced in urban areas. The load curve presented in Figure 5 is proposed by a government institution for the specific studied area. However, another specific or a typical load profile can be used to solve the optimization problem. The information reported in Figure 4 and Figure 5 is used to solve the optimization problem and to calculate the dispatch using the EMS.
3.2. Heuristic Algorithm to Dispatch the Available Power in the Microgrid
To evaluate the results obtained using the MILP approach, the heuristic algorithm reported in [19] is used as a benchmark for comparison. That algorithm has been previously used to dispatch power of a small-scale and remote microgrid with photovoltaic generation. The heuristic algorithm was implemented using the following rules:
- First, dispatch the available power in renewable sources;
- Then, if there is an excess of power generated, evaluate the state of charge of the battery bank and store as much energy as possible;
- Otherwise, if the demand is higher than the generation, dispatch the available power of the battery bank, taking into account the minimum storage limit;
- The battery bank is only dispatched when its SoC is higher than 70% to guarantee storage power at the beginning of the next day;
- If the power balance is not fulfilled, the diesel generator is dispatched to support the load demand without violating the maximum power of the generator;
- If there is not enough power in the sources of the microgrid to supply the load, the algorithm generates a message reporting that condition.
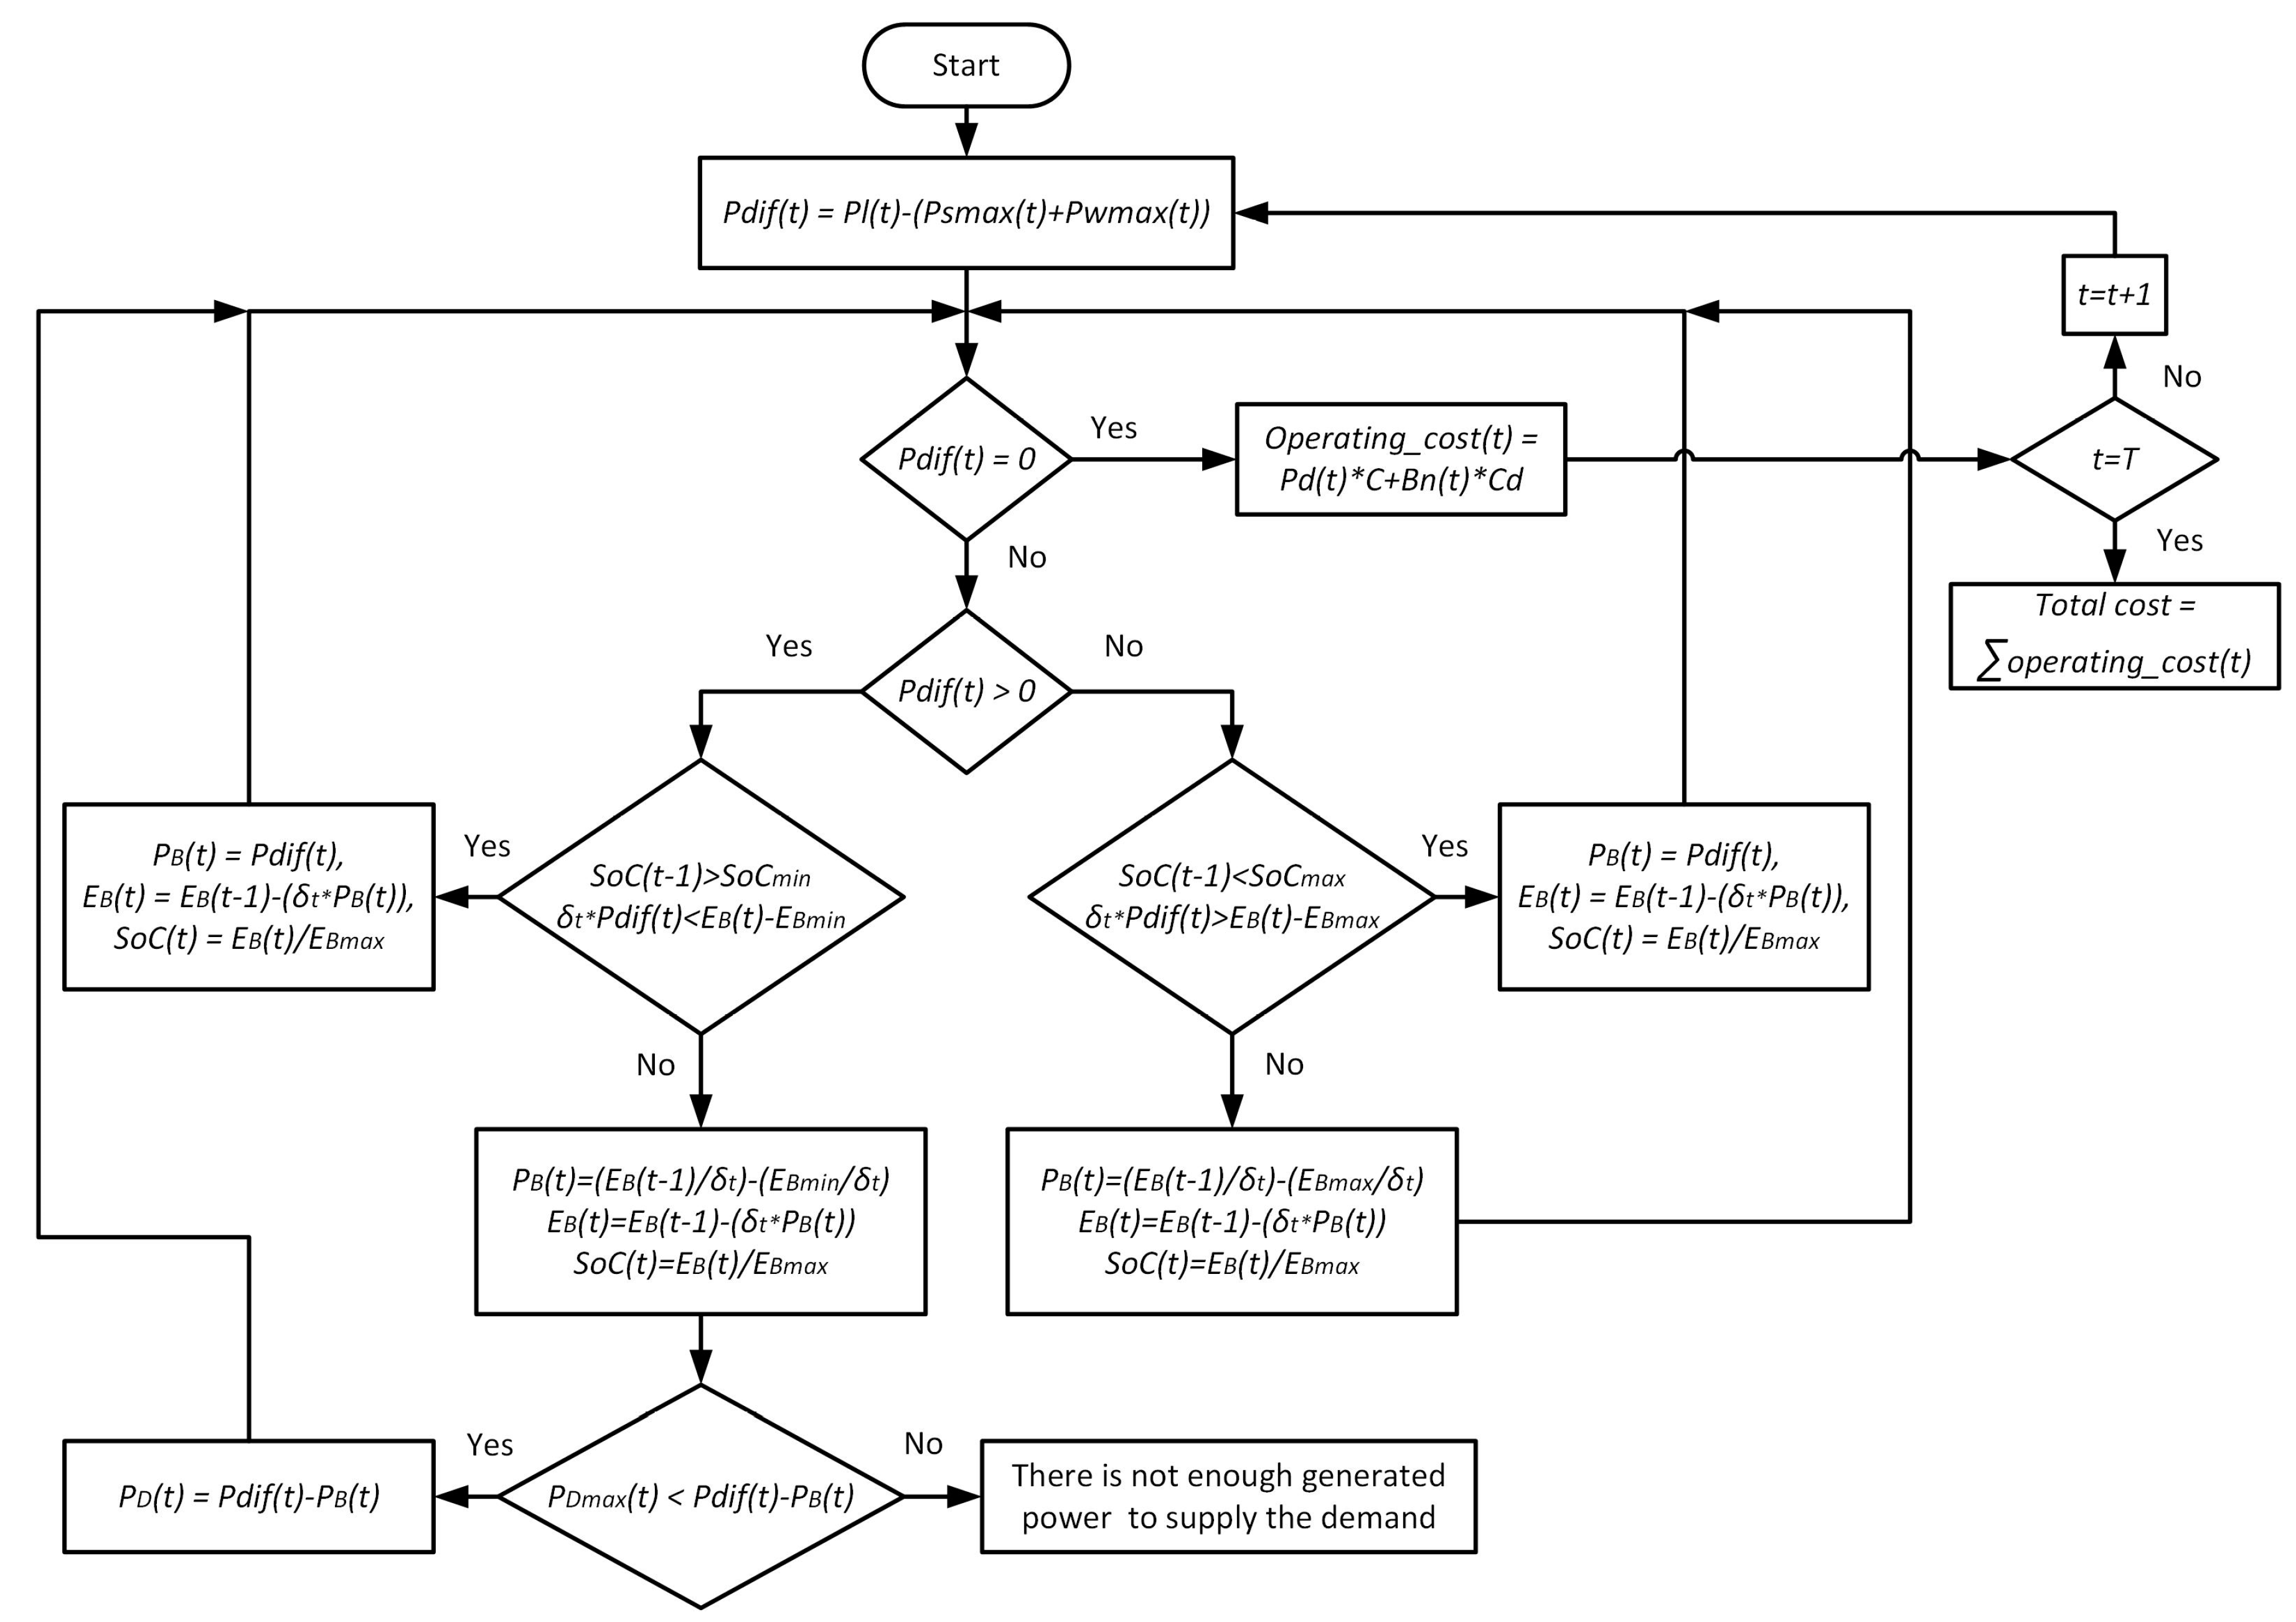
Figure 6 shows the flowchart of the heuristic algorithm, in which Pdif represents the power difference between the renewable resources and the load power requirement. Moreover, EBmin and EBmax represent the minimum and maximum stored energy available to charge or discharge the battery, respectively. To provide a fair comparison with the proposed MILP solution, the heuristic algorithm also dispatches the diesel generator as the last option due to its operating cost related to both operation and startup.
The heuristic algorithm must be executed for each sample in the period evaluated; for that reason, this algorithm can be implemented to dispatch power in a microgrid with the information of a day, month of even the hole year. However, since the dispatch is evaluated in each sample, it is not possible to estimate several solutions for the entire period of time; therefore, the power dispatch cannot be optimized.
3.3. Comparison of the Power Dispatchs Obtained with the MILP and Heuristic Algorithm Approaches
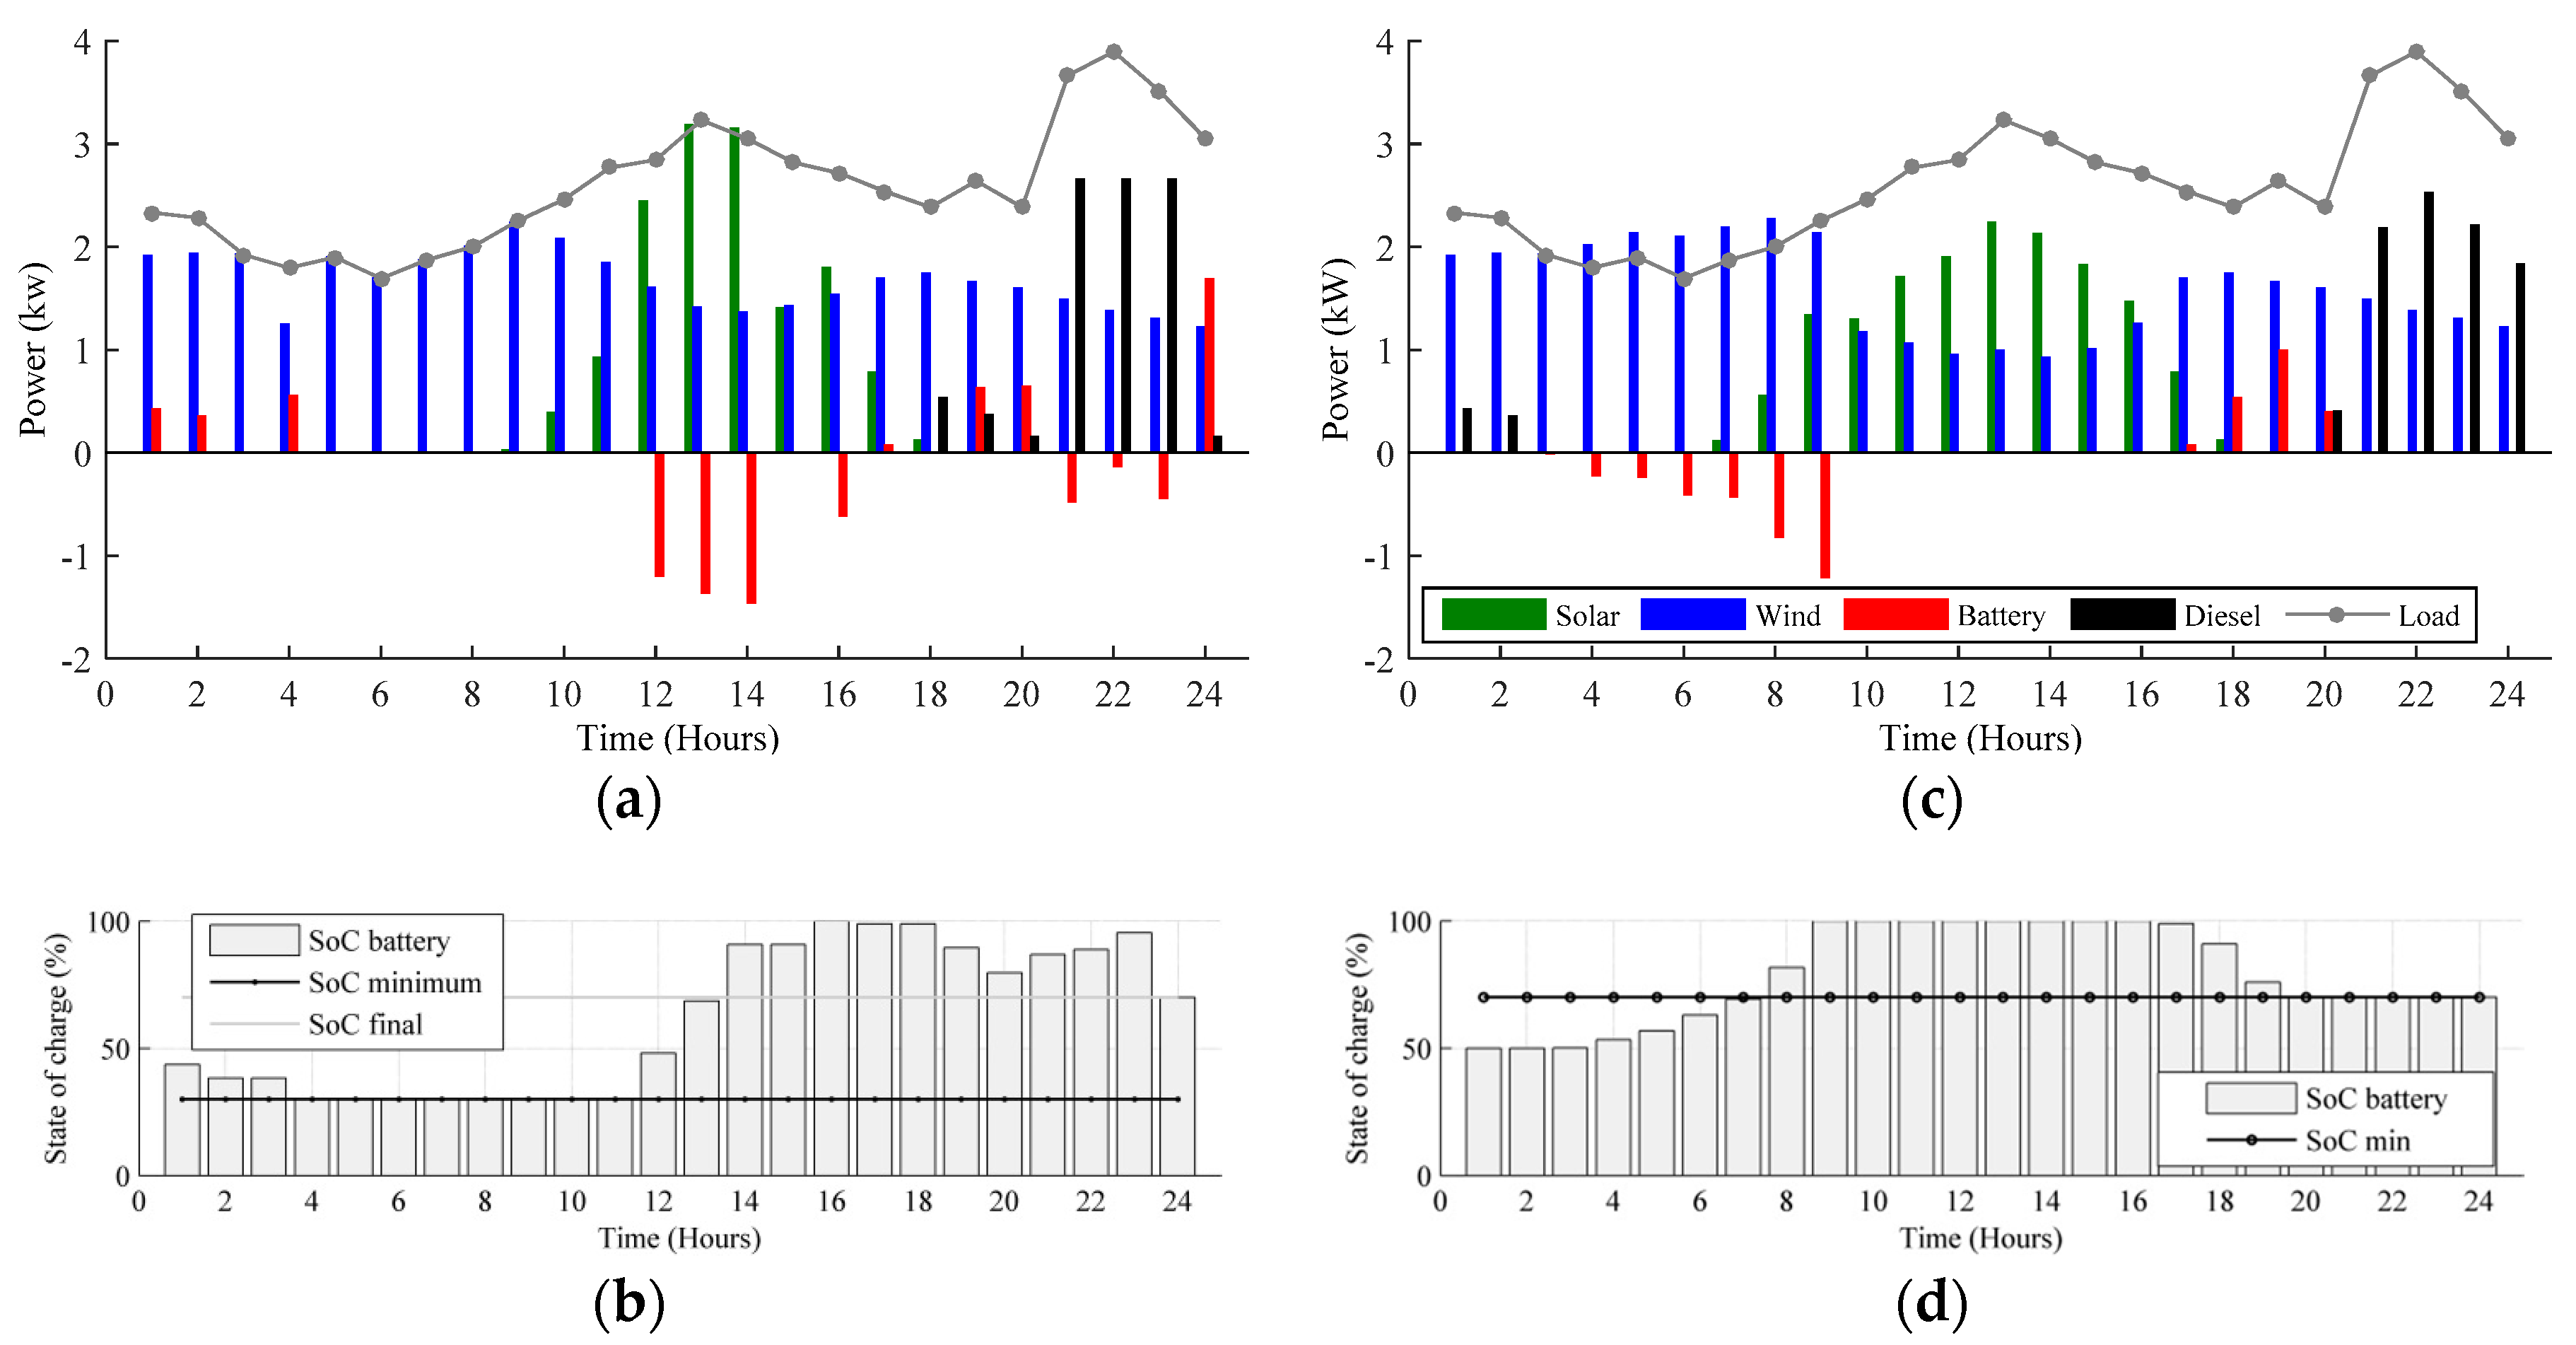
Figure 7 presents the power dispatch and the state of charge of the battery obtained with both approaches. It must be remembered that irradiance and wind speed in Taroa are presented in Figure 3, and the load profile estimated for the same town is presented in Figure 4. Those data are the inputs for both dispatch approaches. The power dispatched by each source is identified with colors—green for solar power, blue for wind power, red for the battery power, and black for the power produced with the diesel generator. The negative scale is used to show when the battery is being charged, and the grey points represent the load demand. The heuristic algorithm has just one limit for the SoC, and the initial SoC value starts below its limit to make a fair comparison with the MILP approach. However, it should be understood that once the SoC passes over the limit, the algorithm will avoid it to passes under its limit. Figure 7 shows that both approaches dispatch the available power in the microgrid; however, the amount of diesel consumed is different, and hence the operating cost of the microgrid is not the same.
The MILP results are shown in Figure 7a,b. During the first four hours, the MILP approach dispatches the wind generator and the battery bank to supply the load requirement. When there is an excess of available power in a real microgrid, a dissipating load must be provided to avoid damage to the elements of the microgrid. During the hours that renewable sources have available power to supply the load, the diesel generator is not dispatched, and even the battery bank is charged. In the last hours of the profile, there is power available from the wind generator, but it is not enough to supply the high demand of the load, and therefore the battery bank is discharged. Finally, since the 70% of the SoC is a requirement for the end of the day, the diesel generator is used to supply the rest of the demanded power and to ensure the desired SoC condition.
In Figure 7c,d, the power dispatch of the microgrid and the SoC of the battery bank calculated using the heuristic algorithm is presented. Because the heuristic algorithm only has one limit programed for the state of charge, the battery bank is not dispatched during the first hours because the SoC of the battery is below the SoCmin. That situation forces the algorithm to dispatch the diesel generator. Then, at 8 am, the available power in the renewables sources overcomes the load demand, and the battery bank is charged during the next three hours until it reaches the SoCmax. At night, there is a reduced amount of renewable power, and the algorithm prevents the SoC going below 70%. During the night, the power demanded by the load increases significantly, hence the algorithm dispatches the diesel generator to supply load demand and to keep the battery ready to supply power for the next day.
The amount of power dispatched by the diesel generator is observed in Figure 7a,c. The MILP approach dispatches the diesel generator once in the whole day, while the heuristic algorithm dispatches the diesel generator twice in the same period. Moreover, the amount of power dispatched by the MILP approach is lower than the power dispatched by the heuristic algorithm. The operating cost produced by both approaches is presented in Table 2, which put into evidence that the MILP generates a reduction in the operating cost equal to 25.5% of the cost imposed by the heuristic algorithm. Therefore, the objective proposed in the problem formulation is achieved.
Moreover, the reduced use of the diesel generator also reduces the kg of CO2 (kg-CO2) produced by the microgrid operation. The calculation of the kg-CO2 produced by both algorithms reported in Table 2 was performed using the relations given in [40], which studies the efficiency and pollution generated by a 5 kW diesel generator (12.21 kg-CO2 per day with a load demand of 6.3 kW/day). Those results put into evidence the lower pollution provided by the proposed MILP solution, which could enable the microgrid to access governmental incentives. At this moment, the Colombian government is finalizing the laws to implement such incentives for both rural and urban areas.
On the other hand, the battery bank exchanged 75% more power during the MILP dispatch, which produces a higher number of equivalent charge/discharge cycles in comparison with the heuristic algorithm. Such a higher number of equivalent charge/discharge cycles produce an accelerated battery degradation, which is normally expressed in terms of remaining full charge/discharge cycles [41]. Therefore, the MILP solution could be improved by including the effect of the charge/discharge cycles using the battery cost model proposed in [41].
4. Conclusions
An optimal power dispatch of a small-scale standalone microgrid for Taroa, a small settlement in La Guajira, Colombia, was proposed. The methodology applied to obtain the optimal power dispatch was presented in six steps, and for each one, inputs and outputs were discussed. The power dispatch was generated by an energy management system based on mixed integer linear programming, which is considered as a centralized controller that dispatches the available power of the generators and the battery to minimize the operating cost. The boundaries of the SoC of the battery were fulfilled, and this action extended the lifespan of the battery.
Basic steady-state models of the generators were selected to solve the optimization problem. Once the models of the photovoltaic modules, the wind generator, the diesel generator, and the battery bank were selected, commercial equipment information was used to simulate the optimal power dispatch. To validate the solution given by the proposed EMS based on a MILP, its power dispatch was compared with results generated by a heuristic algorithm, which has been previously used to dispatch power in small-scale standalone microgrid. The power dispatch of the generation units and the state of charge of the battery bank during a 24 h operation were presented as the results. Comparing the operating cost obtained with the MILP and the heuristic algorithm, it is possible to see that lower cost was achieved with the MILP approach.
The proposed EMS could be improved by taking into account additional restrictions. For example, minimizing the charge/discharge cycles of the battery bank, and reduce the steady-state currents to prevent electrical stress, among others. Moreover, introducing the uncertainty of renewable energy sources is required to improve the performance of EMS dealing with such types of sources. This can be done by first extracting data from estimators for wind and solar energy able to provide the uncertainty of the prediction, such as the one reported in [42]. Then, the uncertainty distribution must be introduced into the optimization algorithm. This approach has been done using stochastic programming with high success [43], and future improvements to the proposed MILP solution will be focused on achieving similar results.
Author Contributions
A.H.-M. developed the software to simulate the microgrid and solve the optimization problem. A.H.-M. and A.S.-M. conceived, designed, and developed the experiments and analyzed the data. Finally, C.R.-P., A.H.-M. and A.S.-M. wrote the paper.
Funding
This work was supported by the Universidad Nacional de Colombia, Instituto Tecnológico Metropolitano and COLCIENCIAS (Fondo nacional de financiamiento para la ciencia, la tecnología y la innovación Francisco José de Caldas) under the projects MicroRENIZ-25439 with Code 1118–669–46197 and UNAL-ITM-39823/P17211.
Conflicts of Interest
The authors declare no conflict of interest. The founding sponsors had no role in the design of the study; in the collection, analyses, or interpretation of data; in the writing of the manuscript, and in the decision to publish the results.
Nomenclature
| Acronyms | |
| IPSE | Colombian Institute of Planning and Promotion of Energy Solutions for Non-interconnected |
| IDEAM | Institute of Hydrology, Meteorology and Environmental Studies |
| CIGRE | Council on Large Electric Systems |
| NASA | National Aeronautics and Space Administration |
| PSAT | Power System Analysis Toolbox |
| RAPS | Remote area power supply |
| SoC | State of charge |
| EMS | Energy management system |
| MILP | Mixed integer linear programming |
| PV | Photovoltaic |
| Variables and parameters | |
| PSmax | Maximum available output power of the PV system, W |
| RS | Solar irradiation, W/m2 |
| AS | Surface area of the photovoltaic generator, m2 |
| ηS | Efficiency of commercial photovoltaic panels |
| PEmax | Maximum available output power of the wind generation system, W |
| v | Wind speed, m/s |
| AE | Swept area of the turbine blades in turbines, m2 |
| ρ | Air density, kg/m3 |
| Cp | Power coefficient of wind turbines |
| PIn | Output power of the battery bank, W |
| PBc | Charging power profile of the battery bank, W |
| PBd | Discharging power profile of the battery bank, W |
| PIo | Internal power consumed by the battery bank, W |
| ηInc | Efficiency of the charging process in the battery bank |
| ηInd | Efficiency of the discharging process in the battery bank |
| Bc | Binary variable reporting the battery bank operation in charging state |
| Bd | Binary variable reporting the battery bank operation in discharging state |
| PBc_max | Maximum charging power profile of the battery bank, W |
| PBd_max | Maximum discharging power profile of the battery bank, W |
| SoCmin | Minimum value of the SoC |
| SoCmax | Maximum value of the SoC |
| SoCfinal | Desired SoC at the end of the day |
| PD | Output power of the diesel engine, W |
| Pn | Power in each line segment of the generator characteristic curve, W |
| h | Number of linear segments of the generator characteristic curve |
| q | Amount of diesel used to produce the diesel generator power, L |
| αn | Gradient of segment n in the generator characteristic curve, L/W |
| βn | Cut off of segment n in the axis of ordinates on the generator characteristic curve, W |
| f(t) | Objective function of the EMS |
| CD | Operating cost related with the fuel, US dollars |
| Cst | Cost of start-up the diesel engine, US dollars |
| δt | Duration of the time step, hours |
| Pn_min | Minimum value of the diesel generator power range, W |
| Pn_max | Maximum value of the diesel generator power range, W |
| Dprice | Price for diesel consumption during steady-state operation of the diesel engine, US dollars |
| stprice | Price for diesel consumption during start-up of the diesel engine, US dollars |
| PS | Power produced by the photovoltaic generator, W |
| PE | Power produced by the wind generator, W |
| PL | Load demand, W |
| kg-CO2 | kg of CO2 produced by the microgrid operation |
| Mixed integer linear programming (MILP) | |
| f(x,z) | Objective function of the MILP |
| x | vector of output variables |
| z | vector of binary variables |
| Ci and CN | vectors of the associated costs of output and binary variables |
| T | Transpose of a vector or a matrix |
| G | Representation of equality constraints |
| H | Representation of inequality constraints |
| b and d | Constants associated with the equality and inequality constraints |
| I | Number of output variables |
| Aeq | Equality matrix |
| aeq | Coefficients related to each output variable and constraint in Aeq |
| m | Number of equality constraints in Aeq |
| A | Inequality matrix |
| a | Coefficients related to each output variable and constraint in A |
| p | Number of inequality constraints in A |
References
- Unidad de Planeación Minero Energética. Plan Indicativo de Expansión de Cobertura de Energía Eléctrica 2013–2017, 1st ed.; UPME: Bogotá, Colombia, 2014.
- Li, F.; Xie, K.; Yang, J. Optimization and analysis of a hybrid energy storage system in a small-scale standalone microgrid for remote area power supply (RAPS). Energies 2015, 8, 4802–4826. [Google Scholar] [CrossRef]
- Gaona, E.E.; Trujillo, C.L.; Guacaneme, J.A. Rural microgrids and its potential application in Colombia. Renew. Sustain. Energy Rev. 2015, 51, 125–137. [Google Scholar] [CrossRef]
- Garzón-Hidalgo, J.D.; Saavedra-Montes, A.J. Una metodología de diseño de microrredes para zonas no interconectadas de Colombia. Tecno Lógicas 2017, 20, 30–44. (In Spanish) [Google Scholar]
- Tan, Q.; Ding, Y.; Zhang, Y. Optimization model of an efficient collaborative power dispatching system for carbon emissions trading in China. Energies 2017, 10, 1405. [Google Scholar] [CrossRef]
- Olivares, D.E.; Lara, J.D.; Cañizares, C.A.; Kazerani, M. Stochastic-predictive energy management system for isolated microgrids. IEEE Trans. Smart Grid 2015, 6, 2681–2693. [Google Scholar] [CrossRef]
- Olivares, D.E.; Cañizares, C.A.; Kazerani, M. A centralized energy management system for isolated microgrids. IEEE Trans. Smart Grid 2014, 5, 1864–1875. [Google Scholar] [CrossRef]
- Liu, Q.; Wang, R.; Zhang, Y.; Wu, G.; Shi, J. An optimal and distributed demand response strategy for energy internet management. Energies 2018, 11, 215. [Google Scholar] [CrossRef]
- Ou, T.; Su, W.; Liu, X.; Huang, S.; Tai, T. A modified bird-mating optimization with hill-climbing for connection decisions of transformers. Energies 2016, 9, 671. [Google Scholar] [CrossRef]
- Ou, T. Ground fault current analysis with a direct building algorithm for microgrid distribution. Int. J. Electr. Power Energy Syst. 2013, 53, 867–875. [Google Scholar] [CrossRef]
- Ou, T. A novel unsymmetrical faults analysis for microgrid distribution systems. Int. J. Electr. Power Energy Syst. 2012, 43, 1017–1024. [Google Scholar] [CrossRef]
- Lin, W.M.; Ou, T.C. Unbalanced distribution network fault analysis with hybrid compensation. IET. Gener. Transm. Distrib. 2011, 5, 92–100. [Google Scholar] [CrossRef]
- Ou, T. Design of a novel voltage controller for conversion of carbon dioxide into clean fuels using the Integration of a vanadium redox battery with solar energy. Energies 2018, 11, 524. [Google Scholar] [CrossRef]
- Ou, T.; Hong, Ch.M. Dynamic operation and control of microgrid hybrid power systems. Energy 2014, 66, 314–323. [Google Scholar] [CrossRef]
- Hong, Ch. M.; Ou, T.; Lu, K.H. Development of intelligent MPPT (maximum power point tracking) control for a grid-connected hybrid power generation system. Energy 2013, 50, 270–279. [Google Scholar] [CrossRef]
- Ou, T.; Lu, K.; Huang, C. Improvement of transient stability in a hybrid power multi-system using a designed NIDC (Novel Intelligent Damping Controller). Energies 2017, 10. [Google Scholar] [CrossRef]
- Hu, C.; Luo, S.; Li, Z.; Wang, X.; Sun, L. Energy coordinative optimization of wind-storage-load microgrids based on short-term prediction. Energies 2015, 8, 1505–1528. [Google Scholar] [CrossRef]
- Luna, A.C.; Diaz, N.L.; Graells, M.; Vasquez, J.C.; Guerrero, J.M. Mixed-integer-linear-programming-based energy management system for hybrid pv-wind-battery microgrids: modeling, design, and experimental verification. IEEE Trans. Power Electr. 2017, 32, 2769–2783. [Google Scholar] [CrossRef]
- Henao-Muñoz, A.C.; Saavedra-Montes, A.J.; Ramos-Paja, C.A. Energy management system for an isolated microgrid with photovoltaic generation. In Proceedings of the 14th International Conference on Synthesis, Modeling, Analysis and Simulation Methods and Applications to Circuit Design (SMACD), Giardini Naxos, Italy, 12–15 June 2017; pp. 1–4. [Google Scholar]
- Zhang, Y.; Gatsis, N.; Giannakis, G.B. Robust energy management for microgrids with high-penetration renewables. IEEE Trans. Sustain. Energy 2013, 4, 944–953. [Google Scholar] [CrossRef]
- Olivares, D.E.; Mehrizi-Sani, A.; Etemadi, A.H.; Cañizares, C.A.; Iravani, R.; Kazerani, M.; Hatziargyriou, N.D. Trends in microgrid control. IEEE Trans. Smart Grid 2014, 5, 1905–1919. [Google Scholar] [CrossRef]
- Palma-behnke, R.; Benavides, C.; Lanas, F.; Severino, B.; Reyes, L.; Llanos, J.; Sáez, D. A microgrid energy management system based on the rolling horizon strategy. IEEE Trans. Smart Grid 2013, 4, 996–1006. [Google Scholar] [CrossRef]
- Renewables.ninja. Available online: https://www.renewables.ninja/ (accessed on 31 October 2017).
- Atlas Interactivo-IDEAM. Available online: http://atlas.ideam.gov.co/presentacion/ (accessed on 15 February 2018).
- Natale, N.; Pilo, F.; Pisano, G.; Troncia, M.; Bignucolo, F.; Coppo, M.; Pesavento, N.; Turri, R. Assessment of typical residential customers load profiles by using clustering techniques. In Proceedings of the 2017 AEIT International Annual Conference, Cagliari, Italy, 20–22 September 2017; pp. 1–6. [Google Scholar]
- Instituto Colombiano de Normas Técnicas y Certificación. Código Eléctrico Colombiano, 1st ed.; Instituto Colombiano de Normas Técnicas y Certificación: Bogotá, Colombia, 2002; ISBN 9789589383209. [Google Scholar]
- Yang, H.T.; Huang, C.M.; Huang, Y.C.; Pai, Y.S. A weather-based hybrid method for 1-day ahead hourly forecasting of pv power output. IEEE Trans. Sustain. Energy 2014, 5, 917–926. [Google Scholar] [CrossRef]
- El-Amari, N.H.; Balbaa, A.; Swief, R.A.; Abdel-Salam, T.S. A reconfigured whale optimization technique (RWOT) for renewable electrical energy optimal scheduling impact on sustainable development applied to Damietta seaport, Egypt. Energies 2018, 11, 535. [Google Scholar] [CrossRef]
- Nguyen, T.T.; Yoo, H.J.; Kim, H.M. Analyzing the impacts of system parameters on mpc-based frequency control for a stand-alone microgrid. Energies 2017, 10, 417. [Google Scholar] [CrossRef]
- Zangs, M.J.; Adams, P.B.E.; Yunusov, T.; Holderbaum, W.; Potter, B.A. Distributed Energy Storage Control for Dynamic Load Impact Mitigation. Energies 2016, 9, 647. [Google Scholar] [CrossRef]
- Hijjo, M.; Felgner, F.; Frey, G. PV-battery-diesel microgrid layout design based on stochastic optimization. In Proceedings of the 2017 6th International Conference on Clean Electrical Power, Santa Margherita Ligure, Italy, 27–29 June 2017; pp. 30–35. [Google Scholar]
- Taha, M.S.; Mohamed, Y.A.R.I. Optimal MPC-based energy management of multiport power electronics interface for hybrid energy sources. In Proceedings of the 2016 IEEE Canadian Conference on Electrical and Computer Engineering, Vancouver, BC, Canada, 15–18 May 2016; pp. 1–6. [Google Scholar]
- Tenfen, D.; Finardi, E.C. A mixed integer linear programming model for the energy management problem of microgrids. Electr. Power Syst. Res. 2015, 122, 19–28. [Google Scholar] [CrossRef]
- CNG Solar Engineering. Available online: https://cngsolarengineering.com/wp-content/uploads/2015/02/SUNMODULE-SW-250-MONO.pdf (accessed on 4 April 2018).
- Ennera. Available online: http://www.ennera.com/en/windera-s (accessed on 4 April 2018).
- Solar Choice. Available online: https://www.solarchoice.net.au/blog/wp-content/uploads/Aspen-48S-2.2-Product-Specification-Sheet.pdf (accessed on 4 April 2018).
- Pramac. Available online: https://www.pramac.com/product?id=1801&folder=52 (accessed on 4 April 2018).
- Pfenninger, S.; Staffell, I. Long-term patterns of European PV output using 30 years of validated hourly reanalysis and satellite data. Energy 2016, 114, 1251–1265. [Google Scholar] [CrossRef]
- Staffell, I.; Pfenninger, S. Using bias-corrected reanalysis to simulate current and future wind power output. Energy 2016, 114, 1224–1239. [Google Scholar] [CrossRef]
- Jakhrani, A.Q.; Rigit, A.R.H.; Othman, A.K.; Samo, S.R.; Kamboh, S.A. Estimation of carbon footprints from diesel generator emissions. In Proceedings of the 2012 International Conference on Green and Ubiquitous Technology, Bandung, Indonesia, 30 Jun–1 July 2012; pp. 78–81. [Google Scholar]
- Correa-Florez, C.A.; Gerossier, A.; Michiorri, A.; Kariniotakis, G. Stochastic operation of home energy management systems including battery cycling. Appl. Energy 2018, 225, 1205–1218. [Google Scholar] [CrossRef] [Green Version]
- Zhang, Y.; Wang, J. K-nearest neighbors and a kernel density estimator for GEFCom2014 probabilistic wind power forecasting. Int. J. Forecast. 2016, 32, 1074–1080. [Google Scholar] [CrossRef]
- Shuai, H.; Fang, J.; Ai, X.; Tang, Y.; Wen, J.; He, H. Stochastic optimization of economic dispatch for microgrid based on approximate dynamic programming. IEEE Trans. Smart Grid 2018, 225. [Google Scholar] [CrossRef]
Figure 1.
Flowchart of the design methodology.

Figure 2.
Line diagram of the microgrid topology.

Figure 3.
Microgrid topology and a flow diagram of information and measurements.

Figure 4.
Energy availability of Taroa, La Guajira, Colombia.

Figure 5.
Load profile of Taroa, La Guajira, Colombia.

Figure 6.
Heuristic algorithm flowchart.

Figure 7.
(a) Power dispatch using the Mixed integer linear programming (MILP) approach; (b) State of charge (SoC) of the battery bank using the MILP approach; (c) Power dispatch using the heuristic algorithm; (d) SoC of the battery bank using the heuristic algorithm.
Figure 7.
(a) Power dispatch using the Mixed integer linear programming (MILP) approach; (b) State of charge (SoC) of the battery bank using the MILP approach; (c) Power dispatch using the heuristic algorithm; (d) SoC of the battery bank using the heuristic algorithm.


Table 1.
Parameters of the microgrid in Taroa.
| Variable | Value | Variable | Value | Variable | Value |
|---|---|---|---|---|---|
| PSmax | 5 kW | AE | 14.93 m2 | SoCmin | 30% |
| ns | 14.91% | PDmax | 5.3 kW | SoCfinal | 70% |
| As | 32 m2 | EB (SoCmax = 100%) | 6.6 kWh | Dprice | 1 USD/L |
| PEmax | 3.2 kW | PBmax | 3 kW | stprice | 2 USD |
Table 2.
Operating costs comparison per day.
| Algorithm | Operating Cost (USD) | kg-CO2 |
|---|---|---|
| MILP | 6.51 | 19.53 |
| Heuristic | 8.74 | 26.21 |
© 2018 by the authors. Licensee MDPI, Basel, Switzerland. This article is an open access article distributed under the terms and conditions of the Creative Commons Attribution (CC BY) license (http://creativecommons.org/licenses/by/4.0/).
Share and Cite
MDPI and ACS Style
Henao-Muñoz, A.; Saavedra-Montes, A.; Ramos-Paja, C. Optimal Power Dispatch of Small-Scale Standalone Microgrid Located in Colombian Territory. Energies 2018, 11, 1877. https://doi.org/10.3390/en11071877
AMA Style
Henao-Muñoz A, Saavedra-Montes A, Ramos-Paja C. Optimal Power Dispatch of Small-Scale Standalone Microgrid Located in Colombian Territory. Energies. 2018; 11(7):1877. https://doi.org/10.3390/en11071877
Chicago/Turabian StyleHenao-Muñoz, Andrés, Andrés Saavedra-Montes, and Carlos Ramos-Paja. 2018. "Optimal Power Dispatch of Small-Scale Standalone Microgrid Located in Colombian Territory" Energies 11, no. 7: 1877. https://doi.org/10.3390/en11071877
Note that from the first issue of 2016, this journal uses article numbers instead of page numbers. See further details here.