The Feasibility of Improving the Accuracy of In Situ Measurements in the Air-Surface Temperature Ratio Method


Abstract
1. Introduction
- The ISO 9869-1: 2014 [8] international standard heat flow meter (HFM) method: This measures the U-value in situ using the heat flux of the building envelope and the temperature difference between the indoor and outdoor environments. The average method is one of those most commonly used to evaluate the thermal properties of building elements using in situ measurements [9]. The U-value is measured under quasi-steady state conditions [10,11,12,13,14,15]. However, the latter are difficult to measure and thus the average heat flow of the building envelope must be measured for a sufficiently long time. The ISO 9869-1: 2014 standard requires data sampling to last for at least three to seven days. It is common for the monitoring period to extend to more than two weeks to achieve satisfactory results and stable conditions [16].
- Theoretical calculation using the ISO 6946: 2007 standard [17]: This method is based on calculations of thermal resistance and heat transfer rate of doors, windows, and other building components. The calculation is based on an appropriate design thermal conductivity or design thermal resistance of the material. It is applied to a component composed of a thermally homogeneous layer and takes into account the thickness and thermal conductivity of each layer making up the envelope. Thermal conductivity is calculated according to ISO 10456 [18]. However, this method is approximate and the U-value obtained differs from the actual value.
- Using infrared cameras: This approach uses the infrared thermovision technique (ITT) [19,20,21,22] to analyze the surface temperature of the envelope. The U-value of the building envelope can be calculated using the temperature information and the total heat transfer coefficient. A standard is currently being established for ISO 9869-2 [23].
2. Method
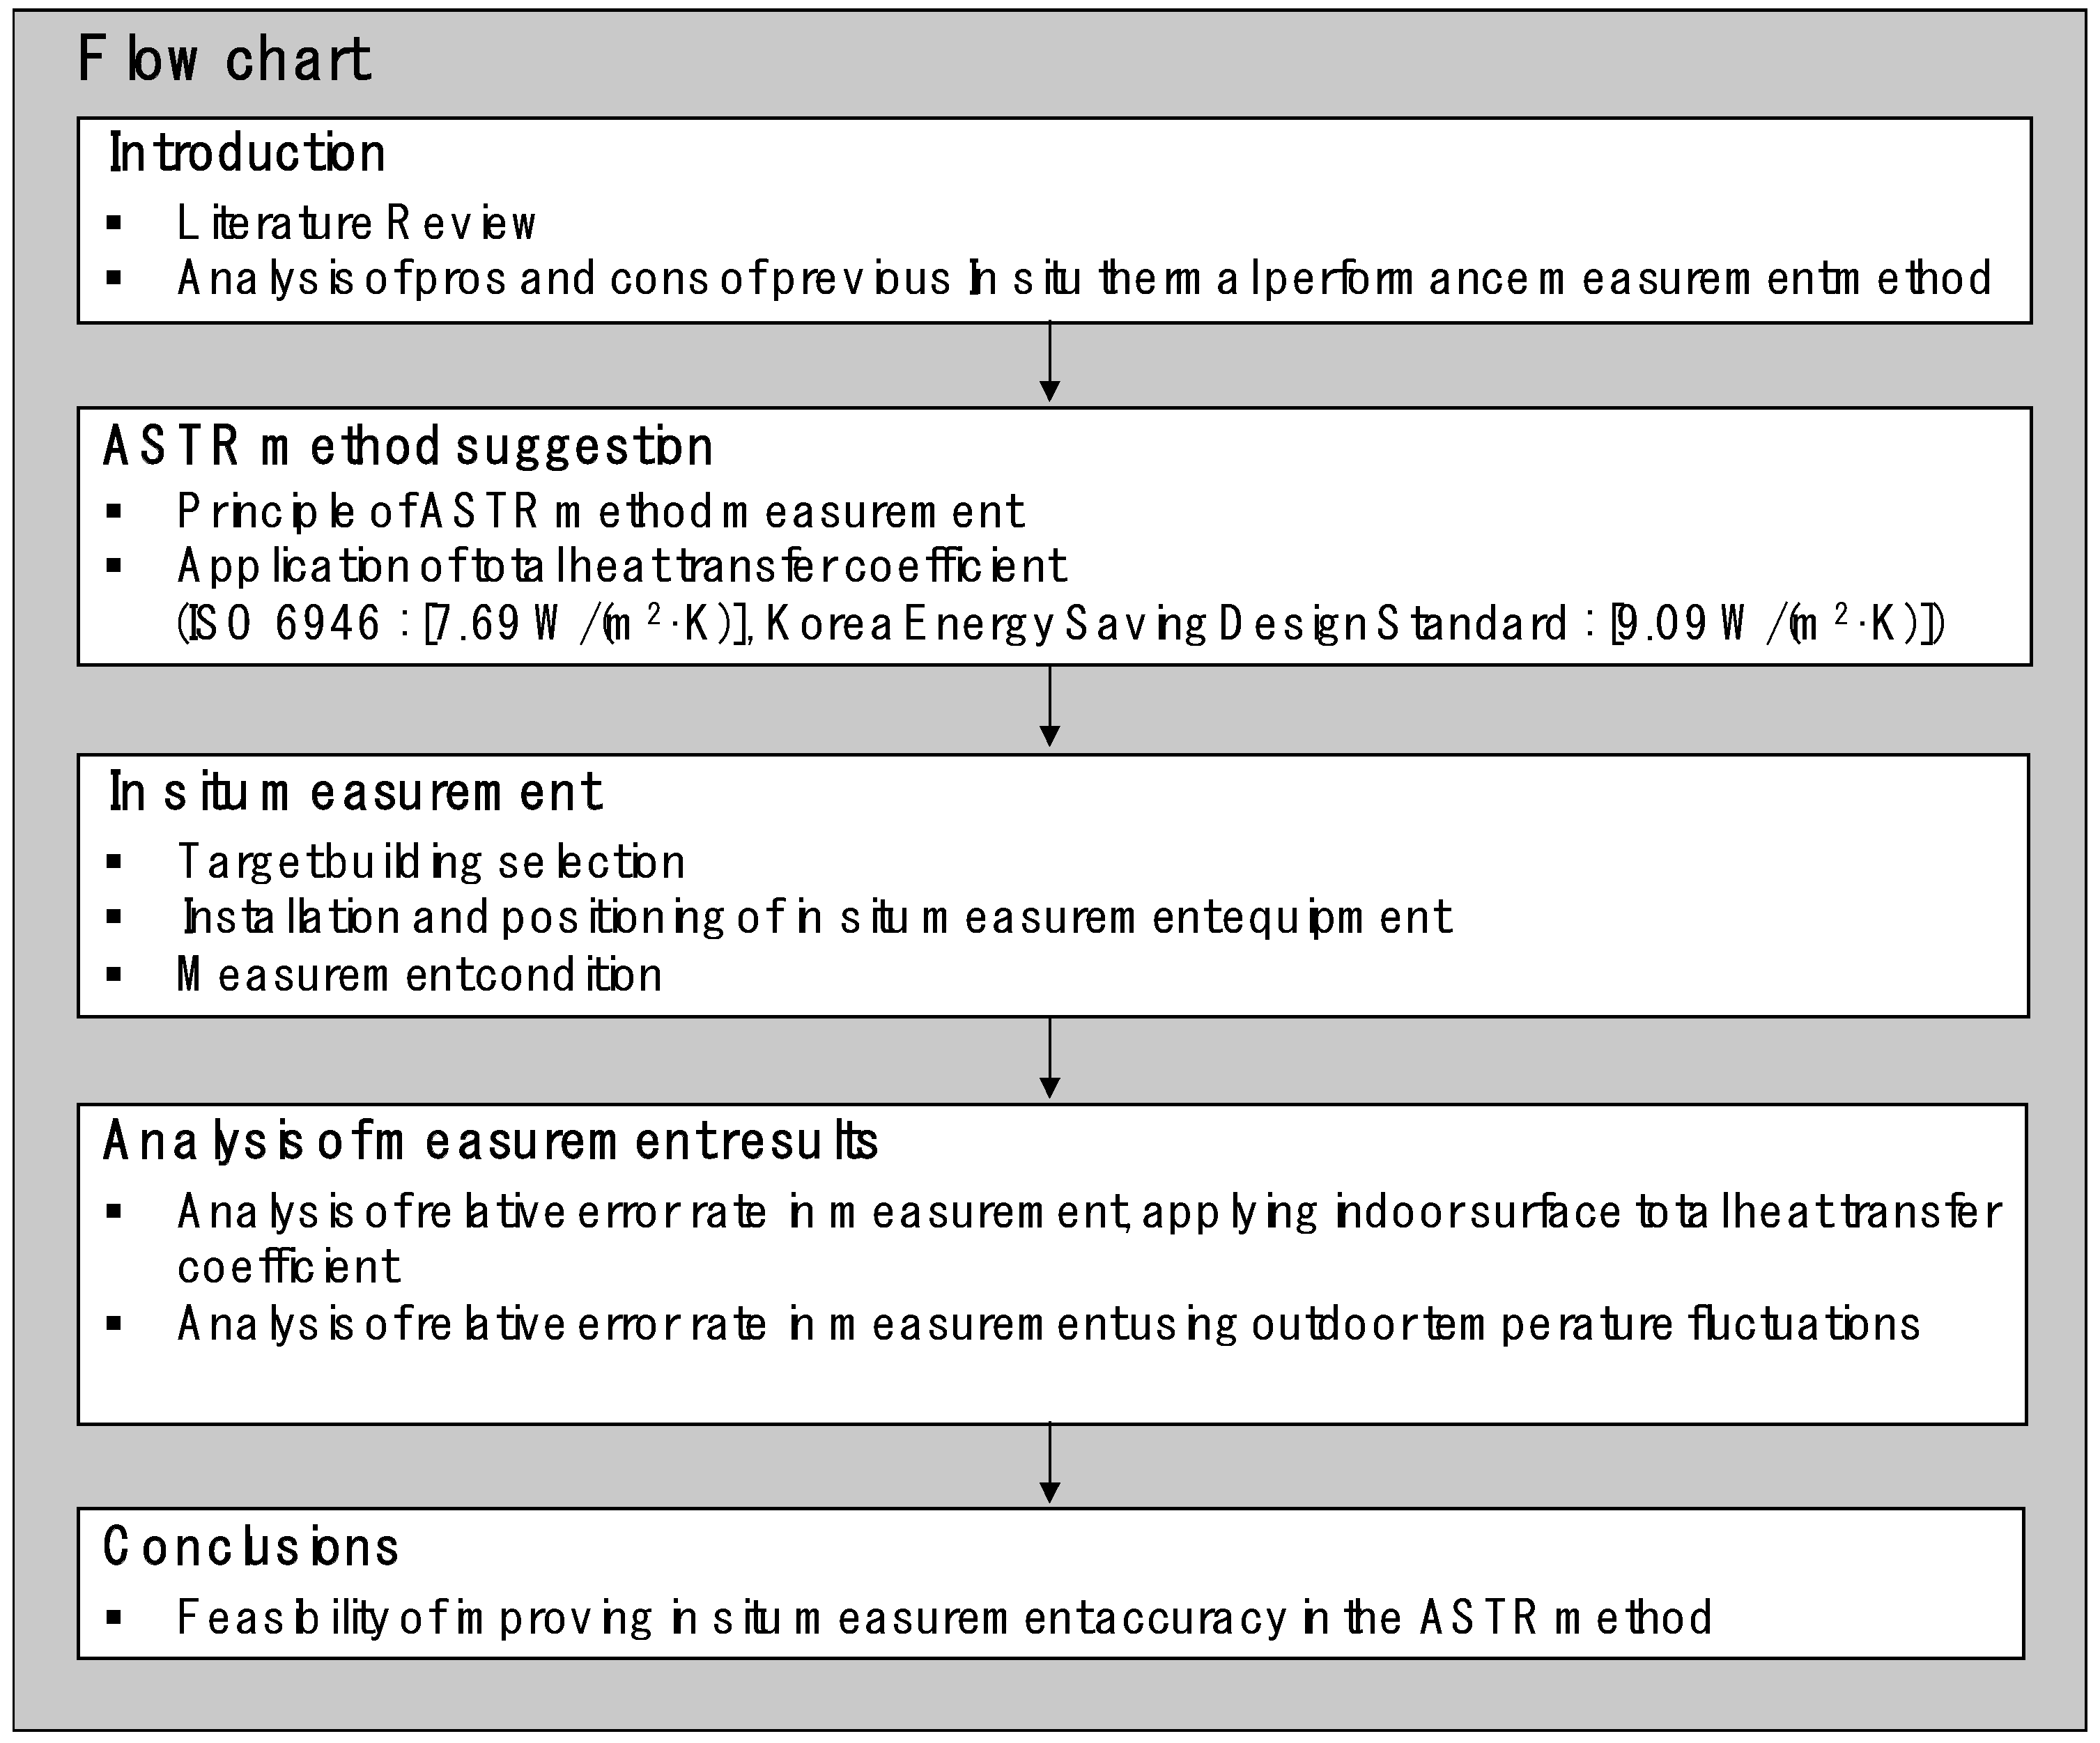
2.1. Study Process
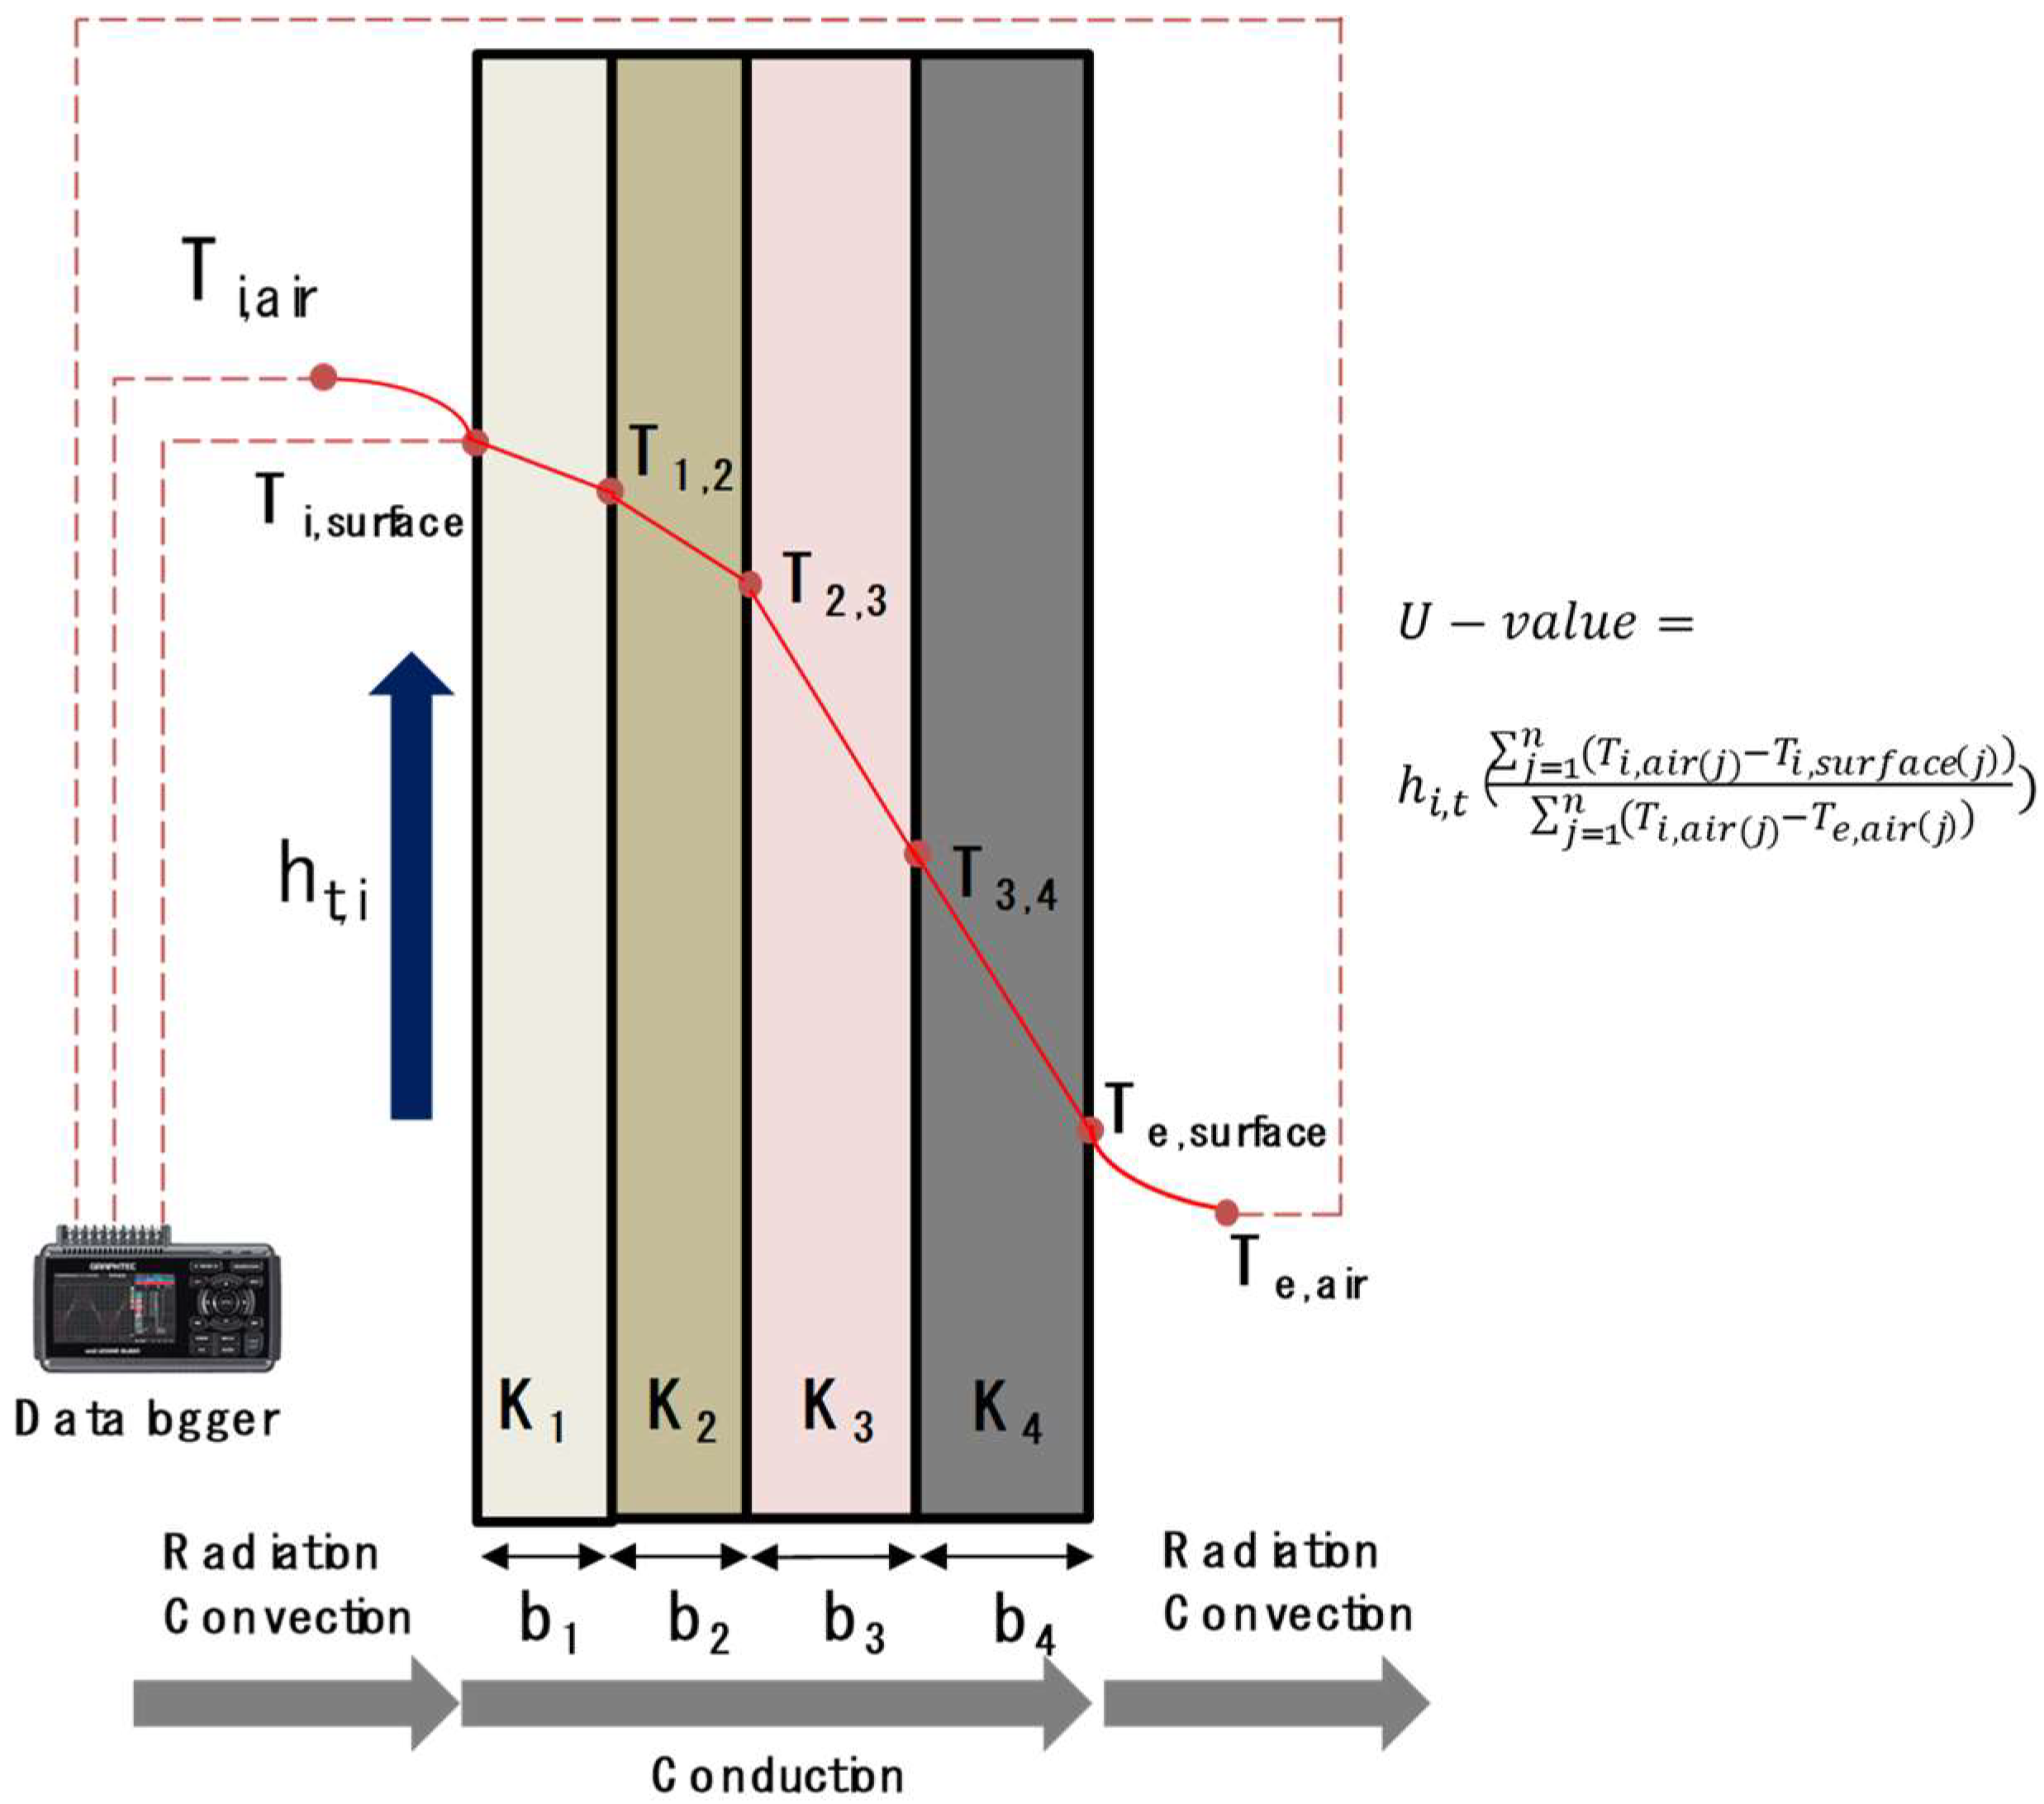
2.2. The Air-Surface Temperature Ratio (ASTR) Method
3. Overview of U-Values In Situ Measurement of Residential Building Envelopes
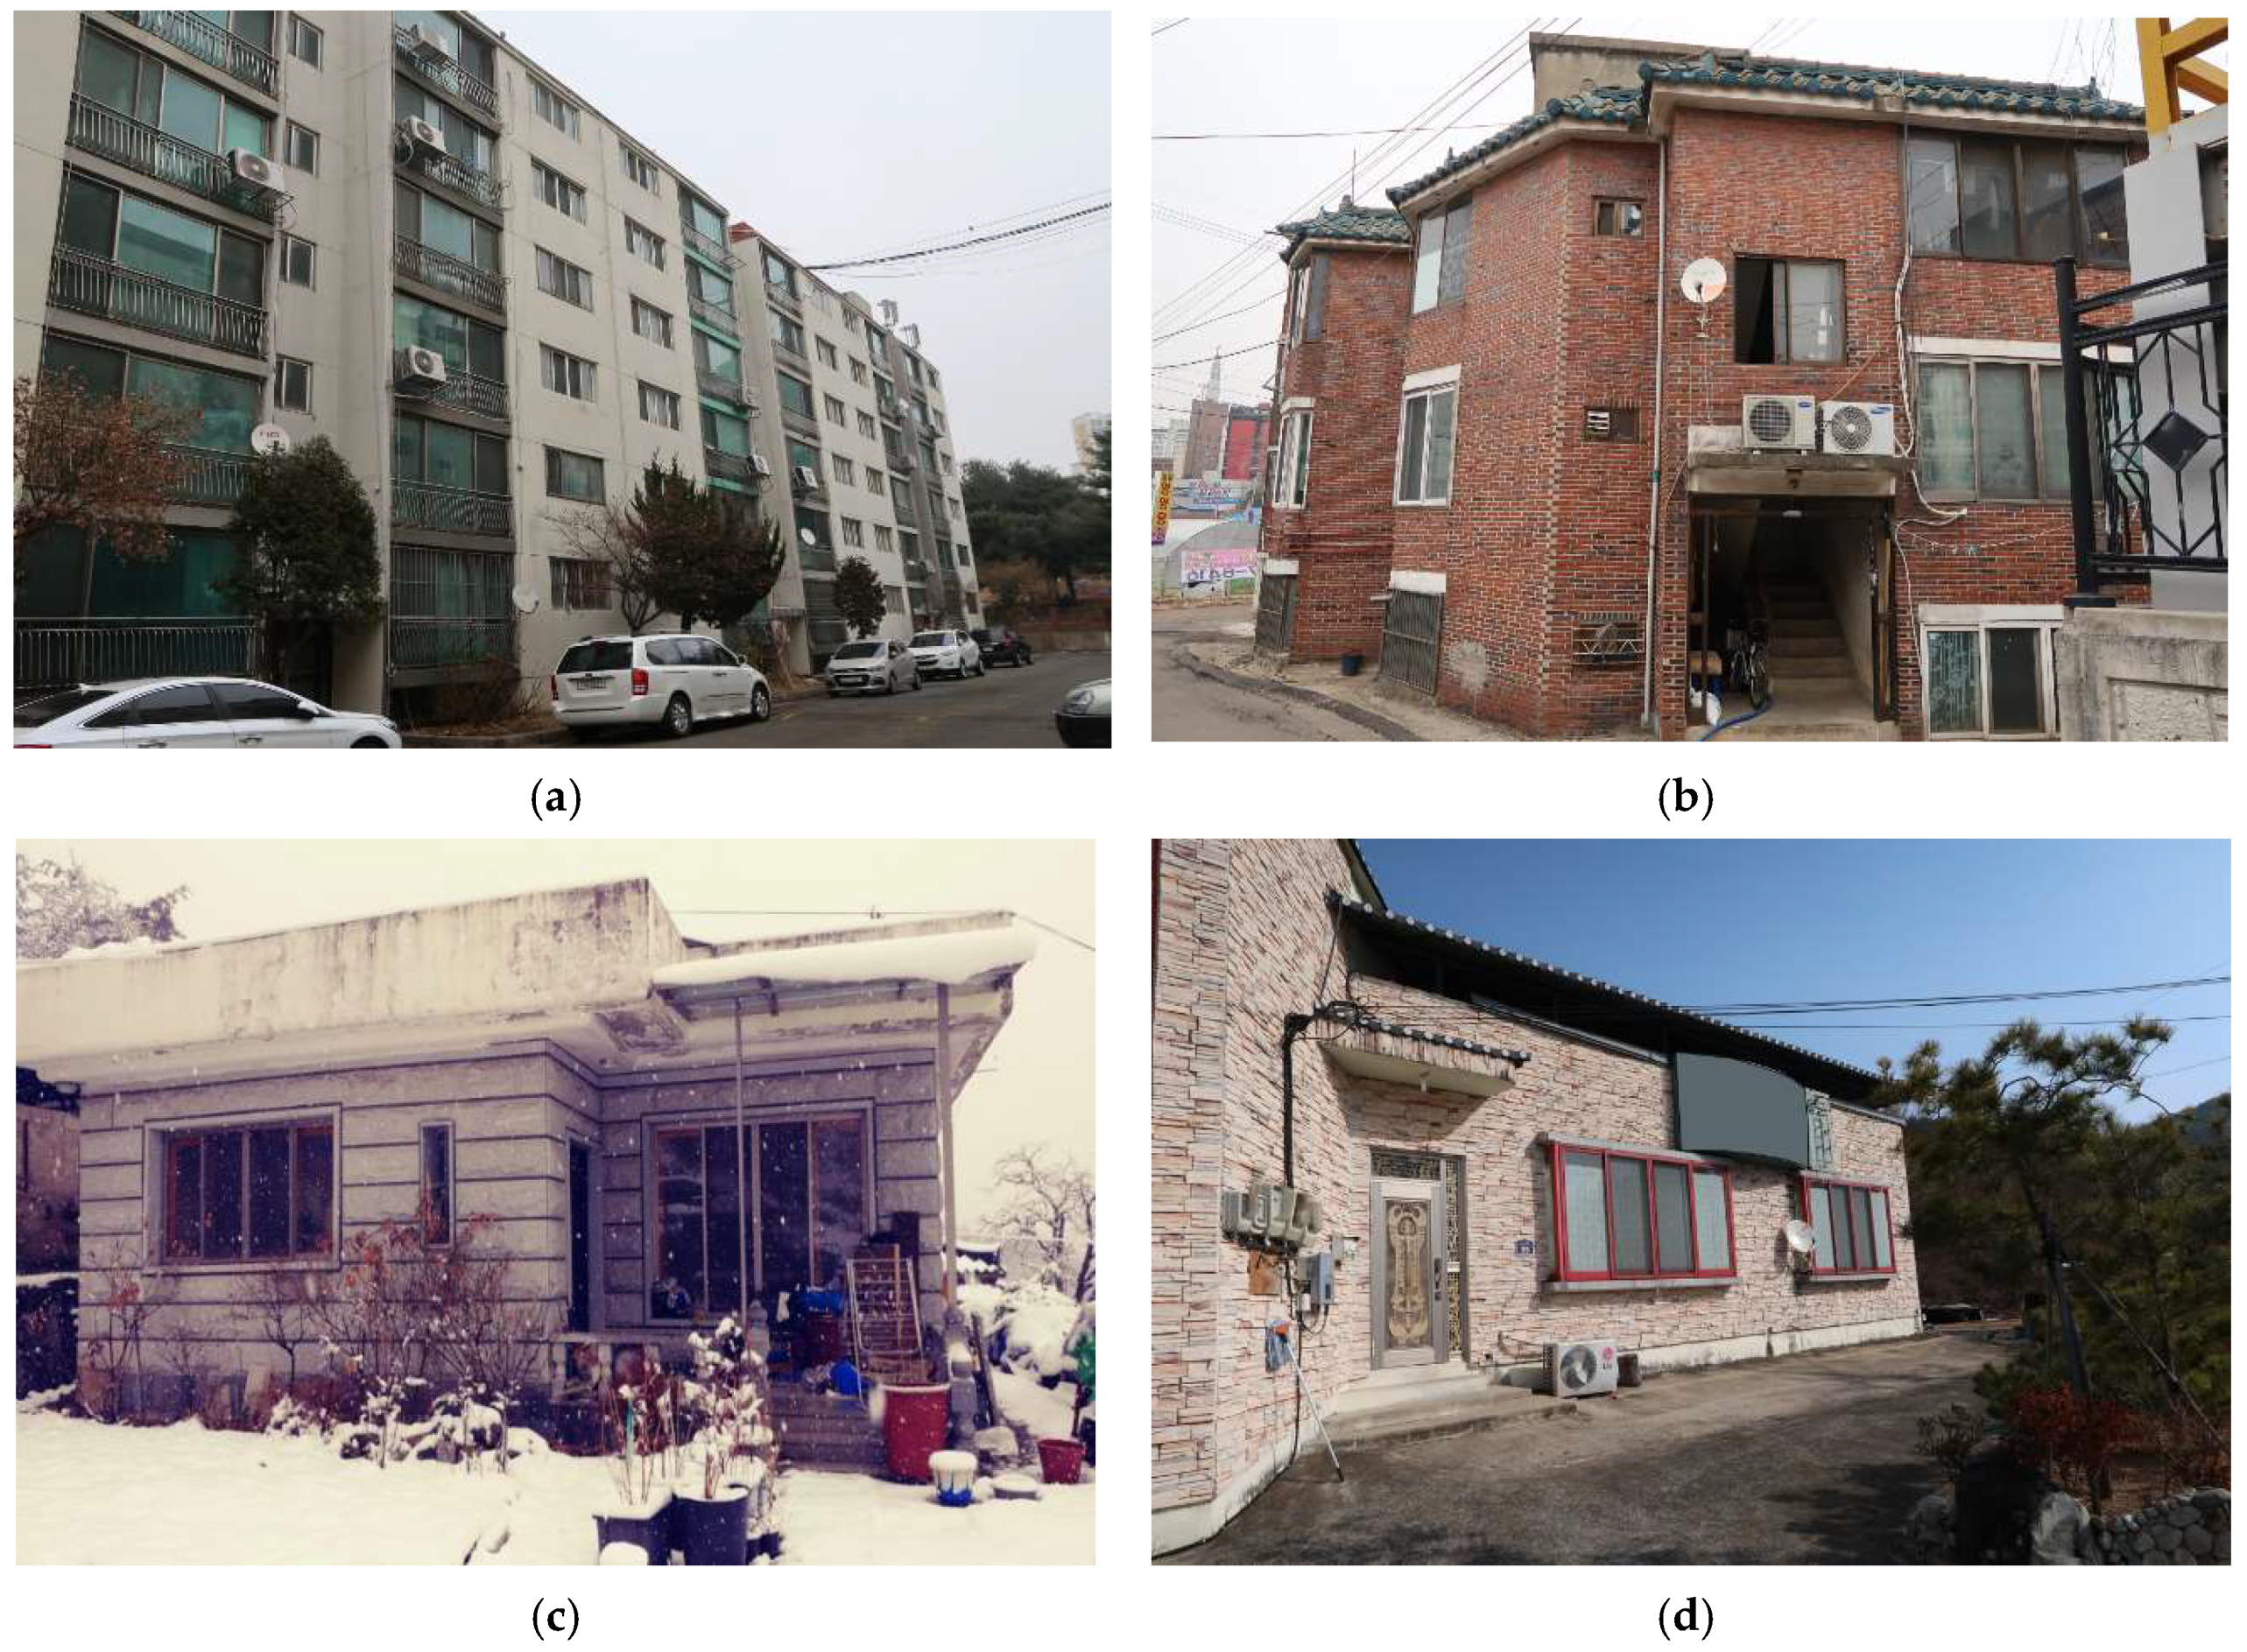
3.1. Target Buildings
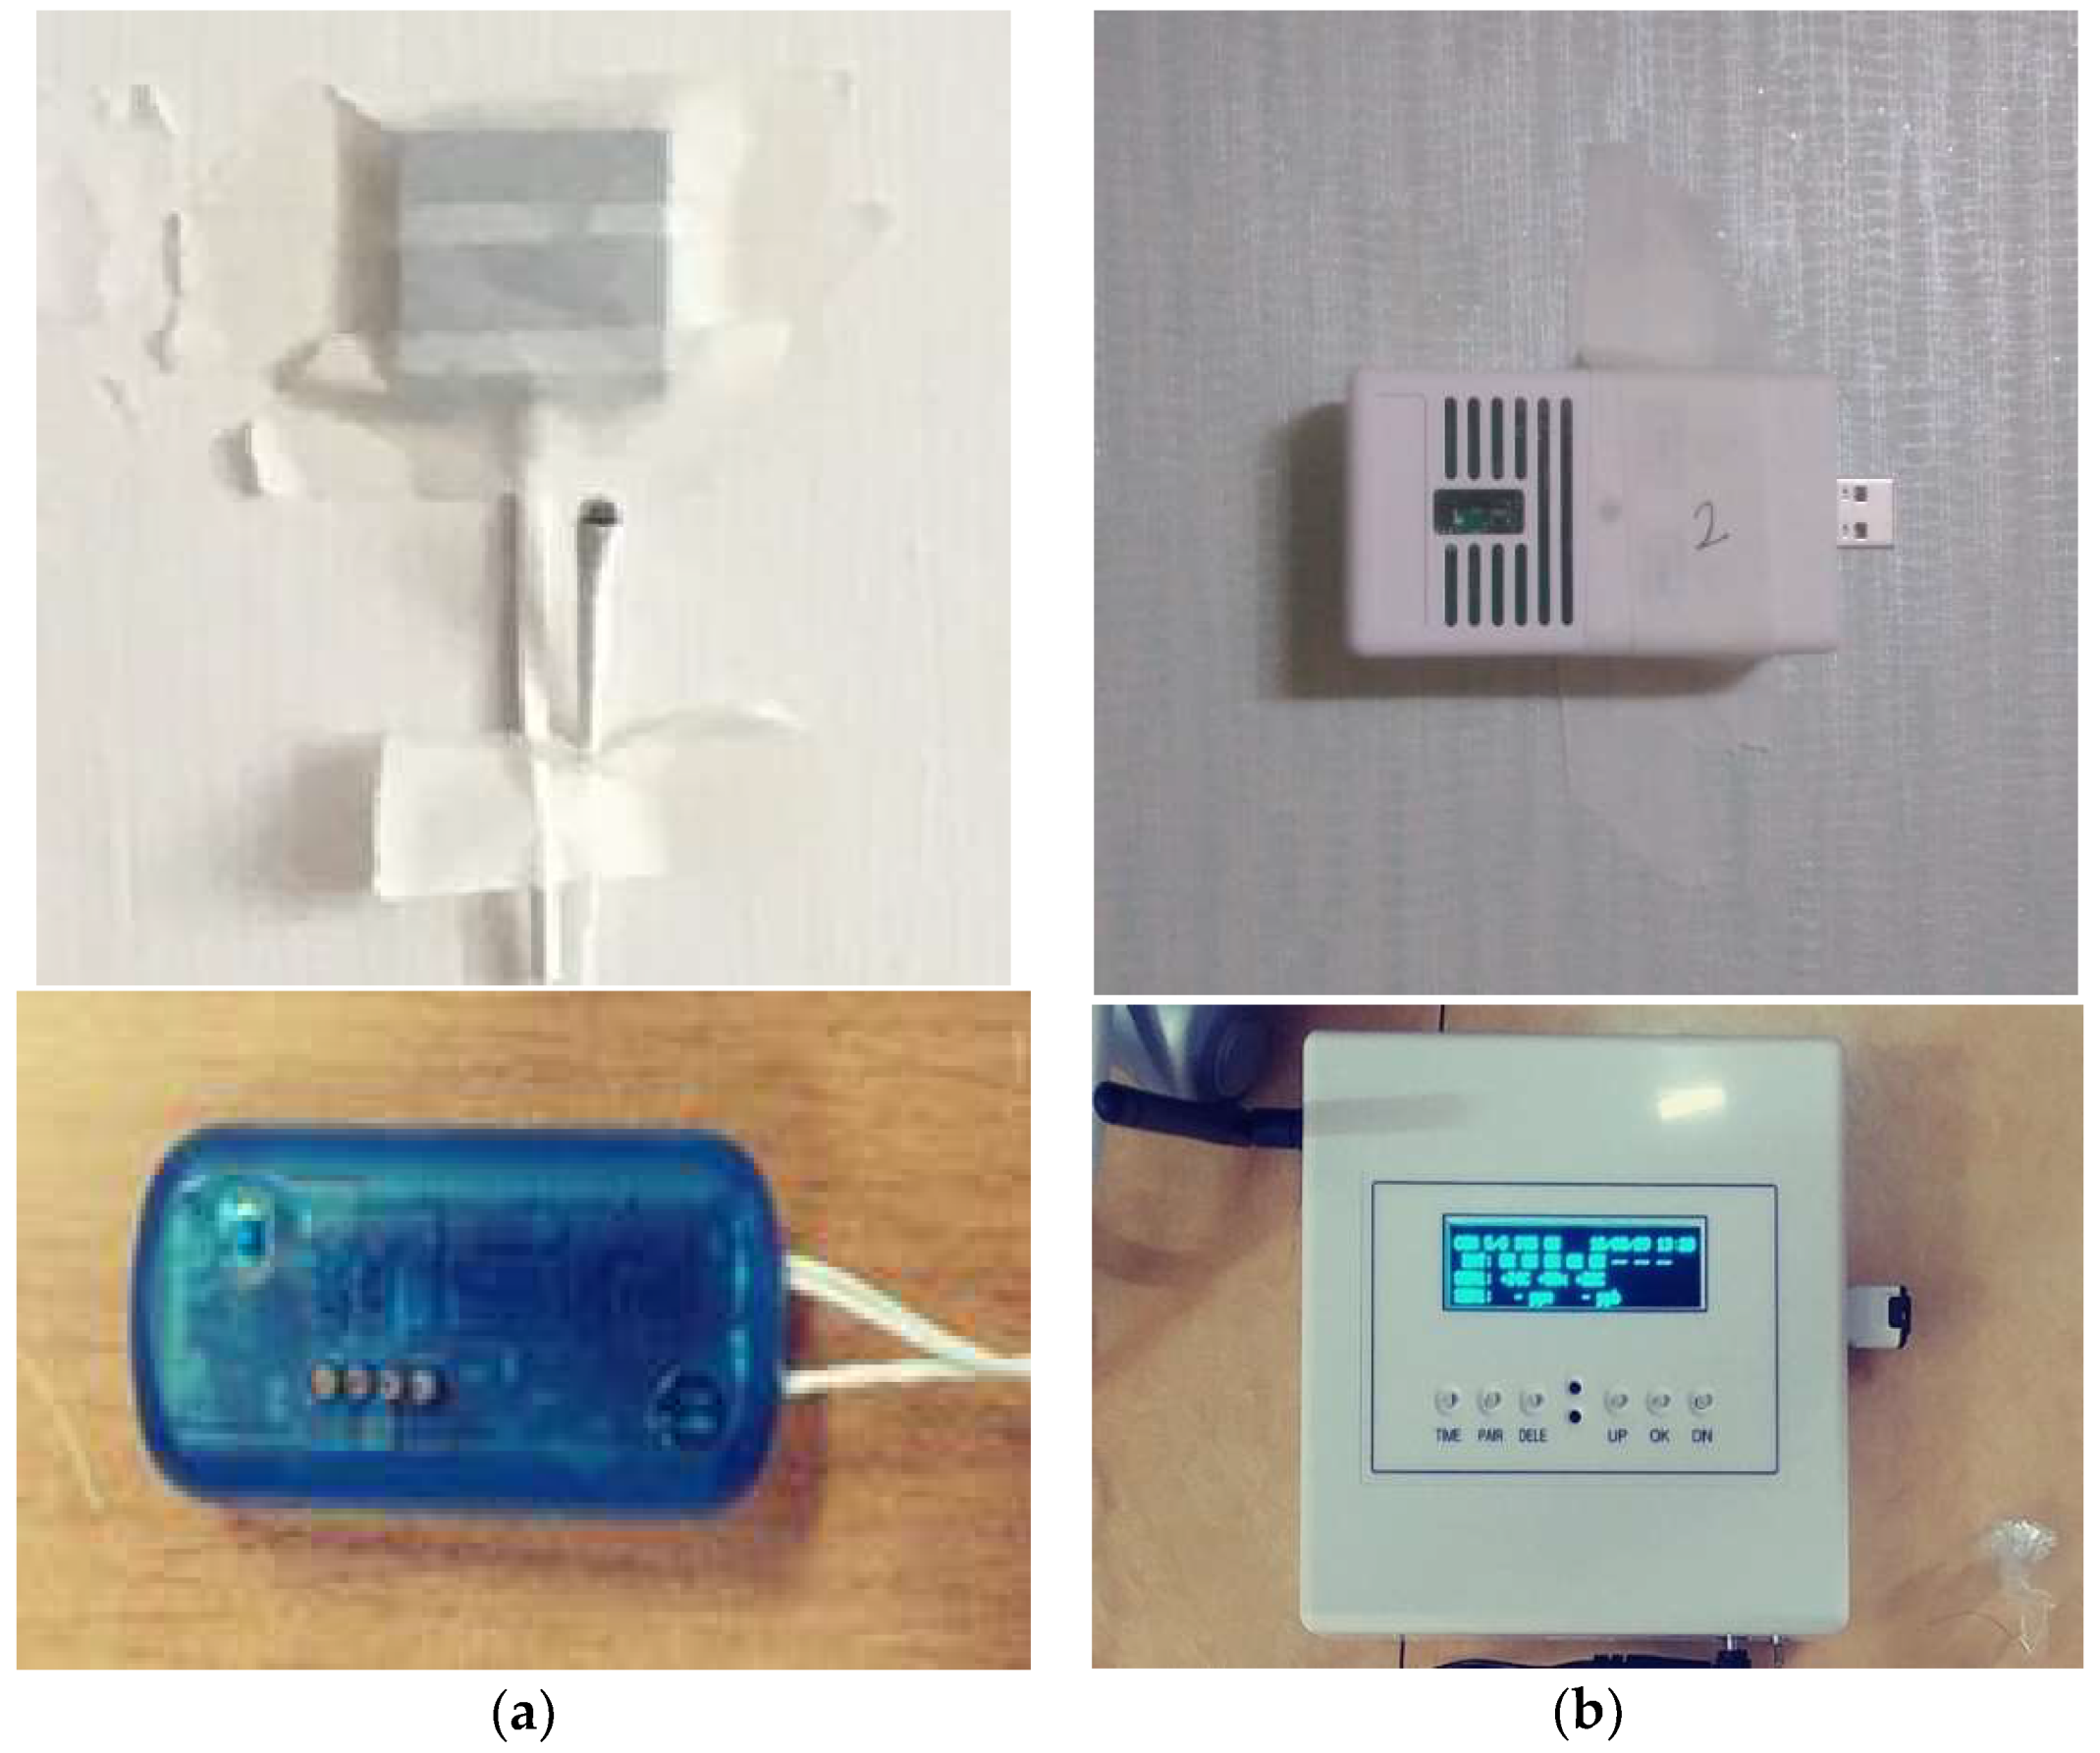
3.2. In Situ Measurement Equipment
3.3. In Situ Measurement Conditions
- (1)
- The heat flux of the building envelope.
- (2)
- The variation in the indoor temperature.
- (3)
- The variation in the outdoor temperature.
- (1)
- Applied heat transfer coefficient of the indoor side wall and horizontal surface (based on ISO 6946).
- (2)
- Applied heat transfer coefficient of the indoor side wall and horizontal surface (based on the Korea Energy Saving Design Standard).
- (3)
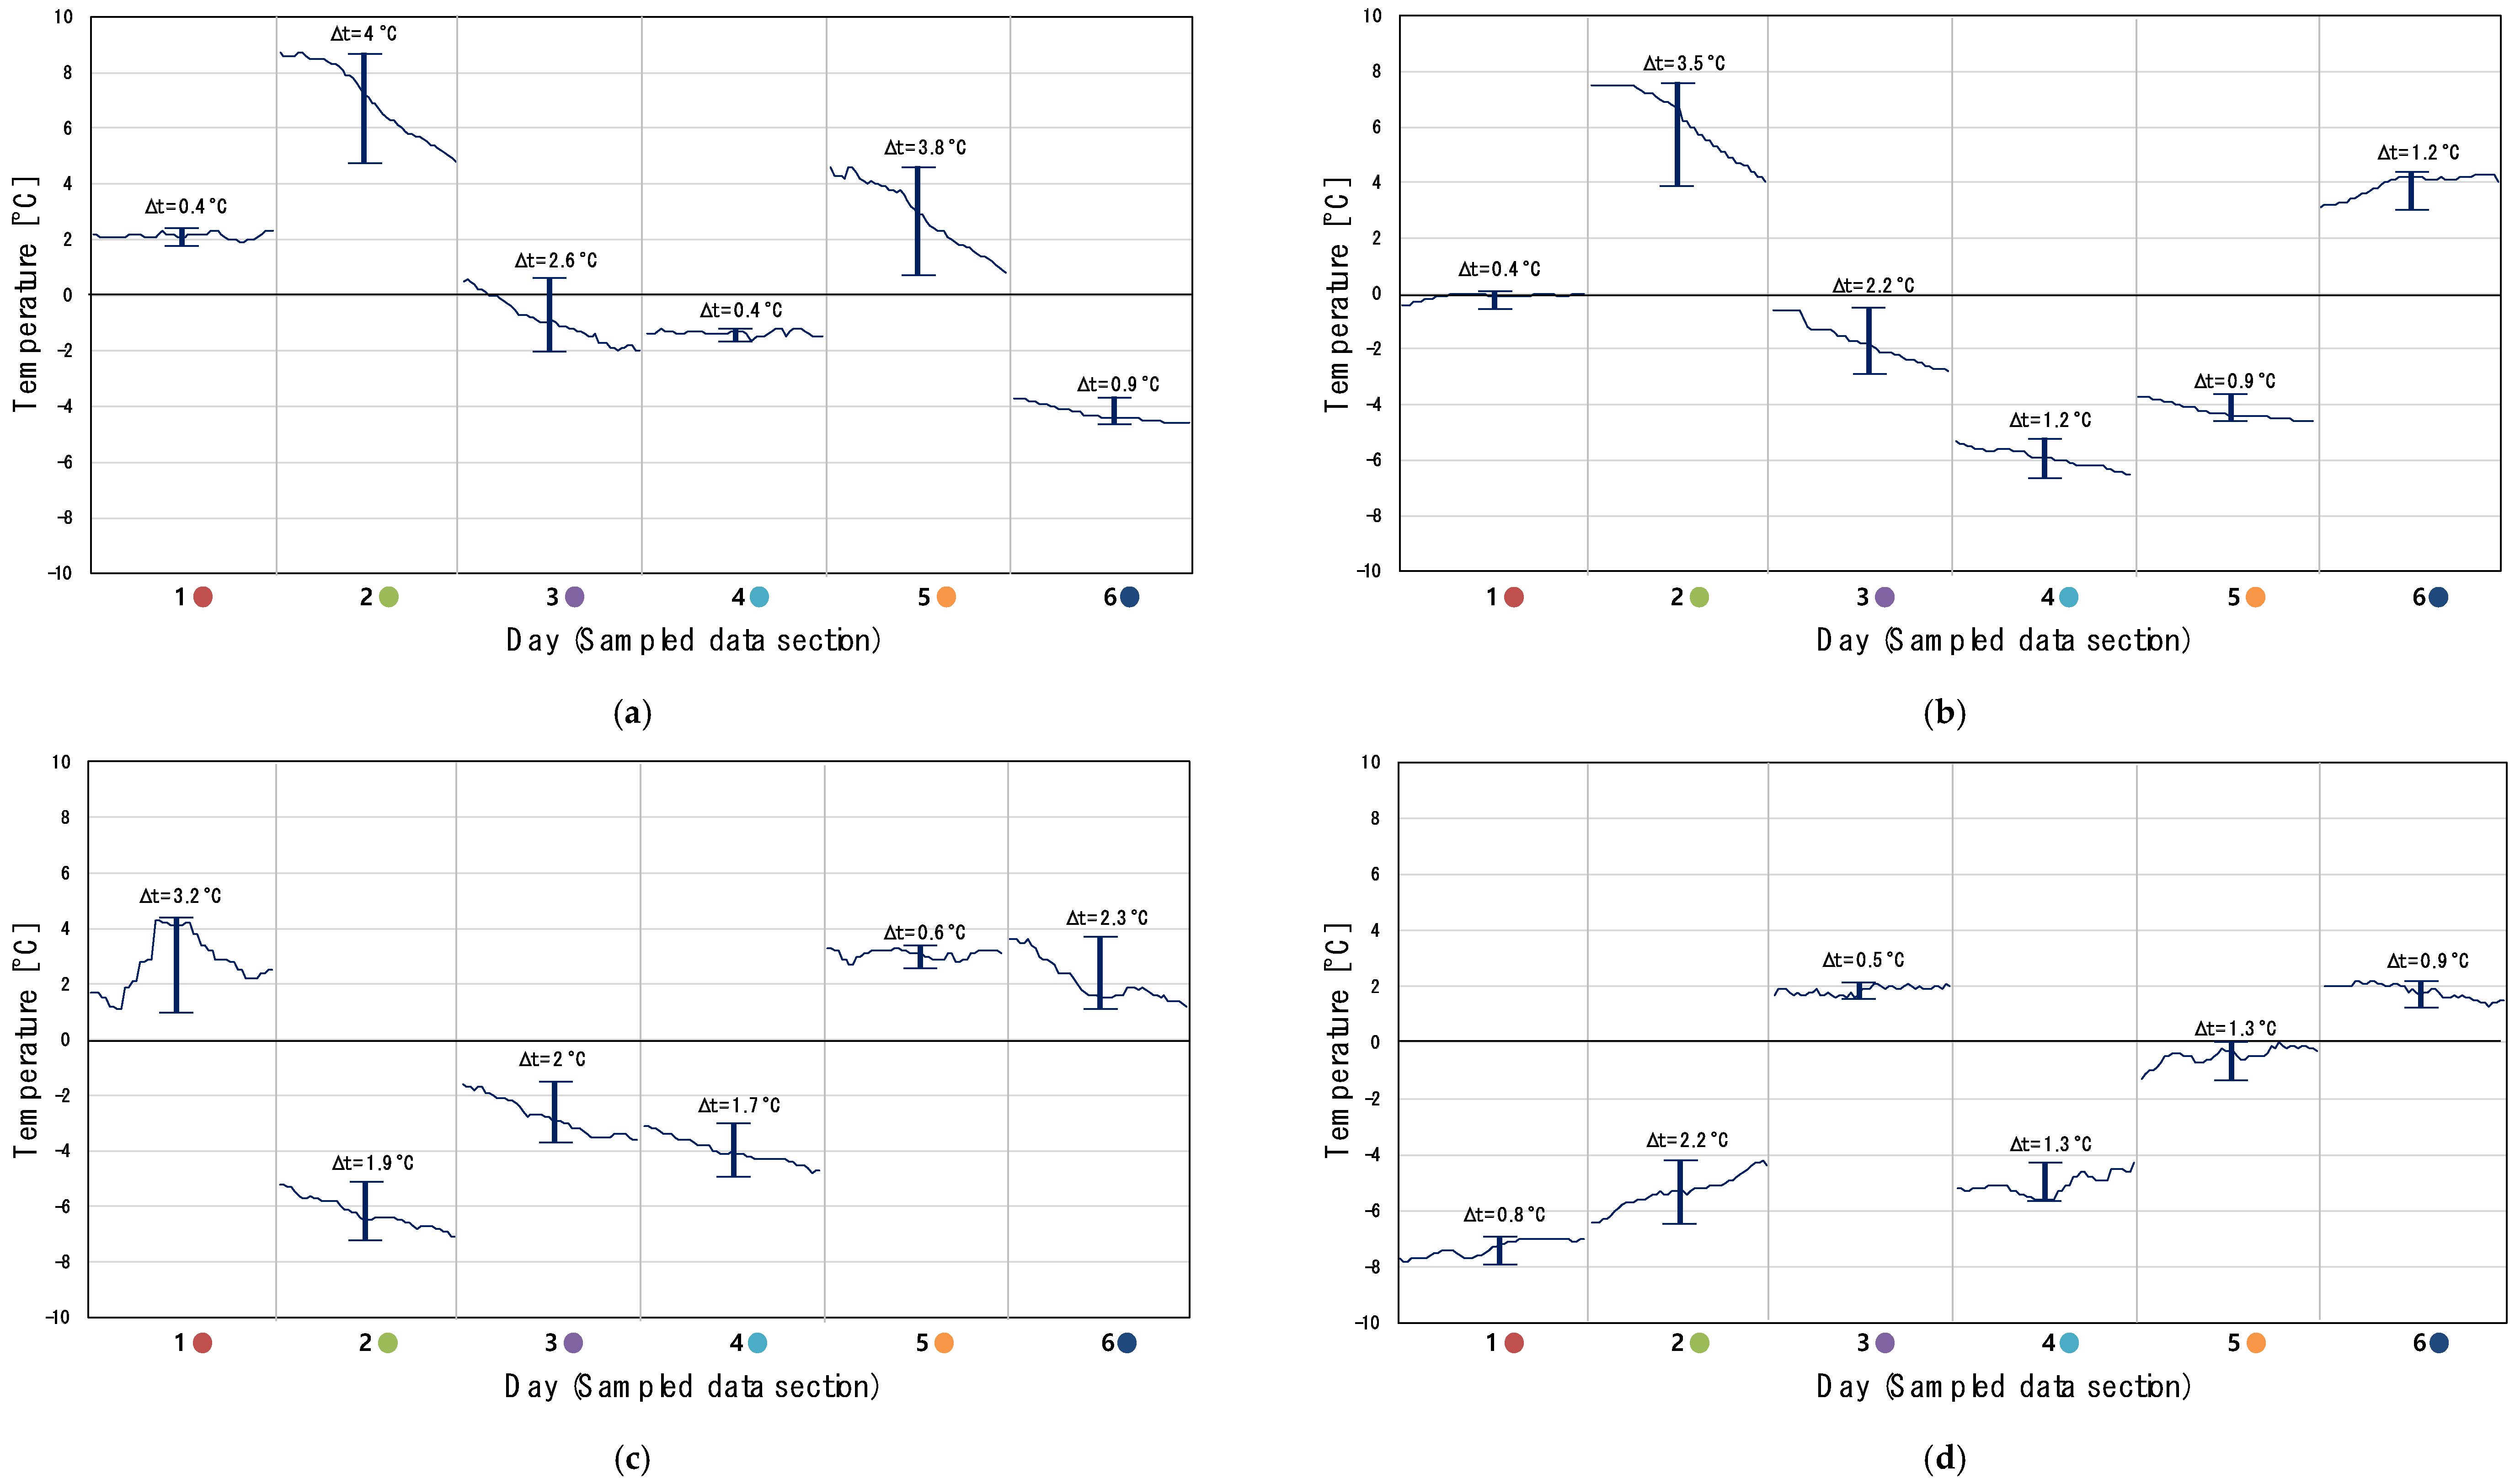
- No data sampling in sections where the change in outdoor temperature was large.
- (4)
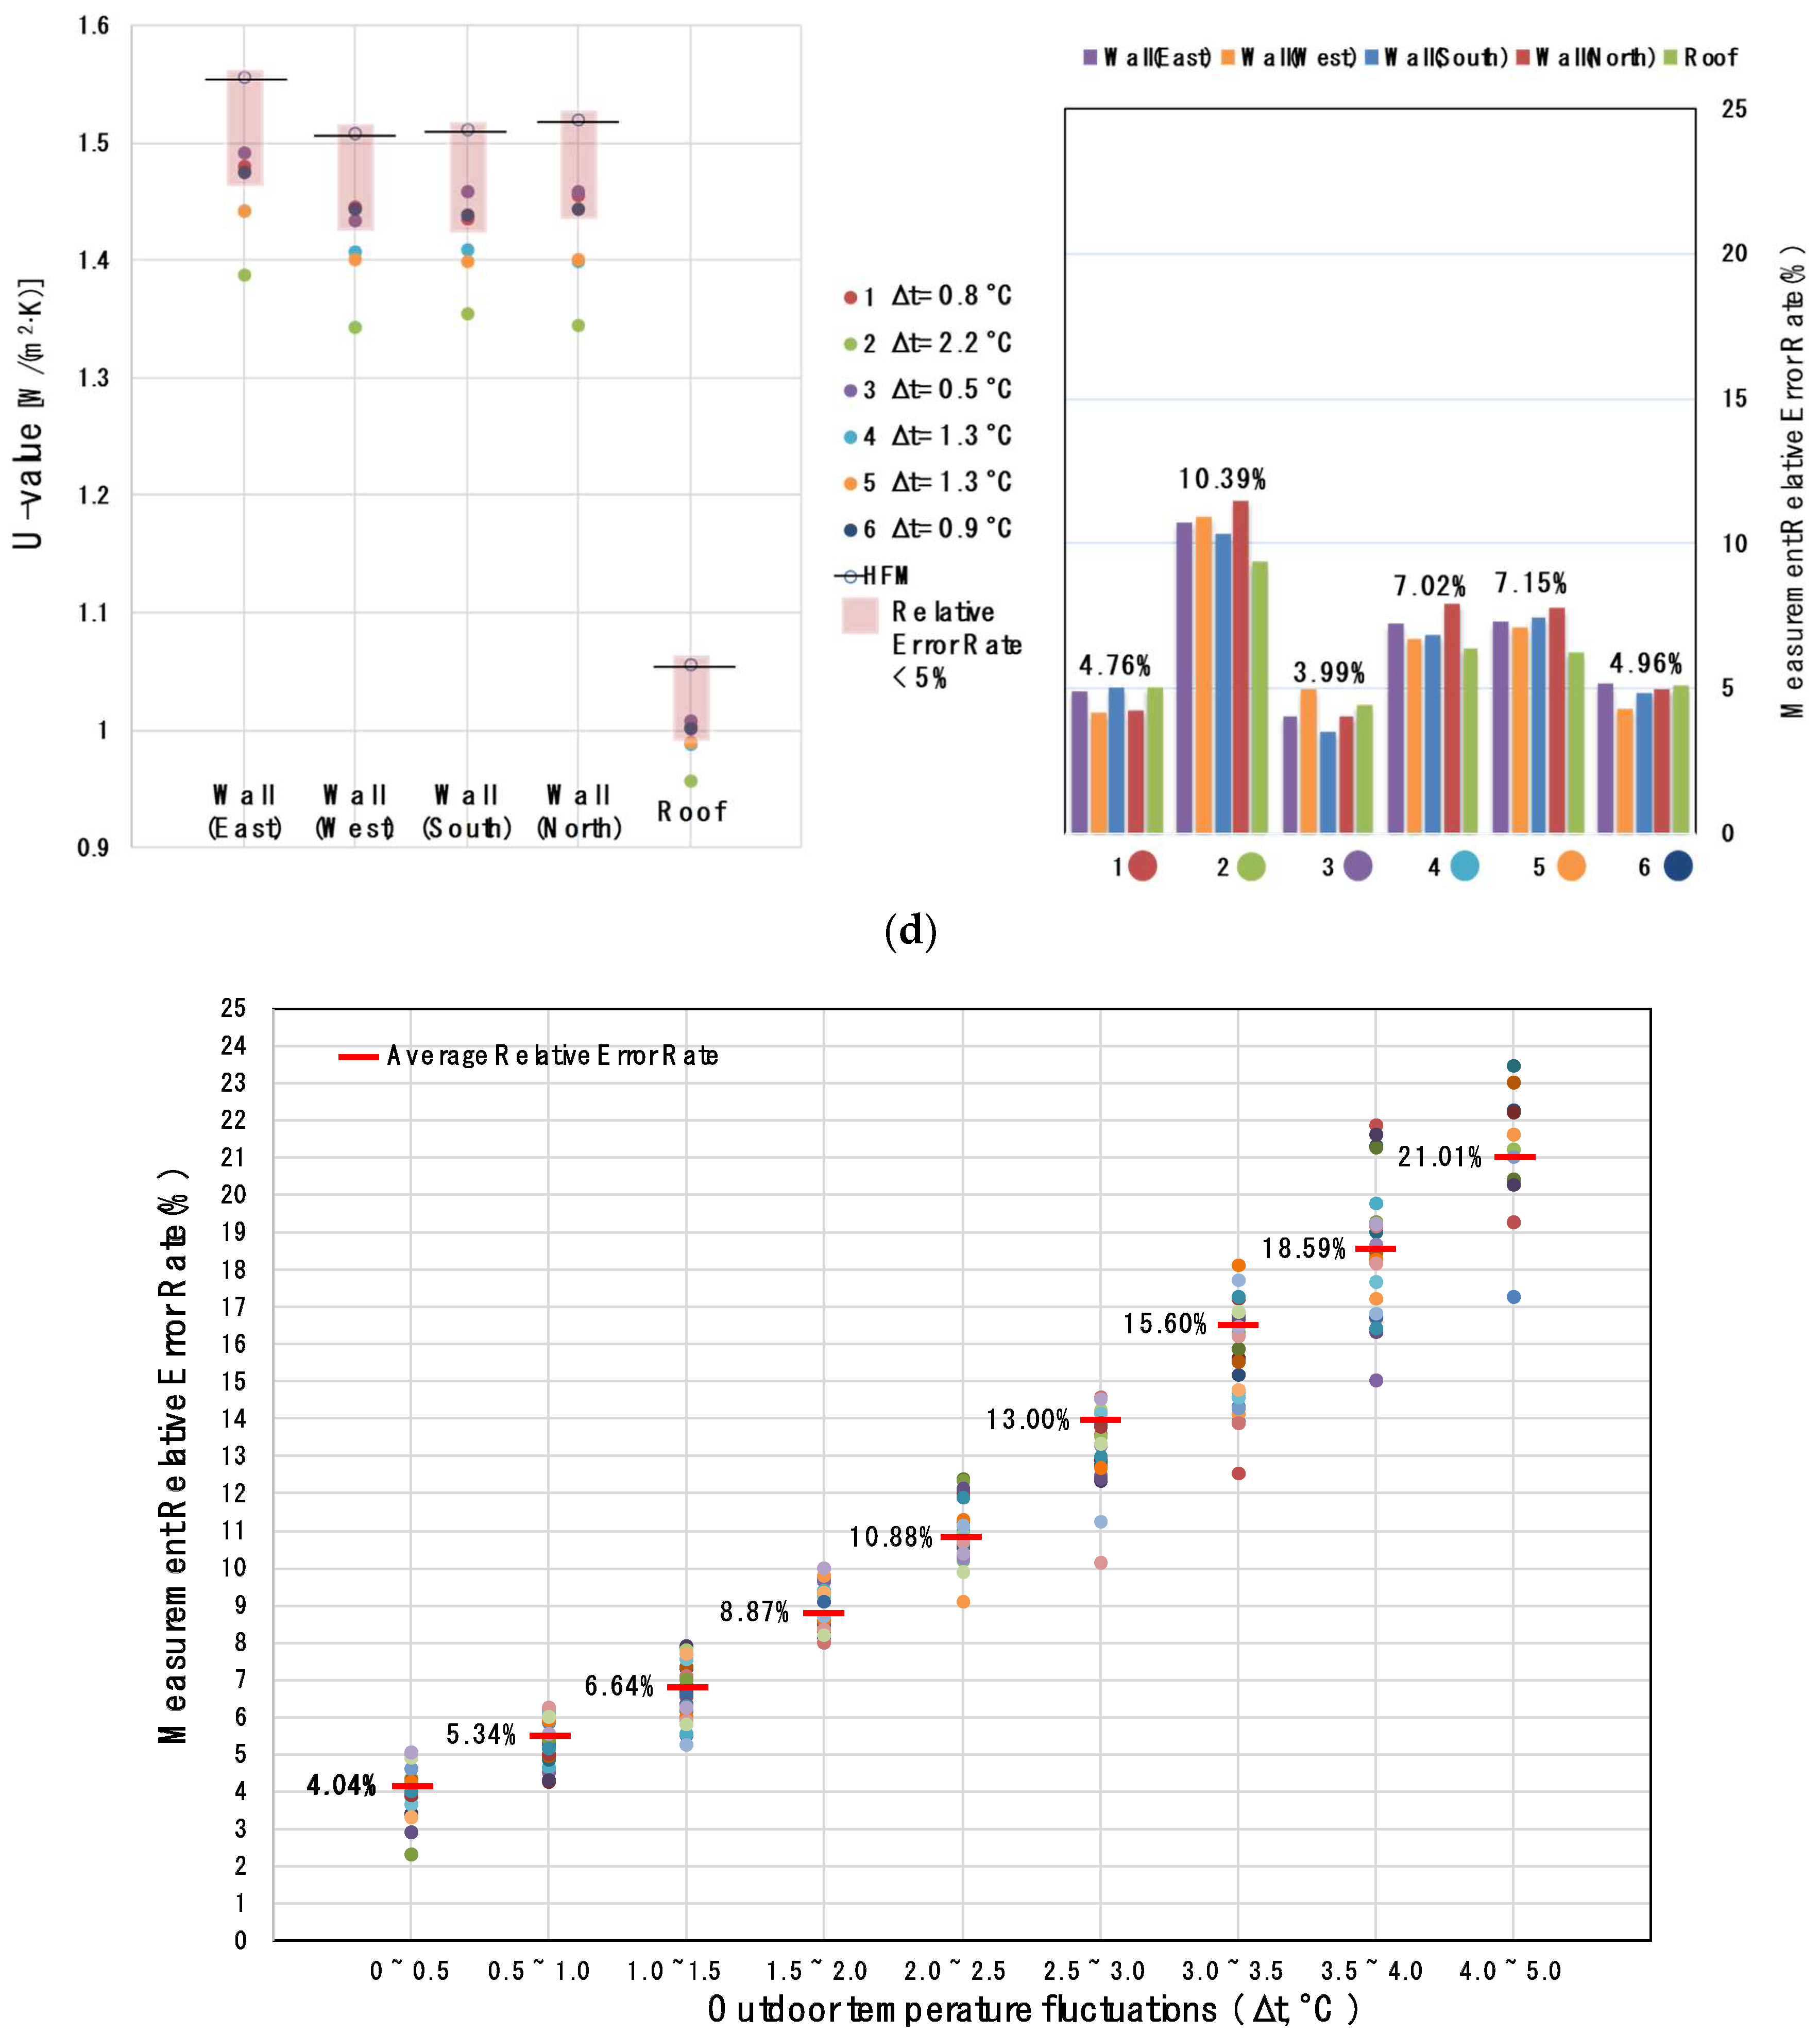
- Sampling data where a satisfactory range in the differences in outdoor temperature difference were present (outdoor temperature fluctuations: less than 1 °C).
4. Results and Discussion
4.1. Application of Indoor Total Surface Heat Transfer Coefficient
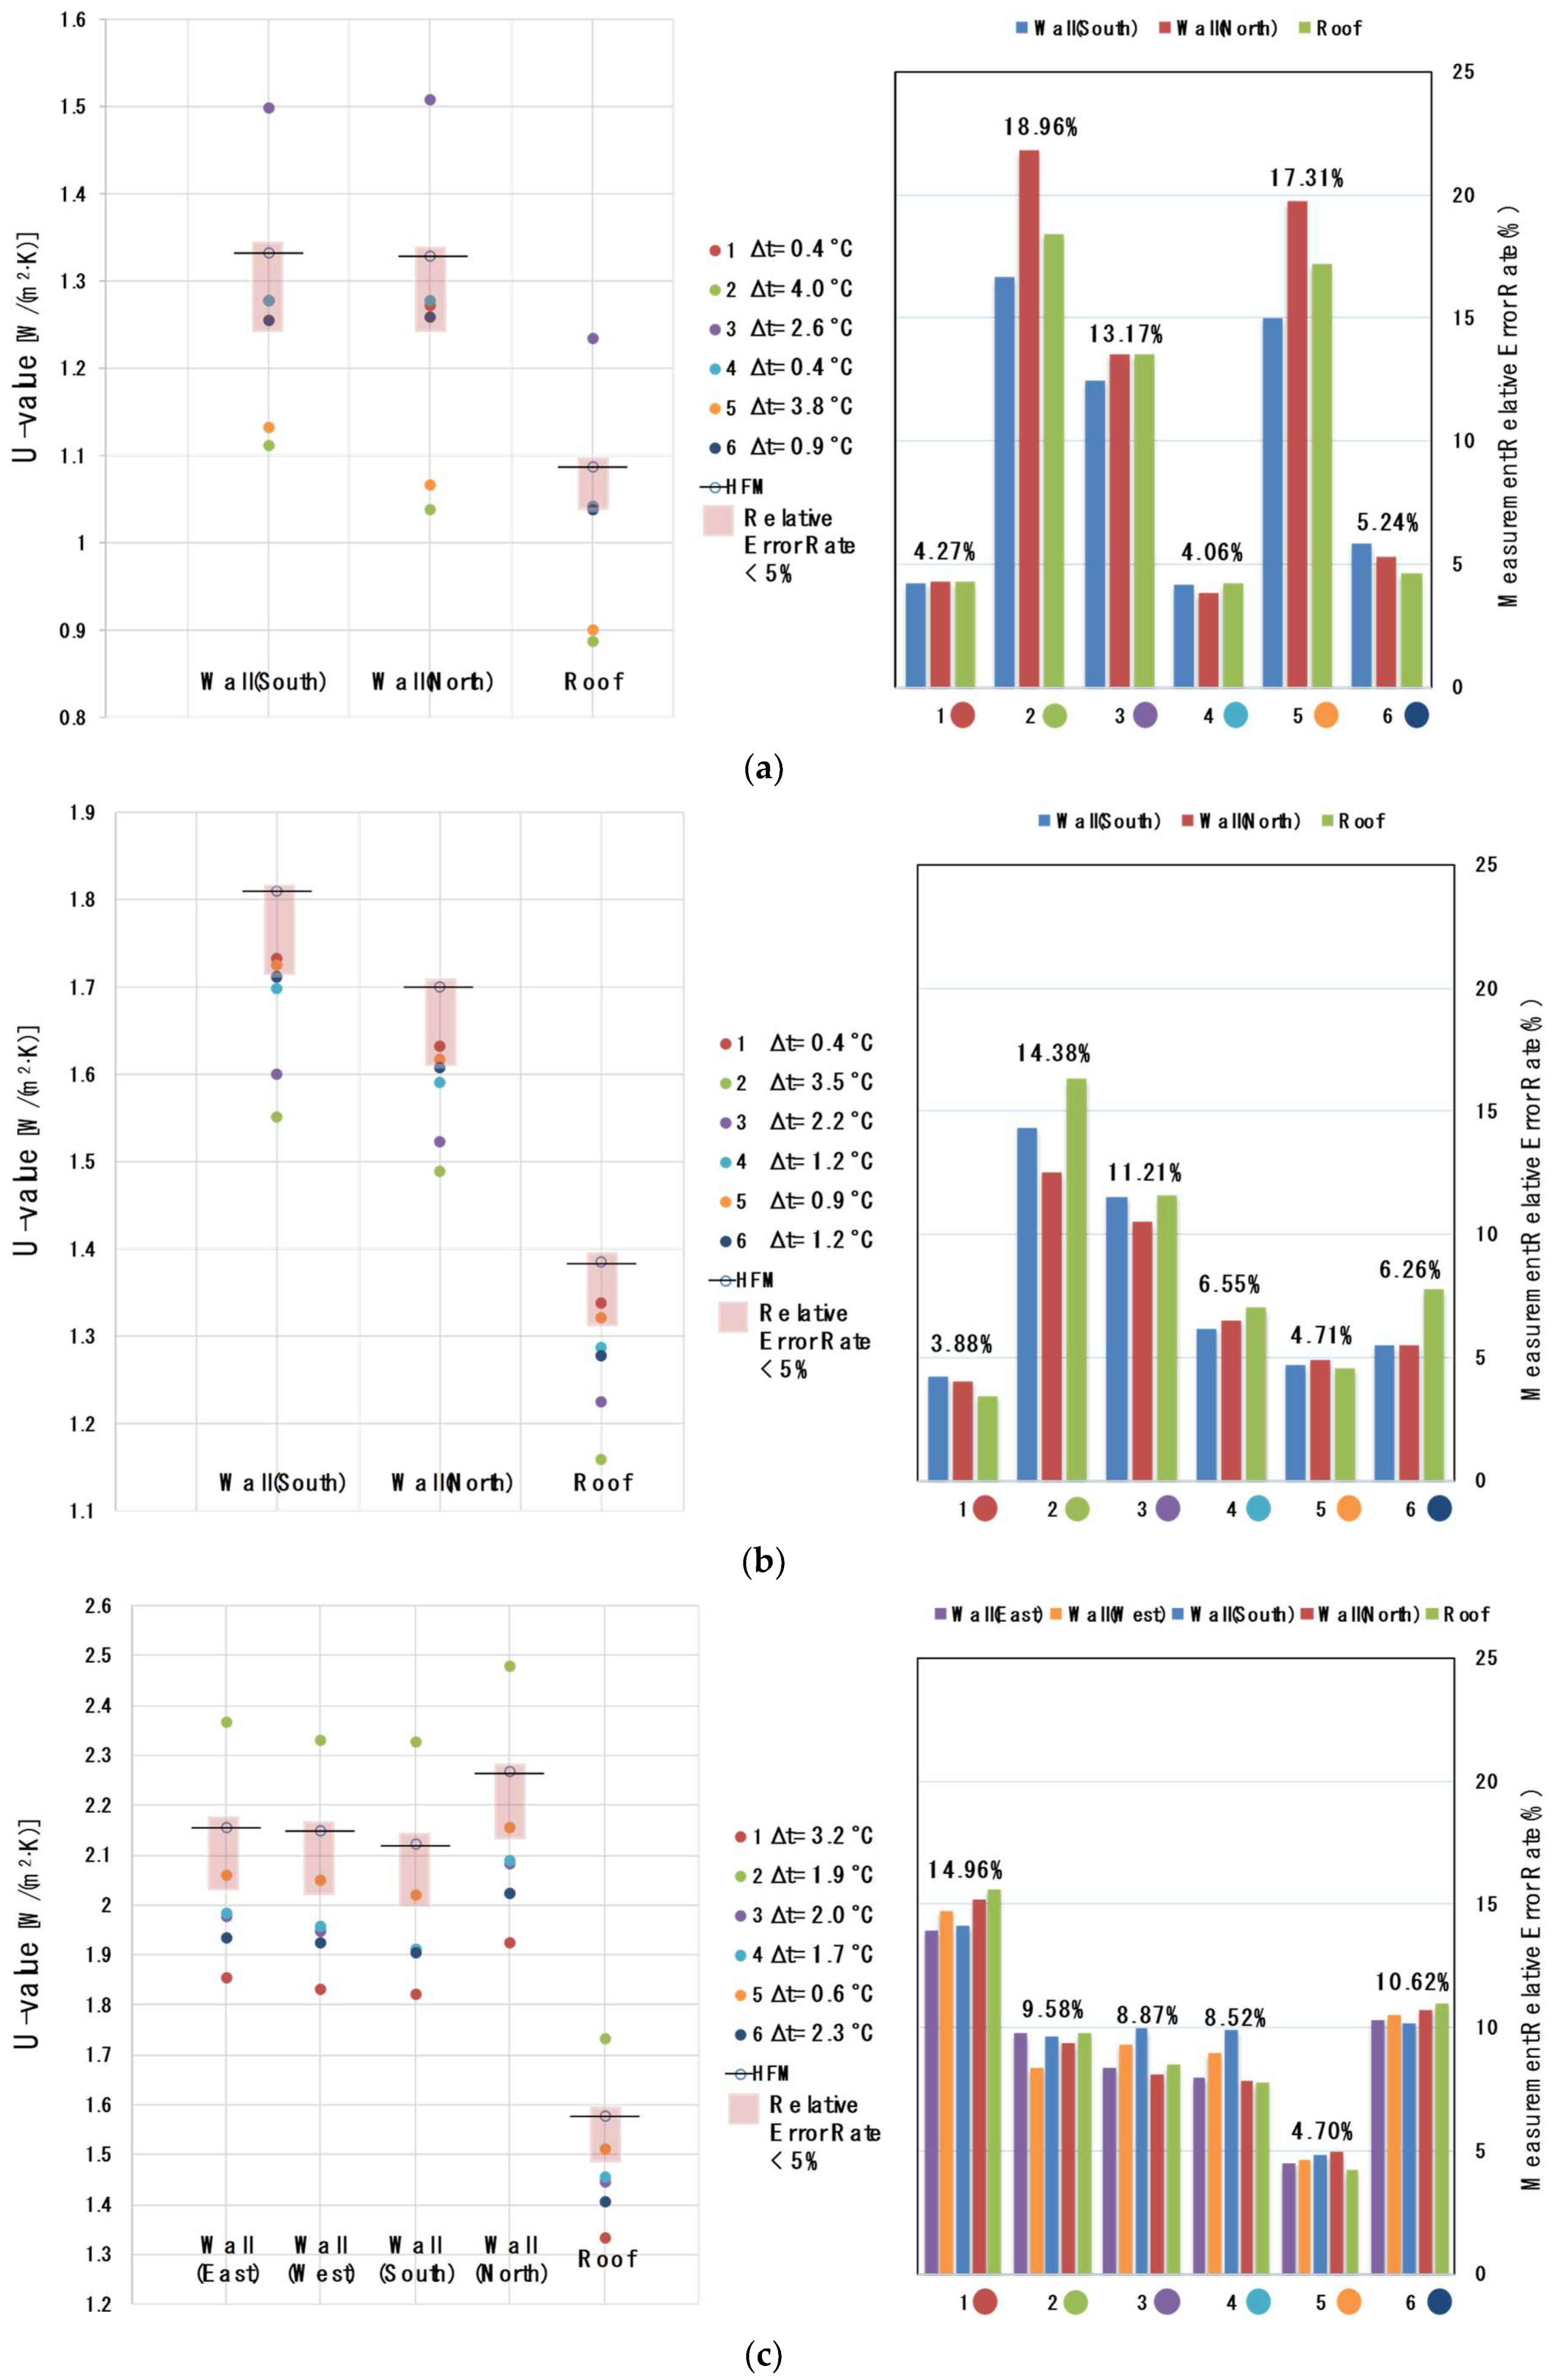
4.2. Data Sampling Based on Fluctuations in Outdoor Temperature
5. Conclusions
Author Contributions
Funding
Acknowledgments
Conflicts of Interest
References
- Ministry of Land, Infrastructure and Transport (MOLIT). Amendment of Energy Saving Design Standards for Buildings; Ministry of Land, Infrastructure and Transport: Sejong-si, Korea, 2017.
- European Parliament and Council. Directive 2012/27/EU of the European Parliament and of the Council; EUR-Lex Access to European Union Law; European Parliament and Council: Brussel, Belgium, 2012. [Google Scholar]
- Dall’O, G.; Sarto, L.; Panza, A. Infrared screening of residential buildings for energy audit purposes: Results of a field test. Energies 2013, 6, 3859–3878. [Google Scholar] [CrossRef]
- Kim, S.G.; Kwon, S.W. The study of optimum method about the design and operating through a zero-energy house built in the existing building. New Renew. Energy 2015, 1149–1159. [Google Scholar] [CrossRef]
- Korea Energy Economics Institute. Residential Building Energy Efficiency Improvement Strategy; Korea Energy Economics Institute: Ulsan, Korea, 2013. [Google Scholar]
- Jones, P.; Li, X.J.; Perisolgou, E.; Patterson, J. Five energy retrofit houses in South Wales. Energy Build. 2017, 154, 335–342. [Google Scholar] [CrossRef]
- Elsharkawy, H.; Rutherford, P. Energy-efficient retrofit of social housing in the UK: Lessons learned from a Community Energy Saving Programme (CESP) in Nottingham. Energy Build. 2018, 172, 295–306. [Google Scholar] [CrossRef]
- International Organization for Standardization. Thermal Insulation—Building Elements—In-Situ Measurement of Thermal Resistance and Thermal Transmittance—Part 1: Heat Flow Meter Method; ISO Standard 9869-1; International Organization for Standardization: Geneva, Switzerland, 2014. [Google Scholar]
- Deconick, A.-H.; Roels, S. Comparison of characterisation methods determining the thermal resistance of building components from onsite measurements. Energy Build. 2016, 130, 309–320. [Google Scholar]
- Shin, M.-S.; Rhee, K.-N.; Yu, J.-Y.; Jung, G.-J. Determination of equivalent thermal conductivity of window spacers in consideration of condensation prevention and energy saving performance. Energies 2017, 10, 717. [Google Scholar] [CrossRef]
- Oh, J.H.; Yoo, H.J.; Kim, S.S. Evaluation of strategies to improve the thermal performance of steel frames in curtain wall systems. Energies 2016, 9, 1055. [Google Scholar] [CrossRef]
- Ficco, G.; Iannetta, F.; Ianniello, E.; Alfano, F.R.d.A.; Dell’Isola, M. U-value in situ measurement for energy diagnosis of existing buildings. Energy Build. 2015, 104, 108–121. [Google Scholar] [CrossRef]
- Cesaratto, P.G.; Carli, D.M. A measuring campaign of thermal conductance in situ and possible impacts on net energy demand in buildings. Energy Build. 2013, 59, 29–36. [Google Scholar] [CrossRef]
- Pisello, A.L.; Cotana, F.; Nicolini, A.; Buratti, C. Effect of dynamic characteristics of building envelope on thermal-energy performance in winter conditions: In field experiment. Energy Build. 2014, 80, 218–230. [Google Scholar] [CrossRef]
- Cheng, X.; Kato, S.; Hiyama, K.; Sihwan, L. The Technological Investigation of Wall Thermal Performance Diagnosis. Seisan Kenkyu 2013, 65, 5–7. [Google Scholar]
- Walker, R.; Pavía, S. Thermal performance of a selection of insulation materials suitable for historic buildings. Build. Environ. 2015, 94, 155–165. [Google Scholar] [CrossRef]
- International Organization for Standardization. Building Components and Building Elements—Thermal Resistance and Thermal Transmittance—Calculation Method; ISO Standard 6946; International Organization for Standardization: Geneva, Switzerland, 2007. [Google Scholar]
- International Organization for Standardization. Building Materials and Products—Procedures for Determining Declared and Design Thermal Values; ISO Standard 10456; International Organization for Standardization: Geneva, Switzerland, 1999. [Google Scholar]
- Albatici, R.; Tonelli, A.M. Infrared thermovision technique for the assessment of thermal transmittance value of opaque building elements on site. Energy Build. 2010, 42, 2177–2183. [Google Scholar] [CrossRef]
- Lucci, L. Applications of the infrared thermography in the energy audit of buildings: A review. Renew. Sustain. Energy Rev. 2018, 82, 3077–3090. [Google Scholar] [CrossRef]
- Fokaides, P.A.; Kalogirou, S.A. Application of infrared thermography for the determination of the overall heat. Appl. Energy 2011, 88, 4358–4365. [Google Scholar] [CrossRef]
- Tejedor, B.; Casals, M.; Gangolells, M. Assessing the influence of operating conditions and thermophysical properties on the accuracy of in-situ measured U-values using quantitative internal infrared thermography. Energy Build. 2018, 171, 64–75. [Google Scholar] [CrossRef]
- International Organization for Standardization. Thermal Insulation—Building Elements—In-Situ Measurement of Thermal Resistance and Thermal Transmittance—Part 2: Infrared Method for Frame Structure Dwelling; ISO 9869-2; International Organization for Standardization: Geneva, Switzerland, 2017. [Google Scholar]
- Ballarini, I.; Corgnati, S.P.; Corrado, V. Use of reference buildings to assess the energy saving potentials of the residential building stock: The experience of TABULA project. Energy Policy 2014, 68, 273–284. [Google Scholar] [CrossRef]
- Albatici, R.; Tonelli, A.; Chiogna, M. A comprehensive experimental approach for the validation of quantitative infrared thermography in the evaluation of building. Appl. Energy 2015, 141, 218–228. [Google Scholar] [CrossRef]
- Lucchi, E. Thermal transmittance of historical brick masonries: A comparison among standard data, analytical calculation procedures, and in situ heat flow meter measurements. Energy Build. 2017, 134, 171–184. [Google Scholar] [CrossRef]
- Kim, S.; Kim, J.; Lee, J.; Jeong, H.; Song, K. Reliability field test on air-surface temperature ratio method for in situ measurement of U-value. Energies 2018, 11, 803. [Google Scholar] [CrossRef]
- Bienvenido-Huertas, D.; Rodriguez-Alvaro, R.; Jose Moyano, J.; Rico, F.; Marin, D. Determining the U-value of facades using the thermometric method: Potentials and limitations. Energies 2018, 11, 360. [Google Scholar] [CrossRef]
- Holman, J.P. Heat Transfer, 10th ed.; Department of Mechanical Engineering of the Southern Methodist University: Dallas, TX, USA, 2010. [Google Scholar]
- Peng, C.; Wu, Z. In situ measuring and evaluating the thermal resistance of building construction. Energy Build. 2008, 40, 2076–2082. [Google Scholar] [CrossRef]
- Wang, F.; Wang, D.; Wang, X.; Yao, J. A data analysis method for detecting wall thermal resistance considering wind velocity in situ. Energy Build. 2010, 42, 1647–1653. [Google Scholar] [CrossRef]
- Obyn, S.; Moeseke, G. Variability and impact of internal surfaces convective heat transfer coefficients in the thermal evaluation of office buildings. Appl. Therm. Eng. 2015, 87, 258–272. [Google Scholar] [CrossRef]
- Desogus, G.; Mura, S.; Ricciu, R. Comparing different approaches to in situ measurement of building components thermal resistance. Energy Build. 2011, 43, 2613–2620. [Google Scholar] [CrossRef]
- Korea Energy Agency. Building Energy Saving Plan; Korea Energy Agency: Seoul, Korea, 2018. [Google Scholar]
- Cholewa, T.; Rosinski, M.; Spik, Z.; Dudzinska, R.M.; Siuta-Olcha, A. On the heat transfer coefficients between heated/cooled radiant floor and room. Energy Build. 2013, 66, 599–606. [Google Scholar] [CrossRef]
- Kim, J.; Lee, J.; Jang, C.; Song, D.; Yoo, S.; Kim, J. Heating Energy Saving and Cost Benefit Analysis According to Low-Income Energy Efficiency Treatment Program—Case Study for Low-Income Detached Houses Energy Efficiency Treatment Program. KIEAE 2016, 10, 39–45. [Google Scholar] [CrossRef]
- Lee, J.; Kim, S.; Kim, J.; Song, D.; Jeong, H. Thermal performance evaluation of low-income buildings based on indoor temperature performance. Appl. Energy 2018, 221, 425–436. [Google Scholar] [CrossRef]
- Ryu, Y.; Park, M.; Kim, J.; Joo, H. A Study on Rural House Remodeling for Improvement of Energy Performance; Korean Rural Community Corporation: Naju-si, Korea, 2013. [Google Scholar]
- Cesaratto, P.; Carli, M.; Marinetti, S. Effect of different parameters on the in situ thermal conductance evaluation. Energy Build. 2011, 43, 1792–1801. [Google Scholar] [CrossRef]
- Ghazi, K.; Binder, B.; Vonbank, R. A simple method to determine the specific heat capacity of thermal insulations used in building construction. Energy Build. 2003, 35, 413–415. [Google Scholar] [CrossRef]
- Rassoli, A.; Itard, L.; Ferreira, C. A response factor-based method for the rapid in-situ determination of wall’s thermal resistance in existing buildings. Energy Build. 2016, 119, 51–61. [Google Scholar] [CrossRef]
- Feuermann, D. Measurement of envelope thermal transmittances in multifamily buildings. Energy Build. 1989, 13, 139–148. [Google Scholar] [CrossRef]
- Trethowen, H. Measurement errors with surface-mounted heat flux sensors. Energy Build. 1986, 21, 41–56. [Google Scholar] [CrossRef]
- International Organization for Standardization. Thermal Insulation—Qualitative Detection of Thermal Irregularities in Building Envelopes—Infrared Method; ISO Standard 6781; International Organization for Standardization: Geneva, Switzerland, 1983. [Google Scholar]
- Kim, S.; Kim, J.; Lee, J.; Jeong, H.; Song, K. The method of in-situ ASTR method diagnosing wall U-value in existing deteriorated houses. KIEAE 2017, 8, 41–48. [Google Scholar] [CrossRef]


| Direction | Indoor Heat Transfer Resistance [m2∙K/W] | Outdoor Heat Transfer Resistance [m2∙K/W] | |
|---|---|---|---|
| Indirect | Directly | ||
| Vertical | 0.11 | 0.11 | 0.043 |
| Horizontal (Ground floor) | 0.086 | 0.15 | 0.043 |
| Horizontal (Rooftop) | 0.086 | 0.086 | 0.043 |
| Direction | Indoor Heat Transfer Resistance [m2∙K/W] | Outdoor Heat Transfer Resistance [m2∙K/W] |
|---|---|---|
| Vertical | 0.13 | 0.04 |
| Horizontal (Upward) | 0.10 | 0.04 |
| Horizontal (Downward) | 0.17 | 0.04 |
| Classification | Case A | Case B | Case C | Case D |
|---|---|---|---|---|
| Location | Gimpo | Gimpo | Hapcheon | Hapcheon |
| Completion Date | 1994 | 1988 | 1982 | 1983 |
| Floor Area | 99.1 m2 | 36.1 m2 | 78.0 m2 | 70.0 m2 |
| Ceiling Height | 2.3 m | 2.3 m | 2.7 m | 2.3 m |
| Orientation | South | South | South | South |
| Classification | # | Component | d (mm) | λ [W/(m·K)] | R [m2·K/W] | |
|---|---|---|---|---|---|---|
| Initial Design U-value | Cases A and B | 1 | Indoor surface heat transfer resistance | 0.13 | ||
| 2 | Cement mortar | 20 | 1.4 | 0.0143 | ||
| 3 | Brick, cement | 90 | 0.6 | 0.015 | ||
| 4 | Expanded polystyrene No. 1. 4 | 50 | 0.043 | 1.1628 | ||
| 5 | Brick, red | 90 | 0.78 | 0.01154 | ||
| 6 | Outdoor surface heat transfer resistance | 0.04 | ||||
| U-value | 0.620 [W/(m2·K)] | |||||
| # | Component | d (mm) | λ [W/(m·K)] | R [m2·K/W] | ||
| Cases C and D | 1 | Indoor surface heat transfer resistance | 0.13 | |||
| 2 | Cement mortar | 20 | 1.4 | 0.0143 | ||
| 3 | Brick, cement | 90 | 0.6 | 0.015 | ||
| 4 | Air gap | 10 | 0.086 | |||
| 5 | Polyurethane (PUR) | 10 | 0.028 | 0.3571 | ||
| 6 | Brick, cement | 90 | 0.6 | 0.15 | ||
| 7 | Cement mortar | 20 | 1.4 | 0.0143 | ||
| 8 | Outdoor surface heat transfer resistance | 0.04 | ||||
| U-value | 1.062 [W/(m2·K)] | |||||
| Item | Classification | Accuracy | |||
|---|---|---|---|---|---|
| HFM method | Model | G. Inc Heat Flux Kit | Heat Flux (W/m2) <0.22 | Temperature (°C) ±0.5 | |
| Quantity | 16 EA | ||||
| ASTR method | Model | U-value metering system | − | Temperature (°C) ±0.5 | |
| Quantity | Hub | 4 EA | |||
| Sensor | 32 EA | ||||
| Wall surface temperature & gradient | Model | F. Inc IR camera | Temperature (°C) ±2., 2% | ||
| Quantity | 1 EA | ||||
| Air Temperature & humidity (Reference) | Model | T. Inc_TR-72wf | Humidity (%) ±5 RH | Temperature (°C) ±0.5 | |
| Quantity | 4 EA | ||||
| Classification | Item | W1 (East) | W1 (West) | W1 (South) | W1 (North) | R1 |
|---|---|---|---|---|---|---|
| UHFM [W/(m2∙K)] (a) | Case A | − | − | 1.333 | 1.328 | 1.088 |
| Case B | − | − | 1.810 | 1.701 | 1.385 | |
| Case C | 2.155 | 2.148 | 2.121 | 2.266 | 1.578 | |
| Case D | 1.555 | 1.508 | 1.511 | 1.519 | 1.055 | |
| UASTR_1 [W/(m2∙K)] (b) ht, i, wall *: 7.69 W/(m2∙K) ht, i, roof **: 10.00 W/(m2∙K) | Case A | − | − | 1.238 | 1.214 | 1.012 |
| Case B | − | − | 1.673 | 1.599 | 1.283 | |
| Case C | 1.985 | 1.979 | 1.913 | 2.091 | 1.458 | |
| Case D | 1.438 | 1.398 | 1.411 | 1.403 | 0.988 | |
| UASTR_2 [W/(m2∙K)] (c) ht, i, wall: 9.09 W/(m2∙K) ht, i, roof: 11.63 W/(m2∙K) | Case A | − | − | 1.449 | 1.421 | 1.177 |
| Case B | − | − | 1.958 | 1.871 | 1.492 | |
| Case C | 2.323 | 2.316 | 2.239 | 2.447 | 1.696 | |
| Case D | 1.683 | 1.636 | 1.651 | 1.642 | 1.149 |
| Classification | Item | W1 (East) | W1 (West) | W1 (South) | W1 (North) | R1 |
|---|---|---|---|---|---|---|
| UHFM~UASTR Relative Error factor (%) | Case A | − | − | 7.13 * | 8.58 * | 6.99 * |
| − | − | 8.69 ** | 6.99 ** | 8.18 ** | ||
| Case B | − | − | 7.57 | 6.00 | 7.36 | |
| − | − | 8.18 | 10.02 | 7.73 | ||
| Case C | 5.97 | 6.74 | 4.87 | 4.43 | 4.20 | |
| 10.05 | 9.15 | 11.33 | 11.85 | 11.41 | ||
| Case D | 6.20 | 6.74 | 5.87 | 5.71 | 6.35 | |
| 9.78 | 9.15 | 10.16 | 10.35 | 8.91 |
| UASTR [W/(m2∙K)] | ||||||
|---|---|---|---|---|---|---|
| Classification | Item | W1 (East) | W1 (West) | W1 (South) | W1 (North) | R1 |
| Case A | UHFM | − | − | 1.333 | 1.328 | 1.088 |
| 1 | − | − | 1.277 | 1.271 | 1.041 | |
| 2 | − | − | 1.111 | 1.038 | 0.888 | |
| 3 | − | − | 1.499 | 1.508 | 1.235 | |
| 4 | − | − | 1.278 | 1.277 | 1.042 | |
| 5 | − | − | 1.133 | 1.066 | 0.901 | |
| 6 | − | − | 1.255 | 1.258 | 1.038 | |
| Case B | UHFM | − | − | 1.81 | 1.701 | 1.385 |
| 1 | − | − | 1.733 | 1.633 | 1.338 | |
| 2 | − | − | 1.551 | 1.488 | 1.159 | |
| 3 | − | − | 1.601 | 1.522 | 1.225 | |
| 4 | − | − | 1.699 | 1.59 | 1.288 | |
| 5 | − | − | 1.725 | 1.618 | 1.322 | |
| 6 | − | − | 1.711 | 1.607 | 1.277 | |
| Case C | UHFM | 2.155 | 2.148 | 2.121 | 2.266 | 1.578 |
| 1 | 1.855 | 1.832 | 1.822 | 1.922 | 1.332 | |
| 2 | 2.366 | 2.328 | 2.325 | 2.478 | 1.732 | |
| 3 | 1.975 | 1.948 | 1.909 | 2.082 | 1.444 | |
| 4 | 1.983 | 1.955 | 1.911 | 2.088 | 1.455 | |
| 5 | 2.058 | 2.048 | 2.018 | 2.153 | 1.511 | |
| 6 | 1.933 | 1.922 | 1.905 | 2.023 | 1.405 | |
| Case D | UHFM | 1.555 | 1.508 | 1.511 | 1.519 | 1.055 |
| 1 | 1.479 | 1.445 | 1.435 | 1.455 | 1.002 | |
| 2 | 1.388 | 1.343 | 1.355 | 1.345 | 0.956 | |
| 3 | 1.492 | 1.433 | 1.458 | 1.458 | 1.008 | |
| 4 | 1.442 | 1.407 | 1.408 | 1.399 | 0.988 | |
| 5 | 1.441 | 1.401 | 1.399 | 1.401 | 0.989 | |
| 6 | 1.475 | 1.443 | 1.438 | 1.444 | 1.001 | |
| Relative Error Rate (%) | ||||||
|---|---|---|---|---|---|---|
| Classification | W1 (East) | W1 (West) | W1 (South) | W1 (North) | R1 | |
| Case A | 1 | − | − | 4.20 | 4.29 | 4.32 |
| 2 | − | − | 16.65 | 21.84 | 18.38 | |
| 3 | − | − | 12.45 | 13.55 | 13.51 | |
| 4 | − | − | 4.13 | 3.84 | 4.23 | |
| 5 | − | − | 15.00 | 19.73 | 17.19 | |
| 6 | − | − | 5.85 | 5.27 | 4.60 | |
| Case B | 1 | − | − | 4.25 | 4.00 | 3.39 |
| 2 | − | − | 14.31 | 12.52 | 16.32 | |
| 3 | − | − | 11.55 | 10.52 | 11.55 | |
| 4 | − | − | 6.13 | 6.53 | 7.00 | |
| 5 | − | − | 4.70 | 4.88 | 4.55 | |
| 6 | − | − | 5.47 | 5.53 | 7.80 | |
| Case C | 1 | 13.92 | 14.71 | 14.10 | 15.18 | 15.59 |
| 2 | 9.79 | 8.38 | 9.62 | 9.36 | 9.76 | |
| 3 | 8.35 | 9.31 | 10.00 | 8.12 | 8.49 | |
| 4 | 7.98 | 8.99 | 9.90 | 7.86 | 7.79 | |
| 5 | 4.50 | 4.66 | 4.86 | 4.99 | 4.25 | |
| 6 | 10.30 | 10.52 | 10.18 | 10.72 | 10.96 | |
| Case D | 1 | 4.89 | 4.18 | 5.03 | 4.21 | 5.02 |
| 2 | 10.74 | 10.94 | 10.32 | 11.45 | 9.38 | |
| 3 | 4.05 | 4.97 | 3.51 | 4.02 | 4.45 | |
| 4 | 7.27 | 6.70 | 6.82 | 7.90 | 6.35 | |
| 5 | 7.33 | 7.10 | 7.41 | 7.77 | 6.26 | |
| 6 | 5.14 | 4.31 | 4.83 | 4.94 | 5.12 | |
© 2018 by the authors. Licensee MDPI, Basel, Switzerland. This article is an open access article distributed under the terms and conditions of the Creative Commons Attribution (CC BY) license (http://creativecommons.org/licenses/by/4.0/).
Share and Cite
Kim, S.-H.; Lee, J.-H.; Kim, J.-H.; Yoo, S.-H.; Jeong, H.-G. The Feasibility of Improving the Accuracy of In Situ Measurements in the Air-Surface Temperature Ratio Method. Energies 2018, 11, 1885. https://doi.org/10.3390/en11071885
Kim S-H, Lee J-H, Kim J-H, Yoo S-H, Jeong H-G. The Feasibility of Improving the Accuracy of In Situ Measurements in the Air-Surface Temperature Ratio Method. Energies. 2018; 11(7):1885. https://doi.org/10.3390/en11071885
Chicago/Turabian StyleKim, Seo-Hoon, Jung-Hun Lee, Jong-Hun Kim, Seung-Hwan Yoo, and Hak-Geun Jeong. 2018. "The Feasibility of Improving the Accuracy of In Situ Measurements in the Air-Surface Temperature Ratio Method" Energies 11, no. 7: 1885. https://doi.org/10.3390/en11071885
APA StyleKim, S.-H., Lee, J.-H., Kim, J.-H., Yoo, S.-H., & Jeong, H.-G. (2018). The Feasibility of Improving the Accuracy of In Situ Measurements in the Air-Surface Temperature Ratio Method. Energies, 11(7), 1885. https://doi.org/10.3390/en11071885