Article

Deducing the Optimal Control Method for Electrochromic Triple Glazing through an Integrated Evaluation of Building Energy and Daylight Performance

1
Center for Building Envelope Technology, Korea Conformity Laboratory, 595-10, Pyengsin 1-ro, Daesan-eup, Seosan-si 31900, Chungcheongnam-do, Korea
2
Center for Building Envelope Technology, Korea Conformity Laboratory, 73, Yangcheon 3 gil, Ochang-eup, Cheongwon-gu, Cheongju-si 28115, Chungcheongbuk-do, Korea
3
Sustainable Building Research Center, Hanyang University, 55 Hanyangdaehak-ro, Sangnok-gu, Ansan 15588, Korea
*
Authors to whom correspondence should be addressed.
Energies 2018, 11(9), 2205; https://doi.org/10.3390/en11092205
Submission received: 16 July 2018 / Revised: 20 August 2018 / Accepted: 20 August 2018 / Published: 23 August 2018
(This article belongs to the Special Issue Building Energy Use: Modeling and Analysis)

Abstract

:
Electrochromic glass is anticipated as the next generation of solar control glass for construction because it can control the transmittance of the glass itself. This study analyzed building energy and light environment performance by applying electrochromic glass in triple glazing in order to verify both the solar control characteristics of electrochromic glass and its high insulation performance. This paper evaluates the performance of the electrochromic glass developed by our research team in Korea in five control conditions of varying temperatures and solar radiation levels. By analyzing the cooling and heating load, lighting energy, Daylight Glare Index (DGI), and interior illuminance when applying the selected conditions to office buildings, this paper discerns the optimal control conditions for electrochromic glass. To do so, the optical characteristic data of the electrochromic glass was analyzed via an experiment, and the creation of triple glazing for construction was conducted. The performance of electrochromic glass was evaluated by analyzing hourly and yearly data for cooling, heating load, and lighting energy during a typical day in summer and winter. From this analysis, the control condition with an outstanding performance from an energy perspective was identified. The performance of the light environment was assessed, and the EDPI overall evaluation index was used to find the electrochromic glass’ optimum control conditions for integrating energy and light environment.

1. Introduction

In the midst of global efforts to reduce building energy, numerous studies are being undertaken on the development of such measures in Korea, and energy-related regulations in the country are also being tightened. The building façade has been identified as directly related to the cooling and heating of energy, and the criteria for insulation and sealing have been strengthened every year. Consequently, there is a growing interest in regulating the solar control of the building façade.
Since Korea has a goal of making zero-energy building a necessity by 2025, the insulation criteria of building façades have been raised to the level of the passive house and high-performance products for building façades have been launched in order to create a market. However, improving solar control regulation and developing the next-generation of solar control devices are urgently needed to create zero-energy buildings—particularly offices with large window area ratios. This is especially the case in countries like Korea, where the summer and winter climatic conditions are distinct and solar radiation has a significant influence on the energy consumption of the office buildings with large window area ratios. As such, solar control regulation and the development of the next-generation products are vital. Window blinds or roller shades are primarily used as solar control devices in Korean office buildings, and are manually controlled by the people in the room. Evidently, no logical operation is in place, indicating the need for an automatic solar control device that integrates the building energy and environment according to the external atmosphere in its performance consideration [1].
Several studies on smart glass that works as an auto-controllable solar control device have recently been undertaken. This smart glass has the advantage of being able to control the transmittance of the glass itself without needing a separate shading device, as well as that of easy control via an electric signal. Moreover, unlike blinds or roller shades—which are usually installed indoors—smart glass can be installed as the external layer of dual or triple glass. This is an effective means of blocking solar radiation, and thus has a high solar radiation block ratio. A further advantage is that it is relatively low maintenance, as smart glass does not often need replacing due to contamination or damage.
Representative smart glasses include: electrochromic (EC), polymer dispersed liquid crystal (PDLC), and suspended particle device (SPD). PDLC has a faster discoloration speed than EC and the transmittance can be adjusted depending on the amount of voltage applied. However, because the adjustment range of solar transmittance in the colored and decolorized states is smaller than it is in EC or SPD, it is predominantly used for interior design [2,3]. Moreover, PDLC requires the continuous application of power to maintain a colored state and has a limited ability to block the near infrared (NIR) region. Like PDLC, the discoloration speed of SPD is higher than EC and it has a large adjustment range for visible light transmittance, which means that it can be used as solar control glass. However, like PDLC, SPD also has limitations in blocking the NIR region and must continuously apply electric power to maintain a colored state. EC can also be used as solar control glass. While EC has a lower discoloration speed than both PDLC and SPD, it does not require the application of power to maintain a colored state, can control both the NIR region and visible rays, and has the biggest adjustment range of solar transmittance in colored and decolorized states [4]. Moreover, recently released EC products have a fast response speed, allowing them to change color in three minutes. This increased response speed of EC is achieved by positioning the electrodes in a dense grid form over the entire glass area and making them invisible [5].
As such, electrochromic glass has the potential to become the next-generation of solar control glass for construction based on its characteristics, including its ability to control the transmittance of the glass itself, its broad variation in transmittance, and its operability with a small amount of power consumption [6,7].
With regard to extant research on electrochromic glass, there are on-going studies on the discomfort glare index (DGI) and lighting energy in the indoor light environment created by controlling electrochromic glass, which has been found to reduce lighting energy by 37–48% [8]. According to the simulation result of office buildings in America, the application and control of electrochromic glass resulted in a 10–20% energy saving effect on the perimeter [9]. Another study has shown that more than 54% of energy can be saved in a Mediterranean climate [10]. There are also current studies providing performance evaluations of the glass in the construction environment; these have analyzed thermal and visual comfort [11], and used the optical property of the glass to evaluate the building energy during simulation [12]. Another branch of research involves examining the role of heating and selectively controlling only the invisible near-infrared zone with electrochromic glass [13]. In addition to these, there are several studies that have evaluated the performance of electrochromic glass through simulations and experiments [14,15,16].
Nonetheless, despite various studies on the performance and solar control methods of electrochromic glass being conducted, research on the solar control method of electrochromic glass in the climate conditions of Korea remains insufficient. In addressing this gap, this paper conducted a study to identify the most effective solar control method in Korean climate conditions, integrating considerations of the cooling, heating, lighting energy, and light environment performance using the electrochromic glass developed by our research team in Korea.

2. Methods and Materials

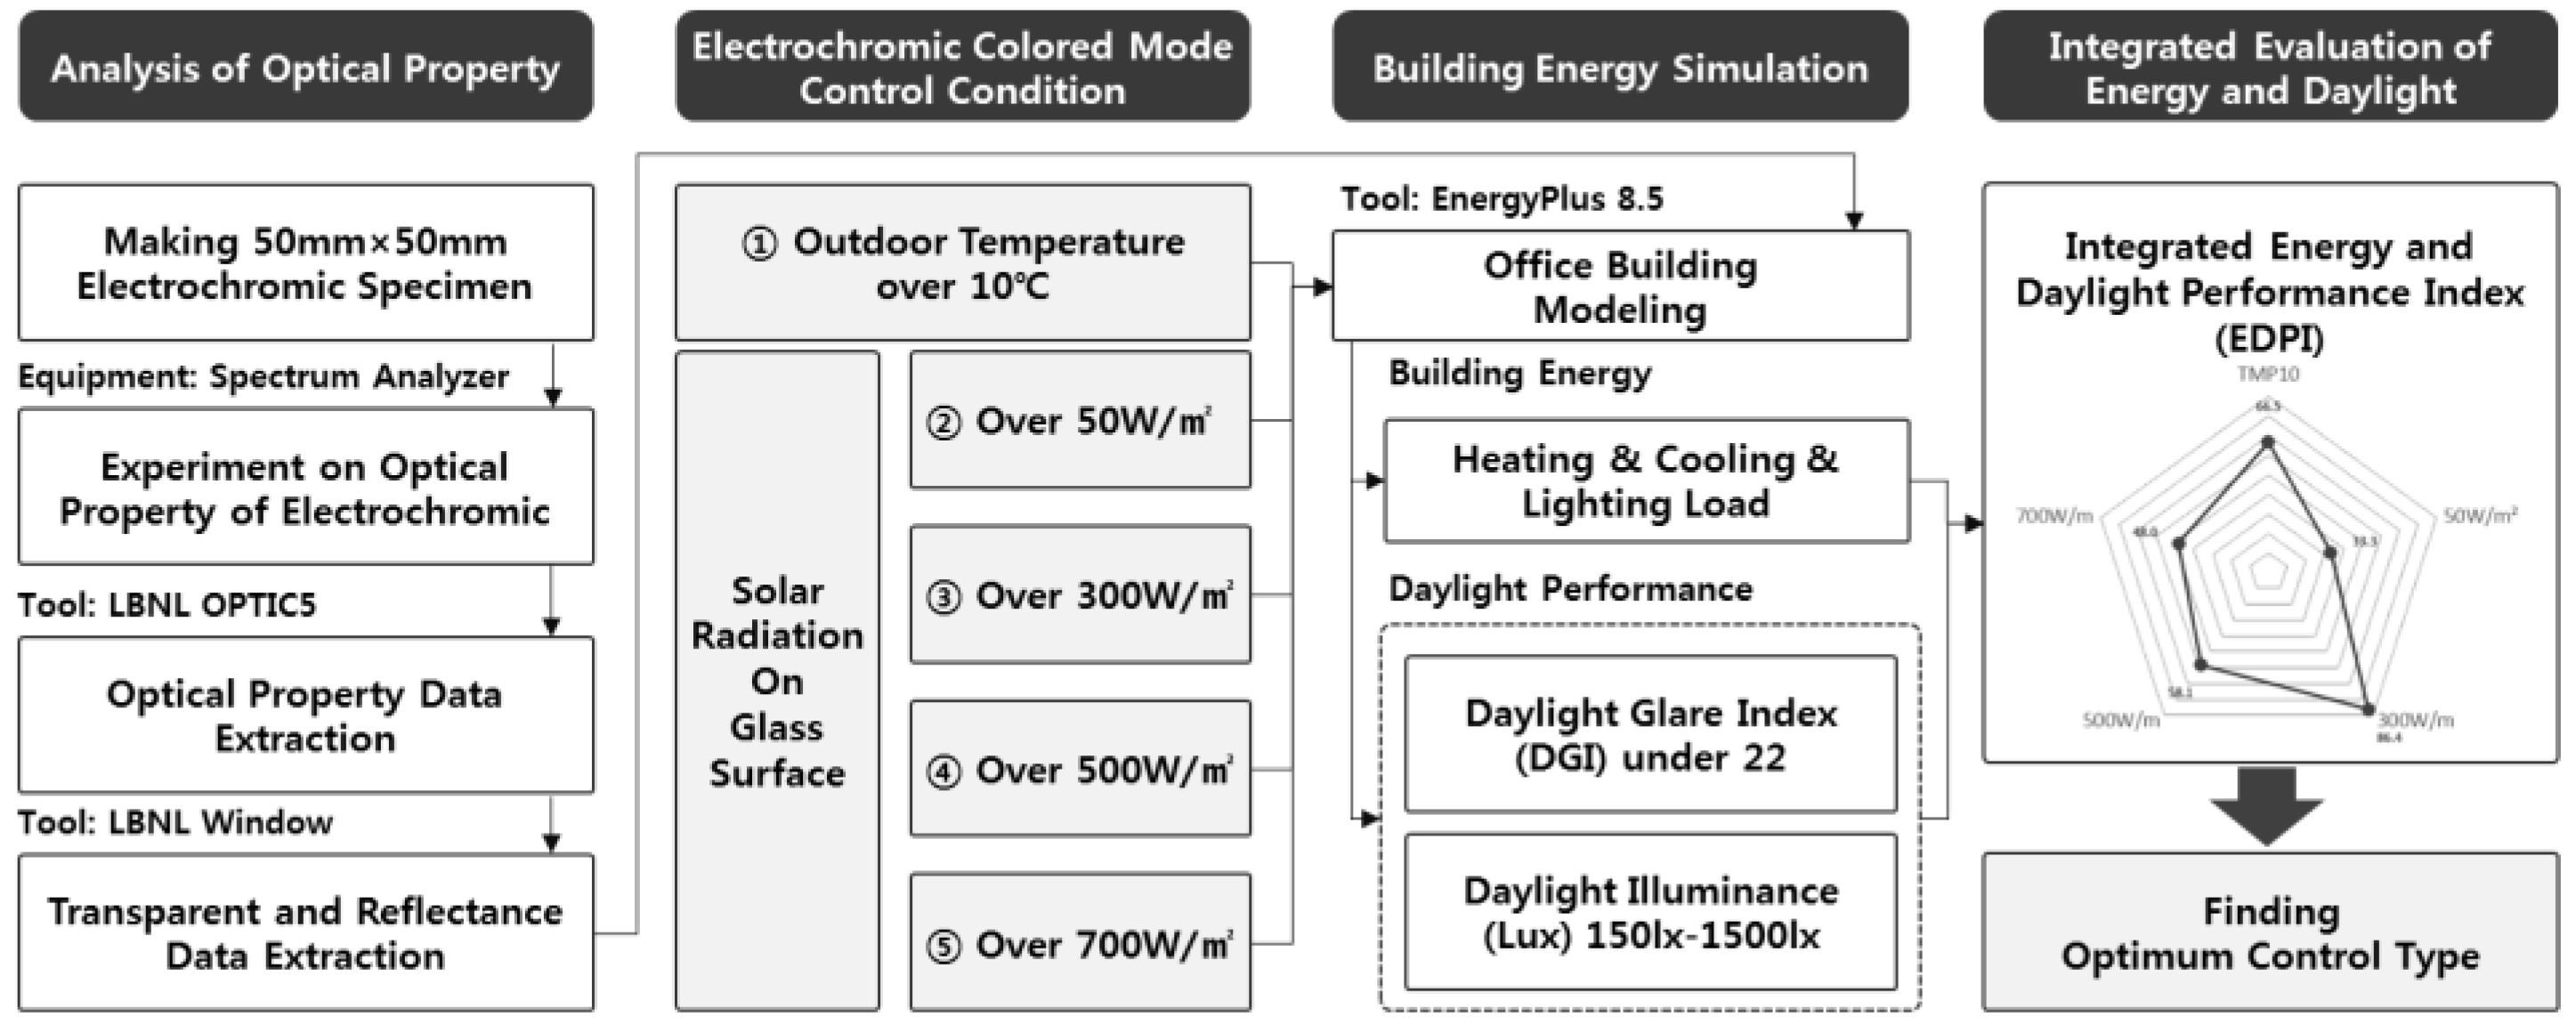
2.1. Research Method and Scope

This study began by making a sample (50 mm × 50 mm) of electrochromic glass to secure the transmittance data of the electrochromic glass (developed by our research team) during the decolorization and colorization states. A spectrometer was then used to analyze the optical characteristics. The solar transmittance, solar reflectance, visible light transmittance, and visible light reflectance of EC laminated glass were determined using the Optic of LBNL and Window program based on optical data obtained from the spectrometer. After using this transmittance and reflectance data to form triple glazing, we entered the data into the building energy interpretation program and simulation tool, EnergyPlus, and analyzed the building energy and light environment performance of the office building for each condition of electrochromic glass transmittance control.
Five conditions controlling the transmittance range of the electrochromic glass were constructed, as follows: (1) A temperature control method setting an external temperature of 10 °C at the center, colorized above and decolorized below; and (2) a solar radiation control method that colorizes once the solar radiation reaching the surface goes beyond 50 W/m2, (3) 300 W/m2, (4) 500 W/m2, or (5) 700 W/m2.
The representative days of summer and winter, monthly cooling, heating, and lighting energy of the office analysis model were identified according to each controlling condition, and the total energy consumption difference, energy consumption trend, and the causes for the total energy consumption were analyzed. The DGI was analyzed for each control condition, as were the ratios of total yearly hours satisfying less than DGI 22 in the office and the ratios of total yearly hours falling within the range of 150 lx–1500 lx, which is the proper illuminance of an office building. As such, the data on discomfort glare and interior illumination were examined to evaluate the performance of the light environment [17].
Finally, the resulting values of the energy consumption rate, DGI, and indoor illumination in different units were changed to a single index in percentile for an integrated evaluation of the energy consumption rate and light environment performance in order to discern the optimal control plan for electrochromic glass. Figure 1 demonstrates the methods and ranges of this study via a flowchart.

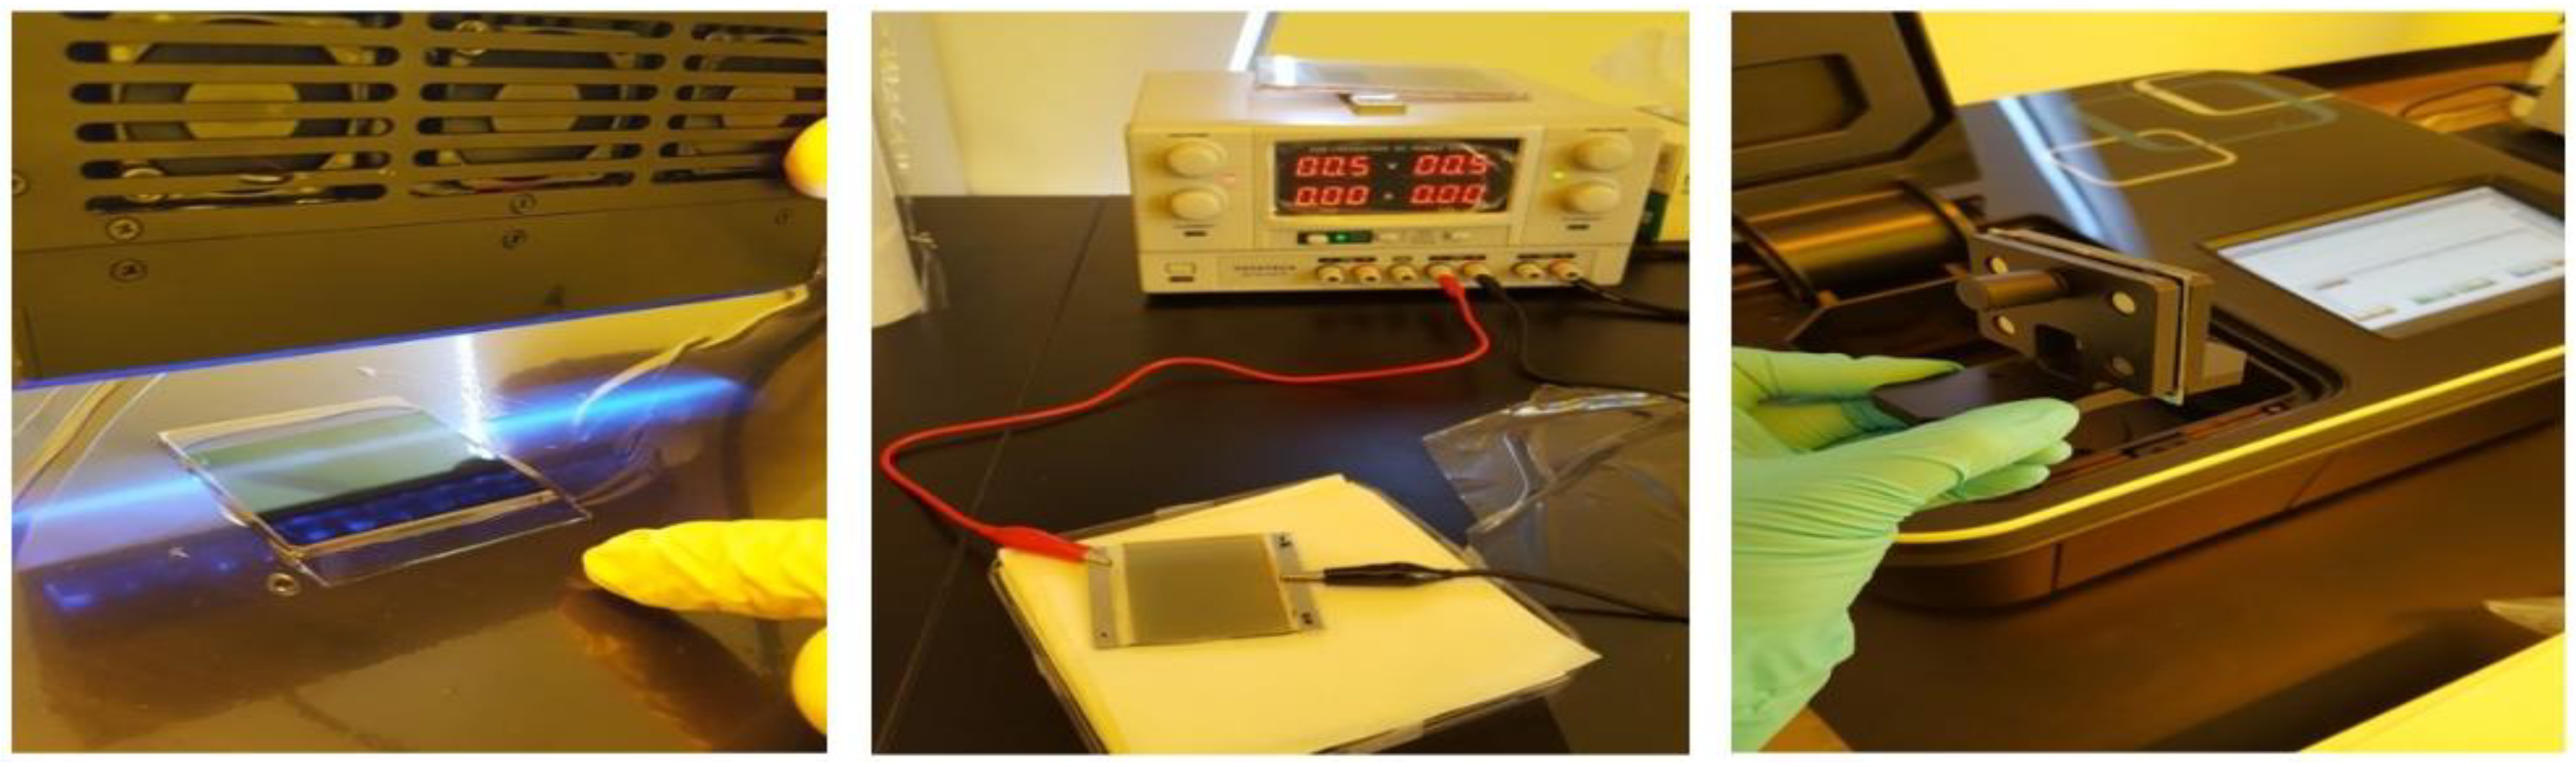
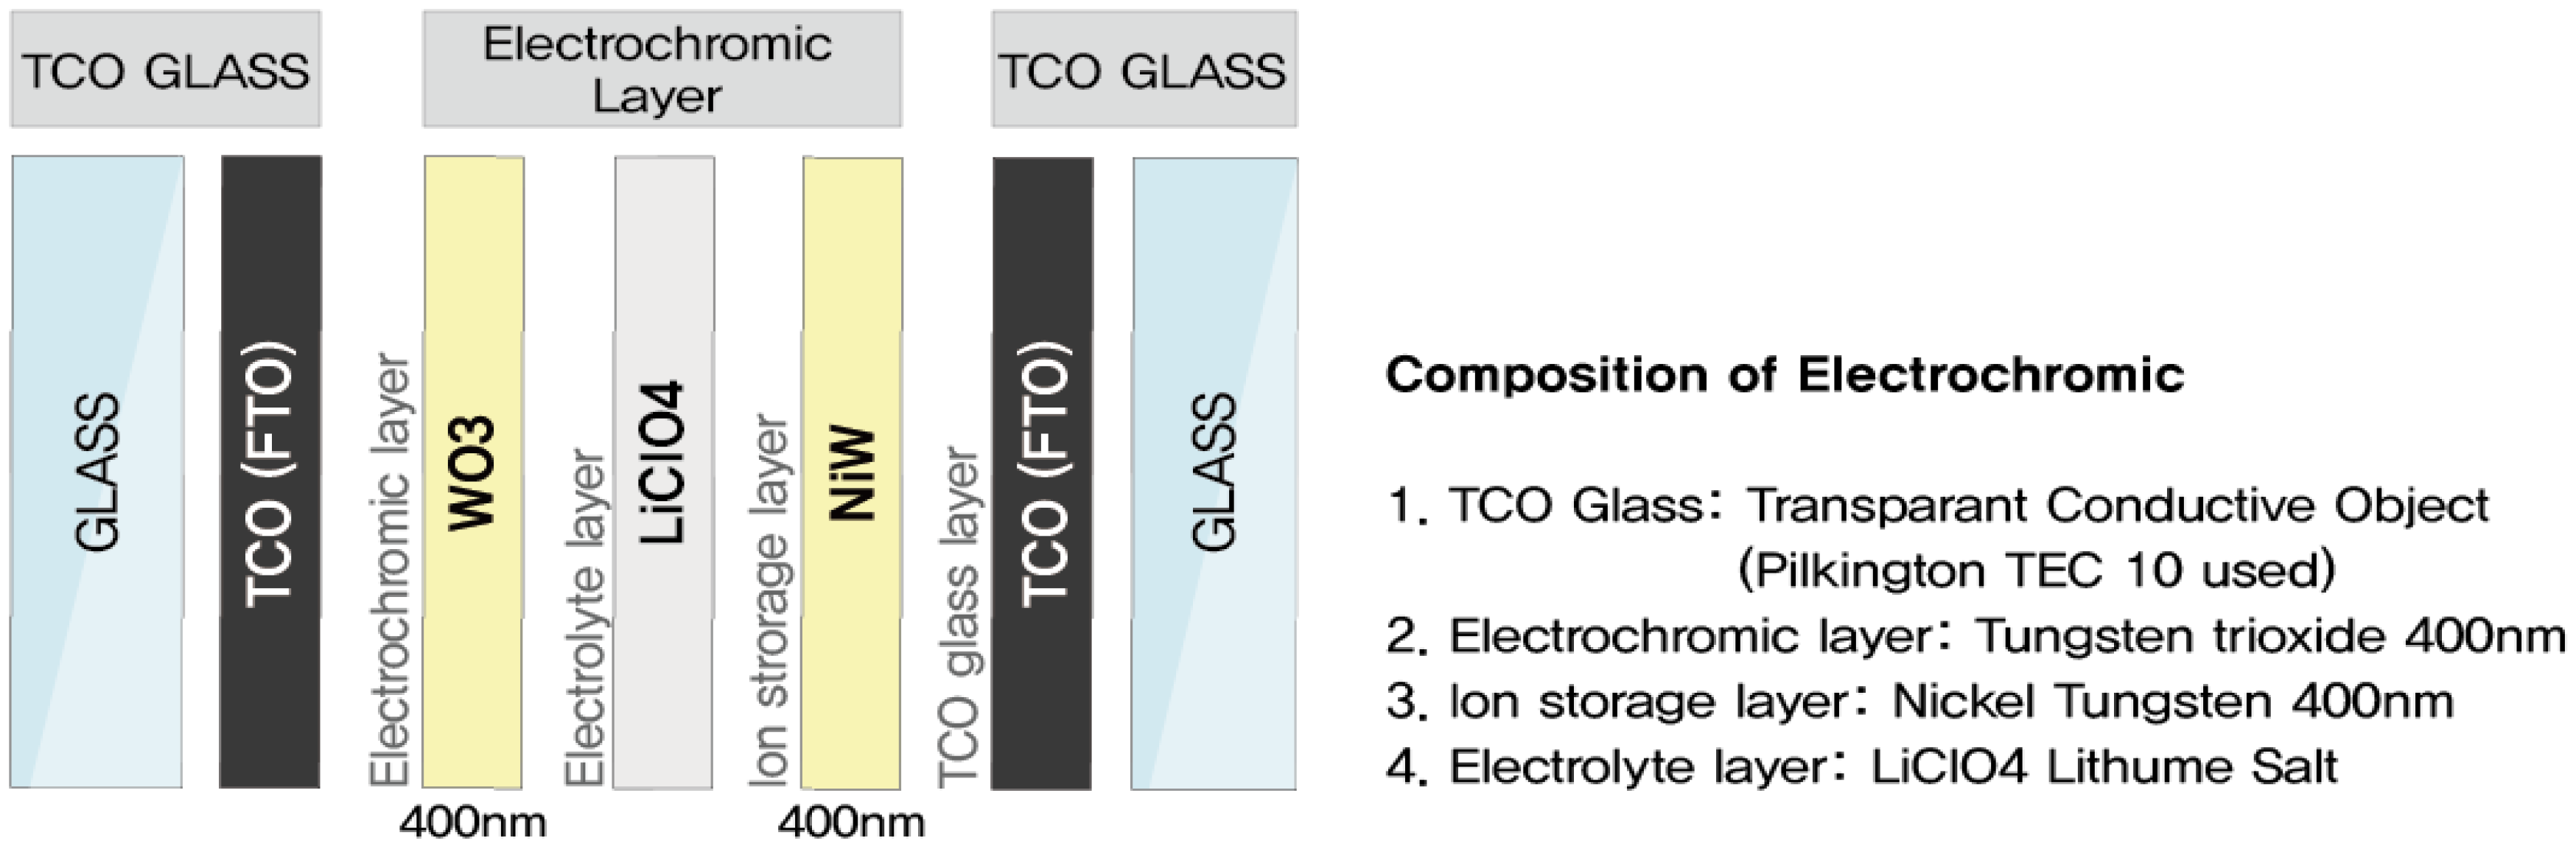
2.2. Analysis of the Optical Properties of Electrochromic Glazing

Our research team has developed large area electrochromic glass with a size of 1500 mm × 1800 mm for the first time in Korea. This electrochromic glass is composed of a transparent conductive object, electrochromic layer, ion storage layer, and electrolyte layer, as shown in Figure 2. In this study, a sample of 50 mm × 50 mm was constructed for the analysis of its optical properties, and its composition was made to match that of the real product. In order for electronic glass to be used as an architectural glass in the construction market, large-scale electrochromic glass of at least 1500 mm × 1500 mm is required. Since the requirements of both durability and solar control performance must be met for enlargement and commercialization, research is constantly being conducted. This study used a small sample of 50 mm × 50 mm to measure the optical characteristics with a spectrometer. A 3V voltage was applied at the time of discoloration.
TEC 10 of Pilkington was used for the transparent conductive object, and WO3 (Tungsten trioxide) was used for the electrochromic layer. For the ion storage layer, NiW (Nickel Tungsten) Target was used, and both the electrochromic layer and ion storage layer were coated via the 400 nm sputtering method. For the electrolyte layer, gel-type of LiClO4 was used; the electrodes were composed of silver paste at both edges and the bus-bar was made of copper. In addition, the glass edges were sealed with UV hardening material, as shown in the first picture of Figure 3, to prevent the gel-type electrolyte from oozing out and the electrochromic material from reacting to air.
After making the 50 mm × 50 mm sample, a spectrum analyzer (Optizen pop spectrometer) was used to measure the transmittance and reflectance of a spectral wavelength range of 0.3–2.5 μm (0.005 μm intervals) while maintaining the colored and decolored state by permitting a 2 V and −2 V voltage, as shown in Figure 3. The raw transmittance and reflectance data extracted by the spectrum analyzer were imported into the LBNL’s Optic 5.1 program, and the average spectral data of solar transmittance, solar reflectance, visible transmittance, and visible reflectance were deduced (Table 1, Figure 4) [18]. As shown in Table 1, the solar transmittance (Tsol) of the electrochromic glass sample could be controlled in the range of 41.6–48.1% when decoloring and up to 6.5% when coloring. In the case of visible transmittance, the controllable range was found to be 52.8–64.8% when decoloring and up to 12% when coloring.

3. Simulation Conditions

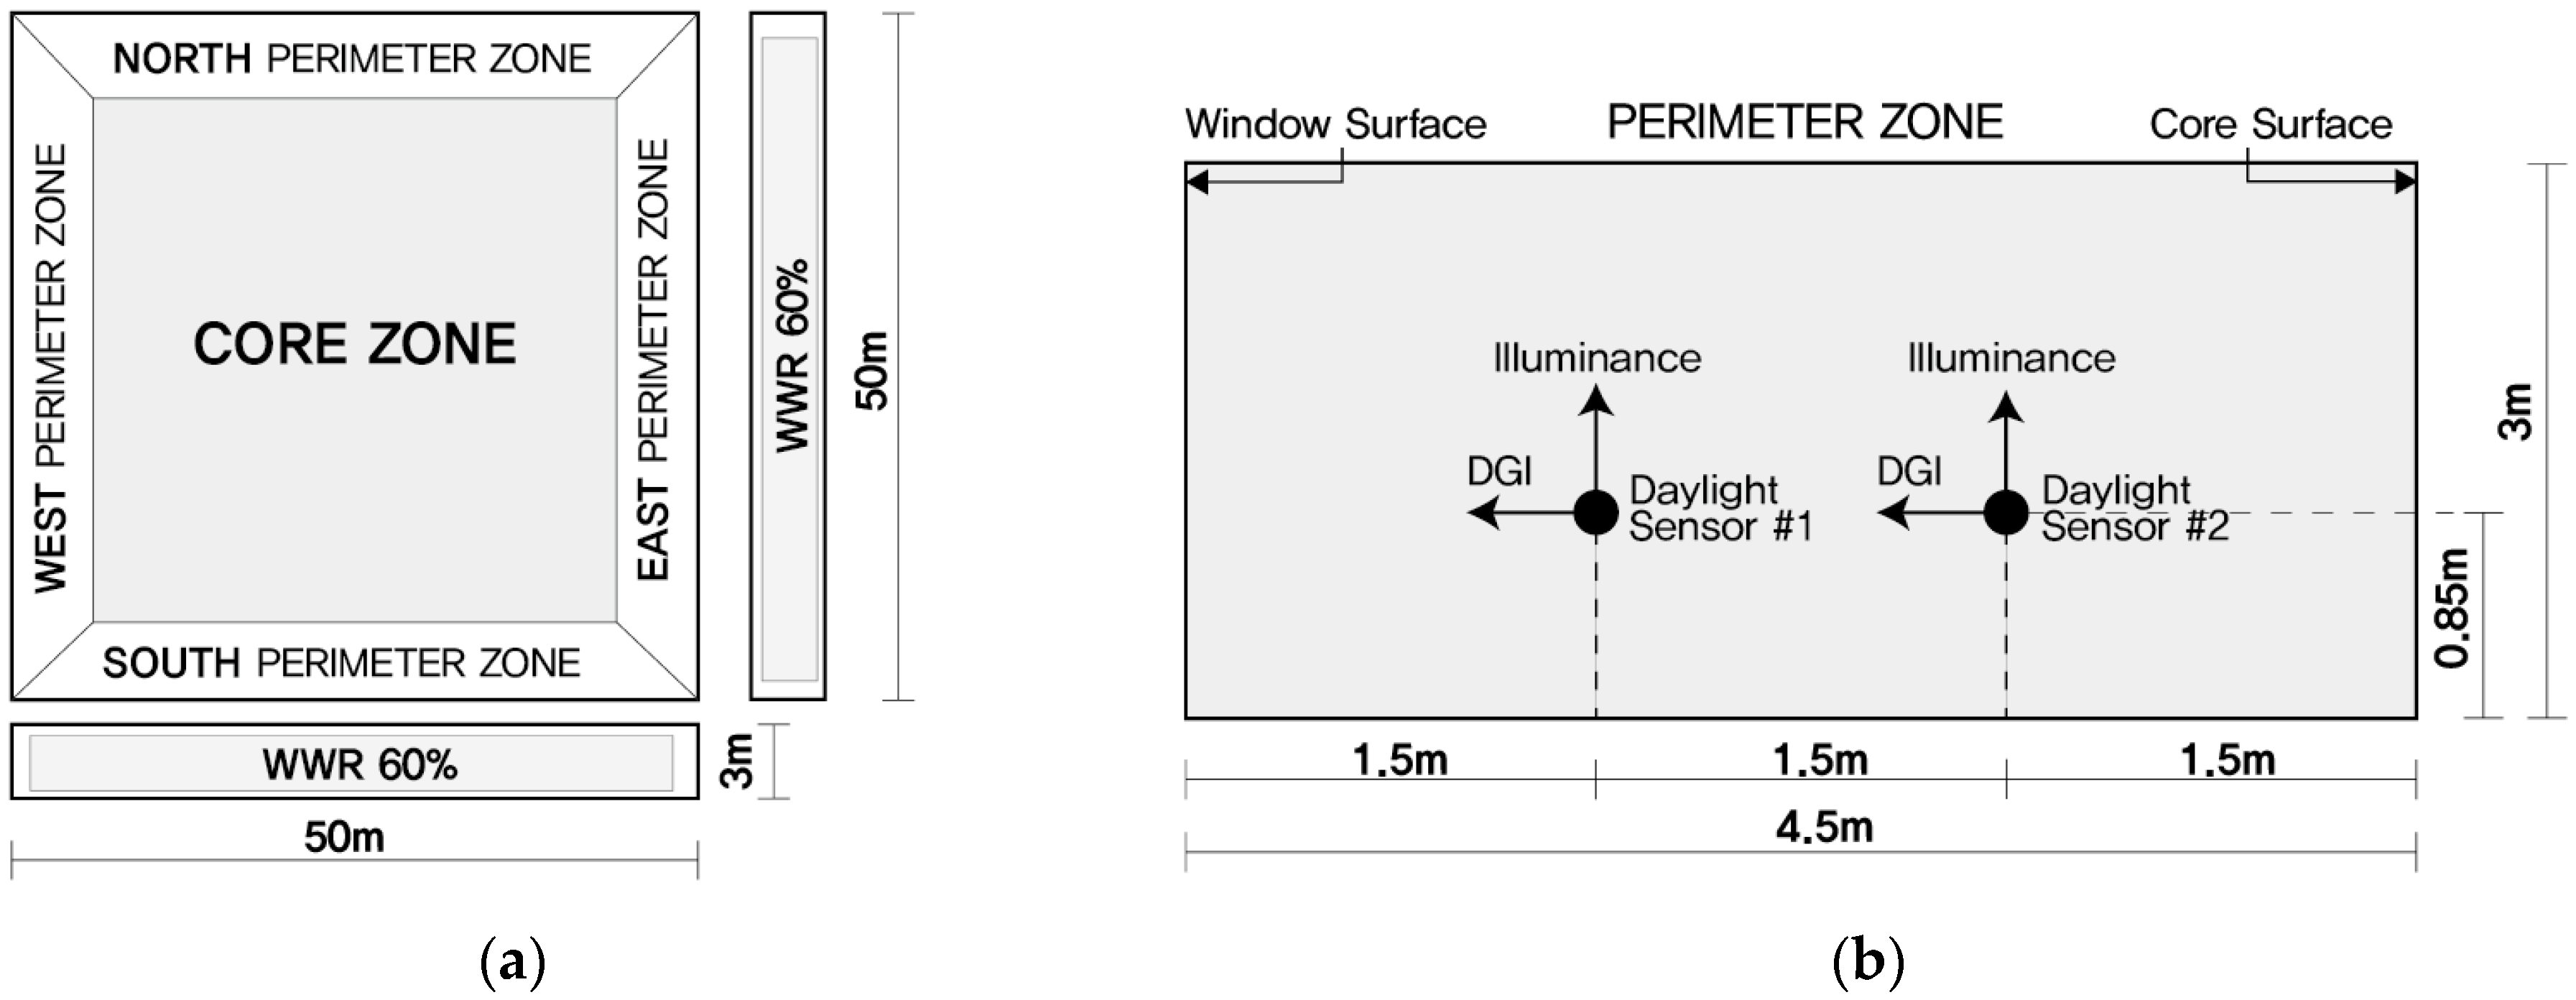
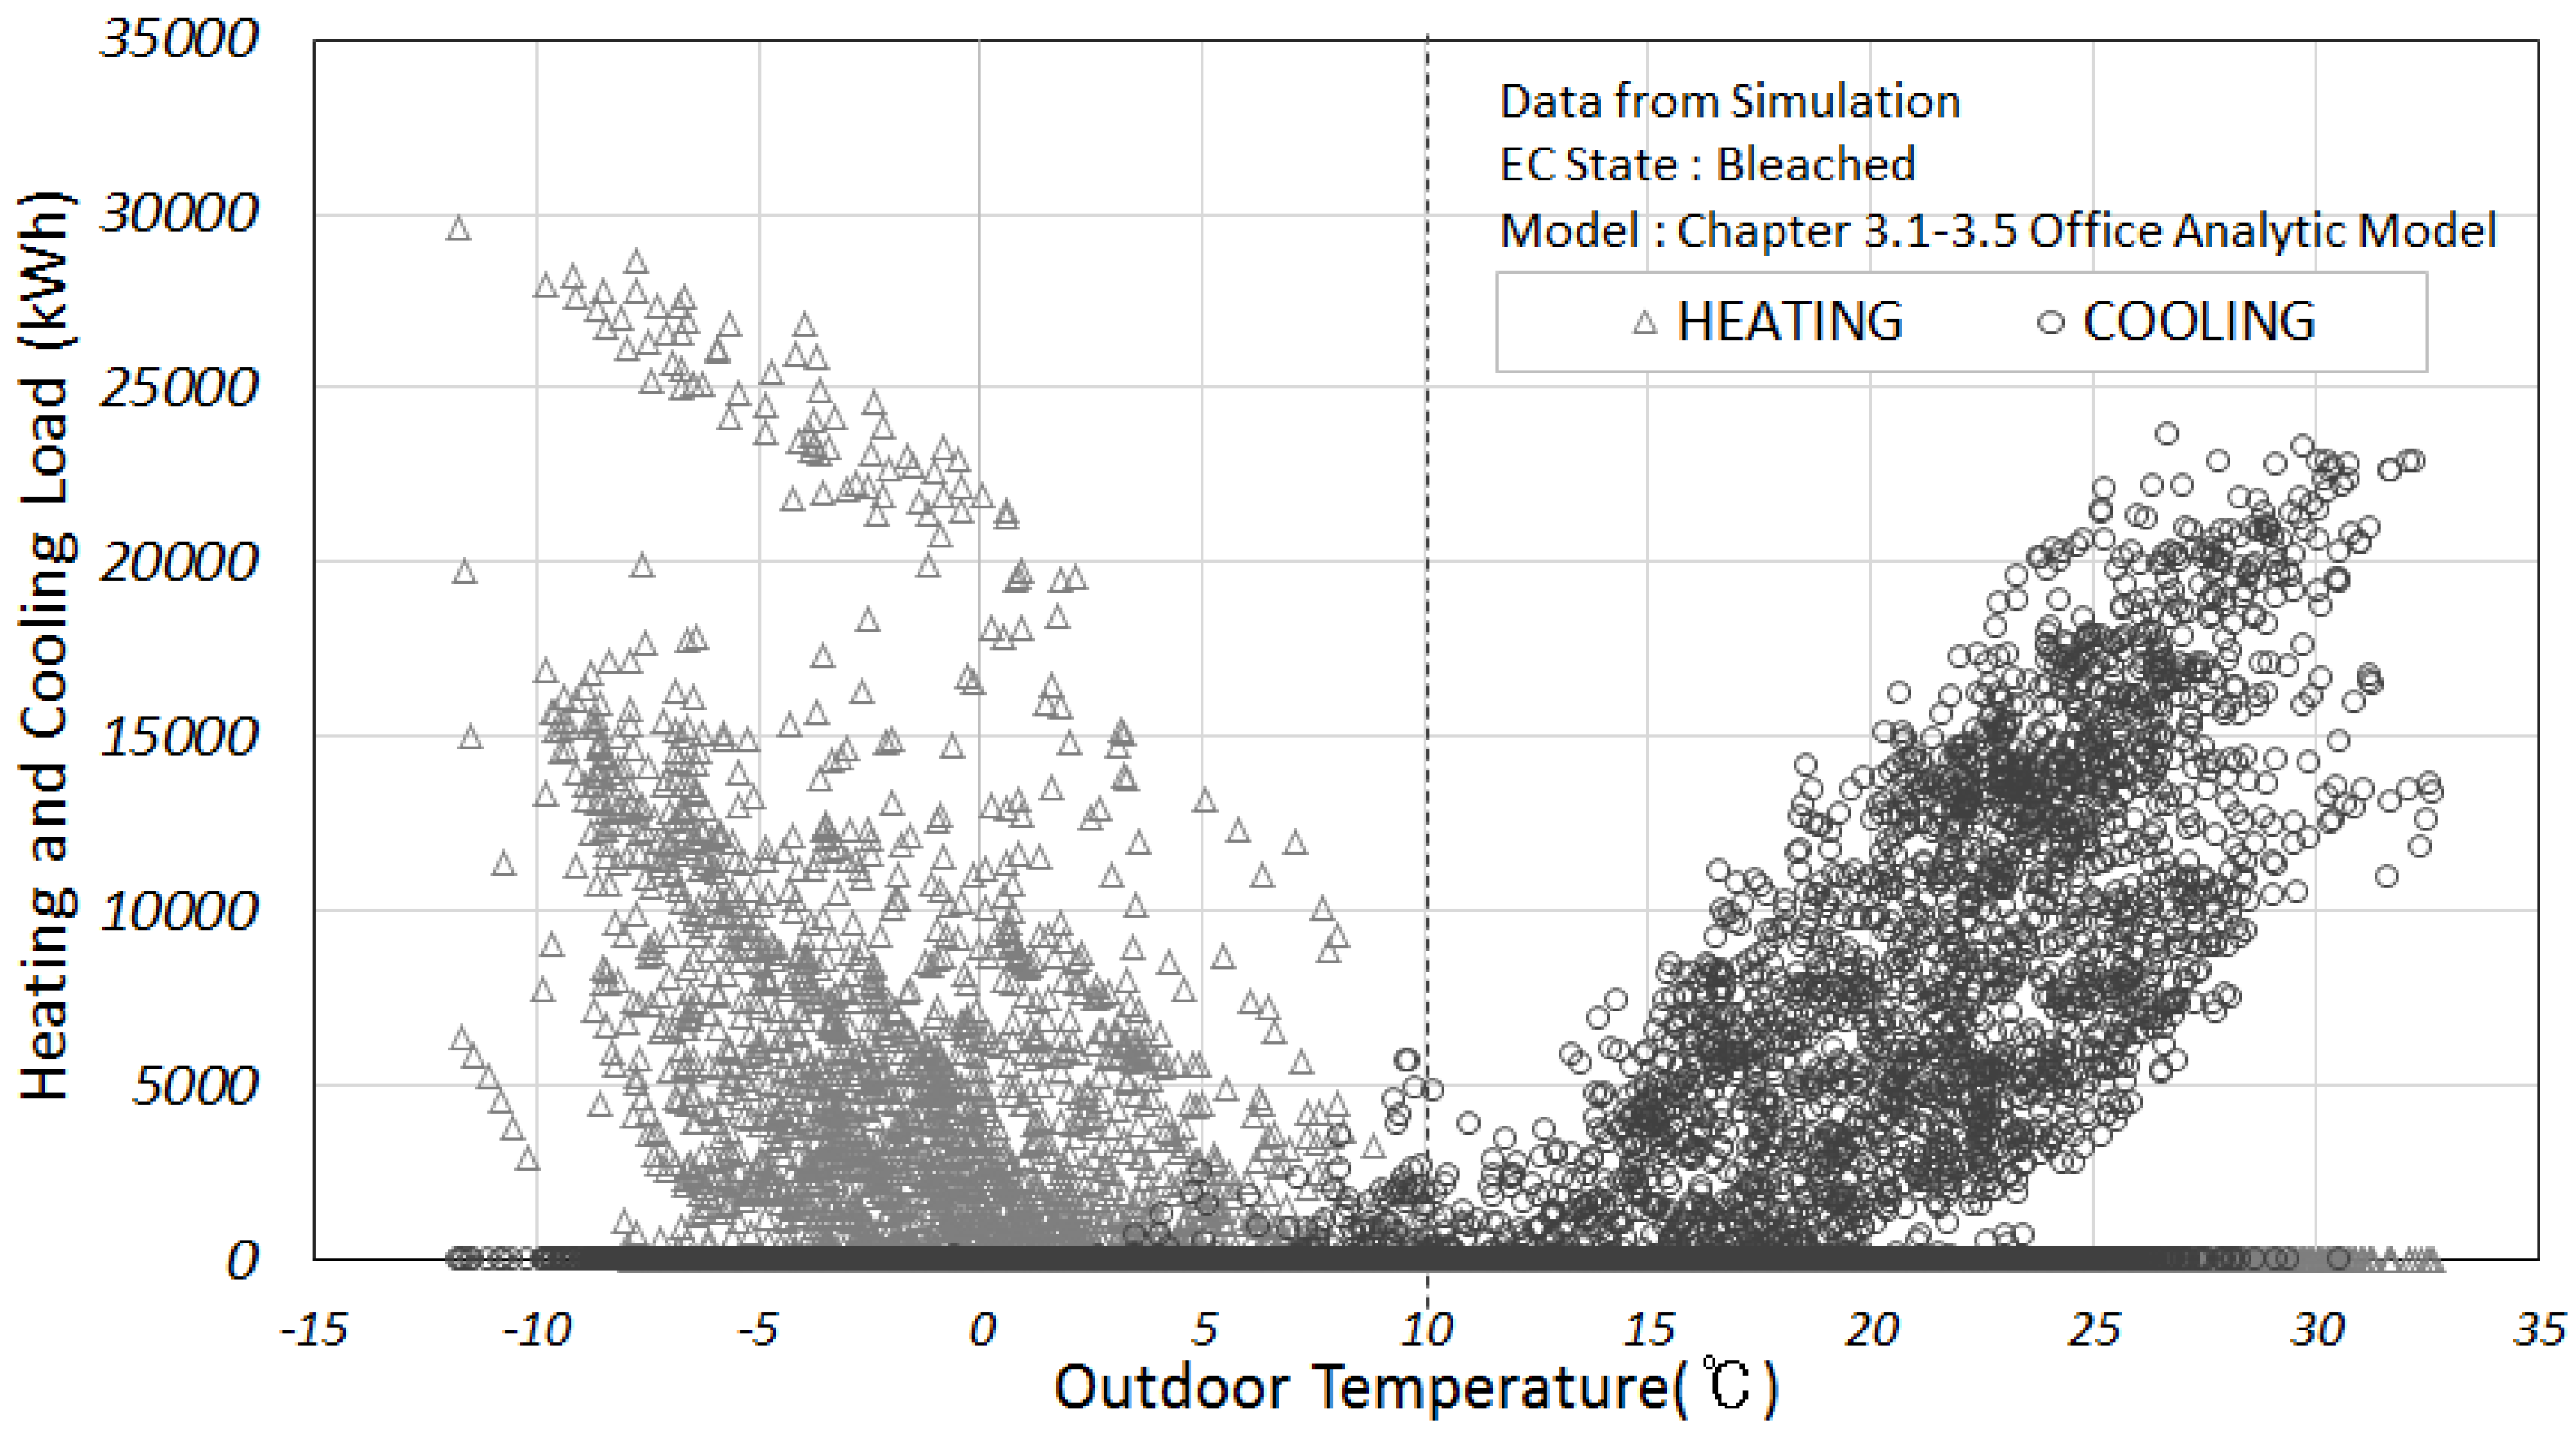
3.1. Overview of Analytical Simulation Model

This study used EnergyPlus 8.5, a simulation tool developed by the US Department of Energy (DOE), to analyze building energy [19]. Based on a heat balance equation, EnergyPlus has an advantage in that it calculates the penetration, reflection, and absorption attributes of solar radiation, as well as the heat transfer by detailed conduction, convection, and radiation to the windows. As such, it is appropriate for evaluating the effects of the coloring and decoloring of the electrochromic glass on building energy [20,21,22,23,24,25,26].
EnergyPlus not only analyzes the building energy, but also the daylight performance that this study wishes to examine as well. The component that can analyze the DGI can be provided by applying the daylight sensor to the zone of the analysis model in EnergyPlus. DGI can evaluate the level of glare when the person indoors looks at the window from the installed location of the daylight sensor. Using the daylight sensor, it is possible to provide an analysis of the indoor illuminance, and a detailed examination of the distribution of indoor illuminance by applying the illuminance map in grid form.
Figure 5 illustrates the simulation model for analysis: an office building with a floor area of 50 m × 50 m, a height of 3 m, and a window area ratio of 60%. The simulation model is set as three floors in total, and the analysis was conducted on the middle floor. The space within 4.5 m of the outer wall is separated as the perimeter zone; the perimeter zones of the north, east, and west were analyzed with regard to building energy and light environment performance. Electrochromic is applied to the south (90 m2) side, the east side (90 m2), and the west side (90 m2) glass (overall 270 m2) and is controlled by five conditions according to temperature and solar radiation.

3.2. Material and Construction

As displayed in Table 2, the opaque exterior wall is composed according to the insulation standard of the Energy Saving Design Standards of Buildings (2016). The material property of the glass applied to the analysis model is based on the optical properties of electrochromic glass discussed in Section 2 and is made of triple electrochromic glass according to the Energy Saving Design Standards of Buildings [27], using LBNL’s Window tool [28]. The composition of the glass is: 8 mm electrochromic glass + 12 mm air + 6 mm clear glass + 12 mm air + 6 mm low-e glass, with a heat transmittance value of 1.192 W/m2 K. The optical properties of triple electrochromic glass in a decolored state are a Solar Heat Gain Coefficient (SHGC) of 0.357 and Visible Transmittance (Tvis) of 0.463; in a colored state, they are a SHGC of 0.107 and Tvis of 0.085. This study applied electrochromic glass with triple glazing, which is currently necessary in order to meet the required heat transmission coefficient of 1.5 W/m2 K of the curtain walls for office buildings. Moreover, glass with the performance capabilities of triple glazing will be in constant demand due to the increasingly strong standards of building energy saving designs in Korea.

3.3. Setpoint Temperature and HVAC System

The temperature of the analysis model was set at 20 °C and 26 °C for the indoor temperature standard in calculating the capacity of heating and cooling facilities according to the Energy Saving Design Standards of Buildings [28]. For the HVAC system, IdealLoadsAirSystem from EnergyPlus was applied for a load analysis that excludes system variable interference as much as possible. IdealLoadsAirSystem processes the cooling and heating load that a zone requires through a virtual air conditioning system with an unlimited capacity, and it only calculates the load by the difference of enthalpy between the air from the designated supply and the combined air (ventilation + outdoor air) [29].

3.4. Internal Gains and Weather Data

For the internal heat gain, overhead lighting of 10.8 W/m2, peak occupancy of 22.3 m2/person, and equipment of 8.6W/m2 were applied according to the standards set by ASHRAE Fundamentals (2009) [30]. Office Schedule, provided by EnergyPlus’ Schedules of DataSets, was used for the heat gain schedule of the human body, lighting, and equipment. For outdoor air volume, 1.1 m3/m2h was applied according to the operational regulation of the certification program for the energy efficiency rating system of the buildings.
We also used weather data for the Incheon region in Korea. The climate conditions of the Incheon region have the characteristics of a continental climate with an annual temperature range of 30 °C, influenced by the cold anticyclone of the continent in winter and the hot and humid oceanic air mass in summer.

3.5. Dimming Control

EnergyPlus offers a component that can control the dimming of light by using the daylight sensor shown in Figure 4 with a step method, continuous method, and continuous/off method. This study set the dimming control at the standard of 700 lx of interior illuminance in order to evaluate the performance of lighting energy saving by controlling the transmittance of electrochromic glass. In the dimming control method, 100% lighting energy is consumed at 0 lx, the lighting energy is no longer used when the illuminance reaches 700 lx, and the illuminance between 0 lx and 700 lx was set to be controlled in the continuous method. The two daylight sensors indicated in Figure 4 were set to detect interior illuminance, and each daylight sensor was set to cover 50% of the perimeter zone by direction.

3.6. Conditions for Controlling Electrochromic Glass

Electrochromic glass can control its transmittance, thus enabling it to be used as a solar control device. The purpose of controlling solar radiation in a building is to save cooling, heating, and lighting energy; reduce the occurrence of glare occurrence; and maintain proper internal illumination. Therefore, it is essential to control the electrochromic glass with the transmittance appropriate for the external environmental conditions in order to satisfy requirements of both the energy and construction environments.
Moreover, the conditions of the external environment need to be detected in order to control the electrochromic glass; thus, the condition variables should be simplified as much as possible. If the optimal algorithm controls the electrochromic glass under complex conditions when developing the control method, the types of sensors will diversify, making it difficult to develop the controller’s hardware and software. This would result in increasing the controller cost and reducing the ability to compete. Furthermore, since a complicated control algorithm needs to be re-developed to cope with the various variables—like shape, direction, and climate condition—of buildings, commercialization would also be tricky.
This study intends to discover a control method that can minimize the control variables of electrochromic glass at the commercialization stage, while still meeting all the conditions concerning building energy and the construction environment. In order to minimize the control variable, this study set limits at the initial development stage of the electrochromic glass control, and temperature and solar radiation as the only variables of external environmental conditions.
The first control method chosen was the discolored glass control method. Here, the criterion of external temperature was set at 10 °C; anything above 10 °C would cause colorization, and anything below 10 °C would cause decolorization. The basis for deducing a control condition by temperature is as follows. The control condition is set at a temperature of 10 °C based on the analysis results of an office building simulation, as described in Section 3.1, Section 3.2, Section 3.3, Section 3.4 and Section 3.5. According to these results, the cooling and heating load patterns are divided based on a criterion of 10 °C, as shown in Figure 6. Therefore, the temperature control condition was set with the intention of reducing the load from solar radiation by coloring the electrochromic glass within the outdoor temperature range where the cooling load occurs. Another reason for this was to reduce the heating load through the inflow of solar radiation by decoloring the electrochromic glass within the outdoor temperature range where the heating load occurs. While temperature control is expected to perform excellently in reducing the cooling and heating load, it will maintain its decolorized state in winter and this may cause discomfort due to glare.
The second controlling method used was discoloring by solar radiation detected from the glass surface. Four conditions of 50 W/m2, 300 W/m2, 500 W/m2, and 700 W/m2 were given and the glass was set to decolor if the solar radiation was below the condition, and color if the solar radiation was above the condition. One of the fundamental roles of a solar radiation control device is to reduce the glare when looking at the window. Hence, regarding control conditions by solar radiation, glare was also considered, in addition to the cooling and heating load, when setting the conditions.
We deduced the solar radiation that can minimize the glare from a DGI analysis. The graph in Figure 7 shows the annual DGI data of each bearing when facing the window surface with a decolorized electrochromic state. DGI is used to indicate the degree of glare that occurs when looking at a window, and states that office buildings need to satisfy a DGI value of below 22. Thus, when setting the controlling conditions of electrochromic glass by solar radiation, the DGI by solar radiation on the glass surface was first analyzed using a scatterplot, as shown in Figure 7; 50 W/m2, the solar radiation where the DGI value began to go beyond 22, was set as the minimum condition. Since 50 W/m2 is when coloring due to solar radiation starts occurring, it is expected to have an effect on reducing the cooling load.
The other solar radiation conditions are classified into three phases: 300 W/m2, 500 W/m2, and 700 W/m2, as shown in Table 3. These conditions were set by considering each element in order to reduce glare, cooling, heating, and illumination load. As such, 300W/m2 was set for the primary purpose of reducing the cooling load, with some expectation for reducing the lighting energy and glare; 500 W/m2 was set to reduce cooling, heating, and lighting energy in a balanced way; while 700 W/m2 was set with the purpose of reducing heating and lighting energy. Figure 7 divides the same bearing into a DGI of 20–22 and DGI of 30–40 because the DGI is particularly high at noon during winter, when the solar altitude is low in the south, and high on the doors and windows during sunrise and sunset, when the solar altitude is low in the east and west.
Likewise, the desired effects of the five conditions of varying temperature and solar radiation are all different. As such, the office building analysis model established from Section 3.1, Section 3.2, Section 3.3, Section 3.4 and Section 3.5 is used as the object of analysis. Using EnergyPlus 8.5, we analyzed the cooling and heating load, lighting energy, DGI, and interior illuminance when controlling the electrochromic glass according to the five conditions.

4. Results and Discussion

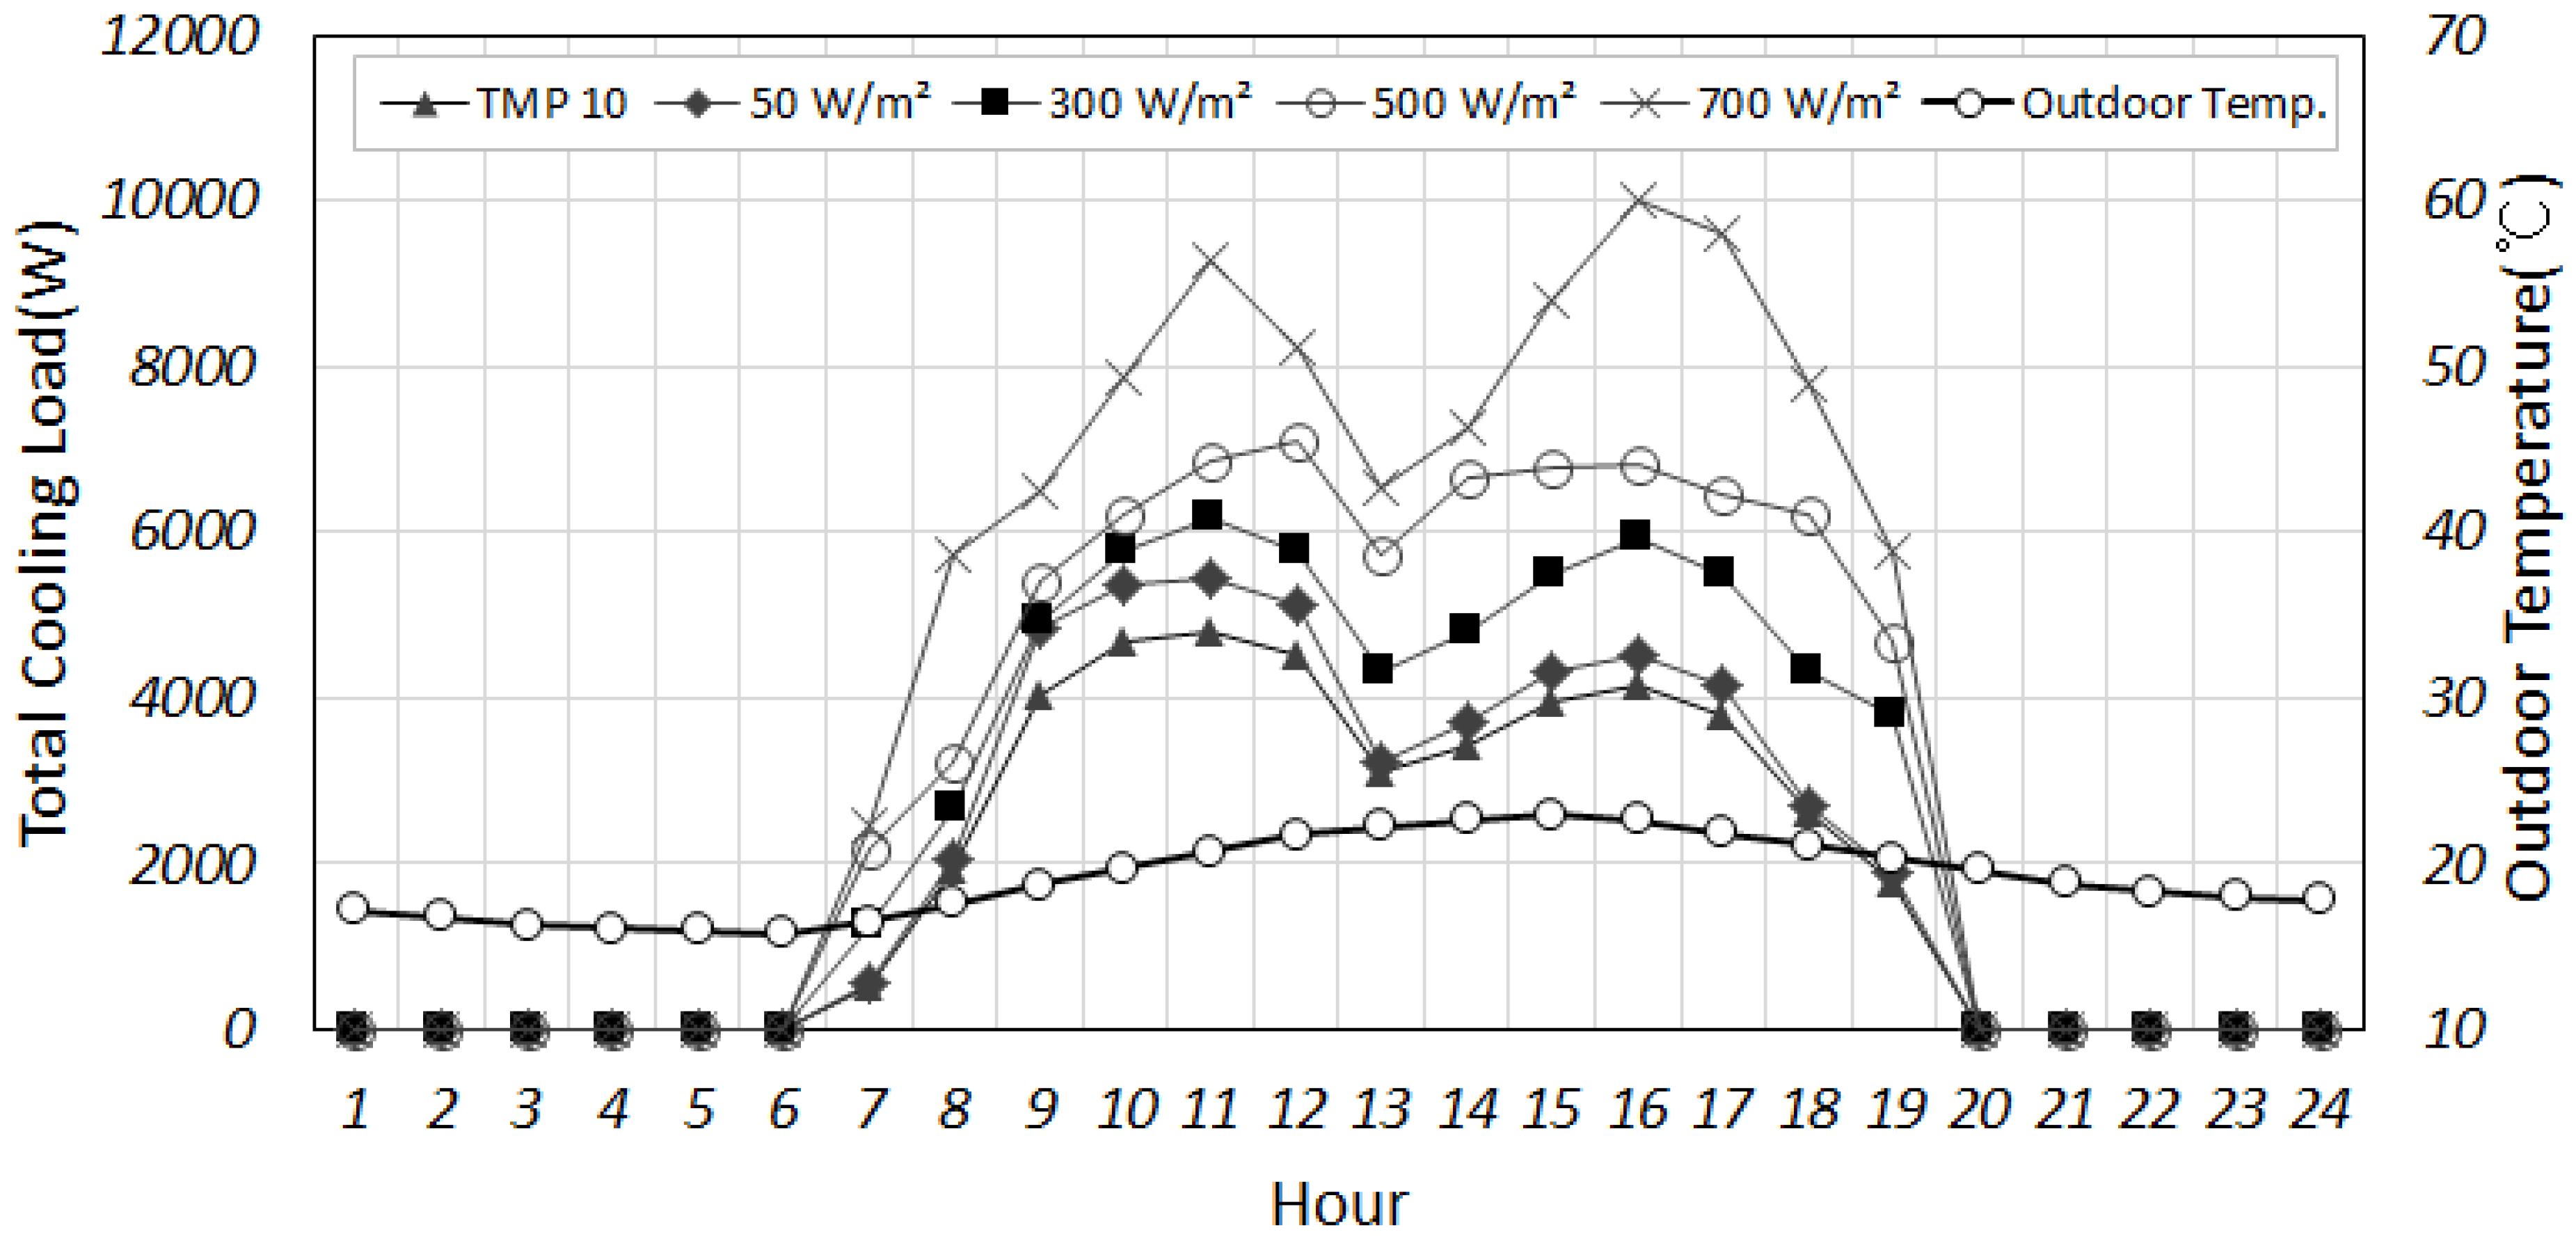
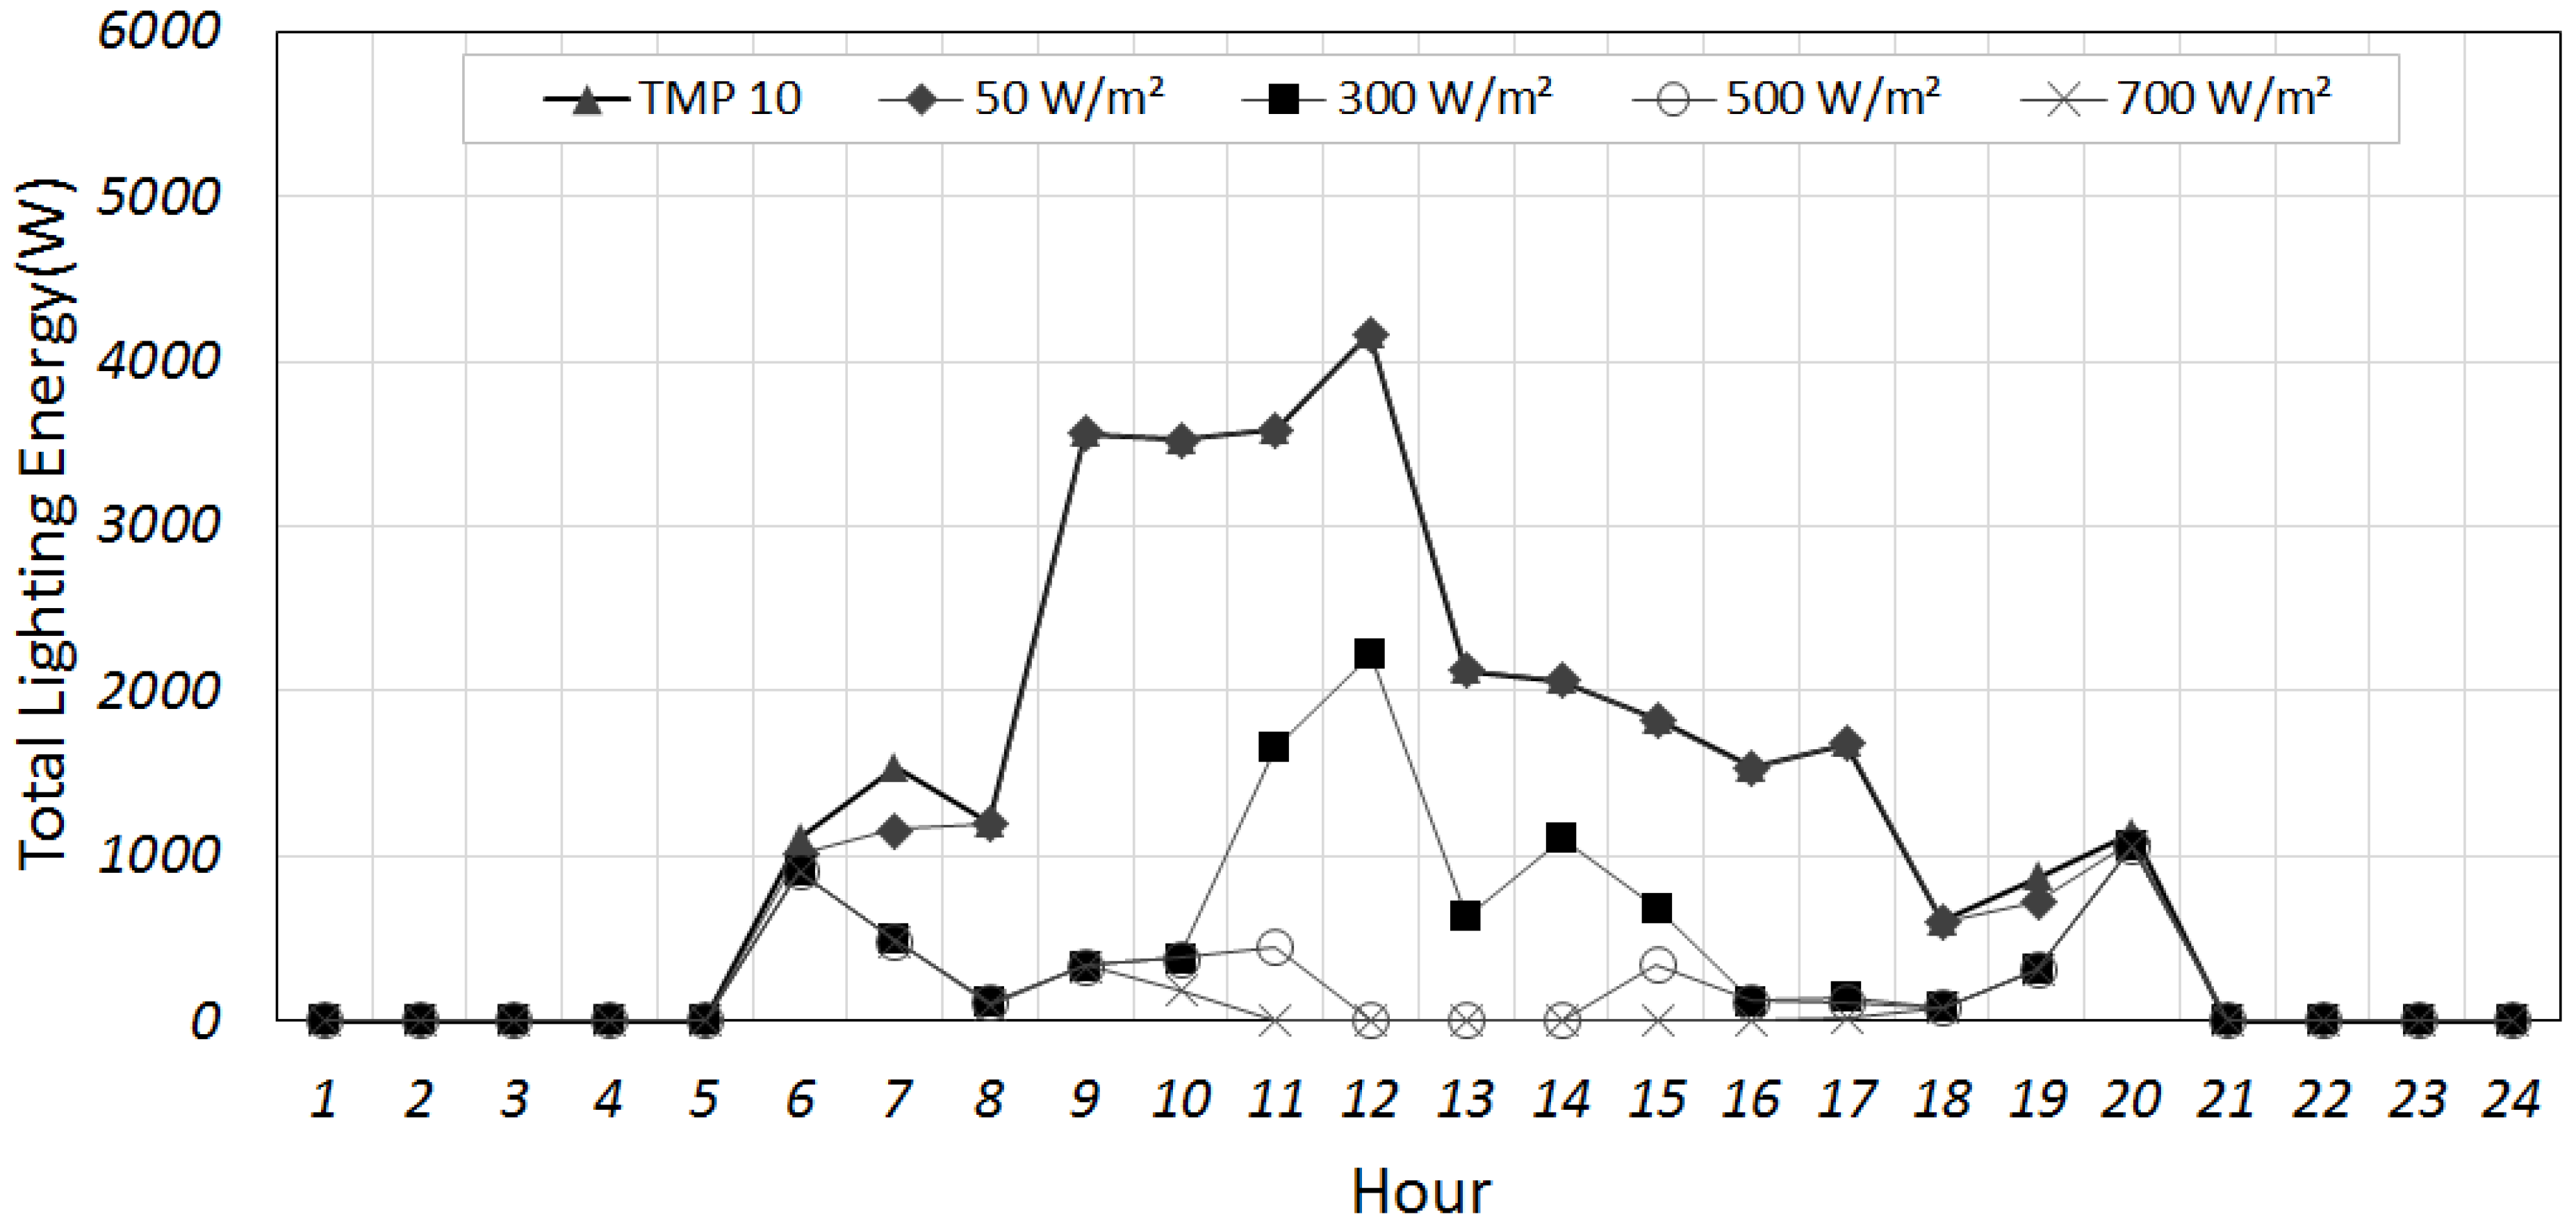
4.1. Analysis of Hourly Energy Consumption by Controlling Condition

This section intensively analyzes the hourly data of a typical day in summer and winter in order to evaluate the differences in the cooling and heating load and lighting energy consumption according to the conditions of controlling electrochromic glass. Based on the climate data analysis of the Incheon region, June 10 was the day with the highest solar radiation between June and August, and was thus chosen as the typical summer day; 12 December had the highest solar radiation between November and January, and was thus chosen as the typical winter day. As discussed in Section 3.3, EnergyPlus 8.5’s IdealLoadAirSytem model was used to calculate the cooling and heating load required to reach the set temperatures of 20 °C and 26 °C. As discussed in Section 3.5, an interior illumination of 700 lx was set as the criterion for the dimming control so that the lighting energy consumption differs according to the interior illumination.
Figure 8 and Table 4 show the cooling load of the typical day in summer. The results indicate that electrochromic glass controlled by the temperature has the best effect on reducing the cooling load, whereas control by solar radiation has a high performance in reducing the cooling load for the conditions to color when the radiation is low. Since the outside temperature of a typical summer’s day is always higher than 10 °C, the controlling method of coloring when the temperature is higher than 10 °C caused the glass to be colored throughout the day, resulting in the best performance of blocking the solar radiation.
As indicated in Figure 9 and Table 5, however, the temperature-controlled method shows the highest consumption rate of lighting energy. As explained above, since the temperature-controlled method causes the glass to be constantly colored during the typical summer day, the amount of solar light penetration is lower, and the indoor illumination is lower than in other conditions. Since it is the condition in which the lights are under dimming control, the consumption rate of lighting energy is the highest.
Figure 10 and Table 6 show the results of the heating load on the typical winter day, and the temperature-based control of electrochromic glass was found to have the best performance from the heating load perspective.
Since the outside temperature of the typical winter day is always lower than 10 °C, the controlling method of coloring when the temperature is lower than 10 °C caused the glass to be decolored throughout the day, resulting in the best performance of inflowing solar radiation. When controlling the electrochromic glass by solar radiation, colorization under a higher amount of solar radiation condition was effective to reduce the heating load. With regard to the lighting energy consumption, since the outside temperature of the typical winter day is always higher than 10 °C, as shown in Figure 11 and Table 7, the least amount of energy was used to maintain the decolored state.
Table 3 demonstrates the integrated analysis of the hourly data of the typical days in summer and winter. Regarding cooling reduction, the temperature-controlled method and solar radiation of the W/m2 controlling method were found to have the advantage. With regard to the heating load, the temperature controlling method and controlling with solar radiation of 700 W/m2 had superb performances. In terms of lighting energy consumption, controlling with solar radiation of 500 W/m2 and 700 W/m2 worked better in summer, whereas the temperature controlling method worked better in winter.
This section examined the trends of the cooling and heating load, and the lighting energy consumption, according to each controlling condition through an analysis of hourly data. Table 8 provides a compilation of all performance evaluation results, and shows which controlling condition is advantageous for cooling, heating, or lighting. This analysis result can be utilized as primary data when developing the controlling condition for the commercialization of electrochromic glass in the future.

4.2. Analysis of Annual Energy Consumption by Controlling Conditions

According to the hourly data analyzed in Section 4.1, each characteristic and tendency toward the cooling and heating load, and lighting energy consumption, in summer and winter according to control condition can be identified. However, it is difficult to estimate the total amount of annual building energy. Examining the analysis results of the hourly data of the temperature controlling method and 700 W/m2 solar radiation control method fragmentarily, indicates that the temperature controlling conditions are effective in reducing the heating and cooling load and lighting energy in winter. In contrast, the 700 W/m2 solar radiation controlling method is effective in reducing the heating load and light energy in winter and summer. Thus, it is difficult to identify the performance superiority when both controlling conditions demonstrate an excellent performance in all three areas. Therefore, this section conducts an overall analysis of the total amount of annual cooling and heating loads and lighting energy by each controlling condition in order to discern the optimized controlling conditions for electrochromic glass from the building energy perspective.
Table 9 and Figure 12 show the summed monthly data of the annual cooling and heating loads, and lighting energy consumption. The monthly data were divided into the cooling season (April–October) and heating season (November–March) to study the trend.
During the cooling season, the 300 W/m2 solar radiation controlling condition was found to have the best performance. Although the temperature control method with a high solar radiation blocking rate and 50 W/m2 solar radiation showed an outstanding performance in terms of hourly data, the 300 W/m2 solar radiation controlling condition showed the best result when the data was integrated with cooling load and lighting energy, thus displaying a different trend. As shown in Table 9, the temperature controlling method and 50 W/m2 solar radiation had a high frequency of maintaining a colored state during summer, resulting in a high consumption rate of lighting energy. Regarding the cooling load, the 300 W/m2 solar radiation controlling condition was not the best, but somewhat reasonable; while the 500 W/m2 and 700 W/m2 solar radiation controlling conditions were on the weaker side. Nonetheless, they all belonged to the better group regarding the lighting energy consumption rate. Therefore, this group was found to perform better than the temperature controlling condition and 50 W/m2 solar radiation controlling condition with regard to the total amount of building energy by reducing the lighting energy consumption during the cooling period.
During the heating season, the solar radiation temperature controlling condition was found to have the best performance. Based on the hourly data, the temperature controlling method with a high blocking rate of solar radiation was found to perform the best from a heating load perspective. Since the temperature controlling method maintains the decolored state during the winter season, the solar radiation penetration rate is higher than in other controlling methods. This method also maintained the high internal lighting and reduced the heating load and lighting energy the most. The solar radiation controlling method showed a trend similar to that of the hourly data, demonstrating that the energy consumption rate decreases as the solar radiation condition increases. Table 10 and Figure 13 show the total amount of annual cooling and heating loads, as well as the consumption amount of lighting energy. In the case of office buildings applying the lighting control, the analysis reveals that coloring under the condition of solar radiation higher than 300W/m2 is favorable for reducing the total energy consumption rate.
This results from the influence of the lighting energy, which takes up around 25% of the total building energy of the analysis model built in this study. As shown in Figure 14 and Table 10, the temperature controlling method and the coloring condition with a low solar radiation of 50 W/m2 have double the lighting energy compared to other controlled conditions. In contrast, the condition with more than 300 W/m2 solar radiation has an average effect on cooling and heating reduction, but the difference with other conditions is only around 2000 kWh. Moreover, approximately 5000 kWh of energy can be reduced through the dimming control, thus the influence of lighting energy is clearly substantial. Therefore, while deducing the electrochromic glass’ controlling methods for reducing the cooling and heating load is essential, an integrated strategy that takes lighting energy into account is required to reduce the building energy.

4.3. Analysis of DGI and Indoor Lighting by Controlling Conditions

As much as reducing the energy is essential for a solar radiation control device, it is equally vital to suppress the glare and secure reasonable indoor lighting from the perspective of the construction environment. As such, this section analyzes the DGI, which identifies the level of glare when looking at the window, according to the conditions of controlling electrochromic glass. This section also analyzes the performance of the light environment through a ratio analysis of the time within the range of the reasonable indoor lighting from 8760 h in a year.
Proposed by Hopkinson, the DGI recommends that the glare level of an office building be less than 22 [31]. Figure 15 provides an analysis of DGI according to the control conditions of the electrochromic glass, and shows the scatter plot of DGI by solar radiation. In this graph, the data marked by upward arrows and percentage indicate the rate of the time exceeding DGI 22 in a year, and the data marked by downward arrows and percentage are the rate of time satisfying the condition of being less than DGI 22.
In analyzing the DGI data, the condition with the lowest frequency of glare was found to be the condition of colorization by 50 W/m2 solar radiation. With regard to the temperature controlling method, glare was suppressed during the summer with colorization, but occurs in the winter because the decolorization is maintained. The altitude of the sun is low in winter, and the window glare becomes stronger than summer, so this is not an effective method to prevent glare.
With regard to solar radiation control methods, it was found that as the solar condition for controlling electrochromic glass becomes higher, the frequency of glare also increases. For example, the 500 W/m2 solar radiation condition found to perform superbly with regard to energy saving, caused the glaring ratio to increase by more than 20%. Such a result involves an element of dissatisfaction in terms of the user’s construction environment. In other words, glare should be considered from both an energy saving perspective and that of the construction environment when selecting the control method in order to result in both user satisfaction and the successful commercialization of electrochromic glass.
Figure 16 is a graph representing the rate of time falling within the range of proper indoor illumination per year according to each control condition of the electrochromic glass. The proper illumination range was set as 150 lx–1500 lx, which is the proper illumination range of the office building according to the 2011 criteria of the Korean Industrial Standard (KS) [32]. Upon examination, the control method with the highest rate of time within the range of proper illumination per year was found to be the 300 W/m2 solar radiation condition. As the solar radiation condition increased, data with higher than proper illumination offered by KS also increased, decreasing the quality of indoor illumination as a result. Much of the data for the 50 W/m2 solar radiation control condition was lower than the proper illumination, meaning the indoor area was continuously maintained to be dark. In the case of temperature control, high indoor illumination was maintained in winter, and low indoor illumination was maintained in the summer. Thus, the annual indoor illumination had a poor quality without continuity and uniformity.

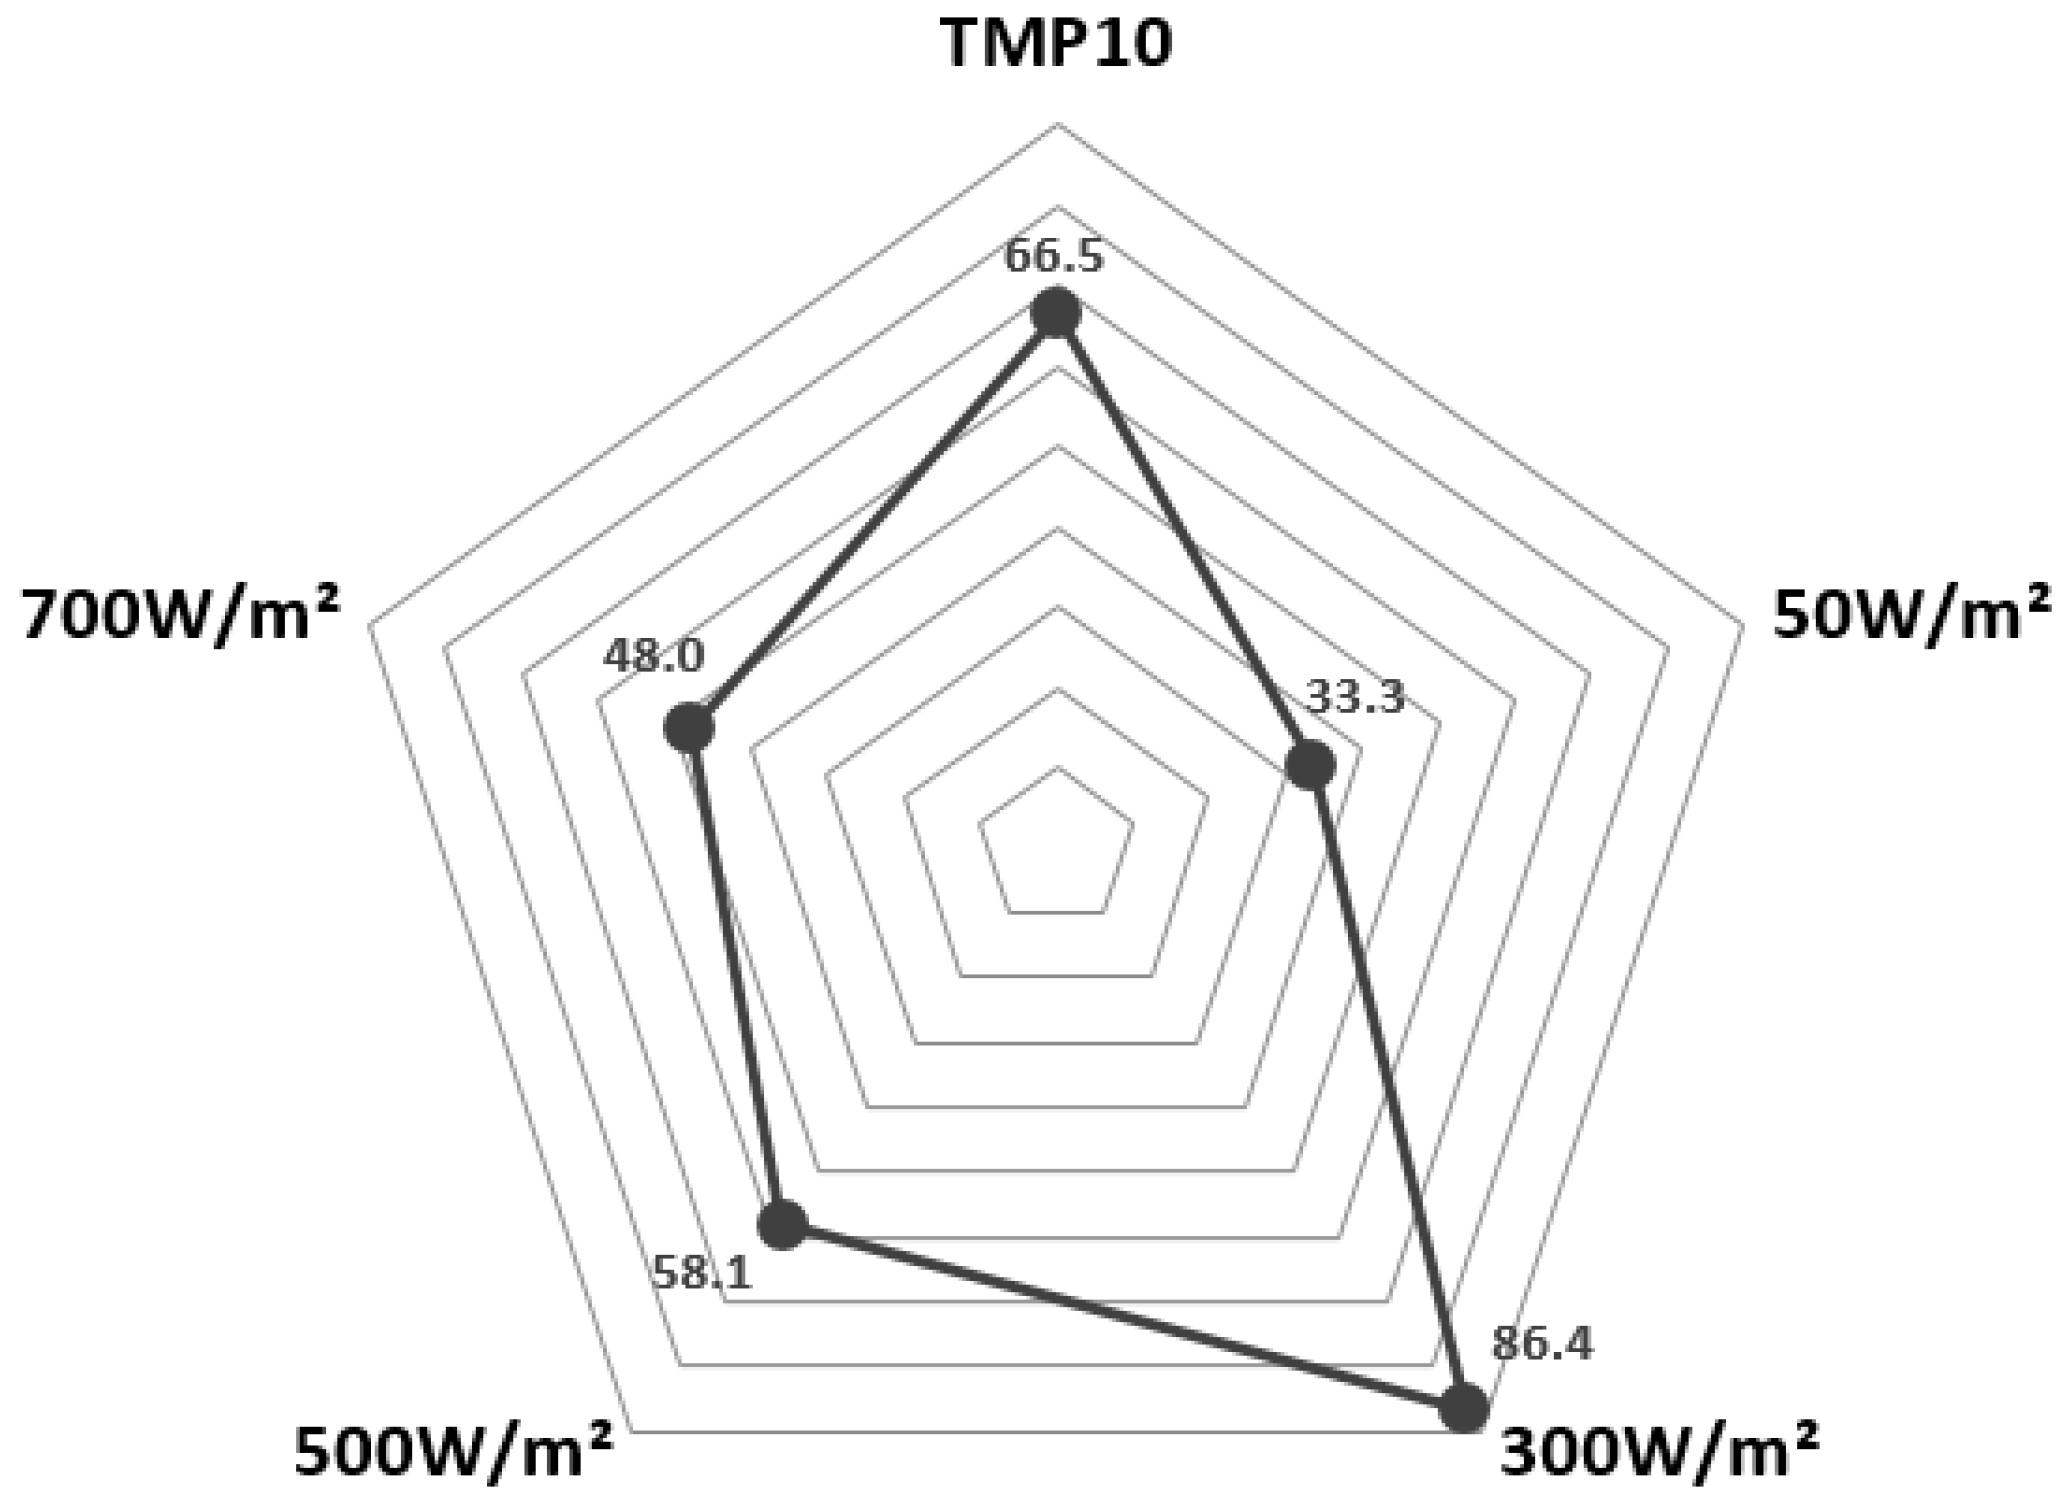
4.4. Deducing the Optimized Ccontrol Condition that Considers the Energy and Light Environment

Section 4.1, Section 4.2 and Section 4.3 have evaluated the energy-saving and light environment performances, comparing advantages and disadvantages of each control condition of the electrochromic glass. Since different conditions have different characteristics, a methodology that can perform an integrated evaluation is required. Thus, this section performs an integrated evaluation by unifying the analysis result data of energy and light environment into a single index called the Integrated energy and daylight performance index (EDPI). The performance is evaluated by making the real value into a percentile by comparing the maximum and minimum value for each component, such as energy, DGI, and indoor illumination. In other words, if the total sum of cooling, heating, and lighting energy of the temperature controlling method is converted to E P D I i j , the value of I is the sum of cooling, heating, and lighting energy, and the j condition becomes the temperature controlling method. Based on the data provided in Table 11, the performance level can be calculated by using Equation (1). Here, the A c t u a l   X i j   v a l u e is 39,154.1 kWh, M i n n i m u m   X i j   v a l u e is 36,310.5 kWh, and M a x i m u m   X i j   v a l u e is 43,130.8 kWh. When the data calculated by each element are added and averaged, the integrated performance can be evaluated.
E D P I i j = A c t u a l   X i j   v a l u e M i n i m u m   X i j   v a l u e   M a x i m u m   X i j   v a l u e M i n m u m   X i j   v a l u e × 100
The EDPI analysis confirmed that the 300 W/m2 solar radiation condition displayed the best performance; its result values are provided in Table 11 and Figure 17. The 300 W/m2 solar radiation condition performed the best because it displayed good results with regard to cooling and heating load and lighting energy, as well as in maintaining proper indoor illumination. With regard to DGIS, it was the second-best in performance after the 50 W/m2 condition, but had a mediocre performance in comparison with other conditions. From the analysis of the EDPI values (Table 11), it was discovered that no single controlling method satisfies every condition perfectly. Nonetheless, although not perfect, the EPDI index is a useful method for deriving the optimal condition. Since the essential performances required by buildings are different, an EDPI with a weighted factor will be developed in a follow-up study.

5. Discussion

This study set five transmittance conditions of varying temperatures and solar radiation levels based on an optical characteristic data analysis of electrochromic glass developed in Korea. The study also analyzed and identified the control condition optimal for building energy and light environment performances. The analysis results are summarized as follows.
(1)
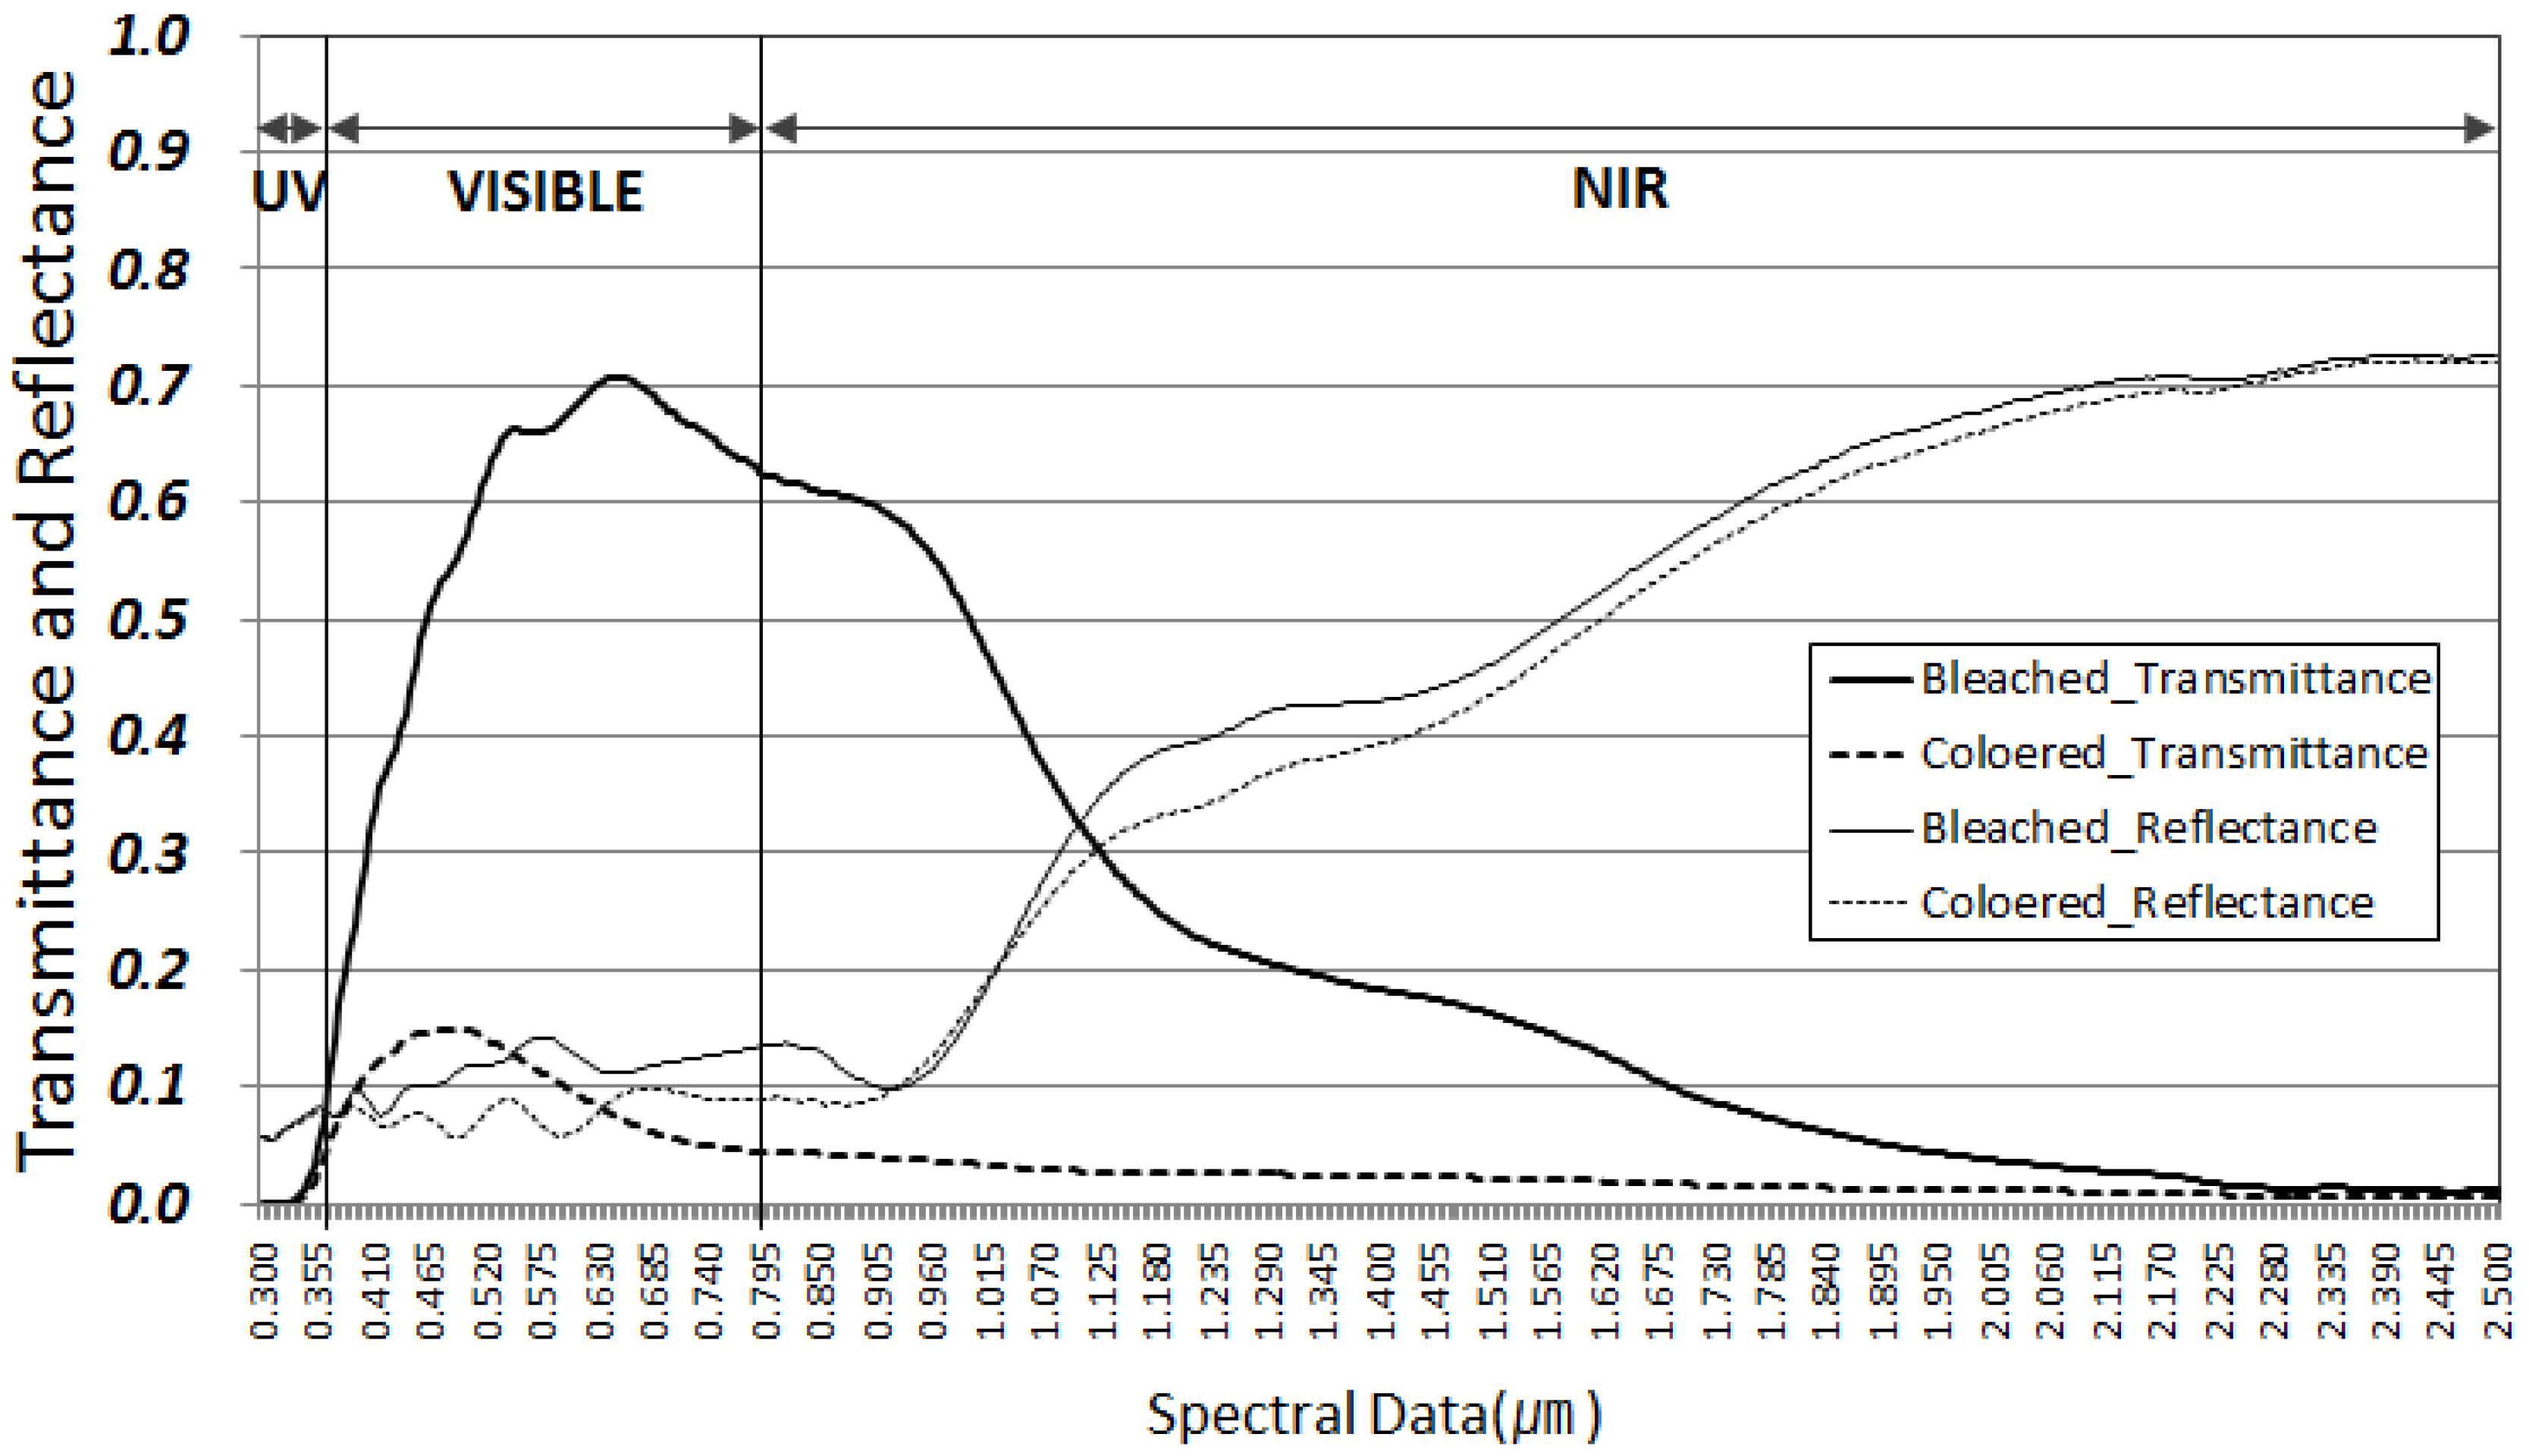
According to the analysis of the optical characteristics by a spectrometer, it was found that the solar transmittance of the electrochromic glass sample can be adjusted in the range of 41.6–48.1% when decolored, and up to 6.5% when colored. It was also found to be adjustable in the range of 52.8–64.8% when decolored, and up to 12% when colored, for the case of visible transmittance. In examining the optical characteristics after composing triple glass for construction by using the LBNL’s Optic and Window tool, the thermal transmittance showed a high thermal insulation property of 1.19 W/m2 K. The solar transmittance was adjustable in the range of 25–35.7% when decolored, and up to 10.7% when colored. The visible transmittance was adjustable in the range of 37.8–46.3% when decolored, and up to 8.5% when colored. Thus, the potential of the electrochromic glass to serve as a solar radiation controlling device was fully demonstrated.
(2)
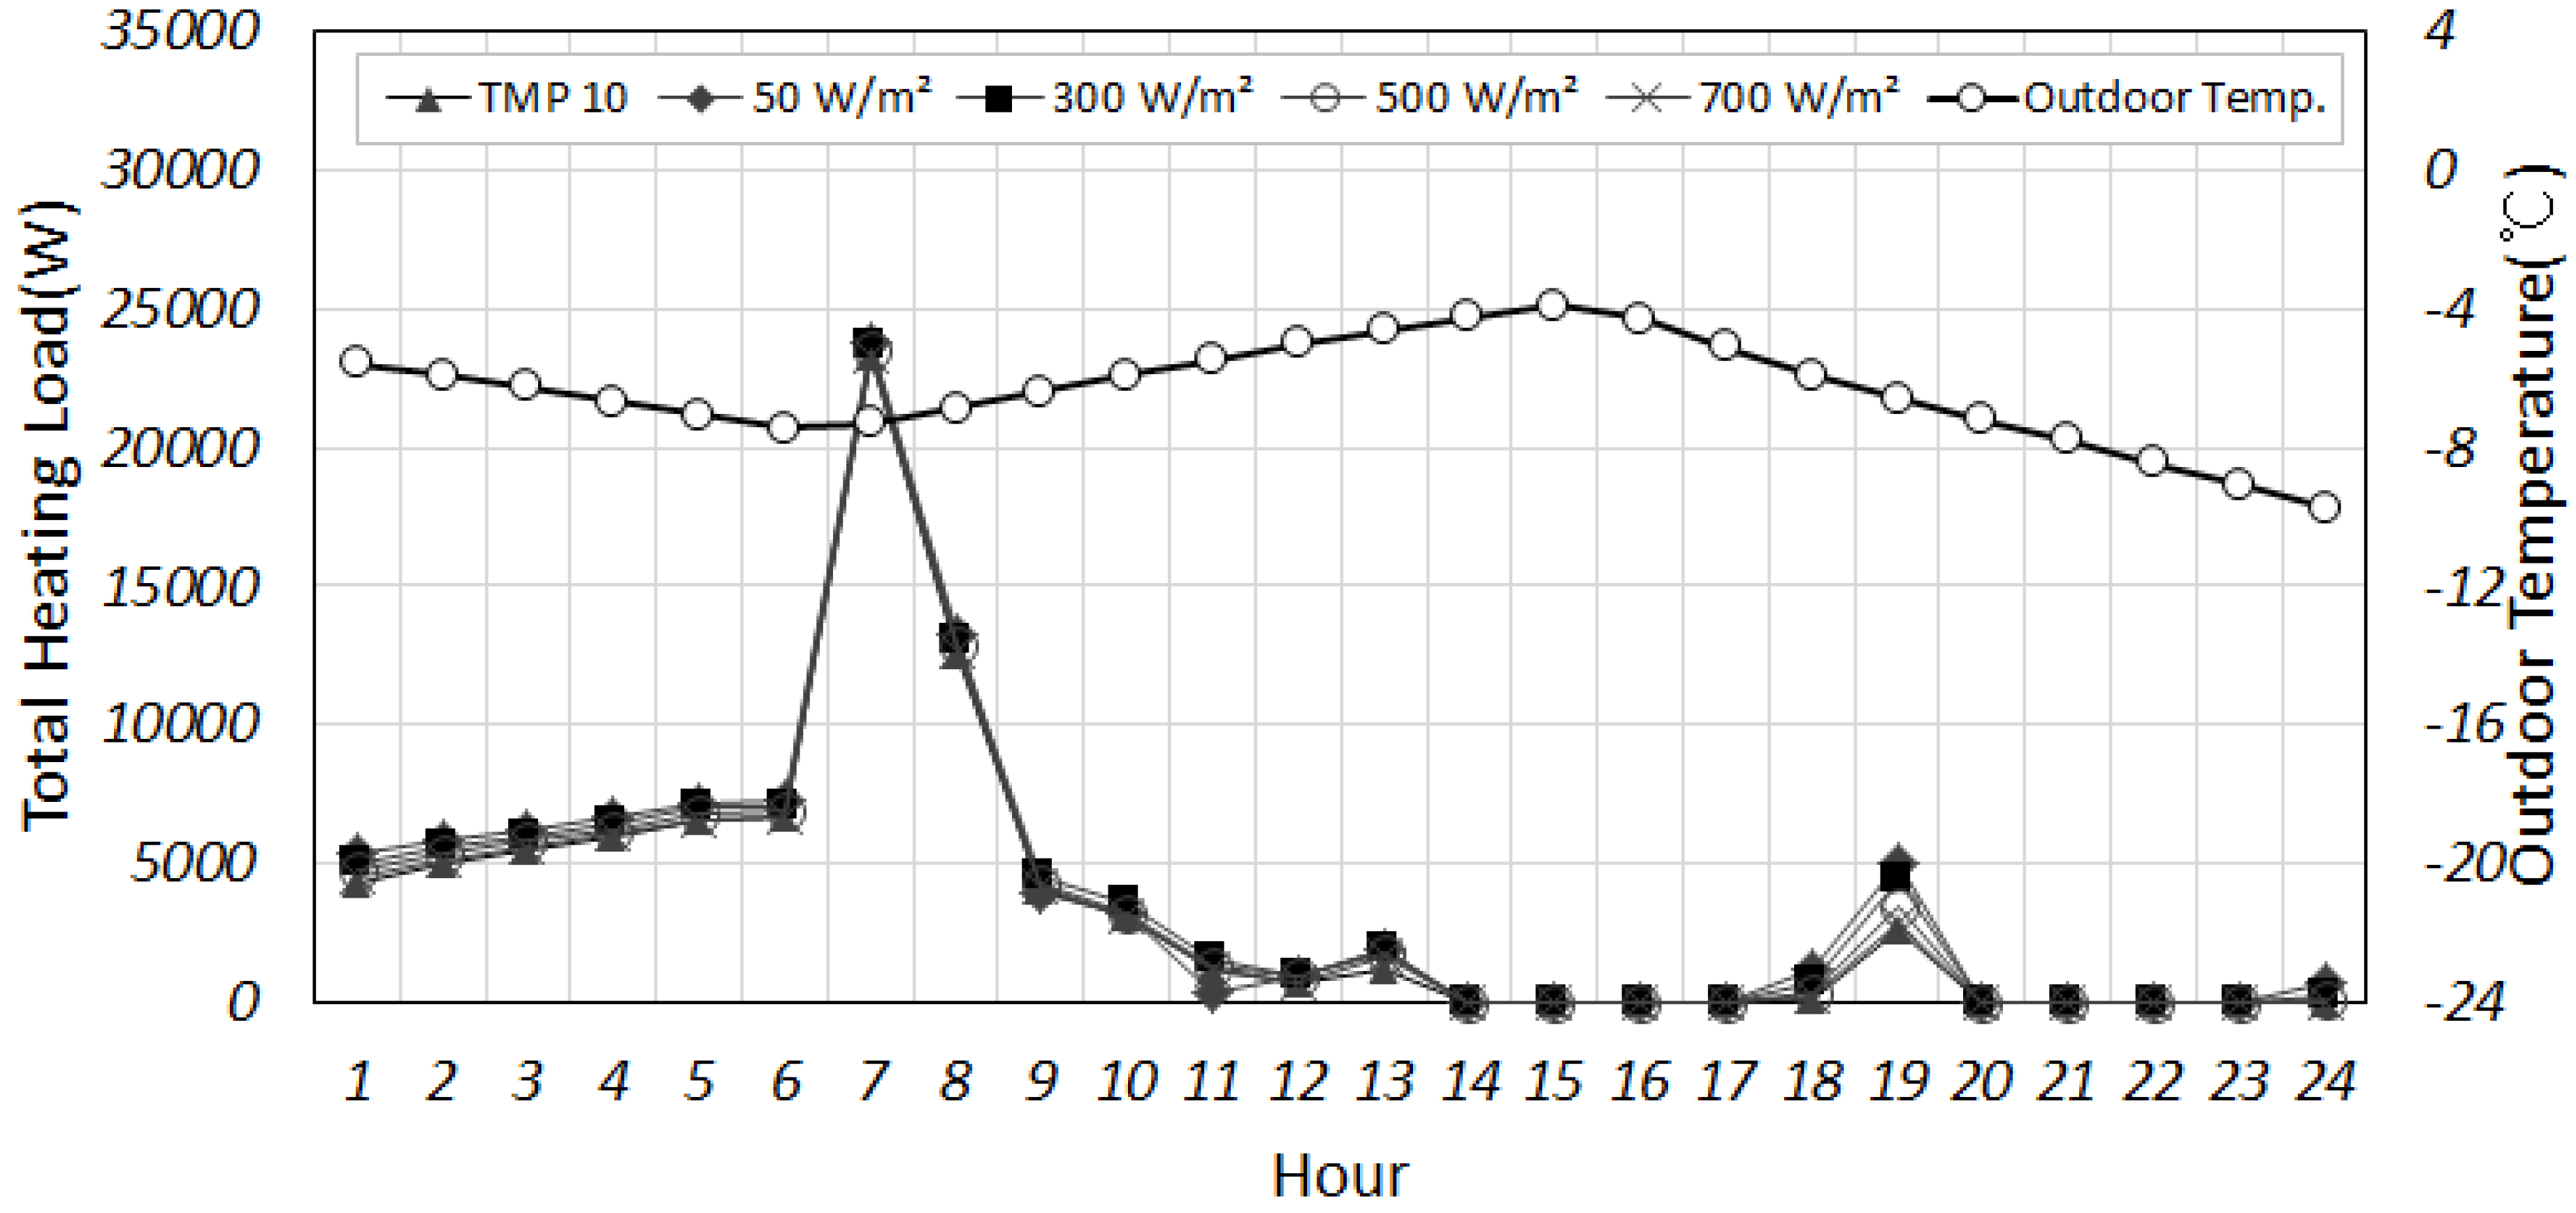
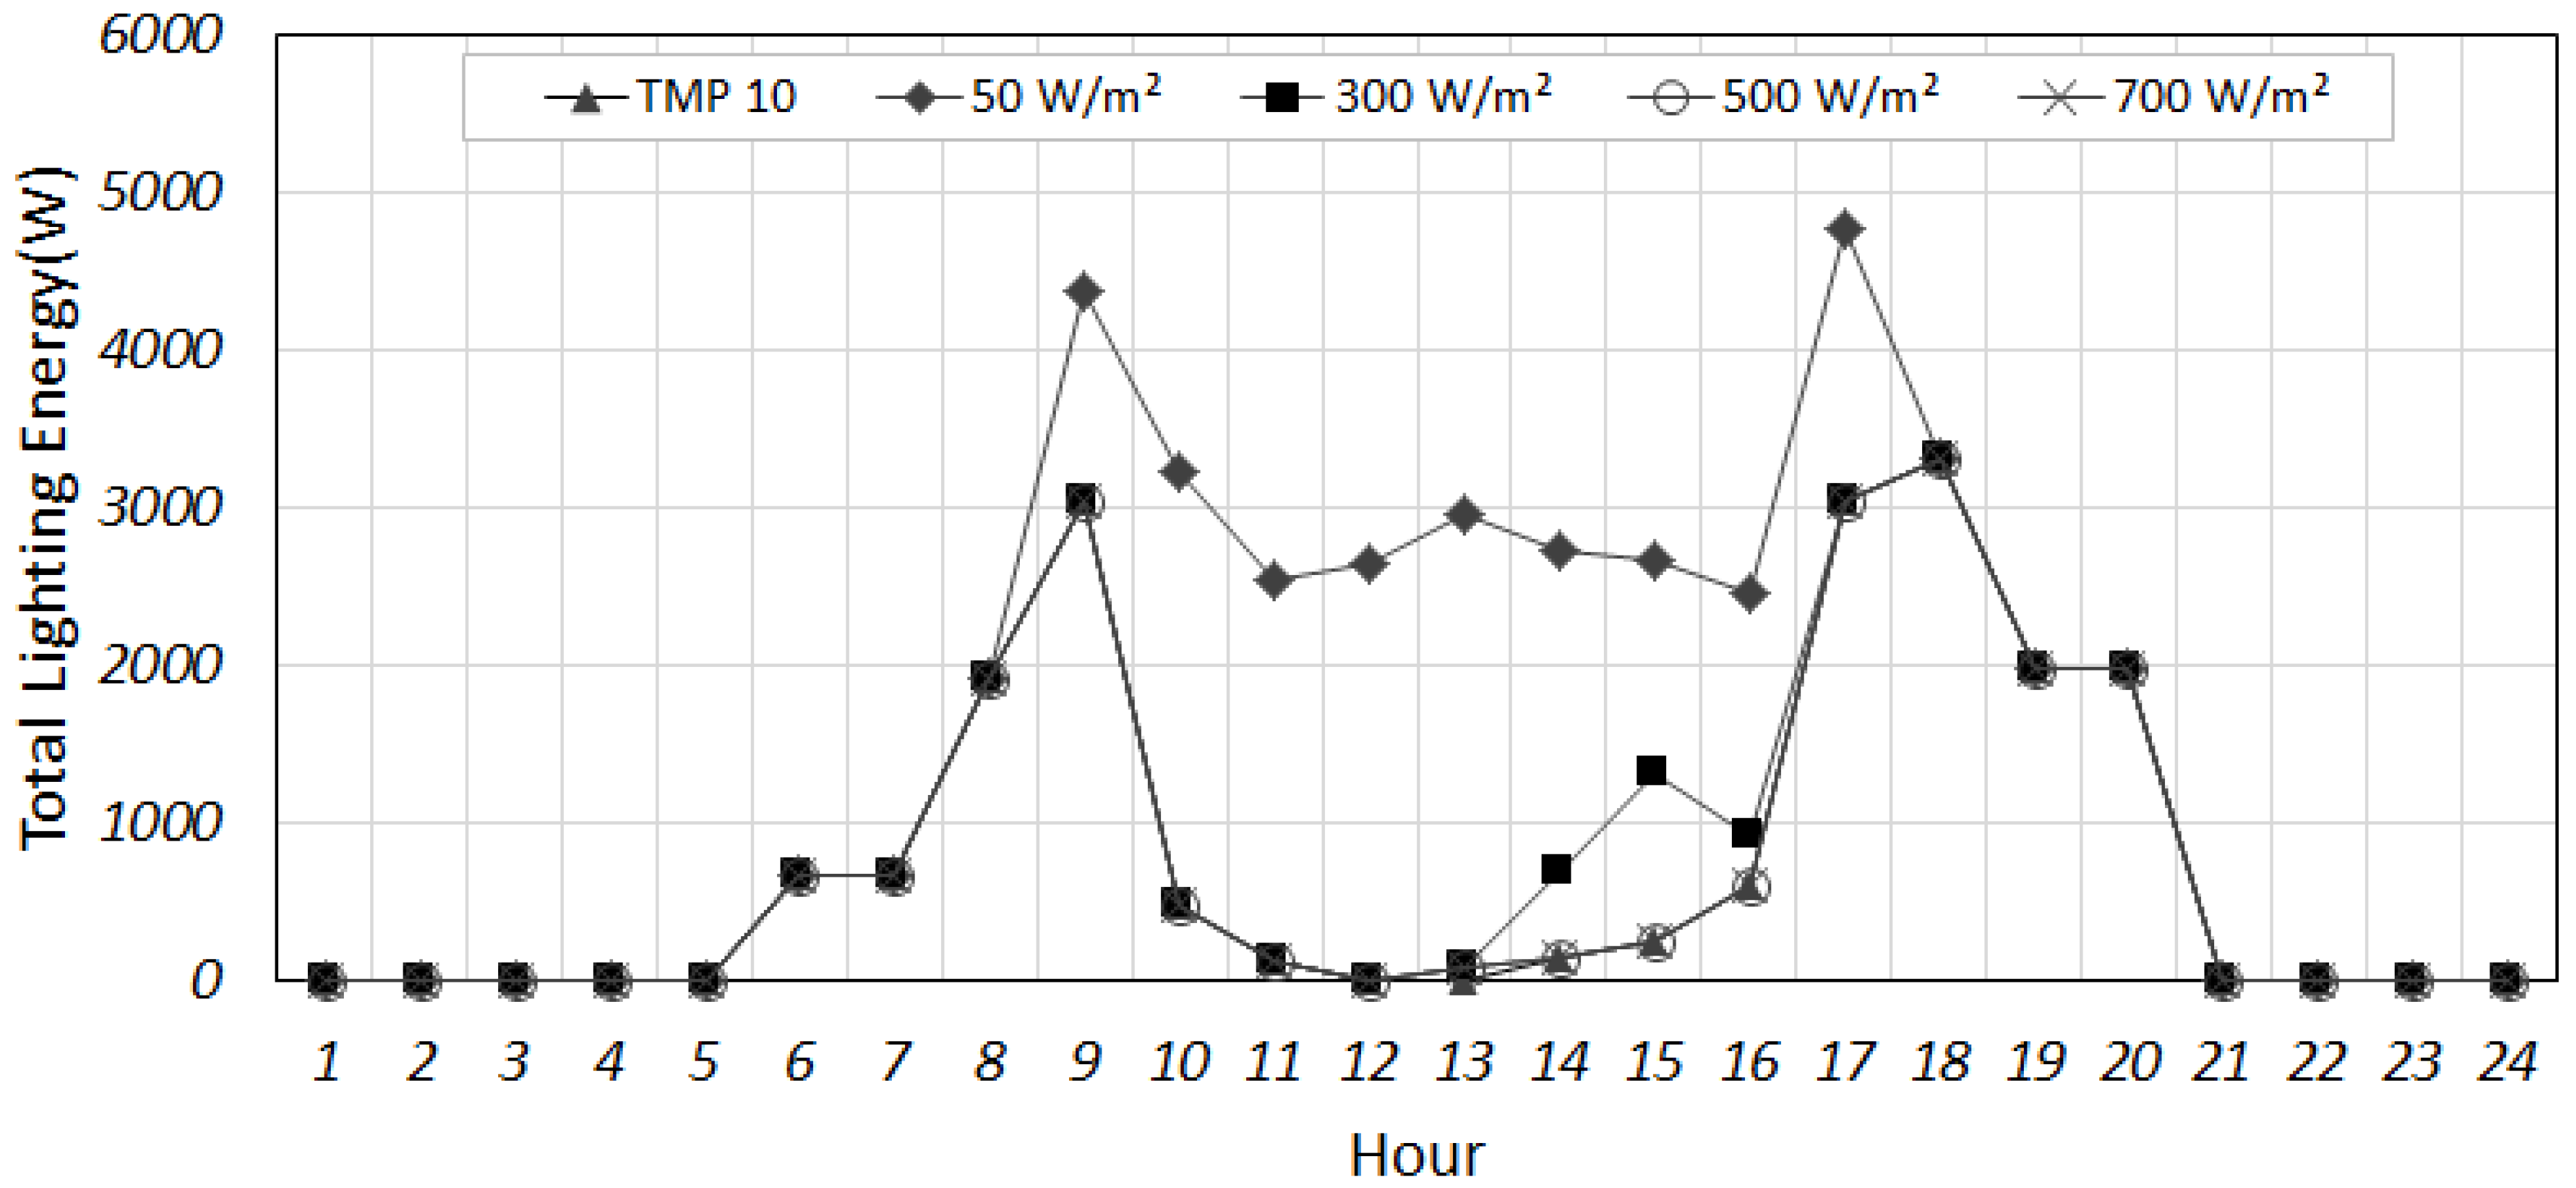
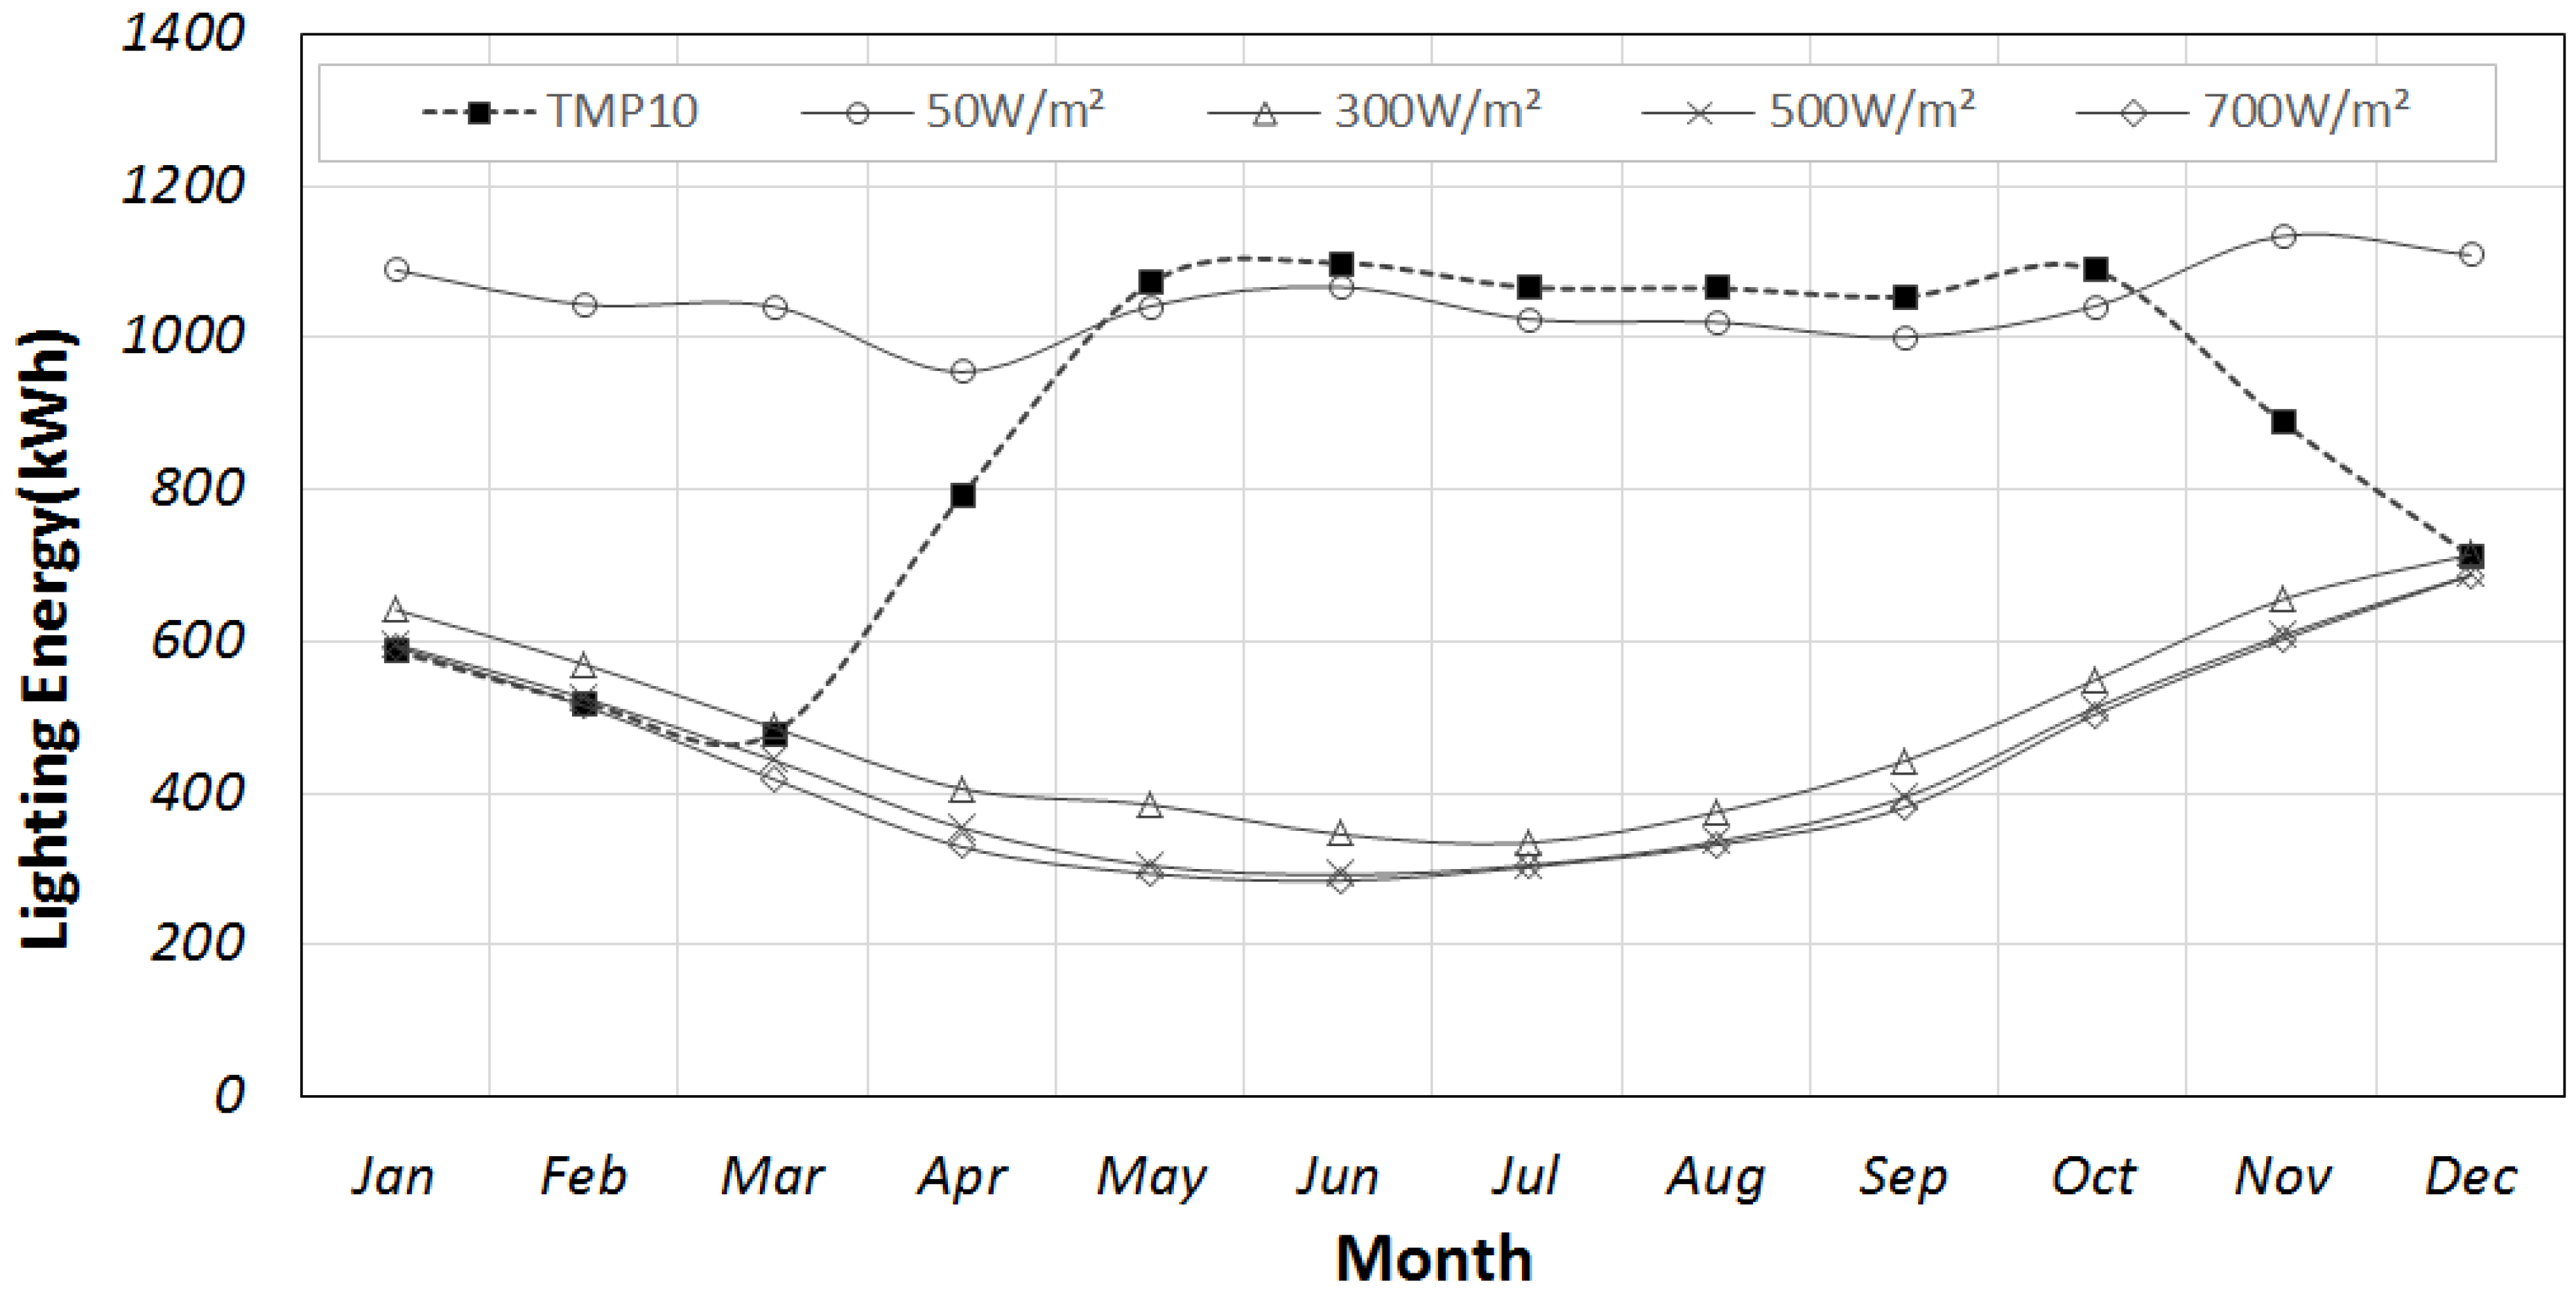
Based on the results of the data analysis of the optical characteristics, the cooling and heating load, and lighting energy consumption hourly rate during a typical day in summer and winter of an office building were evaluated according to the five transmittance control conditions. This examination showed that the temperature controlling method and 50 W/m2 solar radiation controlling method have a high rate of maintaining the colored state during the summer and were advantageous in terms of the cooling load. For the heating load, the temperature controlling method and 700 W/m2 solar radiation controlling method, which have a high rate of decolored state during winter, showed a good performance result. From the perspective of lighting energy consumption, the 500 W/m2 and 700 W/m2 solar radiation controlling methods, which have high sunlight penetration rates, were found to have the edge over others during the summer; whereas the temperature controlling method that maintains the decolored state is more advantageous during the winter. The individual characteristic and tendency towards cooling, heating, and lighting energy can be identified through an analysis of the hourly data and used as basic data when developing the control conditions for electrochromic glass’ utilization.
(3)
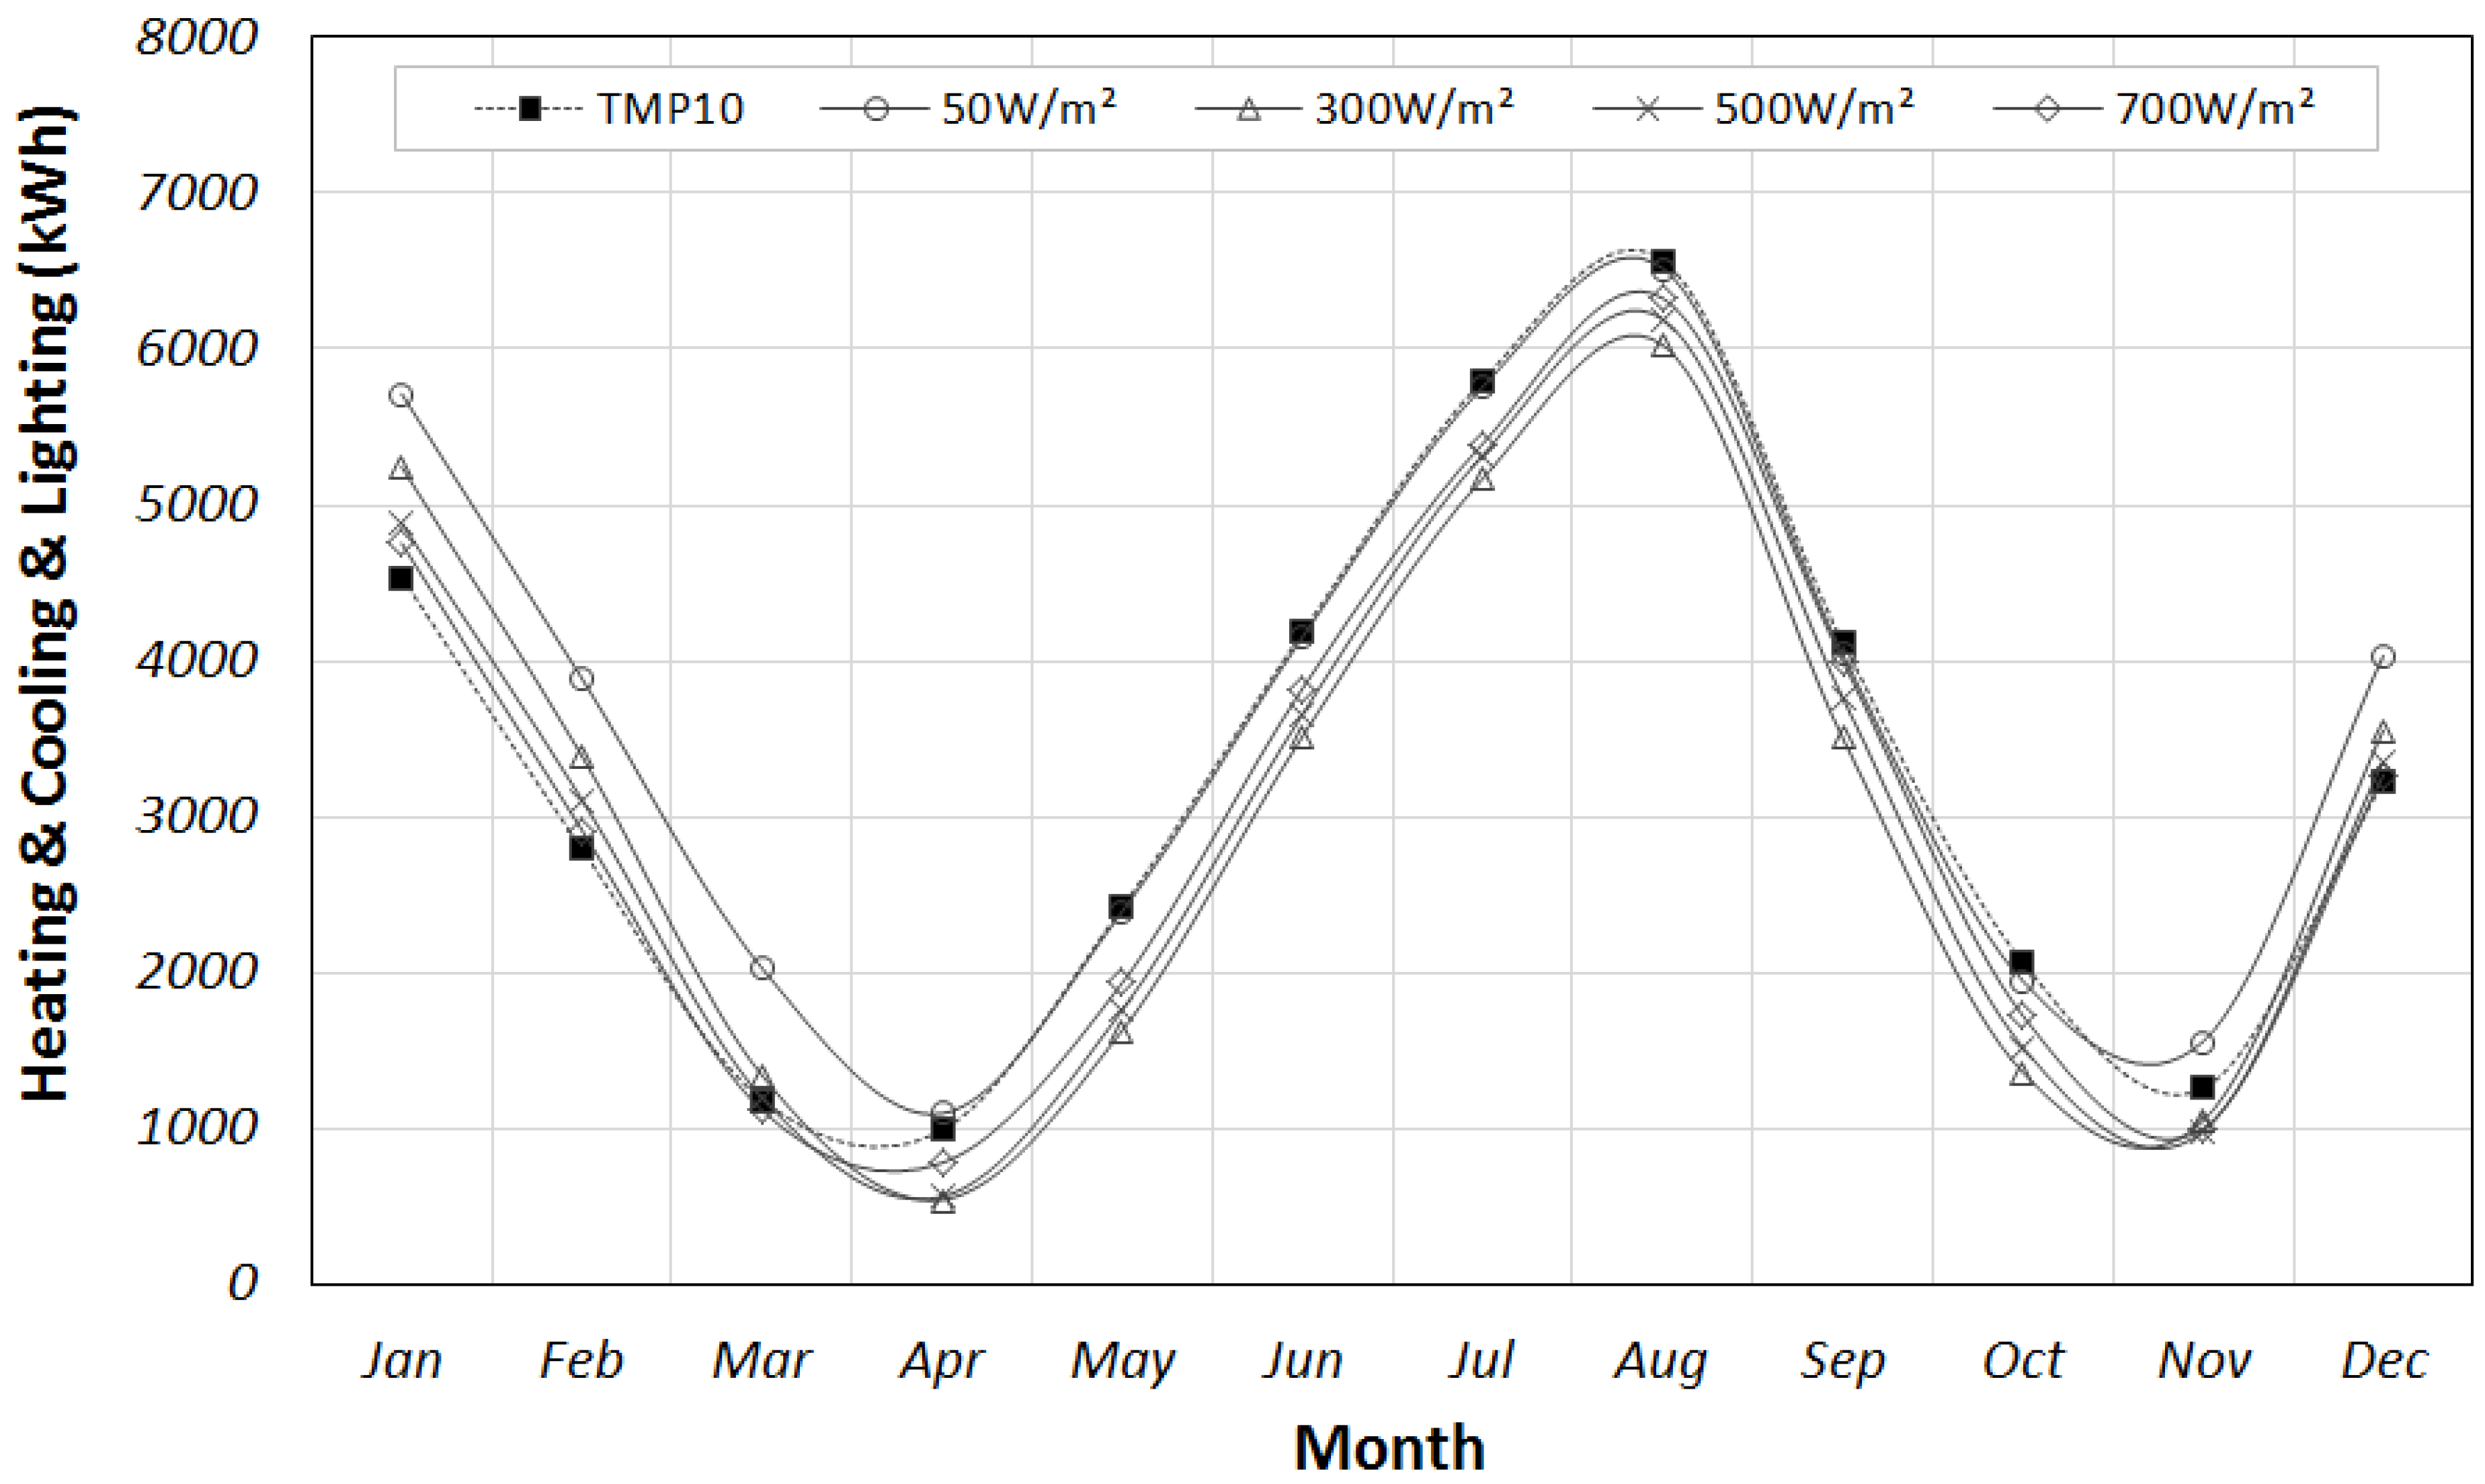
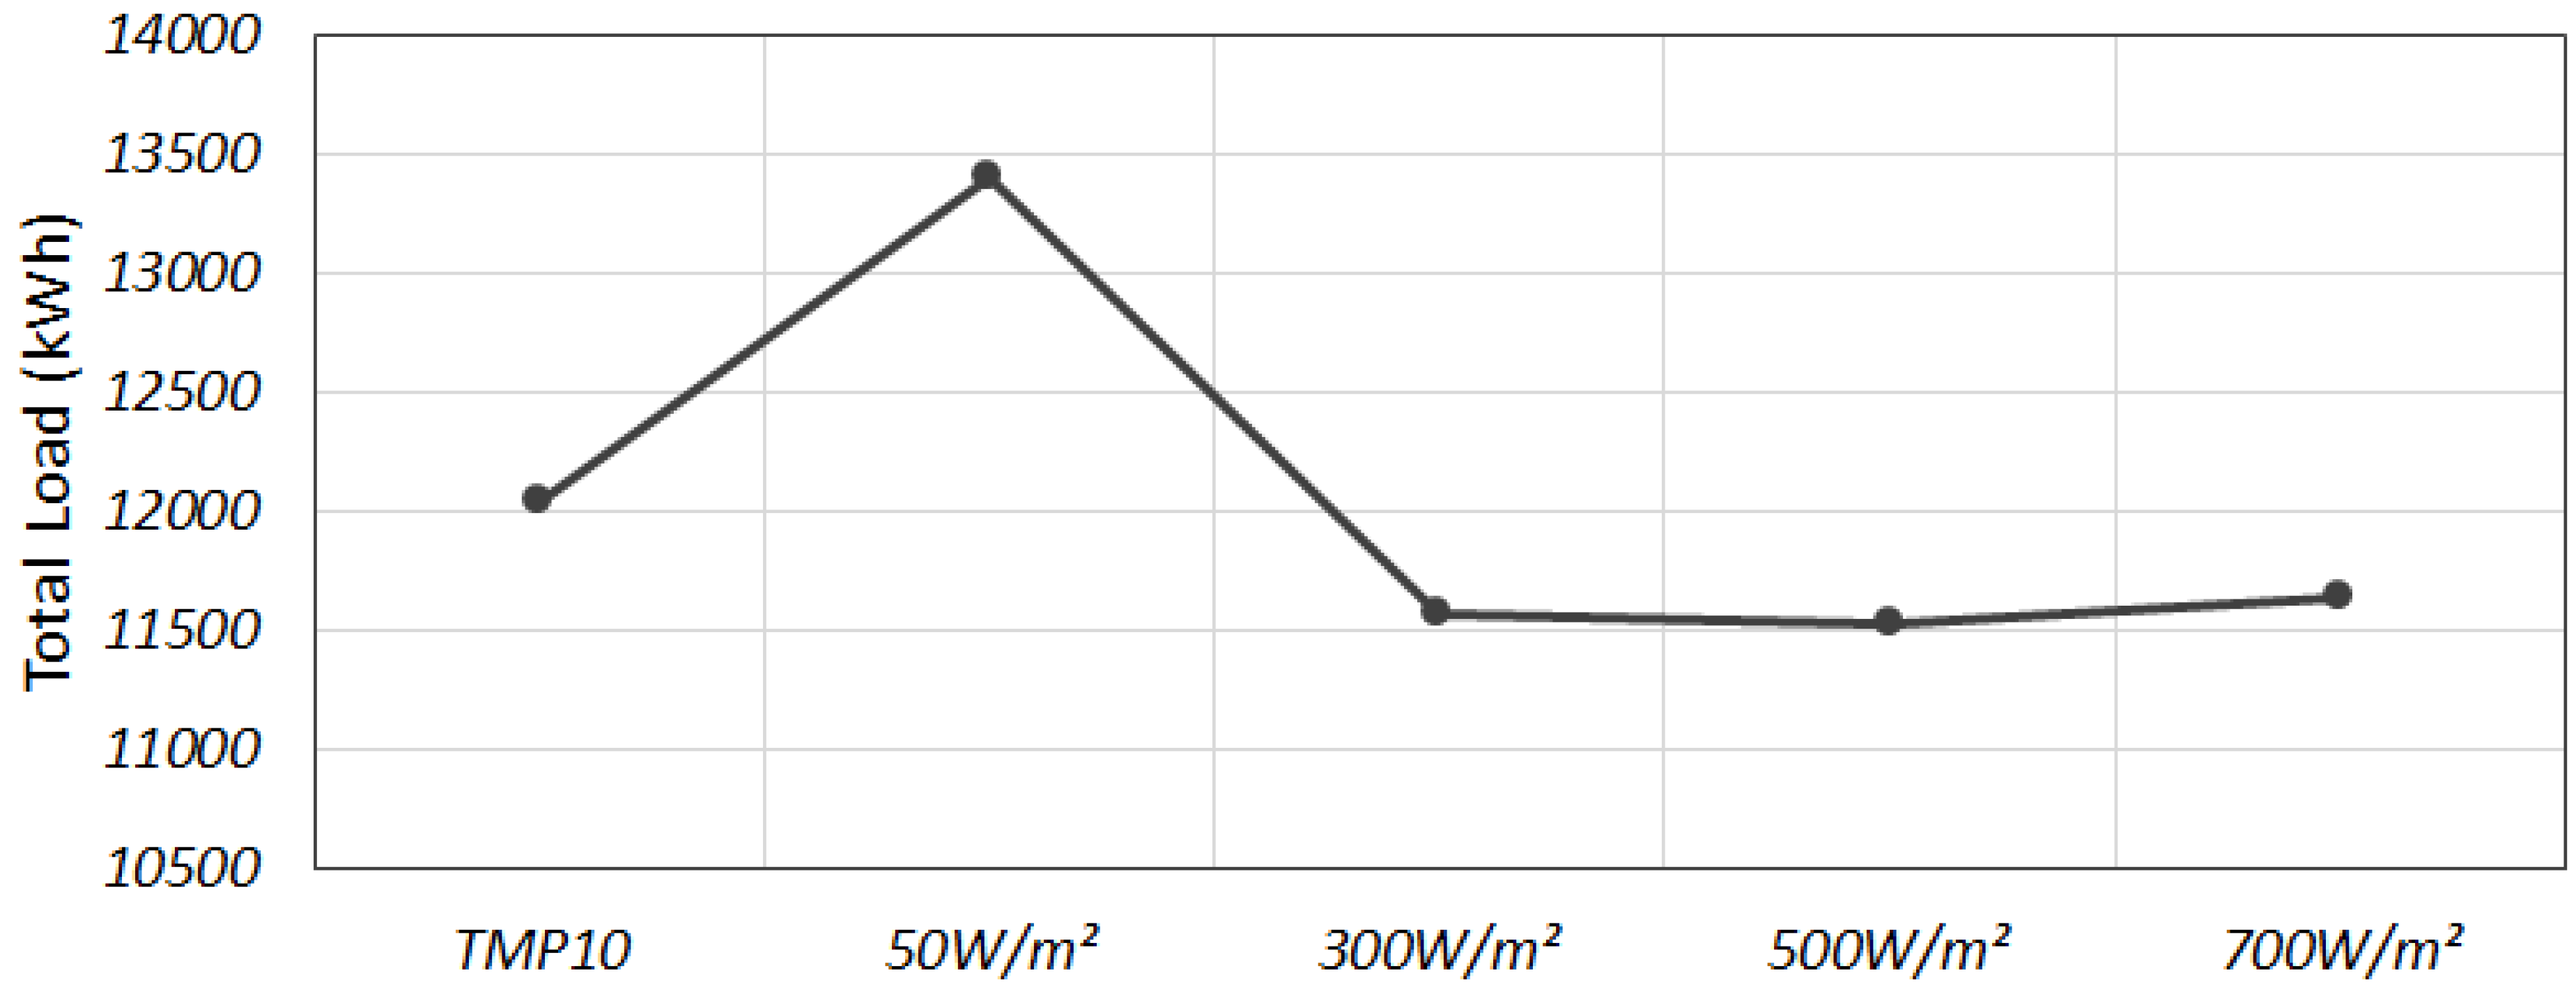
When the optimized control condition of electrochromic glass was examined from the building energy perspective by analyzing the total data of annual cooling and heating load, as well as the light energy, the controlling method that colors when solar radiation is 300 W/m2 or higher was found to be most advantageous in reducing the total energy consumption rate. This is due to the large influence of lighting energy on the total annual amount of building energy through the dimming control of the light in this study. When analyzing the annual building energy data, the difference in light energy, which takes up to 25% of the total building energy, is larger with light control (approximately 5000 kWh range) than the differences in the cooling and heating load by control conditions (approximately 2000 kWh range). Therefore, a consideration of light energy was found to be necessary in developing a strategy to control electrochromic glass.
(4)
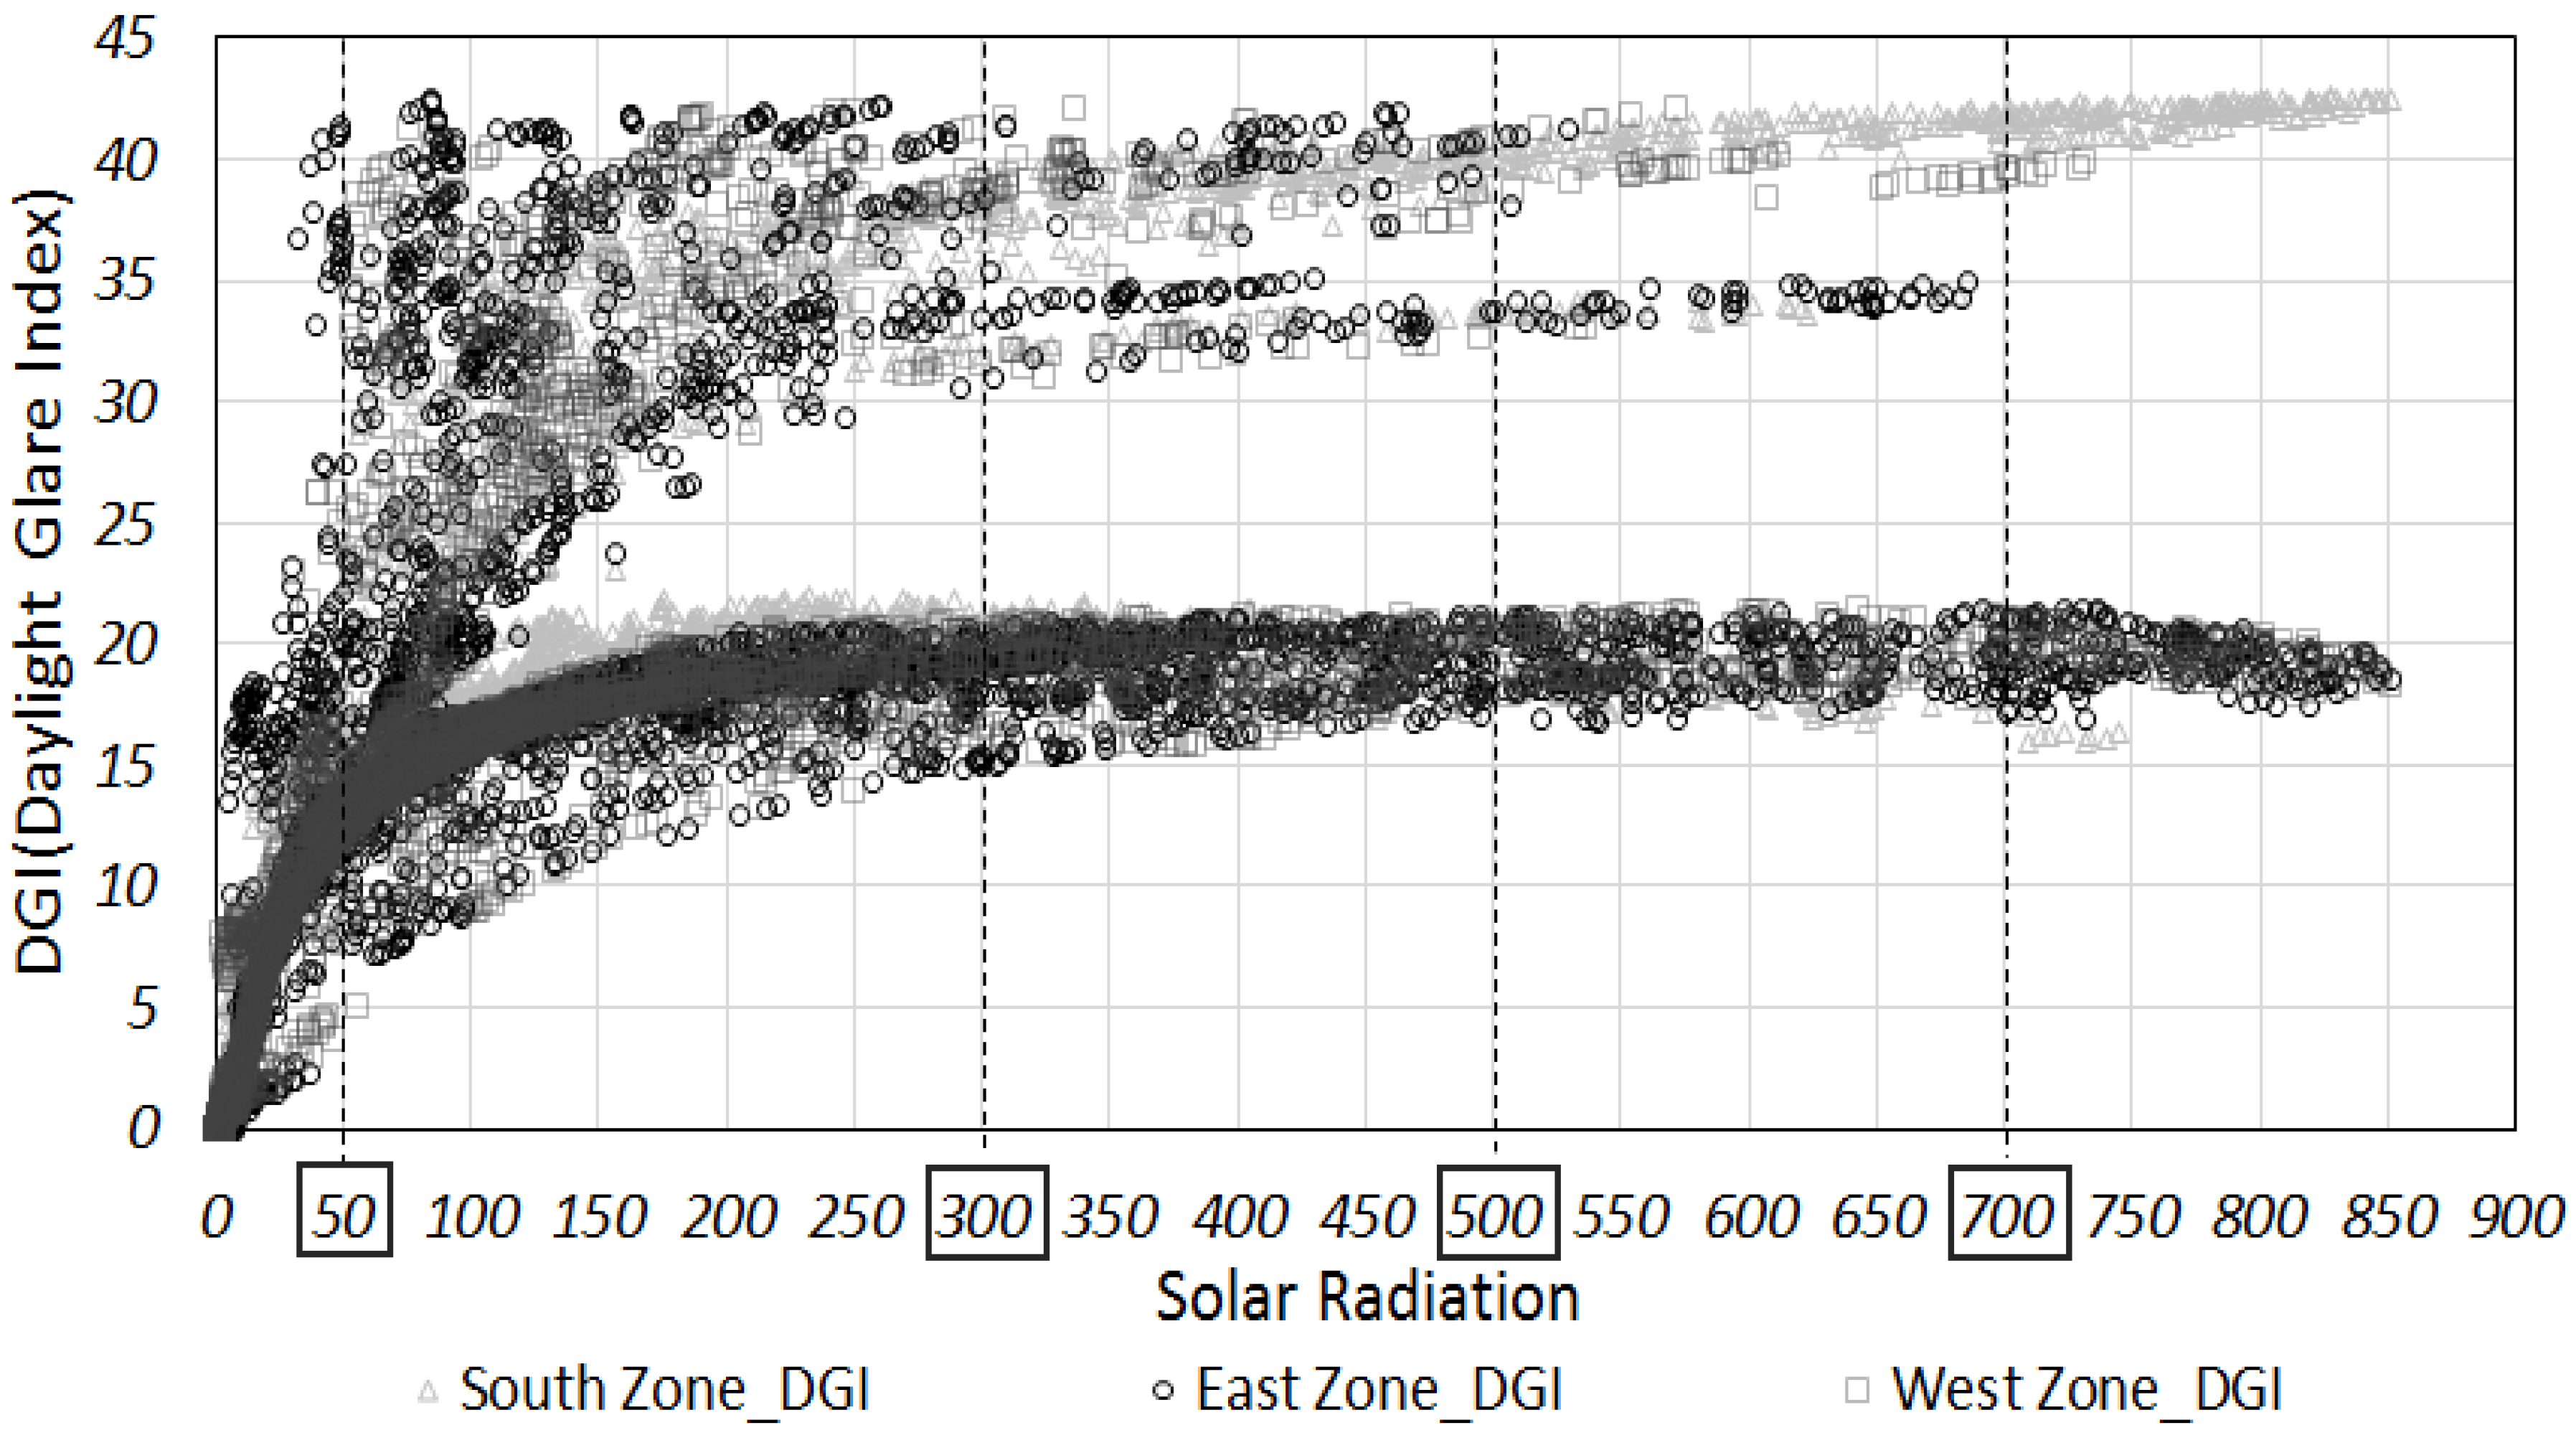
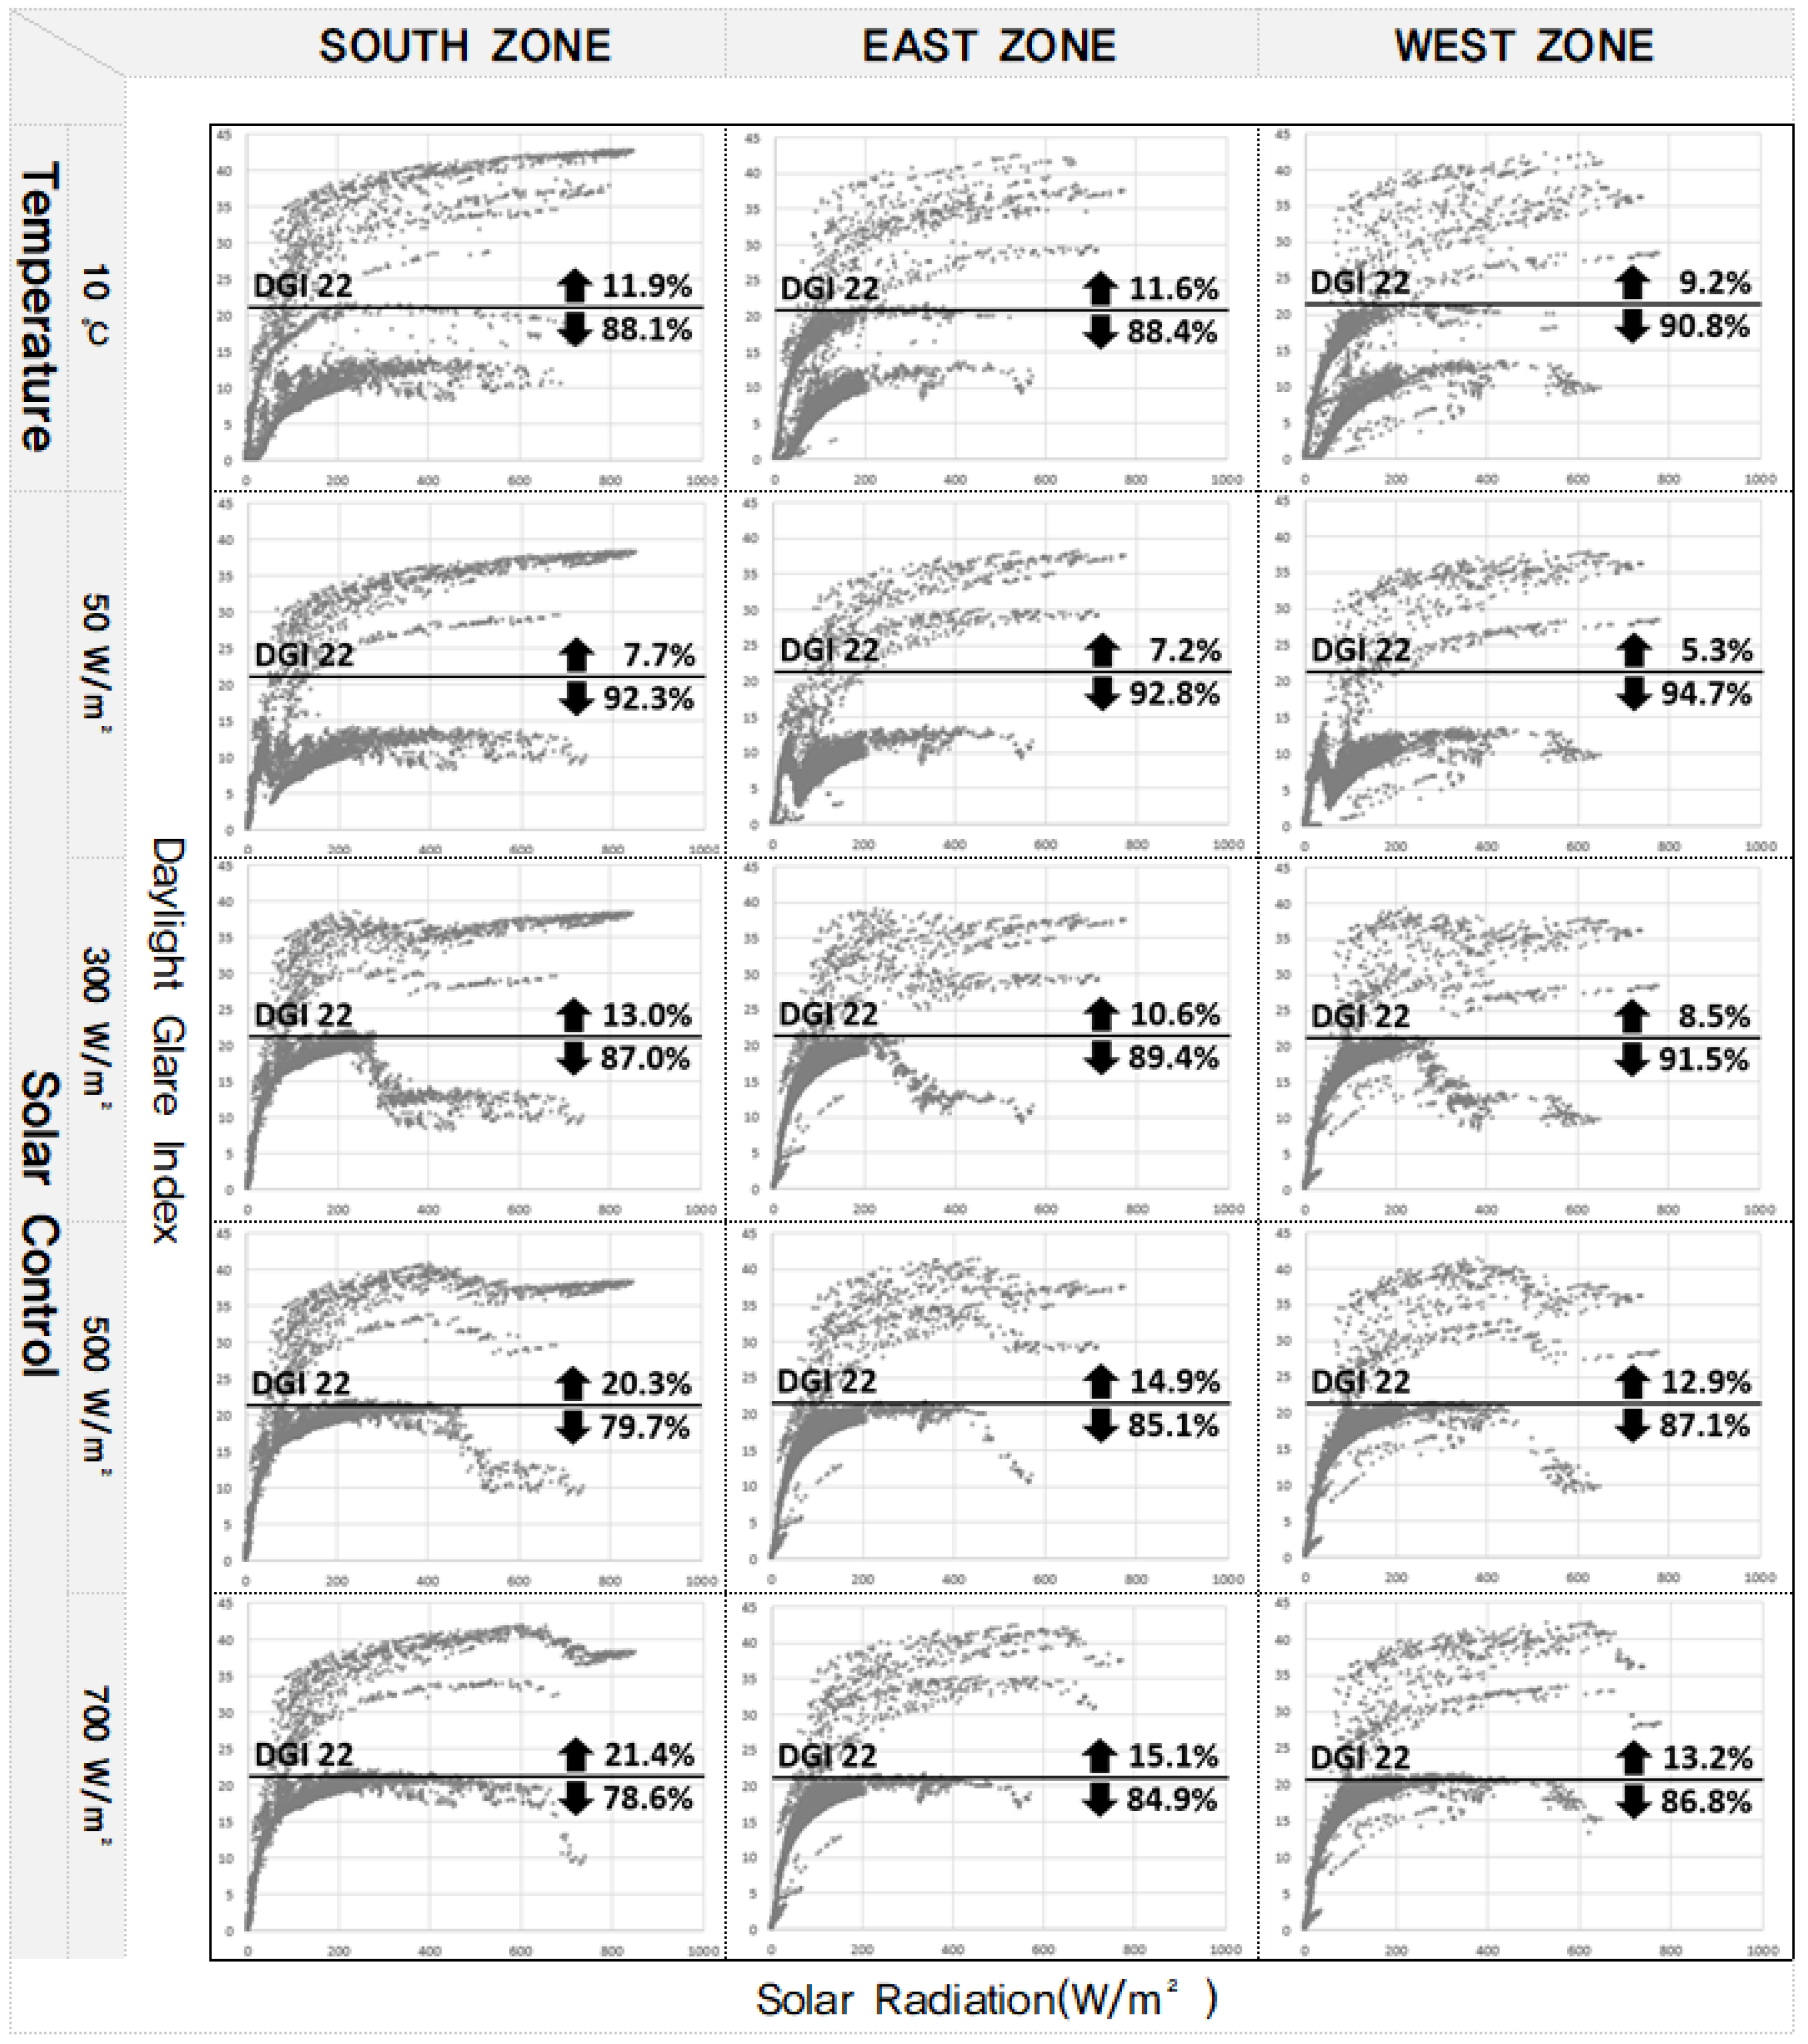
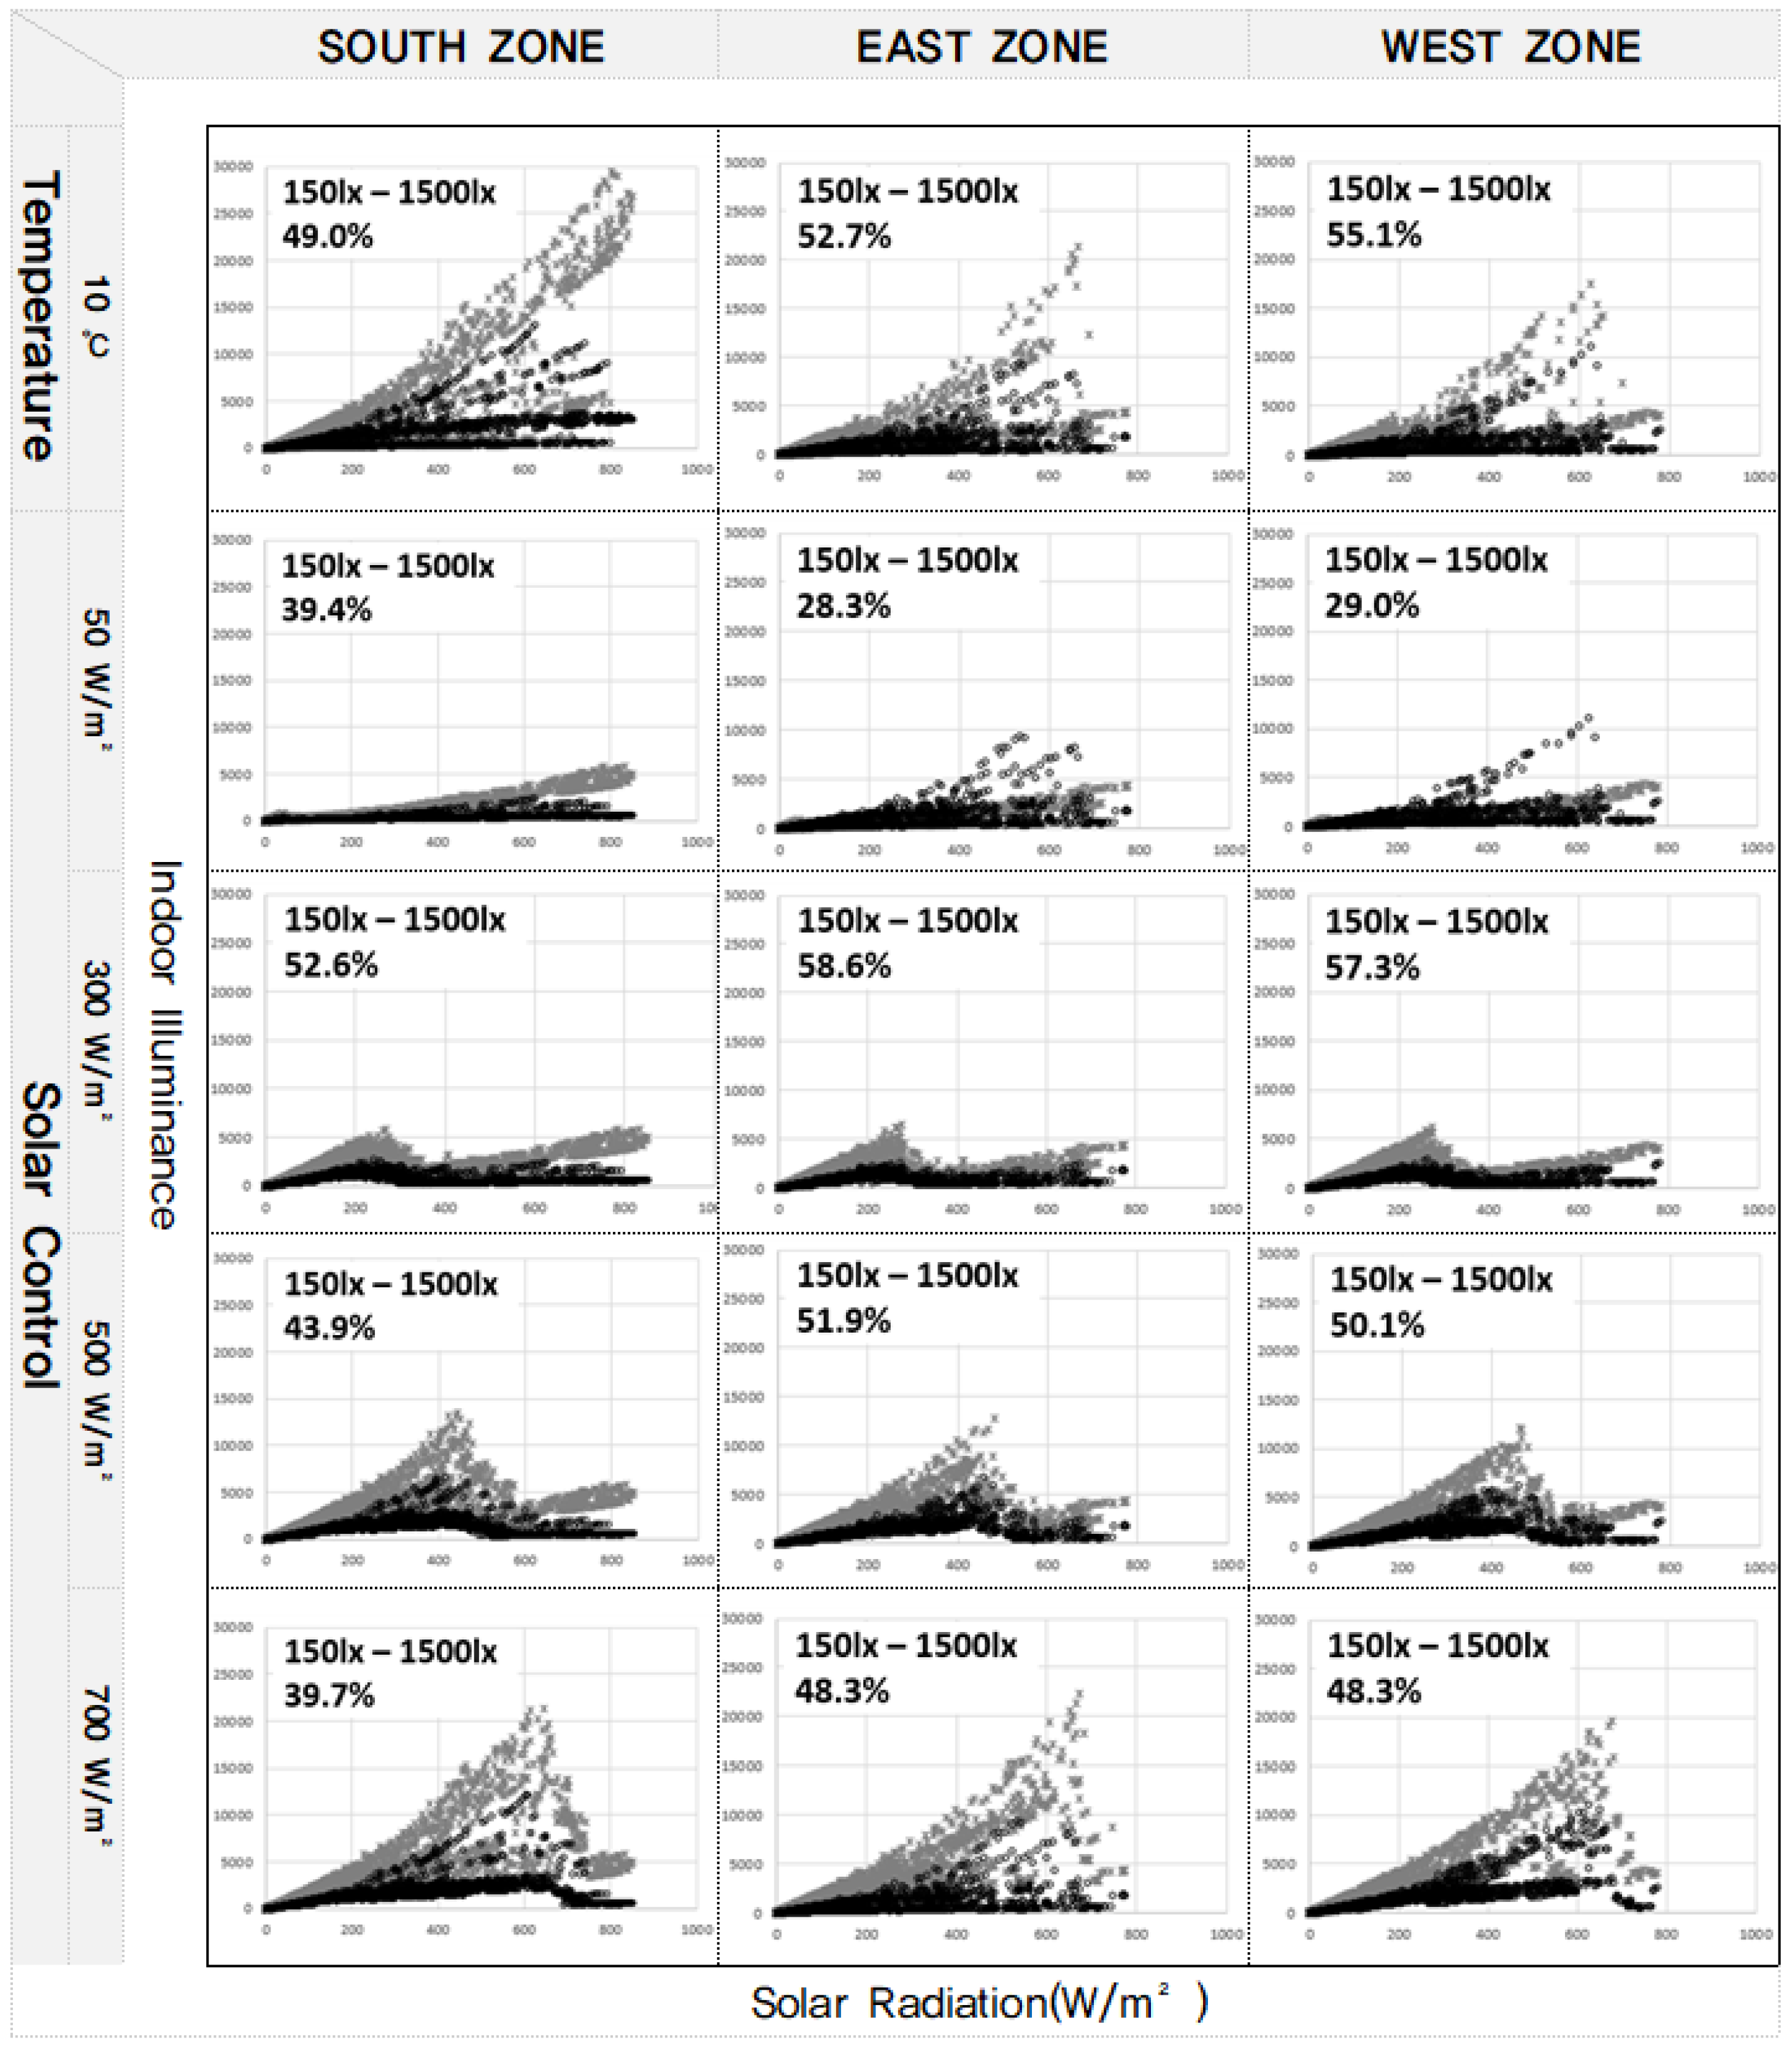
In terms of building environment, analyses of the DGI—that is, light environment performance—and the indoor illumination were conducted. In examining DGI, the 50 W/m2 solar radiation controlling condition, which has the highest maintenance rate, was found to perform the best. Furthermore, the glare ratio increased by more than 20% under the controlling condition of 500 W/m2 solar radiation, resulting in a high probability of reducing the level of user satisfaction from the building environment perspective. Moreover, the temperature controlling method maintains the decolored state during the winter, which has a low sun altitude; this was found to cause a high level of bad quality glare, thereby confirming that it is not an effective controlling method. In analyzing indoor illumination, the controlling method with the highest rate of time falling within the proper annual illumination range is found to be the 300 W/m2 solar radiation control condition. The temperature control condition had much less uniformity in annual indoor illumination, whereas the 50 W/m2 solar radiation condition showed that the indoor illumination value was much lower than the KS approved criteria. The condition of 500 W/m2 solar radiation or higher resulted in data with indoor illumination values that were too high, and is thus found to be disadvantageous from the light environment performance perspective.

6. Conclusions

In order to take both building energy and light environment performance into consideration, EDPI was used to conduct an integrated performance evaluation. EDPI is an index that evaluates the level of performance by making the real number a percentile through a comparison of the maximum and minimum values of each component of the total energy (cooling and heating load, and lighting energy), DGI, and indoor illumination. EDPI does not deduce which control condition satisfies all conditions, but identifies that with the optimal condition. The EDPI analysis indicated that the 300 W/m2 condition shows the best performance. This is because it displayed an excellent performance in the cooling and heating load, while maintaining the proper indoor illumination. With regard to DGI, however, the performance was midrange in comparison to the other conditions. As such, the performance in the overall evaluation was found to be optimal.
This study has performed an EDPI evaluation of the integrated energy and light environment performances for a specific building office when controlling the transmittance of electrochromic glass by temperature and five different solar radiation levels based on the climate data of the Incheon area in South Korea. However, this study has several limitations. First, although the climate conditions in Korea can be divided into four areas (central area 1, central area 2, southern area, Jesu-do), only the climate data of Incheon—which is within central area 2—was used. Second, since the shape of the office building was limited to that used in the model, the optimized controlling condition for electrochromic glass deduced from this study cannot be viewed as suitable for all buildings. Third, as mentioned in Section 4.4 above, the current EDPI applied in this research cannot be deemed perfect because the performance can be significantly different depending on the usage of the area or buildings. Therefore, a follow-up study on electrochromic glass needs to be conducted based on the results of this study. Such research should encompass developing the analysis model for four different climate conditions in Korea, and account for different shapes and uses of the buildings. Moreover, a study weighting the EDPI by performance evaluation, area, and building usage needs to be conducted in the future.

Author Contributions

Conceptualization, M.O. and J.P.; Methodology, M.O. and S.R.; Software, M.O.; Validation, J.P.; Formal Analysis, M.O. and S.R.; Investigation, C.L.; Resources, C.L.; Data Curation, C.L.; Writing-Original Draft Preparation, M.O.; Writing-Review & Editing, J.P. and S.R.; Visualization, J.P.; Supervision, J.P. and S.R.; Project Administration, J.P. and S.R.; Funding Acquisition, M.O.

Funding

This research funded by the Ministry of Land, Infrastructure, and Transport of the Korean government. Grant number: 18CTAP-C142184-01. This research was supported by a grant from the Technology Advancement Research Program (TARP), funded by the Ministry of Land, Infrastructure, and Transport of the Korean government. Grant number: 18CTAP-C142184-01.

Conflicts of Interest

The authors declare no conflict of interest.

References

  1. Oh, M.H.; Lee, K.H.; Yoon, J.H. Automated control strategies of inside slat-type blind considering visual comfort and building energy performance. Energy Build. 2012, 55, 728–737. [Google Scholar] [CrossRef]
  2. Ghosh, A.; Norton, B. Advances in switchable and highly insulating autonomous (self powered) glazing system for adaptive low energy buildings. Renew. Energy 2018, 126, 1003–1031. [Google Scholar] [CrossRef]
  3. Ghosh, A.; Mallick, T.K. Evaluation of colour properties due to switching behaviour of a PDLC glazing for adaptive building integration. Renew. Energy 2018, 120, 126–133. [Google Scholar] [CrossRef]
  4. Rezaei, S.D.; Shannigrahi, S.; Ramakrishna, S. A review of conventional, advanced, and smart glazing technologies and materials for improving indoor environment. Sol. Energy Mater. Sol. Cells 2017, 159, 26–51. [Google Scholar] [CrossRef]
  5. HALIO Glass, Asahi Glass Co. (AGC). Available online: https://halioglass.com (accessed on 9 June 2018).
  6. Reilly, S.; Arasteh, D.; Selkowitz, S.E. Thermal and optical analysis of switchable window glazings. Sol. Energy Mater. 1991, 22, 1–14. [Google Scholar] [CrossRef] [Green Version]
  7. Piccolo, A.; Pennisi, A.; Simone, F. Daylighting performance of an electrochomic window in a small-scale test-cell. Sol. Energy 2009, 83, 832–844. [Google Scholar] [CrossRef]
  8. Fernandes, L.L.; Lee, E.S.; Ward, G. Lighting energy savings potential of split-pane electrochromic windows controlled for daylighting with visual comfort. Energy Build. 2013, 61, 8–20. [Google Scholar] [CrossRef] [Green Version]
  9. Lee, E.S.; Yazdanian, M.; Selkowitz, S. The Energy-Savings Potential of Electrochromic Windows in the US Commercial Buildings Sector; LBNL-54966; Lawrence Berkley National Laboratory: Berkley, CA, USA, 2004. [Google Scholar]
  10. Tavares, P.F.; Gaspar, A.R.; Martins, A.G.; Frontini, F. Evaluation of electrochromic windows impact in the energy performance of buildings in Mediterranean climates. Energy Policy 2014, 67, 68–81. [Google Scholar] [CrossRef] [Green Version]
  11. Ajaji, Y.; André, P. Thermal comfort and visual comfort in an office building equipped with smart electrochromic glazing: An experimental study. Energy Proc. 2015, 78, 2464–2469. [Google Scholar] [CrossRef]
  12. Papaefthimiou, S.; Syrrakou, E.; Yianoulis, P. Energy performance assessment of an electrochromic window. Thin Solid Films 2006, 502, 257–264. [Google Scholar] [CrossRef]
  13. DeForest, N.; Shehabi, A.; Garcia, G.; Greenbalt, J.; Masanet, E.; Lee, E.S.; Selkowitz, S.; Milliron, D.J. Regional performance targets for transparent near-infrared switching electrochromic window glazings. Build. Environ. 2013, 61, 160–168. [Google Scholar] [CrossRef]
  14. Granqvist, C.G.; Bayrak Pehlivan, I.; Niklasson, G.A. Electrochromics on a roll: Web-coating and lamination for smart windows. Surf. Coat. Technol. 2017, 6–11. [Google Scholar] [CrossRef]
  15. Rottmann, M.; Kraft, A.; Heckner, K.H.; Hausler, T.; Fischer, U.; Stenzel, H. Large-area electrochromic safety glass; switching behaviour and transmission control of solar radiation. In Proceedings of the 9th International Glass Conference on Glass Processing Days, Tampere, Finland, 17–20 June 2005. [Google Scholar]
  16. Myunghwan, O.; Sungho, T.; Sangkun, H. Analysis of heating and cooling loads of electrochromic glazing in high-rise residential buildings in South Korea. Sustain. Sci. 2018, 1121. [Google Scholar] [CrossRef]
  17. Nabil, A.; Mardaljevic, J. Useful daylight illuminances: A replacement for daylight factor. Energy Build. 2006, 38, 905–913. [Google Scholar] [CrossRef]
  18. LBNL. Available online: https://windows.lbl.gov/software/optics (accessed on 9 June 2018).
  19. EnergyPlus. EnergyPlus Input Output Reference. The Encyclopedic Reference to EnergyPlus Input and Output. 2012. Available online: http://www.energyplus.gov (accessed on 9 June 2018).
  20. Winkelmann, F. Modeling Windows in EnergyPlus. In Proceedings of the 7th International IBPSA Conference, Rio di Janeiro, Brazil, 13–15 August 2001. [Google Scholar]
  21. Arasteh, D.K.; Reilly, M.S.; Rubin, M.D. A versatile procedure for calculating heat transfer through windows, American Society of Heating, Refrigeration and Air-Conditioning Engineers. ASHRAE Trans. 1989, 95, 755–765. [Google Scholar]
  22. Finlayson, E.U.; Arasteh, D.K.; Huizenga, C.; Rubin, M.D.; Reilly, M.S. WINDOW 4.0: Documentation of Calculation Procedures; LBNL-33943; Lawrence Berkeley National Laboratory: Berkley, CA, USA, 1993. [Google Scholar]
  23. Arasteh, D.K.; Kohler, J.C.; Griffith, B.T. Draft, Modeling Windows in EnergyPlus with Only U, SHGC, and Optionally VT; LBNL-54966; Lawrence Berkeley National Laboratory: Berkley, CA, USA, 2009. [Google Scholar]
  24. Winkelmann, F.; Selkowitz, S. Day-lighting simulation in DOE-2: Theory, validation and applications. In Proceedings of the Building Energy Simulation Conference, Seattle, WA, USA, 21–22 August 1985. [Google Scholar]
  25. Lomanowski, B.A.; Wright, J.L. Modeling fenestration with shading devices in building energy simulation: A practical approach. In Proceedings of the 11th International IBPSA Conference, Glasgow, UK, 27–30 July 2009. [Google Scholar]
  26. Chantrasrisalai, C.; Fisher, D.E. Comparative analysis of one-dimensional slat type blind models. In Proceedings of the SimBuild 2004, Boulder, CO, USA, 4–6 August 2004. [Google Scholar]
  27. LBNL. Available online: https://windows.lbl.gov/software/window (accessed on 9 June 2018).
  28. The Korean Ministry of Land, Transport and Maritime Affairs, Standard for Energy Saving Design in Buildings. 2017. Available online: http://www.molit.go.kr (accessed on 9 June 2018).
  29. EnergyPlus, EnergyPlus Engineering Reference. The Reference to EnergyPlus Calculations. 2012. Available online: http://www.energyplus.gov (accessed on 9 June 2018).
  30. ASHRAE Fundamentals Handbook; American Society of Heating, Refrigerating and Air-Conditioning Engineers, Inc.: Atlanta, GA, USA, 2009.
  31. Hopkinson, R.G. Glare from daylighting in buildings. Appl. Ergon. 1972, 206–215. [Google Scholar] [CrossRef]
  32. KSCI. Available online: https://standard.go.kr/ (accessed on 9 June 2018).
Figure 1. Research guideline and flowchart.
Energies 11 02205 g001
Figure 2. Composition of electrochromic glass.
Energies 11 02205 g002
Figure 3. Producing, voltage permission, and spectrum analysis experiment process of the electrochromic glass.
Energies 11 02205 g003
Figure 4. The average spectral data of electrochromic (EC) glass.
Energies 11 02205 g004
Figure 5. (a) Floor plan of the EnergyPlus Simulation Model; (b) location of the daylight sensor.
Energies 11 02205 g005
Figure 6. Scatterplot of cooling and heating load by outdoor temperature.
Energies 11 02205 g006
Figure 7. DGI scatterplot of solar radiation on a glass surface.
Energies 11 02205 g007
Figure 8. Cooling load of electrochromic glass on a typical summer day by controlling conditions.
Energies 11 02205 g008
Figure 9. Lighting energy consumption of electrochromic glass on a typical summer day by controlling condition.
Energies 11 02205 g009
Figure 10. Heating load of electrochromic glass on a typical winter day by controlling conditions.
Energies 11 02205 g010
Figure 11. Lighting energy consumption of electrochromic glass on a typical winter day by controlling condition.
Energies 11 02205 g011
Figure 12. Electrochromic glass’ controlling conditions and monthly energy consumption rate.
Energies 11 02205 g012
Figure 13. Electrochromic glass’ controlling conditions and annual energy consumption rate.
Energies 11 02205 g013
Figure 14. Monthly lighting energy consumption by electrochromic glass’ controlling conditions.
Energies 11 02205 g014
Figure 15. Analysis result of annual DGI by electrochromic glass’ controlling conditions.
Energies 11 02205 g015
Figure 16. Analysis result of proper indoor illuminance over a year by control conditions of electrochromic glass.
Energies 11 02205 g016
Figure 17. Result of calculating the optimized control condition with a consideration of energy and light environment.
Energies 11 02205 g017
Table 1. The average spectral data of electrochromic (EC) glass.
DivisionEC Glass (Bleached)EC Glass (Colored)
Thickness (mm)33
Solar Transmittancefront0.4810.065
back0.4810.065
Solar Reflectancefront0.2140.181
back0.1900.168
Visible Transmittancefront0.6480.120
back0.6480.120
Visible Reflectancefront0.1280.074
back0.1110.062
Table 2. Composition of the simulation base model 1.
DivisionMaterialsThermal & Optical Properties
Exterior Wall200 mm concrete
155 t insulation
19 mm gypsum board
U-value
0.202 W/m2 K
Exterior Floor105 mm insulation
200 mm concrete
U-value
0.291 W/m2 K
Exterior Roof100 mm concrete
220 mm insulation
Ceiling air space
Acoustic tile
U-value
0.136 W/m2 K
Glazing44 mm Triple glazing
(8 mm Electrochromic + 12 air + 6 mm clear glass + 12 mm air + 6 mm low-e glass)
BleachedColored
SHGC 0.357
Tvis 0.463
U-value 1.192
SHGC 0.107
Tvis 0.085
U-value 1.192
1 SHGC: solar heat gain coefficient.
Table 3. Performance expected for each condition to control electrochromic glass.
Condition for Controlling ECConsideration Factor
Temperature/Solar RadiationGlare ReductionHeating Load ReductionCooling Load ReductionLighting Energy Reduction
10 °C
50 W/m2
300 W/m2
500 W/m2
700 W/m2
●: Excellent ◎: Normal △: Weak
Table 4. Cooling load of electrochromic glass on a typical summer day by controlling conditions.
Heating Load (kWh)TMP 1050 W/m2300 W/m2500 W/m2700 W/m2
South Zone7.211.515.520.722.0
East Zone20.120.225.529.539.6
West Zone16.116.219.724.134.3
Total Heating Load47.648.060.774.395.9
Table 5. Lighting energy consumption of electrochromic glass on a typical summer day by controlling condition.
Lighting Energy (kWh)TMP 1050 W/m2300 W/m2500 W/m2700 W/m2
South Zone11.511.24.91.01.0
East Zone8.18.03.01.81.2
West Zone11.011.02.31.81.3
Total Lighting Energy30.530.010.24.63.5
Table 6. Heating load of electrochromic glass on a typical winter day by controlling conditions.
Heating Load (kWh)TMP 1050 W/m2300 W/m2500 W/m2700 W/m2
South Zone22.327.226.825.223.1
East Zone28.631.630.929.829.2
West Zone31.634.233.932.732.1
Total Heating Load82.593.091.687.784.5
Table 7. Lighting energy consumption of electrochromic glass on a typical winter day by controlling condition.
Lighting Energy (kWh)TMP 1050 W/m2300 W/m2500 W/m2700 W/m2
South Zone5.27.85.65.35.3
East Zone6.815.86.86.86.8
West Zone6.315.37.96.36.3
Total Lighting Energy18.339.020.318.418.4
Table 8. Performance of the cooling and heating load, and lighting energy, by controlling electrochromic glass.
Temperature/Solar RadiationConsideration Factor
Heating Load ReductionCooling Load ReductionLighting Energy Reduction
Cooling PeriodHeating Period
10 °C
50 W/m2
300 W/m2
500 W/m2
700 W/m2
●: Excellent ◎: Normal △: Weak
Table 9. Electrochromic glass’ controlling conditions and monthly energy consumption rate.
MonthTMP 1050 W/m2300W/m2500 W/m2700 W/m2
Cooling Period (kWh)April991.51097.5543.7564.4780.3
May2422.22394.91630.61761.71936.9
June4184.44152.33514.83658.03822.7
July5799.75757.05169.65319.25393.9
August6570.26519.36026.46193.16327.2
September4118.54040.93505.43762.23999.8
October2065.21947.01360.01520.31723.7
Total26,151.625,908.821,750.422,778.923,984.5
Heating Period (kWh)November1258.31559.41050.3982.11002.3
December3224.84032.03555.33353.93268.9
January4539.35712.95245.74884.24754.4
February2794.63888.13391.03111.32914.7
March1185.42029.71341.91200.01118.6
Total13,002.517,222.014,584.213,531.613,058.9
Table 10. Electrochromic glass’ controlling conditions and annual energy consumption rate.
Energy Consumption (kWh)TMP 1050 W/m2300 W/m2500 W/m2700 W/m2
Heating Load9777.411,928.111,573.210,689.510,192.9
Cooling Load19,152.418,909.718,988.420,379.321,725.8
Lighting Energy10,224.312,293.05773.15241.75124.7
Total Load & Energy39,154.143,130.836,334.736,310.537,043.4
Table 11. Integrated performance evaluation of energy and light environment by using the EDPI.
Temp/Solar RadiationElement (i)TotalAverage
Heating, Cooling, & Lighting (kWh)DGI over 22LUX 150 lx–1500 lx
Raw Data (j)10 °C39,154.189.1%52.3%
50 W/m243,130.893.3%32.3%
300 W/m236,334.789.3%56.2%
500 W/m236,310.584.0%48.6%
700 W/m237,043.483.4%45.4%
EDPI10 °C58.357.683.7199.666.5
50 W/m20.0100.00.0100.033.3
300 W/m299.659.6100.0259.286.4
500 W/m2100.06.168.2174.358.1
700 W/m289.30.054.8144.148.0

