Practical Analysis and Design of a Battery Management System for a Grid-Connected DC Microgrid for the Reduction of the Tariff Cost and Battery Life Maximization


Abstract
:1. Introduction
2. Overview of Battery Management System in MGs
- Battery monitoring: This subsystem includes voltage, current, impedance and temperature measurements. The monitoring allows for calculating the battery parameters: SOC, SOL, DOD and State of Health (SOH), yielding an estimation of the battery model. The SOH represents an estimation of the capacity of the battery to store and deliver energy, compared with a new battery [43]. The SOL is similar to the SOH. However, the SOL is defined in literature as the remaining time until the battery needs to be replaced [11]. It is possible to estimate the SOL, saving the data corresponding to the DOD values and the temperatures at which the batteries have been exposed [44]. The BMS of this paper uses the SOH concept. In order to estimate the SOH of the batteries, some studies [35] consider the following expression: SOH (%) = (QMAX/QRated) 100%; where QRated is the rated capacity and QMAX is the maximum releasable capacity when the battery is fully charged, which will decline with the used time.
- Battery protection: Protection can be implemented in both the hardware and the software. This includes protection and diagnosis in the following situations: high temperature, overcharge, overcurrent and the communication loss with the system.
- Battery control: This subsystem is responsible for the battery charging procedure. Its goal is to extend the service time of batteries and to allow for a proper energy management in the system.
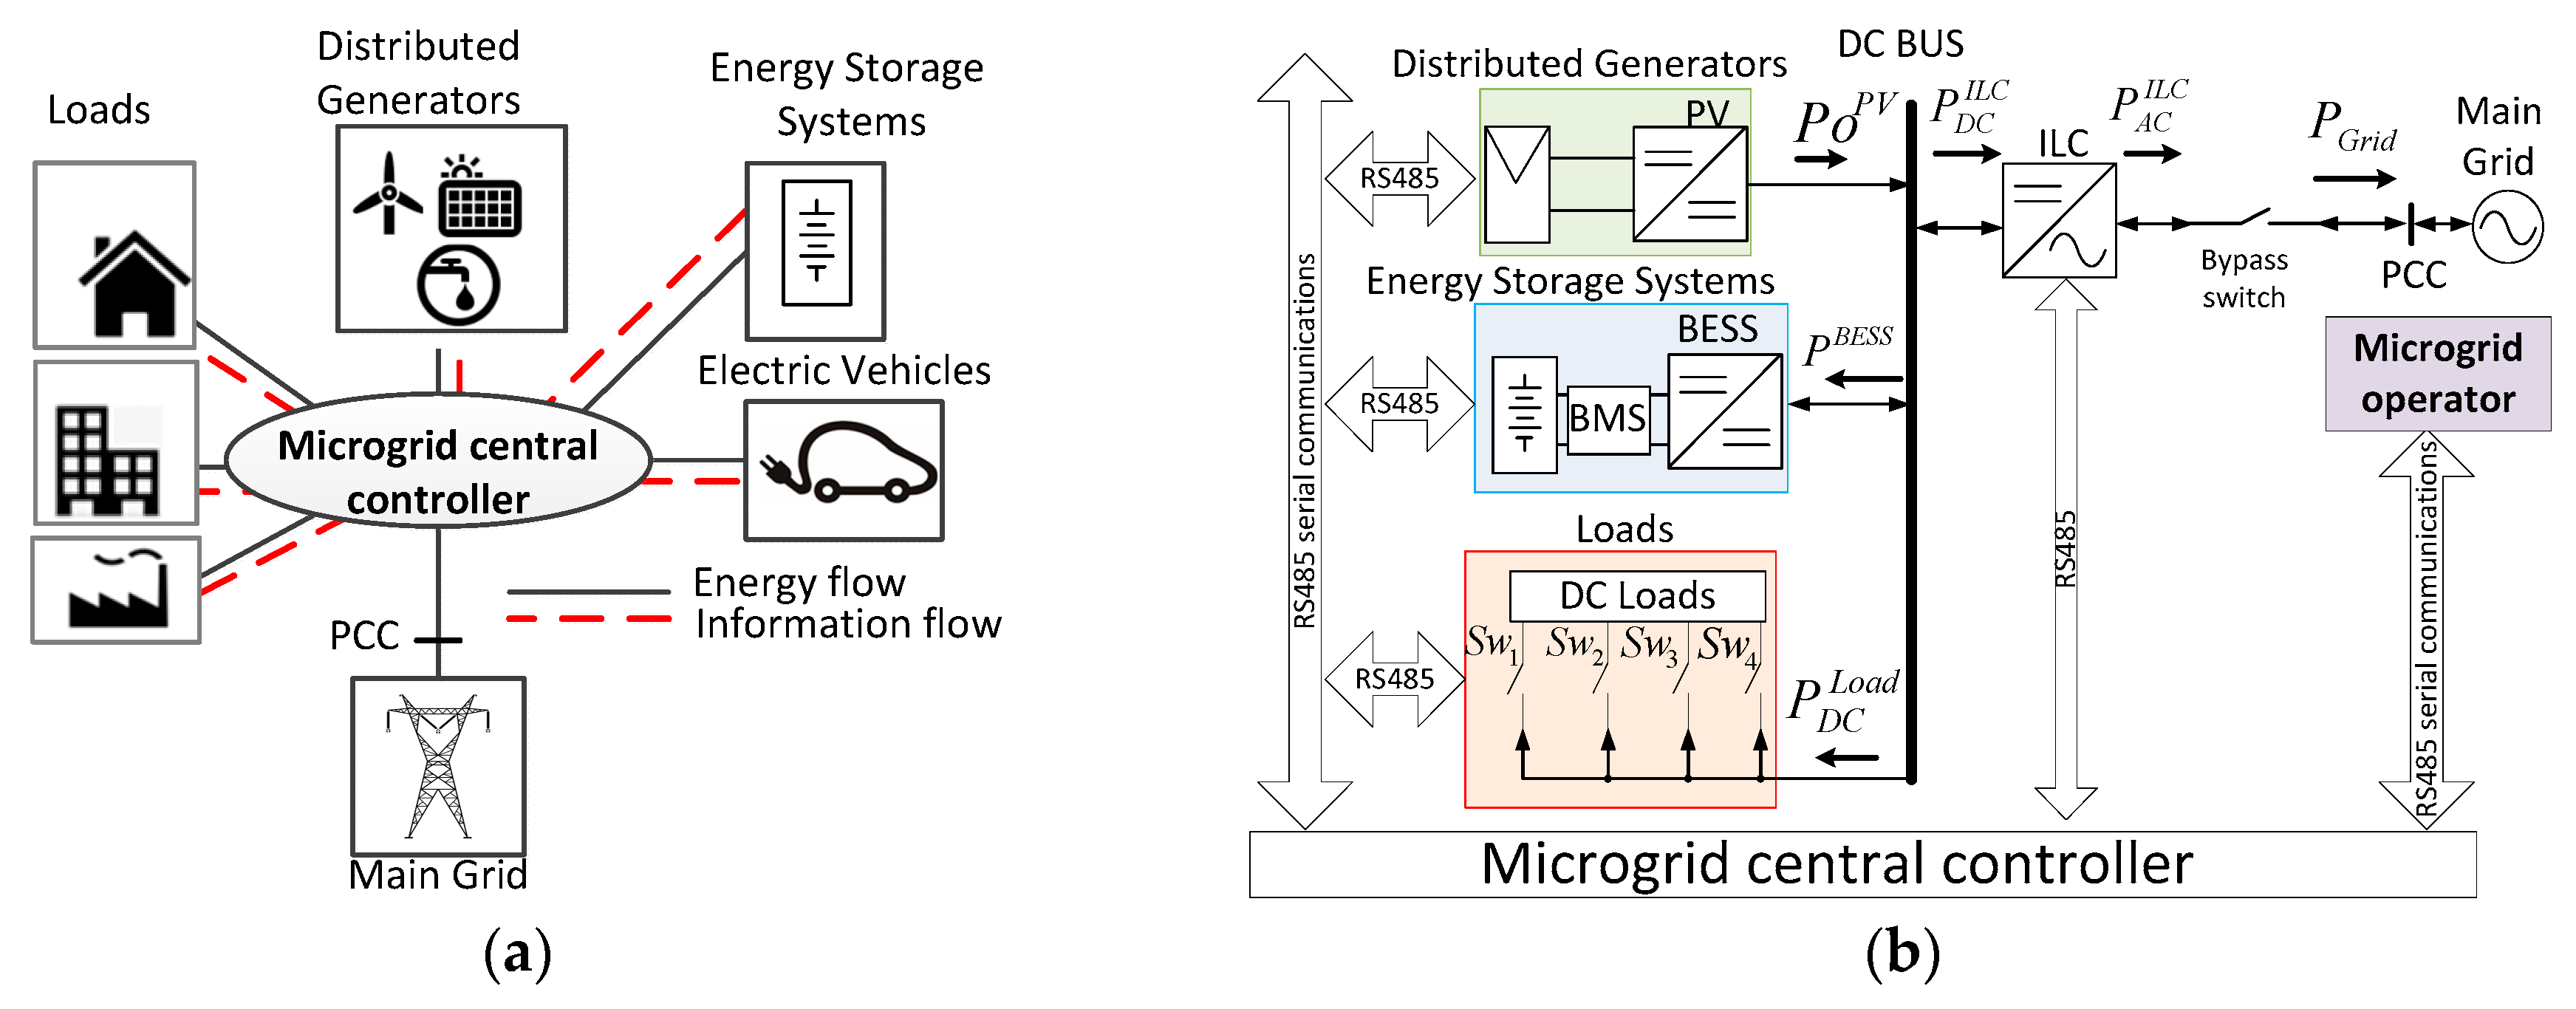
- Communication system: This subsystem informs a central controller about the parameters of the batteries in order to manage the power dispatch of the MG. These communications allow for an interface with the user and the interaction with the power management in the MG.
3. Design of the Battery Energy Storage System
3.1. Selection of the Battery Bank
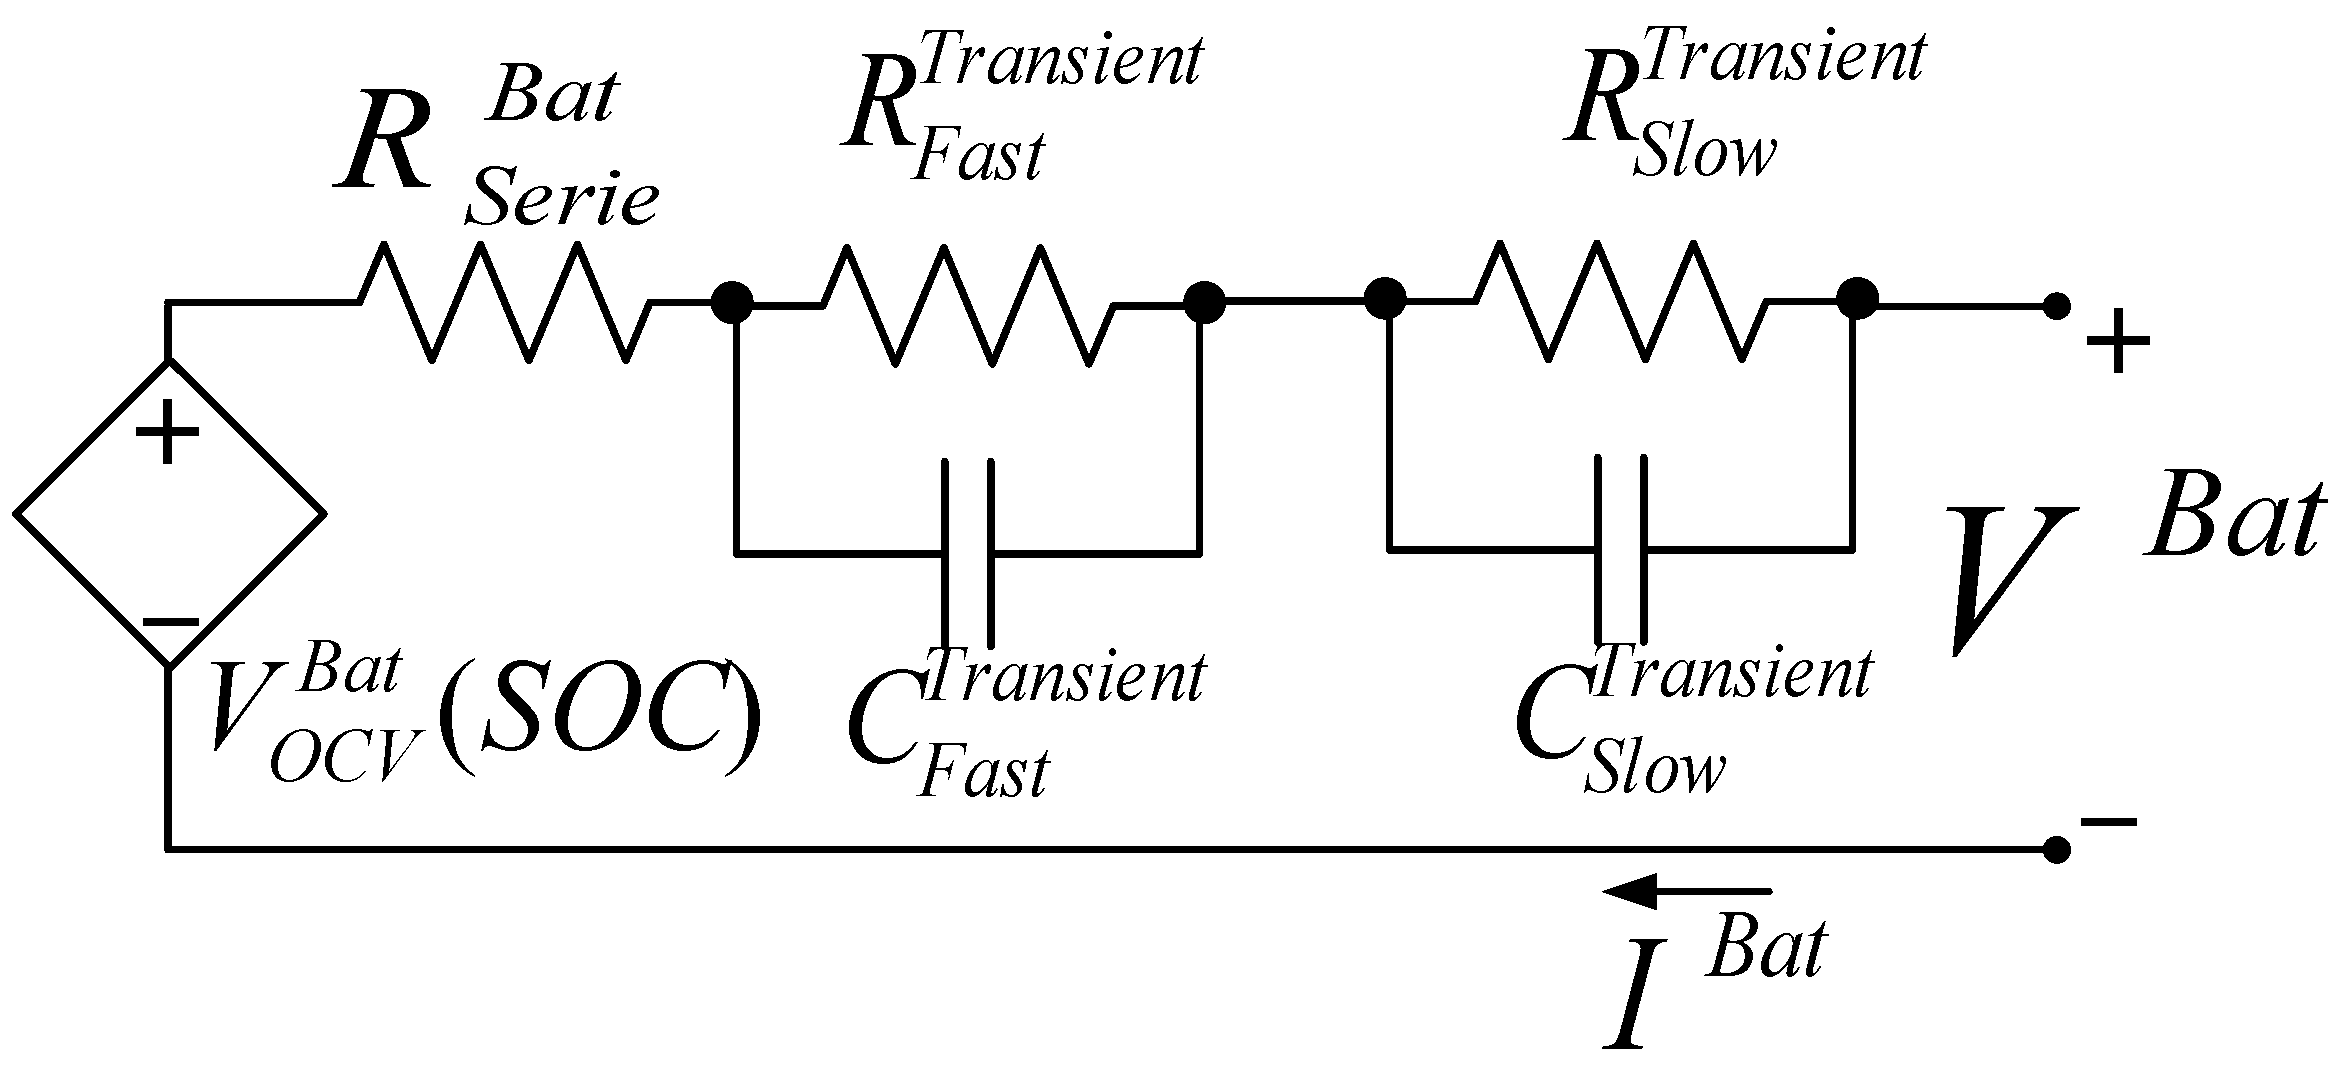
3.2. Modeling of Battery Bank
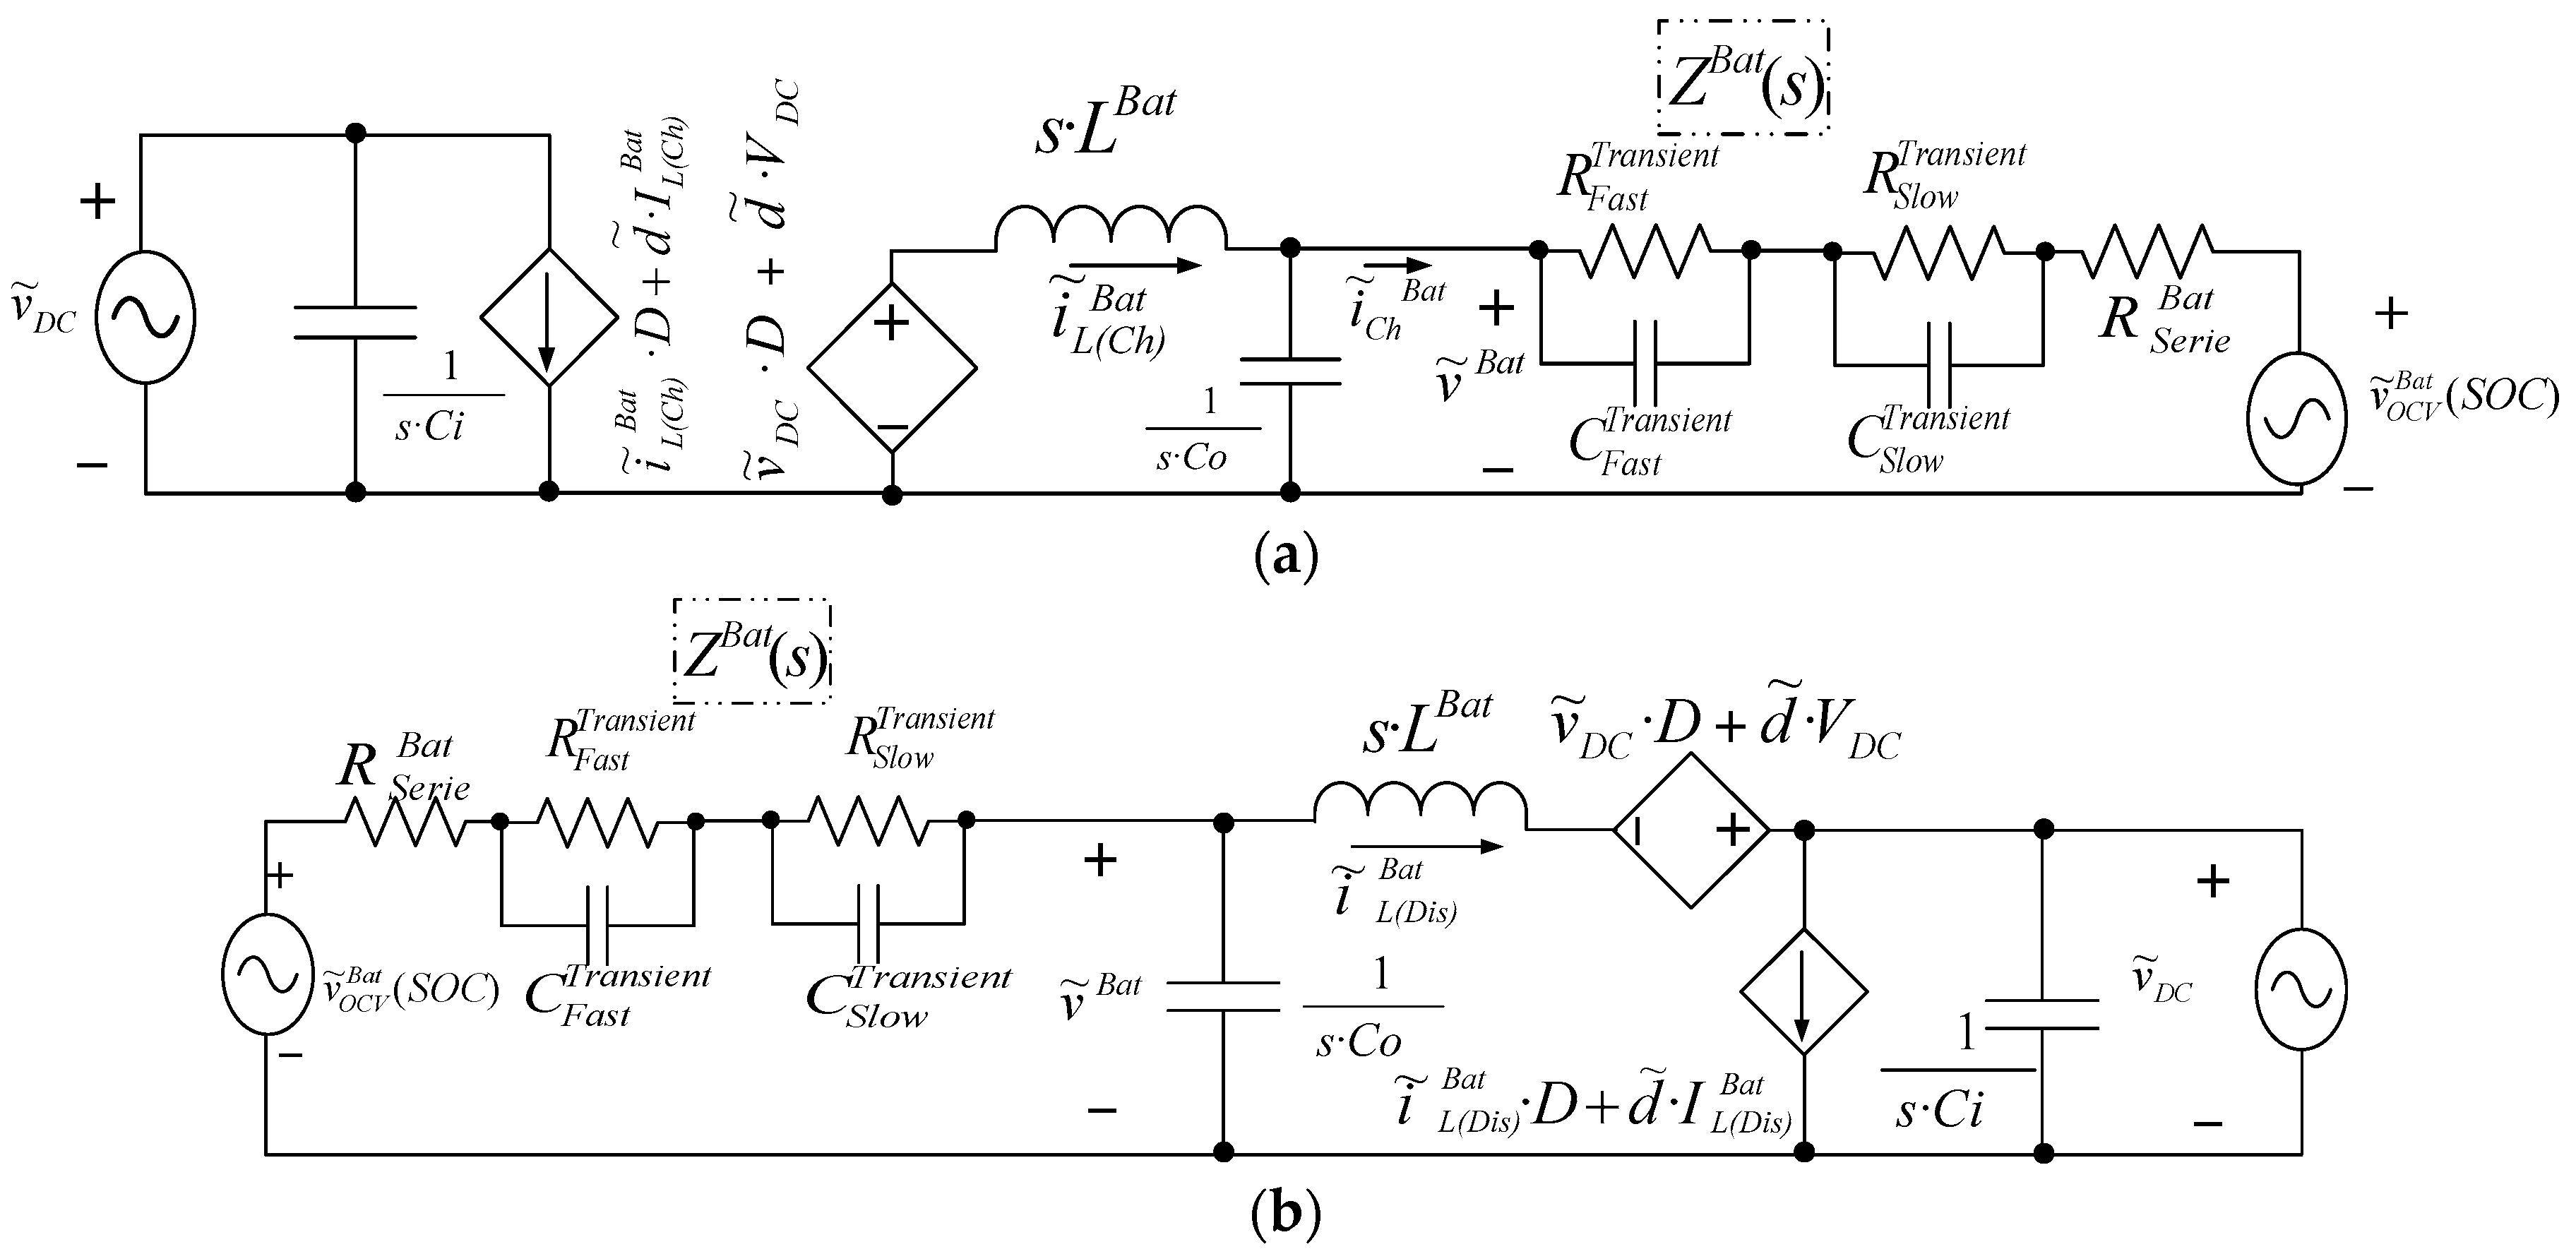
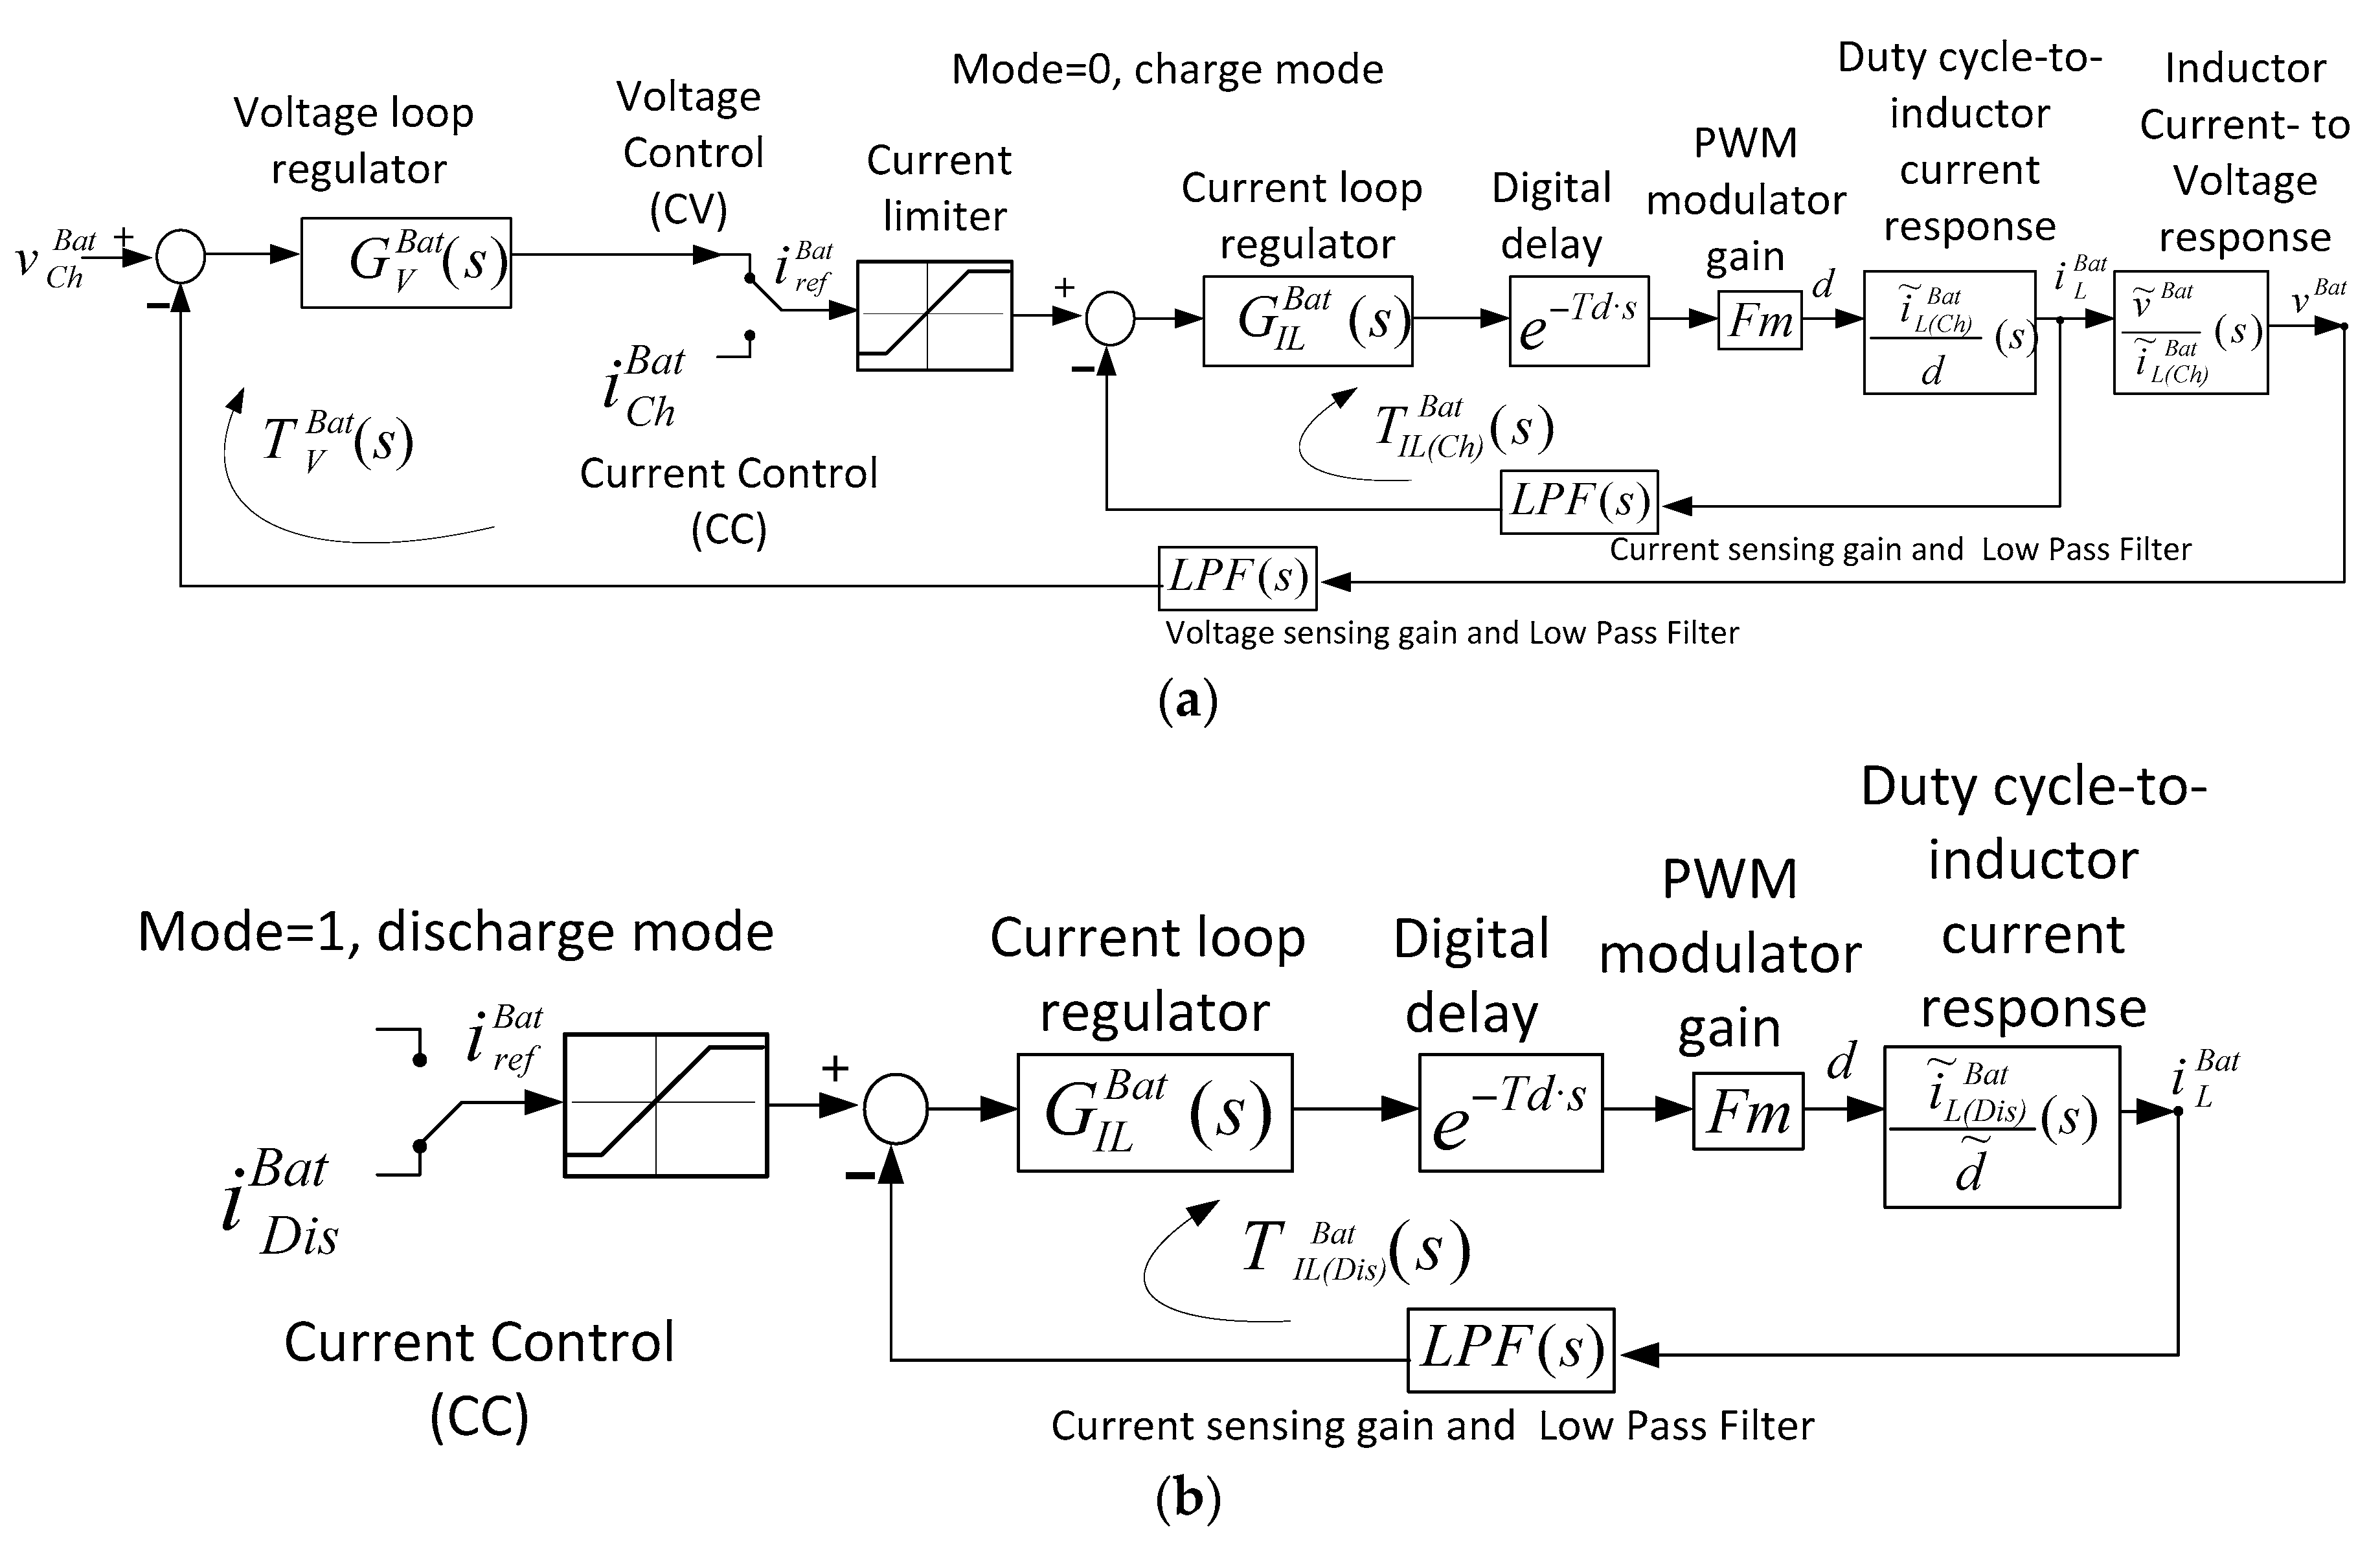
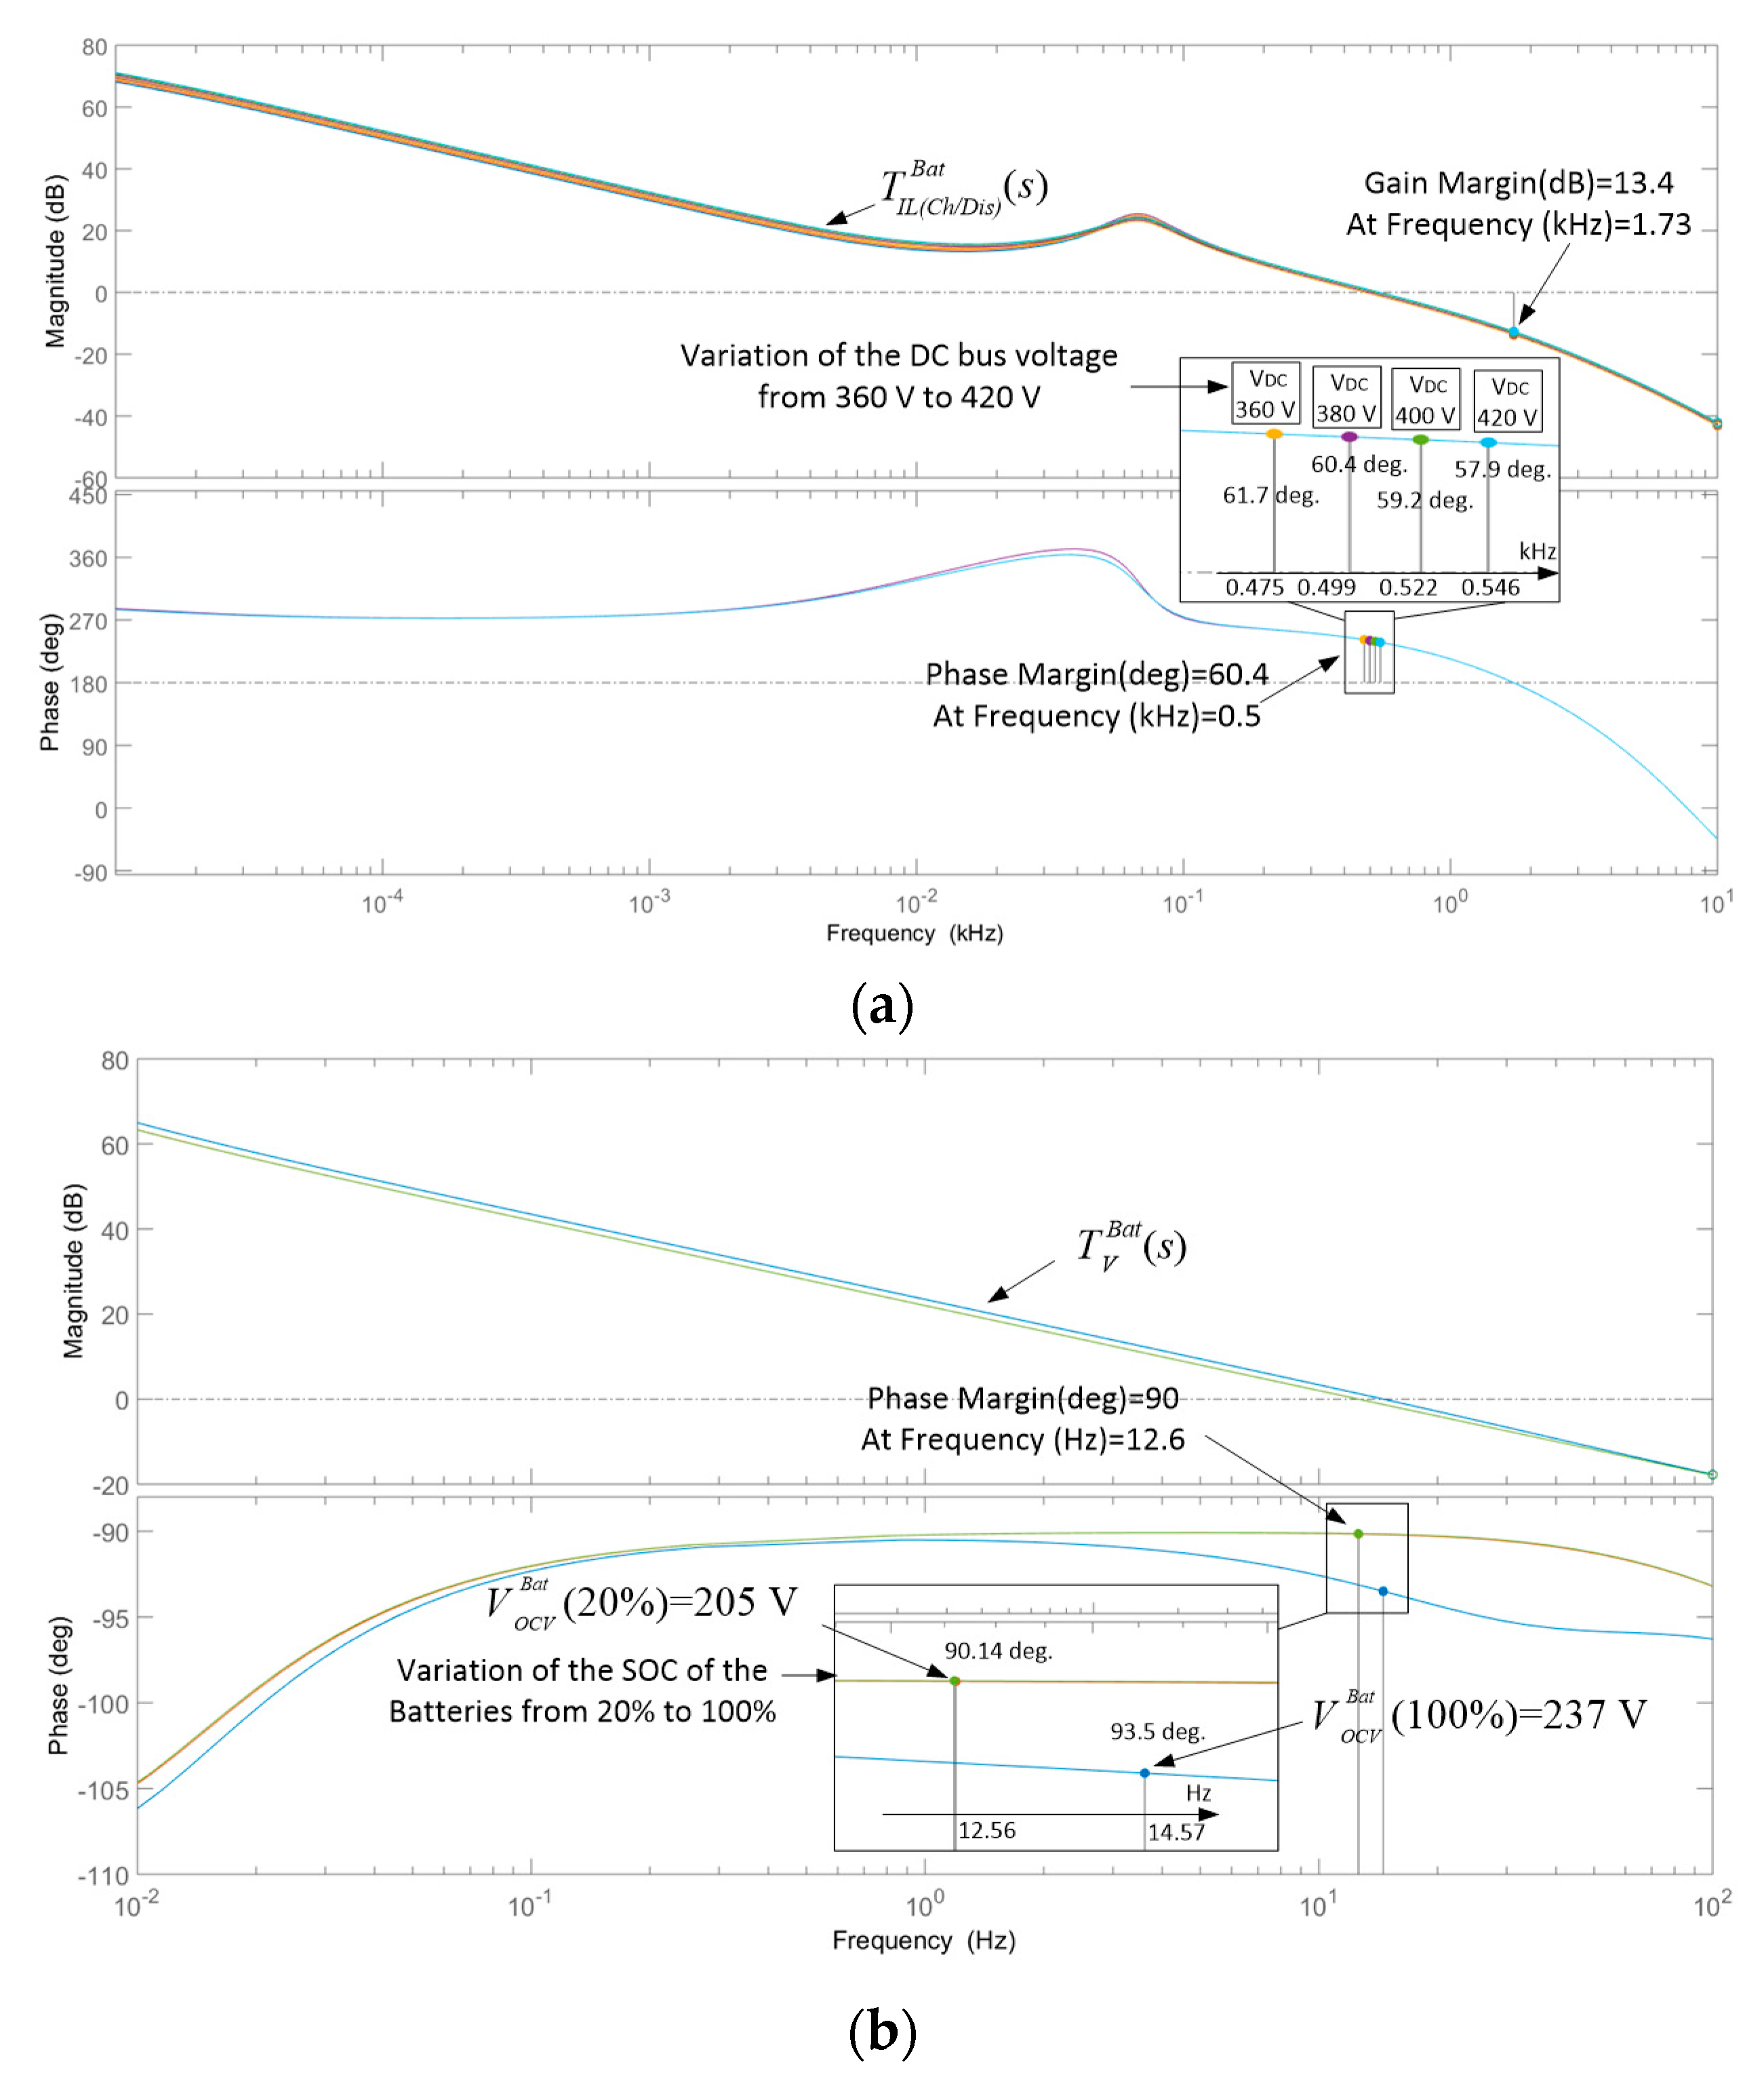
3.3. Small-Signal Model of the BESS
3.4. Control Loops Design of the BESS
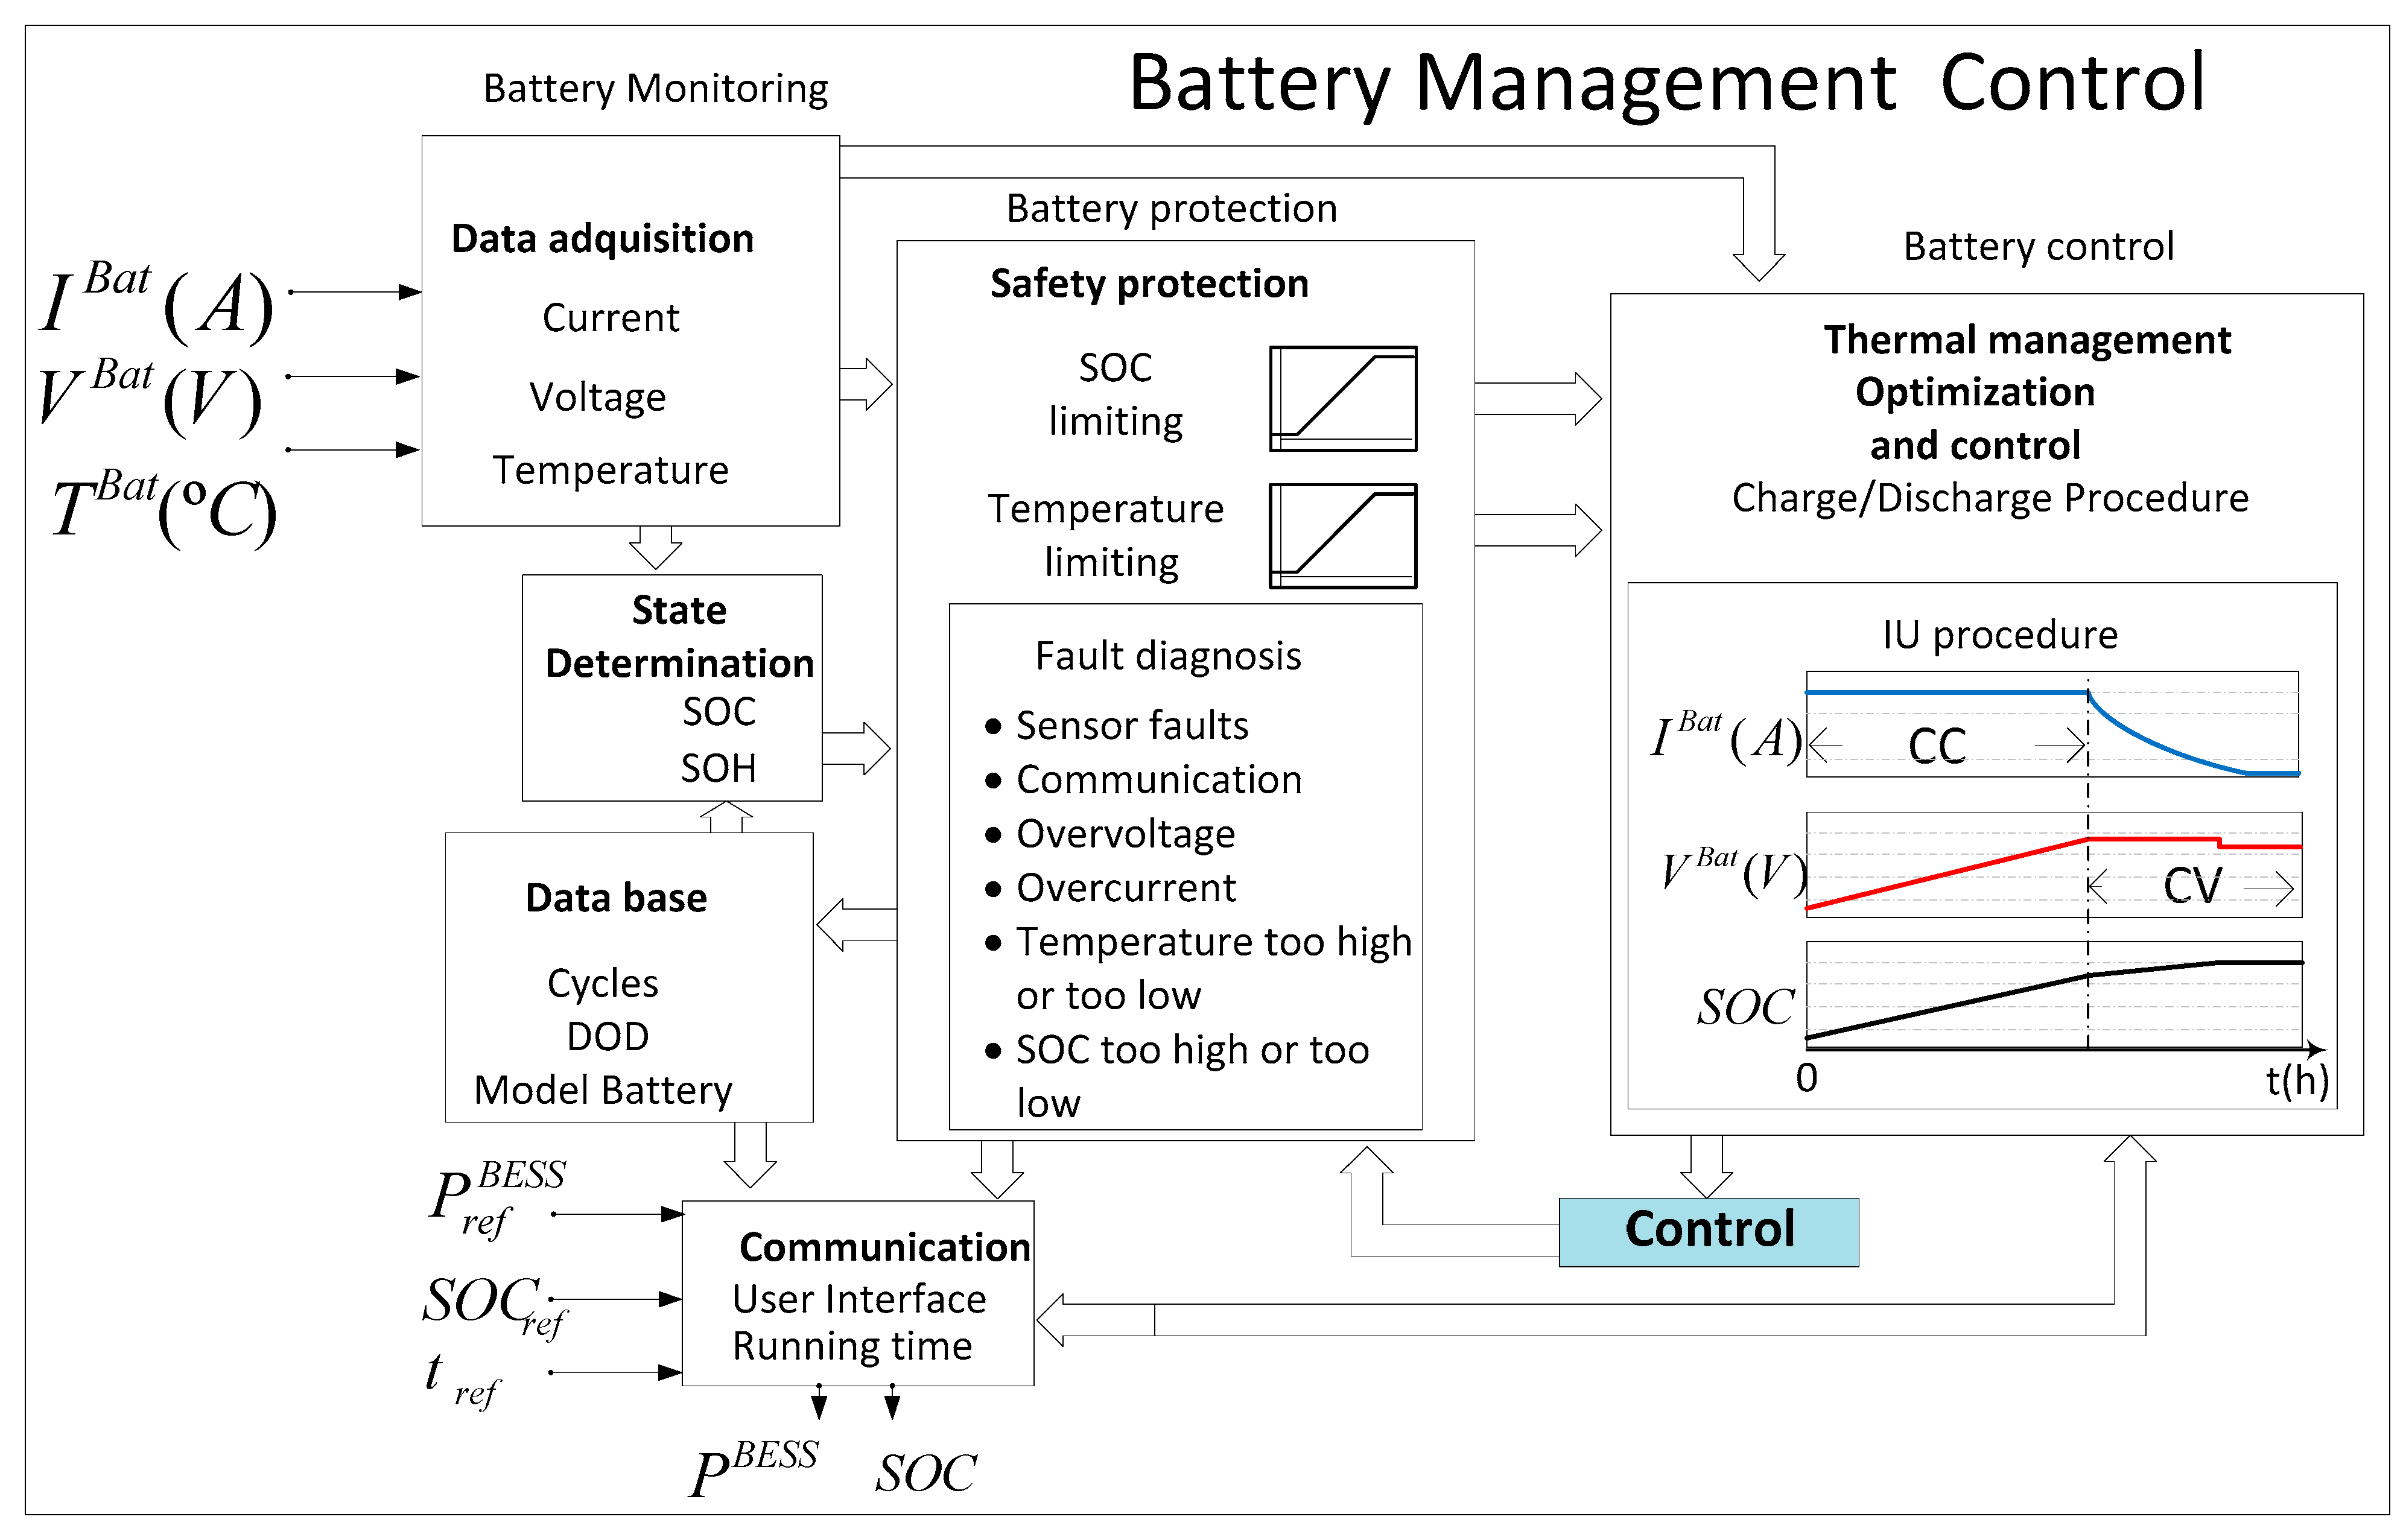
3.5. Design of the BMS
- Battery Monitoring: It measures the battery parameters: current, voltage and temperature of the battery bank (IBat, VBat y TBat). The initial SOC, DOD and SOH are estimated. A data table is stored corresponding to the amount of charge/discharge cycles, the battery model and its initial impedance.
- Battery Protection: The batteries are protected against overcharge, overcurrent, high temperature, communication loss and connection loss. The BMS sets the maximum charging/discharging current, the advisable SOC, the battery voltage and the maximum temperature.
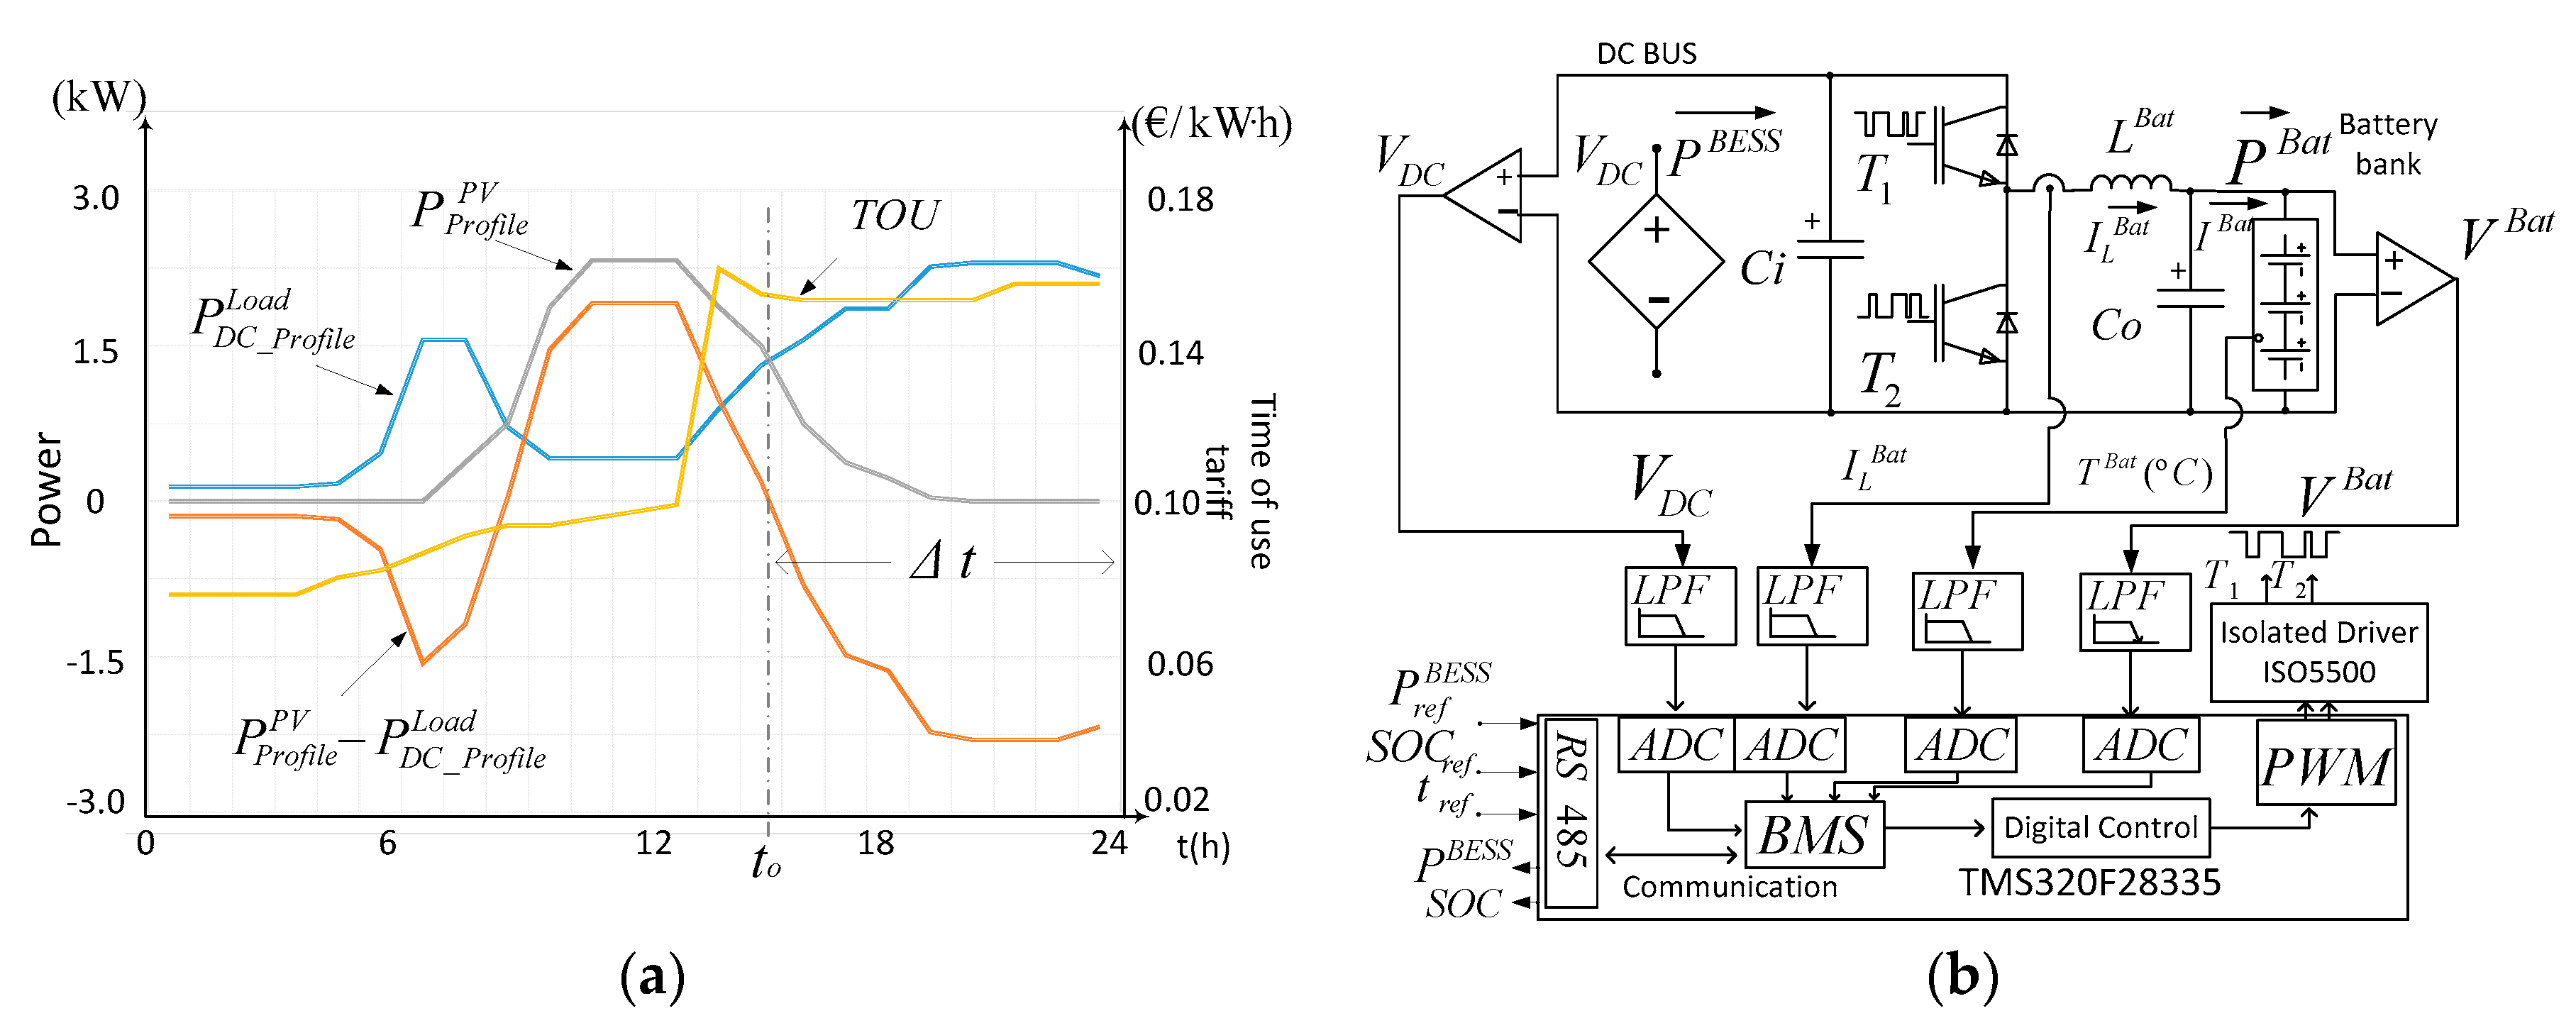
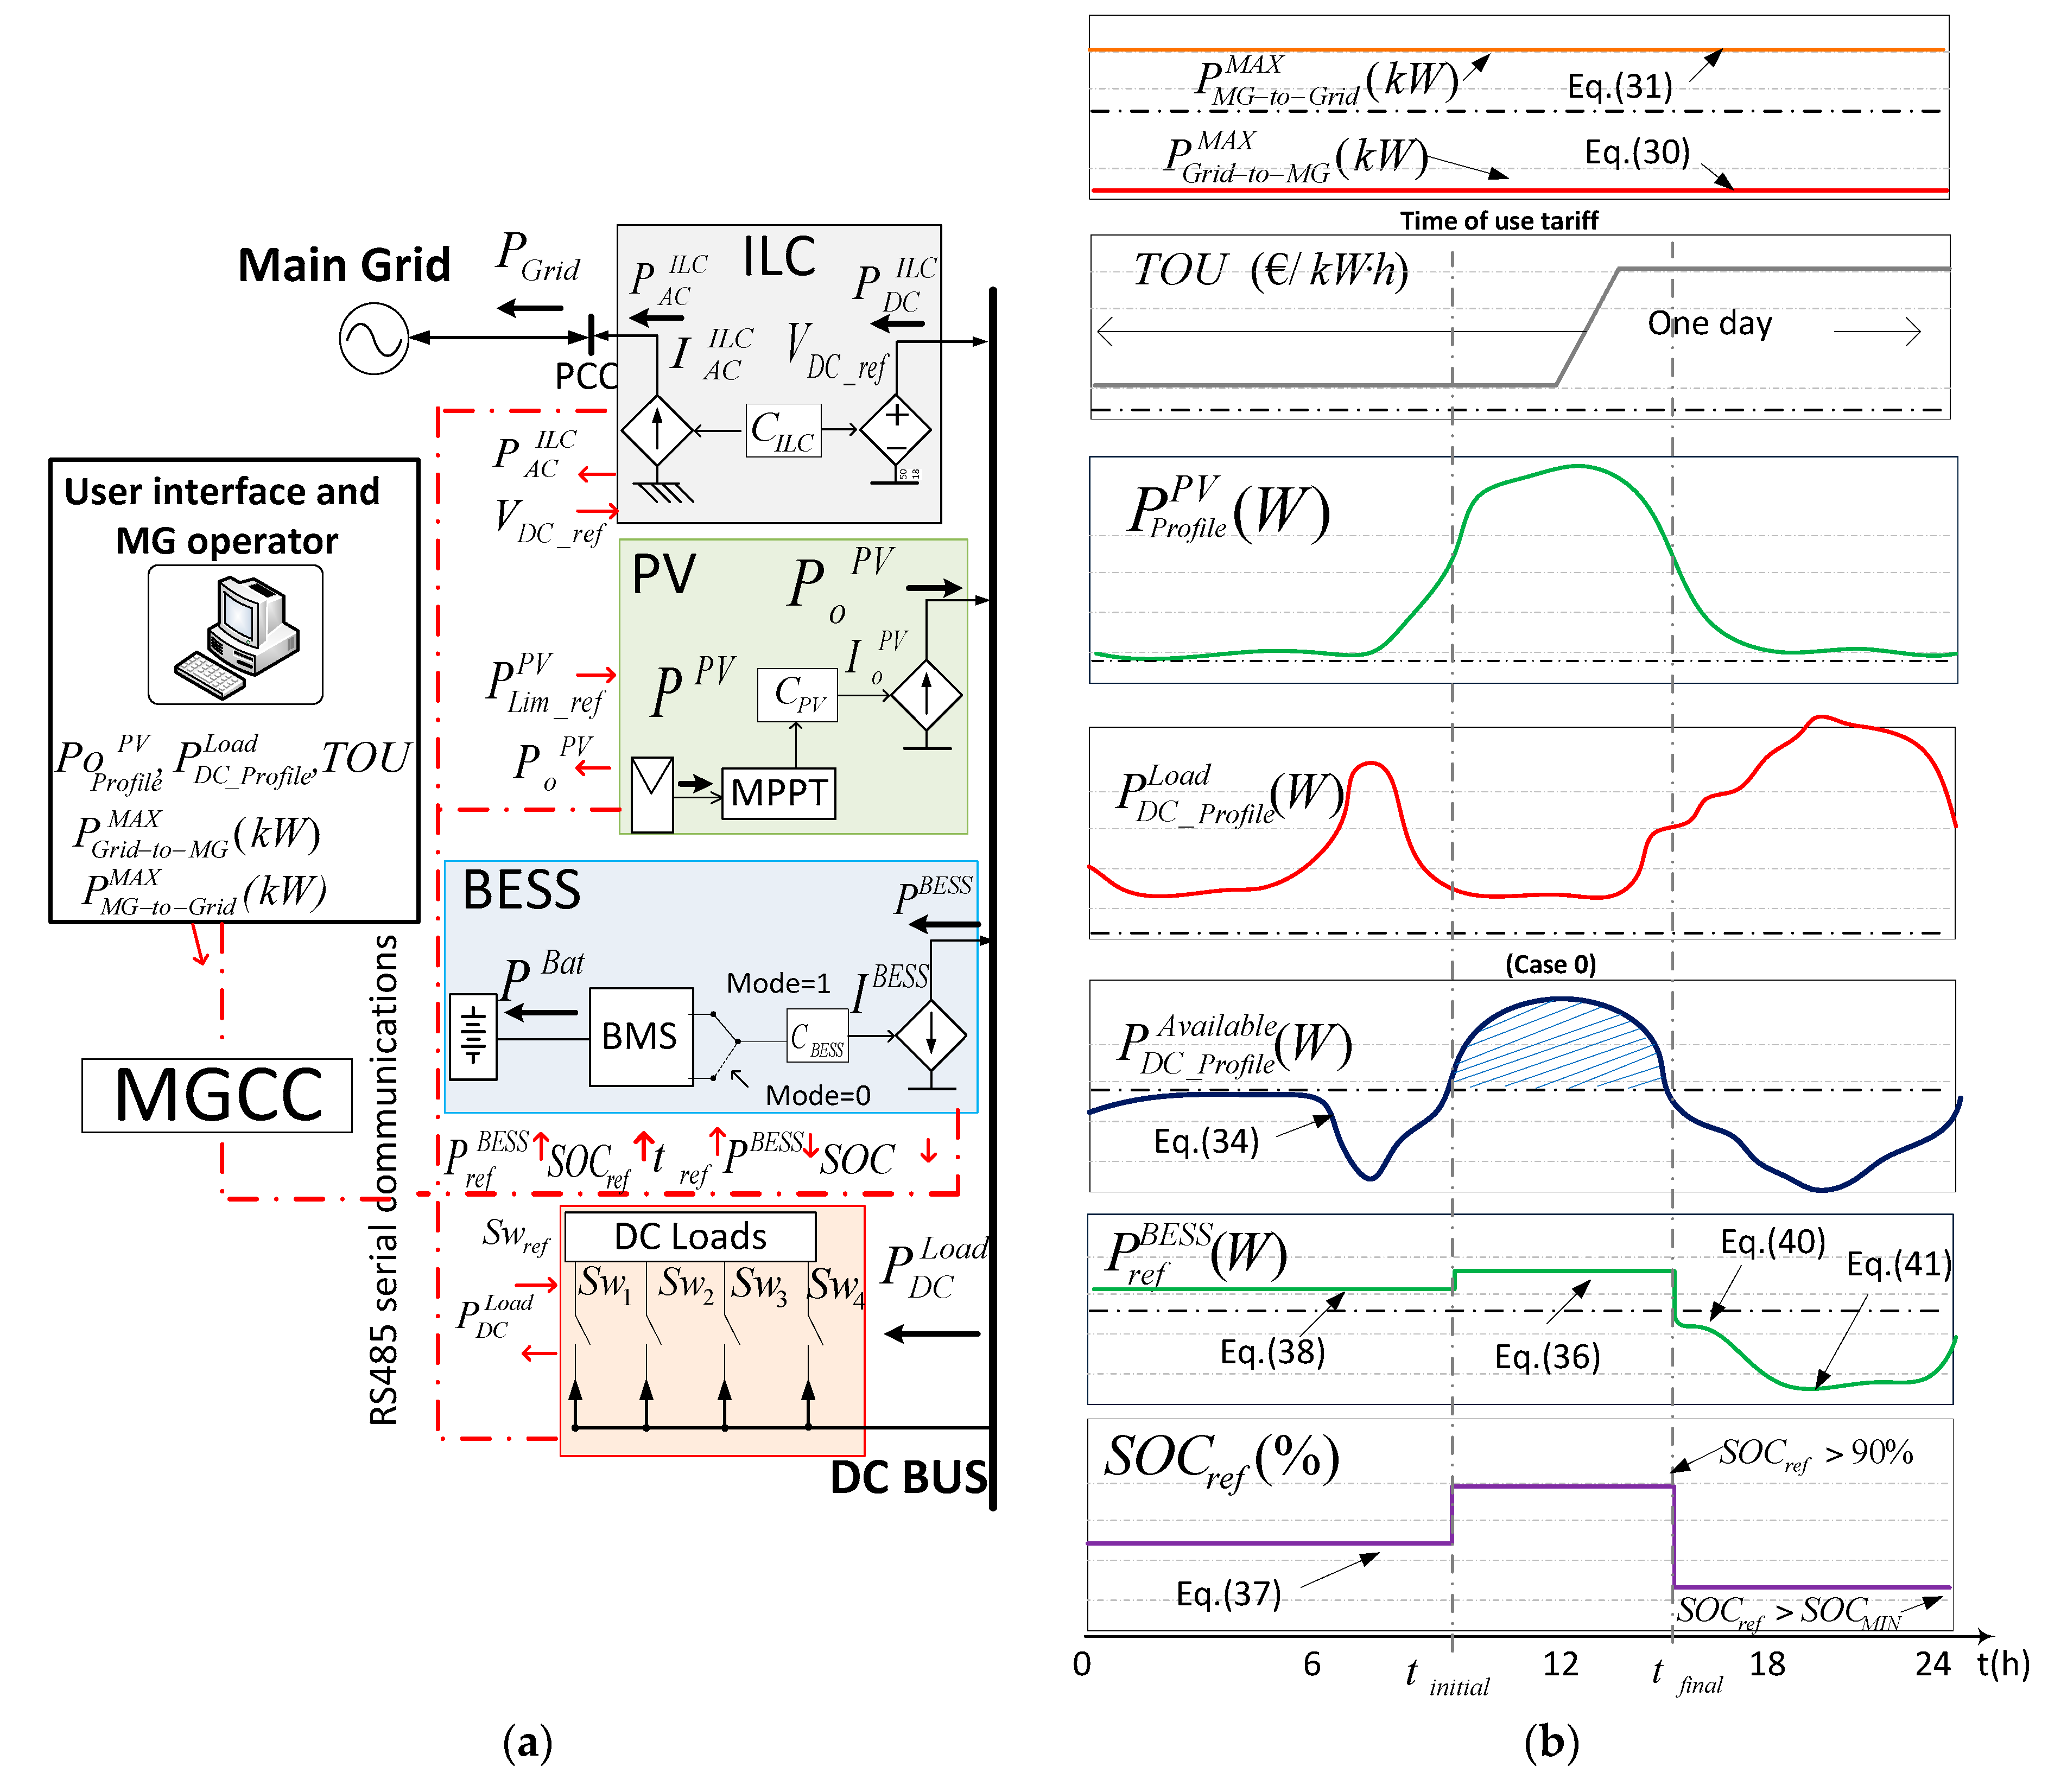
- Battery Communication: The communication allows for the optimization of the battery charging/discharging process. In charge mode, the MGCC sends to the BESS information about the available power to charge batteries () and the time (tref) in which the BESS keeps this power. In addition, the MGCC sends the desired SOC (SOCref) of the batteries, to be reached in a time tref. The BESS informs the MGCC about the current SOC and the absorbed/injected power from/to the DC bus by the BESS.
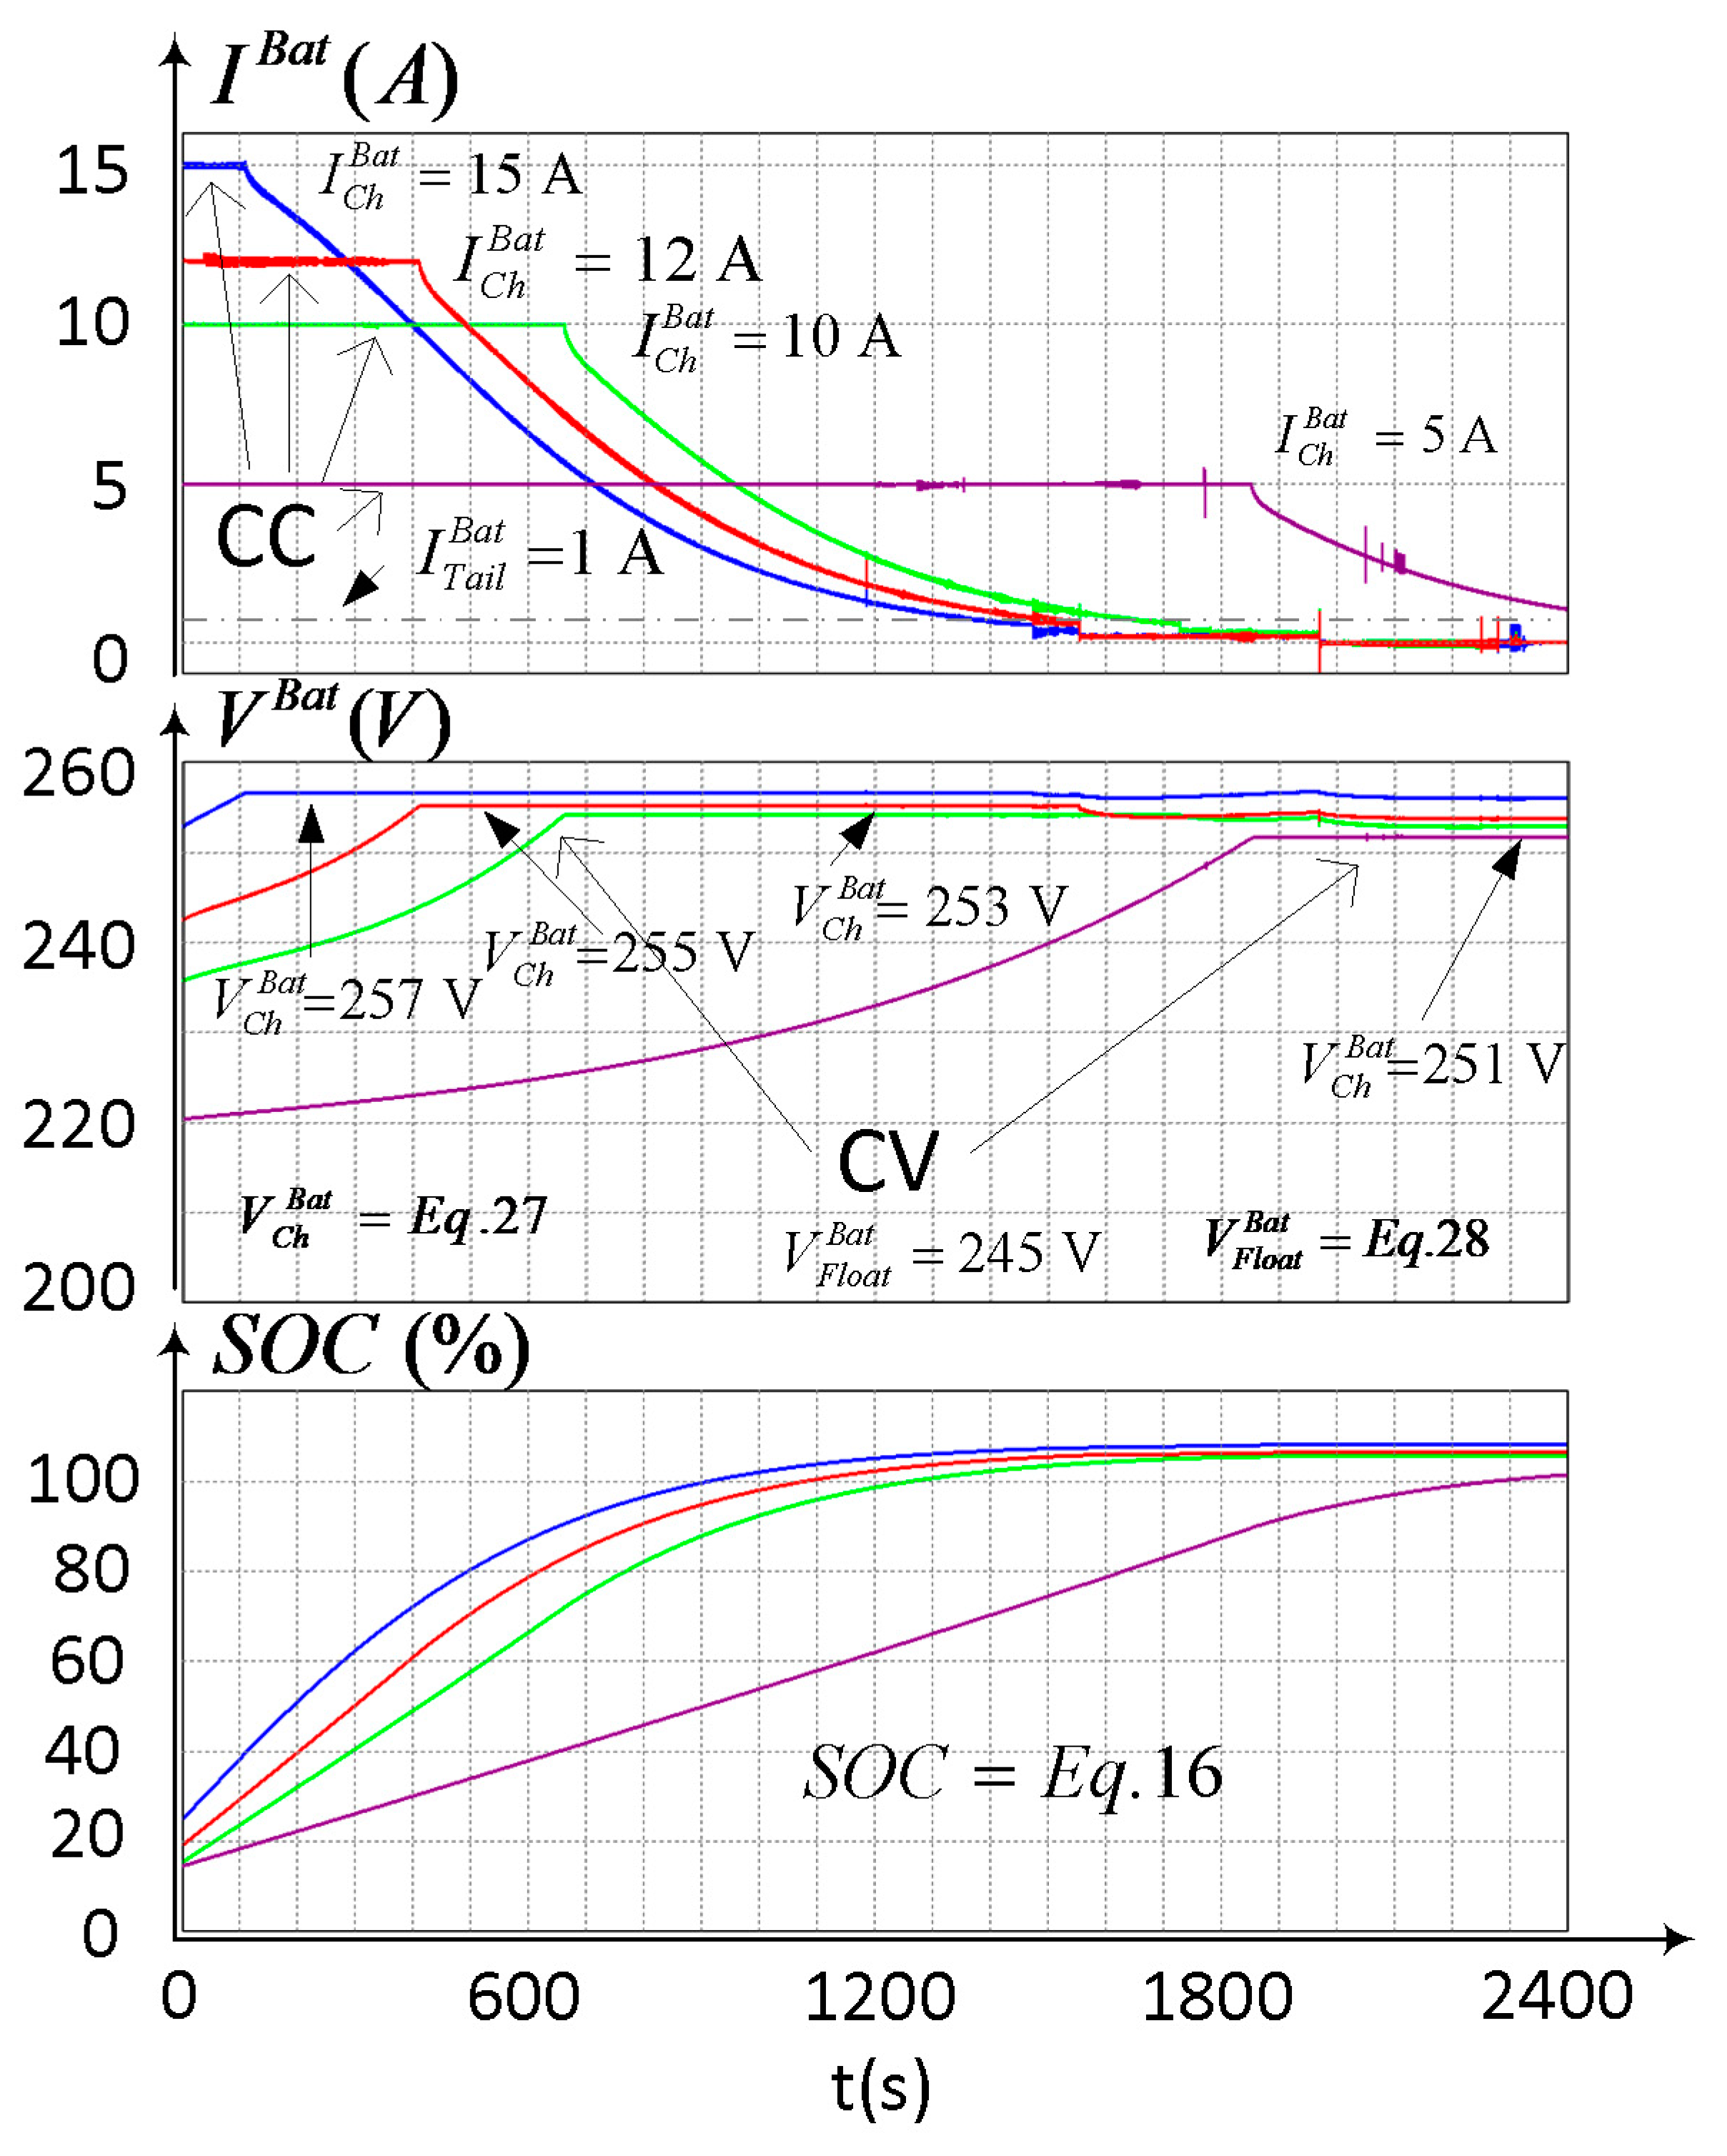
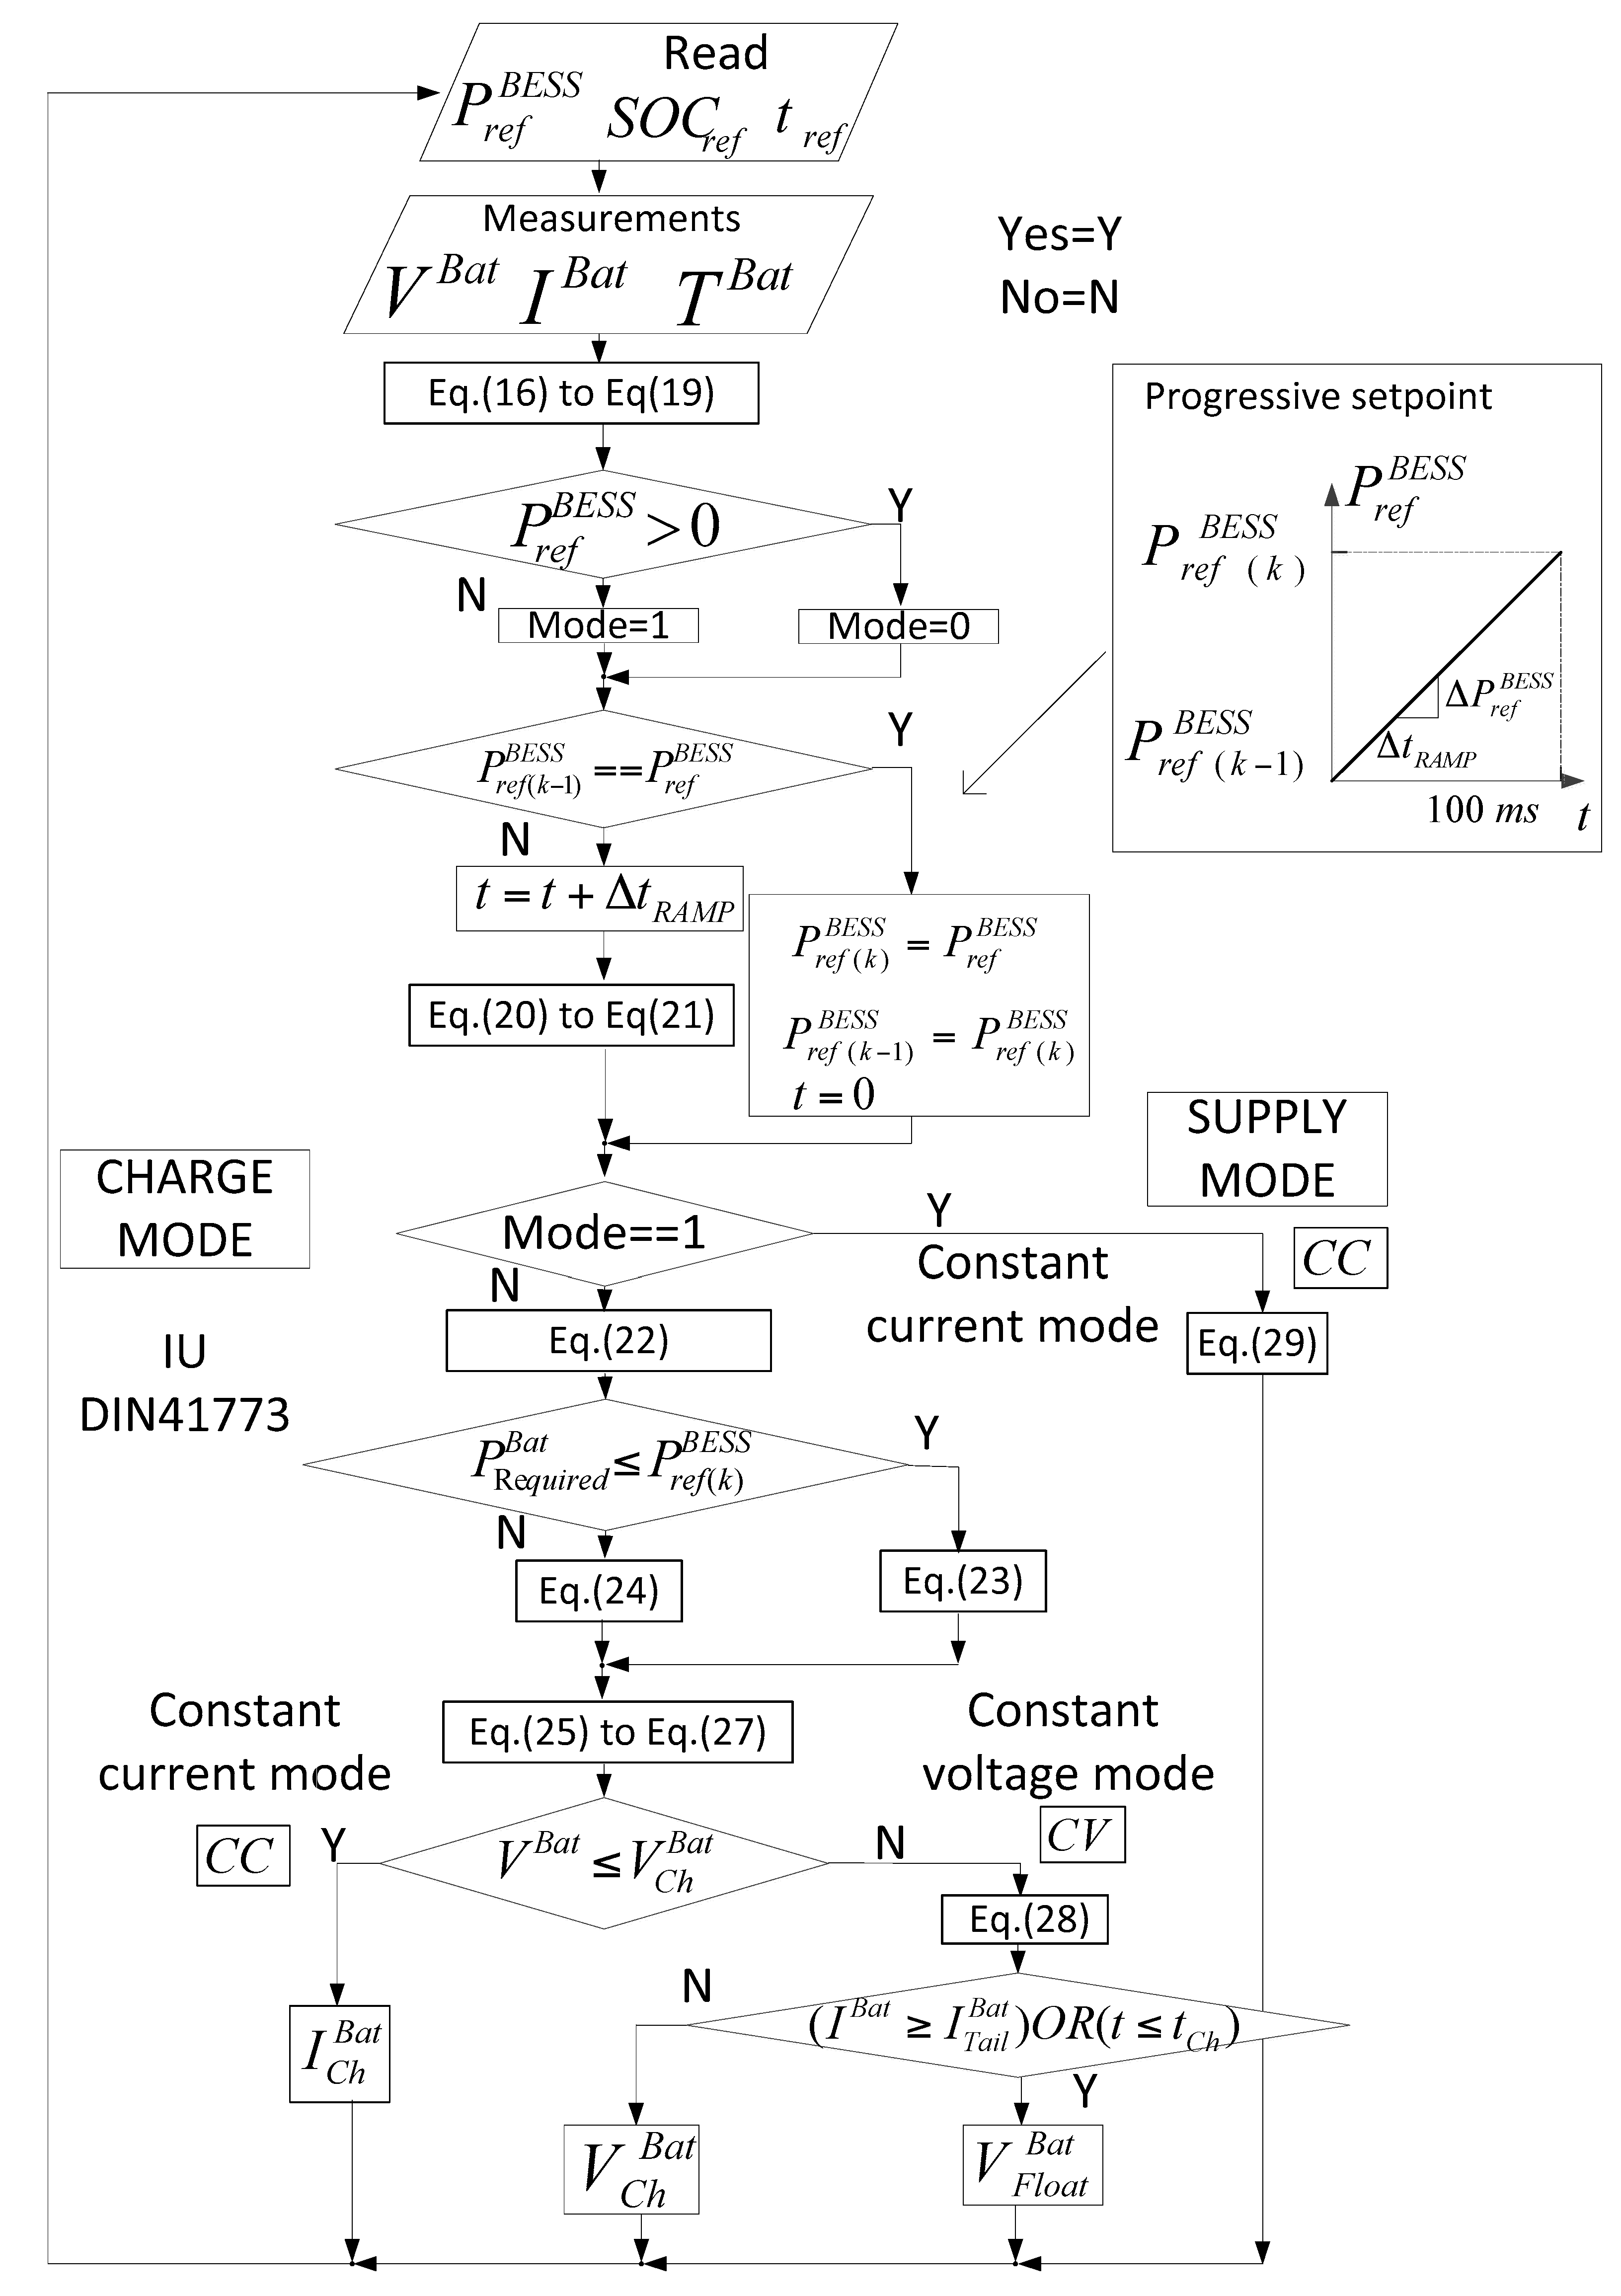
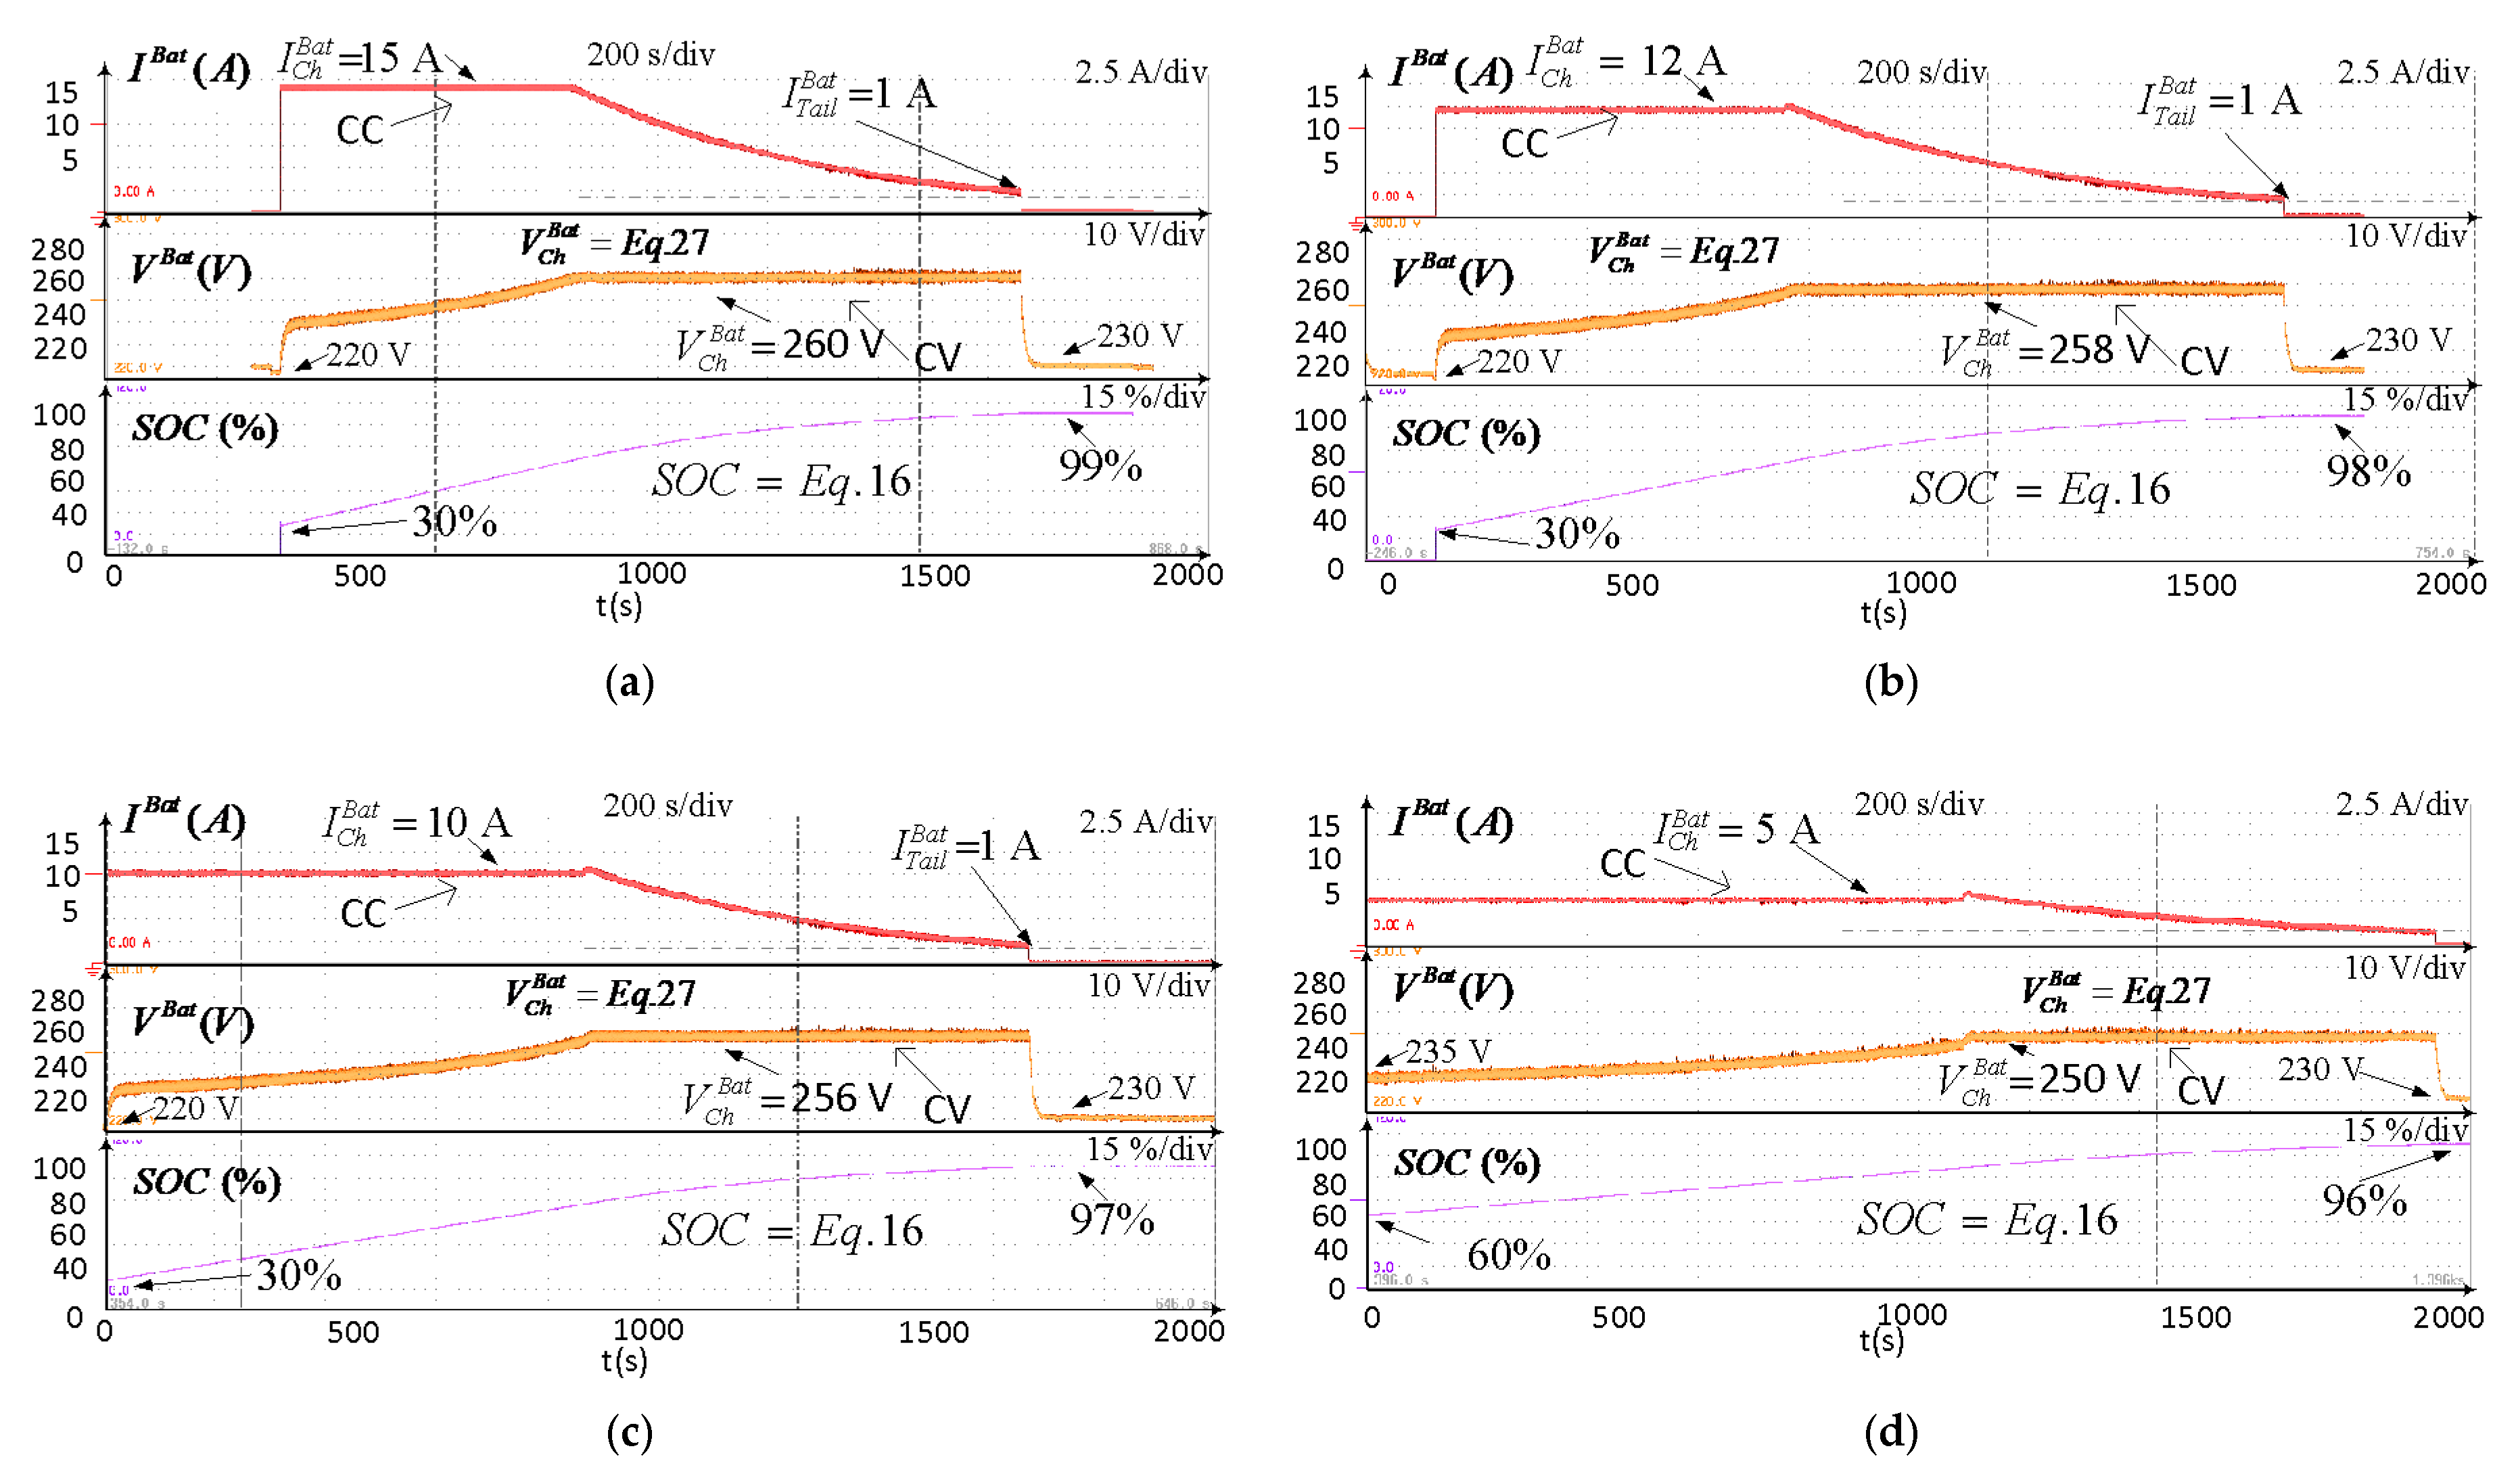
- Battery control: The current/voltage vs. time curves of the charge procedure of the battery bank are shown on the right side of Figure 7. First, the batteries are charged to a constant current (CC) until a maximum charging voltage is reached. At this point, the control is changed to constant voltage (CV) in the batteries. The procedure is based on adjusting the current and voltage charging parameters of the batteries as a function of the MG state and complying with the DIN 41773 specifications [29] at the same time. The charge procedure is done by adjusting the battery current and voltage according to the temperature of the batteries and to the available power at the DC bus. In addition, the batteries can be charged or discharged depending on the cost of the electricity tariff and on the power availability at the RESs of the MG.
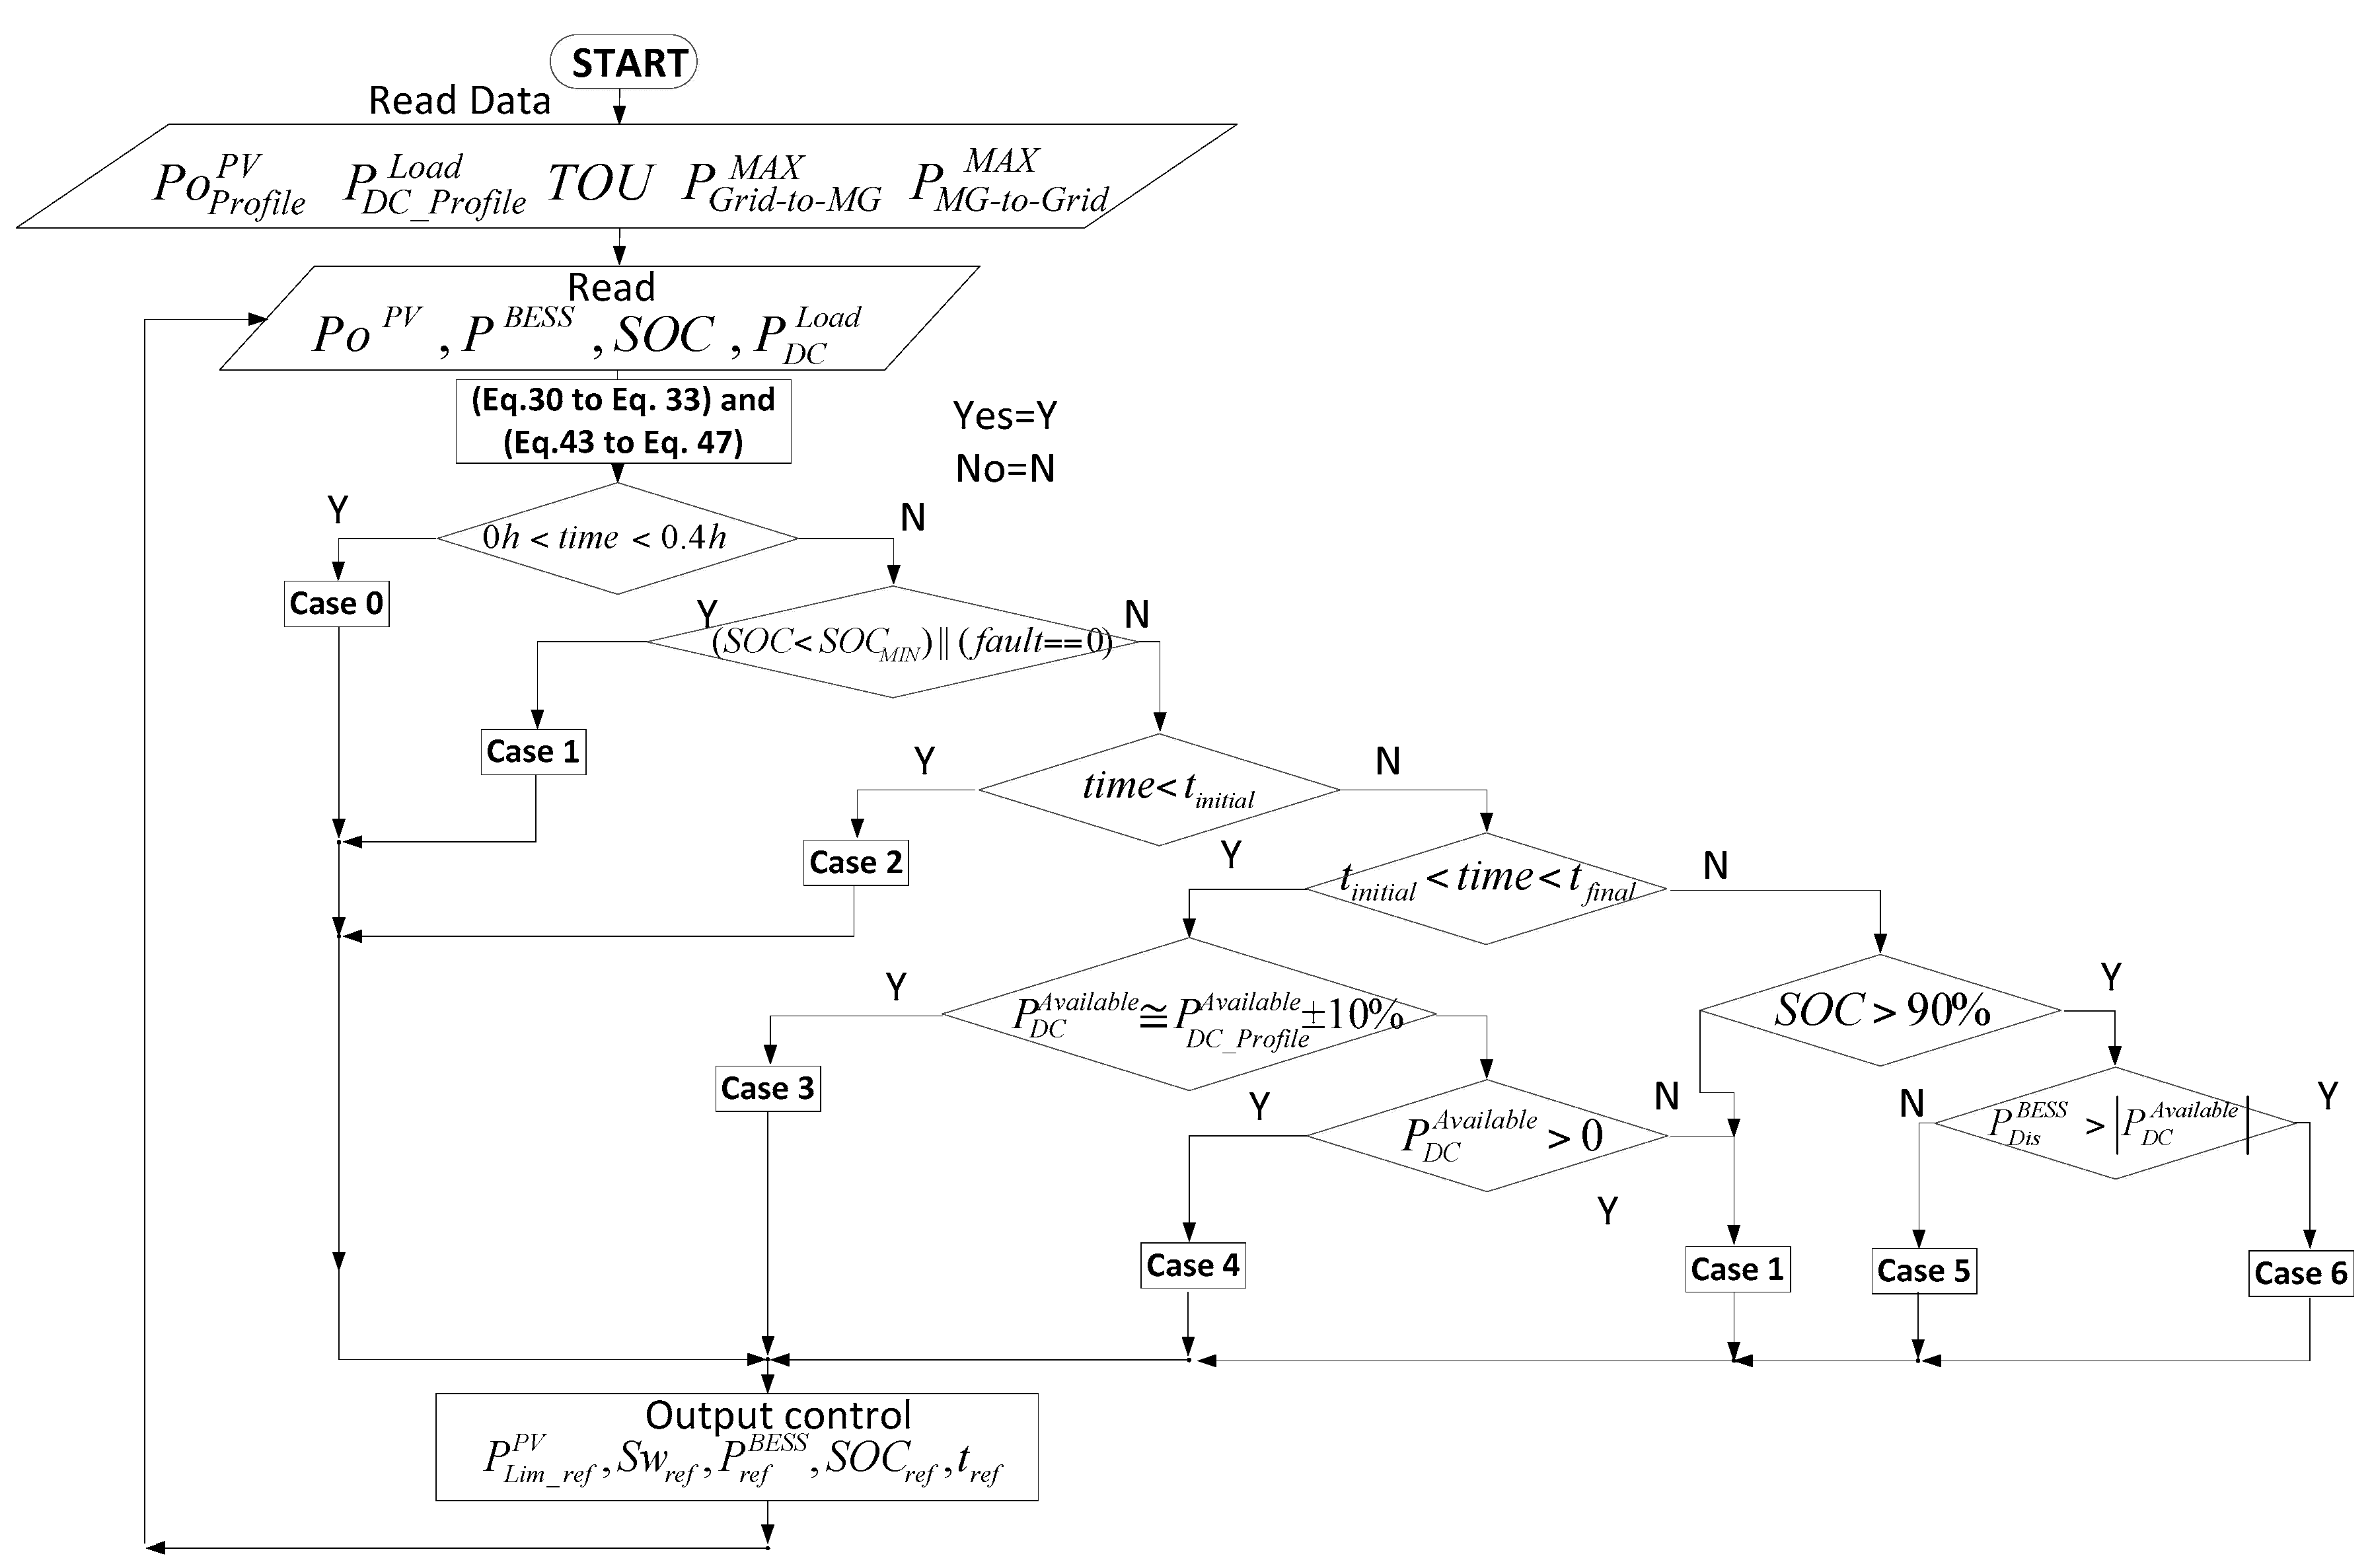
4. Centralized Power Management Algorithm of the DC Microgrid Tied to the Main Grid
The Power Management Algorithm of the MG
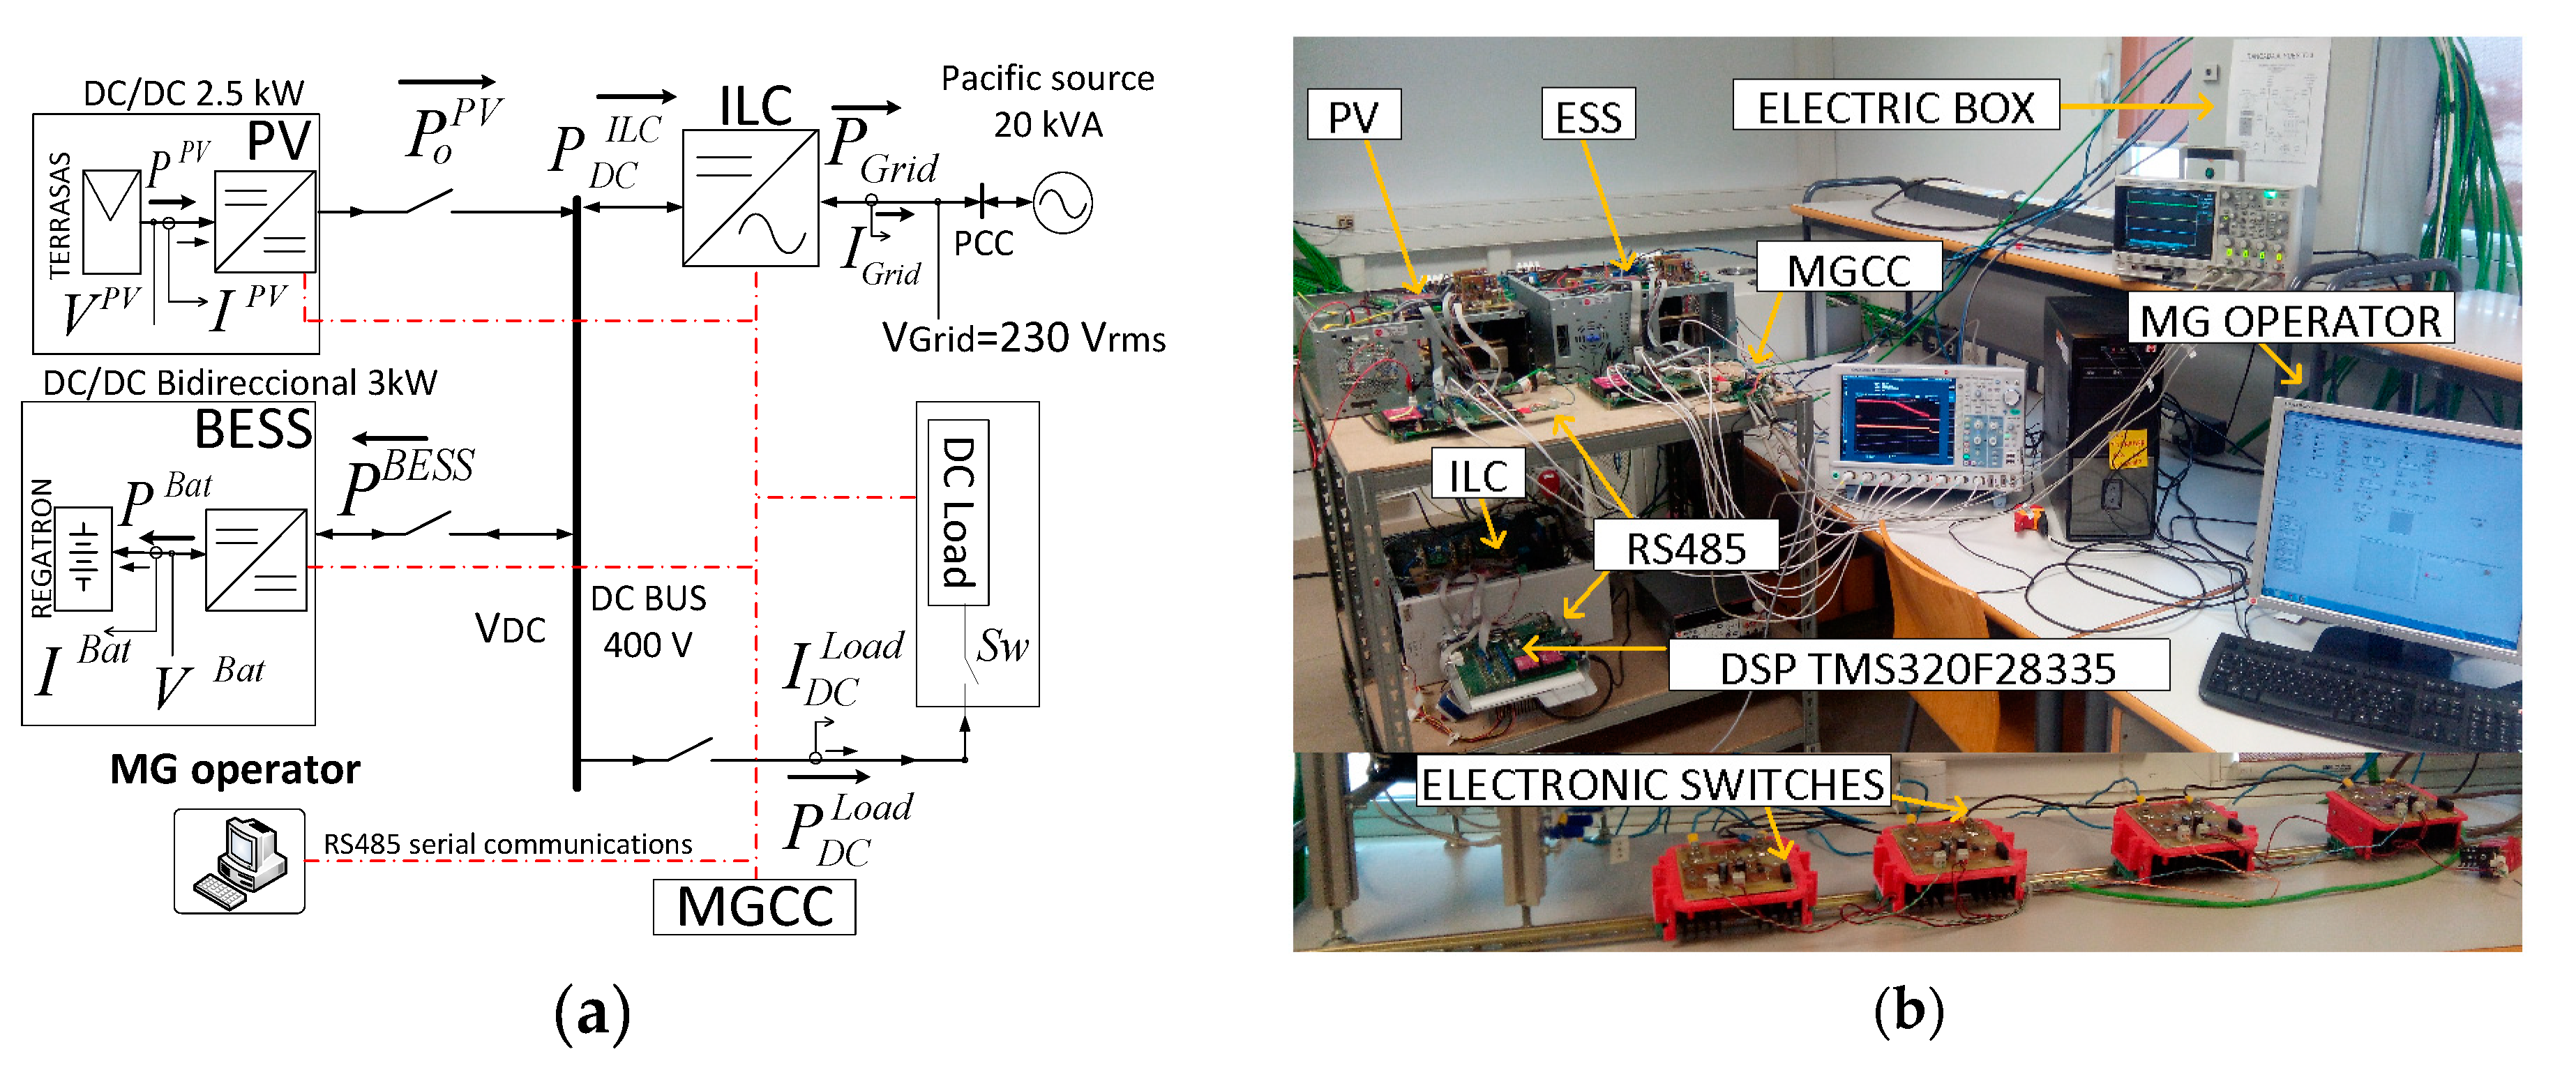
5. Experimental and Simulation Results
5.1. Simulation #1
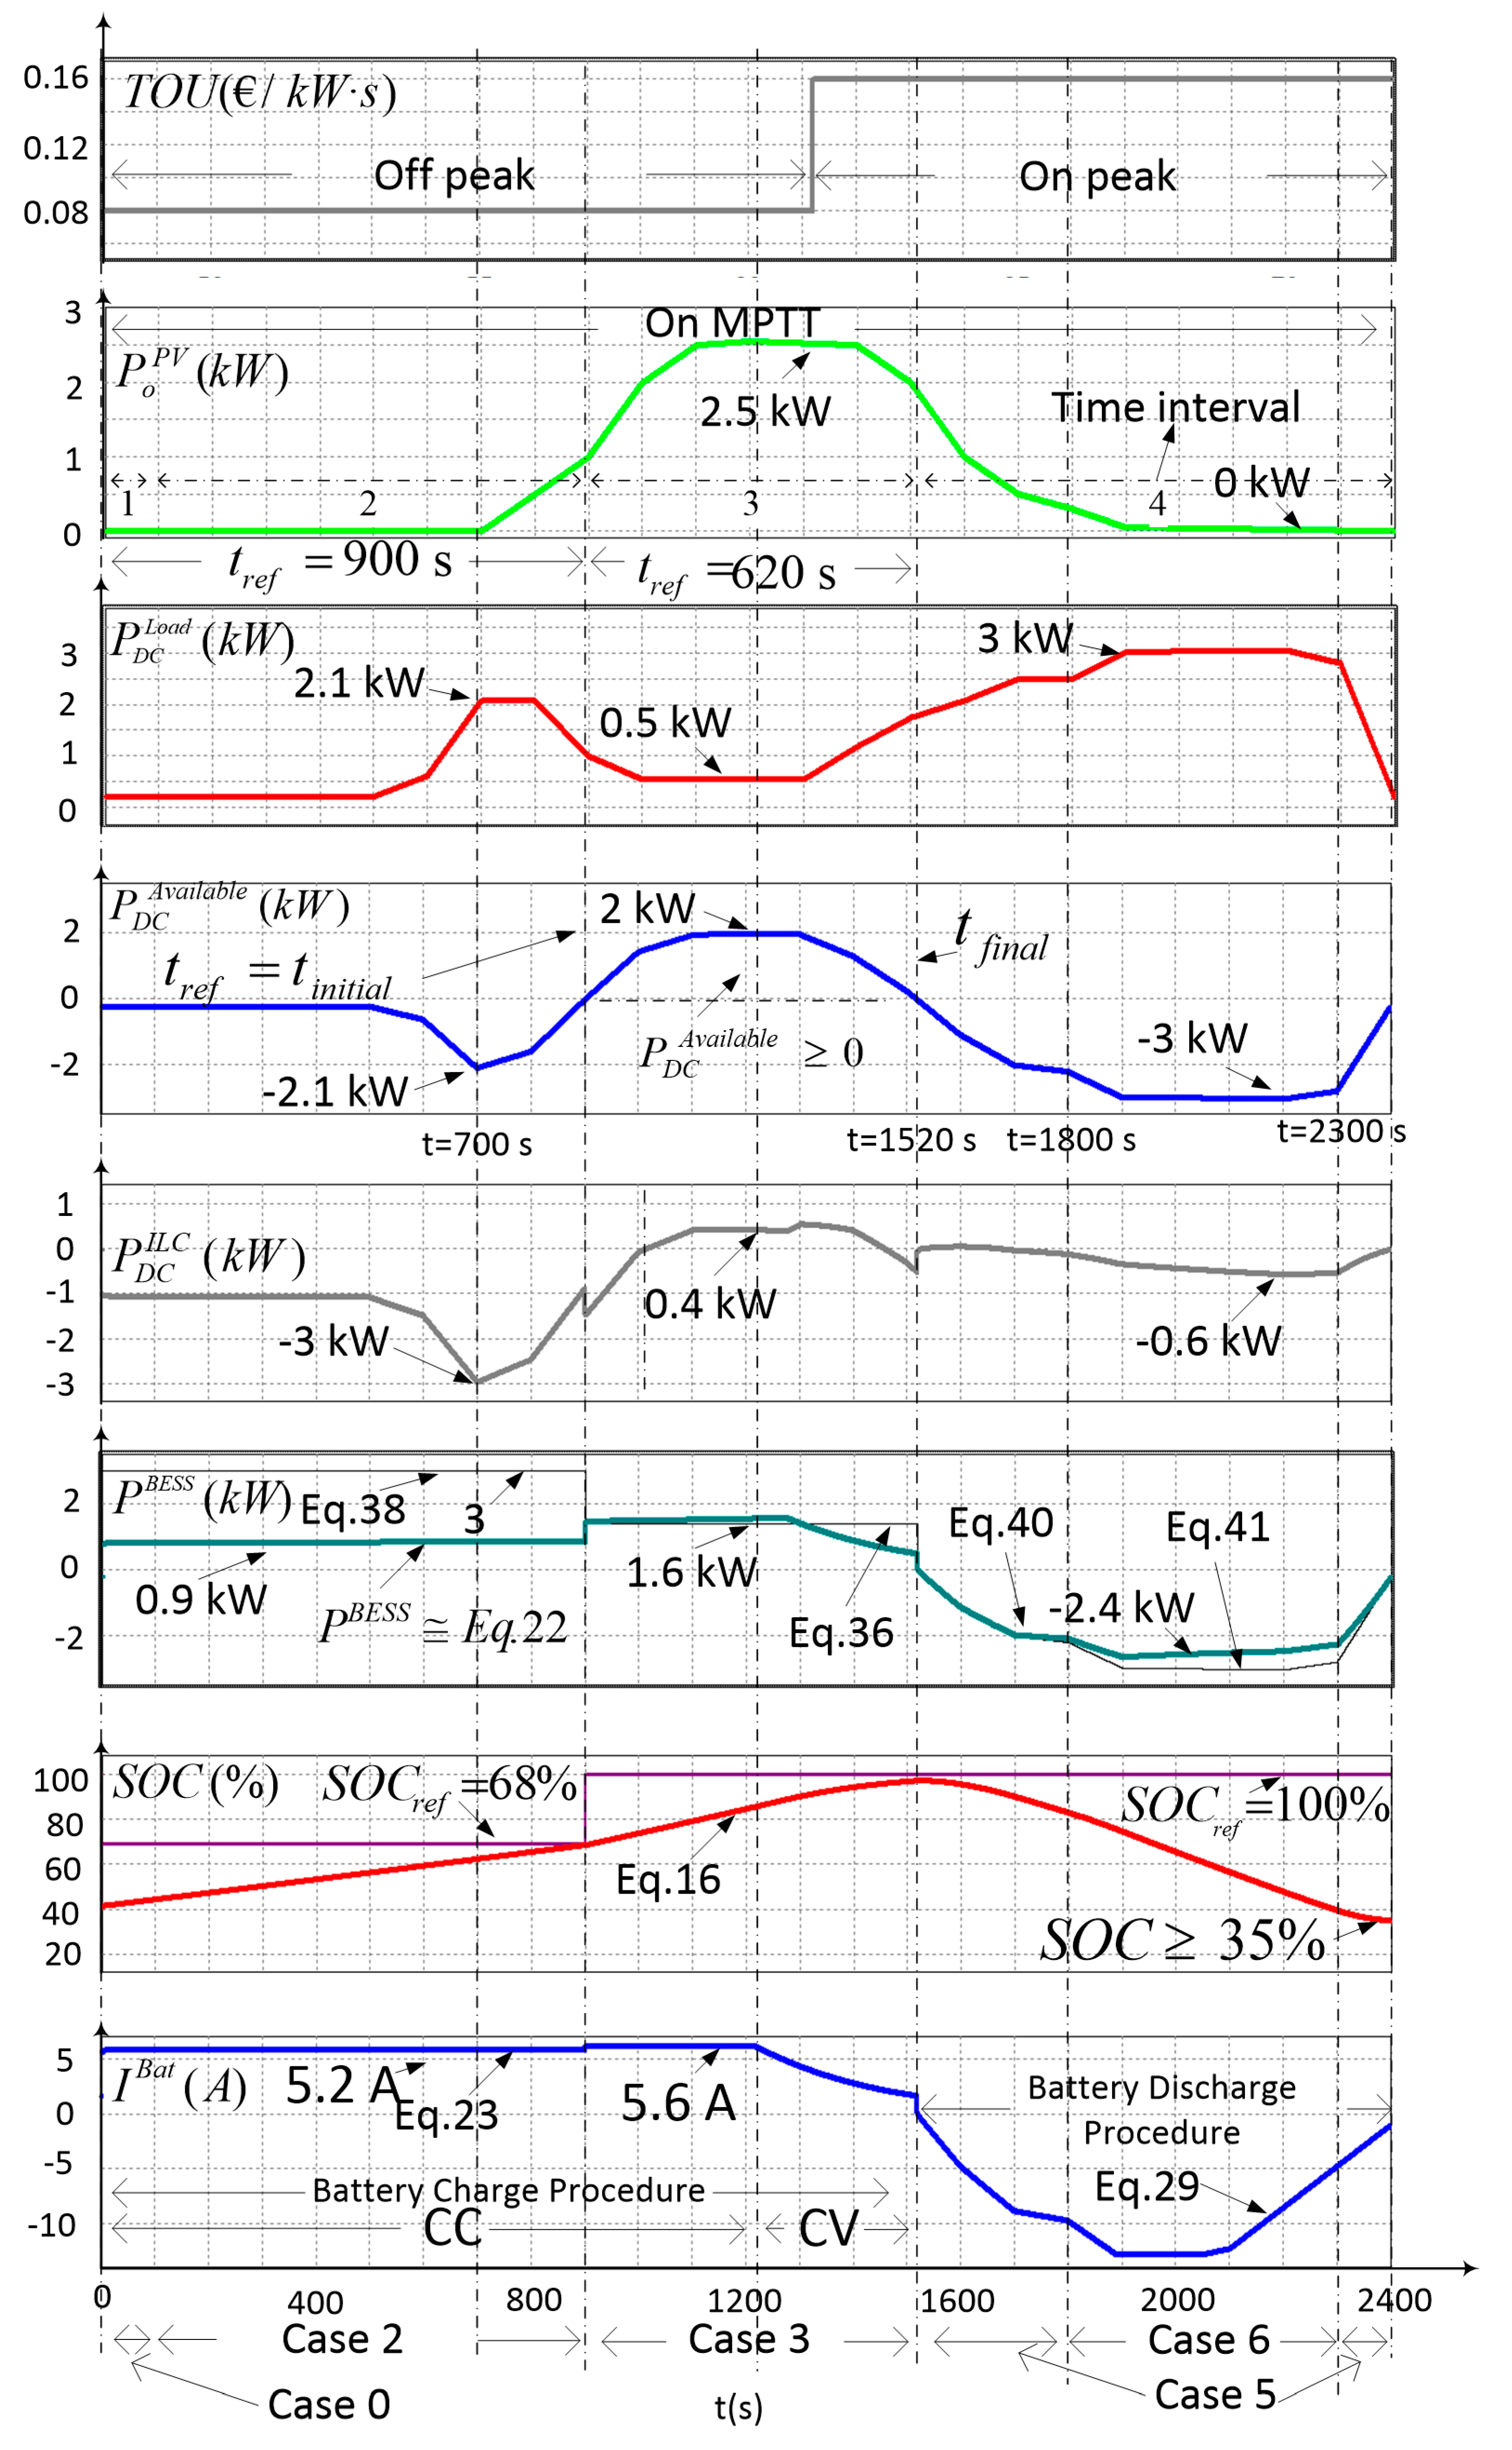
5.2. Simulation #2
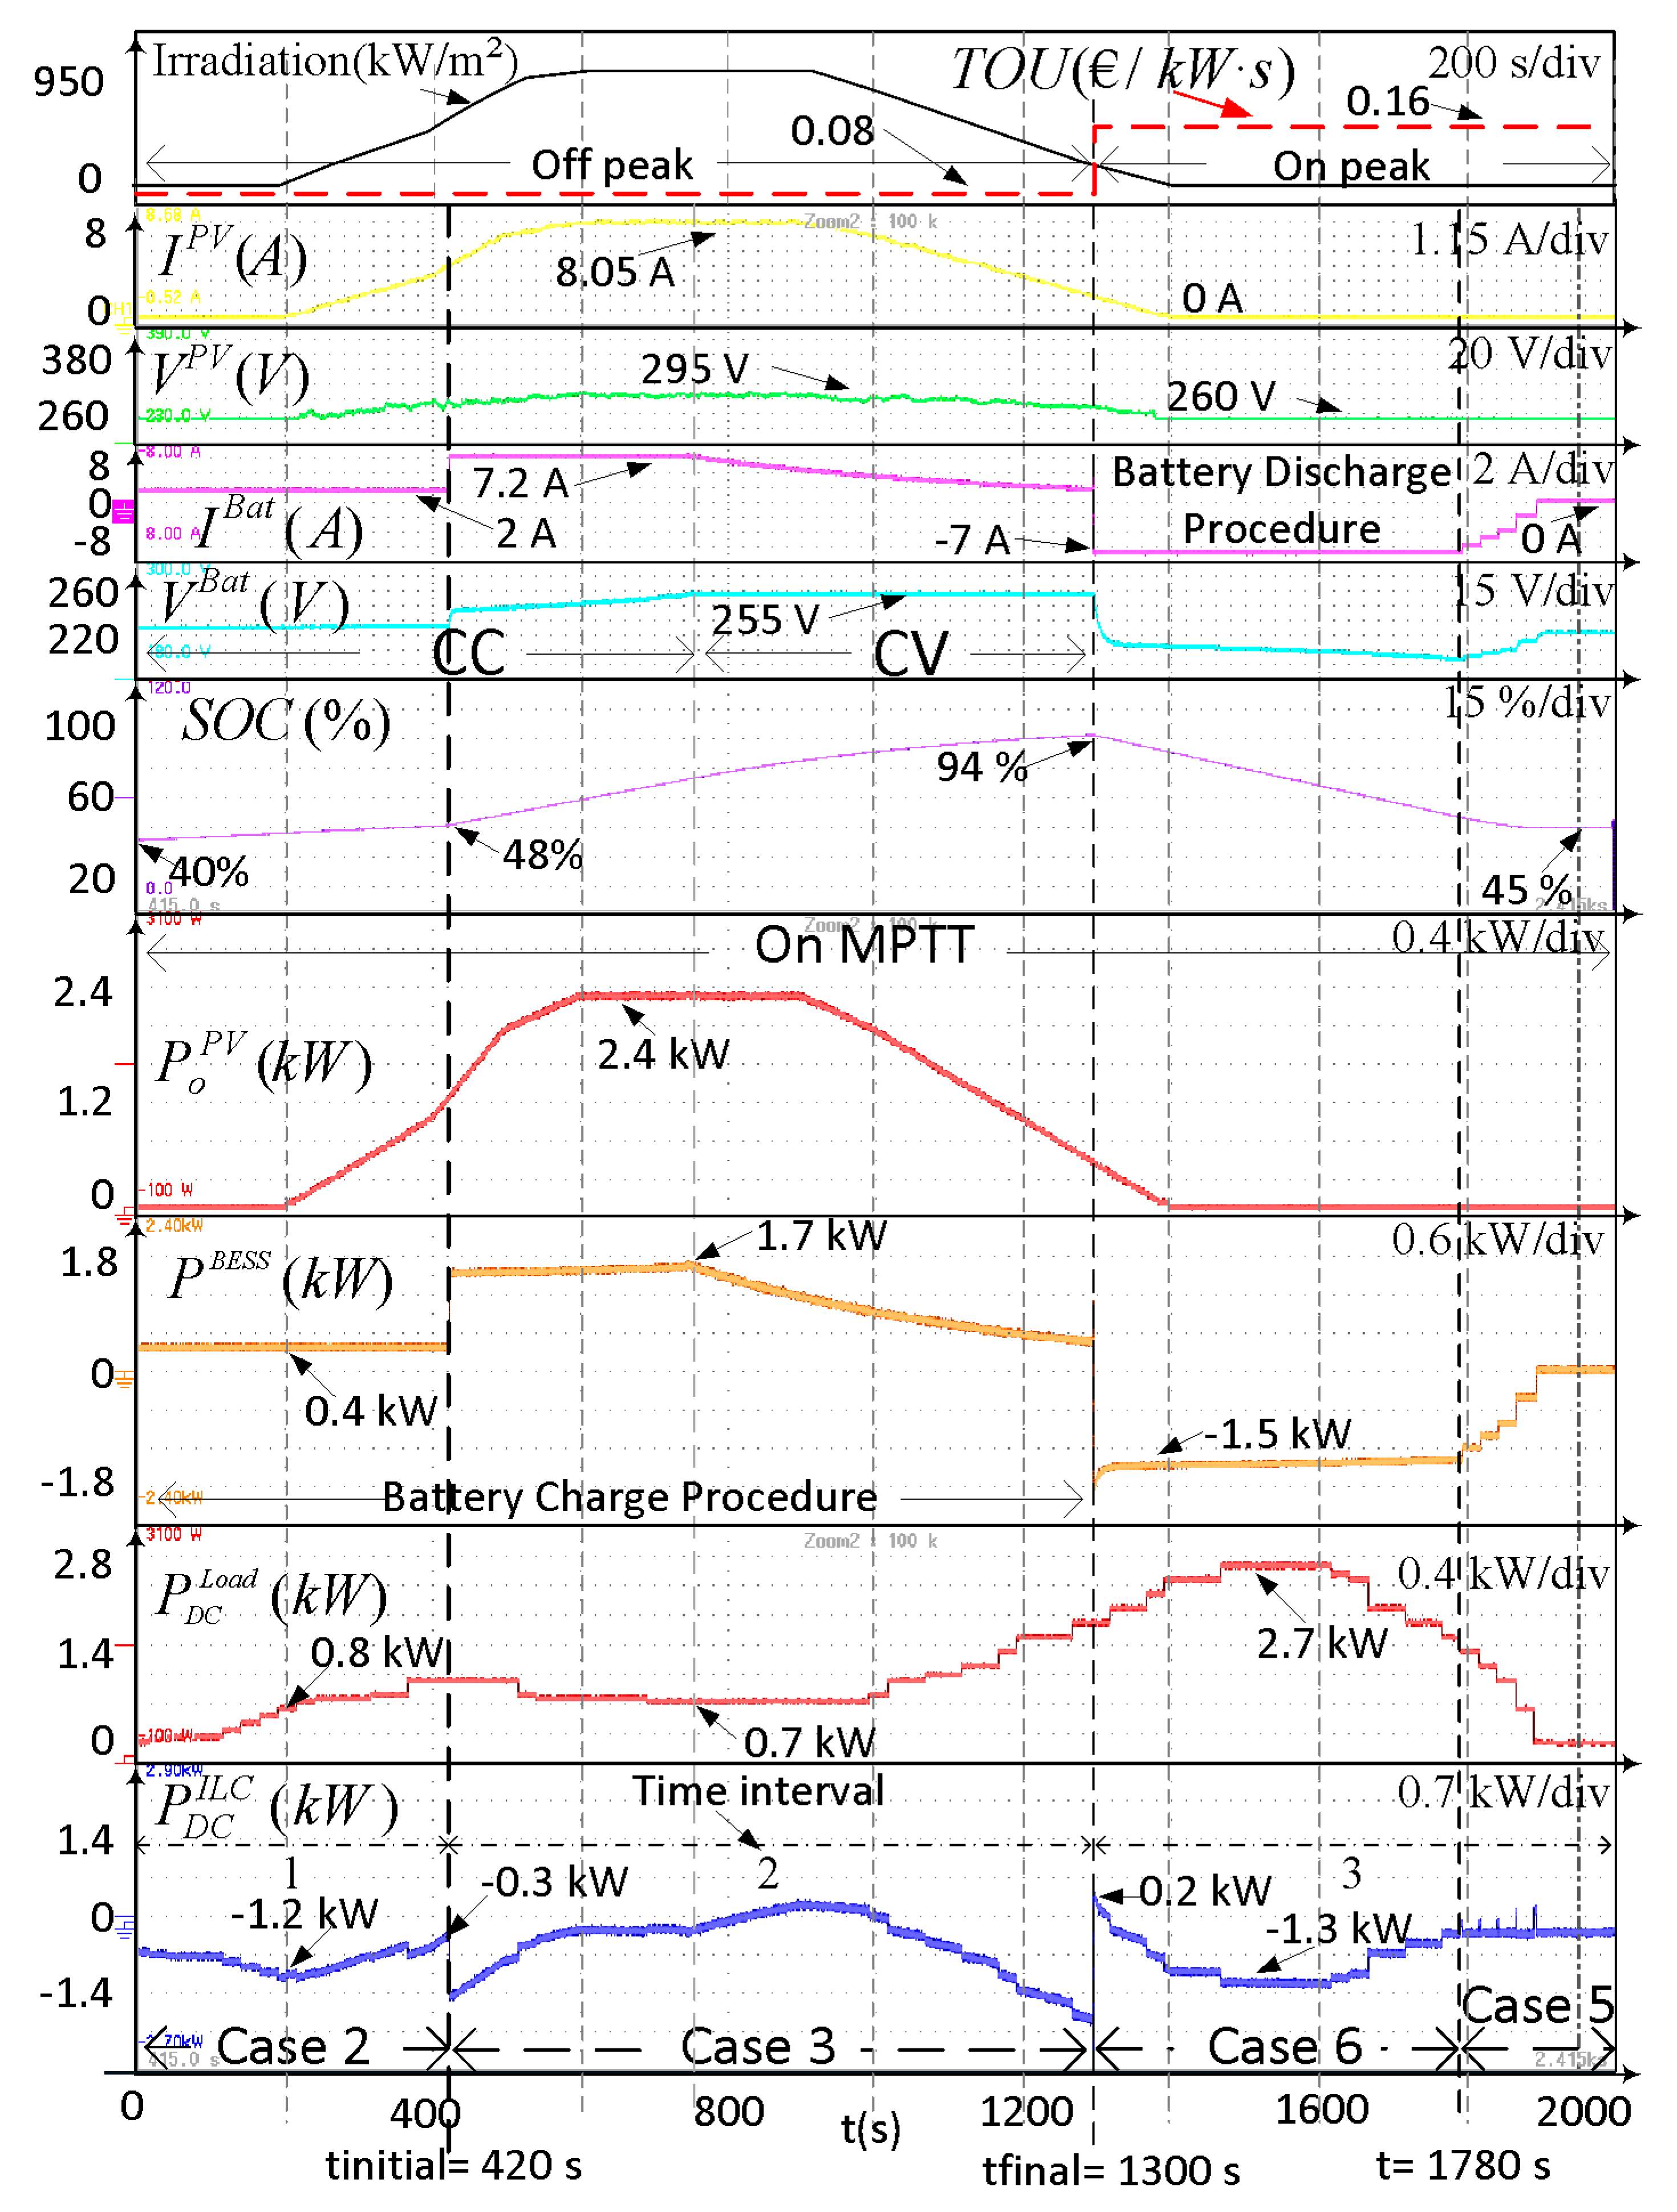
5.3. Experiment #1
5.4. Experiment #2
5.5. Experiment #3
5.6. Experiment #4
6. Conclusions
Author Contributions
Funding
Acknowledgments
Conflicts of Interest
Abbreviations
| PoPV | Power supplied by the PV arrays seen from the DC bus |
| Overall power consumed by the DC loads | |
| PGrid | Power injected from the DC microgrid to the grid |
| Power injected from the DC bus to the grid by the ILC, measured at the AC side of the ILC | |
| Power injected from the DC bus to the grid by the ILC, measured at the DC side of the ILC | |
| PBESS | Battery charge power seen from the DC bus |
| PBat | Battery charge power |
| Power available at the DC bus | |
| IGrid | RMS Current injected from the DC microgrid to the grid |
| VGrid | RMS value of the grid voltage |
| VDC | DC bus voltage |
| SOC | State of charge of the battery bank |
| IBat | Battery bank charge current |
| VBat | Battery bank voltage |
| IPV | Current supplied by the PV array |
| Overall current consumed by the DC loads | |
| Reference of the charging voltage | |
| Reference of the charging current | |
| Maximum power that can be extracted from the main grid to the MG | |
| Maximum power that can be injected from the MG to the main grid | |
| TOU | Time of use of electricity |
| Reference profiles of PV generation | |
| Reference profiles of power consumed by the loads | |
| The available power profile at the DC bus | |
| SOCref | Desired SOC in the batteries |
| Reference power for charging/discharging the batteries from/to DC bus | |
| tref | Time interval in which BESS must reach the target SOC with |
| VDC_ref | Reference of the DC bus voltage |
| Maximum power that should be extracted from the PV sources | |
| Swref | Reference of the DC load switches (load 1 to 4) |
References
- Dragičević, T.; Lu, X.; Vasquez, J.C.; Guerrero, J.M. DC Microgrids—Part I: A Review of Control Strategies and Stabilization Techniques. IEEE Trans. Power Electron. 2016, 31, 4876–4891. [Google Scholar]
- Baek, J.; Choi, W.; Chae, S. Distributed Control Strategy for Autonomous Operation of Hybrid AC/DC Microgrid. Energies 2017, 10, 373. [Google Scholar] [CrossRef]
- Rahimi-Eichi, H.; Ojha, U.; Baronti, F.; Chow, M.Y. Battery Management System: An Overview of Its Application in the Smart Grid and Electric Vehicles. IEEE Ind. Electron. Mag. 2013, 7, 4–16. [Google Scholar] [CrossRef]
- Sujitha, N.; Krithiga, S. RES based EV battery charging system: A review. Renew. Sustain. Energy Rev. 2017, 75, 978–988. [Google Scholar] [CrossRef]
- Renewables 2017 Global Status Report. Available online: http://www.ren21.net/wp-content/uploads/2017/06/17-8399_GSR_2017_Full_Report_0621_Opt.pdf (accessed on 5 July 2018).
- Chen, H.; Cong, T.N.; Yang, W.; Tan, C.; Li, Y.; Ding, Y. Progress in electrical energy storage system: A critical review. Prog. Nat. Sci. 2009, 19, 291–312. [Google Scholar] [CrossRef]
- May, G.J.; Davidson, A.; Monahov, B. Lead batteries for utility energy storage: A review. J. Energy Storage 2018, 15, 145–157. [Google Scholar] [CrossRef]
- Joseph, A.; Shahidehpour, M. Battery storage systems in electric power systems. In Proceedings of the 2006 IEEE Power Engineering Society General Meeting, Montreal, QC, Canada, 18–22 June 2006; p. 8. [Google Scholar]
- IRENA. Available online: http://www.irena.org/eventdocs/Battery%20storage%20June%201%202017%20MICHAEL%20TAYLOR%20PDF%20version.pdf (accessed on 3 February 2018).
- Hussein, A.A.; Fardoun, A.A. Design considerations and performance evaluation of outdoor PV battery chargers. Renew. Energy 2015, 82, 85–91. [Google Scholar] [CrossRef]
- Xing, Y.; Ma, E.W.M.; Tsui, K.L.; Pecht, M. Battery Management Systems in Electric and Hybrid Vehicles. Energies 2011, 4, 1840–1857. [Google Scholar] [CrossRef] [Green Version]
- Wu, D.; Tang, F.; Dragicevic, T.; Guerrero, J.M.; Vasquez, J.C. Coordinated Control Based on Bus-Signaling and Virtual Inertia for Islanded DC Microgrids. IEEE Trans. Smart Grid 2015, 6, 2627–2638. [Google Scholar] [CrossRef]
- Dou, C.; Zhang, Z.; Yue, D.; Zheng, Y. MAS-Based Hierarchical Distributed Coordinate Control Strategy of Virtual Power Source Voltage in Low-Voltage Microgrid. IEEE Access 2017, 5, 11381–11390. [Google Scholar] [CrossRef]
- Bracale, A.; Caramia, P.; Carpinelli, G.; Mancini, E.; Mottola, F. Optimal control strategy of a DC micro grid. Int. J. Electr. Power Energy Syst. 2015, 67, 25–38. [Google Scholar] [CrossRef]
- Yue, J.; Hu, Z.; Li, C.; Vasquez, J.C.; Guerrero, J.M. Economic Power Schedule and Transactive Energy through an Intelligent Centralized Energy Management System for a DC Residential Distribution System. Energies 2017, 10, 916. [Google Scholar] [CrossRef]
- Gao, L.; Liu, Y.; Ren, H.; Guerrero, J.M. A DC Microgrid Coordinated Control Strategy Based on Integrator Current-Sharing. Energies 2017, 10, 1116. [Google Scholar] [CrossRef]
- Unamuno, E.; Barrena, J.A. Hybrid AC/DC microgrids—Part II: Review and classification of control strategies. Renew. Sustain. Energy Rev. 2015, 52, 1123–1134. [Google Scholar] [CrossRef]
- Zia, M.F.; Elbouchikhi, E.; Benbouzid, M. Microgrids energy management systems: A critical review on methods, solutions, and prospects. Appl. Energy 2018, 222, 1033–1055. [Google Scholar] [CrossRef]
- Feng, X.; Shekhar, A.; Yang, F.E.; Hebner, R.; Bauer, P. Comparison of Hierarchical Control and Distributed Control for Microgrid. Electr. Power Compon. Syst. 2017, 45, 1043–1056. [Google Scholar] [CrossRef]
- De Brabandere, K.; Bolsens, B.; van den Keybus, J.; Woyte, A.; Driesen, J.; Belmans, R. A Voltage and Frequency Droop Control Method for Parallel Inverters. IEEE Trans. Power Electron. 2007, 22, 1107–1115. [Google Scholar] [CrossRef]
- Kaur, A.; Kaushal, J.; Basak, P. A review on microgrid central controller. Renew. Sustain. Energy Rev. 2016, 55, 338–345. [Google Scholar] [CrossRef]
- Marzal, S.; González-Medina, R.; Salas-Puente, R.; Figueres, E.; Garcerá, G. A Novel Locality Algorithm and Peer-to-Peer Communication Infrastructure for Optimizing Network Performance in Smart Microgrids. Energies 2017, 10, 1275. [Google Scholar] [CrossRef]
- Gamarra, C.; Guerrero, J.M. Computational optimization techniques applied to microgrids planning: A review. Renew. Sustain. Energy Rev. 2015, 48, 413–424. [Google Scholar] [CrossRef] [Green Version]
- Li, W.; Logenthiran, T.; Woo, W.L.; Phan, V.T.; Srinivasan, D. Implementation of demand side management of a smart home using multi-agent system. In Proceedings of the 2016 IEEE Congress on Evolutionary Computation (CEC), Vancouver, BC, Canada, 24–29 July 2016; pp. 2028–2035. [Google Scholar]
- Joo, I.Y.; Choi, D.H. Optimal household appliance scheduling considering consumer's electricity bill target. IEEE Trans. Consum. Electron. 2017, 63, 19–27. [Google Scholar] [CrossRef]
- Roozbehani, M.; Dahleh, M.A.; Mitter, S.K. Volatility of power grids under real-time pricing. IEEE Trans. Power Syst. 2012, 27, 1926–1940. [Google Scholar] [CrossRef]
- Carpinelli, G.; Khormali, S.; Mottola, F.; Proto, D. Optimal operation of electrical energy storage systems for industrial applications. In Proceedings of the 2013 IEEE Power & Energy Society General Meeting, Vancouver, BC, Canada, 21–25 July 2013; pp. 1–5. [Google Scholar]
- Erol-Kantarci, M.; Hussein, T.M. Prediction-based charging of PHEVs from the smart grid with dynamic pricing. In Proceedings of the IEEE Local Computer Network Conference, Denver, CO, USA, 10–14 October 2010; pp. 1032–1039. [Google Scholar]
- Hooppecke. Operating Instructions Valve Regulated Stationary Lead-Acid Batteries. Available online: http://www.hoppecke-us.com/tl_files/hoppecke/Documents/HO-US/Operating_Instructions_sealed_stationary_lead_acid_batteries_en1111.pdf (accessed on 13 October 2017).
- TAB Batteries. Available online: http://www.tabspain.com/wp-content/uploads/informacion -tecnica/renovables/curvas-y-tablas/din-41773-y-din-41774-para-baterias-pzs.pdf (accessed on 13 October 2017).
- Lu, L.; Han, X.; Li, J.; Hua, J.; Ouyang, M. A review on the key issues for lithium-ion battery management in electric vehicles. J. Power Sources 2013, 226, 272–288. [Google Scholar] [CrossRef]
- Hussein, A.A.; Batarseh, I. A Review of Charging Algorithms for Nickel and Lithium Battery Chargers. IEEE Trans. Veh. Technol. 2011, 60, 830–838. [Google Scholar] [CrossRef]
- Shen, W.; Vo, T.T.; Kapoor, A. Charging algorithms of lithium-ion batteries: An overview. In Proceedings of the 2012 7th IEEE Conference on Industrial Electronics and Applications (ICIEA), Singapore, 18–20 July 2012; pp. 1567–1572. [Google Scholar]
- Hesse, H.C.; Schimpe, M.; Kucevic, D.; Jossen, A. Lithium-Ion Battery Storage for the Grid—A Review of Stationary Battery Storage System Design Tailored for Applications in Modern Power Grids. Energies 2017, 10, 2107. [Google Scholar] [CrossRef]
- Analog Devices. Available online: http://www.analog.com/media/en/technical-documentation/technical-articles/A-Closer-Look-at-State-Of-Charge-and-State-Health-Estimation-Techniques-....pdf (accessed on 1 February 2018).
- Fathoni, G.; Widayat, S.A.; Topan, P.A.; Jalil, A.; Cahyadi, A.I.; Wahyunggoro, O. Comparison of State-of-Charge (SOC) estimation performance based on three popular methods: Coulomb counting, open circuit voltage, and Kalman filter. In Proceedings of the 2017 2nd International Conference on Automation, Cognitive Science, Optics, Micro Electro-Mechanical System, and Information Technology (ICACOMIT), Jakarta, Indonesia, 23–24 October 2017; pp. 70–74. [Google Scholar]
- Lyu, C.; Cong, W.; Liu, H.; Zhang, L. A novel parameters acquisition method based on electrochemical impedance spectroscopy mathematical model in lithium ion cell. In Proceedings of the 2017 Prognostics and System Health Management Conference (PHM-Harbin), Harbin, China, 9–12 July 2017; pp. 1–8. [Google Scholar]
- Hu, X.; Li, S.E.; Yang, Y. Advanced Machine Learning Approach for Lithium-Ion Battery State Estimation in Electric Vehicles. IEEE Trans. Transp. Electrification 2016, 2, 140–149. [Google Scholar] [CrossRef]
- Piller, S.; Perrin, M.; Jossen, A. Methods for state-of-charge determination and their applications. J. Power Sources 2001, 96, 113–120. [Google Scholar] [CrossRef]
- Kim, D.; Goh, T.; Park, M.; Kim, S.W. Fuzzy Sliding Mode Observer with Grey Prediction for the Estimation of the State-of-Charge of a Lithium-Ion Battery. Energies 2015, 8, 12409–12428. [Google Scholar] [CrossRef] [Green Version]
- Tian, Y.; Li, D.; Tian, J.; Xia, B. State of charge estimation of lithium-ion batteries using an optimal adaptive gain nonlinear observer. Electrochim. Acta 2017, 225, 225–234. [Google Scholar] [CrossRef]
- Rivera-Barrera, J.P.; Muñoz-Galeano, N.; Sarmiento-Maldonado, H.O. SoC Estimation for Lithium-ion Batteries: Review and Future Challenges. Electronics 2017, 6, 102. [Google Scholar] [CrossRef]
- Kozlowski, J.D. Electrochemical Cell Prognostics Using Online Impedance Measurements and Model-Based Data Fusion Techniques. In Proceedings of the IEEE Aerospace Conference, Big Sky, MT, USA, 8–15 March 2003; Volume 7, pp. 3257–3270. [Google Scholar]
- Xiong, R.; Cao, J.; Yu, Q.; He, H.; Sun, F. Critical Review on the Battery State of Charge Estimation Methods for Electric Vehicles. IEEE Access 2018, 6, 1832–1843. [Google Scholar] [CrossRef]
- Lin, C.H.; Wang, C.-M.; Lin, W.-J. A SOC-based intelligent charger with multi-charging mode. In Proceedings of the 2015 IEEE 2nd International Future Energy Electronics Conference (IFEEC), Taipei, Taiwan, 1–4 November 2015; pp. 1–6. [Google Scholar]
- Oliveira, T.R.; Gonçalves Silva, W.W.A.; Donoso-Garcia, P.F. Distributed Secondary Level Control for Energy Storage Management in DC Microgrids. IEEE Trans. Smart Grid 2017, 8, 2597–2607. [Google Scholar] [CrossRef]
- Velho, R.; Beirão, M.; Calado, M.R.; Pombo, J.; Fermeiro, J.; Mariano, S. Management System for Large Li-Ion Battery Packs with a New Adaptive Multistage Charging Method. Energies 2017, 10, 605. [Google Scholar] [CrossRef]
- Xue, F.; Ling, Z.; Yang, Y.; Miao, X. Design and Implementation of Novel Smart Battery Management System for FPGA Based Portable Electronic Devices. Energies 2017, 10, 264. [Google Scholar] [CrossRef]
- Doan, V.T.; Vu, V.B.; Vu, H.N.; Tran, D.H.; Choi, W. Intelligent charger with online battery diagnosis function. In Proceedings of the 2015 9th International Conference on Power Electronics and ECCE Asia (ICPE-ECCE Asia), Seoul, Korea, 1–5 June 2015; pp. 1644–1649. [Google Scholar]
- Diaz, J.; Martin-Ramos, J.A.; Pernia, A.M.; Nuno, F.; Linera, F.F. Intelligent and universal fast charger for Ni-Cd and Ni-MH batteries in portable applications. IEEE Trans. Ind. Electron. 2004, 51, 857–863. [Google Scholar] [CrossRef]
- Mundra, T.S.; Kumar, A. An Innovative Battery Charger for Safe Charging of NiMH/NiCd Batteries. IEEE Trans. Consum. Electron. 2007, 53, 1044–1052. [Google Scholar] [CrossRef]
- Hu, X.; Martinez, C.M.; Yang, Y. Charging, Power management, and battery degradation mitigation in plug-in hybrid electric vehicles: A unified cost-optimal approach. Mech. Syst. Signal Process. 2017, 87, 4–16. [Google Scholar] [CrossRef]
- Yong, S.O.; Rahim, N.A. Development of on-off duty cycle control with zero computational algorithm for CC-CV Li ion battery charger. In Proceedings of the 2013 IEEE Conference on Clean Energy and Technology (CEAT), Lankgkawi, Malaysia, 18–20 November 2013; pp. 422–426. [Google Scholar]
- Salas-Puente, R.; Marzal, S.; González-Medina, R.; Figueres, E.; Garcera, G. Experimental Study of a Centralized Control Strategy of a DC Microgrid Working in Grid Connected Mode. Energies 2017, 10, 1627. [Google Scholar] [CrossRef]
- Monteiro, V.; Ferreira, J.C.; Melendez, A.A.; Couto, C.; Afonso, J.L. Experimental Validation of a Novel Architecture Based on a Dual-Stage Converter for Off-Board Fast Battery Chargers of Electric Vehicles. IEEE Trans. Veh. Technol. 2017, 67, 1000–1011. [Google Scholar] [CrossRef]
- Bhatt, M.; Hurley, W.G.; Wolfle, W.H. A new approach to intermittent charging of valve-regulated lead-acid batteries in standby applications. IEEE Trans. Ind. Electron. 2005, 52, 1337–1342. [Google Scholar] [CrossRef]
- Hussein, A.A.H.; Pepper, M.; Harb, A.; Batarseh, I. An efficient solar charging algorithm for different battery chemistries. In Proceedings of the 2009 IEEE Vehicle Power and Propulsion Conference, Dearborn, MI, USA, 7–10 September 2009; pp. 188–193. [Google Scholar]
- Gallardo-Lozano, J.; Milanés-Montero, M.I.; Guerrero-Martínez, M.A.; Romero-Cadaval, E. Electric vehicle battery charger for smart grids. Electr. Power Syst. Res. 2012, 90, 18–29. [Google Scholar] [CrossRef]
- López, J.; Seleme, S.I.; Donoso, P.F.; Morais, L.M.F.; Cortizo, P.C.; Severo, M.A. Digital control strategy for a buck converter operating as a battery charger for stand-alone photovoltaic systems. Sol. Energy 2016, 140, 171–187. [Google Scholar] [CrossRef]
- Dragičević, T.; Guerrero, J.M.; Vasquez, J.C.; Škrlec, D. Supervisory Control of an Adaptive-Droop Regulated DC Microgrid with Battery Management Capability. IEEE Trans. Power Electron. 2014, 29, 695–706. [Google Scholar] [CrossRef]
- Chen, M.; Rincon-Mora, G.A. Accurate electrical battery model capable of predicting runtime and I-V performance. IEEE Trans. Energy Convers. 2006, 21, 504–511. [Google Scholar] [CrossRef] [Green Version]
- Support, T. Installation, Commissioning and Operation Handbook for Gel-Vrla-Batteries. 2003. Available online: http://www.sonnenschein. org/PDF%20files/GelHandbookPart2.pdf (accessed on 13 October 2017).
- PSIM10.0; PowerSim: Rockville, Maryland, MD, USA, 2016.


| Battery Type | Power Rating (MW) | Discharge Time | Life Time (Years) | Cycle Life (Cycles) | Reliability and Efficiency (%) | Cost (USD/kW·h) |
|---|---|---|---|---|---|---|
| Flooded Lead Acid, VRLA | 0–20 | Seconds–hours | 5–15 | 1500–9000 | 70–90% | 180–300 |
| Lithium ion | 0–0.1 | Minutes–hours | 5–15 | >10,000 | Close to 100% | 350–1100 |
| Battery Management System | |||||||||||
|---|---|---|---|---|---|---|---|---|---|---|---|
| Monitoring | Protection | Control | Communication System | Applications | |||||||
| Temperature | Overcharge | Overcurrent | Communication Loss | Reference | |||||||
| Battery Model | Estimation | ||||||||||
| Thermal Management | Optimization | ||||||||||
| SOC | SOH | ||||||||||
| – (1) | • | – | – | – | – | – | – | – | • | Uninterruptible power supplies | [45] |
| • | • | – | – | • | • | • | • | • | • | DC Microgrid | [46] |
| – | • | – | • | • | • | • | – | – | • | Uninterruptible power supplies | [47] |
| – | • | – | • | • | • | – | • | • | – | Portable electronic devices | [48] |
| • | – | • | – | • | • | – | – | – | – | Motorcycles, cars, wheelchairs, UPS | [49] |
| – | – | – | • | • | • | – | – | – | • | Portable electronics devices | [50] |
| – | – | • | • | • | • | – | • | • | • | Portable electronics devices | [51] |
| – | • | • | • | • | • | – | • | • | – | Hybrid electric vehicles | [52] |
| – | – | – | • | • | • | – | • | • | • | Portable applications | [53] |
| • | • | – | – | • | • | – | • | • | • | DC Microgrid | [54] |
| – | • | – | • | • | • | – | – | – | – | Electric vehicles | [55] |
| – | • | – | • | • | • | – | • | • | – | Motorcycles, cars, wheelchairs | [56] |
| • | • | – | • | • | • | – | – | – | – | Photovoltaic systems | [57] |
| – | • | – | – | • | • | – | – | – | – | Hybrid electric vehicles and Electric vehicles | [58] |
| – | • | – | • | • | • | – | – | – | – | Photovoltaic systems | [59] |
| DC/DC Converter | Battery Specifications | Battery Bank Parameters for Complying DIN 41773 |
|---|---|---|
| Sun Power VRM 12V105 | ||
| = 3 kW | = 12 V | −10 °C < TBat < 45 °C |
| Fsw = 16 kHz | = 20 A | = 194 V |
| Ci = 1 mF | = 216 V | = 260 V |
| Co = 1 mF | QRated = 105 A·h | = 1 A |
| LBat = 5.4 mH | Q100 = 101 A·h | tCh < 48 h |
| ηBESS = 0.97 | ∆ = 0.02· | IC5 ≅ 20A |
| VDC = 400 V ± ∆VDC | ∆ = 0.1· | IC20 ≅ 5A |
| ∆VDC = 20 V | DOD = 65% |
| Description | Transfer Function |
|---|---|
| Low Pass Filter | |
| PWM Modulator gain | |
| Battery Current-loop regulator | |
| Battery Voltage-loop regulator | |
| Current Charge/Discharge-loop gain | |
| Voltage-loop gain |
| MGCC | MG Operator | Power Converters | |||
|---|---|---|---|---|---|
| ILC | BESS | PV | DC Load | ||
| Output reference values (1) | VDC_ref | SOCref tref | Swref = {Sw1ref, Sw2ref, Sw3ref, Sw4ref} | ||
| Input | Reference Profiles | Input measurement (2) | |||
| , TOU, , | PGrid | SOC PBESS | PoPV | ||
| PV | BESS | DC Load | Output References | ||
|---|---|---|---|---|---|
| Mode | Charging Procedure | ||||
| Case 0 | Case 0 is applied at the beginning of each day. The MGCC performs the daily planning of the power dispatch at the MG. To perform this, it uses the data of the power profiles and TOU sent from the MG operator. | ||||
| Case 1 | PV = Off | Charge mode | CC-CV based on Equation (46) | Load shedding funtionality | =Equation (46), SOCref = 100% tref = tinitial, Swref = {0 or 1} |
| Case 1 indicates that the power management profile predicted for the day has not been correctly fulfilled. This case is applied when there is not power available at the DC bus, the SOC is less than 90% or when the case 0 has failed. In this case, the MGCC complies with the power limit established by the MG operator, without taking into account the electricity tariff in the power management of the MG. The BESS will operate in charge mode, but won’t be able to assure the DIN41773 charge procedure. | |||||
| Case 2 | PV = Off | Charge mode | DIN41773 | All Loads Connected | = Equation (38), SOCref = Equation (37) tref = tinitial, Swref = {1, 1, 1, 1} |
| Case 2 is applied when there is not PV generation, the SOC is less than 90% and the TOU is off-peak. The MGCC establishes the target SOC (SOCref = Equation (37)) at the time interval tinitial and with a constant power to charge the batteries. In this case, the BESS can fulfill the DIN41773 charge procedure. | |||||
| Case 3 | PV = On On MPPT | Charge mode | DIN41773 | All Loads Connected | =Equation (36), SOCref= 100% tref = tfinal − tinitial, Swref = {1, 1, 1, 1} |
| Case 3 is applied when the PV power is enough to energize all the DC loads, the SOC is less than 90% and the TOU is off-peak. The MGCC sets the value of SOCref at its maximum possible value (SOCref = 100%) at the time interval tfinal − tinitial with a constant power = Equation (36) to charge the batteries. In this case, the BESS can fulfill the DIN41773 charge procedure. | |||||
| Case 4 | PV = On Off MPPT | Charge mode | CC-CV based on Equation (47) | All Loads Connected | = Equation (47), SOCref = 100% tref = tfinal − tinitial, Swref = {1, 1, 1, 1} = Equation (43) |
| In case 4 a surplus of energy is available from the PV generation and the SOC is less than 90%. The DC loads and the batteries cannot absorb the excess of power at the DC bus and the Maximum Power Point Tracking is disabled (Off-MPPT). Power is injected into the grid below the limit imposed by the MG operator. The MGCC sets the target SOC to 100% (SOCref = 100%) in the time interval tfinal − tinitial and the batteries are charged at a power according to Equation (47). | |||||
| Case 5 | PV = Off | Discharge | - | All Loads Connected | = Equation (40), Swref = {1, 1, 1, 1} |
| Case 5 is applied when there is not PV generation, TOU is on-peak and SOC is greater than 90%. The BESS must supply power to the DC bus from the batteries. The discharge power of the batteries Equation (40) is determined to avoid a SOC lower than 35%. | |||||
| Case 6 | PV = Off | Discharge | - | All Loads Connected | = Equation (41) Swref = {1, 1, 1, 1} |
| Case 6 is applied when there is not PV generation and the TOU is on-peak. This case prevents discharge the batteries to a SOC lower than SOCMIN. The batteries are discharged with a maximum power given by Equation (41). | |||||
| ILC | BESS | PV |
|---|---|---|
| = 10 kW | = 3 kW | = 2.5 kW |
| VGrid = 230 V and FGrid = 50 Hz | VBat = 216 V | VPV = 306 V |
| VDC = 400 V | Fsw_BESS = 16 kHz | Fsw_PV = 16 kHz |
| Fsw_ILC = 12.8 kHz | TBat = 25 °C, QRated = 2 A·h | PV Panel: Atersa A-250P GSE |
| Time(s) | |||||||||||||||||
|---|---|---|---|---|---|---|---|---|---|---|---|---|---|---|---|---|---|
| 0 | 500 | 600 | 700 | 800 | 900 | 1000 | 1100 | 1200 | 1300 | 1400 | 1500 | 1600 | 1700 | 1800 | 1900 | 2200 | 2300 |
| (kW) | |||||||||||||||||
| 0 | 0 | 0 | 0.05 | 0.5 | 1 | 2 | 2.5 | 2.5 | 2.5 | 2.5 | 2 | 1 | 0.5 | 0.3 | 0.1 | 0 | 0 |
| (kW) | |||||||||||||||||
| 0.2 | 0.2 | 0.6 | 2 | 2 | 1 | 0.5 | 0.5 | 0.5 | 0.5 | 1.2 | 1.8 | 2 | 2.5 | 2.5 | 3.2 | 3 | 2.8 |
| TOU (€/kW·s) | |||||||||||||||||
| 0.08 | 0.16 | ||||||||||||||||
| Power dispatch limits established by the electric company | |||||||||||||||||
| = 10 kW and = 4 kW | |||||||||||||||||
© 2018 by the authors. Licensee MDPI, Basel, Switzerland. This article is an open access article distributed under the terms and conditions of the Creative Commons Attribution (CC BY) license (http://creativecommons.org/licenses/by/4.0/).
Share and Cite
Salas-Puente, R.; Marzal, S.; Gonzalez-Medina, R.; Figueres, E.; Garcera, G. Practical Analysis and Design of a Battery Management System for a Grid-Connected DC Microgrid for the Reduction of the Tariff Cost and Battery Life Maximization. Energies 2018, 11, 1889. https://doi.org/10.3390/en11071889
Salas-Puente R, Marzal S, Gonzalez-Medina R, Figueres E, Garcera G. Practical Analysis and Design of a Battery Management System for a Grid-Connected DC Microgrid for the Reduction of the Tariff Cost and Battery Life Maximization. Energies. 2018; 11(7):1889. https://doi.org/10.3390/en11071889
Chicago/Turabian StyleSalas-Puente, Robert, Silvia Marzal, Raul Gonzalez-Medina, Emilio Figueres, and Gabriel Garcera. 2018. "Practical Analysis and Design of a Battery Management System for a Grid-Connected DC Microgrid for the Reduction of the Tariff Cost and Battery Life Maximization" Energies 11, no. 7: 1889. https://doi.org/10.3390/en11071889