Bilevel Optimal Dispatch Strategy for a Multi-Energy System of Industrial Parks by Considering Integrated Demand Response

1
School of Electrical and Electronic Engineering, Shandong University of Technology, Zibo 255000, Shandong, China
2
Guangzhou Power Supply Bureau Co. Ltd., Guangzhou 510620, Guangdong, China
*
Author to whom correspondence should be addressed.
Energies 2018, 11(8), 1942; https://doi.org/10.3390/en11081942
Submission received: 28 May 2018
/
Revised: 8 July 2018
/
Accepted: 16 July 2018
/
Published: 26 July 2018
(This article belongs to the Special Issue Grid-Scale Energy Storage Management)
Abstract
:To combat energy shortage, the multi-energy system has gained increasing interest in contemporary society. In order to fully utilize adjustable multi-energy resources on the demand side and reduce interactive compensation, this paper presents an integrated demand response (IDR) model in consideration of conventional load-shedding and novel resource-shifting, due to the fact that participants in IDR can use more abundant resources to reduce the consumption of energy. In the proposed IDR, cooling, heating, electricity, gas and so forth are considered, which takes the connection between compensation and load reductions into consideration. Furthermore, a bilevel optimal dispatch strategy is proposed to decrease the difficulty in coordinated control and interaction between lower-level factories and upper-level multi-energy operators in industrial parks. In this strategy, resources in both multi-energy operator and user sides are optimally controlled and scheduled to maximize the benefits under peak shifting constraint. In the normal operation mode, this strategy can maximize the benefits to users and multi-energy operators. Particularly in heavy load conditions, compared to the conventional electricity demand response, there are more types of adjustable resources, more flexibility, and lower interactive compensations in IDR. The results indicate that optimal operation for factories and multi-energy operators can be achieved under peak shifting constraint and the overall peak power value in industrial park is reduced.
1. Introduction
With the increasing global energy crisis, the consensus is that low energy efficiency and high energy costs, due to separated planning and operation for cooling, heating, electricity, and gas systems, are the most important issues to be solved [1,2]. Due to its advantages in improving energy efficiency, reducing operational costs, and enhancing dispatching flexibility, the multi-energy system (MES) emerges as an attractive solution [3].
MES is a complex integrated system containing many subsystems, such as cooling, heating, electricity, gas, etc. [4,5]. There are various energy conversion devices in MES, including combined cooling, heating and power (CCHP), combined heat and power (CHP), wind turbine (WT), gas boiler (GB), gas turbine (GT), micro turbine (MT), electric air conditioner (EAC), absorption chiller (AC), heat pump (HP), energy storage (ES), etc. [6,7]. Energy efficiency can be improved by the complementary and cascade utilization of various energy resources [8].
From the perspective of an external power network, MES can be regarded as a controllable and flexible integration unit to support the beneficial interaction with the power network, and demand response (DR) plays an important role in the interaction [9]. Currently, electricity demand response has been widely used in power systems for peak-load shifting, to obtain the benefits of reducing the reserve capacity and postponing equipment investment [10,11]. With more and more implementation of distributed generation and microgrid, DR starts to be actively applied in commercial building microgrids and residential energy systems [12,13]. In [14], a framework for home microgrids considering coalition game and demand-side management is presented. Participation of residential players can be improved and profits can be increased by the optimal use of the existing electrical/thermal resources in residential microgrids. In [15], a dynamic optimal dispatching strategy for a small building microgrid utilizing virtual energy storage system is discussed. The virtual energy storage system will discharge when the electricity price is high, so the operational costs can be reduced. In this strategy, only thermostatically controlled loads are regarded as flexible resources. An integrated model of residential MES is designed in [16] to achieve optimal operation of energy devices. The objective is to minimize the user’s energy costs. By applying home load management, a user’s electricity load can be shifted to low price periods. In this paper, relatively less flexible resources are discussed and only time-based DR is taken into consideration. According to [17,18], an overload condition of the distribution transformer will be caused on account of the increasing number of electric vehicles. To avoid distribution transformer upgrading and reforming, DR can be used as a load shaping tool. The detailed strategy and flow are described, but flexible loads are still restricted to conventional load-shifting.
Given what has been discussed above, the DR is mostly applied in a single electricity system, which only takes electricity load-shifting and electricity load-shedding into consideration. Flexible DR is only possible when users have some shiftable or curtailable loads. Meanwhile, the electricity usage habit and electricity consumption will be greatly impacted to affect users’ comfort and satisfaction in energy consumption. Therefore, it is obvious that adjustable resources on the demand side cannot be fully utilized by conventional electricity DR.
The decrease of total energy consumption without reducing the user’s comfort and satisfaction can be realized in integrated demand response (IDR), utilizing various complementary and coupling energies in MES such as cooling, heating, electricity, and gas [19,20]. The cooling, heating, electricity, and gas are integrated in IDR to maintain an energy supply–demand balance at peak periods. The basic concept and characteristics of IDR are briefly introduced in [21]. By considering energy market prices, users can cut down operational costs by adjusting the dispatch strategy of cooling, heating, electricity, and gas in MES. According to [22], the gas-electricity multi-energy system is modeled. The peak electricity and gas load can be coordinated by using the optimized demand response. However, the model of gas demand is relatively simple and so the details are not described. The integrated demand response program is built for hybrid gas and electricity systems in [23,24]. The energy resources of the smart energy hubs are able to be reasonably switched based on electricity price and its changes. Both smart energy hubs and utility companies can benefit from the IDR program. However, the devices discussed in this paper only involve a micro turbine and gas boiler. A stochastic optimization strategy of MES considering the thermal energy market and demand response is given in [25]. Stochastic programming is used to solve the uncertainties of demand, prices, and wind speed. The MES energy cost can be significantly decreased by the thermal demand response, but the cooling and gas DR are not taken into consideration. In [26], optimal operation of hybrid electricity, gas, and heating systems considering IDR is proposed to improve the energy efficiency and the ability to accommodate renewable energy sources. Unfortunately, fewer details are considered in the model of IDR, so IDR is not fully and clearly described.
Compared to small commercial buildings and smart houses, the scale of an industrial park is usually larger. In addition, the load of an industrial park accounts for a large share of the present power system, so the potential benefit of industrial park peak-load shifting is huge. However, there are few studies on multi-energy systems of industrial parks considering integrated demand response. Moreover, due to many interested parties and energy conversion devices in an industrial park, it is difficult to coordinate the multiple sources of energy. Therefore, a bilevel optimal dispatch strategy for a park-level multi-energy system considering integrated demand response is proposed in this paper.
The main contributions of this paper are as follows:
- An integrated demand response model is built. In this model, the demand response for heating, cooling, and electricity is taken into consideration rather than single conventional electricity. There are more types of adjustable resources, more flexibility, and lower interactive compensations in the IDR program.
- A bilevel optimal dispatch strategy is proposed to support the complex dispatch scheme and interaction of the industrial park. Resources in both multi-energy operator and factory sides are optimally controlled and scheduled with an economic objective under peak shifting constraints. The maximum interests of the lower-level factories and upper-level multi-energy operators can be ensured. A win-win situation for both multi-energy operator and factories can be created with this strategy. Meanwhile, computational difficulties and conflicts of interest can be eliminated.
- To evaluate the validity and practicality of the strategy proposed in this study, four cases are discussed. The results show that the maximum benefit of the lower-level factories and upper-level multi-energy operator can be ensured. In heavy load conditions, to handle emergencies in the power network, the most economical adjustable resources are chosen by the multi-energy operator to ensure the electricity balance. Moreover, the proposed model of integrated demand response and bilevel optimal dispatch strategy in this paper will be adopted by an actual multi-energy system demonstration project in China.
The rest of this paper is organized as follows: a device model of a multi-energy system is provided in Section 2. An integrated demand response model is established in Section 3. The bilevel optimal dispatch strategy model is proposed in Section 4. The case studies and discussion are described in Section 5. Finally, the main conclusions are summarized in Section 6.
2. Device Model of Multi-Energy System
2.1. Model of CCHP
In a CCHP unit, natural gas is consumed by GT to generate electricity, and natural gas is consumed by GB to generate heating. Waste heat is recovered by a heat recovery steam generator (HRSG) and absorption chiller (AC). CCHP is more able than a conventional thermal power plant to increase the energy efficiency and to cut costs [27]. CCHP can be classified into two types: (I) fixed heat to electricity ratio (back-pressure steam unit) (II) adjustable heat to electricity ratio (condensing steam type unit).
- (i)
- The equivalent model of gas conversion:
- (ii)
- The equivalent model of heat to electricity of CCHP
The heat to electricity equivalent model of fixed heat to electricity ratio CCHP can be expressed as follows:
where α is the fixed heat to electricity ratio. QCCHP and PCCHP represent thermal and electricity power generation of CCHP, respectively.
The heat to electricity equivalent model of adjustable heat to electricity ratio CCHP can be expressed as follows [28]:
where Z is a fixed value. Pcon denotes the generated electricity in full condensing mode.
- (iii)
- The equivalent model of waste heat recovery of GT
- (a)
- The equivalent model of HRSG
Waste heat of GT can be reclaimed by HRSG to produce hot water and steam. The equivalent model of waste heat recovery of GT can be formulated as follows [29]:
where and represent the output and input thermal power of HRSG, respectively. ηHRSG denotes the efficiency rate of HRSG.
- (b)
- The equivalent model of AC
Waste heat of GT can be reclaimed by AC for refrigeration. The equivalent model of heat to cooling can be described as in Equation (7) [30]:
where and represent the output refrigeration and input thermal power of AC, respectively. COPAC indicates the coefficient of performance of heat to cooling.
2.2. Model of Energy Storage
Energy storage (ES) is the key equipment in MES that can shift energy in the time dimension. ES is usually arranged to store energy during low tariff periods and discharge in high price hours to save on operational costs. With the advance of material technology, there are many types of ES on the market including battery storage (BS), thermal storage (TS), ice storage (IS), etc. [31]. There are various forms of energy storage, but the effect and constraints are similar. Generally, most energy storage devices can be expressed in the following model. The hourly remaining capacity in time t is calculated by Equation (8). The charge and discharge power of ES should not exceed its capacity limit, which can be described by Equations (9)–(11). Meanwhile, in the vast majority of case, ES cannot be charged and discharged at the same time t simultaneously, as expressed in Equation (12).
where and are the level of ES in time t and t + 1, respectively. σS is the loss ratio of ES. PS,ch and PS,dis are the storing power and releasing power of ES, respectively. Caps means the capacity of ES. γS,ch and γS,dis denote the maximal storing and releasing rate of ES. WS,min and WS,max are the minimal and maximal level of ES.
2.3. Model of Electric Refrigeration and Heating Device
Electric refrigeration and heating devices consume electricity to generate cooling and heating. The conversion model of electric refrigeration and heating device can be formulated as follows:
Equations (13) and (14) denote the model of electric refrigeration device and electric heating device [29]. QEC and PEC indicate the output refrigeration power and input electric power of electric refrigeration device. COPEC is the coefficient of performance of electricity to cooling. Similarly, QEH and PEH indicate the output thermal power and input electric power of electric heating device. COPEH is the coefficient of performance of electricity to heating.
3. Model of Integrated Demand Response
Integrated demand response is established on the basis of conventional electricity demand response. The capability of energy complementation and integration of MES provide a basis for eliminating boundaries between electricity and other types of energy. In order to keep the energy balance at peak periods, not only conventional load-shedding but also novel resource-shifting should be involved in the IDR program [32]. IDR participants can use more abundant resources to reduce energy consumption. Conventional electricity demand response (EDR), heating demand response (HDR), cooling demand response (CDR), gas demand response, etc. are all included in the integrated demand response.
Equations (15) and (16) present total load reduction and compensation of IDR, respectively.
3.1. Model of Electricity Demand Response
Conventional electricity demand response program is categorized into time-based and incentive-based programs [33]. Interruptible load (IL) management is usually regarded as a vital implementation of the incentive-based program in an industrial park. The multi-energy operator signs an IL contract with large industrial customers that will cut power use to obtain a certain amount of compensation from a multi-energy operator.
Power outage costs on the user side will be caused by electricity load shedding in IL. Therefore, it is necessary for a multi-energy operator to offer interactive users reasonable compensations. In fact, power outage costs and compensations are determined by a customer’s load characteristics and increased with the amount of load shedding quadratically [34,35].
where CEDR,i is the compensation provided by multi-energy operator to interactive factory i. PEDR,i,t indicates the amount of load shedding of interactive factory i in time t. βi and μi are the coefficients of factory i, which are related to a customer’s load characteristics. T is the participation period.
3.2. Model of Heating and Cooling Demand Response
When factories’ electric load increases substantially in an industrial park, the electric power drawn from an external power network is likely to exceed maximum allowable value of a tie-line. Under such circumstances, the factories need to be advised to obtain more heating and cooling from the multi-energy operator. Meanwhile, a factory’s own electric refrigeration and heating devices are advised to be halted. While using less electricity, more electricity will be produced as a result of the higher cooling and heating load of CCHP. The equivalence relationship can be expressed as follows:
Equations (18) and (19) indicate that the total power of load shedding in heating (or cooling) response in factory i are from two sources: (1) the electricity replaced and saved by heating (or cooling) demand response; (2) the increased electricity generation of CCHP. ΔPi is the total power of replaced and saved electricity by heating or cooling demand responses in factory i. PCCHP is the power of increased electricity generation of CCHP. Pi,j is the power of device j in factory i. Equations (21) and (22) denote the increased electricity generation of CCHP by heating and cooling demand responses, respectively. Equation (23) denotes the performance coefficient of electricity heating or cooling.
The extra cooling and heating resources produced by CCHP can be consumed by the factory for free with additional compensation from the operator to encourage the factory’s participation. The total compensation obtained by participants in heating demand response program can be expressed as in Equation (24):
where CHDR,i is the compensation obtained by factory i in heating demand response program; T is the participation period. ce is the current electricity price; λi is the corresponding coefficient of factory i.
Similarly, the total compensation obtained by participants in a cooling demand response program can be expressed by Equation (25):
where CCDR,i is the compensation obtained by factory i in a cooling demand response program.
4. Bilevel Optimal Dispatch Strategy
4.1. Bilevel Optimal Dispatch Framework in IDR
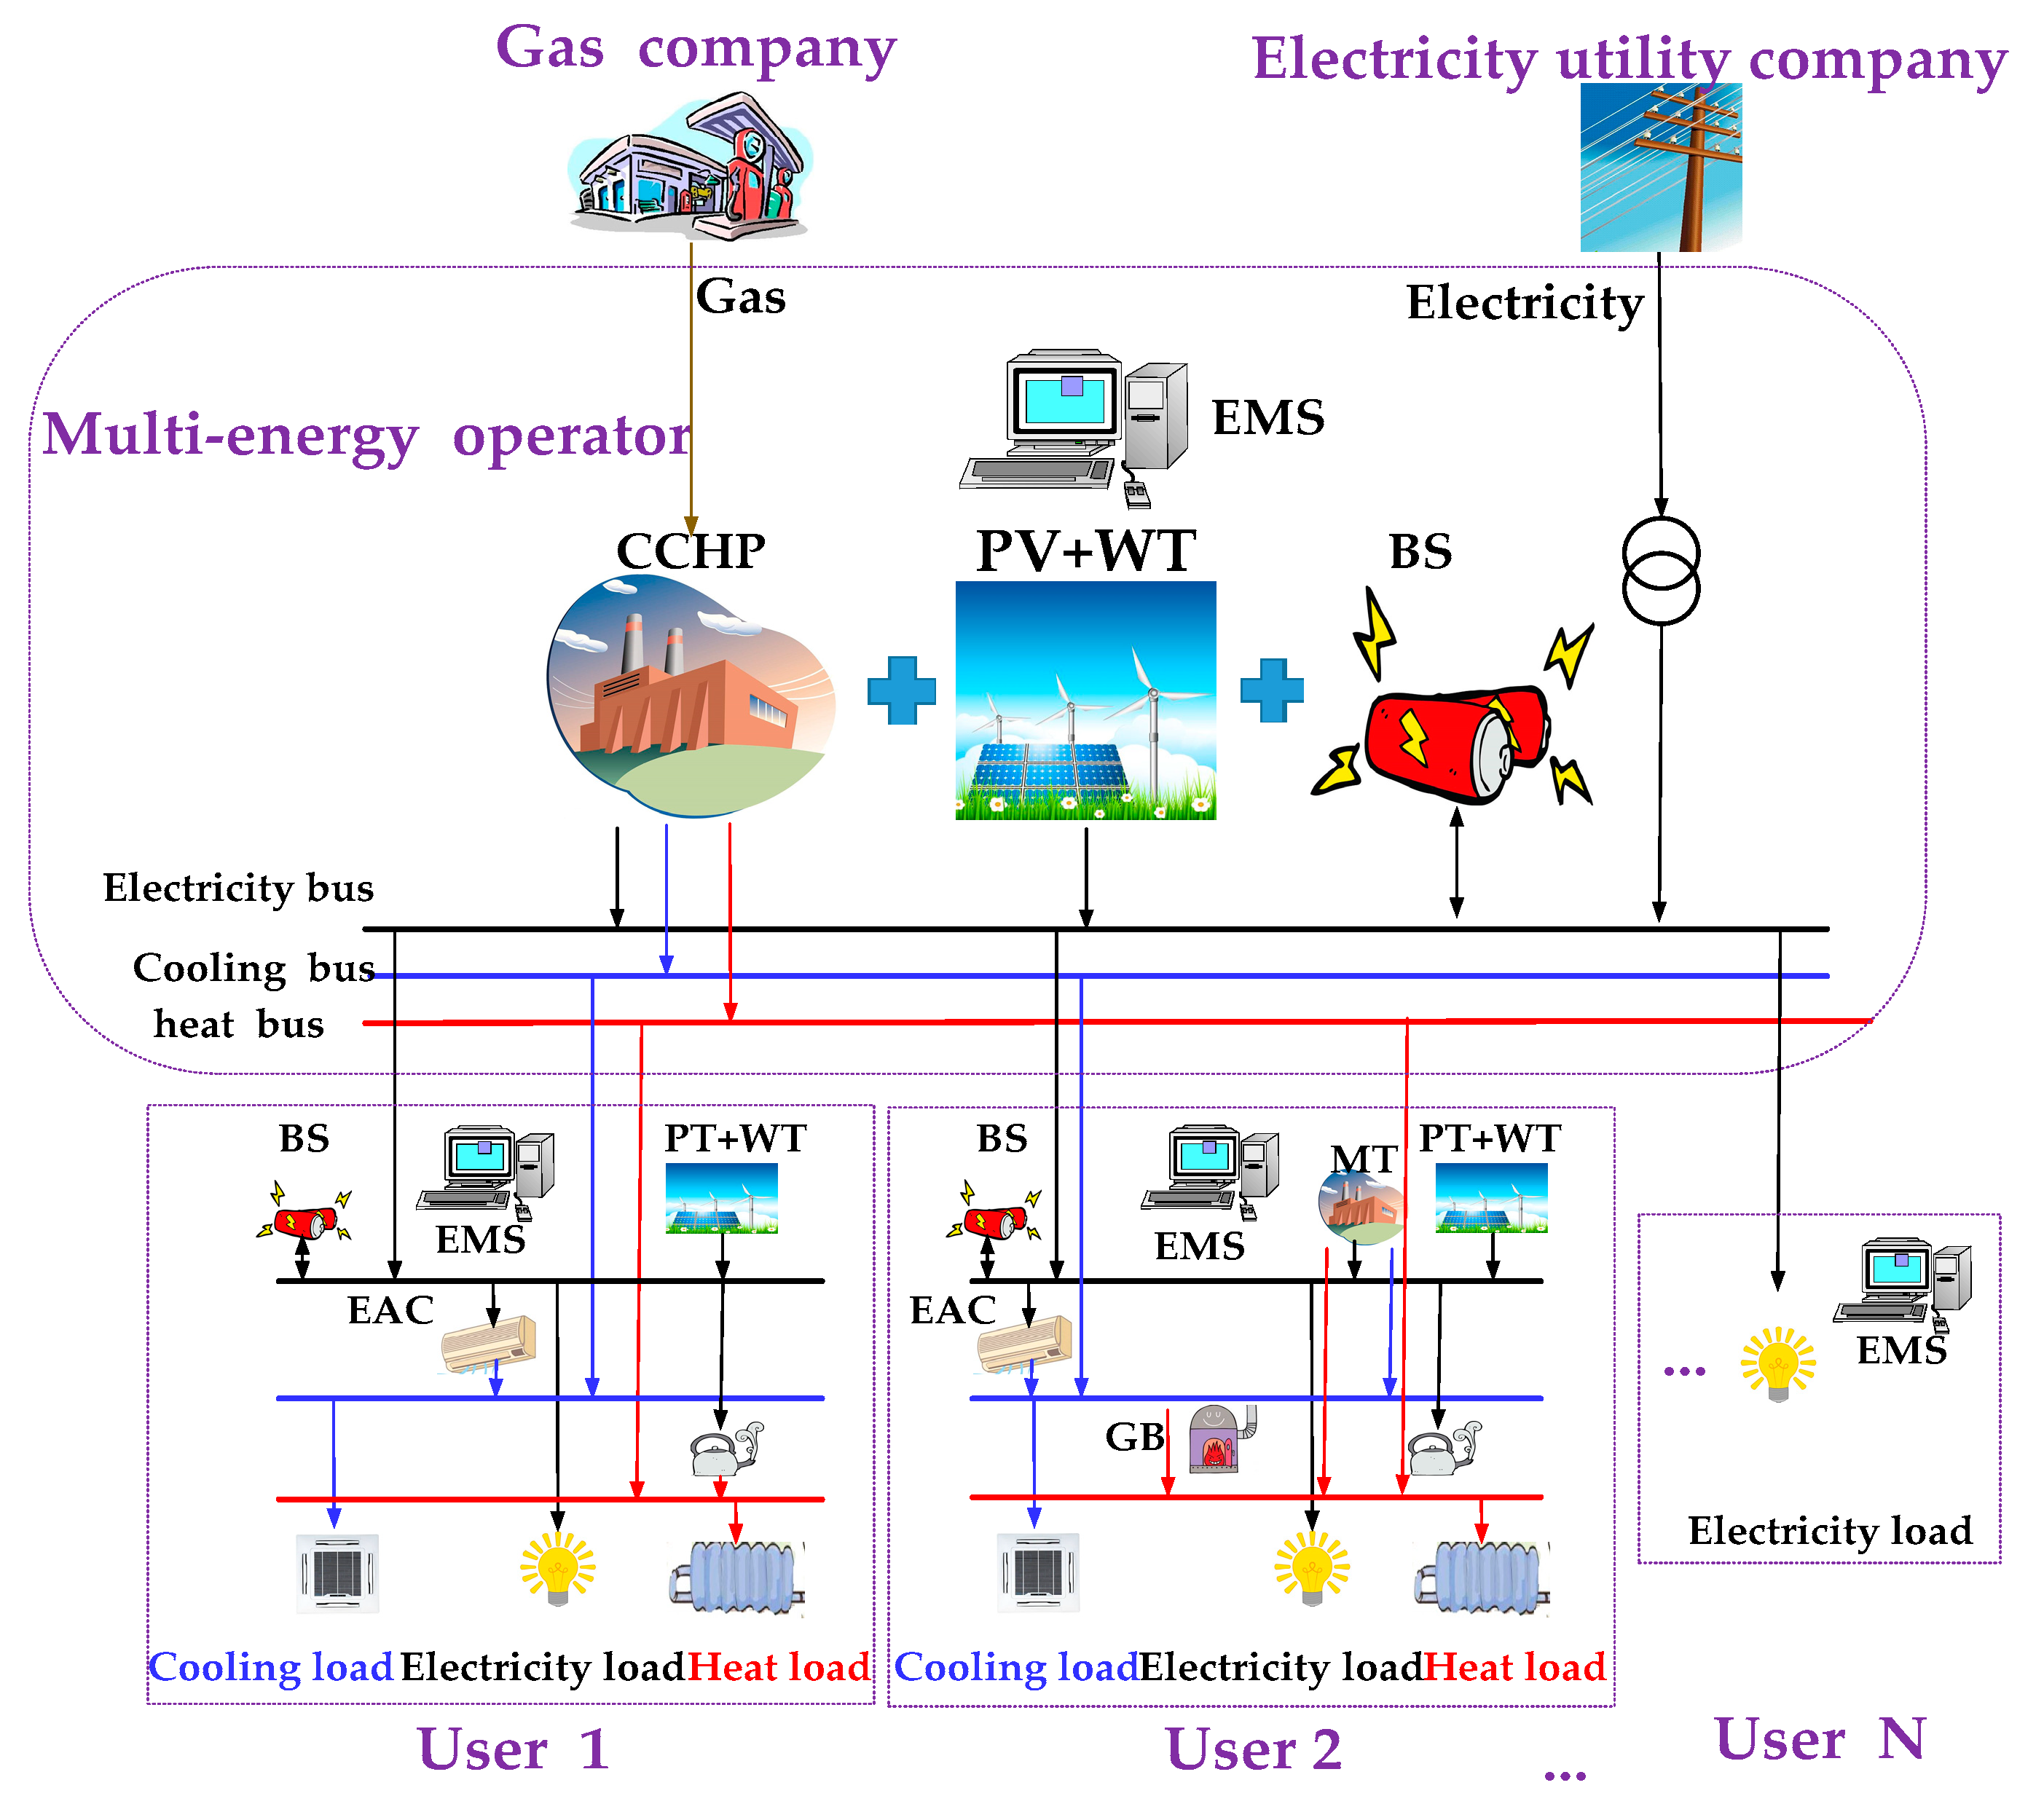
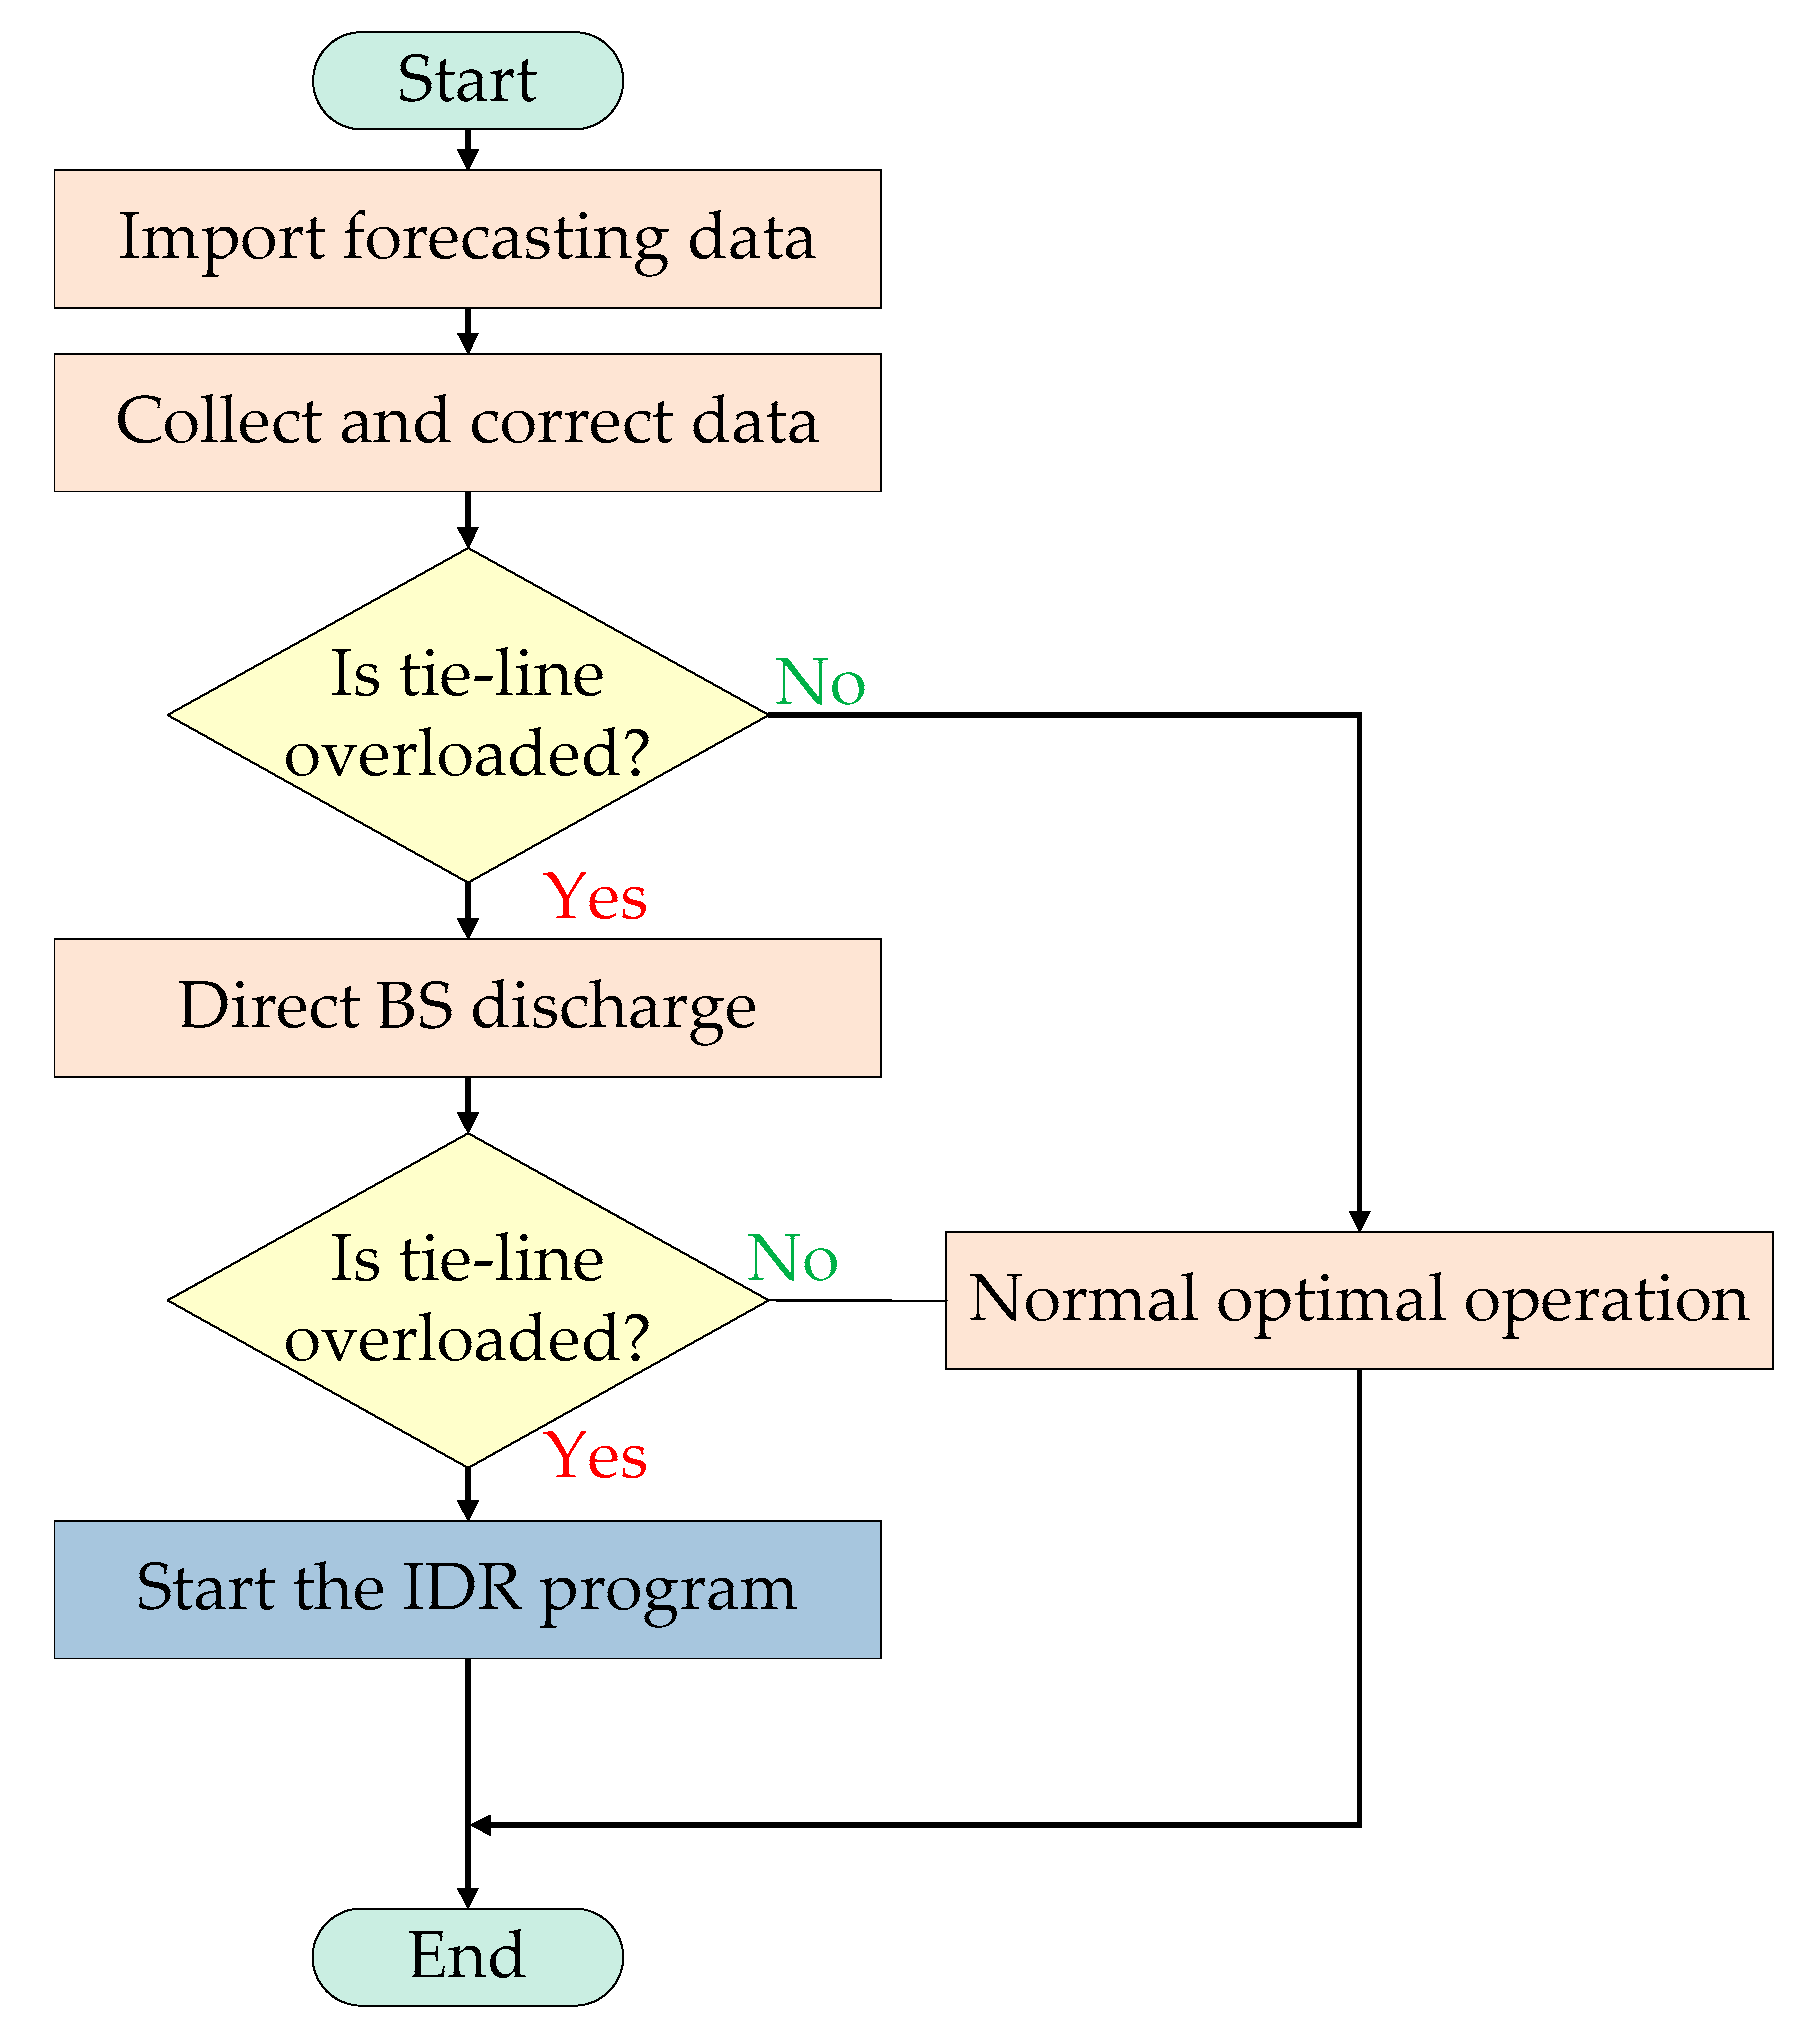
Profits are obtained by a multi-energy operator in the industrial park from supplying factories with cooling, heating, electricity, and ancillary services. The multi-energy operator often owns a substantial number of energy conversion devices such as photovoltaic (PV), CCHP, BS, etc. When its electricity generation is unable to meet the factory’s demand, a multi-energy operator can purchase electricity from an external utility company under the constraint of the maximal permitting power value of the tie line. Electricity, cooling, and heating are generated simultaneously by CCHP owned by a multi-energy operator. The electricity is transmitted to factories via distribution lines, and the cooling and heating can be supplied to users via a transportation pipe. Various forms of devices such as MT, PV, WT, BS, EAC, GB, and so forth may be installed on the factory side [36]. Insufficient energy power on the user side is supplied by the multi-energy operator. An overall schematic diagram and logic flow chart for the bilevel optimal dispatch strategy considering IDR are presented in Figure 1 and Figure 2, respectively.
Due to a large number of participants and potential conflicts of interest in park-level MES, it is difficult to coordinate and schedule multi-energy subsystems. As a result, the bilevel optimal dispatch strategy is necessary under such circumstances. Decision-makers at a lower level are factories’ EMS and decision-makers at the operator level are a multi-energy operator’s EMS [37]. Under normal operational conditions, the maximization of profit is set as a goal for both lower-level factories’ EMS and multi-energy operator’s EMS. In heavy load conditions, the multi-energy operator’s EMS chooses the most economical multi-energy resources on its own side and controls the demand-side resources to keep the power balance and realize peak load shifting.
4.2. Distributed Dispatch Strategy for Lower-Level Factories
The objective for lower-level factories is to minimize operational costs by optimal dispatch of controllable devices according to the day-ahead load prediction and energy price. When the power of a tie line exceeds the maximum allowable value under peak shifting constraint, the IDR program will be started.
4.2.1. Objective Function
The objective for lower-level factories is to minimize daily operation costs. The objective function can be formulated in detail as follows:
where f1 is the total operational costs. Celectricity, Cheating, Ccooling, and Cgas are the cost of purchasing electricity, heating, cooling, and gas, respectively.
where is the electricity price in time t. is the purchasing electricity power at time t. cheating is the price of heating. is the purchasing heating power at time t. ccooling is the price of cooling. is the purchasing cooling power at time t. cgas is the heat value price of gas. and ηMT are the power of electricity generation and efficiency ratio of a micro turbine. and ηGB are the thermal power generation and efficiency ratio of a gas boiler.
4.2.2. Constraints
- (i)
- Electrical power balancewhere Pgrid is the purchasing electricity power. PPV and PWT denote the power of electricity generation of photovoltaic and wind turbine, respectively. PBS,dis and PBS,ch indicate the discharging power and charging power of BS, respectively. PEAC and PHP present the input power of EAC and HP. and are the input power of double mode main engine in ice-making mode and refrigeration mode. PEL is the total power of the electric load.
- (ii)
- Heat balancewhere , QGB, and QHP are the output heat power of HRSG, GB, and HP, respectively. QTS,D and QTS,C represent the discharging power and charging power of TS, respectively. QHL is the total power of the thermal load.
- (iii)
- Cooling balancewhere , QIS,dis, QAC, and QEAC are the output cooling power of double mode main engine in refrigeration mode, ice melting of IS, AC, and EAC, respectively. is the cooling power of double mode main engine in ice-making mode. QCL is the total power of the cooling load.
4.3. Centralized Dispatch Strategy of Multi-Energy Operator
The objective of the multi-energy operator is maximizing the profit under the premise of meeting a factory’s energy demand in the industrial park. When the power of the tie line exceeds the maximum allowable value under peak shifting constraint, battery storage installed in multi-energy operator side will be utilized to smooth load fluctuation. If necessary, participating factories will be asked to join the IDR program to reduce the electricity load or increase the cooling or heating load from CCHP at the multi-energy operator side.
4.3.1. Objective Function
The objective for multi-energy operator is to maximize the profit. The objective function can be formulated in detail as follows:
where f2 is the total profit. Eelectricity, Eheating and Ecooling are the profit of selling electricity, heating, and cooling. Cgrid, Cgas are the expense of purchasing electricity and gas from external electricity and a gas utility company. CIDR is the compensation cost for integrated demand response.
4.3.2. Constraints
- (i)
- Maximum permitted power value of tie line under peak shifting constraint:where Pline,max is the maximum permitted power value of a tie line under peak shifting constraint.
- (ii)
- Total power value of IDR
Equation (36) shows the total over-limit power shortage under peak shifting constraint. Accordingly, Equation (37) shows the requirement of participation in IDR program to solve the problem of overload.
4.4. Problem-Solving Method
The models of upper-level and lower-level are binary mixed integer linear programming problems. The binary variable is introduced to handle coupling variables in the constraints; as an example, ES devices cannot be in both a charging and a discharging state at the same time [29]. The commercial computational software of linear interactive and general optimizer (Lingo) has been employed to solve this binary mixed integer linear programming problem.
5. Case Studies and Discussion
In this paper, case studies are conducted in an actual multi-energy system demonstration project of an industrial park in China. There are 13 lower-level factories and one multi-energy operator in the industrial park. The structure of the case study is established on the basis of Figure 1. Three major factories are selected for analysis, and the specific configuration and parameters of the factories and operator are shown in the Appendix A. Full details of time of use are shown in Table 1. According to the local rate, the price of gas is 0.5391 $/m3, which is equivalent to 0.0545 $/kW·h for heat value. The price of cooling and heating are 0.1250 $/kW·h and 0.1016 $/kW·h, respectively.
5.1. Distributed Optimal Dispatch of Lower-Level Factories
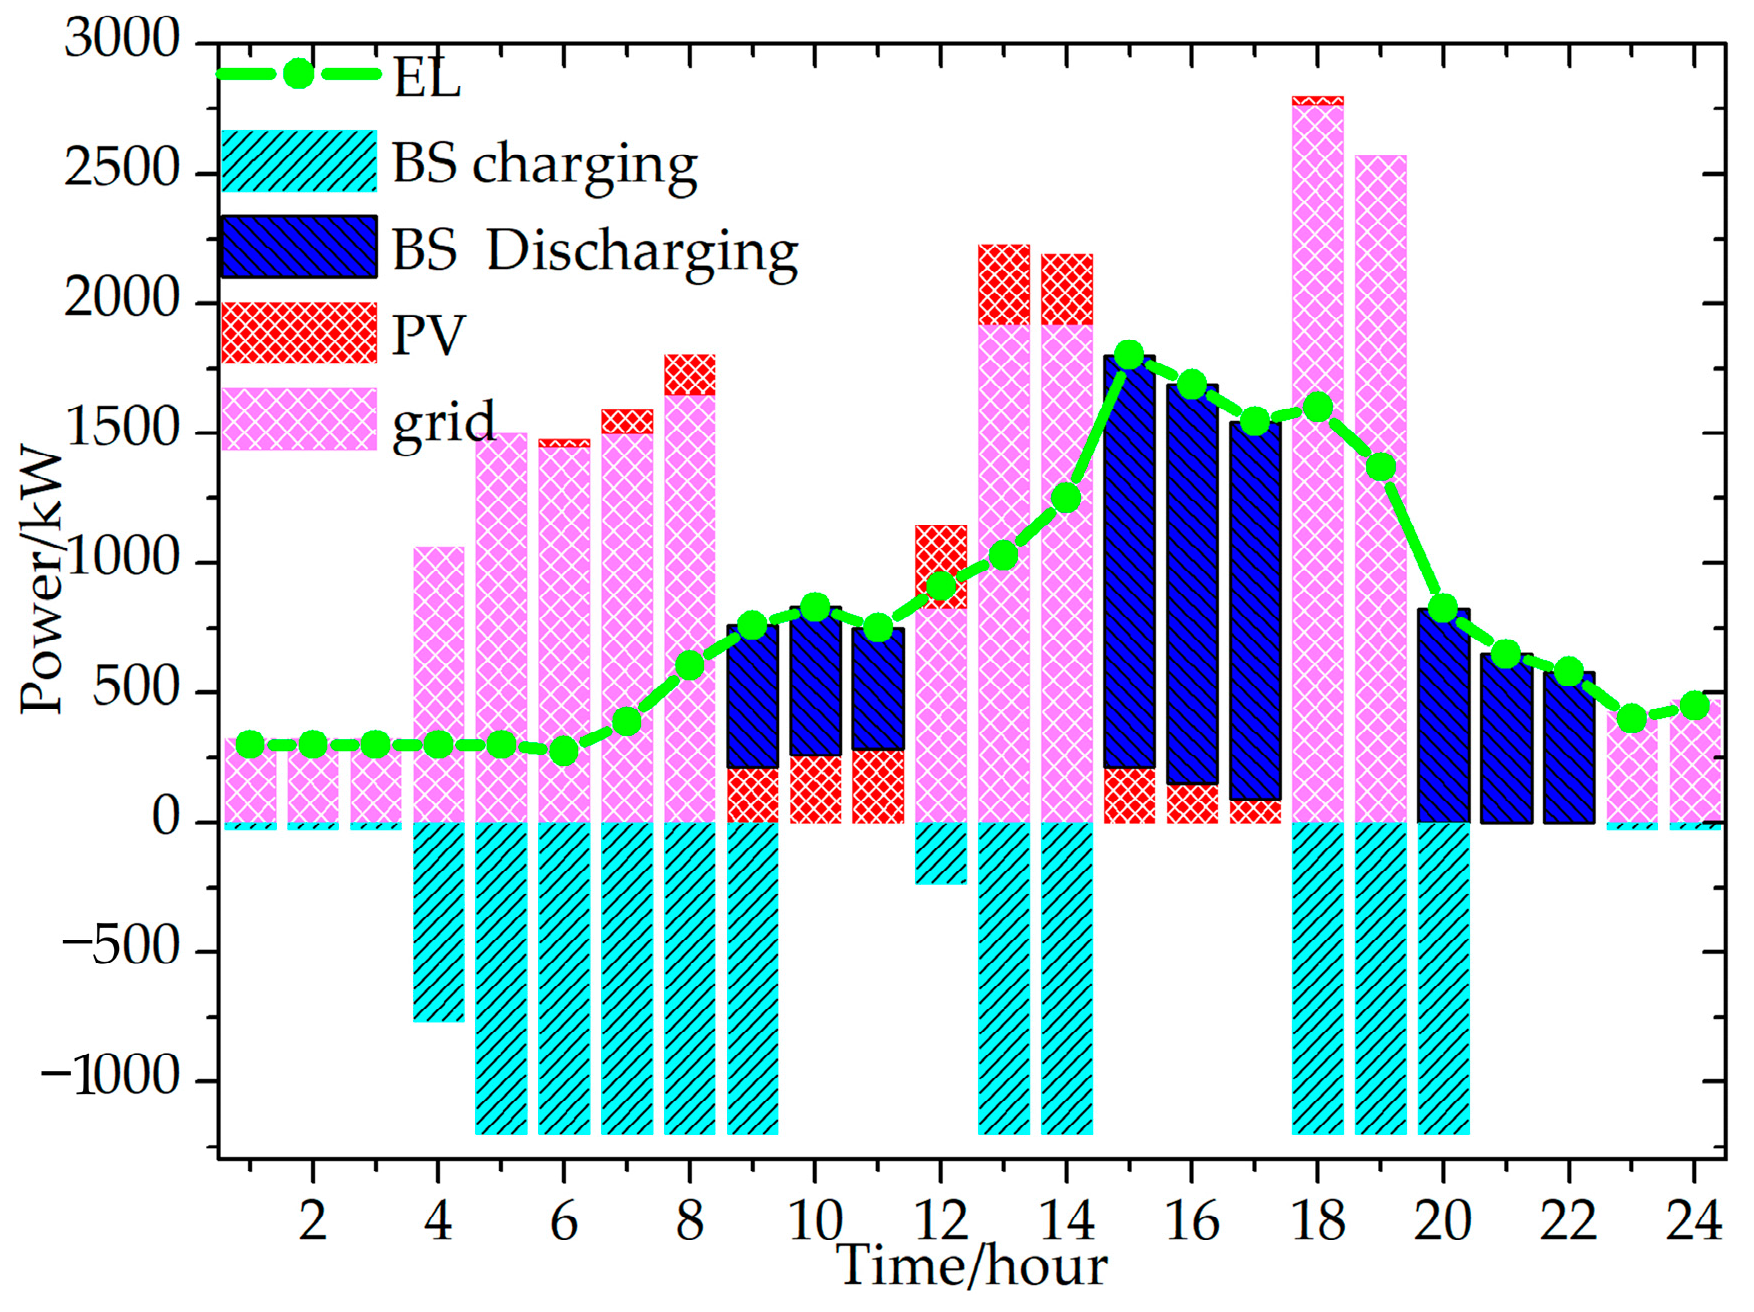
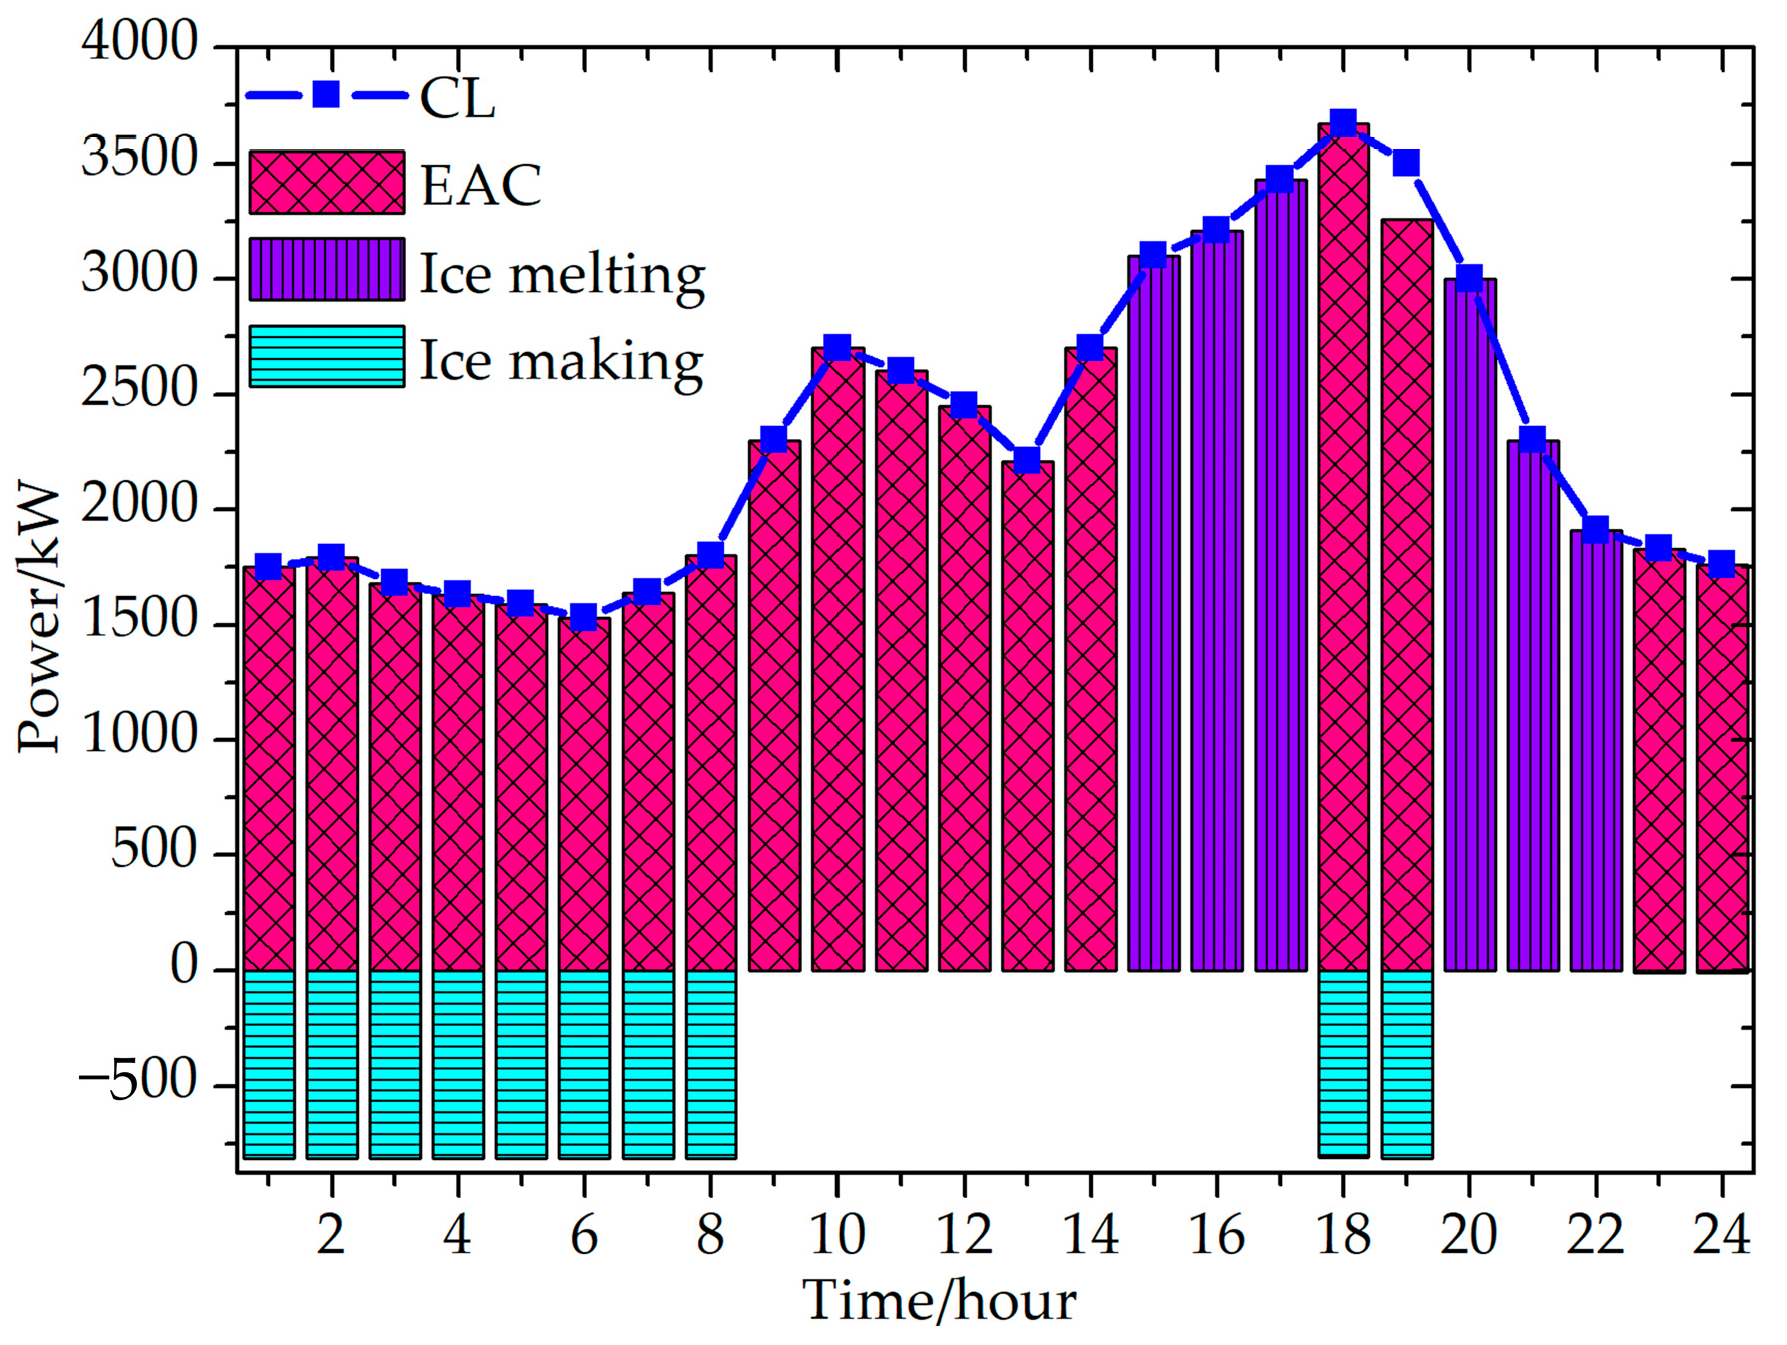
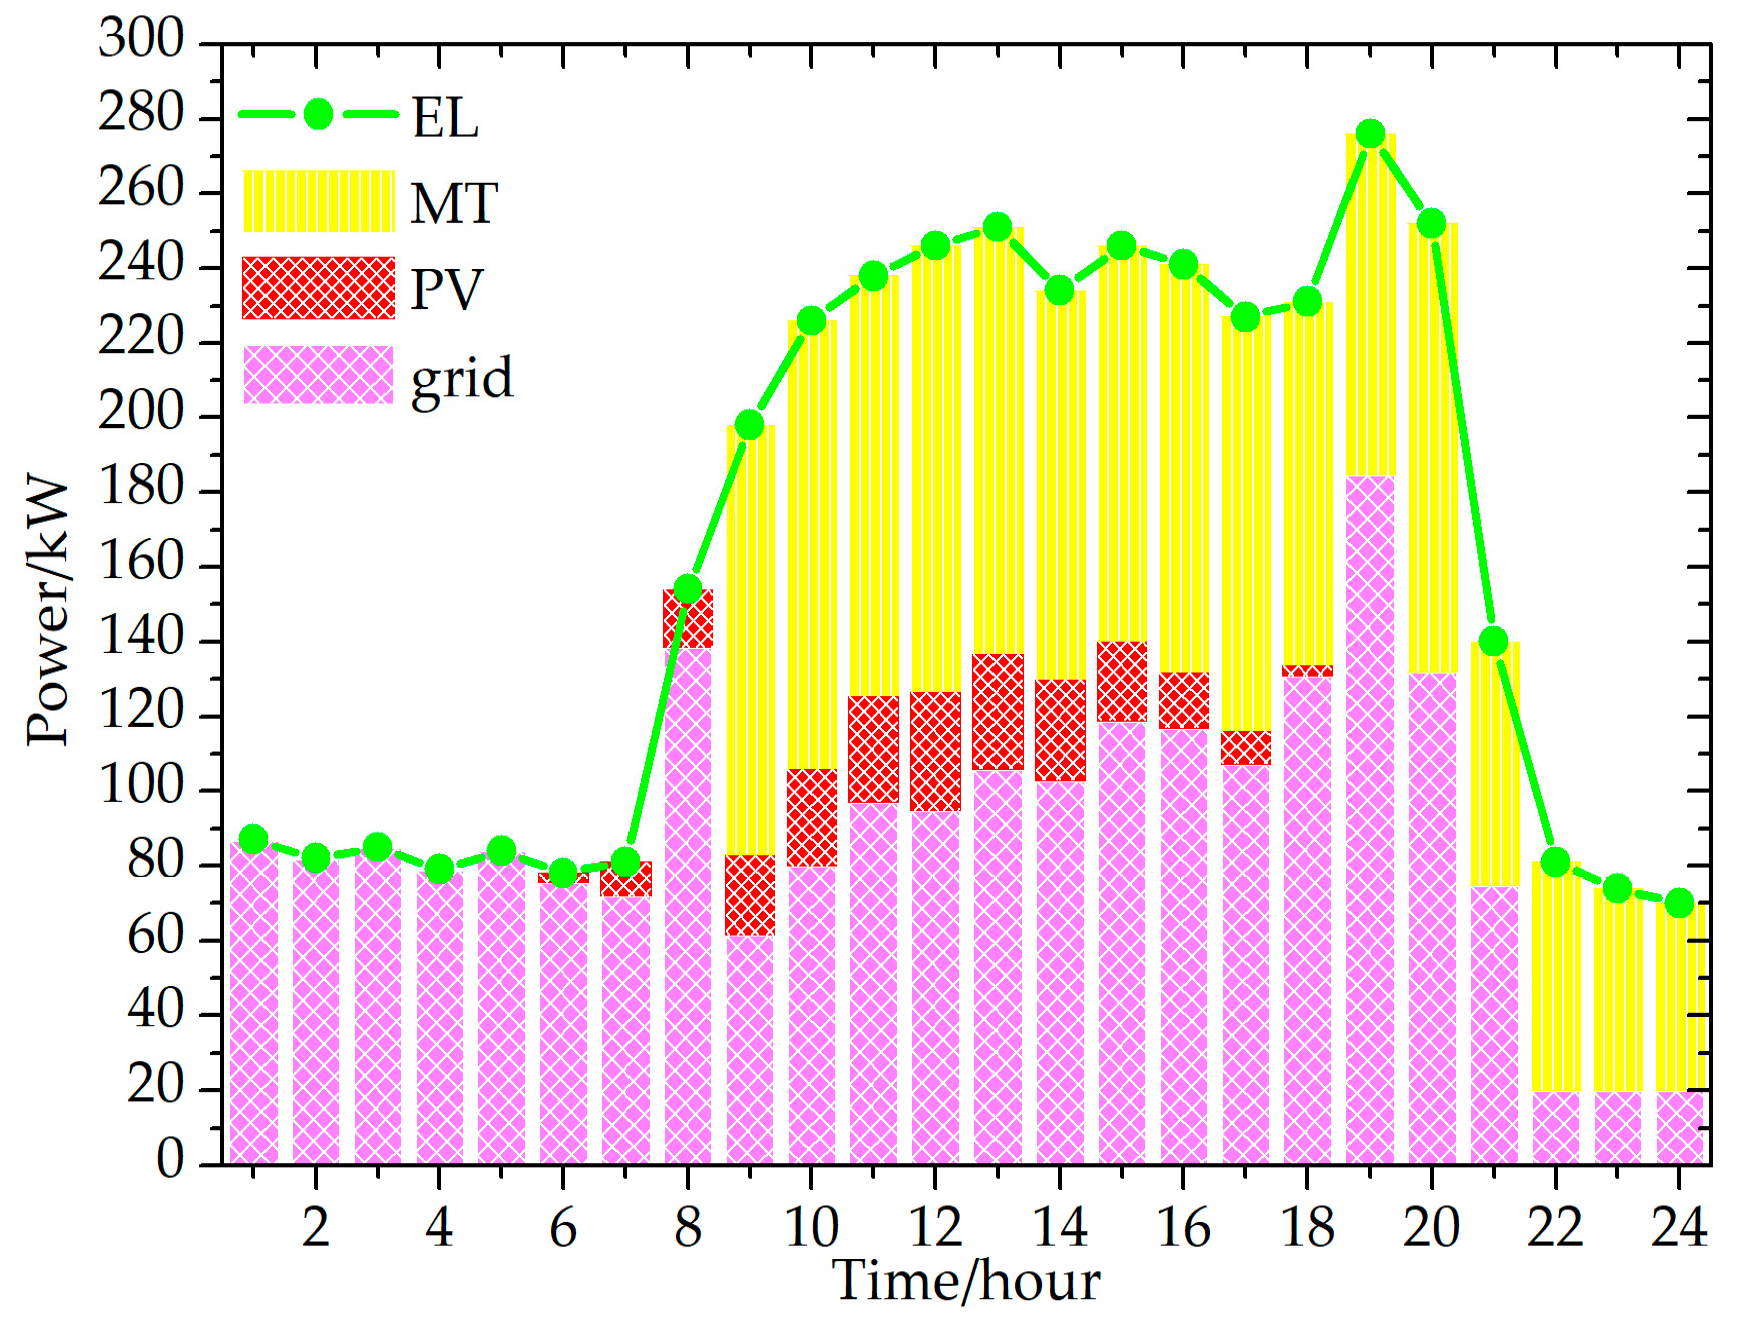
Using the distributed optimal dispatch strategy, Figure 3, Figure 4, Figure 5 and Figure 6 show that three factories achieve the objective of minimal operational costs. The total operational costs of Factories 1 to 3 are $2169.50, $3582.60 and $592.30, respectively. An operational costs comparison for the three factories with and without optimization is presented in Table 2.
From the optimal dispatch results of the three factories, the following conclusions can be obtained:
- The battery storage in Factory 1 can cut operational costs by charging and discharging according to the electricity price. Meanwhile, the peak of overall load curve of the whole industrial park is lowered. A mutual beneficial result for both Factory 1 and the operator is achieved by the optimal dispatch.
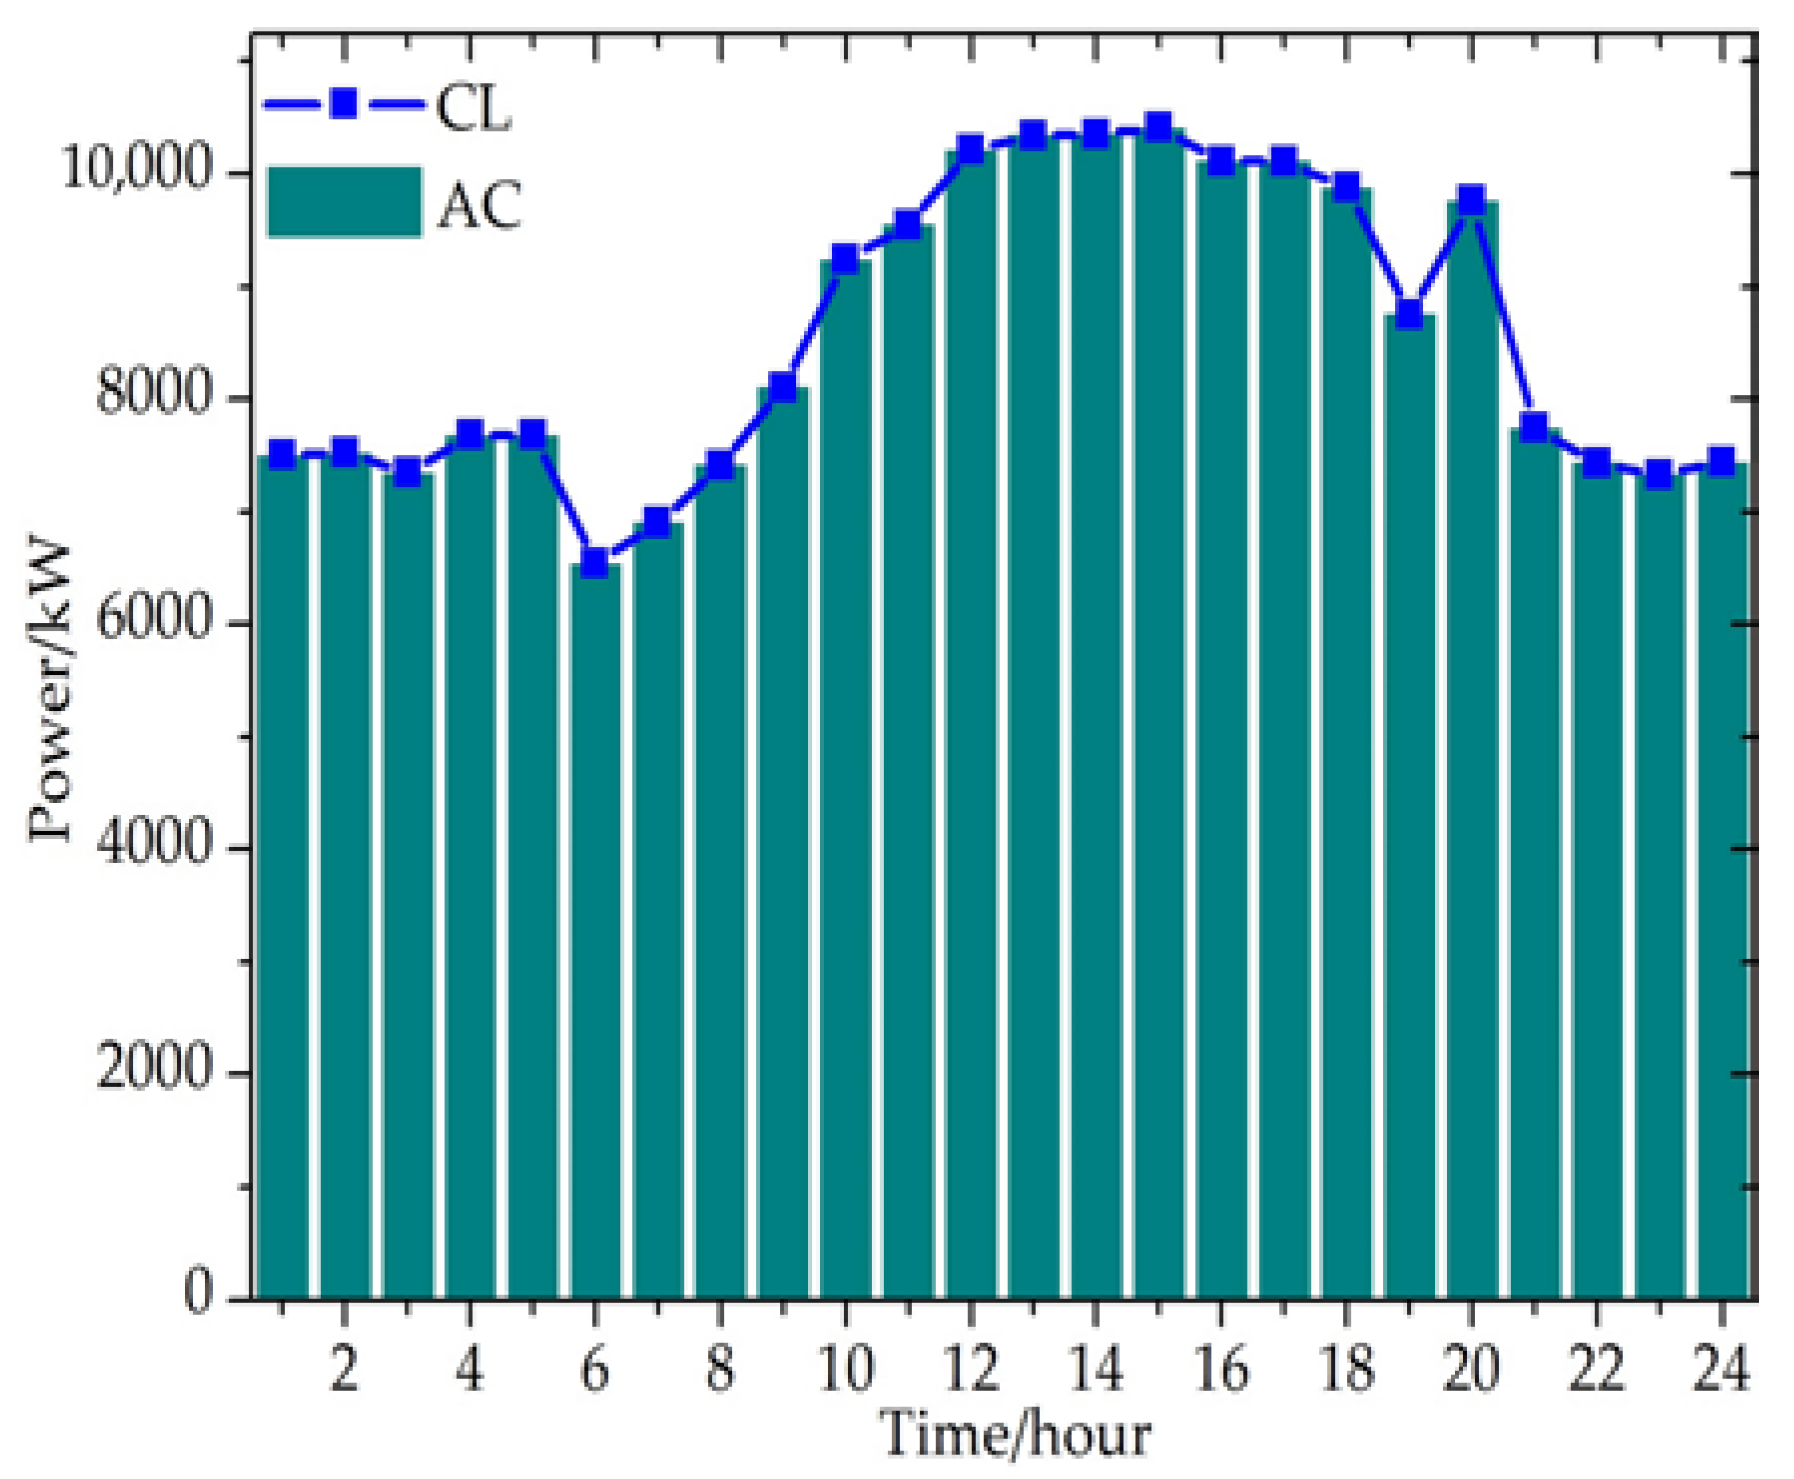
- The cooling load for Factory 2 can be met by electric air conditioner (EAC) and ice storage. Ice storage is similar to battery storage. The ice is made, stored, and melted based on the electricity price. Dual-model chiller units are not allowed to operate in refrigeration mode and ice-making mode at the same time, so an electric air conditioner is used to provide cooling for factories when dual-mode chiller units operate in ice-making mode.
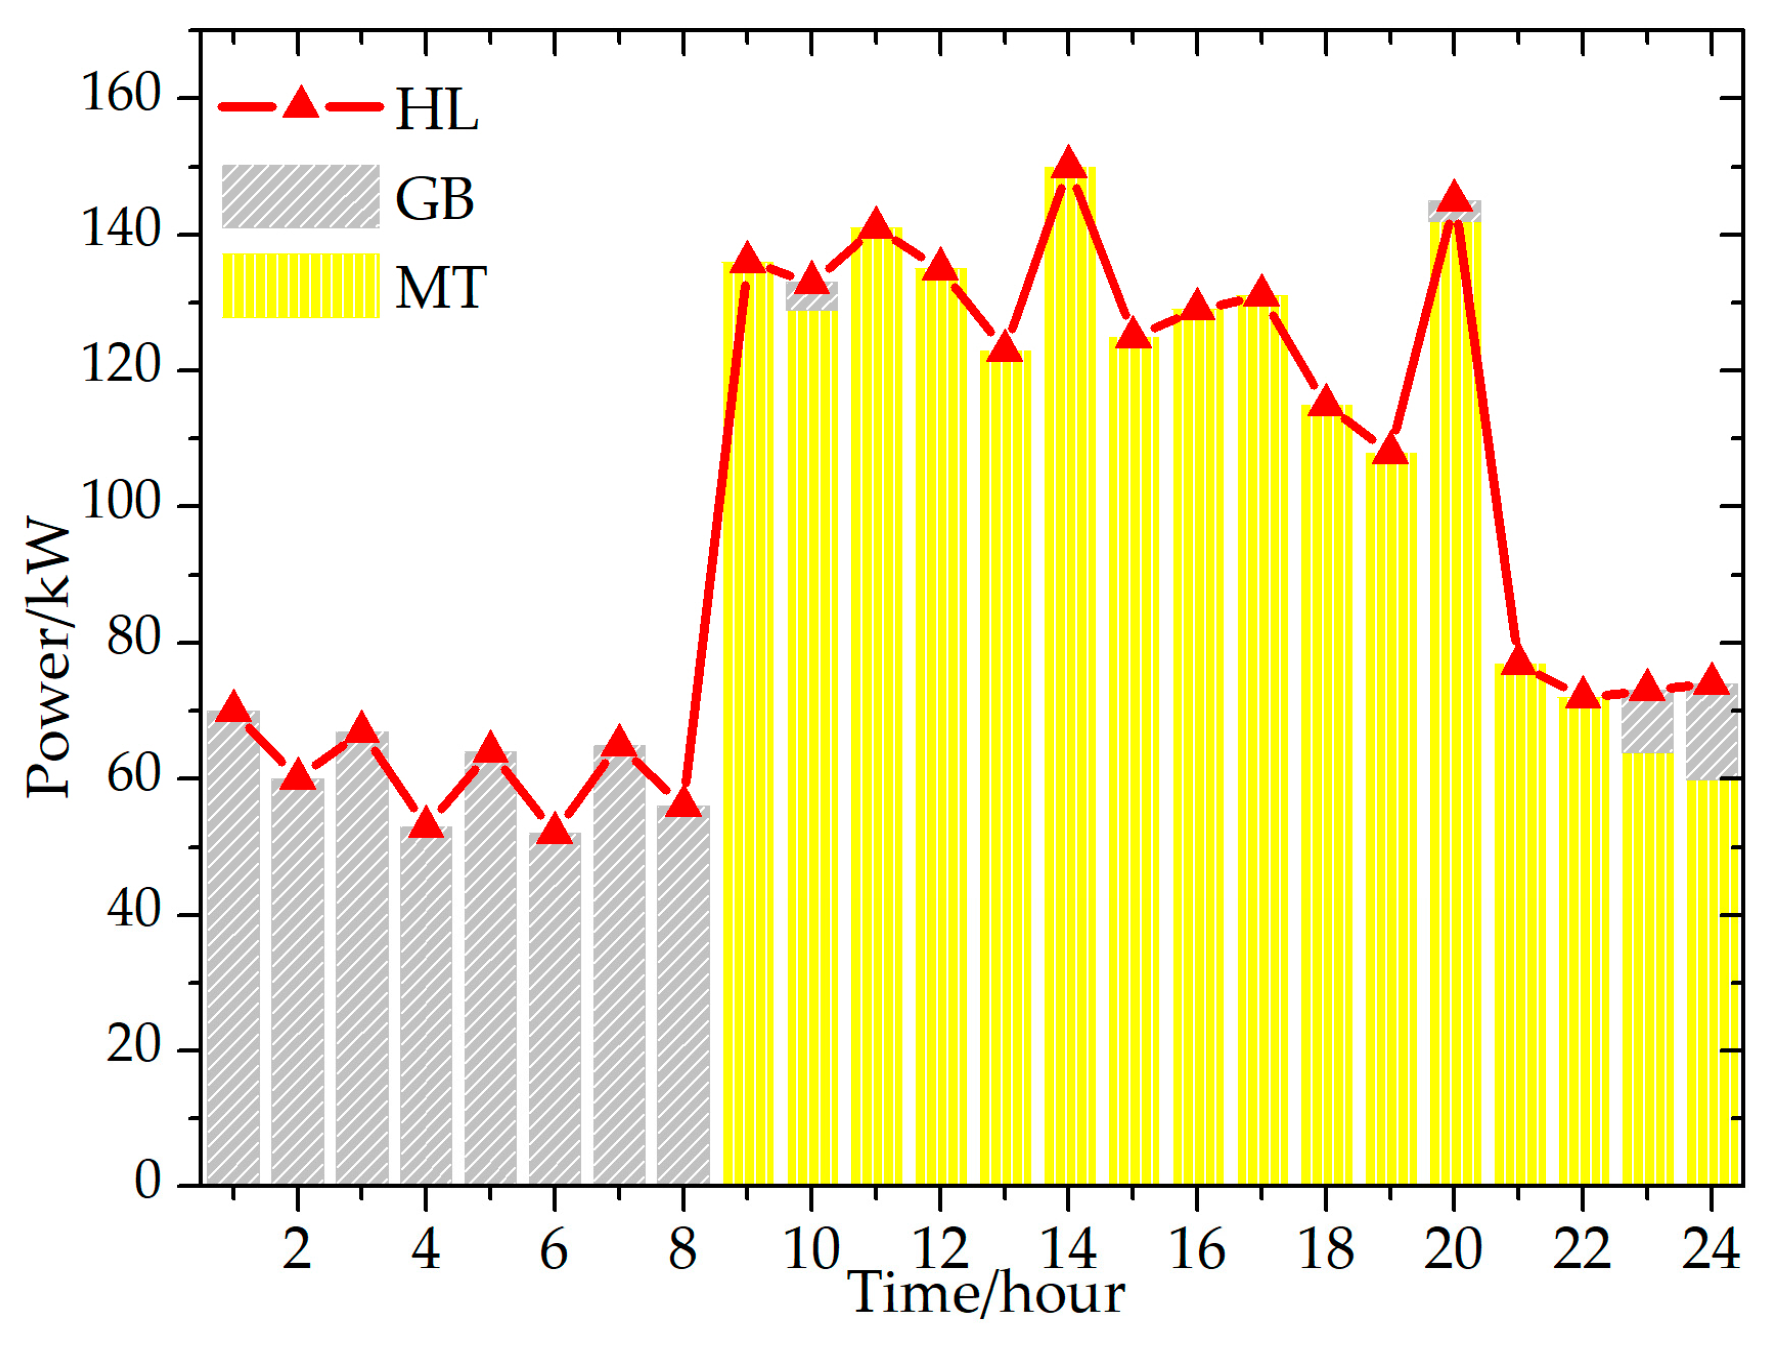
- MT and GB work together to meet the thermal load of Factory 3. When the electricity price is high, MT works to produce both thermal energy and electricity. Any electrical power shortage may be compensated for by the grid. When the electrical price is low, GB is used to meet all thermal loads.
5.2. Centralized Optimal Dispatch of Multi-Energy Operator
The maximum permitted power value of a tie line in the industrial park under peak shifting constraint is set to 11 MW, so a multi-energy operator needs to sign IDR program contracts with factories in order to ensure the energy balance in the industrial park. Specific compensation tables based on the actual situation are shown in Table 3 and Table 4.
Case 1. Optimal dispatch in normal operation
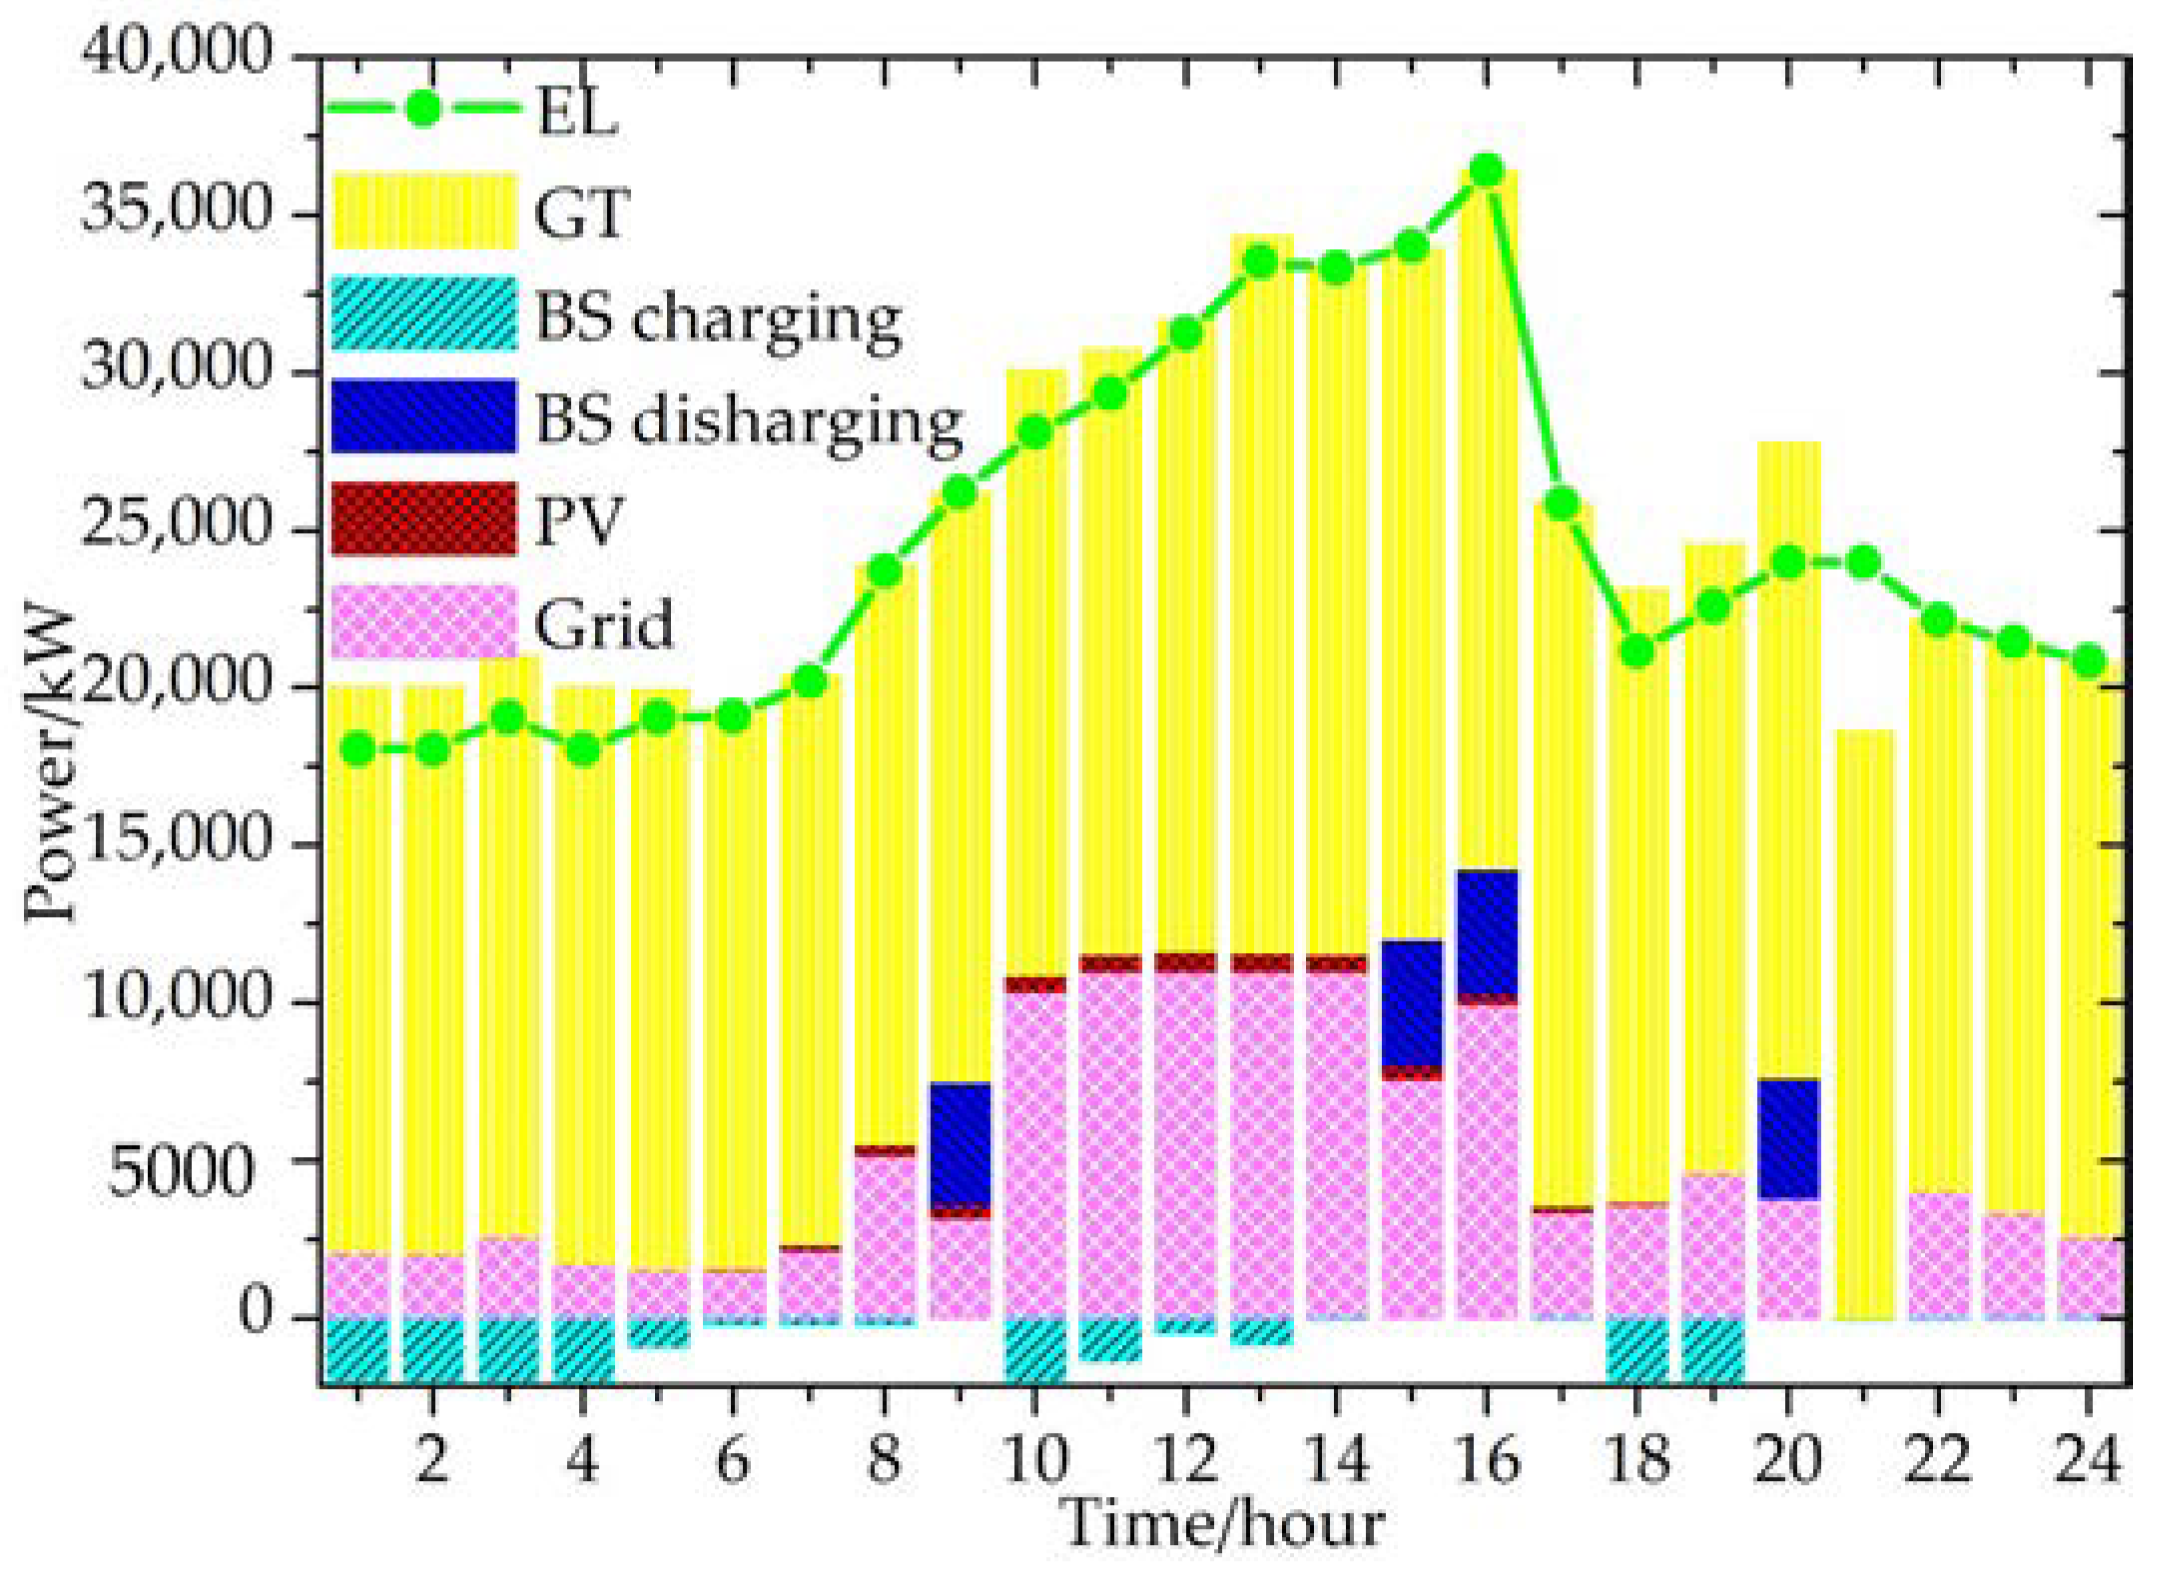
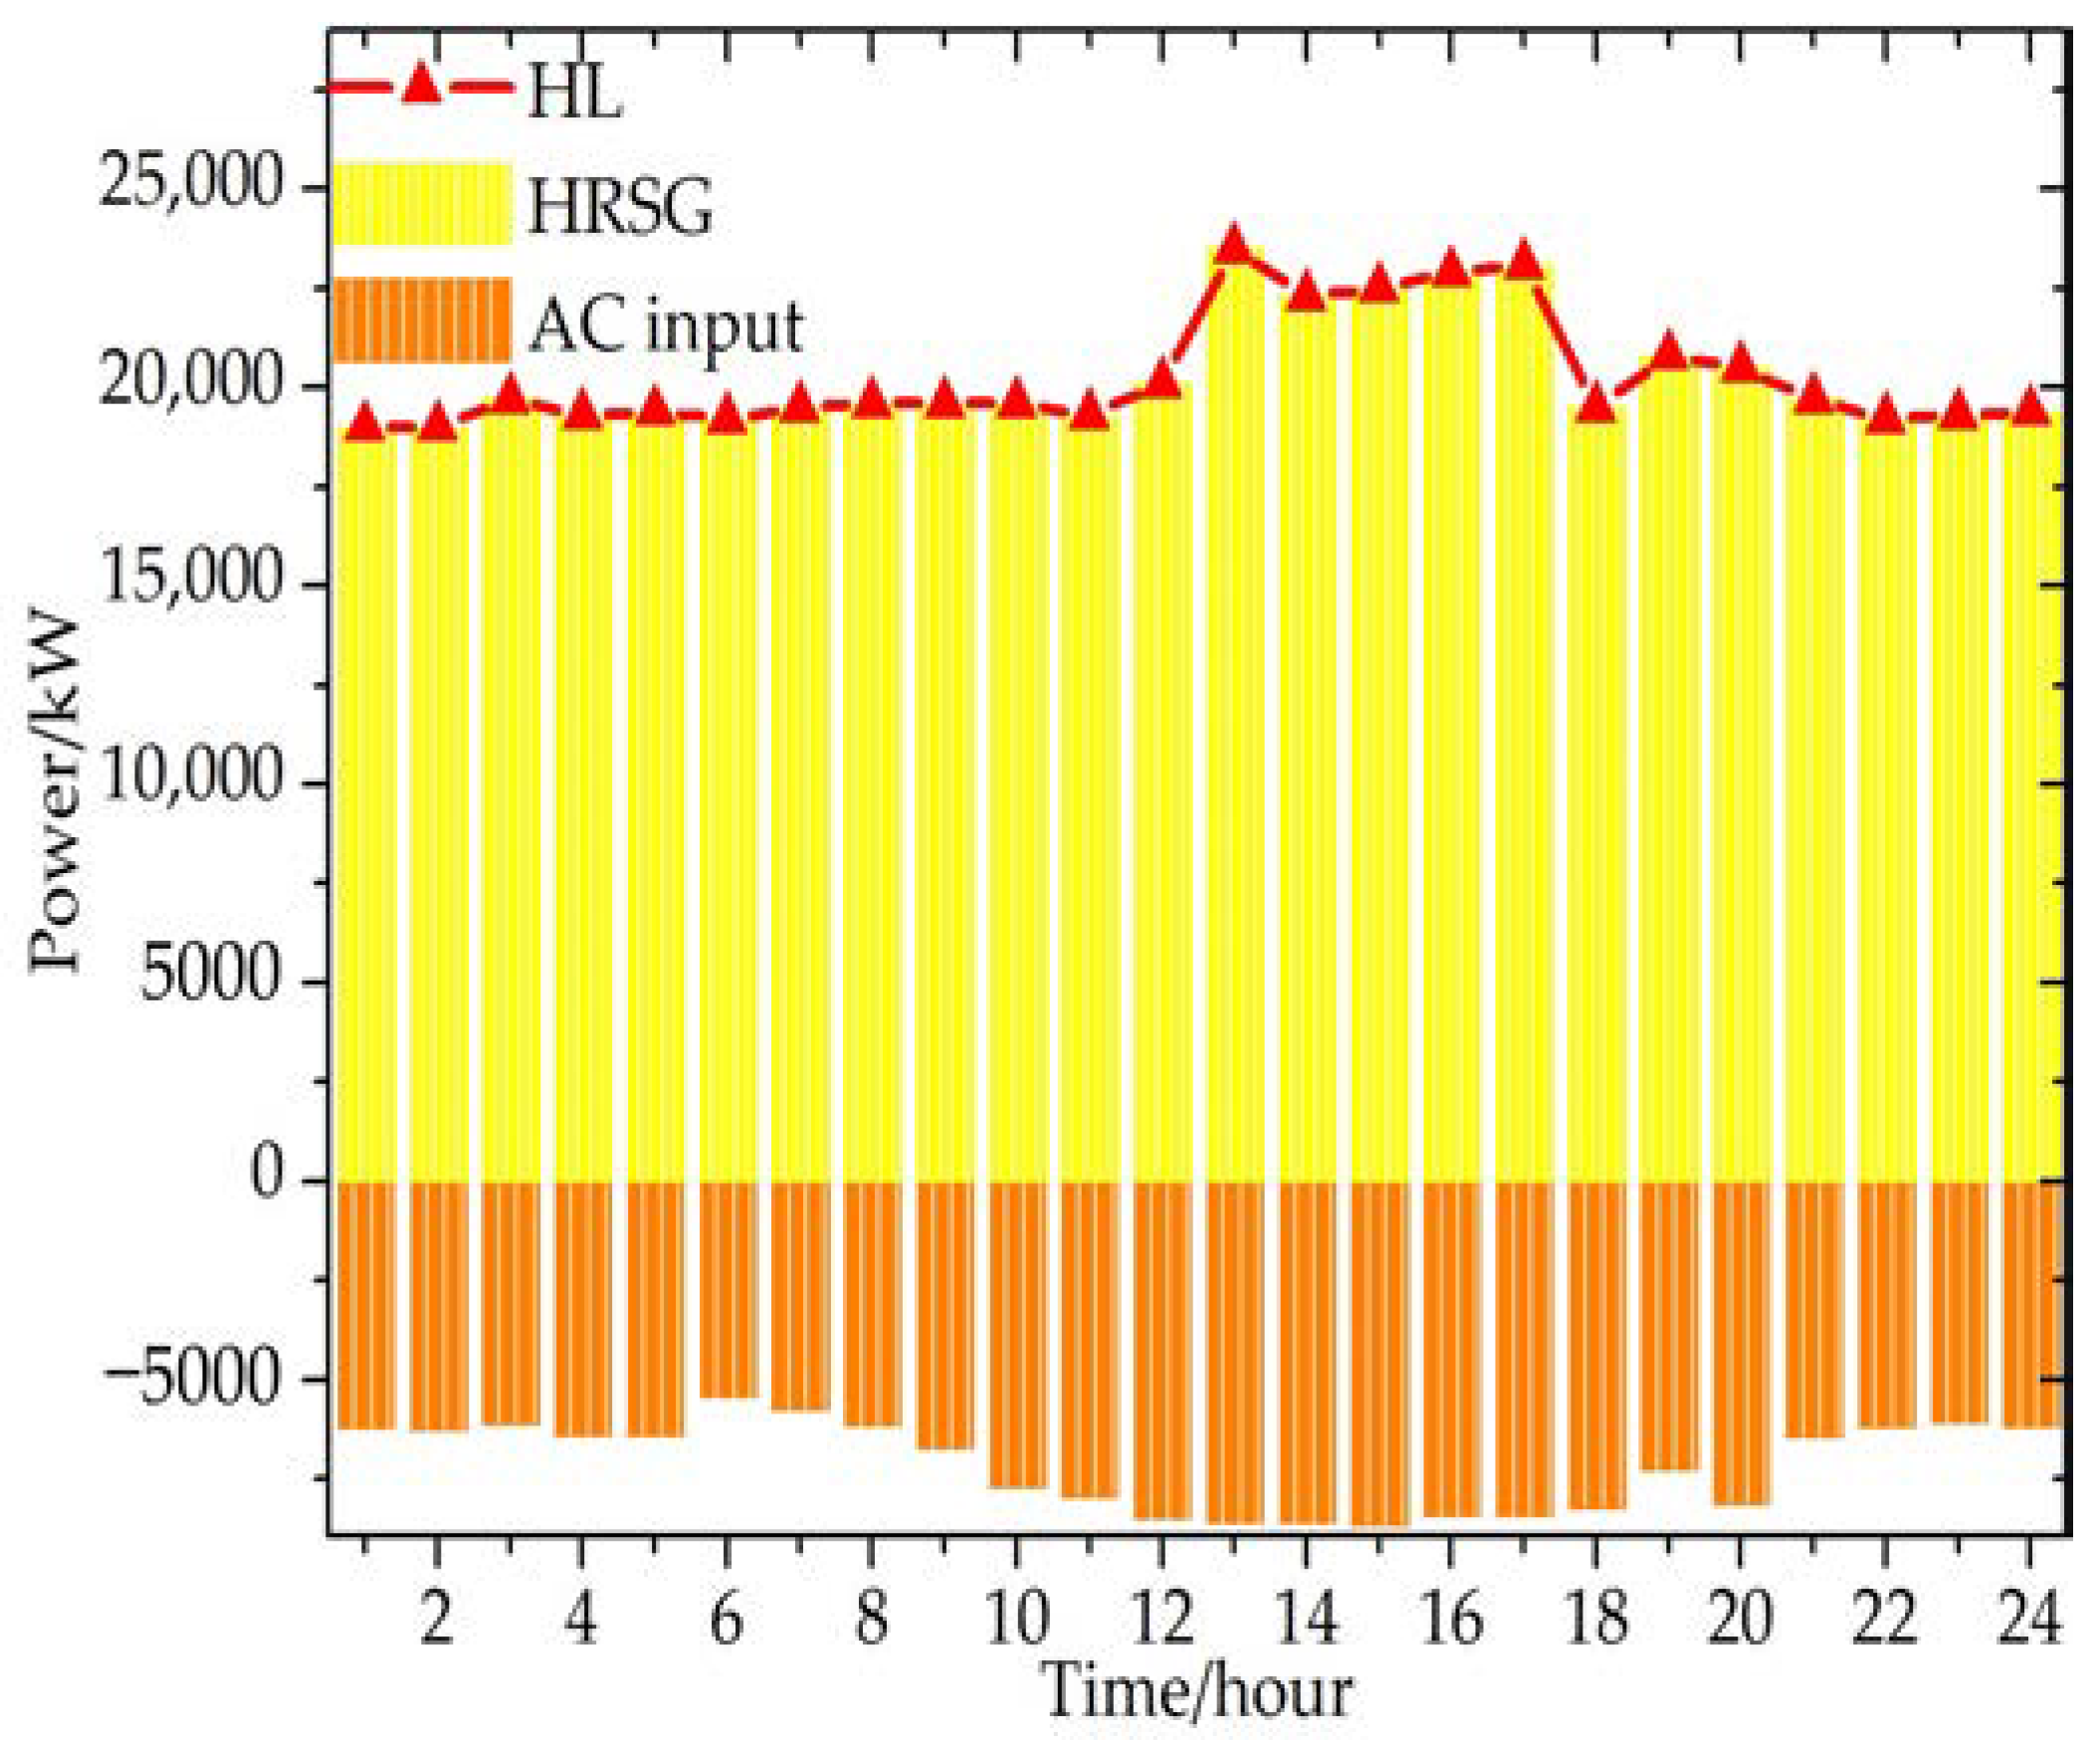
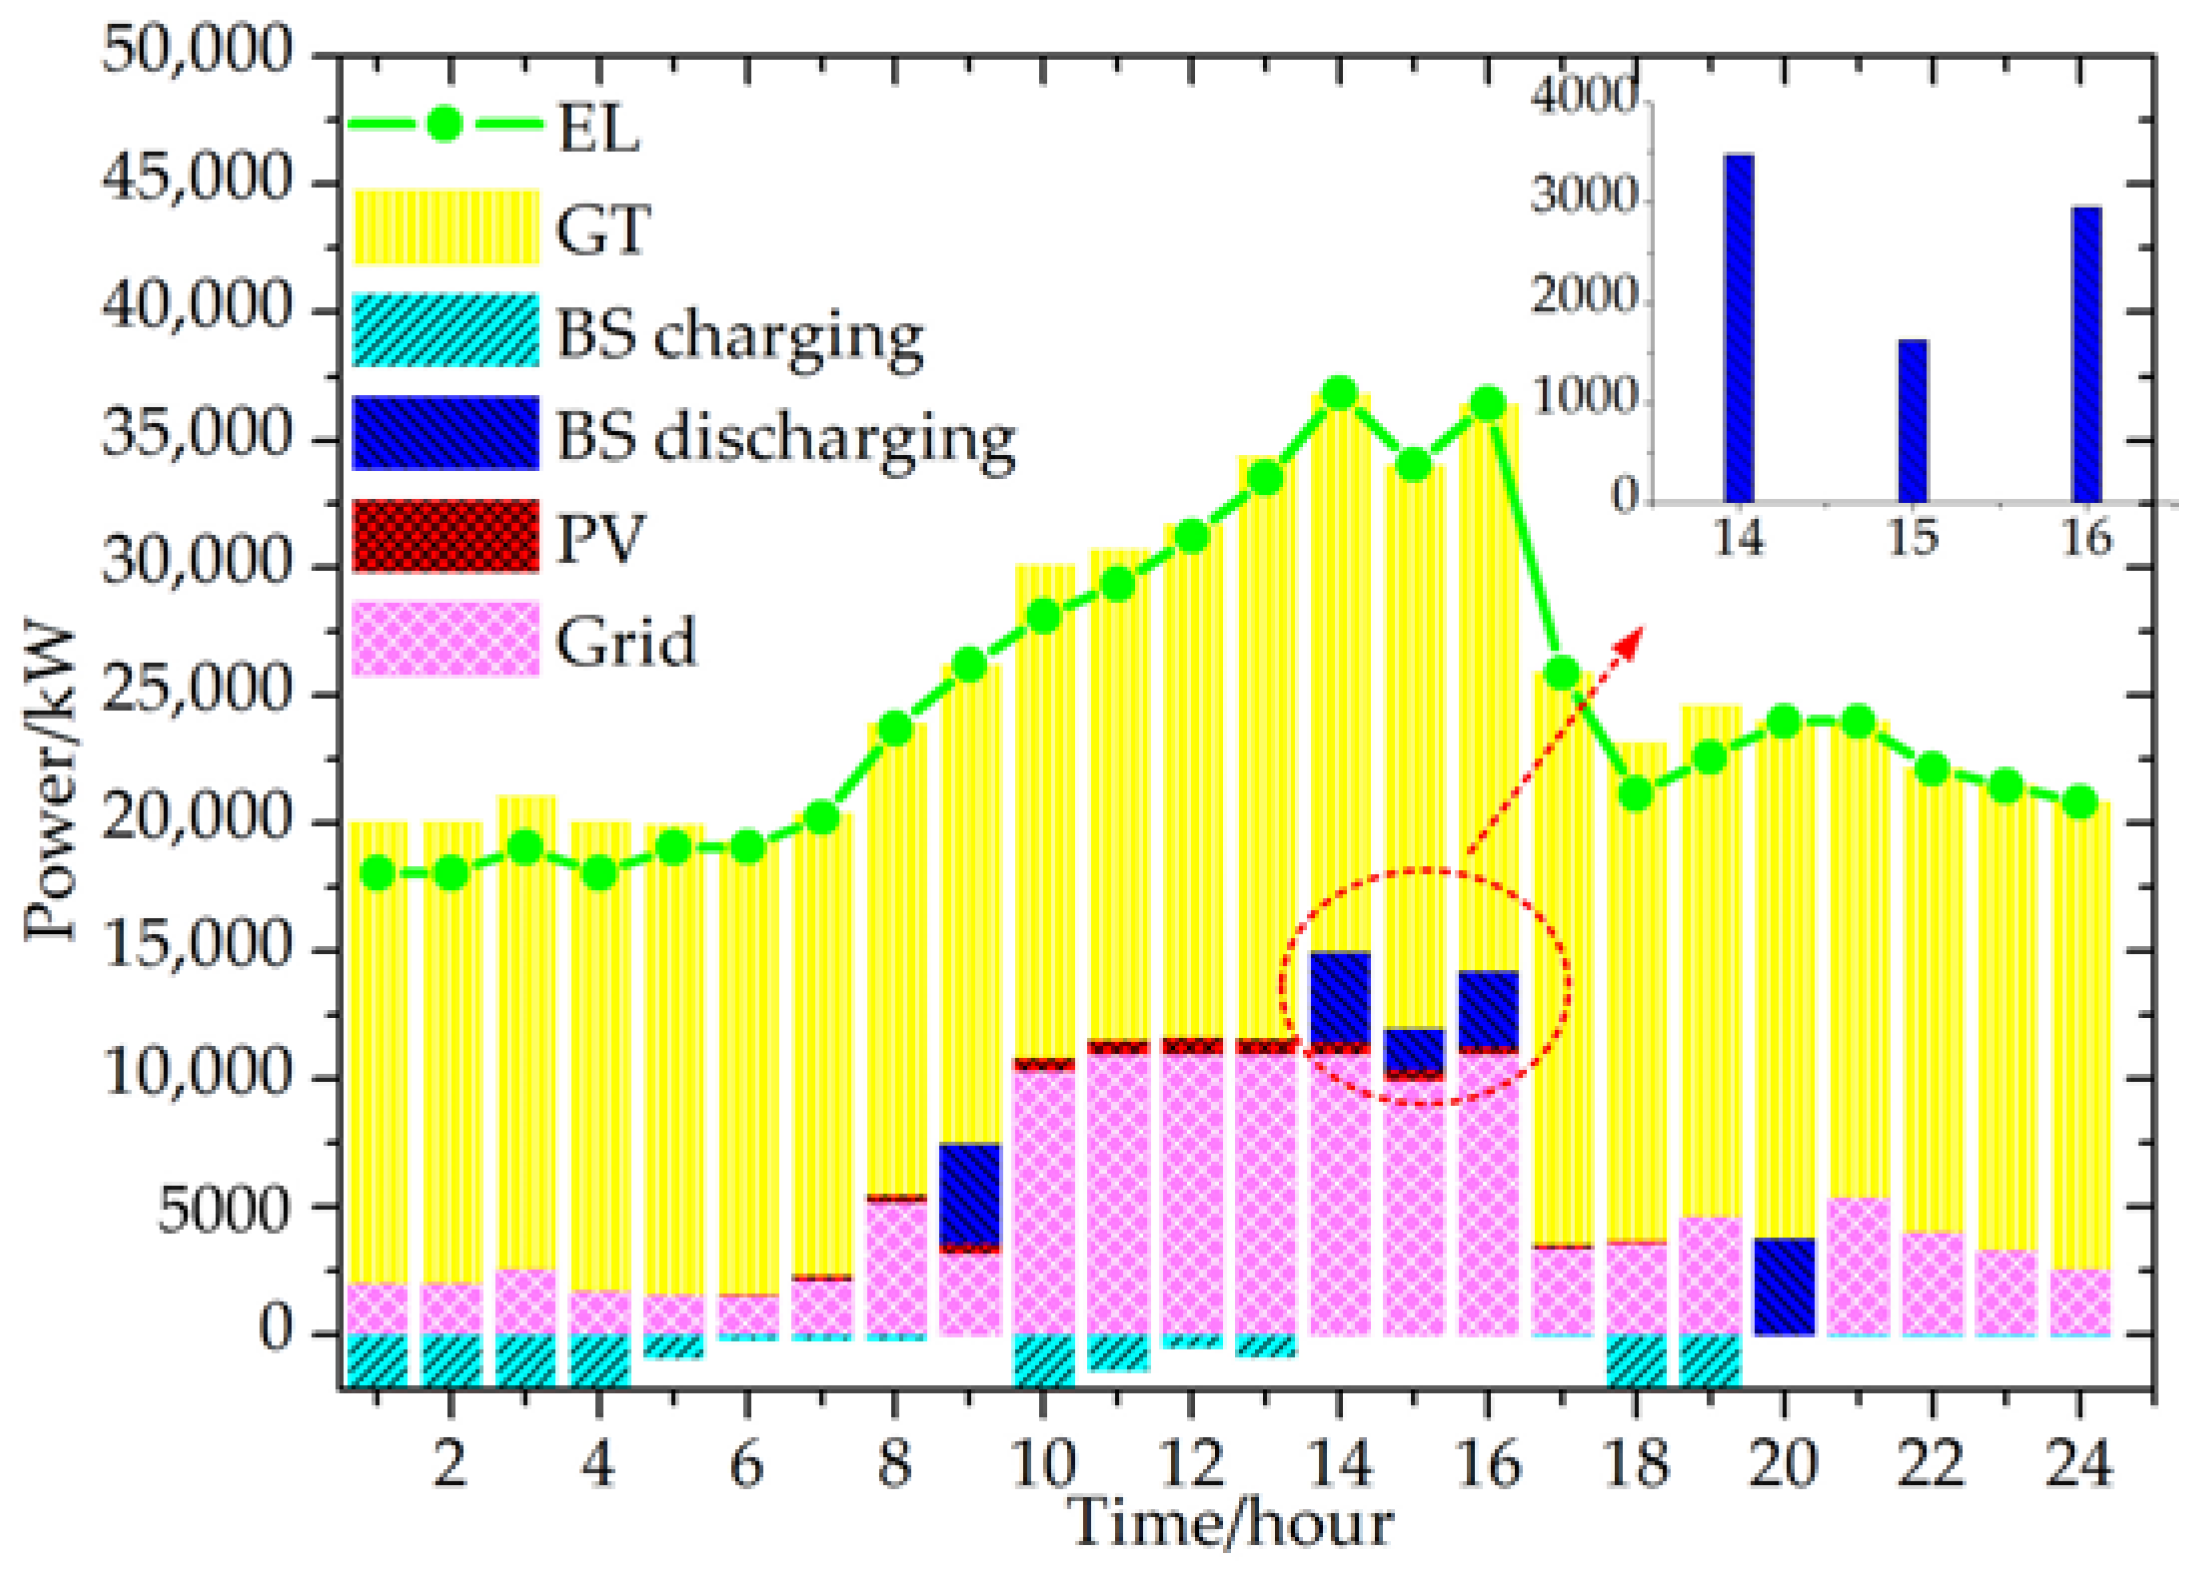
In normal mode, the system operation is illustrated in Figure 7, Figure 8 and Figure 9 using the centralized optimal dispatch strategy. In this case, the energy balance can be kept by optimal and coordinated dispatch of CCHP and battery storage directly owned by a multi-energy operator. The total profit of multi-energy operator is $72,509.70 in Case 1.
Case 2. The load fluctuation alleviated by battery storage
According to the day-ahead forecast, the total electricity load power will be increased by 3.5 MW at 14 p.m., and the cooling and thermal loads remain unchanged. The optimal dispatch of electric resources in Case 2 is shown in Figure 10. The optimal dispatch of cooling resources and thermal resources are as in Figure 8 and Figure 9. The load fluctuation effect in the industrial park is mainly alleviated by discharging of the battery directly owned by the multi-energy operator. The total profit of multi-energy operator is $72,228.40 in Case 2.
Case 3. The load fluctuation alleviated by heating demand response
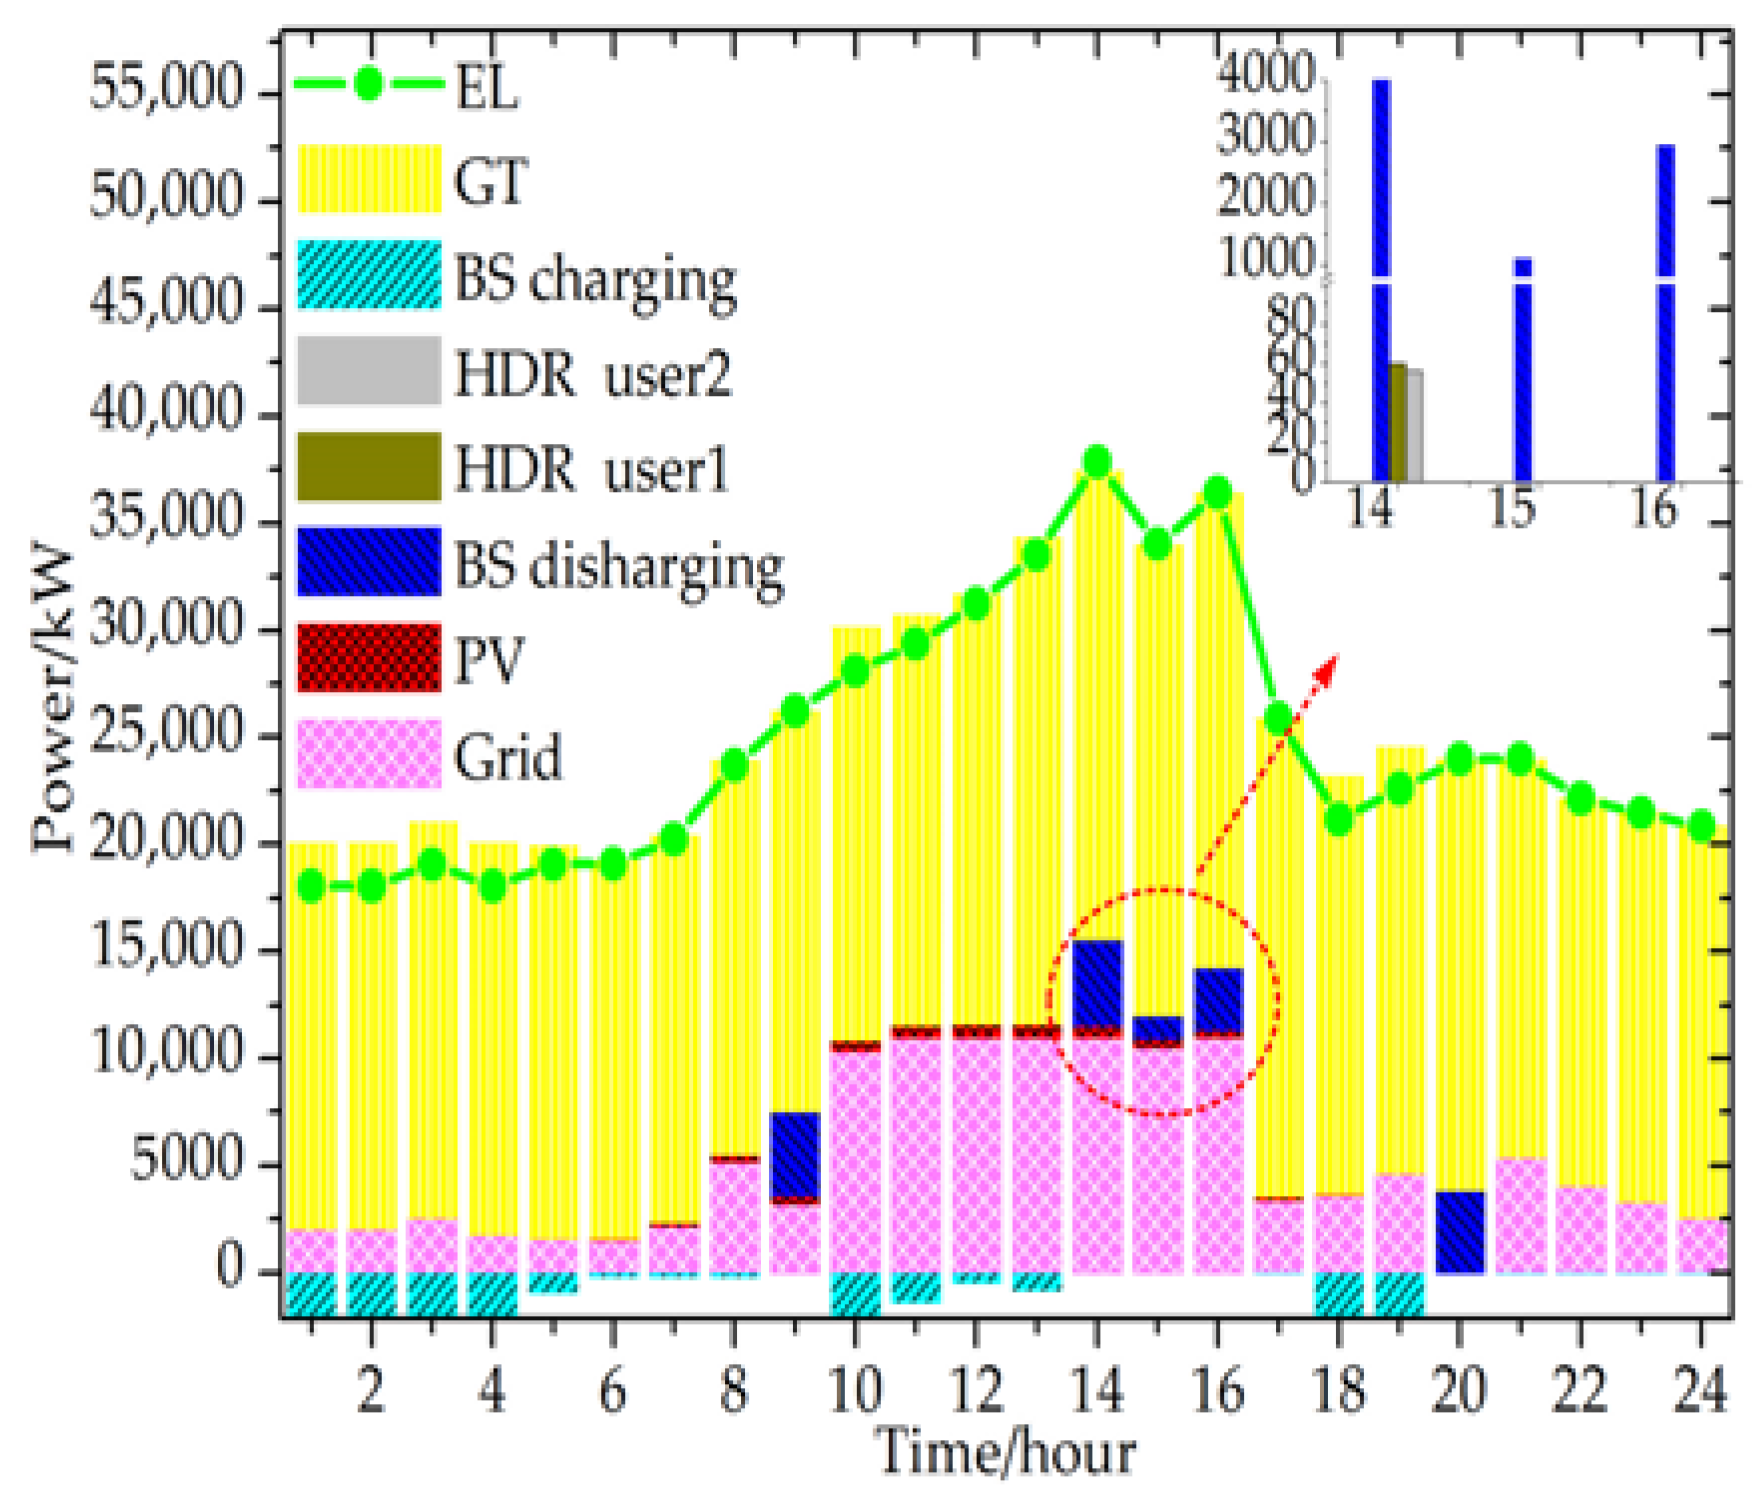
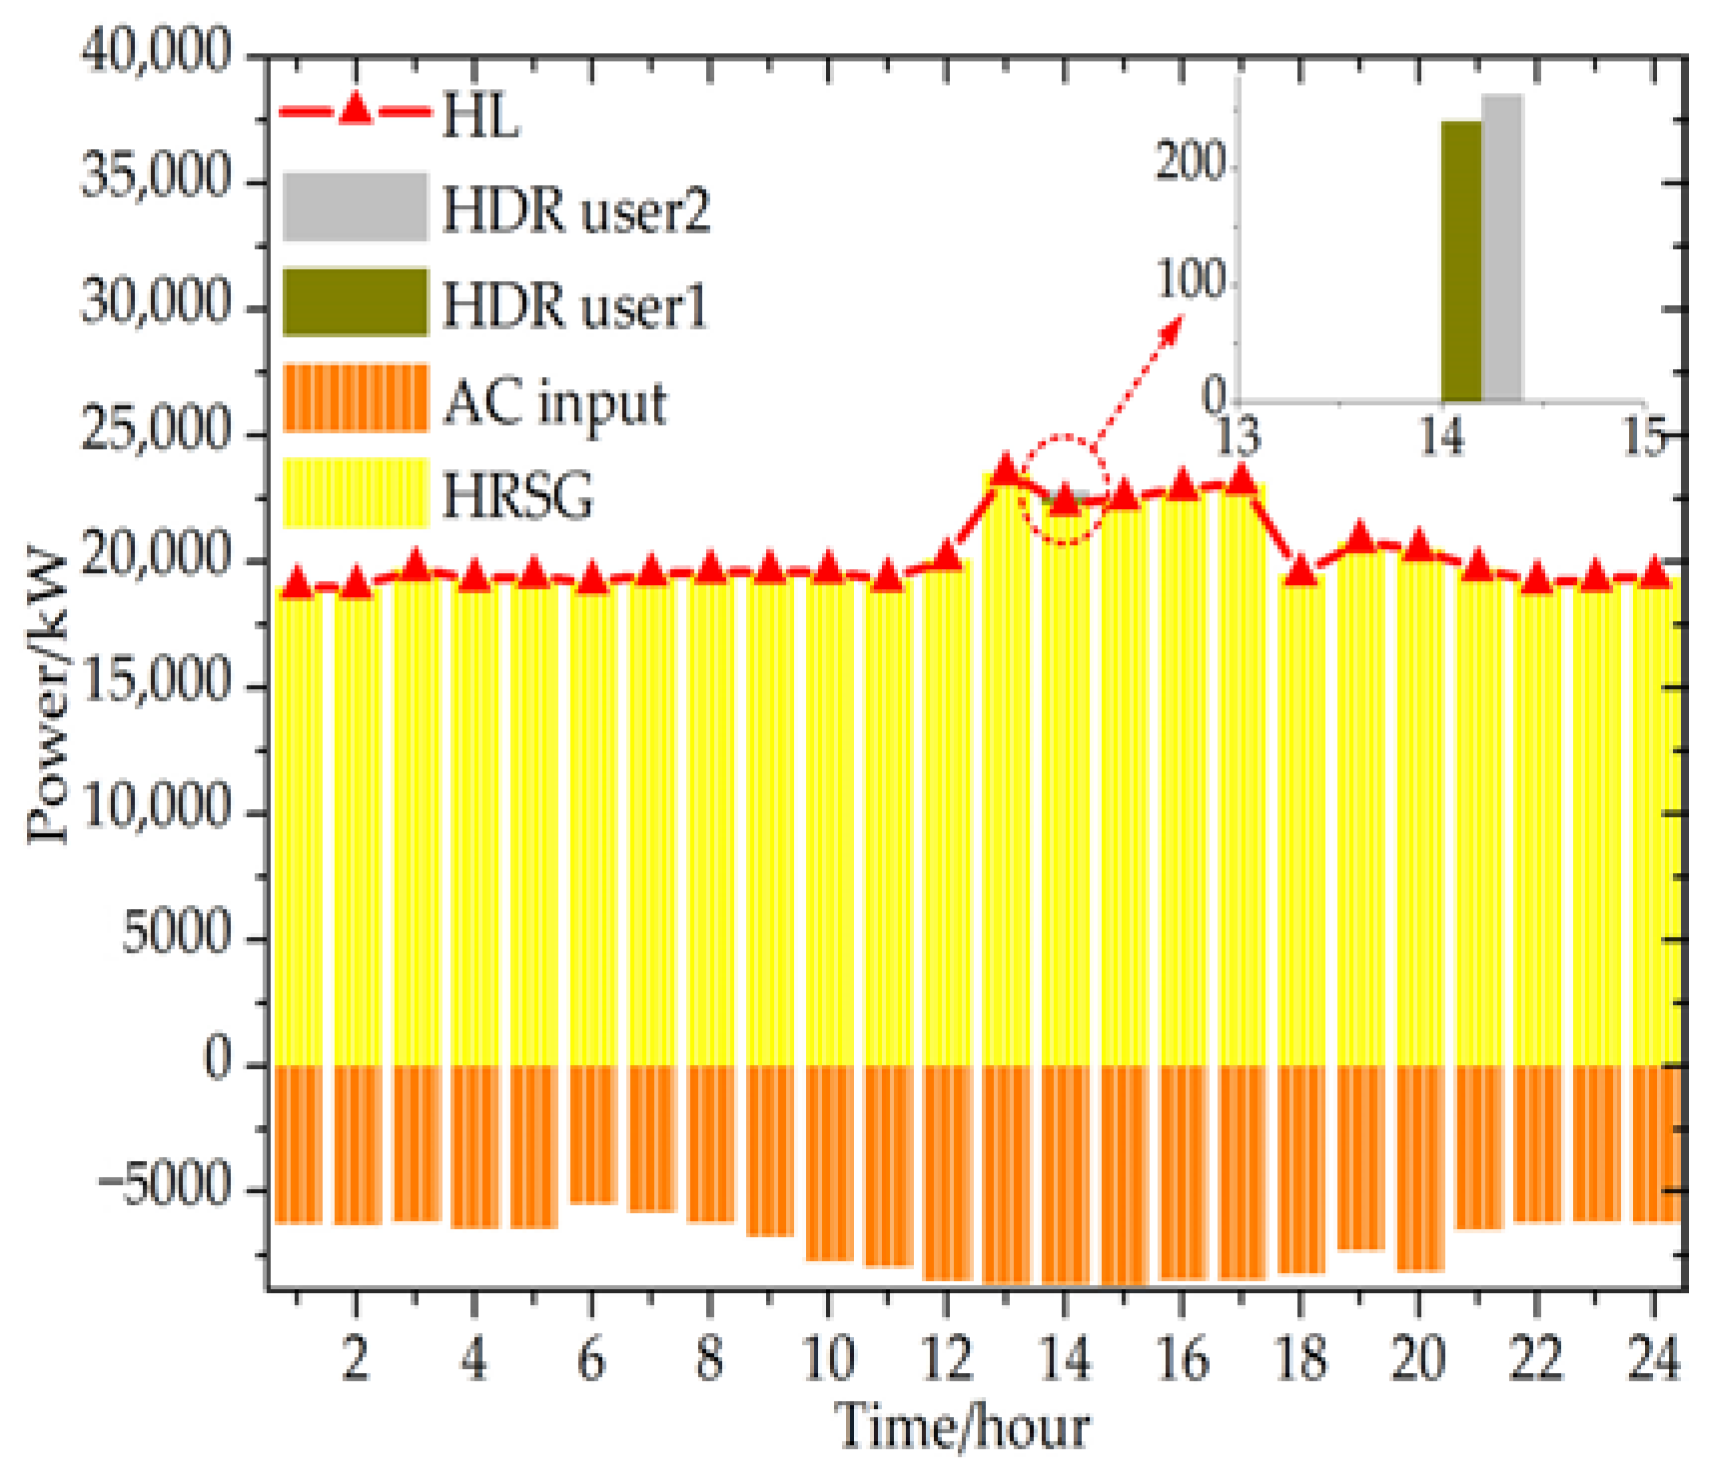
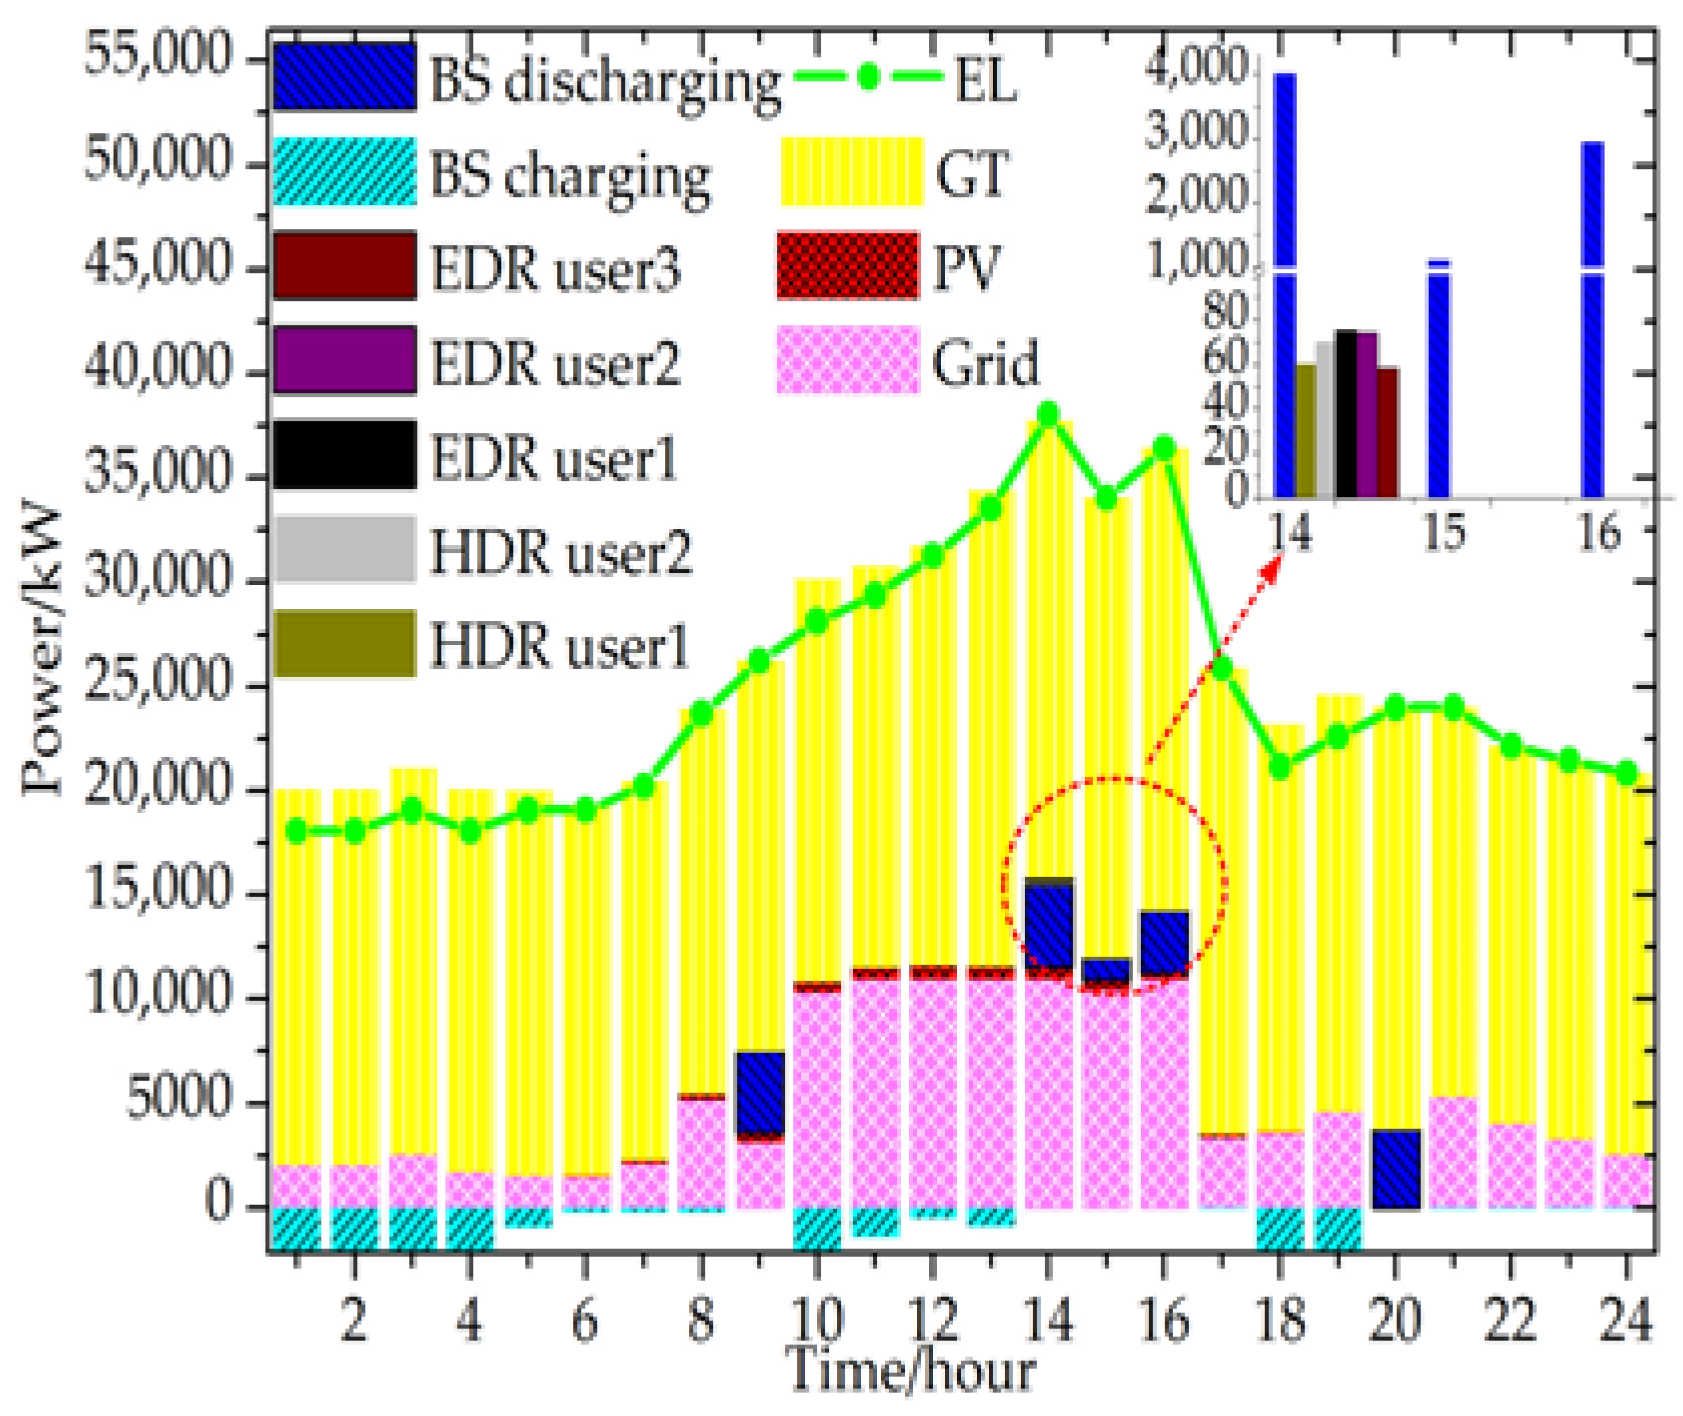
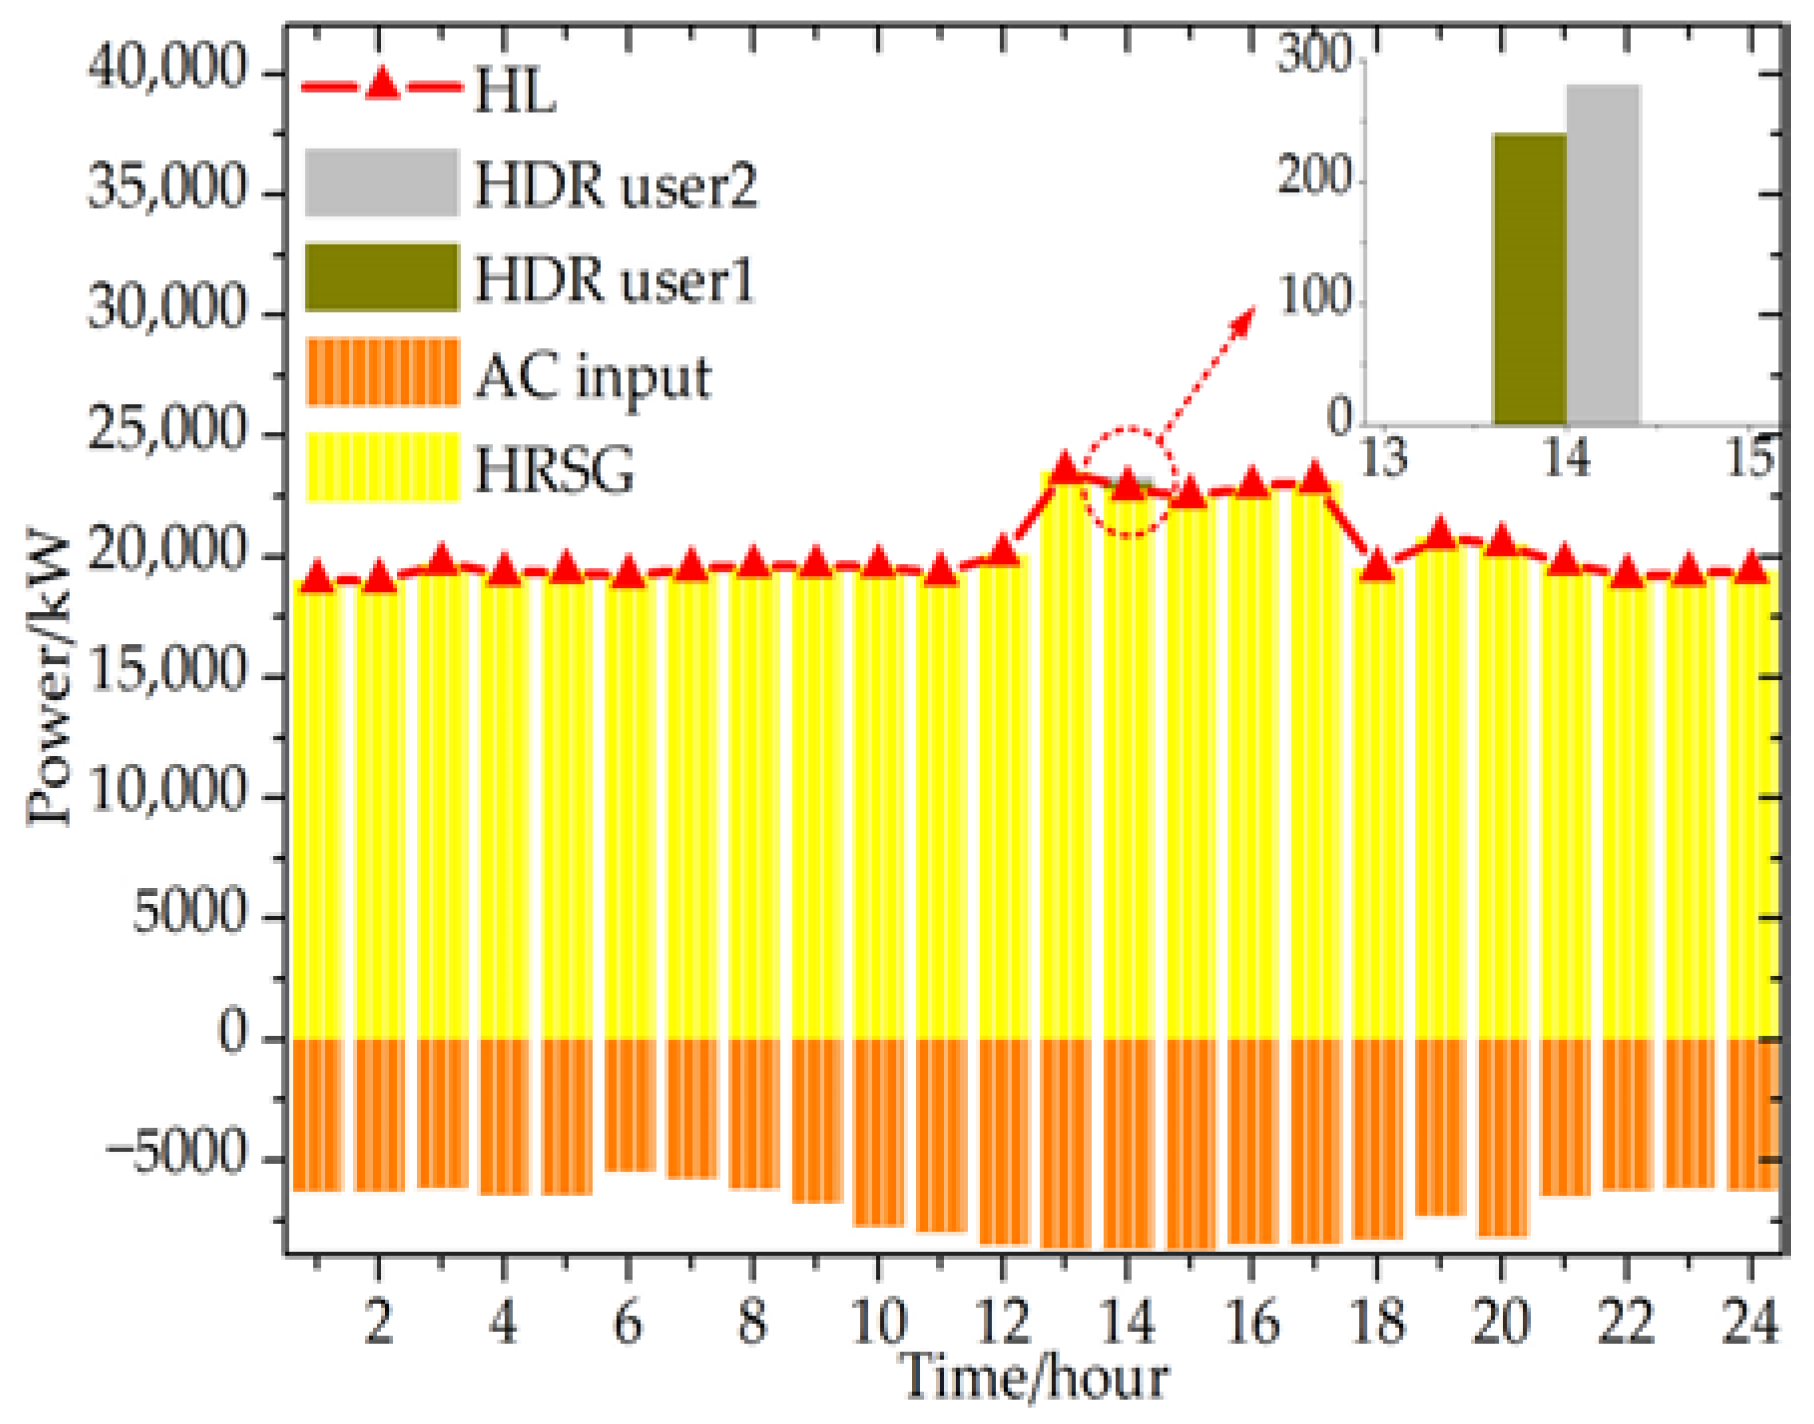
According to the day-ahead forecast, total electricity load power will be increased by 4.5 MW at 14:00, and the cooling and thermal loads remain unchanged. Over-limit power of a tie line under peak shifting constrain at 14:00 is 471 kW, as calculated by Equation (36). To maintain the energy balance, a multi-energy operator needs to turn off electric heating devices installed in IDR participants’ factories and guide factories in using heating from the operator’s CCHP. The total power of replaced electric heating is 125.6 kW; in addition, the total heating power increased by CCHP from the operator side is 502.3 kW. The total compensation expenses spent by a multi-energy operator on participating factories are $38.10, and the total profit of the multi-energy operator is $72,213 in this case. The optimal dispatch is shown in Figure 11 and Figure 12.
Case 4. The load fluctuation alleviated by electricity demand response
According to the day-ahead forecast, total electricity load power will be increased by 4.72 MW at 14:00, but the cooling and thermal load remain unchanged. Over-limit power of tie line under peak shifting constrain at 14:00 is 695 kW as calculated by Equation (36). To maintain the energy balance, the operator needs to turn off electric heating devices installed in IDR participants’ factories and guide factories in using heating from an operator’s CCHP. In addition, the electricity demand response participants come to the rescue by cutting 236.7 kW electrical power. The total electricity DR compensation is $472. The total compensation cost for an operator in a heating demand response program is $40.30. The total profit of the multi-energy operator is $71,766.90. The optimal dispatch is shown in Figure 13 and Figure 14. The profit comparison for a multi-energy operator with and without optimization is presented in Table 5.
From the optimal dispatch results in the four case studies, the following conclusions can be reached:
- The thermal load can be satisfied by fixed heat to electricity ratio CCHP. The CCHP operates in the following thermal load (FTL) mode and supplies electricity, heating and cooling simultaneously for users in an industrial park. The shortage of electricity can be compensated for by an external power network with a tie line.
- In normal operation, the battery storage directly owned by the operator stores cheap energy in flat and valley periods of electricity tariff and discharges when the electricity price is high to save on operational costs. Observing the maximum permitted power value of a tie line, the battery storage will discharge to eliminate the load peak when the power value of a tie line exceeds maximum the allowable value.
- Due to the high compensation costs, IDR participants are only required to adjust their energy usage when the power of the tie line exceeds the maximum allowable value. Due to the low impact on the comfort level and satisfaction ratio, the compensation cost of the heating demand response program is lower than the cost of the electricity demand response program. In practice, the heating demand response is an operator’s favorite means of load shaving in an IDR program.
- In an electricity demand response program, the compensation cost is in proportion to the square of the load shedding amount. To save on compensation costs, the total load shedding amount may be averaged for the three participating factories.
5.3. Results Analysis and Discussion
Without optimization, the operational plan of the device cannot be properly arranged. Operational costs are much higher in the three factories, while profits are lower for a multi-energy operator. The overall peak power value in an industrial park is large. The total operational costs of Factories 1 to 3 are $2498.60, $3637.40 and $637.30, respectively. The total profit of the multi-energy operator is $69,179.10 in Cases 1 to 4. The power of the tie line in Cases 1 to 4 is 11.99 MW, 14.47 MW, 15.47 MW, and 15.69 MW, respectively.
Simulation results have validated the effectiveness of the optimal dispatch considering IDR under peak shifting constraints. The optimal operation of factories and the multi-energy operator is achieved under peak shifting constraints and the overall peak power value in an industrial park is significantly reduced. In the normal operation mode, a device is reasonably operated according to the energy price. For instance, the energy storage on the factory side and multi-energy operator side is usually designed to store energy during low tariff periods and discharge in high price hours to maximize the benefits. The MT on the factory side works to produce both thermal energy and electricity in high price hours to minimize operational costs. With optimization, the total operational costs of Factories 1 to 3 are $2169.50, $3582.60, and $592.30, respectively. The total profit of the multi-energy operator in Cases 1 to 4 is $72,509.70, $72,228.40, $72,213 and $71,766.90, respectively. The power of the tie line in Cases 1 to 4 is 11 MW. Compared with the results without optimization, the factories and multi-energy operator gain more profits and the overall peak power value in an industrial park is reduced. Particularly in heavy load conditions, factories can consume more heating or cooling from CCHP to generate more electricity. Furthermore, the computing time is on the millisecond level, which can meet the engineering demand.
Although there are important discoveries revealed by these studies, there are also limitations. The current algorithm is relatively preliminary. The presented binary mixed integer linear programming problem is solved by Lingo. More attention will be given to intelligent algorithm analysis. Then a more accurate and comprehensive IDR model needs further study and exploration.
6. Conclusions
With the development of multi-energy systems, IDR has proven to be a new demand response form that can ensure MES’ friendly interactions with the power network. In this paper, an integrated demand response model containing various types of flexible resources is established to fully utilize the adjustable multi-energy resources on the demand side and reduce the costs of compensation. Moreover, to decrease computational difficulty and conflict of interest in MES, a bilevel optimal dispatch strategy is proposed. The maximum profits of factories and multi-energy operators can be ensured via the bilevel optimal dispatch strategy. Four cases are analyzed to verify and validate the proposed strategy. The results show that using a distributed optimal dispatch strategy and multiple energy resources owned by lower-level factories can be coordinated to minimize operating costs. Similarly, the maximal profit of a multi-energy operator can be achieved and the overall peak power value in an industrial park can be reduced using a centralized optimal dispatch strategy. Particularly in heavy load conditions, the battery storage, heating demand response, and electricity demand response will be selected and implemented in turn to smooth the load fluctuation. A multi-energy operator has more choices at the peak time than ever, and a multi-energy operator is inclined to choose the most economical flexible resources in an industrial park. There are more types of flexible resources and lower interactive compensations in the IDR program. The steady-state dispatch of a multi-energy system based on the day-ahead prediction is mainly discussed in this paper. In the future, the intra-day dispatch strategy with an ultra-short-term load forecast and uncertainty of renewable energy resources and energy market will also be studied further.
Author Contributions
Y.Z. conceived the main idea and wrote the manuscript with guidance from K.P.; B.X., H.L., Y.L. and X.Z. reviewed the work and gave helpful suggestions for improvements.
Funding
This research was funded by the national key R&D program of China (Project No. 2016YFB0901300) and Shandong Provincial Natural Science Foundation, China (Project No. ZR2017LEE022).
Acknowledgments
The authors thank the anonymous reviewers for careful reading and many helpful suggestions to improve the presentation of this paper.
Conflicts of Interest
The authors declare no conflict of interest.
Abbreviations
| Nomenclature | |
| MES | multi-energy system |
| CCHP | combined cooling, heating and power |
| CHP | combined heat and power |
| GB | gas boiler |
| GT | gas turbine |
| MT | micro turbine |
| EAC | electric air conditioner |
| AC | absorption chiller |
| HP | heat pump |
| DR | demand response |
| TOU | time of use |
| IDR | integrated demand response |
| PV | photovoltaic |
| WT | wind turbine |
| BS | battery storage |
| EAC | electric air conditioner |
| HRSG | heat recovery steam generator |
| ES | energy storage |
| COP | coefficient of performance |
| IL | interruptible load |
| IS | ice storage |
| EDR | electricity demand response |
| HDR | heating demand response |
| CDR | cooling demand response |
| EL | electricity load |
| HL | heating load |
| CL | cooling load |
| FTL | following thermal load |
| TS | thermal storage |
| DMME | double mode main engine |
| EH | electric heating device |
| EC | electric refrigeration device |
| Greek symbols | |
| α | heat to electricity ratio |
| β | second-order coefficient of load characteristic in EDR |
| μ | first-order coefficient of load characteristic in EDR |
| λ | load characteristic coefficient in HDR or CDR |
| η | efficiency |
| γ | charging and discharging rate |
| English symbols | |
| F | heat value |
| P | electric power |
| Q | thermal power |
| W | level of ES |
| Caps | capacity |
| E | profit |
| c | price |
| L | load |
| t | time |
| i | order of user |
| j | order of device |
| T | time period |
| m | total number of device |
| dis | discharging |
| ch | charging |
| con | condensing mode |
Appendix A

Table A1.
Configuration of factories and multi-energy operator.
| Factory No. | Configuration | Type of Load | |
|---|---|---|---|
| Factory 1 | Capacity of PV (kW) | 500 | Electricity |
| Capacity of BS (MW·h) | 6 | ||
| Factory 2 | Capacity of PV (kW) | 500 | Electricity and cooling |
| Capacity of IS (MW·h) | 20 | ||
| Factory 3 | Capacity of PV (kW) | 100 | Electricity, cooling, and heating |
| Capacity of steam heat-exchanger (kW) | 120 | ||
| Capacity of HRSG (kW) | 120 | ||
| Capacity of GB (kW) | 100 | ||
| Multi-energy operator | Capacity of GT (MW) | 25 | Electricity, cooling, and heating |
| Capacity of HRSG (MW) | 50 | ||
| Capacity of steam heat exchanger (MW) | 60 | ||
| Capacity of BS (MW·h) | 10 | ||
Table A2.
The parameters of devices in lower level and upper level.
| Type of Devices | Parameters | |
|---|---|---|
| MT | ηMT | 0.3 |
| HRSG in Factory 3 | ηGB | 0.73 |
| GT | ηGT | 0.348 |
| α | 1.8 | |
| HRSG in operator-level | ηGB | 0.808 |
| steam heat exchanger | ηHX,steam | 0.9 |
| BS | γBS,ch | 0.2 |
| γBS,dis | 0.4 | |
| ηBS,ch | 0.95 | |
| ηBS,dis | 0.95 | |
| σBS | 0.02 | |
| WBS,max | 0.9CapBS | |
| WBS,min | 0.1CapBS | |
| IS | γIS,ch | 0.5 |
| γIS,dis | 0.5 | |
| σIS | 0.03 | |
| WIS,max | 0.9CapBS | |
| WIS,min | 0.1CapBS | |
| EAC | COPEAC | 4 |
| DMME | 3.68 | |
| 2.94 | ||
References
- Li, Y.; Xia, Y. DES/CCHP: The best utilization mode of natural gas for China’s low carbon economy. Energy Policy 2013, 53, 477–483. [Google Scholar] [CrossRef]
- Graus, W.H.J.; Voogt, M.; Worrell, E. International comparison of energy efficiency of fossil power generation. Energy Policy 2007, 35, 3936–3951. [Google Scholar] [CrossRef]
- Xu, X.D.; Jia, H.J.; Chiang, H.D.; Yu, D.C.; Wang, D. Dynamic modeling and interaction of hybrid natural gas and electricity supply system in microgrid. IEEE Trans. Power Syst. 2015, 30, 1212–1221. [Google Scholar] [CrossRef]
- Mancarella, P. MES (multi-energy systems): An overview of concepts and evaluation models. Energy 2014, 65, 1–17. [Google Scholar] [CrossRef]
- Qiu, J.; Dong, Z.Y.; Zhao, J.H.; Xu, Y.; Zheng, Y.; Li, C.X.; Wong, K.P. Multi-Stage Flexible Expansion Co-Planning Under Uncertainties in a Combined Electricity and Gas Market. IEEE Trans. Power Syst. 2015, 30, 2119–2129. [Google Scholar] [CrossRef]
- Marzband, M.; Azarinejadian, F.; Savaghebi, M.; Pouresmaeil, E.; Guerrero, J.M.; Lightbody, G. Smart transactive energy framework in grid-connected multiple home microgrids under independent and coalition operations. Renew. Energy 2018, 126, 95–106. [Google Scholar] [CrossRef]
- Luo, F.; Dong, Z.Y.; Meng, K.; Wen, J.H.; Wang, H.M.; Zhao, J.H. An Operational Planning Framework for Large-Scale Thermostatically Controlled Load Dispatch. IEEE Trans. Ind. Inf. 2017, 13, 217–227. [Google Scholar] [CrossRef]
- Gao, L.; Wu, H.; Jin, H.G.; Yang, M.L. System study of combined cooling, heating and power system for eco-industrial parks. Int. J. Energy Res. 2008, 32, 1107–1118. [Google Scholar] [CrossRef]
- Bahrami, S.; Amini, M.H.; Shafie-khah, M.; Catalao, J.P. A Decentralized Electricity Market Scheme Enabling Demand Response Deployment. IEEE Trans. Power Syst. 2018, 33, 4218–4227. [Google Scholar] [CrossRef]
- Bahrami, S.; Wong, V.W.; Huang, J. An online learning algorithm for demand response in smart grid. IEEE Trans. Smart Grid 2017. [Google Scholar] [CrossRef]
- Amini, M.H.; Nabi, B.H.; Haghifam, M.R. Load management using multi-agent systems in smart distribution network. In Proceedings of the Power and Energy Society General Meeting, Vancouver, BC, Canada, 21–25 July 2013; pp. 1–5. [Google Scholar]
- Tavakoli, M.; Shokridehaki, F.; Marzband, M.; Godina, R.; Pouresmaeil, E. A Two Stage Hierarchical Control Approach for the Optimal Energy Management in Commercial Building Microgrids Based on Local Wind Power and PEVs. Sustain. Cities Soc. 2018, 41, 332–340. [Google Scholar] [CrossRef]
- Marzband, M.; Javadi, M.; Pourmousavi, S.A.; Lightbody, G. An advanced retail electricity market for active distribution systems and home microgrid interoperability based on game theory. Electr. Power Syst. Res. 2018, 157, 187–199. [Google Scholar] [CrossRef]
- Marzband, M.; Fouladfar, M.H.; Akorede, M.F.; Lightbody, G.; Pouresmaeil, E. Framework for smart transactive energy in home-microgrids considering coalition formation and demand side management. Sustain. Cities Soc. 2018, 40, 136–154. [Google Scholar] [CrossRef]
- Jin, X.L.; Mu, Y.F.; Jia, H.J.; Wu, J.Z.; Jiang, T.; Yu, X.D. Dynamic economic dispatch of a hybrid energy microgrid considering building based virtual energy storage system. Appl. Energy 2017, 194, 386–398. [Google Scholar] [CrossRef]
- Rastegar, M.; Fotuhi-Firuzabad, M.; Lehtonen, M. Home load management in a residential energy hub. Electr. Power Syst. Res. 2015, 119, 322–328. [Google Scholar] [CrossRef]
- Shao, S.N.; Pipattanasomporn, M.; Rahman, S. Demand response as a load shaping tool in an intelligent grid with electric vehicles. IEEE Trans. Smart Grid 2011, 2, 624–631. [Google Scholar] [CrossRef]
- Shao, S.N.; Pipattanasomporn, M.; Rahman, S. Grid integration of electric vehicles and demand response with customer choice. IEEE Trans. Smart Grid 2012, 3, 543–550. [Google Scholar] [CrossRef]
- Sheikhi, A.; Rayati, M.; Bahrami, S.; Ranjbar, A.M. Integrated Demand Side Management Game in Smart Energy Hubs. IEEE Trans. Smart Grid 2015, 6, 675–683. [Google Scholar] [CrossRef]
- Sheikhi, A.; Bahrami, S.; Ranjbar, A.M. An autonomous demand response program for electricity and natural gas networks in smart energy hubs. Energy 2015, 89, 490–499. [Google Scholar] [CrossRef]
- Wang, J.X.; Zhong, H.W.; Ma, Z.M.; Xia, Q.; Kang, C.Q. Review and prospect of integrated demand response in the multi-energy system. Appl. Energy 2017, 202, 772–782. [Google Scholar] [CrossRef]
- Bai, L.Q.; Li, F.X.; Cui, H.T.; Jiang, T.; Sun, H.B.; Zhu, J.X. Interval optimization based operating strategy for gas-electricity integrated energy systems considering demand response and wind uncertainty. Appl. Energy 2016, 167, 270–279. [Google Scholar] [CrossRef] [Green Version]
- Bahrami, S.; Sheikhi, A. From Demand Response in Smart Grid Toward Integrated Demand Response in Smart Energy Hub. IEEE Trans. Smart Grid 2016, 7, 650–658. [Google Scholar] [CrossRef]
- Sheikhi, A.; Rayati, M.; Bahrami, S.; Ranjbar, A.M.; Sattari, S. A cloud computing framework on demand side management game in smart energy hubs. Int. J. Electr. Power Energy Syst. 2015, 64, 1007–1016. [Google Scholar] [CrossRef]
- Vahid-Pakdel, M.J.; Nojavan, S.; Mohammadi-Ivatloo, B.; Zare, K. Stochastic optimization of energy hub operation with consideration of thermal energy market and demand response. Energy Convers. Manag. 2017, 145, 117–128. [Google Scholar] [CrossRef]
- Ni, L.N.; Liu, W.J.; Wen, F.S.; Xue, Y.S.; Dong, Z.Y.; Zheng, Y.; Zhang, R. Optimal operation of electricity, natural gas and heat systems considering integrated demand responses and diversified storage devices. J. Modern Power Syst. Clean Energy 2018, 6, 423–437. [Google Scholar] [CrossRef]
- Wu, D.W.; Wang, R.Z. Combined cooling, heating and power: A review. Prog. Energy Combust. Sci. 2006, 32, 459–495. [Google Scholar] [CrossRef]
- Liu, X.Z. Combined Analysis of Electricity and Heat Networks; Cardiff University: Cardiff, UK, 2013. [Google Scholar]
- Guo, L.; Liu, W.J.; Cai, J.J.; Hong, B.W.; Wang, C.S. A two-stage optimal planning and design method for combined cooling, heat and power microgrid system. Energy Convers. Manag. 2013, 74, 433–445. [Google Scholar] [CrossRef]
- Ma, T.F.; Wu, J.Y.; Hao, L.L. Energy flow modeling and optimal operation analysis of the micro energy grid based on energy hub. Energy Convers. Manag. 2017, 133, 292–306. [Google Scholar] [CrossRef]
- Baker, J. New technology and possible advances in energy storage. Energy Policy 2008, 36, 4368–4373. [Google Scholar] [CrossRef]
- Valinejad, J.; Marzband, M.; Akorede, M.F.; Barforoshi, T.; Jovanović, M. Generation expansion planning in electricity market considering uncertainty in load demand and presence of strategic gencos. Electr. Power Energy Syst. 2017, 152, 92–104. [Google Scholar] [CrossRef]
- Aalami, H.A.; Moghaddam, M.P.; Yousefi, G.R. Evaluation of nonlinear models for time-based rates demand response programs. Int. J. Electr. Power Energy Syst. 2015, 65, 282–290. [Google Scholar] [CrossRef]
- Jiang, Z.Q.; Hao, R.; Ai, Q. Interaction mechanism of industrial park based on multi-energy complementation. Electr. Power Autom. Equip. 2017, 6, 260–267. [Google Scholar]
- Fahrioglu, M.; Alvarado, F.L. Using utility information to calibrate customer demand management behavior models. IEEE Trans. Power Syst. 2001, 16, 317–322. [Google Scholar] [CrossRef] [Green Version]
- Tavakoli, M.; Shokridehaki, F.; Akorede, M.F.; Marzband, M.; Vechiu, I.; Pouresmaeil, E. Cvar-based energy management scheme for optimal resilience and operational cost in commercial building microgrids. Int. J. Electr. Power Energy Syst. 2018, 100, 1–9. [Google Scholar] [CrossRef]
- Marzband, M.; Sumper, A.; Domínguez-García, J.L.; Gumara-Ferret, R. Experimental validation of a real time energy management system for microgrids in islanded mode using a local day-ahead electricity market and minlp. Energy Convers. Manag. 2013, 76, 314–322. [Google Scholar] [CrossRef]
Figure 1.
Overall framework schematic diagram.

Figure 2.
Logic flow chart for bilevel optimal dispatch strategy considering IDR.

Figure 3.
Optimal dispatch of Factory 1.

Figure 4.
Optimal dispatch of Factory 2.

Figure 5.
Optimal dispatch of electric resources of Factory 3.

Figure 6.
Optimal dispatch of thermal resources of Factory 3.

Figure 7.
Optimal dispatch of electric resources in Case 1.

Figure 8.
Optimal dispatch of thermal resources in Case 1.

Figure 9.
Optimal dispatch of cooling resources in Case 1.

Figure 10.
Optimal dispatch of electric resources in Case 2.

Figure 11.
Optimal dispatch of electric resources in Case 3.

Figure 12.
Optimal dispatch of thermal resources in Case 3.

Figure 13.
Optimal dispatch of electric resources in Case 4.

Figure 14.
Optimal dispatch of thermal resources in Case 4.

Table 1.
Time of use.
| Time Period | TOU | Price ($/kW·h) |
|---|---|---|
| 00:00–08:00 | Valley | 0.0074 |
| 09:00–14:00, 18:00–19:00, 23:00–24:00 | Flat | 0.1404 |
| 15:00–17:00, 20:00–22:00 | Peak | 0.2266 |
Table 2.
Operational costs comparison for three factories with and without optimization.
| Factory No. | Operational Costs/$ | |
|---|---|---|
| Without Optimization | With Optimization | |
| Factory 1 | 2498.60 | 2169.50 |
| Factory 2 | 3637.40 | 3582.60 |
| Factory 3 | 637.3 | 592.3 |
Table 3.
Compensation standard for heating and cooling DR.
| Factory No. | Maximum Power Value/kW | λi |
|---|---|---|
| Thermal and refrigeration DR Factory 1 | 60 | 0.1547 |
| Thermal and refrigeration DR Factory 2 | 70 | 0.1828 |
Table 4.
Compensation for electricity DR.
| Factory No. | Maximum Power Value/kW | βi | μi |
|---|---|---|---|
| Electricity DR Factory 1 | 100 | 0.0273 | 0.1953 |
| Electricity DR Factory 2 | 200 | 0.0273 | 0.2734 |
| Electricity DR Factory 3 | 300 | 0.0352 | 0.2344 |
Table 5.
Profit comparison for a multi-energy operator with and without optimization.
| Case | Pgrid/MW | Profit/$ | ||
|---|---|---|---|---|
| Without Optimization | With Optimization | Without Optimization | With Optimization | |
| 1 | 11.99 | 11 | 69,179.1 | 72,509.7 |
| 2 | 14.47 | 11 | 69,179.1 | 72,228.4 |
| 3 | 15.47 | 11 | 69,179.1 | 72,213 |
| 4 | 15.69 | 11 | 69,179.1 | 71,766.9 |
© 2018 by the authors. Licensee MDPI, Basel, Switzerland. This article is an open access article distributed under the terms and conditions of the Creative Commons Attribution (CC BY) license (http://creativecommons.org/licenses/by/4.0/).
Share and Cite
MDPI and ACS Style
Zhao, Y.; Peng, K.; Xu, B.; Li, H.; Liu, Y.; Zhang, X. Bilevel Optimal Dispatch Strategy for a Multi-Energy System of Industrial Parks by Considering Integrated Demand Response. Energies 2018, 11, 1942. https://doi.org/10.3390/en11081942
AMA Style
Zhao Y, Peng K, Xu B, Li H, Liu Y, Zhang X. Bilevel Optimal Dispatch Strategy for a Multi-Energy System of Industrial Parks by Considering Integrated Demand Response. Energies. 2018; 11(8):1942. https://doi.org/10.3390/en11081942
Chicago/Turabian StyleZhao, Yuehao, Ke Peng, Bingyin Xu, Huimin Li, Yuquan Liu, and Xinhui Zhang. 2018. "Bilevel Optimal Dispatch Strategy for a Multi-Energy System of Industrial Parks by Considering Integrated Demand Response" Energies 11, no. 8: 1942. https://doi.org/10.3390/en11081942
Note that from the first issue of 2016, this journal uses article numbers instead of page numbers. See further details here.