Lightning Impulse Withstand of Natural Ester Liquid
by
 , and
, and
Stephanie Haegele
1,*, 
Farzaneh Vahidi
1,
Stefan Tenbohlen
1,
Kevin J. Rapp
2 and
Alan Sbravati
2 1
Institute of Power Transmission and High Voltage Technology, University of Stuttgart, 70569 Stuttgart, Germany
2
Cargill Inc., Cargill Industrial Specialties—Dielectric Fluids, Plymouth, MN 55441, USA
*
Author to whom correspondence should be addressed.
Energies 2018, 11(8), 1964; https://doi.org/10.3390/en11081964
Submission received: 7 July 2018
/
Revised: 23 July 2018
/
Accepted: 25 July 2018
/
Published: 28 July 2018
(This article belongs to the Special Issue Engineering Dielectric Liquid Applications)
Abstract
:Due to the low biodegradability of mineral oil, intense research is conducted to define alternative liquids with comparable dielectric properties. Natural ester liquids are an alternative in focus; they are used increasingly as insulating liquid in distribution and power transformers. The main advantages of natural ester liquids compared to mineral oil are their good biodegradability and mainly high flash and fire points providing better fire safety. The dielectric strength of natural ester liquids is comparable to conventional mineral oil for homogeneous field arrangements. However, many studies showed a reduced dielectric strength for highly inhomogeneous field arrangements. This study investigates at which degree of inhomogeneity differences in breakdown voltage between the two insulating liquids occur. Investigations use lightning impulses with different electrode arrangements representing different field inhomogeneity factors and different gap distances. To ensure comparisons with existing transformer geometries, investigations are application-oriented using a transformer conductor model, which is compared to other studies. Results show significant differences in breakdown voltage from an inhomogeneity factor of 0.1 (highly inhomogeneous field) depending on the gap distance. Larger electrode gaps provide a larger inhomogeneity at which differences in breakdown voltages occur.
1. Introduction
Natural ester liquids (NE) are increasingly used as insulating liquids in distribution and power transformers. A reason for this is the environmental advantage in comparison to the traditionally used mineral oil (MO). Good biodegradability, generally high flash and fire points, low toxicity and their contribution to lower risks for humans and the environment has already been evaluated [1] for the natural ester liquid used in this contribution. The dielectric strength of insulating liquids is one of the main parameters relevant for power transformers. Several studies showed a comparable dielectric strength of the same used natural ester liquids compared to mineral oil under homogeneous and slightly inhomogeneous fields at lightning impulse (LI) [2,3,4] or with a different natural ester liquid [5].
Tests were performed with different polarities over a range of gap distances and electrode diameters. Other tests showed significantly lower dielectric strength of natural ester liquids at highly inhomogeneous fields using needle—plate arrangements under LI [6,7,8]. Differences in breakdown voltage occur due to differences in streamer propagation between (well-investigated) mineral oils [9,10,11,12] and natural ester liquids [13,14,15,16]. Differences increase by growing gap distances and by growing inhomogeneity factors. Insulating liquids used for the described tests are EnvirotempTM FR3TM (Minnetonka, MN, USA) fluid as natural ester liquid produced by Cargill, Inc. and Nytro Lyra X (Stockholm, Sweden) as mineral oil produced by Nynas Inc.
This study evaluates the breakdown voltages of arrangements with different electrode settings forming a large range of inhomogeneity factors. Its aim is to define those parameters at which differences in breakdown voltage and breakdown field strength emerge between different liquids.
To get closer to transformer geometry, a series of tests with a transformer conductor at defined gap distance and inhomogeneity were conducted to compare the results to the results of the initial study.
2. Measurement of Breakdown in Insulating Liquid
Two different setups were used. The used generator and measurement procedure are the same for all following investigations.
2.1. Lightning Impulse Generating and Measurement Setup
A 1 MV Marx generator was used for all tests. Its maximum rated energy is 30 kJ. A standard 1.2/50 µs lightning impulse was applied in all tests. Investigations with different inhomogeneity factors were performed at negative lightning impulse, investigations with the transformer conductor were conducted under positive lightning impulse in order to provide a complete, but feasible range of measurement results and to be able to compare to previous tests.
Inhomogeneity tests were performed with large (volume V = 16 L) and small (V = 1.6 L) measurement cells adapted to different voltage levels which limits the quantities of required insulating liquid. Transformer conductor tests were performed in a separate large steel tank (see Figure 1) with bushing (BIL 750 kV).
Different electrode and gap arrangements were tested. Some configurations were tested in both test cells to exclude possible influences of volume effects. The used steel electrodes were mainly manufactured at the institute. Needle electrodes were purchased. The specified tip radius of the steel needles was confirmed by scanning electron microscopy (SEM).
The electrode diameters used were 120 µm, 0.6 mm, 0.8 mm, 3 mm and 13 mm. Gap distances used were 10, 15, 25, 40 and 50 mm. Using larger gap distances than 50 mm would have resulted in breakdown voltages too high to handle (oil volume, electrode abrasion) for these investigations for all configurations but the needle. As the focus of our investigations was on degrees of inhomogeneity between the highly inhomogeneous needle configuration and slightly inhomogeneous sphere configuration and not on the extremes, investigated gap distances were limited to 50 mm. An overview of the test configurations used is given in Table 1.
Electrodes used for transformer conductor tests were made from copper and use the same dimensions as the conductor used in former tests at the institute to guarantee comparability. Conductors were not wrapped with paper; bare conductors were used. The design was changed in comparison to former tests to avoid the possibility of a breakdown from the ends of the conductor to the rounded ground plate. The minimal radius of curvature of the conductor used for these tests was 1 mm.
2.2. Procedure
Oil samples were prepared from dried, degassed and filtered samples. Relative moisture rH was set to values smaller than 12% for all liquids and tests. Moisture measurement and breakdown tests were performed at ambient temperature. Filtering cartridges with element size smaller than 5 µm were used. Ten breakdown tests per configuration and per insulating liquid are performed for the sphere, blunt point and needle tests. Waiting times before starting tests were much longer for natural ester liquid than for mineral oil and depend on the oil volume. Minimum waiting time for tests with the 1.6 L cell was five minutes for mineral oil and 15 min for natural ester liquid. Liquid was poured in carefully; nevertheless, minimum waiting time was 15 min for mineral oil and 30 min for natural ester liquid for the large 16 L test cell. Necessary waiting time was investigated in five-minute steps previously. Too short waiting time resulted in lower breakdown voltage and especially higher standard deviation. Previous tests were conducted to define the waiting time at which no considerable decreases in breakdown voltage and standard deviation could be noticed compared to the five-minute shorter waiting time. Waiting time for tests with the large steel tank was one day after complete change of liquid and two hours in between tests. Thirty breakdown tests were performed for each insulating liquid at this arrangement.
2.3. Electrode Conditioning
As surface defects are the dominant breakdown effect during LI stress [17], electrode surface effects need to be considered and tested before the actual investigation. Preliminary tests were conducted to define electrode replacement intervals and polishing intervals [18].
A preliminary test was performed to assure the usability of the chosen needle electrodes. Needles were electrically tested at different stress levels: No stress, one impulse, 10 impulses, 15 impulses, one breakdown and several breakdowns. Results and scanning electron microscope images can be found in [18]. ASTM D3300 standard with which mentioned investigations were performed suggests electrode polishing intervals of five breakdowns for sphere electrodes and immediate replacement of needle electrodes after one breakdown. These suggestions were considered, and intervals were determined for the electrode configurations of blunt points with radii smaller than sphere and larger than needle tip. Blunt points were manufactured and polished by the institute’s workshop.
The polishing of blunt points with small tip radii changes radii over time. Therefore, blunt points with 0.6 and 0.8 mm are polished only one time. After the second use they are replaced. Blunt points with larger radii could be polished several times. Corresponding polishing intervals can be found in [18].
Additionally, electrode conditioning is investigated. Blunt points are stressed with many breakdowns. In most cases, the first breakdown after polishing shows a significantly larger breakdown voltage than following impulses. Therefore, the first breakdown after polishing is not taken into account for statistics.
Preliminary tests were performed to determine the replacement intervals of the copper conductor and the influence of breakdown on the ground electrode (plane with rounded edges) for conductor tests.
2.4. Calculation of Inhomogeneity Degrees
In order to quantify the degree of inhomogeneity, the Schwaiger Factor η is used.
η = Emean/Emax
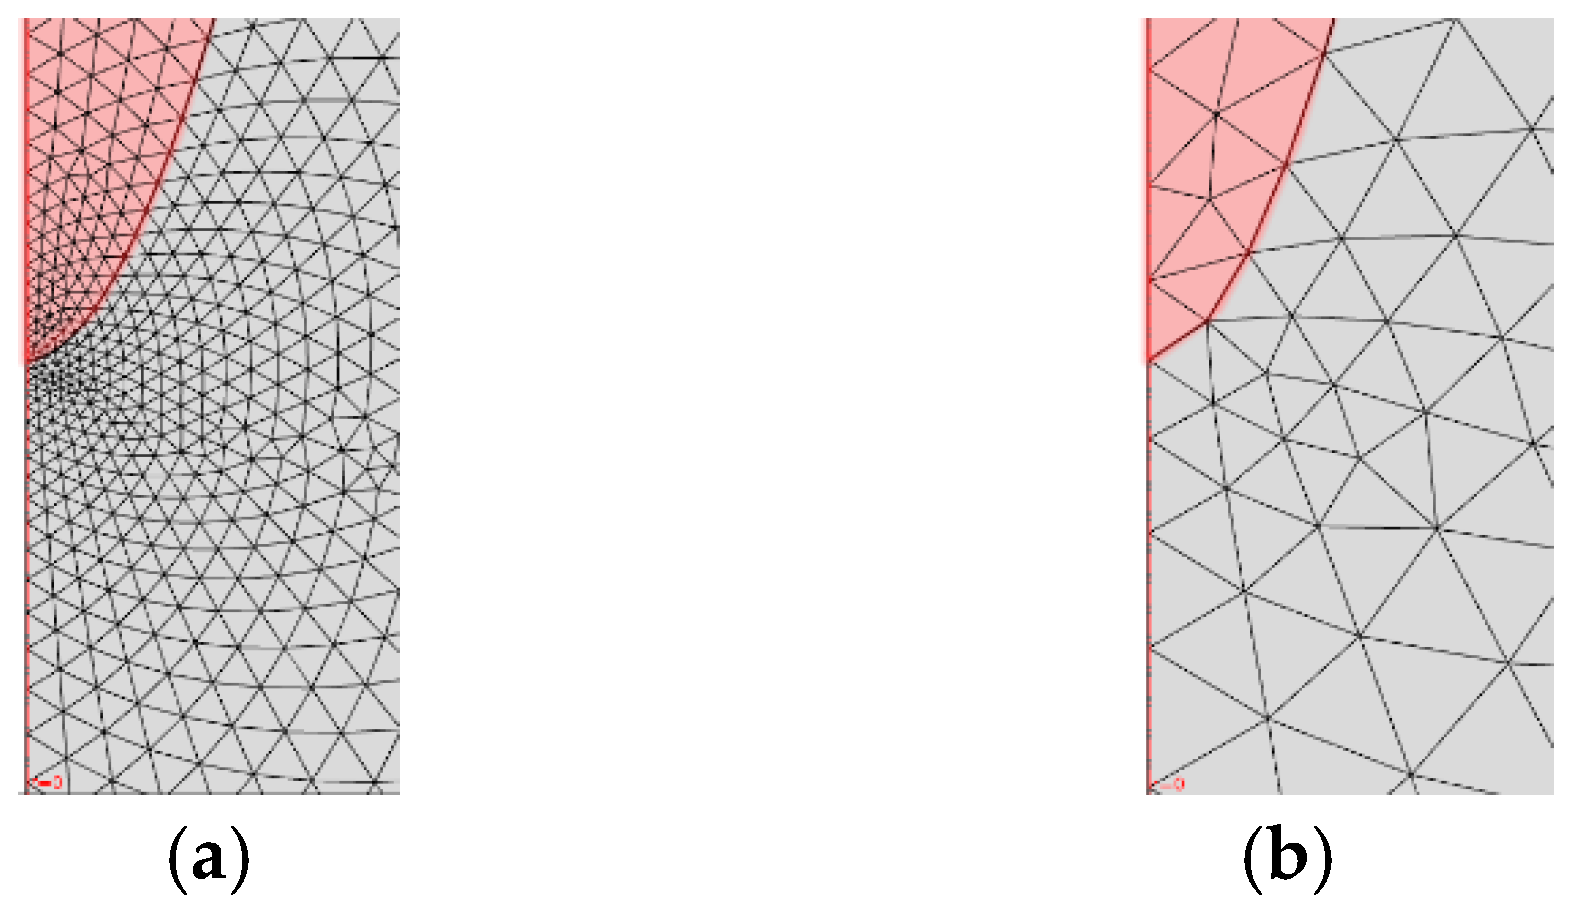
The Schwaiger Factor defines the relation between mean (Emean) and maximum (Emax) field strength and can be derived analytically from geometry factors for simple arrangements [4,19]. For arrangements that are more complex, computer-aided design (CAD) and numerical field simulation is necessary to calculate inhomogeneity factors. Field simulation is performed using a three-dimensional electrostatic model. Special care needs to be taken for meshing of needle arrangements (Figure 2). The maximum calculated field strength of a configuration depends on the selected mesh for the use of default physics-controlled mesh options. Element size needs to be reduced to the point where no dependency between varying element size and maximum field strength is given anymore.
Considered Schwaiger Factors (see Figure 3 range between highly inhomogeneous arrangements commonly made up with needle electrodes at high voltage potential and sphere or plate electrodes at ground potential and only slightly inhomogeneous arrangements like sphere-to-sphere. The aim is to represent a large range of inhomogeneities at the limits of radii used in transformer design. The field inhomogeneity η for transformer conductor tests is calculated to be η = 0.21.
3. Measurement Results
Breakdown voltages and breakdown field strengths are determined for all investigated configurations. First, breakdown behavior of fresh insulating liquids is determined.
3.1. Mean Breakdown Field Strength, Mean Breakdown Voltage and Withstand Voltage
Figure 4 shows mean breakdown voltage versus gap distance; Figure 3 shows mean breakdown field strength over the investigated range of inhomogeneity. Field strengths during an ongoing discharge can be a lot higher than the calculated ones due to space charges depending on the distance of the streamer tip from the electrode and the diameter of the streamer. This effect was investigated in [20,21,22,23,24,25].
Mean breakdown voltages are comparable between the two investigated liquids for small gap distances and slightly inhomogeneous electrode arrangements. Natural ester liquid shows significantly reduced mean breakdown voltages for highly inhomogeneous arrangements at large gaps (blunt points 0.6 mm, 0.8 mm and needle at gaps ≥25 mm).
Mean breakdown field strengths are plotted versus Schwaiger factors to show the influence of field inhomogeneity. They are small for highly inhomogeneous electrode arrangements (needle) compared to slightly inhomogeneous electrode arrangements (sphere). An explanation therefore is that highly inhomogeneous arrangements show high breakdown field strength next to the inhomogeneous needle tip, but comparably small field strength in the main volume. Homogeneous or slightly inhomogeneous arrangements show a more homogeneous distribution of the field strength over the whole arrangement showing smaller maximum values than the highly inhomogeneous arrangements, but larger mean values. Overall, mean breakdown field values are decreasing from small inhomogeneities to large inhomogeneities with a few exemptions for the small gap distance tests with 3 mm blunt point.
Mineral oil shows higher mean breakdown field strength than natural ester liquid for the configurations with highly inhomogeneous fields from an inhomogeneity factor η of η < 0.1. Differences between the two liquids increase towards larger gap distances and higher inhomogeneity.
The needle configurations at 40 mm and 50 mm gap distance show the largest differences between the two liquids: Natural ester liquid depicts 60% of the mean field of mineral oil at 50 mm gap distance. At inhomogeneities of 0.1 < η < 1, both insulating liquids show comparable mean breakdown field strengths for all electrode configurations and gap distances.
Regarding the mean breakdown voltages, the following effect can be observed: The larger the electrode gap and the larger the homogeneity of the field, the larger the resulting breakdown voltage. Natural ester liquids and mineral oils show comparable breakdown values for homogeneous and slightly inhomogeneous field strength values with η > 0.1. Mean breakdown voltages drop significantly for natural ester liquids for inhomogeneous arrangements. With larger gap distances, the differences between the breakdown voltages of natural ester liquids and mineral oil also increase in this area. The standard deviation is comparable for both insulating liquids for nearly all configurations. Configurations with low breakdown voltages generally show a low standard deviation. The more homogeneous the electrode arrangement, the higher the standard deviation. Breakdown data is fitted to normal and Weibull distribution. Normal distribution fitting is slightly better for the measured impulse breakdown data than Weibull distribution. Furthermore, 2% withstand voltages are calculated.
Slightly inhomogeneous configurations with higher standard deviation show lower withstand voltages than highly inhomogeneous arrangements with low standard deviation compared to the mean breakdown values. Figure 5 shows Weibull and normal distribution fitted to breakdown data for an exemplarily configuration.
3.2. Homogeneity Factor and Breakdown Voltage—Differences between Mineral Oil and Natural Ester Liquid
A Schwaiger Factor ηs = 0.1 can be determined as the degree of inhomogeneity required to see differences between the two liquids. Considering the entire available range of gap and electrode configurations by extrapolating the general interrelationships of the measured data, it is expected that for far larger gap distances than the tested ones, ηs is shifted towards larger values of η. For gap distances around 10 mm, ηs is shifted towards smaller values of η. The selected range of η for further testing is determined to be 0.03 < η < 0.3. Differences in breakdown behavior of natural ester liquids and mineral oils at highly inhomogeneous field condition are caused by different streamer propagation mechanisms. Easier propagation at high propagation modes leads to lower mean and withstand breakdown voltages. A possible explanation for this effect is the presence of polyaromatic molecules in mineral oil that do not appear in natural ester liquids [26].
3.3. Conductor Breakdown Test
A new test set-up is built to investigate breakdown voltages and breakdown field strengths of natural ester liquids compared to mineral oil in a set-up more suitable to electric field constellations occurring in a real transformer. The gap distance is set to 20 mm. Results are again fitted to normal and Weibull distribution to determine 1% withstand voltages. Results for all distributions are shown in Table 2 and Table 3.
Table 2 shows normal distribution fitted breakdown values with 50% breakdown and 1% withstand voltages for natural ester liquid and mineral oil. Natural ester liquids show 89% of the breakdown voltage of mineral oil for 50% mean values and 87% for 1% withstand voltages. The results for the Weibull distribution fitted data in Table 3 depict natural ester liquids holding 90% of the mean breakdown voltage values of mineral oil, and 90% for 1% withstand voltages. A comparison between the fittings of normal and Weibull distribution shows higher 50% breakdown voltages for Weibull distribution and higher 1% withstand voltages for normal distribution for both insulating liquids. A probability plot is given in Figure 6. Normal distribution fits slightly better than Weibull distribution to the measurement data for both insulating liquids.
The LogLikelihood method was used to determine the quality of each fit. The quality of the fits is comparable for both insulating liquids and distributions. Standard deviation of both insulating liquids is comparable and fulfills the standard requirements.
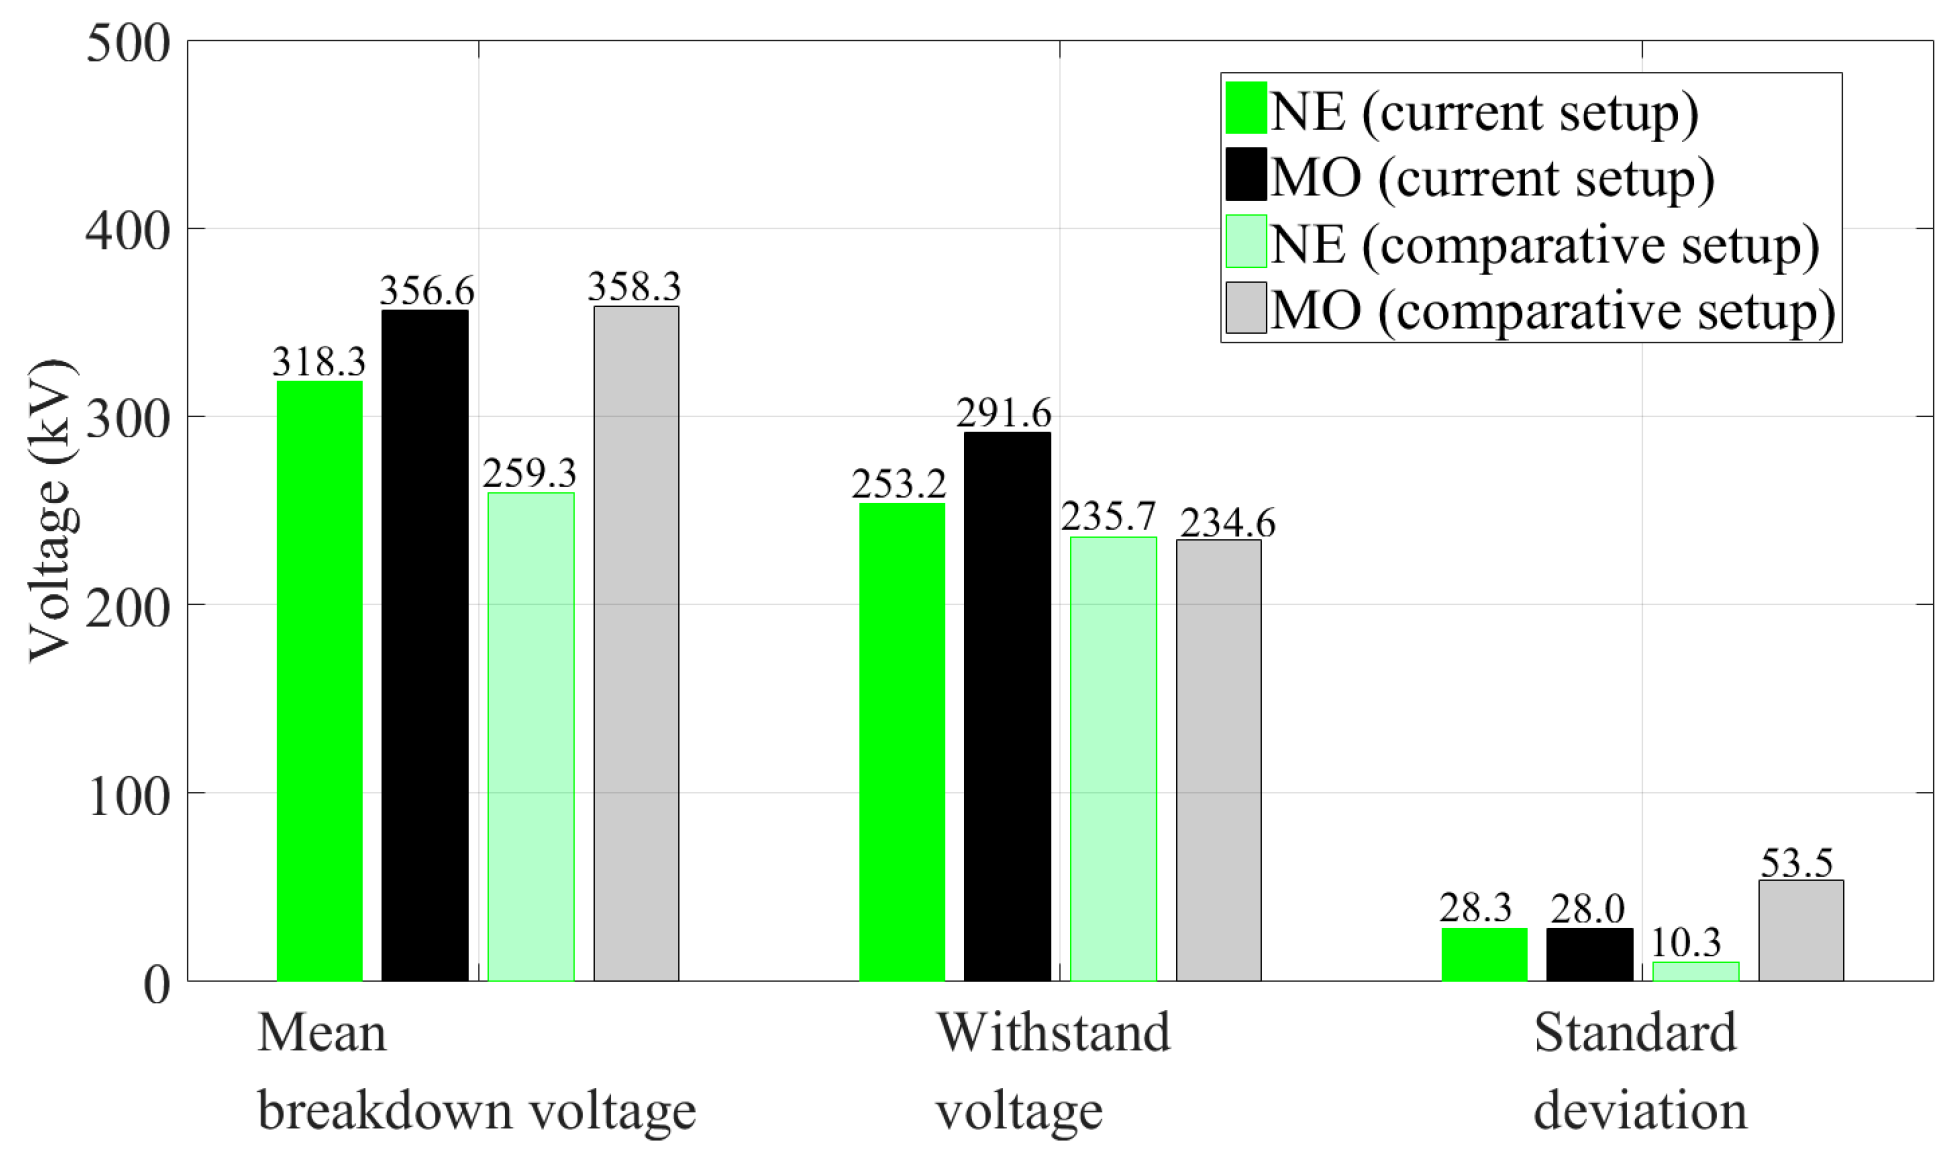
A comparison to other investigations with comparable electrode arrangement and comparable low relative moisture [2] is provided in Figure 7. The main difference between the two setups is a change in curvature of the ends of the transformer conductor. This change was performed to compare if the larger inhomogeneity represented by the exposed ends of the conductor in the former tests possibly influences the differences between natural ester liquid and mineral oil. The mentioned conductors are shown in Figure 1 and Figure 8.
The experiments described here show reduced differences in breakdown voltage between natural ester liquids and mineral oil. The mean breakdown voltage of natural ester liquids is higher than in a previous study, compared to the mineral oil being equal. Comparative tests showed a significantly higher standard deviation for mineral oil than for natural ester liquids. The withstand voltages of both liquids are therefore comparable. Current experiments show comparable standard deviations for both insulating liquids. As it was also observed for the mean values, natural ester liquids show slightly lower withstand voltages than mineral oil (87%). Because the knowledge of comparative experiments is only based on the information given in the published data, reasons for the differences can only be assumed.
Differences in electrode surface treatment, handling and conditioning of insulating liquids could cause differences in measurement results between different laboratories and different researchers. It is quite demanding to define a uniform proceeding for highly reproducible measurements because influencing factors mainly depend on many individual set-up factors. For example, the waiting time prior to breakdown tests in natural ester liquids needs to be significantly higher than that in mineral oil due to its higher viscosity. Waiting times for both liquids should be long enough that a longer waiting does not affect the result significantly. Tests showed that the required waiting time strongly depends on the used oil volume. It is small for small cell volumes and high for large test tanks. Therefore, some researchers provide detailed recommendations about their experience [3]. Abrasion of electrodes strongly depends on the breakdown energy. Abrasion is significantly higher for inhomogeneous arrangements using high breakdown voltages. Suitable electrode replacement intervals have to be assured for the highest test voltage used.
Previous studies about fluid treatment of natural ester liquid showed differences to the required treatment of mineral oils that need to be respected [27].
Experiments with large volumes of insulating liquids require oil replacement management. Replacing hundreds of liters of insulating liquid after one lightning impulse breakdown needs many liters of insulating liquid which is not always required. In order to define reasonable replacement intervals, preliminary tests with at least one oil volume stressed until mean breakdown voltage starts decreasing have to be conducted.
By comparing all measured data of both setups, it can be stated that both tests were conducted considering the same findings. Differing results should be caused by the change of the conductor shape.
3.4. Comparison of Different Setups and Explanation of Their Breakdown Results
Comparisons to further test arrangements and studies investigating natural ester liquids and mineral oils at inhomogeneous field arrangements under impulse voltages are drawn to support data interpretation. Performed test study can therefore be compared to a larger database. The following studies are compared to the two analyzed setups in this contribution: [3,4,5,8,28,29]. First comparisons are drawn on the different electrode arrangements selected. Self-provided simplified drawings of the arrangements used are shown (if available) in Figure 9.
Test arrangements can be separated into two different groups: Oil gap breakdowns with needle —plate or needle—sphere arrangements (i) and arrangements with transformer conductors (oil gap and creepage breakdowns). (ii) Breakdown voltage values and standard deviations of the compared liquids are compared for each individual group.
3.4.1. Needle Arrangement Group (i)
Group (i) consists of the arrangements of studies [5,8,29] and the present study. Liu et al. in [5] shows a comparable mean breakdown voltage for natural ester liquid and mineral oil at 25 mm oil gap under positive 1.2/50 µs impulse for needle—sphere and needle—plate arrangements. For negative impulse voltages, mineral oil shows significantly larger breakdown voltages than the natural ester liquid. Negative impulse arrangements are comparable to the present arrangements, results for needle—sphere arrangements also fit. Needle—sphere mean breakdown voltages are higher than needle—plate mean values and breakdown values under positive impulse are smaller than the ones under negative impulses (polarity effect). A comparison of breakdown voltages of the different studies is given in Figure 10.
The electrode and gap arrangement in [8] is similar to the one presented in [4], results are also comparable. The study in [29] is also conducted with a point—plane arrangement at positive and negative impulses, but under a step voltage of 0.5/1400 µs and at 50 mm and 100 mm gap distance. Therefore, results are not directly comparable to the previous studies. They show a comparable mean breakdown voltage for natural ester liquid and mineral oil for positive step impulse at 50 mm, but a significantly reduced mean breakdown voltage of natural ester liquid (73% of the mineral oil value) at 100 mm gap distance. For negative step impulse, mean breakdown voltage of natural ester liquid is reduced significantly for both gap distances (50 mm ≈ 63% of the one of mineral oil, 100 mm ≈ 80%).
All investigated studies for group (i) have some characteristics in common: The difference in mean breakdown voltage between natural ester liquid and mineral oil at highly inhomogeneous needle configurations is small or not significant for small gaps at positive impulses. The difference between the two liquids is high for negative impulses and large gaps and can reach a 50% reduced mean breakdown voltage. The standard deviation of breakdown data of group (i) is not available from all studies. No significant difference in standard deviation for highly inhomogeneous needle arrangements could be found in the present study. Study [29] shows a significantly higher standard deviation of mineral oil, but also significantly higher breakdown values for mineral oil.
3.4.2. Conductor Arrangement Group (ii)
Group (ii) represents the arrangements of the studies [2,3,4,5] and the present study. A comparison between [2] and the present study has already been performed in Section 3.3.
U-type conductor arrangements (see Figure 9) were initially used by [4]. This arrangement can be used for oil gap or creepage breakdown investigations. T. Prevost in [4] used the arrangements for creepage investigation. Therefore, results are not directly comparable to this study because the oil-pressboard interface, is different versus the oil volume. Both polarities are investigated under 1.2/50 µs with gap distances from 10–35 mm. The results of the mean breakdown voltages for negative polarity show comparable values of natural ester liquid and mineral oil for a 10 mm gap and a slightly reduced mean value for natural ester (95% of the one of mineral oil) for 20 mm and 35 mm. For positive polarity, the largest differences between the two liquids emerge at the smallest gap distance of 10 mm with natural ester liquid showing 90% of the mean breakdown voltages of mineral oil. The differences are not significant for larger gap distances. The standard deviation of both liquids is comparable overall; some tests show a higher standard deviation for mineral oil and some tests show a higher standard deviation for natural ester liquid in the same scale.
Liu et al. in [5] used an arrangement built on the suggestion in [4] (see Figure 9) and measured oil gap breakdown and creepage breakdown at positive polarities with 1.2/50 µs impulse at 35 mm gap distance. Oil gap tests show an insignificantly reduced mean value of natural ester liquid compared to mineral oil (96%); creepage tests showed a reduced overall breakdown level of the interface systems for both liquids and a slightly reduced mean breakdown voltage for mineral oil (88%) compared to the one of natural ester liquid. Not all creepage breakdowns occurred along the interface. Differences between results of [4,5] for positive polarity impulses with creepage arrangements at 35 mm gap distance could be due to different handling of the solid-liquid insulating system in this comparatively complex setup.
Investigations in [3] composed of two opposed transformer conductors at small (3 mm) to large (50 mm) gap distance to represent a coil-to-coil arrangement instead of one conductor and a ground plate electrode as used in the previous studies. Shielded ends were applied for large gaps to prevent alternative breakdown paths. The results show a slightly reduced mean breakdown voltage of mineral oil of about 89% of the one of natural ester liquid at small gap distances (3–5 mm) and comparable results for 8–12 mm gaps. Larger gaps show an increasing difference between the two liquids with reduced mean breakdown values for natural ester liquid comparable to former mentioned studies in this range of gap distance (and respective inhomogeneities). Natural ester liquids show 88% of the mean value of mineral oil at 25 mm and 84% at 50 mm.
A general comparison between different studies using transformer conductor at 1.2/50 µs impulse voltages in comparable ranges of inhomogeneity in oil gaps shows comparable breakdown values for small gaps (condition: gap distance <25 mm). Comparison shows mainly slightly reduced breakdown voltages of natural ester liquid of around 90% of the ones of mineral oil for larger gaps (between 25 and 50 mm). There are also a few studies showing a comparable breakdown voltage for the larger gap distances. The study in this contribution shows slightly reduced mean breakdown voltages of natural ester liquid (90%) compared to mineral oil at a gap distance of 20 mm at positive polarity. The overall comparison reveals the difficulties in finding a suitable conductor arrangement built up in a simple way to avoid handling differences coming up with complex arrangements but also to reach a single wanted point of breakdown in the geometry without breakdowns at unwanted points of the geometry. The setup in [3] with shielded ends seems to be an arrangement that fulfills both requirements.
4. Conclusions
Different studies show the same trends for comparison of natural ester liquid and mineral oil under impulse voltages in inhomogeneous field arrangements. The higher the inhomogeneity, the larger the difference between natural ester liquid and mineral oil with natural ester liquid showing a reduced mean breakdown voltage. Differences in mean breakdown voltages over inhomogeneity can be explained by different streamer propagation of the two liquids built up of different chemical compounds. The larger the inhomogeneity, the higher the influence of fast streamer events leading to breakdown at lower voltages in natural ester liquids. These events occur mainly in highly inhomogeneous field arrangements made up of needle constructions (η < 0.1). Less inhomogeneous arrangements with transformer conductor (0.1 < η < 0.5) show less significant differences in fast streamer propagation and therefore less differences between the two different liquids. Typical mean breakdown values of natural ester liquid in this range of inhomogeneity are 90% of the mineral oil values. Differences are small for small gaps (e.g., gap distance 10 mm) and increase with the gap distance.
Author Contributions
Investigation, S.H.; Writing—review and editing, F.V., S.T., K.J.R. and A.S.
Funding
This research was funded by Cargill Inc., grant number EH2015-57c.
Acknowledgments
The authors would like to thank Cargill Inc. team for supporting their work.
Conflicts of Interest
The authors declare no conflict of interest. The funding sponsors had a role in the decision to publish the results, but not in the design of the study; in the collection, analyses, or interpretation of data; in the writing of the manuscript.
References
- Pompili, M.; Calcara, L.; Sturchio, A.; Catanzaro, F. Natural esters distribution transformers: A solution for environmental and fire risk prevention. In Proceedings of the AEIT, Capri, Italy, 5–7 October 2016. [Google Scholar] [CrossRef]
- Vukovic, D.; Jovalekic, M.; Tenbohlen, S. Comparative Experimental Study of Dielectric Strength of Oil-cellulose Insulation for Mineral and Vegetable-based Oils. In Proceedings of the IEEE ISEI, San Juan, PR, USA, 10–13 June 2012; pp. 424–428. [Google Scholar] [CrossRef]
- Sbravati, A.; Rapp, K.J. Challenges for the application of Natural Ester fluids in extra high voltage transformers. In Proceedings of the CIGRE-AORC Technical Meeting 2016, New Delhi, India, 24–26 February 2016. [Google Scholar]
- Prevost, T. Dielectric properties of natural esters and their influence on transformer insulation system design and performance. In Proceedings of the IEEE PES T&D, Dallas, TX, USA, 21–24 May 2006. [Google Scholar] [CrossRef]
- Liu, R.; Törnkvist, C.; Chandramouli, V.; Girlanda, O.; Pettersson, L. Geometry impact on streamer propagation in transformer insulation liquids. In Proceedings of the Annual Report CEIDP, West Lafayette, IN, USA, 17–20 October 2010. [Google Scholar] [CrossRef]
- Liu, Q.; Wang, Z.D. Streamer characteristic and breakdown in synthetic and natural ester transformer liquids with pressboard interface under lightning impulse voltage. IEEE Trans. Dielectr. Electr. Insul. 2011, 18, 1908–1917. [Google Scholar] [CrossRef]
- Denat, A.; Lesaint, O.; McCluskey, F. Breakdown of liquids in long gaps: Influence of distance, impulse shape, liquid nature, and interpretation of measurements. IEEE Trans. Dielectr. Electr. Insul. 2015, 22, 2581–2591. [Google Scholar] [CrossRef]
- Liu, R.; Törnkvist, C.; Chandramouli, V.; Girlanda, O.; Pettersson, L. Ester fluids as alternative for mineral oil: The difference in streamer velocity and LI breakdown voltage. In Proceedings of the Annual Report CEIDP, Virginia Beach, VA, USA, 18–21 October 2009; pp. 543–548. [Google Scholar] [CrossRef]
- Hwang, J.G.; Zahn, M.; Pettersson, L. Mechanisms behind positive streamers and their distinct propagation modes in transformer oil. IEEE Trans. Dielectr. Electr. Insul. 2012, 19, 162–174. [Google Scholar] [CrossRef]
- Lesaint, O. Prebreakdown phenomena in liquids: Propagation “modes” and basic physical properties. J. Phys. D Appl. Phys. 2016. [Google Scholar] [CrossRef]
- Lesaint, O.; Top, T.V. Streamer initiation in mineral oil. Part I: Electrode surface effect under impulse voltage. IEEE Trans. Dielectr. Electr. Insul. 2002, 9, 84–91. [Google Scholar] [CrossRef]
- Rain, P.; Lesaint, O. Prebreakdown Phenomena in Mineral Oil under Step and Ac Voltage in Large-Gap Divergent Fields. IEEE Trans. Dielectr. Electr. Insul. 1994, 1, 692–701. [Google Scholar] [CrossRef]
- Rozga, P.; Stanek, M. Positive Streamer Propagation in Natural Ester and Mineral Oil under Lightning Impulse. In Proceedings of the ISH, Pilsen, Czech Republic, 23–28 August 2015. [Google Scholar]
- Rozga, P.; Stanek, M. Characteristics of streamers developing at inception voltage in small gaps of natural ester, synthetic ester and mineral oil under lightning impulse. IET Sci. Meas. Technol. 2016, 10, 50–57. [Google Scholar] [CrossRef]
- Rozga, P.; Stanek, M. Comparative analysis of lightning breakdown voltage of natural ester liquids of different viscosities supported by light emission measurement. IEEE Trans. Dielectr. Electr. Insul. 2017, 24, 991–999. [Google Scholar] [CrossRef]
- Lu, W.; Liu, Q. Effect of cellulose particles on impulse breakdown in ester transformer liquids in uniform electric fields. IEEE Trans. Dielectr. Electr. Insul. 2015, 22, 2554–2564. [Google Scholar] [CrossRef]
- Weber, K.H.; Endicott, H.S. Extremal Area Effect for Large Area Electrodes for the Electric Breakdown of Transformer Oil. Trans. Am. Inst. Electr. Eng. Part III Power Appar. Syst. 1957, 76, 1091–1096. [Google Scholar] [CrossRef]
- Haegele, S.; Tenbohlen, S.; Fritsche, R.; Rapp, K.J.; Sbravati, A. Characterization of inhomogeneous field breakdown in natural ester liquid compared to mineral oil. In Proceedings of the ICHVE, Chengdu, China, 19–22 September 2016. [Google Scholar] [CrossRef]
- Schwaiger, A. Elektrische Festigkeitslehre, 2nd ed.; Springer: Berlin/Heidelberg, Germany, 1925; pp. 450–451. [Google Scholar]
- Girdino, P.; Molfino, P.; Molinari, G. Effect of streamer shape and dimensions on local electric field conditions. IEEE Trans. Electr. Insul. 1988, 23, 4. [Google Scholar] [CrossRef]
- Yamashita, H.; Amano, H. Prebreakdown Phenomena in Hydrocarbon Liquids. IEEE Trans. Electr. Insul. 1988, 23, 403–408. [Google Scholar] [CrossRef]
- Forster, E.O. Critical Assessment of the Electrical Breakdown Process in Dielectric Fluids. IEEE Trans. Electr. Insul. 1985, 20, 891–896. [Google Scholar] [CrossRef]
- Chadband, W.G.; Sufian, T.M. Experimental Support for a Model of Positive Streamer Propagation in Liquid Insulation. IEEE Trans. Electr. Insul. 1985, 20, 239–246. [Google Scholar] [CrossRef]
- Hebner, R.E.; Kelley, E.F.; Forster, E.O.; FitzPatrick, G.J. Observations of Prebreakdown and Breakdown Phenomena in Liquid Hydrocarbons under Non-uniform Field Conditions. In Proceedings of the 1984 Eighth International Conference on Conduction and Breakdown in Dielectric Liquids, Pavia, Italy, 24–27 July 1984. [Google Scholar]
- Lewis, T.J. Electronic Processes in Dielectric Liquids under Incipient Breakdown Stress. IEEE Trans. Electr. Insul. 1985, 2, 123–132. [Google Scholar] [CrossRef]
- Duy, C.T.; Lesaint, O.; Denat, A.; Bonifaci, N. Streamer propagation and breakdown in natural ester at high voltage. IEEE Trans. Dielectr. Electr. Insul. 2009, 16, 1582–1594. [Google Scholar] [CrossRef]
- Sbravati, A.; Bingenheimer, D.; Rapp, K.J.; Gomes, J.C. Fluid treatment applied for natural esters based fluids: Evaluation of fluid reconditioning and reclaiming. In Proceedings of the CIGRE Study Committee A2, Shanghai, China, 21–25 September 2015. [Google Scholar]
- Rapp, K.J.; McShane, C.P.; Systems, C.P. Long Gap Breakdown of natural ester liquid. In Proceedings of the ICHVE 2010, New Orleans, LA, USA, 11–14 October 2010; pp. 104–107. [Google Scholar]
- Nguyen Ngoc, M.; Lesaint, O.; Bonifaci, N.; Denat, A.; Hassanzadeh, M. A comparison of breakdown properties of natural and synthetic esters at high voltage. In Proceedings of the Annual Report CEIDP, West Lafayatte, IN, USA, 17–20 October 2010. [Google Scholar] [CrossRef]
Figure 1.
(a) Steel test tank (V = 320 L) with bushing and (b) copper electrode for transformer conductor tests.
Figure 1.
(a) Steel test tank (V = 320 L) with bushing and (b) copper electrode for transformer conductor tests.
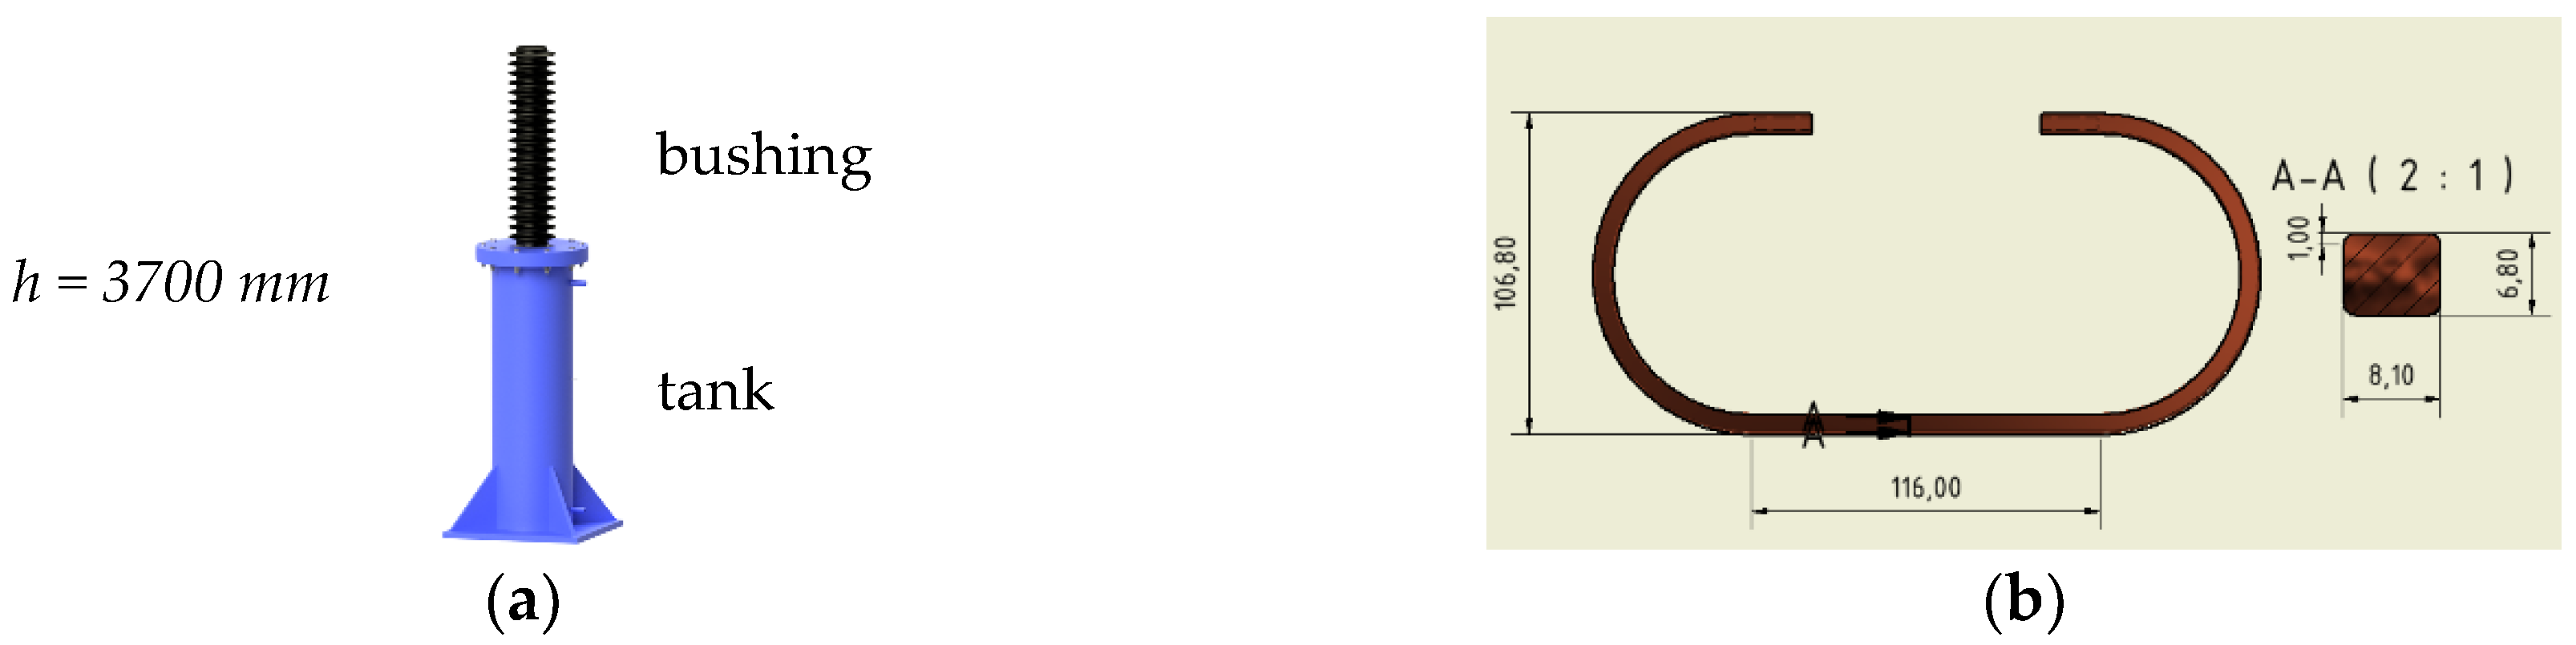
Figure 2.
Meshing of needle electrode in field simulation. (a) manually with finer mesh than the finest automatic meshing; (b) automatic with “extra fine” mesh.
Figure 2.
Meshing of needle electrode in field simulation. (a) manually with finer mesh than the finest automatic meshing; (b) automatic with “extra fine” mesh.

Figure 3.
Mean breakdown field strength over the range of investigated inhomogeneity at negative polarity for mineral oil and natural ester liquid.
Figure 3.
Mean breakdown field strength over the range of investigated inhomogeneity at negative polarity for mineral oil and natural ester liquid.

Figure 4.
Mean breakdown voltages versus gap distance at negative polarity for mineral oil and natural ester liquid.
Figure 4.
Mean breakdown voltages versus gap distance at negative polarity for mineral oil and natural ester liquid.

Figure 5.
Weibull and normal distribution for natural ester liquid and mineral oil at 10 mm gap distance fitted to the measured needle—sphere data at negative polarity.
Figure 5.
Weibull and normal distribution for natural ester liquid and mineral oil at 10 mm gap distance fitted to the measured needle—sphere data at negative polarity.
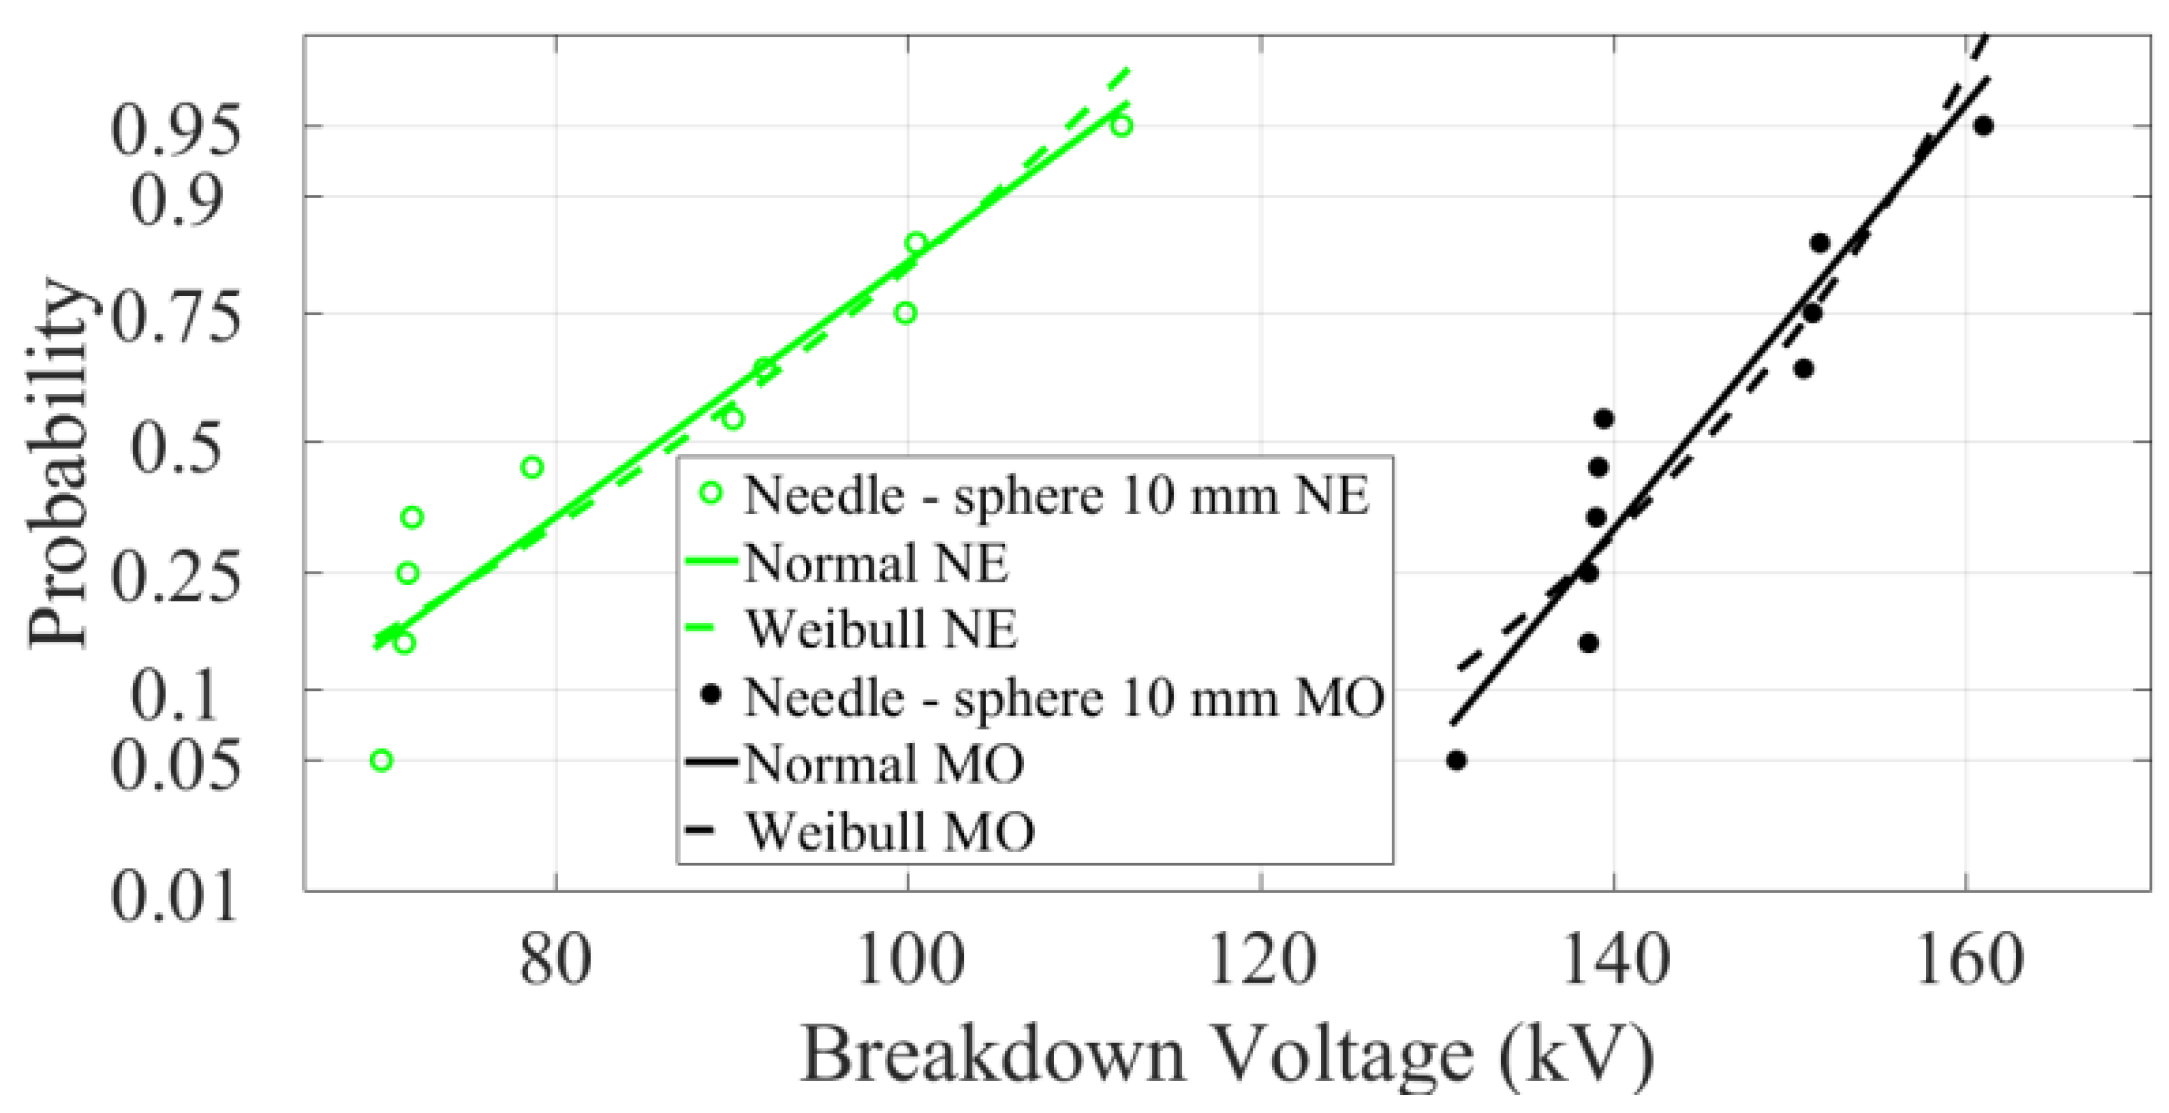
Figure 6.
Weibull and normal distribution for natural ester liquid and mineral oil fitted to the measured conductor data at a gap distance of 20 mm and positive polarity.
Figure 6.
Weibull and normal distribution for natural ester liquid and mineral oil fitted to the measured conductor data at a gap distance of 20 mm and positive polarity.

Figure 7.
Comparison with results from the former measurement setup in [2] with comparable gap arrangement at positive polarity.
Figure 7.
Comparison with results from the former measurement setup in [2] with comparable gap arrangement at positive polarity.

Figure 8.
Curvature of conductors used in comparative tests in [2].
Figure 8.
Curvature of conductors used in comparative tests in [2].

Figure 9.
Different test arrangements for impulse testing of natural ester liquid compared to mineral oil.
Figure 9.
Different test arrangements for impulse testing of natural ester liquid compared to mineral oil.
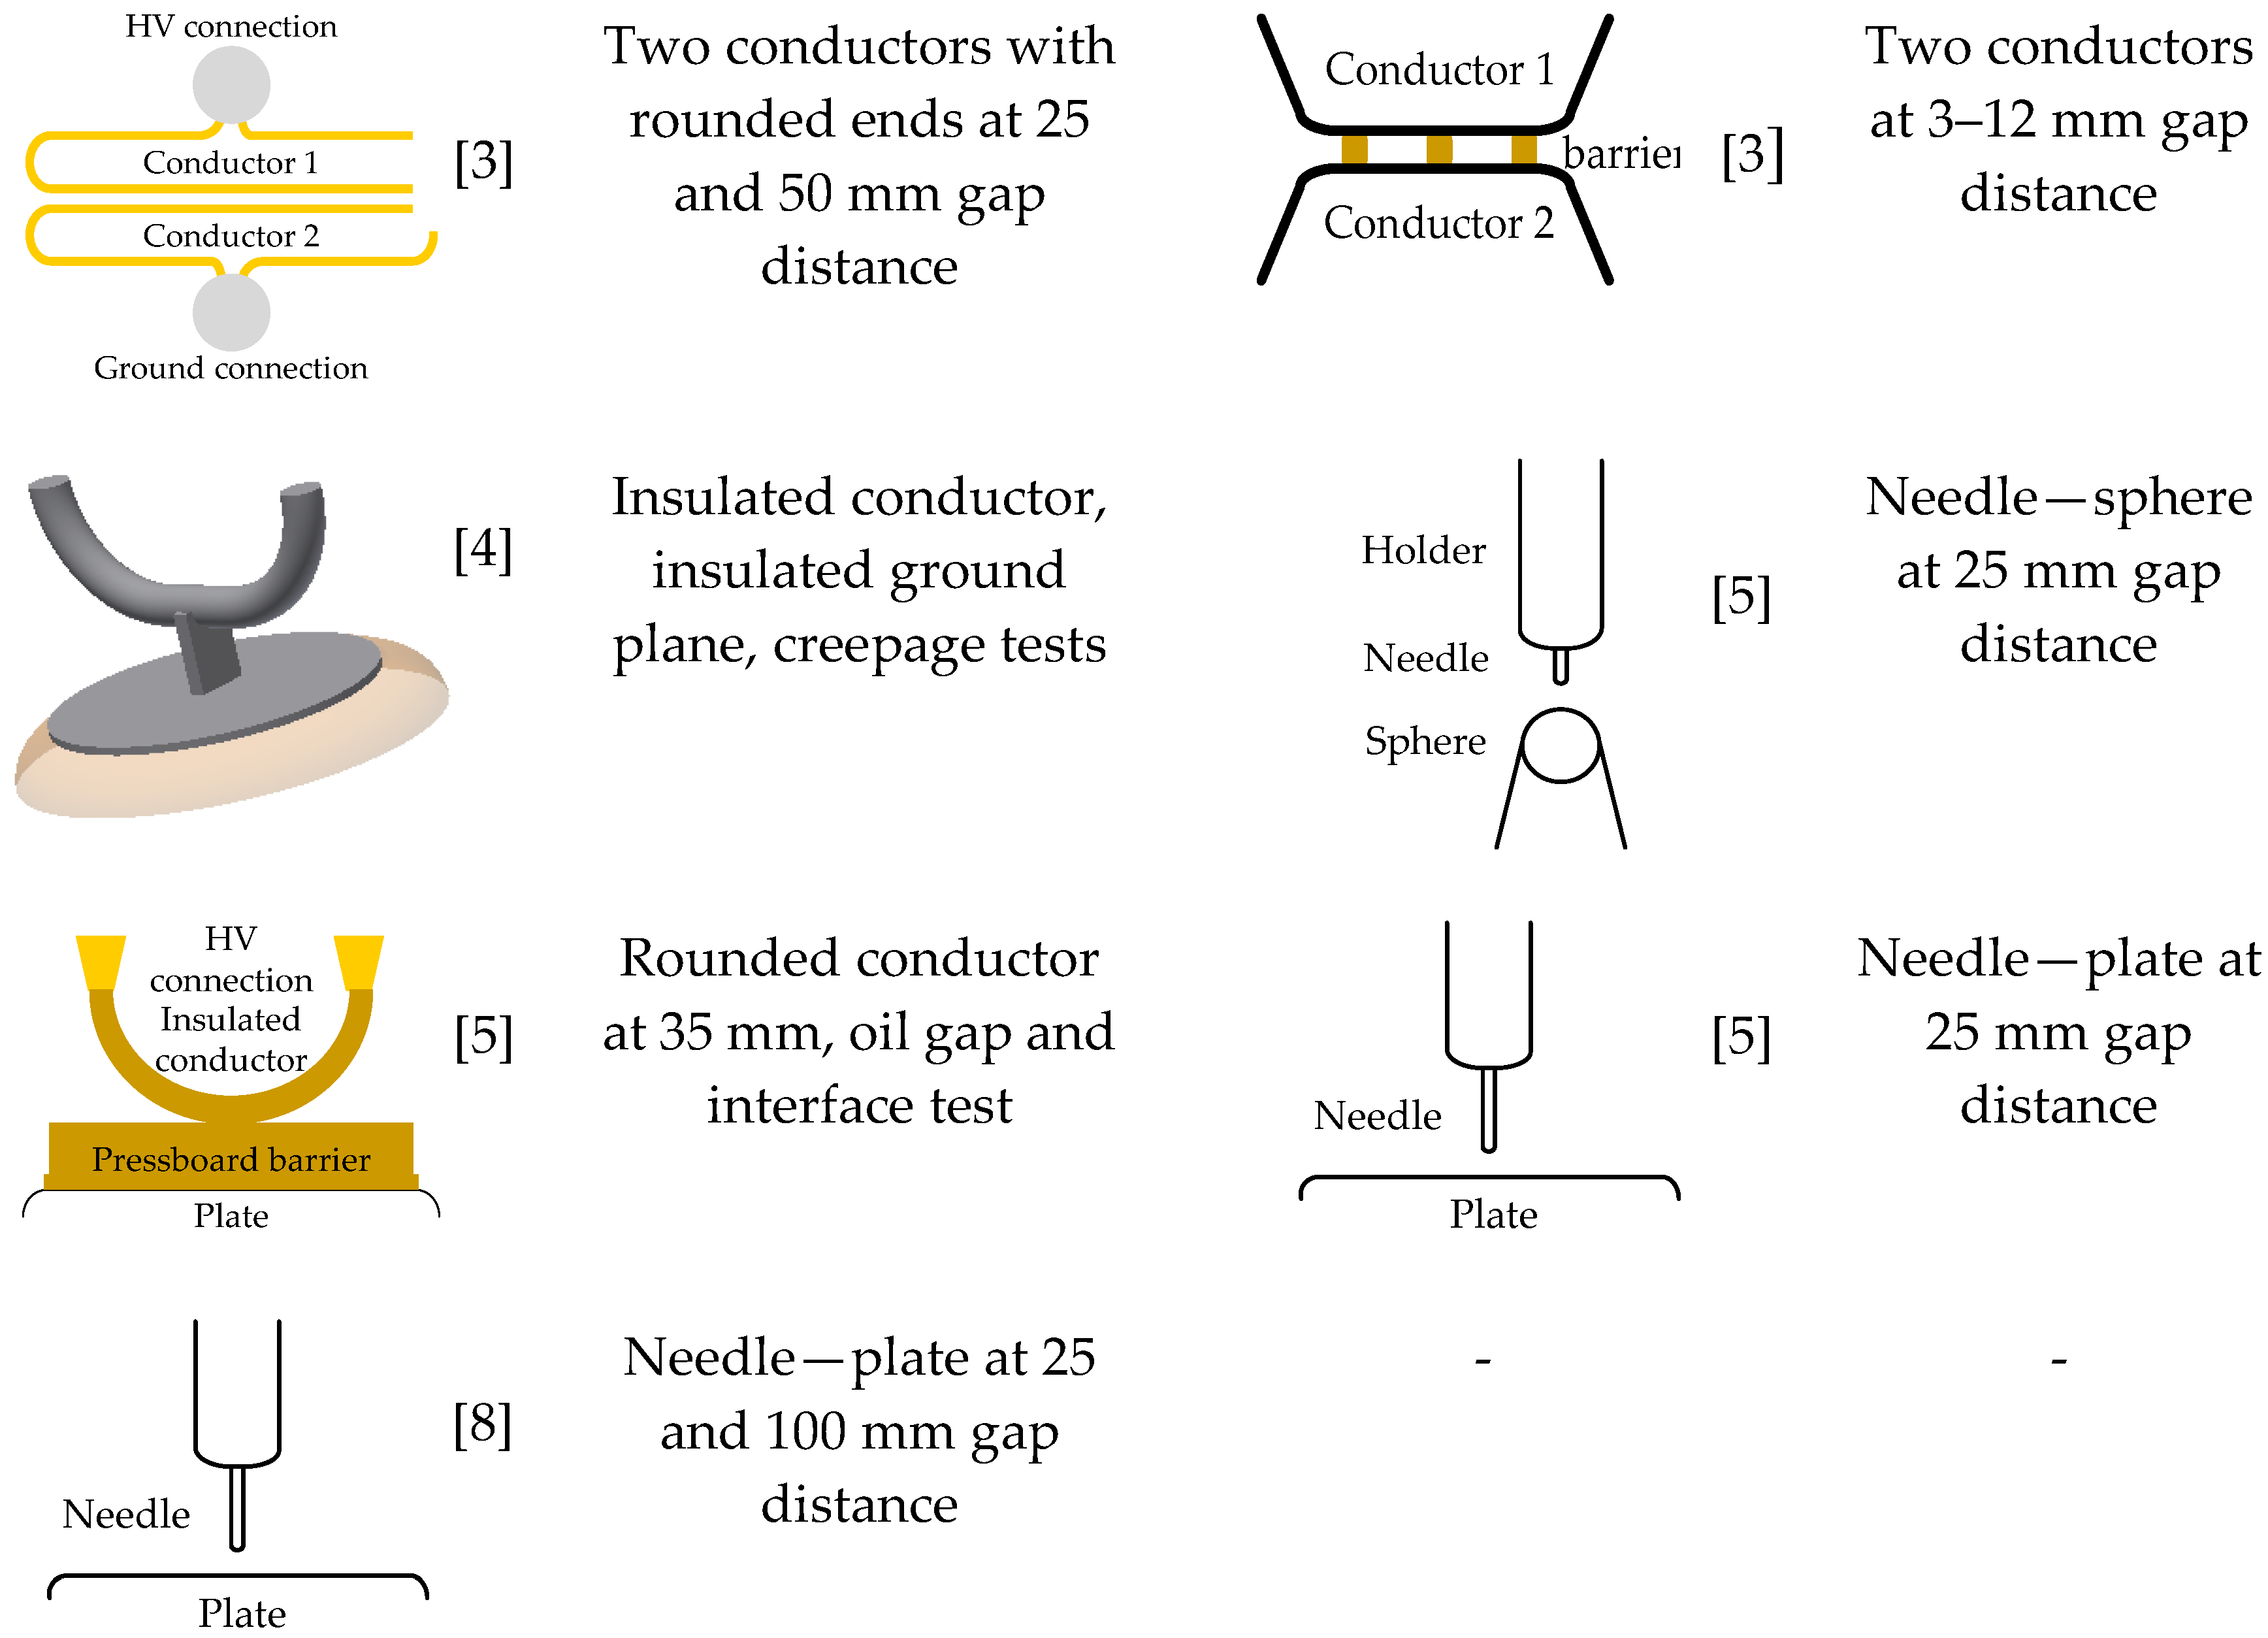
Figure 10.
Comparison: mean breakdown voltages of present investigation vs. data from study [5] for natural ester liquid and mineral oil.
Figure 10.
Comparison: mean breakdown voltages of present investigation vs. data from study [5] for natural ester liquid and mineral oil.


Table 1.
Configurations for inhomogeneity tests under lightning impulse (LI) at negative polarity.
| 10 mm | 15 mm | 25 mm | 40 mm | 50 mm |
|---|---|---|---|---|
| Sphere | Sphere | Sphere | - | - |
| Blunt point (Bp) 3 mm | Bp 3 mm | Bp 3 mm | - | - |
| Bp 0.8 mm | Bp 0.8 mm | Bp 0.8 mm | - | - |
| Bp 0.6 mm | Bp 0.6 mm | Bp 0.6 mm | - | - |
| Needle 120 µm | - | Needle 120 µm | Needle 120 µm | Needle 120 µm |
Table 2.
Breakdown results for conductor test at positive polarity, normal distribution fitting for mineral oil (MO) and natural ester liquid (NE).
Table 2.
Breakdown results for conductor test at positive polarity, normal distribution fitting for mineral oil (MO) and natural ester liquid (NE).
| Liquid | Normal Distribution | ||
|---|---|---|---|
| Ud,1% (kV) | Ud,50% (kV) | σ | |
| MO | 291.6 | 356.6 | 28.0 |
| NE | 252.3 | 318.3 | 28.3 |
Table 3.
Breakdown results for conductor test at positive polarity, Weibull distribution fitting.
| Liquid | Weibull Distribution | |||
|---|---|---|---|---|
| Ud,1% (kV) | Ud,50% (kV) | α | β | |
| MO | 248.3 | 358.5 | 370.1 | 11.5 |
| NE | 222.8 | 321.2 | 331.5 | 11.6 |
© 2018 by the authors. Licensee MDPI, Basel, Switzerland. This article is an open access article distributed under the terms and conditions of the Creative Commons Attribution (CC BY) license (http://creativecommons.org/licenses/by/4.0/).
Share and Cite
MDPI and ACS Style
Haegele, S.; Vahidi, F.; Tenbohlen, S.; Rapp, K.J.; Sbravati, A. Lightning Impulse Withstand of Natural Ester Liquid. Energies 2018, 11, 1964. https://doi.org/10.3390/en11081964
AMA Style
Haegele S, Vahidi F, Tenbohlen S, Rapp KJ, Sbravati A. Lightning Impulse Withstand of Natural Ester Liquid. Energies. 2018; 11(8):1964. https://doi.org/10.3390/en11081964
Chicago/Turabian StyleHaegele, Stephanie, Farzaneh Vahidi, Stefan Tenbohlen, Kevin J. Rapp, and Alan Sbravati. 2018. "Lightning Impulse Withstand of Natural Ester Liquid" Energies 11, no. 8: 1964. https://doi.org/10.3390/en11081964
Note that from the first issue of 2016, this journal uses article numbers instead of page numbers. See further details here.