An Overview of Existing Experiences with Solar-Powered E-Bikes


Faculty of Engineering Technology, Department of Design, Production and Management, University of Twente, Enschede 7500 AE, The Netherlands
*
Author to whom correspondence should be addressed.
Energies 2018, 11(8), 2129; https://doi.org/10.3390/en11082129
Submission received: 1 July 2018
/
Revised: 18 July 2018
/
Accepted: 2 August 2018
/
Published: 15 August 2018
(This article belongs to the Special Issue Solar Energy Harvesting, Storage and Utilization)
Abstract
:Electric bicycles (e-bikes) are considered a sustainable alternative to automobile transportation today. The electric bike includes all the benefits that conventional bicycles offer, plus faster, more comfortable and longer trips, as well as less effort for the user. In this paper, we specifically focus on a new type of e-bike, the so-called ‘solar-powered e-bike’. Therefore, this review paper explores existing literature findings for the use of solar energy in transportation, and more specifically in e-bikes. This paper aims to capture the status of and experiences with the use of e-bikes; more specifically, with solar-powered e-bikes. It presents research conducted so far on e-bikes and solar-powered e-bikes, as well as the main technical features of the solar e-bike. Finally, it analyzes a sample of e-bikes’ and solar-powered e-bikes’ users, based on Dutch National Travel Survey data and an experimental field study conducted in 2017. Data showed that the main target group of (solar) e-bikes are commuters in the age group between 40 and 60 years old, commuting distances longer than 6 km, with a gross income higher than €2500. Solar-powered e-bikes are concluded to have potential as a sustainable way of transportation in urban areas and cities, potentially replacing the conventional means of transport.
Keywords:
e-bikes; solar powered; photovoltaic; sustainable; mobility; transportation mode; commuting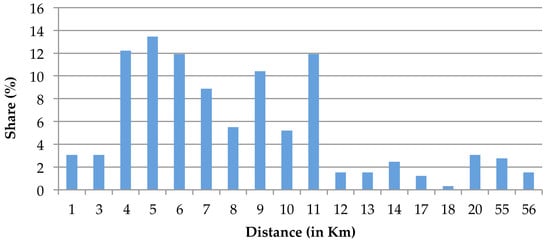
1. Introduction
One of the largest sources of air pollution in urban areas is transportation [1,2]. Air pollutants have numerous impacts on human health, the climate, ecosystems, and the built environment [1]. European and worldwide authorities support emission-free mobility and consider it necessary for the development of their national sustainable strategies [3]. Since 2000, governments have been promoting bicycles as an alternative mode of transportation to replace private cars [4], especially in urban areas where the terrain and the road network allow it. Bicycles could contribute to the reduction of air pollution, traffic congestion, noise emission, and energy consumption, allowing at the same time a healthier lifestyle for users [5]. In addition to this, the bicycle constitutes one of the most accessible and cheapest transportation modes (e.g., there is no extra cost for taxes, no driving license, parking costs or high service maintenance costs, as in the case of cars). Many cities have promoted cycling, especially by implementing bike-sharing programs for public use [6,7,8].
An alternative of the conventional bicycle is the electric bicycle (e-bike). The term electrical bike or ‘e-bike’ refers to all two-wheeled electric vehicles (EVs), more specifically to bicycles, with different levels of assistance to the user. A small electric motor and a rechargeable battery are used to assist the power that is provided by the rider. The battery can provide energy for high acceleration under hard biking conditions, such as climbing inclines and overcoming wind resistance, thus extending the range of the trip. Other definitions given to the e-bikes include pedaled electric cycles—or pedelecs—and electric power-assisted cycles—or EPAC. Some high-powered e-bikes resemble scooters. The definition of the e-bike requires that the rider can pedal the e-bike. This is a characteristic that distinguishes e-bikes from e-scooters. A typical e-bike can travel up to 25 km/h, depending on the country’s regulations, with motor power up to 250 Watts, a battery of 24 V, 36 V or 48 V, and capacity between 8.8 Ah to 15 Ah [9,10,11]. However, there can be variations with regard to the e-bikes’ speed. In The Netherlands, for instance, there are high-speed pedal-assisted speed pedelecs [9,10,11,12] that can travel up to 45 km/h, but this e-bike is treated as a conventional moped, and is not allowed on dedicated bike lanes (in January 2017, the Dutch government changed Dutch traffic law and defined the speed-pedelec as a moped. As a result, the driver needs to have moped driver license and wear a helmet. The vehicle is required to have a moped license plate (and insurance) and a rearview mirror. Also, speed-pedelecs are not allowed on dedicated bicycle lanes). The speed limit for e-bikes could be different for each country, based on the country’s legislation and regulations [9,10,11,12]. However, in this paper, legislation will not be further investigated as a topic, due to our lack of expertise and the lack of laws and regulations at present.
The first commercial e-bikes were available in Japan in 1980s [13,14], but they only started being massively marketed in the early 2000s, when the improved battery and motor technology simplified the manufacture and assembling of the e-bikes, hence allowing component modularity and reduced cost. In 2016, the bicycle sales in Europe reached around 19 million units, while in the same year, e-bike sales reached 1.6 million units, of which 36% were in Germany, 16% in The Netherlands, 10% in Belgium and 8% in France, followed by other European countries, with lower shares [15]. In 2016, 35 million units of e-bikes were sold worldwide, and in 2023, global sales of e-bikes are forecast to reach 40.3 million units [15,16]. Today, e-bikes are considered one of the most promising sustainable alternatives to automobile transportation and represent one of the fastest growing transport market segments. Statistics show that they are becoming more and more popular, and it is therefore important for them to be further investigated [15,16]. At the moment, China and Japan are the most important markets for e-bikes, and they are also the largest manufacturers and exporters worldwide [16]. Europe is emerging as a relevant market, with Germany, The Netherlands, Switzerland and Denmark leading the production and sales of e-bikes [16,17]. The primary use of the e-bike includes urban transportation, by replacing or complementing the use of conventional motorized transport options such as cars or buses, representing a valid option for short travel distances and traffic hours. E-bikes include all the benefits that conventional bicycles offer, while they also represent an attractive alternative to recreational activities, increasing trips’ ranges, offering faster and more comfortable trips, and diminishing the physical effort of the users.
The introduction of the e-bike could be effective, aiming to reduce the usage of cars [18]. Additionally, the e-bike resolves many of the reasons people give for not cycling (e.g., distance, hills, physical strenuousness) and offers many of the same benefits as the car (e.g., range, flexibility, rush-hour speed) [19]. In recent years, e-bikes have been becoming a very popular transportation means in The Netherlands, especially among the elderly and commuters. More specifically, the share of e-bikes in bike sales has rapidly grown from 12% in 2009 to over 28% in 2015 [20,21]. At the moment, there are around 2 million e-bikes in The Netherlands [22,23], compared to around 23 million regular bikes [22,24,25].
A recent innovation is the development of the solar e-bike. Solar e-bikes are electric bikes with integrated photovoltaic (PV) solar cells on their wheels or other parts of the e-bikes’ skeleton, which can charge their batteries when parked and during trips. Additionally, there are also solar-charged e-bikes, the batteries of which are charged by a charging system, which is powered by photovoltaic (PV) solar modules. Solar-charged e-bikes are connected to solar-powered charging stations to charge their batteries when parked. Adhisuwignjo (2017) states that the use of solar power for e-bike charging could be decisive for the improvement of the forthcoming bike-sharing systems [6]. In this respect, the term ‘solar-powered e-bikes’ covers both types of e-bikes, mainly the solar-charged e-bikes and e-bikes that contain integrated PV cells—also called solar e-bikes.
Since the solar e-bike is a type of e-bike, it might be interesting to consider the differences between commuters who use e-bikes and commuters who use conventional bikes, in order to investigate the solar e-bike’s target group. This paper comprises an overview of the solar-powered e-bike as a sustainable transportation mode. Section 2 presents a classification of e-bikes. Subsequently, in Section 3, a literature review on e-bikes and solar e-bikes is presented; in Section 3.1 a collection of studies on e-bikes and solar e-bikes, while in Section 3.2 the status of solar energy in transportation is discussed. In Section 4, the choice of the bicycle as a transportation mode is addressed, based on literature data, and in Section 5, data from two studies on e-bikes and solar e-bikes are presented: a survey conducted in The Netherlands by ‘Research on Mobility in The Netherlands’ (Onderzoek Verplaatsingen in Nederland (OViN)) [26,27,28,29,30,31], and a survey conducted by University of Twente (UT) and Eindhoven University of Technology (TU/e), in which 79 employees participated in a test with the solar e-bike, aiming to investigate the e-bike’s target group and users’ notions about the solar e-bike as a sustainable transportation mode. Additionally, in Section 5, some financial aspects of bikes are also addressed, such as a comparative cost analysis of the various bike options. The review paper concludes in Section 6 with the conclusions and discussion.
2. A Classification of E-Bikes
The term e-bike generally refers to all two-wheel vehicles with a small electric motor attached. It has been applied both to scooters and mopeds, creating confusion among people due to the wide variety of e-bikes available. The main characteristics of the e-bikes can be generalized as follows:
- The motor power ranges from 200 Watts to 4000 Watts.
- E-bike weight ranges from 20 kg to 45 kg.
- Travel distance ranges as high as 150 km.
- Speed is generally less than 45 km/h.
Due to the confusion that was mentioned above, electric bikes are divided into two categories according to the characteristics they present: bicycle-style electric bikes (BSEB) and speed pedelecs. The main features of each type are summarized in Table 1.
The principal characteristic of bicycle-style electric bikes is that human pedaling propels them. However, an electric motor is also included to assist the ride. BSEB (bicycle-style electric bikes) are classified as having a motor power below 750 Watts and speed slower than 30 km/h. These bikes have pedals to propel them with or without the help of the electric motor. They can be divided into powered bicycles (PB); and power-assisted bicycles (PAB), also known as electric assisted bicycles (EAB) or pedelecs, which activate the motor only when the user pedals the wheels. Pedelecs also include an electronic controller that stops the motor support when the rider is not pedaling or the bike reaches a programmed speed [11,12,32].
Speed pedelecs include scooters, mopeds and even motorcycles with an electrical motor attached, and they have a higher capacity concerning speed and motor power, the primary function of which is to provide all the needed power for transport. Although electric mopeds and motorcycles may have pedals, they are used more as a platform on which the user can rest his/her feet, rather than as a functional necessity for pedaling or providing power. Electric mopeds present semi-functional pedals. Speed pedelecs offer powerful motors—up to 3000 Watts—and can reach speeds up to 45 km/h [11,12,32].
This research study on e-bikes focuses only on pedelec BSEBs. Pedelecs are the cheapest and simplest EVs available on the market. They are used by young and older users, different social-economical segments of the population, and for different purposes, ranging from purely recreational to commuting purposes. In the Dutch market, the main characteristics of pedelecs are [21]:
- Mainly powered by pedaling.
- Speed up to 25 km/h.
- Motor power up to 250 Watts.
- Electrical motor assists only pedaling in hard biking conditions.
3. Literature Review on E-Bikes and Solar-Powered E-Bikes
3.1. E-Bike Studies
Research on e-bikes is adapted based on social-geographical motivations and according to the experiences in those societies. Research mainly emphasizes self-reported beliefs or estimations and information collected from the users. The analyses in Asian countries, mainly China, focus further on safety, market growth and operations among a large volume of e-bikes [33]. Western European studies investigate the impact of e-bikes on human health [34] and the environment (e.g., studies in European countries). Additionally, there are studies that focus on the impact of e-bikes on emerging markets and the behavior of this new market [14] (e.g., studies conducted in North-America).
Nevertheless, research with survey data is not typical. In Table 2, recently conducted field studies on e-bikes [35,36,37], mostly in Europe and in the United States, are presented. Most of those analyses focus on the use of the e-bike by users and on the trips’ safety conditions. The duration of the studies ranges from two weeks to four years (see Table 2). The typical sample of bikes ranges from just 12 users up to several hundred users. This could be considered a very small number of statistics compared to the millions of e-bike users worldwide. As such, a lot of research might be needed to cover this new field of interest.
Gorenflo et al. (2017) [35], Kiefer and Behrendt (2016) [38], Fyhri and Fearnley (2015) [19], Fluchter and Wortmann (2014) [39], as well as Paefgen and Michahelles (2010) [40], focused, for instance, on usage patterns. Gorenflo et al. (2017) conducted a 3-year field trial with 33 sensor-equipped e-bikes [35]. The so-called WeBike field trial analyzed the usage of the e-bike and the charging status of its battery [35,41]. Results show that e-bikes are mainly used for commuting. Regarding users’ charging habits, results showed that participants usually charge their e-bike’s batteries just after they return home. It was also noticed that some participants chose to charge their e-bike’s batteries later in the evening, just before they go to bed. Moreover, measurements showed that some participants charge their e-bikes while they are at work. Gorenflo et al. (2017) found that the students that participated in this field trial usually let their e-bike’s batteries to get totally empty and charged them when the battery status was around 15–45%, while university staff members usually charged their batteries when they were above 70% [35]. Kiefer and Behrendt (2016) used GPS and motor assistance level data [38]. Fyhri and Fearnley (2015) analyzed odometer data collected by the e-bikes [19]. The odometer is an electronic or mechanical device that measures the distance travelled by a car or bike. They concluded that participants who used the e-bikes made longer and more frequent trips than those who used the regular bicycles [19]. Fluchter and Wortmann (2014) investigated users’ expectations, privacy issues and the technological shortcomings in GPS technologies [39]. Paefgen and Michahelles (2010) also used GPS coordinates for the demonstration of the average and maximum velocities, accelerations, traveled distance and routes [40].
MacArthur et al. (2014) focused on a survey analysis based on participants’ answers regarding their e-bike usage in order to find obstructions in bicycling [31]. Results show that the e-bike encourages users to bike more frequently and make longer trips. Dozza et al. (2016) studied e-cyclist behavior and safety issues with e-bikes during trips [42]. The main conclusion of this study was that e-bikes are faster than regular bikes and, consequently, new safety issues might arise during the interaction of the e-bikes with other vehicles on the road. Haustein and Moller (2016) also investigated the e-bike’s safety and its involvement in safety critical incidents in Denmark [43]. They conclude that user’s attitude, age, sex, education level, e-bike excitement, excitement about speed, riding style and experience on the e-bike, are factors closely related to perceived safety and incident immersion. Furthermore, Langford et al. (2015) investigated e-bikes’ safety using GPS data from regular bikes and e-bikes and concluded that e-bikes are driven faster on city streets, namely, over 13.3 km/h, but not on other shared-use routes [44]. Schleinitz et al. (2017) focused on the speed of e-bikes compared to regular bikes [45]. As in the previously mentioned study, this study shows that cyclists especially under 40 years old ride their e-bikes faster.
Gebhard et al. (2016) presented a study on e-bikes, in which the battery parameters and the GPS coordinates were measured for the investigation of users’ travel patterns [46]. The results of his study show the range of the trip, the distance traveled per participant, the state of charge (SoC) of the battery, and its relation with the users’ charging habits [46]. Behrendt (2017) investigated e-velomobility, based on a field trial with e-bikes conducted in the UK [47]. Kroesen (2017) addressed the question of whether e-bikes can substitute travel by other transportation modes, and to what extent, using data from OViN (Onderzoek Verplaatsingen in Nederland), in The Netherlands [48]. He concluded that e-bike ownership can mainly replace the conventional bikes in The Netherlands, followed by the car or other transportation modes.
Wolf and Seebauer (2014) studied the e-bikes’ technology adoption, exploring the use of the e-bike in different contexts: work, leisure, and shopping [49]. The results of their analysis show that most early adopters are aged above 60 years, and they mainly use the e-bike for leisure trips. Motivations to use the e-bike depend on the user’s age. Seebauer (2015) investigated e-bike and e-scooter early adopters by conducting a survey among users of these two electrical vehicles in Austria and described early adopters’ motivations to promote these two transportation modes to their peers [50].
Plazier et al. (2017) focused on the use of the e-bike by the young population by investigating a group of students at a Dutch university [51]. For the data collection, a survey and interviews with some of the participants were used. Results show that the young population finds the e-bike a good alternative for daily transportation and expresses a likelihood of buying one in the future. It is possible to use e-bikes as a substitute to public transportation. However, their high cost seems to be a deterrent factor to replace other means of transportation. Harms et al. (2014) explored variations in cycling patterns in The Netherlands, using data from the National Travel Survey (NTS) of Central Bureau of Statistics in The Netherlands (CBS) based on a survey on the mobility behavior of the Dutch population [52,53]. Results show that the number of e-bike users has increased, as do the per capita distances. Jones et al. (2016) investigated the motives, perceptions and experiences that lead users to buy an e-bike [54]. His analysis is based on interviews with e-bike owners in The Netherlands and the UK. Results show that the main motivation users have for purchasing an e-bike is the opportunity offered by the e-bike for longer and more complicated trips (typically longer than 10 km), faster and with less effort than using a regular bike [54].
Schleinitz et al. (2017) investigated the road safety of e-bikes, because of their higher speed levels compared to conventional bicycles [45]. Mishra (2016) studied the design and the development of a solar hybrid bicycle for use in India as an alternative to fueled automobile transportation [55]. Mesentean (2010) studied two different approaches for PV smart charging stations using e-scooters [37]. The results of his study show the impact on CO2 emission reduction and how these charging systems interact with the electric grid when the PV generated energy is not enough to fulfill the EVs’ requirements. Fuentes et al. (2017) analyzed an e-bike sharing system that was powered exclusively by solar energy, concluding that the design of such a system is quite feasible as an improvement of the public transport and as a solution of the last-mile problem [56]. Moreover, the solar-powered e-bike sharing system includes zero CO2 emissions and allows the reduction of the GHG emissions in urban areas. Adhisuwignjo et al. (2017) developed a solar powered battery charging system for an e-bike, using a fuzzy logic algorithm for the design and testing of the controller system. Results showed that the specific algorithm that was designed could be used as a controller for the battery charging of the solar e-bike [6].
Apostolou et al. (2018) studied the technical features and performance of solar-powered e-bikes, as well as various factors that affect users’ satisfaction and their choices of a specific transportation mode [57]. Results of a field study executed in The Netherlands showed that cost, time, and effort are among the most important factors affecting users’ transportation mode choices [57]. The participants of this field study used the solar e-bike for their daily trips and described their experience with it as quite positive, seeing the solar e-bike as a potential and practical choice for commuting [57]. Van den Berg et al. [58,59] studied the acceptance of the solar e-bike as a transportation mode using a survey that was distributed online with 317 respondents. Around 66% of the respondents believed that it is rather unlikely that they will buy a solar e-bike, while 13% were willing to buy one. The group with the most positive thoughts about the solar e-bike was users over 50 years old. Users that travel daily distances of around 7 to 12 km expressed interest in buying a solar e-bike, while users that travel less than 6 km per day were not much interested. Lastly, users’ motivations to buy a solar e-bike were its price and weight compared to a regular e-bike; the cheaper and the more lightweight it is, the better for users [58,59].
Based on all the above-mentioned studies, it can be concluded that most studies of e-bikes have been conducted using user surveys, which are mainly based on users’ experiences, thus producing inconsistencies with real data. Key areas of research are health and safety impact, transport features such as the travel distance and speed, and the user’s motivation to use the e-bike. Little research focused on solar e-bikes or solar-powered e-bikes [6,55,57,58,59], solar e-bikes’ trip features such as the travel distance and speed, and user safety, has been conducted. Consequently, the field of solar-powered e-bikes needs to be further investigated.
3.2. Solar Energy in Transportation
According to the Dutch National Energy Outlook 2016 [60], 92% of primary energy is obtained by burning fossil fuels and projections for 2020 reduces fossil fuels to only 82%. About 37% of this consumption is represented by oil consumption—mostly for the transport sector—and projections increase the participation of this fossil fuel to 38.5% by 2020. Electrical generation represents only about 1% of all national consumption [60]. Decreasing the consumption of fuels on the transport sector directly combats Greenhouse gas (GHG) emissions, meaning a significant contribution to achieving the Dutch commitment to renewable sources (14% renewable power generation by 2020 [60]).
A recent and promising development in transportation is the replacement of combustion engines by the use of battery technology, power electronics and control systems. This should result in a reduction of fossil fuel dependency and CO2 emissions. Electric vehicles (EVs) provide an energy-efficient and clean alternative for mobility when compared to fossil fuel vehicles, since they offer the potential to dramatically reduce global warming emissions throughout their lifetime, especially when charged by a clean electricity grid [61]. Marano (2008) claims that the raise of EVs in international markets contributes significantly to the increase of renewable energy sources and the reduction of CO2 emissions [62,63]. Currently, in the Dutch grid, CO2 emissions are estimated at around 420 g CO2/kWh [64]. Using solar energy to power the charging stations of EVs, their CO2 emissions will be reduced to 32 g CO2/kWh. Mouli et al. (2016) showed that in The Netherlands, there would be a reduction in CO2 emissions from 109 g/km to 70.5 g/km by replacing gasoline vehicles with EVs [65].
Photovoltaic (PV) solar cells have numerous applications in products, and are called ‘product-integrated photovoltaics’ (PIPV). These PIPVs range from low-powered consumer products, e.g., entertainment appliances, lighting systems, and art objects, to high-powered products, such as cars, planes, boats and bicycles [66,67,68,69,70,71,72,73], and buildings (building-integrated photovoltaics—BIPV). Photovoltaics (PV) may provide mid- and/or large-scale distributed renewable energy production. In recent years, the price of PV systems has decreased considerably, offering an economical solution for the design of charging stations. Large surfaces on flat roofs offer great potential for PV; examples include industrial and commercial buildings, offices and universities. A charging station for electric vehicles—electric cars or e-bikes—is a good example of a BIPV application. Such a charging station can operate successfully using locally installed PV systems attached on its rooftop and produce enough electricity for the battery charging of several e-vehicles. This could be an optimal solution for electric mobility [74,75].
On the other hand, a solar e-bike with attached PV panels on its wheels or on its skeleton, or a solar e-car with PV panels on its rooftop or on its other surfaces, are typical examples of PIPV applications. The solar e-bike, for instance, could be totally autonomous and could even be charged while it is in motion, offering freedom, convenience and fast speeds to users.
4. E-Bikes and Mode Choice in The Netherlands
In The Netherlands, almost one million bikes (more accurately 957,000 bikes) were sold in 2017 [21,76,77], of which more than a quarter were e-bikes (approximately 294,000 units) [16,30,76,77,78]. In 2016, around 27% of all trips made in The Netherlands, were travelled by bicycle [22,26,30]; this can be translated to approximately 15.5 billion kilometers travelled by bicycles [22]. Additionally, during the same year, nearly 2 billion kilometers were travelled by e-bikes [22].
A commuter’s choice for a specific transportation mode for his/her trip is based on the direct benefits that this transportation mode can offer to him/her; namely, in terms of time, comfort, and flexibility [79,80,81]. Other benefits offered to the individual by cycling include improved health, a cheap form of transportation, and even being faster than other transport modes, especially in urban areas, where traffic jams can be avoided [78,79,80,81]. A Danish case study by Haustein and Møller (2016) confirms that people use e-bikes because it is cheaper than other modes, or because it is environmentally friendly [43]. Other reasons why people use e-bikes include their enjoyment of cycling and exercise [43].
Bicycle mode choices of individuals can be explained by weather conditions and climate, socioeconomic factors, trip distance and attitudes towards cycling [82,83]. Actual differences between e-commuters and regular commuters cannot be found in the literature; nonetheless, important factors playing a role in transportation mode choices can be found. Heinen et al. (2010) claim that the utility theory explains that people’s transport mode decisions rely on cost, time, and effort [83]. The negative influence of hilliness, which affects the effort of cycling, is lower for e-commuting than for regular commuting, since e-commuting requires less effort due to the electric support. In terms of time, e-commuting should have a higher probability, since the mean travel speed of e-commuters is higher. The influence of weather conditions [78,79,80,81,82,83,84] probably differs between e-commuting and regular commuting, since the electrical support can reimburse the effort needed to cycle with strong winds. When looking at facilities in the workplace [82,85], charging facilities for e-bikes could increase the number of e-commuters. However, secured bike parking could be more important, due to the value of an e-bike compared to the value of a conventional bicycle. The availability of access to a transportation mode seems to be important [83]. More specifically, a commuter that does not have access to an e-bike cannot e-commute.
Commuting concentrates itself in terms of time and place, which may lead to various problems such as congestion, and environmental problems [80,81]. In the period 2013–2014, 17% of all trips made were commuting trips [30]. That accounted for almost ten million trips daily. 25% of commuting trips were made by bicycle, accounting for only 6% of the total commuting distance travelled. These percentages indicate that bicycles are mostly used for short-distance commuting trips. That is unfortunate, because cycling commuting is environmentally more sustainable than car commuting, and the infrastructure needed is relatively inexpensive [80,81]. Transport mode choice for commuting is one of the most environmentally significant decisions an individual can make [86].
5. Solar E-Bikes vs. Conventional E-Bikes
In order to approach the target group of solar e-bikes, we used data from the Dutch National Travel Survey, abbreviated (in Dutch) as OViN. The Dutch National Travel Survey has a sample size of about 40 thousand respondents who have participated in a one-day trip diary. The survey includes the individual and socio-economic characteristics of respondents, vehicle ownership, trip origin and destination, transport mode choice and trip purpose. Since 2013, it has distinguished trips made by regular bikes and e-bikes (Section 5.1). This allows a comparison of users choosing the e-bike and/or the solar e-bike for their transportation. In order to answer these questions, in Section 5.2, we use data from a study conducted in The Netherlands at the University of Twente (UT) and Eindhoven University of Technology (TU/e) in 2017, in which 79 employees participated in a test with solar e-bikes. The aim of the data presentation of the two above-mentioned studies is not to compare the specific data and draw conclusions based on this comparison, but to observe and analyze the users that use these transportation modes and verge on the (solar) e-bike’s target group.
5.1. Travel Survey Data Analysis
With the available data from OViN (see Table 3), it is possible to look into differences in gender, age, travelled distance, household disposable income and travel speed between two groups of commuters: e-commuters and regular commuters. From 2013 to 2015, in total there were 14380 commuting trips made by bicycle, of which 1092 were trips made by an electric bicycle and 13288 were trips with a conventional bicycle (see Table 3).
As presented in Table 3, 38.0% of the e-bike commuters are male and 62.0% are female. The percentages for regular bike commuters are 50% for both male and female. When looking at distances traveled, there is some difference between e-bike commuters and regular bike commuters.
OViN data show that around 35% of regular commuters travel distances between 1.0 and 2.5 km. For e-commuters, this distance class is also larger; around 24% of e-commuters travel distances between 1.0 and 2.5 km. However, the percentage of e-commuters that travel more than 5.0 km per trip (around 51%) is larger than regular commuters (around 30%). The mean travel distance of e-commuters is 6.0 km, where the mean travel distance of regular commuters is only 4.1 km. These values agree with data from the Central Bureau of Statistics of Netherlands, known as CBS (Central Bureau of Statistics, 2016), which states that trips made by an electric bicycle are 1.5 times longer in terms of distance than trips made by regular bicycles.
Around 60% of e-commuters are aged between 50 and 65 years, while 55% of commuters under the age of 40 years commute using non-electric bicycles. The mean age of e-commuters is 56 years, and for regular commuters it is 42. From the OViN data, it can be concluded that the mean age of e-commuters is higher than the mean age of regular commuters.
Regarding the household’s disposable income class between the e-commuters and the regular commuters, OViN data show that there is no significant difference in the deviation. Last but not least, the mean average travel speed of e-commuters is only 14.4% higher than the mean travel speed of regular commuters, at 17.3 km/h and 15.1 km/h, respectively. However, this speed is self-reported based on the specific OViN surveys, and therefore its reliability should be further discussed. Over almost all age classes, e-commuters have a higher mean average travel speed than regular commuters.
5.2. Solar E-Bike Field Experiment
The purpose of the solar e-bike field experiment is to investigate the solar e-bike’s target group and users’ notions about the solar e-bike as a sustainable transportation mode, by observing and analyzing users’ behaviors when using the solar e-bike for their daily trips. This survey was conducted in The Netherlands with 79 participants; 37 of them were working at the University of Twente and 42 at Eindhoven University of Technology [57,58]. All participants filled out pre- and post-test surveys, before and after they used the solar e-bike. The solar e-bike that was used in this study was a Sparta M7S LTD with a 400 Wh battery, containing a small photovoltaic (PV) panel in the front wheel consisting of 6 modules of 18 CIGS cells each (36 V and 11–12 W per module-per bike; 6 × 11 = 66 Wp or 6 × 12 = 72 Wp) [57]. For example, the nominal power of the PV system that is attached on one of these solar e-bikes, in the area of Enschede, The Netherlands, could be estimated at around 0.7 kW, and the average daily electricity production from the given system during July would be approximately 2.3 to a maximum of 3.3 kWh under horizontal solar radiation [87]. In fact, the average daily electricity production is lower than the previously mentioned values, because the solar e-bike is not stable under the sun during the day; it is being used for transportation, and thus its solar panels are being shaded during trips and/or when the solar e-bike is parked. A rough estimation of the average daily electricity production of the solar e-bike could be around 1.0–2.5 kWh, depending on the solar irradiance, the shading, the inclination of the panel, etc.
In Table 4, the descriptive statistics of the survey variables are presented. The age of the participants ranges between 20 and 72 years old, with a mean of 44.5. The proportion of males and females is 61% and 39%, respectively. The percentages of male and female users are not related to the gender percentages of the students and/or the staff of the technical universities, but are completely random. The users were selected voluntarily based on their own willingness and availability to participate in this survey.
Since the tested user sample is limited with regard to the number of participants and their background (e.g., educational level, field of employment), it is difficult to relate the sample of users that participated in this survey to a broader group of people. The aim of this survey is to test solar e-bikes with people that are interested in technologies and new advancements in the field of transportation and would like to spend time following a different daily routine from their own, using a new transportation mode and sharing their experiences. The distribution of a large number of solar e-bikes to a bigger sample of users was impossible to carry out at his stage of the research project, since the university owned only 5 e-bikes for the tests.
Results are not representative for a broader group of people; however, they present some interesting user experiences with the solar e-bikes, offering a good starting point for further research on subjects related to user interaction with solar e-bikes, and the problems, frustrations and difficulties that users faced with the solar e-bike, as well as users’ positive comments for this new transportation mode and ways to improve the testing procedure and, ultimately, the solar e-bikes.
From the evaluation of the data presented in Table 4, it may be concluded that the general experience of solar e-bikes is quite positive. The most influential factors on the general grading are crosswind hindrance, the suitability of the solar e-bike for commuting, the likelihood of buying a solar e-bike, and two attitudes: the solar e-bike’s flexibility and the solar e-bike’s sustainability (see Table 4).
The commuting distance of the participants lies between 1 km and 56 km, with a mean distance of 10.3 km (see Figure 1). Since employees of the universities are testing the solar bike, it is interesting to know whether the participants would consider the solar e-bike for commuting or not. In line with Fyhri and Fearnly (2015) [19], the intervention in the transportation mode behavior of the employees can have effects that can transform into a behavioral shift. It has been established that experience of a transport mode following incentives or marketing initiatives is associated with positive attitudes [88], increased use [89] and long-term adoption [90]. The experience of a transport mode increases the tendency for its use over time [19].
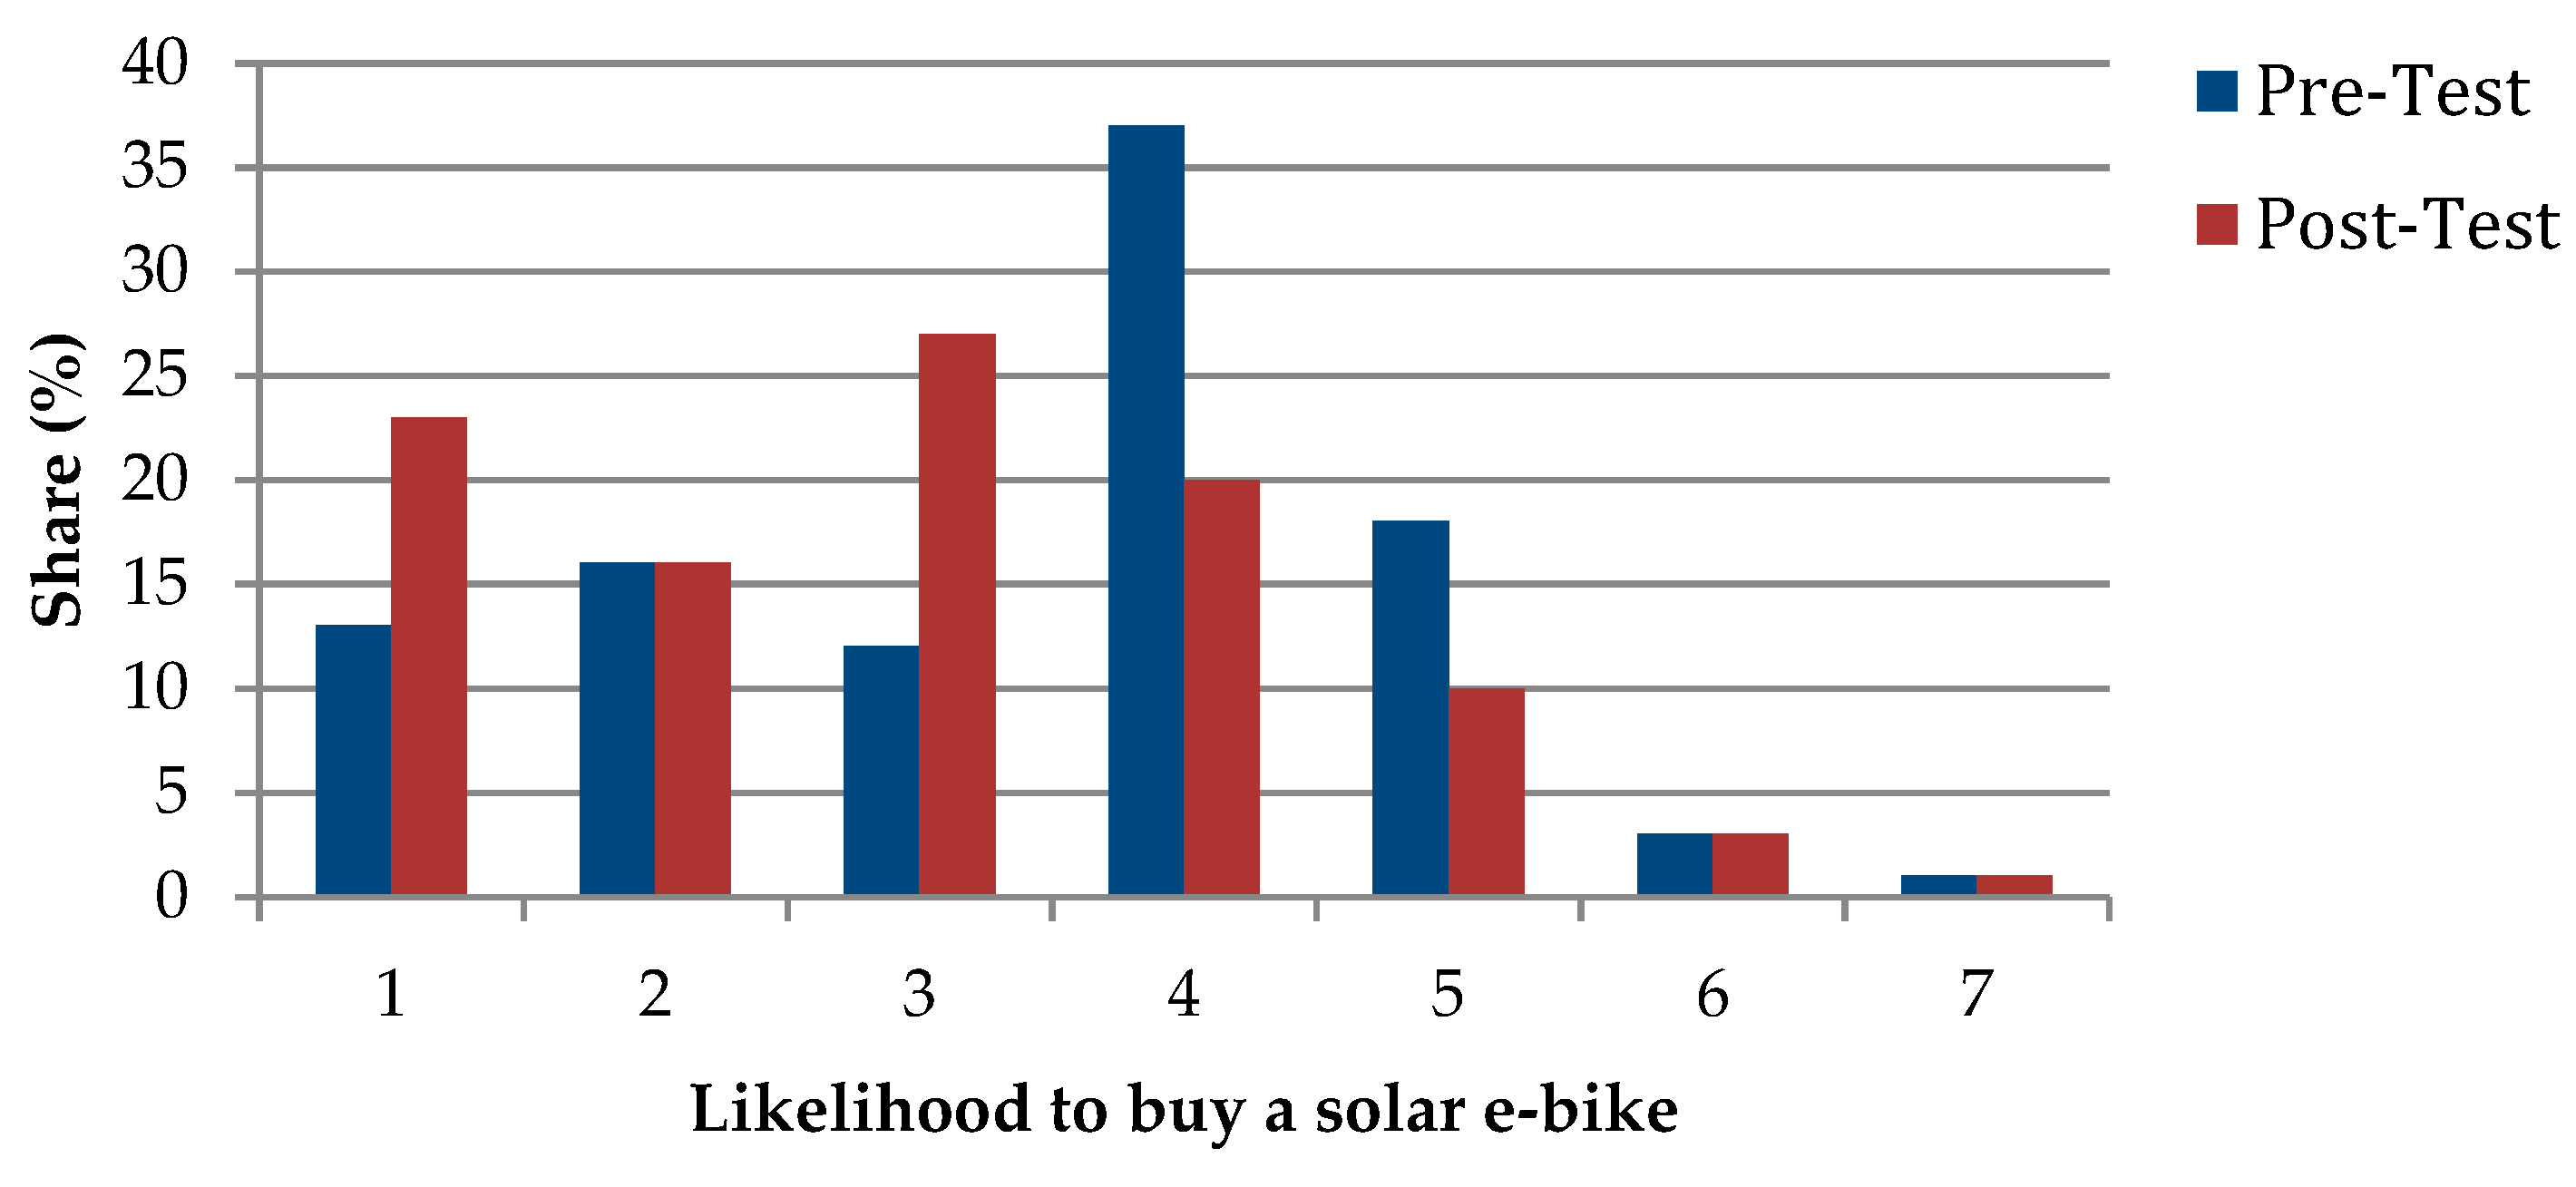
By letting employees of the universities experience a solar e-bike as a transportation mode, they might consider it further as an option for commuting. Figure 2 presents users’ likelihood of buying a solar e-bike before and after testing it.
As can be seen from Figure 2, the claim of Fyhri and Fearnley (2015) appears to apply in this situation considering transportation mode choice preferences [19]. The intervention on the transportation mode behavior of the employees had an effect on their transportation mode preferences concerning the solar e-bike. However, testing the solar e-bike did decrease users’ likelihood of buying a solar e-bike. After testing, 14% of the participants had a positive stance in terms of the likelihood of buying a solar e-bike. Around 86% of the participants are not willing to buy a solar e-bike, even if their feedback and experience with the solar e-bike were quite positive. The reasons for this are mainly the high purchase cost of the (solar) e-bike (see Section 5.4 below) and the increased maintenance costs (e.g., safe parking space, expensive anti-theft mechanism, service costs, etc.). Furthermore, the additional costs of the solar panel (around 40 cents/watt (net) in 2017 [91]), e.g., in case of a home charging kit unit for charging the solar e-bike at home, the crosswind hindrance, as stated above, and the limited lifetime of the solar e-bike (usually around 5–10 years, depending on the quality of the e-bike, the type of battery, the frequency of use, the regular maintenance service, the terrain in which the e-bike is used, and/or the style of biking) compared to the lifetime of the solar panel (which is usually around 20–25 years, according to the solar cell manufacturers [92,93]), are also barriers. In fact, the average daily electricity production is lower than the previously mentioned values, because the solar e-bike is not stable under the sun during the day; it is being used for transportation, and thus its solar panels are being shaded during trips and/or when the solar e-bike is parked. Other reasons for which participants are not willing to buy a solar-powered e-bike could include people’s ignorance regarding the benefits that the solar e-bike could offer them and the environment as a sustainable transportation mode.
Survey results showed that crosswind hindrance was one of the biggest issues that solar e-bike users faced during the tests. The PV panel on the front wheel made the solar e-bike highly unstable, and riders had difficulty cycling against the wind. PV cells on the e-bikes’ wheels during cloudy weather might give around 1 to 10 W, depending on the time that the e-bike is parked under diffuse irradiance. Unfortunately, less than 10 W over 8 h is not such a significant contribution, and it might only be efficient for a partial charge of the e-bike’s batteries. Therefore, PV-powered parking places seem to be more efficient compared to solar e-bikes with integrated solar cells in their wheels. The installment of PV panels on the roofs of houses or parking places, could be an alternative and a good investment for the charging of the e-bikes/solar-powered e-bikes at home and work locations, with less cabling costs and enough energy to power the e-bikes even on cloudy days.
Last but not least, robbery and vandalism also seem to be problems for the solar e-bikes, according to users. The integrated solar cells could be easily broken or destroyed during an accident with the solar e-bike or could be even stolen while the solar e-bikes are parked unattended. Safe parking places with secured fences and video monitoring could be a way to prevent robbery and vandalism. However, this costs individuals, or the institutes/companies that want to offer this service to their employees, money.
5.3. Survey Results Conclusions
From the OViN data analyses in Section 5.1, it can be concluded that the mean commuting distance of e-commuters is 6 km, the mean number of e-bikes owned by e-commuter households is 1.4, and the mean age of e-commuters is 56 years. The mean travel speed of e-commuters is 17.3 km/h.
Table 5 presents a summary of the results from the two surveys described in the previous paragraphs. Data from OViN [28,29,30] for e-commuters are compared to the UT survey data for the solar e-bike commuters, to see whether the participant population has similarities with the respondent population of OViN. The survey results indicate that the mean age, gender, and commuting distance of the two data sources deviate significantly. The gross income of the data sources are in different categories. Therefore, it is not possible to compare this variable statistically. When looking at the mean income, it seems that the OViN respondents have a slightly higher income than the solar e-bike users. It may be concluded that the participant population is not equivalent to the OViN population, and vice versa. OViN data do not even represent the ‘average Dutch population’ in terms of age, gender and average gross income.
5.4. A Comparative Cost Analysis of the Various Bike Options
Average bicycle sales prices vary substantially between European countries, with Dutch consumers having the highest willingness to pay for new bicycles. At the low end of the spectrum, average bicycle sales prices are around 125–200 euros in Eastern and Southern European Countries, and are the highest in The Netherlands, with average sales prices around 1000 euros [94,95]. The Dutch sales prices are influenced heavily by the market share of e-bikes. The average sales prices of new bikes grew from about 600 euro, with a 12% share of e-bikes, in 2006 to an average sales prices of 1060 Euro, with a 36% of market share of the e-bikes, in 2017. About 36% of sales prices of new Dutch bikes are more than 900 euros [95], a figure dominated by e-bikes. The average sales prices of the electrical bicycles in The Netherlands is about 2000 euro, and about 800 euro for a regular bike [96]. However, the sales price of an e-bike depends on the quality of the bicycle, battery type and power. A low-range price for an e-bike is around 1200 to 1500 euros [97].
In the field experiment, the material cost of the solar e-wheel (including solar panels, energy transfer unit, data logger) was about 700 euro per bike, which makes a market price of the (low-end) solar e-bike used in the field work about 2000 euro. At the moment, there are a few commercially available solar e-bikes with prices around 1500 euros [98,99] [including a 250 W-motor e-bike (around 1000 euros), and a battery and solar panel combo (around 450 euros)] or solar e-wheel kits starting from 615 euros [100]. Another e-bike with fully integrated solar cells for charging is the Leaos [101] (Red Dot Design Award 2015 Winner), with a sales price higher than 6000 euros. However, the market of the solar-powered e-bikes is not yet well established, and there are not many commercially available products in the European market. However, there are many concept products that might be launched in the markets soon.
To conclude this section, the cost of an e-bike is significantly higher, with current average sales prices about 60% higher, than a conventional bike, and the cost of a solar e-bike is substantially higher than a normal e-bike. Given that the fieldwork experiment showed a decreasing willingness to buy after the field trials, as noted in Section 5.2, it seems unlikely that e-bike commuters would be willing to pay the additional cost of the prototype solar e-wheels with crosswind hindrances. Commuters with a high willingness to pay also already have options to purchase regular e-bikes with a more powerful battery. For example, some Dutch bicycle manufacturers offer e-bikes with different battery types, ranging from 300 to 600 Wh batteries which would increase cycling range by 50–100% (up to 200 km) at an additional cost of 150–350 euro.
6. Conclusions and Discussion
The aim of this review paper was to capture the status and experiences with the use of e-bikes, more specifically, with the solar-powered e-bikes. This paper presented research conducted so far on e-bikes and solar-powered e-bikes, as well as the main technical features of solar e-bikes. It also introduced the solar e-bike as a sustainable transportation mode, based on literature data and a field experiment in The Netherlands, which aimed to investigate the target group of solar e-bikes and user beliefs about the specific transportation mode.
The literature review showed a growing literature on e-bike user studies, and more specifically on users, health issues, mobility and safety impact, but a lack of studies on solar-powered e-bikes. In particular, the technical performance of solar-powered e-bikes is poorly addressed. From the literature, people use e-bikes because they are cheaper than other transportation modes, and/or environmentally friendly, while improving users’ physical activity. Motivations to use the e-bike depend on the user’s age. Early adopters of e-bikes are people over 60 years old using the e-bike for leisure trips and commuters. Users’ motivations to buy a solar e-bike include its price and its lower weight compared to a regular e-bike. Furthermore, the use of e-bikes provides direct health benefits to users and reduces harmful emissions, such as CO2, NOxs and other air pollutants.
Analysis using national travel survey data for The Netherlands showed that solar e-bikes’ target group is commuters between 40 and 60 years old, using the e-bike for commuting distances longer than 6 km per day, with an average gross income above €2500, as well as people who choose a fast, safe, comfortable and effortless way to commute. In this paper, a survey among university staff commuters showed that users’ motivations to use the solar e-bikes include commuting, recreational motives, and the need for a more luxurious and/or a more environmentally friendly vehicle. Users also declare that social influence might be a motivation to move forward this type of transportation. Some of the factors that could play a role in user satisfaction and transportation mode choices of people include: user attitudes and characteristics, commuting distance, and parking strategy. Another important factor could be the energy production of the solar e-bike; however, based on the above-presented surveys, the effect of this factor to the final user satisfaction cannot be defined yet. For the assessment of this factor, precise energy performance measurements are needed, which lack from literature at the moment and will be addressed by the authors in another study.
A field experiment among university staff members in two Dutch universities showed that by experiencing a new transportation mode—the solar e-bike—the transportation mode choices preferences of users are ultimately affected. Users were quite enthusiastic during their interaction with the solar e-bike and were much more interested in the solar e-bike after testing; some users even chose it as a transportation mode for their daily trips. However, despite users’ interest after experiencing the solar e-bike, their likelihood to buy one was still low. Reasons for that might be the high purchase cost of a solar e-bike, crosswind hindrance, the extra care that is needed regarding the solar e-bikes’ battery charging, or parking, as well as the insufficient training and information regarding the use and the benefits of the specific transportation mode to the user and the environment.
Future research could be directed at examining the willingness to pay and user satisfaction of solar bikes for leisure trips and e-bikes for commuting with variations in battery power. Future trials with solar e-bikes could be directed at public e-bike sharing schemes, especially at city centers, offering tourists and visitors a choice for sustainable mobility, reducing the need to charge shared e-bikes at docking stations.
Author Contributions
Conceptualization, G.A., A.R. and K.G.; Methodology, G.A.; Validation, G.A., A.R. and K.G.; Formal Analysis, G.A.; Investigation, G.A.; Resources, G.A., A.R. and K.G.; Data Curation, G.A.; Writing-Original Draft Preparation, G.A.; Writing-Review & Editing, G.A.; Visualization, G.A.; Supervision, A.R. and K.G.; Project Administration, A.R.; Funding Acquisition, A.R. and K.G.
Funding
This research received no external funding.
Acknowledgments
We would like to acknowledge all survey participants at UT and TU/e, CBS for giving us access to the OViN data and students Floris Nijland and Pablo Gaete Haller for their assistance. We would like to thank Pauline van den Berg and colleagues at TU Eindhoven for the collaboration in the solar bike field trial. Last but not least, we would like to thank 4TU.Bouw Lighthouse funding scheme and the University of Twente for supporting this research study, as part of the Solar bike and Smart Living Campus projects.
Conflicts of Interest
The authors declare no conflicts of interest.
References
- European Environment Agency. Air Quality in Europe–2016 Report; EEA Report; No. 28/2016; Publication Office of the European Union: Luxemburg, 2016. [Google Scholar]
- European Environment Agency. Air Quality in Europe–2017 Report; EEA Report; No. 13/2017; Publication Office of the European Union: Luxemburg, 2017. [Google Scholar]
- Federal Ministry of Education and Research. German Federal Government’s National Electromobility Development Plan August 2009. Available online: http://www.bmvi.de/blaetterkatalog/catalogs/219118/pdf/complete.pdf (accessed on 6 July 2018).
- Martens, K. The bicycle as a feedering mode: Experiences from three European countries. Transp. Res. Part D Transp. Environ. 2004, 9, 281–294. [Google Scholar] [CrossRef]
- Fuentes, M. Impact of Energetic Management on the Development of LEVS as a Mode Alternative Transport Solutions Mobility to Urban/Metropolitan; Technical Report, CIEMAT–1228; CIEMAT: Centro de Investigaciones Energeticas Medioambientales y Tecnologicas: Madrid, Spain, 2011; 126p. [Google Scholar]
- Adhisuwignjo, S.; Siradjuddin, I.; Rifái, M.; Putri, R.I. Development of A Solar powered Electric Bicycle in Bike sharing Transportation System. Presented at the 3rd International Conference of Planning in the Era of Uncertainty, Widyaloka Building, Universitas Brawijaya, Malang, Jawa Timur, 6–7 March 2017. [Google Scholar] [CrossRef]
- Shaheen, S.; Guzman, S.; Zhang, H. Bikesharing in Europe, the Americas, and Asia–Past, Present, and Future. Transp. Res. Rec. J. Transp. Res. Board 2010, 2143, 159–167. [Google Scholar] [CrossRef]
- DeMaio, P. Bike-sharing: History, impacts, models of provision, and future. J. Pub. Transp. 2009, 14, 41–56. [Google Scholar] [CrossRef]
- RAI Vereniging. Lemgislation and Regulations Speed Pedelec. Available online: https://raivereniging.nl/dossiers/speed-pedelec (accessed on 6 July 2018).
- RAI Vereniging. Dutch and European Legislation Electric Bicycles. Available online: https://raivereniging.nl/artikel/dossiers/elektrische-voertuigen/nederlandse-en-europese-wetgeving.html (accessed on 6 July 2018).
- Bike Europe. EU Regulations for E-bikes & Pedelecs (Part 1). Available online: https://www.bike-eu.com/laws-regulations/artikel/2010/08/eu-regulations-for-e-bikes-pedelecs-part-1-1018836?vakmedianet-approve-cookies=1&_ga=2.138102576.1627042704.1531468228-21398600.1530459024 (accessed on 4 August 2010).
- European Cyclists’ Federation, ECF, Electric Bicycle (pedelec) Regulation. Available online: https://ecf.com/what-we-do/road-safety/electric-bicycle-pedelec-regulation (accessed on 6 July 2018).
- Rose, G. E-Bikes and urban transportation: Emerging issues and unresolved Questions. Transportation 2012, 39, 81–96. [Google Scholar] [CrossRef]
- Fishman, E.; Cherry, C. E-bikes in the Mainstream: Reviewing a Decade of Research. Transp. Rev. 2015, 36, 72–91. [Google Scholar] [CrossRef]
- Confederation of the European Bicycle Industry. European Bicycle Industry and Market Profile 2017 with 2016 Data. 2017 Edition. European Bicycle Market. Available online: http://www.conebi.eu/download/european-bicycle-industry-and-market-profile-2017-with-2016-data/ (accessed on 6 July 2018).
- Statista. The Statistics Portal. Total sales of new e-bikes in The Netherlands from 2004 to 2017. Available online: https://www.statista.com/statistics/801377/sales-volume-of-new-e-bikes-in-the-netherlands/ (accessed on 6 July 2018).
- Fishman, E. Cycling as transport. Transp. Rev. 2015, 36, 1–8. [Google Scholar] [CrossRef] [Green Version]
- Kroesen, M. To what extent do e-bikes substitute travel by other modes? Evidence from The Netherlands. Transp. Res. Part D 2017, 53, 377–387. [Google Scholar] [CrossRef]
- Fyhri, A.; Fearnley, N. Effects of e-bikes on bicycle use and mode share. Transp. Res. Part D Transp. Environ. 2015, 36, 45–52. [Google Scholar] [CrossRef]
- RAI Vereniging. Fietsen. Available online: https://raivereniging.nl/fietsen (accessed on 5 July 2018).
- RAI Vereniging. Available online: https://raivereniging.nl/fietsen (accessed on 6 July 2018).
- Ministry of Infrastructure and water Management. Cycling Facts 2018, Netherlands Institute for Transport Policy Analysis|KiM. Available online: https://www.google.com.tw/search?source=hp&ei=axNkW4aDLo6i-QaDlZPYBw&q=Kennisinstituut+voor+Mobiliteit%2C+KiM%2C+Cycling+Facts+2018.+Netherlands+Institute+for+Transport+Policy+Analysis+|+KiM%2C+Lucas+Harms+%26+Maarten+Kansen%2C+2018&oq=Kennisinstituut+voor+Mobiliteit%2C+KiM%2C+Cycling+Facts+2018.+Netherlands+Institute+for+Transport+Policy+Analysis+|+KiM%2C+Lucas+Harms+%26+Maarten+Kansen%2C+2018&gs_l=psy-ab.12...3234.3234.0.4534.1.1.0.0.0.0.0.0..0.0....0...1c.1.64.psy-ab..1.0.0....0.uFi1xKEyaxY (accessed on 6 July 2018).
- SWOV. Electrische fietsen en speed-pedelecs. Available online: https://www.swov.nl/feiten-cijfers/factsheet/elektrische-fietsen-en-speed-pedelecs (accessed on 6 July 2018).
- Bestlist.nl. Infographic: Nederland Fietsland. Available online: https://www.beslist.nl/info/fietsland.html (accessed on 6 July 2018).
- Bicycle Dutch WordPress. Dutch Cycling Figures. Available online: https://bicycledutch.wordpress.com/2018/01/02/dutch-cycling-figures/ (accessed on 6 July 2018).
- Onderzoek Verplaatsingen in Nederland (OViN). Research on Mobility in The Netherlands. 2016. Available online: https://www.cbs.nl/nl-nl/onze-diensten/methoden/onderzoeksomschrijvingen/korte-onderzoeksbeschrijvingen/onderzoek-verplaatsingen-in-nederland--ovin-- (accessed on 6 July 2018).
- Kennisinstituut voor Mobiliteit (KiM). Mobiliteitsbeeld 2016; Ministerie van Infrastructuur en Milieu: Den Haag, The Netherlands, 2016.
- CBS. Onderzoek Verplaatsingen in Nederland 2013; Centraal Bureau voor de Statistiek: Den Haag, The Netherlands, 2014.
- CBS. Onderzoek Verplaatsingen in Nederland 2014; Centraal Bureau voor de Statistiek: Den Haag, The Netherlands, 2015.
- CBS. Onderzoek Verplaatsingen in Nederland 2015; Centraal Bureau voor de Statistiek: Den Haag, The Netherlands, 2016.
- CBS. Transport en Mobiliteit 2016; Centraal Bureau voor de Statistiek: Den Haag, The Netherlands, 2016.
- MacArthur, J.; Dill, J.; Person, M. Electric bikes in North America: Results of an online survey. Transp. Res. Rec. 2014, 2468, 123–130. [Google Scholar] [CrossRef]
- Cherry, C.R.; Weinert, J.X.; Xinmiao, Y. Comparative environmental impacts of electric bikes in China. Transp. Res. D Transp. Environ. 2009, 14, 281–290. [Google Scholar] [CrossRef] [Green Version]
- Gojanovic, B.; Welker, J.; Iglesias, K.; Daucourt, C.; Gremion, G. Electric Bicycles as a New Active Transportation Modality to Promote Health. Med. Sci. Sp. Exerc. 2011, 43, 2204–2210. [Google Scholar] [CrossRef] [PubMed] [Green Version]
- Gorenflo, C.; Rios, I.; Golab, L.; Keshav, S. Usage Patterns of Electric Bicycles: An Analysis of the WeBike Project, University of Waterloo, Waterloo, Canada. J. Adv. Transp. 2017, 2017, 14. [Google Scholar] [CrossRef]
- Rios, I.; Golab, L.; Keshav, S. Analyzing the usage patterns of electric bicycles. In Proceedings of the 2016 Workshop on Electric Vehicle Systems Data and Applications, Waterloo, ON, Canada, 21–24 June 2016. [Google Scholar] [CrossRef]
- Mesentean, S.; Feucht, W.; Kula, H.G.; Frank, H. Smart charging of electric scooters for home to work and home to education transports from grid connected photovoltaic-systems. In Proceedings of the 2010 IEEE International Energy Conference, Manama, Bahrain, 18–22 December 2010; pp. 73–78. [Google Scholar]
- Kiefer, C.; Behrendt, F. Smart e-bike monitoring system: Real-time open source and open hardware GPS assistance and sensor data for electrically-assisted bicycles. IET Intell. Transp. Syst. 2016, 10, 79–88. [Google Scholar] [CrossRef]
- Fluchter, K.; Wortmann, F. Implementing the connected e-bike: challenges and requirements of an IoT application for urban transportation. In Proceedings of the First International Conference on IoT in Urban Space, Rome, Italy, 27–28 October 2014. [Google Scholar] [CrossRef]
- Paefgen, J.; Michahelles, F. Inferring usage characteristics of electric bicycles from position information. In Proceedings of the 3rd International Workshop on Location and the Web, New York, NY, USA, 29 November 2010; pp. 16–19. [Google Scholar]
- University of Waterloo WeBike Project. Available online: http://blizzard.cs.uwaterloo.ca/iss4e/webike-project (accessed on 6 July 2018).
- Dozza, M.; Bianchi Piccinini, G.F.; Werneke, J. Using naturalistic data to assess e-cyclist behavior. Transp. Res. Part F Traffic Psychol. Behav. 2016, 41, 217–226. [Google Scholar] [CrossRef]
- Haustein, S.; Møller, M. Age and attitude: Changes in cycling patterns of different e-bike user segments. Int. J. Sustain. Transp. 2016, 10, 836–846. [Google Scholar] [CrossRef] [Green Version]
- Langford, B.; Chen, J.; Cherry, C. Risky riding: Naturalistic methods comparing safety behavior from conventional bicycle riders and electric bike riders. Accid. Anal. Prev. 2015, 82, 220–226. [Google Scholar] [CrossRef] [PubMed]
- Schleinitz, K.; Petzoldt, T.; Franke-Bartholdt, L.; Krems, J.; Gehlert, T. The German Naturalistic Cycling Study—Comparing cycling speed of riders of different e-bikes and conventional bicycles. Saf. Sci. 2017, 92, 290–297. [Google Scholar] [CrossRef]
- Gebhard, L.; Golab, L.; Keshav, S.; de Meer, H. Range prediction for electric bicycles. In Proceedings of the e-Energy 16, Seventh International Conference on Future Energy Systems, Waterloo, ON, Canada, 21–24 June 2016. [Google Scholar]
- Behrendt, F. Why cycling matters for electric mobility: Towards diverse, active and sustainable e-mobilities. Mobilities 2017, 13, 64–80. [Google Scholar] [CrossRef]
- Kroesen, M.; Harms, L. User Characteristics and Trip Patterns of E-Bike Use in The Netherlands–Results from The Dutch National Travel Survey and the Mobility Panel Netherlands; KiM Netherlands Institute for Transport Policy Analysis, Ministry of Infrastructure and Water Management: Delft, The Netherlands, 2018. [Google Scholar]
- Wolf, A.; Seebauer, S. Technology adoption of electric bicycles: A survey among early adopters. Transp. Res. Part A Policy Pract. 2014, 69, 196–211. [Google Scholar] [CrossRef]
- Seebauer, S. Why early adopters engage in interpersonal diffusion of technological innovations: An empirical study on electric bicycles and electric scooters. Transp. Res. 2015, 78, 146–160. [Google Scholar] [CrossRef]
- Plazier, P.; Weitkamp, G.; van den Berg, A.E. The potential for e-biking among the younger population: A study of Dutch students. Travel Behav. Soc. 2017, 8, 37–45. [Google Scholar] [CrossRef] [Green Version]
- Harms, L.; Bertolini, L.; te Brömmelstroet, M. Spatial and social variations in cycling patterns in a mature cycling country exploring differences and trends. J. Transp. Health 2014, 1, 232–242. [Google Scholar] [CrossRef]
- Harms, L.; Bertolini, L.; te Brömmelstroet, M. Performance of municipal cycling policies in medium-sized cities in The Netherlands since 2000. Transp. Rev. 2016, 1–29. [Google Scholar] [CrossRef]
- Jones, T.; Harms, L.; Heinen, E. Motives, perceptions and experiences of electric bicycle owners and implications for health, wellbeing and mobility. J. Transp. Geogr. 2016, 53, 41–49. [Google Scholar] [CrossRef]
- Mishra, K.S.; Gadhawe, S.V.; Chaudhari, D.C.; BhupendraVarma; Barve, S.B. Design and Development of Solar Hybrid Bicycle. Int. J. Curr. Eng. Technol. 2016, 377–381. [Google Scholar]
- Fuentes, M.; Fraile-Ardanuy, J.; Risco-Martín, J.L.; Moya, J.M. Feasibility Study of a Building–Integrated PV Manager to Power a Last-Mile Electric Vehicle Sharing System. Hindawi Int. J. Photoenergy 2017, 2017. [Google Scholar] [CrossRef]
- Apostolou, G.; Geurs, K.T.; Reinders, A.H.M.E. Technical performance and user aspects of solar powered e-bikes–Results of a field study in The Netherlands. Presented at the DIT–ESEIA Conference on Smart Energy Systems in Cities and Regions, Dublin, Ireland, 10 April 2018. [Google Scholar]
- Van den Berg, P.E.W.; Vinken, S.M.H.J.; Geurs, K.; Arentze, T.A. Solar bike acceptance: Mode choice behavior. J. Transp. Land Use 2018. revision submitted. [Google Scholar]
- Van den Berg, P.E.W.; Vinken, S.M.H.J.; Geurs, K.; Arentze, T.A. Universiteiten ontwikkelen fiets met ‘zonnewiel’. Verkeerskunde 2017, 68, 6–7. [Google Scholar]
- National Energy Outlook 2016, CBS, Central Bureau of Statistics of The Netherlands. Available online: https://www.cbs.nl/en-gb/publication/2016/41/national-energy-outlook-2016 (accessed on 6 July 2018).
- Union of Concerned Scientists. Rachael Nealer David Reichmuth Don Anair. Cleaner Cars from Cradle to Grave How Electric Cars Beat Gasoline Cars on Lifetime Global Warming Emissions. Available online: https://www.ucsusa.org/sites/default/files/attach/2015/11/Cleaner-Cars-from-Cradle-to-Grave-full-report.pdf (accessed on 6 July 2018).
- Millo, F.; Rolando, L.; Fuso, R.; Mallamo, F. Real CO2 emissions benefits and end user’s operating costs of a plug-in Hybrid Electric Vehicle. Appl. Energy 2014, 114, 563–571. [Google Scholar] [CrossRef]
- Marano, V.; Rizzoni, G. Energy and economic evaluation of PHEVs and their interaction with renewable energy sources and the power grid. In Proceedings of the IEEE International Conference on Vehicular Electronics and Safety (ICVES 08), Columbus, OH, USA, 22–24 September 2008; pp. 84–89. [Google Scholar]
- Entrance, Energy Transition Center. Renewable Energy in The Netherlands May 2017. Available online: http://en-tran-ce.org/wp-content/uploads/2015/07/Renewable-Energy-in-NL-May-2017.pdf (accessed on 6 July 2018).
- Mouli, G.R.C.; Leendertse, M.; Venugopal, P.; Bauer, P.; Silvester, S.; van de Geer, S.; Zeman, M. Economic and CO2 Emission Benefits of a Solar Powered Electric Vehicle Charging Station for Workplaces in The Netherlands. Presented at the 2016 IEEE Transportation Electrification Conference and Expo (ITEC), Dearborn, MI, USA, 26–29 June 2016. [Google Scholar]
- Apostolou, G.; Reinders, A.H.M.E. Overview of design issues in product-integrated photovoltaics. J. Energy Technol. 2014, 2, 229–242. [Google Scholar] [CrossRef]
- Apostolou, G.; Reinders, A.H.M.E. How do users interact with PV-powered products? Investigating 100 lead users and 6 PV products. J. Des. Res. 2016, 14, 66–93. [Google Scholar]
- Reinders, A. Solar Powered E-bikes: Monitoring and Analysis of a Sustainable Mobility System. Retrieved from AriseTogether. Available online: http://arisetogether.nl/portfolio/solar-powered-ebikes-monitoring-and-analysis-of-a-sustainable-mobility-system/ (accessed on 6 July 2018).
- Reinders, A.H.M.E.; Diehl, J.C.; Brezet, J.C. The Power of Design: Product Innovation in Sustainable Energy Technologies; Wiley: London, UK, 2013; p. 368. [Google Scholar]
- Reinders, A.H.M.E.; Van Sark, W.G.J.H.M. Product Integrated PV. In Comprehensive Renewable Energy; Sayigh, A.A.M., Ed.; Elsevier: London, UK, 2012; pp. 709–732. [Google Scholar]
- Reinders, A.H.M.E.; Boer, A.D. Product integrated PV and innovative product design. Presented at the 26th EU Photovoltaic Solar Energy Conference and Exhibition, Hamburg, Germany, 29 November 2011. [Google Scholar]
- Reinders, A.H.M.E.; Verlinden, P.; van Sark, W.G.J.H.M.; Freundlich, A. Product Integrated PV. Photovoltaic Solar Energy–From Fundamentals to Applications; Wiley and Sons: London, UK, 2017. [Google Scholar]
- Gorter, T.; Reinders, A.H.M.E.; Van Houten, F.J.A.M. Monitored PV system data analysis of PV–powered racing boat during the Frisian Solar Challenge. Presented at the 27th EU Photovoltaic Solar Energy Conference and Exhibition, Frankfurt, Germany, 24–28 September 2012. [Google Scholar]
- Locment, F.; Sechilariu, M.; Forgez, C. Electric vehicle charging system with PV grid-connected configuration: experimental tests of control and power management. In Proceedings of the 2010 IEEE Vehicle Power and Propulsion Conference, Lille, France, 1–3 September 2010. [Google Scholar]
- Blasius, E.; Federau, E.; Janik, P.; Leonowicz, Z. Heuristic Storage System Sizing for Optimal Operation of Electric Vehicles Powered by Photovoltaic Charging Station. Int. J. Photoenergy 2016, 2016. [Google Scholar] [CrossRef]
- Bike-eu, E-Bike Puts Dutch Market Back on Growth Track. Available online: https://www.bike-eu.com/sales-trends/nieuws/2018/03/e-bike-puts-dutch-market-back-on-growth-track-10133083?vakmedianet-approve-cookies=1&_ga=2.75070738.1451927154.1531382090-417313996.1531382090 (accessed on 6 July 2018).
- Bike-eu, E-Bike Sales Soared in EU’s Main Markets. Available online: https://www.bike-eu.com/sales-trends/nieuws/2018/03/e-bike-sales-soared-in-eus-main-markets-10133378 (accessed on 6 July 2018).
- CBS. Onderzoek Verplaatsingen in Nederland 2017; Centraal Bureau voor de Statistiek: Den Haag, The Netherlands, 2017.
- Heinen, E. Bicycle commuting: Proefschrift; Delft University Press: Delft, The Netherlands, 2011. [Google Scholar]
- Heinen, E.; Maat, K.; van Wee, B. Day-to-Day Choice to Commute or Not to Bicycle. Transp. Res. Rec. J. Transp. Res. Board. 2011, 2230, 9–18. [Google Scholar] [CrossRef]
- Heinen, E.; Maat, K.; van Wee, B. The role of attitudes toward characteristics of bicycle commuting on the choice to cycle to work over various distances. Transp. Res. Part D 2011, 16, 102–109. [Google Scholar] [CrossRef]
- Heinen, E.; Maat, K.; van Wee, B. The effect of work-related factors on the bicycle commute mode choice in The Netherlands. Transportation 2013, 40, 23–43. [Google Scholar] [CrossRef]
- Heinen, E.; van Wee, B.; Maat, K. Commuting by Bicycle: An Overview of the Literature. Transp. Rev. 2010, 30, 59–96. [Google Scholar] [CrossRef]
- Aarts, H.; Verplanken, B.; van Knippenberg, A. Habit and information use in travel mode choices. Acta Psychol. 1997, 96, 1–14. [Google Scholar] [CrossRef] [Green Version]
- Wardman, W.; Tight, M.; Page, M. Factors influencing the propensity to cycle to work. Transp. Res. Part A 2007, 41, 339–350. [Google Scholar] [CrossRef] [Green Version]
- Collins, C.M.; Chambers, S.M. Psychological and situational influences on commuter transport-mode choice. Environ. Behav. 2005, 37, 640–661. [Google Scholar] [CrossRef]
- PVGIS. Photovoltaic Geographical Information System–Interactive Maps. Available online: http://re.jrc.ec.europa.eu/pvgis/apps4/pvest.php# (accessed on 6 July 2018).
- Donaghy, K. Models of travel demand with endogenous preference change and heterogeneous agents. J. Geogr. Syst. 2011, 13, 17–30. [Google Scholar] [CrossRef]
- Taniguchi, A.; Fujii, S. Promoting public transport using marketing techniques in mobility management and verifying their quantitative effects. Transportation 2007, 34, 37–49. [Google Scholar] [CrossRef]
- Jones, P.; Sloman, L. Encouraging behavioural change through marketing and management: What can be achieved? Presented at the 10th International Conference on Travel Behaviour Research, Lucerne, Switzerland, 10–15 August 2003. [Google Scholar]
- PV Europe. Solar Technology and Applications, Solar Panel Price: Further Drop Expected in 2017. Available online: http://www.pveurope.eu/News/Markets-Money/Solar-panel-price-Further-drop-expected-in-2017 (accessed on 1 September 2017).
- Energysage. Smarter Energy Decisions. How Long Do Solar Panels Last? Available online: https://news.energysage.com/how-long-do-solar-panels-last/ (accessed on 4 January 2017).
- Namaste Solar. How Long do Solar Panels Last: Lifespan & Maintenance. Available online: https://www.namastesolar.com/how-long-do-solar-panels-last/ (accessed on 6 July 2018).
- Statista. Average Price of Bicycle Sales in the European Union (EU-28) in 2016, by Country (in Euros). 2018. Available online: https://www.statista.com/statistics/561517/bicycle-sales-average-price-in-the-european-union-by-country/ (accessed on 6 July 2018).
- Statista. Bicycle Industry in The Netherlands. 2018. Available online: https://www.statista.com/study/52703/bicycle-industry-in-the-netherlands/ (accessed on 6 July 2018).
- Fiets Platform. Bicycle Recreation Monitor, Figures and Trends. Available online: https://www.fietsplatform.nl/fietsrecreatiemonitor/cijfers (accessed on 6 July 2018).
- Gizmodo. What’s Wrong with Electric Bicycles. Available online: https://gizmodo.com/what-s-wrong-with-electric-bicycles-1702986234 (accessed on 5 July 2015).
- The Verge. This Stylish E-bike Comes with a Solar-powered Battery Pack, A Sharp Repackaging of Products that Already Exist, by Sean O’Kane. Available online: https://www.theverge.com/2018/2/28/17063300/e-bike-powered-battery-pack-kvaern (accessed on 28 February 2018).
- Indiegogo. Kvaern Solar Powered E-Bike. Available online: https://www.indiegogo.com/projects/kvaern-solar-powered-e-bike#/ (accessed on 6 July 2018).
- Electric Bike Report. E-Bike News: Solar Wheel, GPS Tracking, Death Valley, Snow Rides, & More, by Richard Peace. Available online: https://electricbikereport.com/ebike-news-solar-wheel-gps-tracking-death-valley-snow-rides-more-videos/#more-20687 (accessed on 30 December 2016).
- LEAOS. Design Art Passion, LEAOS Solar, Red Dot Design Award 2015 Winner. Available online: http://www.leaos.com/leaos-solar-ebike/, http://www.leaos.com/configurator-shop/552ba41590b79/4014/ (accessed on 6 July 2018).
Figure 1.
Commuting distances (in km) with the solar e-bike, (n = 327 trips). Results presented in this histogram are based on the survey conducted at UT and TU/e.
Figure 1.
Commuting distances (in km) with the solar e-bike, (n = 327 trips). Results presented in this histogram are based on the survey conducted at UT and TU/e.

Figure 2.
Absolute percentages in a Likert scale from 1 to 7 (1 indicates the minimum and 7 the maximum likelihood) of users’ likelihood of buying before and after testing a solar e-bike (n = 79).
Figure 2.
Absolute percentages in a Likert scale from 1 to 7 (1 indicates the minimum and 7 the maximum likelihood) of users’ likelihood of buying before and after testing a solar e-bike (n = 79).


Table 1.
Classification and main features of e-bikes.
| E-bikes’ Main Features | Bicycle-Style Electric Bicycle | Speed Pedelec |
|---|---|---|
| Assistance | EAB (electric-assisted bicycles)—Only when user is pedaling PB (powered bicycles)—Available without pedaling | 100% of the time |
| Pedals | Provide power | Feet support |
| Motor Power | EAB < 250 Watts PB < 750 Watts | 1000–4000 W |
| Speed | < 25 km/h | 25–45 km/h |
| Battery Capacity | 0.3–0.6 kWh | 0.5–15 kWh |
| Author | Location | Purpose | Duration | Participants | Data Collected |
|---|---|---|---|---|---|
| Fyhri and Fearnley | Norway | Usage | 2–4 weeks | 66 | Odometer |
| Paefgen and Michahelles | Switzerland | Usage | 4 months | 17 | GPS |
| Kiefer and Behrendt | Brighton, UK | Usage | 10 months | 30 bikes/93 riders | GPS, assistance level, accelerometer |
| MacArthur et al. | Portland, OR, USA | Usage | 1.5 years | 30 bikes | Participant surveys |
| Dozza et al. | Sweden | Safety | 2 weeks | 3 bikes/12 riders | Video, GPS, braking force, lateral movement |
| Langford et al. | USA | Safety | 2 years | 12 bikes | GPS |
| Haustein and Moller | Denmark | Safety | 2 months | 685 e-bike users | Internet survey |
| Schleinitz et al. | Germany | Speed | 4 weeks | 85 | Video, Speed-odometer |
| Plazier et al. | Netherlands | 37 participants | Survey, interviews | ||
| Gebhard, Golab, Keshav | Canada | Usage, Battery | 3 years | 31 bikes | GPS, battery charge |
| Fluchter and Wortmann | Switzerland | IoT issues | 4 months | 32 bikes | GPS |
| Mesentean, Feucht, Kula and Frank | Germany | PV (photovoltaic) charging | 1 year | 6 bikes/9 students | Battery, % SoC (state of charge), electricity consumption, generated electricity (PV) |
| Gorenflo et al. | Waterloo, Canada | Usage | 3 years | 30 sensor-equipped e-bikes | Survey, e-bike trips and battery SoC |
Table 3.
Features of e-bikes’ and regular bikes’ users (data collected from OViN (Onderzoek Verplaatsingen in Nederland) [26]). Revised 2013–2015.
Table 3.
Features of e-bikes’ and regular bikes’ users (data collected from OViN (Onderzoek Verplaatsingen in Nederland) [26]). Revised 2013–2015.
| Type of Bicycle | E-Bike | Conventional Bike | |
|---|---|---|---|
| Group size [-] | 1 092 | 13 288 | |
| Gender [-] | Male | 415 (38.0%) | 6 642 (50.0%) |
| Female | 677 (62.0%) | 6 646 (50.0%) | |
| Age (years) | |||
| Mean | 56.38 | 41.83 | |
| St. deviation | 10.75 | 15.14 | |
| Travel distance (km) | |||
| Mean | 5.96 | 4.13 | |
| St. deviation | 5.81 | 4.29 | |
| Average travel speed (km/h) | |||
| Mean | 17.3 | 15.13 | |
| St. deviation | 8.5 | 14.96 | |
| Number of cars in household [-] | |||
| Mean | 1.28 | 1.17 | |
| St. deviation | 0.81 | 0.78 | |
| Number of e-bikes in household [-] | |||
| Mean | 1.38 | 0.12 | |
| St. deviation | 0.65 | 0.45 | |
| Number of regular bikes in household [-] | |||
| Mean | 2.30 | 3.79 | |
| St. deviation | 1.92 | 1.99 | |
Table 4.
Descriptive statistics UT survey data [58], n = 79.
Table 4.
Descriptive statistics UT survey data [58], n = 79.
| Influential Factors on the General Grading of the Solar E-Bike | Mean | Std. Deviation | Minimum | Maximum |
|---|---|---|---|---|
| General grading | 6.84 | 1.13 | 3 | 9 |
| Crosswind hindrance | 2.63 | 0.9 | 1 | 4 |
| Age | 44.48 | 10.59 | 20 | 72 |
| Gender | 1.39 | 0.49 | 1 | 2 |
| Weight | 76.47 | 14.67 | 0 | 108 |
| Length | 177.54 | 9.32 | 160 | 200 |
| Commuting distance | 10.32 | 9.37 | 1 | 56 |
| Amount of exercise per day | 4.25 | 1.14 | 1 | 5 |
| Level of education | 6.29 | 1.36 | 2 | 9 |
| Gross income | 3.89 | 1.04 | 1 | 5 |
| Amount of testing days | 4.94 | 1.58 | 1 | 8 |
| E-bike user | 0.18 | 0.38 | 0 | 1 |
| Flexibility | 3.06 | 0.84 | 1 | 5 |
| Elderly image | 1.89 | 0.86 | 1 | 4 |
| Sportive image | 2.27 | 0.90 | 1 | 4 |
| Trendy and innovative image | 3.73 | 0.92 | 1 | 5 |
| Attractiveness due to theft | 3.19 | 0.99 | 1 | 5 |
| Healthy life style contribution | 3.66 | 0.82 | 1 | 5 |
| Sustainable contribution | 4.04 | 0.67 | 2 | 5 |
| Suitable for commuting | 3.76 | 0.96 | 1 | 5 |
| Suitable for recreation | 3.51 | 0.97 | 1 | 5 |
| Amount of solar e-bike choice preferences (pre) | 2.25 | 2.51 | 0 | 9 |
| Amount of solar e-bike choice preferences (post) | 2.67 | 2.65 | 0 | 9 |
Table 5.
Survey (solar e-bike commuters) and OViN (e-bike commuters) data comparison among Dutch users.
Table 5.
Survey (solar e-bike commuters) and OViN (e-bike commuters) data comparison among Dutch users.
| Data Comparison among Dutch Users | Survey Data (n = 79) | OViN Data (n = 1092) | ||
|---|---|---|---|---|
| Variable | Mean | Std. deviation | Mean | Std. deviation |
| Age (years) | 44.48 | 10.59 | 53.38 | 10.75 |
| Gender (1 = male, 2 = female) | 1.39 | 0.49 | 1.62 | 0.49 |
| Commuting distance (km) | 10.32 | 9.37 | 5.96 | 5.81 |
| Average gross income (€/month) | 2.750 | 1.04 | 3.200 | 1.32 |
© 2018 by the authors. Licensee MDPI, Basel, Switzerland. This article is an open access article distributed under the terms and conditions of the Creative Commons Attribution (CC BY) license (http://creativecommons.org/licenses/by/4.0/).
Share and Cite
MDPI and ACS Style
Apostolou, G.; Reinders, A.; Geurs, K. An Overview of Existing Experiences with Solar-Powered E-Bikes. Energies 2018, 11, 2129. https://doi.org/10.3390/en11082129
AMA Style
Apostolou G, Reinders A, Geurs K. An Overview of Existing Experiences with Solar-Powered E-Bikes. Energies. 2018; 11(8):2129. https://doi.org/10.3390/en11082129
Chicago/Turabian StyleApostolou, Georgia, Angèle Reinders, and Karst Geurs. 2018. "An Overview of Existing Experiences with Solar-Powered E-Bikes" Energies 11, no. 8: 2129. https://doi.org/10.3390/en11082129
Note that from the first issue of 2016, this journal uses article numbers instead of page numbers. See further details here.