Abstract
Microgrids can be used for securing the supply of power during network outages. Underground cabling of distribution networks is another effective but conventional and expensive alternative to enhance the reliability of the power supply. This paper first presents an analysis method for the determination of microgrid power supply adequacy during islanded operation and, second, presents a comparison method for the overall cost calculation of microgrids versus underground cabling. The microgrid power adequacy during a rather long network outage is required in order to indicate high level of reliability of the supply. The overall cost calculation considers the economic benefits and costs incurred, combined for both the distribution network company and the consumer. Whereas the microgrid setup determines the islanded-operation power adequacy and thus the reliability of the supply, the economic feasibility results from the normal operations and services. The methods are illustrated by two typical, and even critical, case studies in rural distribution networks: an electric-heated detached house and a dairy farm. These case studies show that even in the case of a single consumer, a microgrid option could be more economical than network renovation by underground cabling of a branch in order to increase the reliability.
1. Introduction
By definition, a microgrid is a cluster of sources, storage systems, and loads, forming a semi-autonomous, controllable, and flexible small electrical entity at the connection point towards the wider power system [1,2]. The capability to operate at times as an intentionally disconnected island from the rest of the power system was added to the definition of a microgrid only later [3,4]. As a microgrid has a variety of operational functions and technical requirements, microgrid systems are complex [5].
Potential microgrid revenue streams that can offset investment and business-as-usual costs, according to [5], are the following:
- participation in demand response programs;
- export of on-site generation to the electricity grid;
- reduced costs as a result of added resiliency against outages and lost loads;
- participation in local microgrid energy markets.
The profitability possibilities of residential microgrids as an aggregator-based solution to the perspective of different stakeholders, for example, utilities, aggregators, and prosumers, were analyzed in [6]. The feasibility and profitability of microgrids participating in the primary frequency control reserve (FCR) market through an aggregator were assessed in [7]. Furthermore, battery energy storage system (BESS) usage on the frequency regulation market was analyzed in [8].
According to [9], underground cabling of the network is an effective way for distribution system operators (DSOs) to increase the reliability of power supply. However, underground cabling is expensive.
Today, farming is highly automated and electricity-dependent [10], and even short power interruptions are very detrimental. Farming is an energy-intensive industry [11], and thus farmers value the reliability of the electricity supply more so than most of the other customer groups.
Farms are located naturally in rural areas, possibly on the long distribution network radial branches with low electricity customer density. The majority of farmers have backup generators (e.g., [11]). Farmers having their own power production to cover a portion of their electricity need is gaining popularity.
Several recent studies have focused on microgrid islanded-mode operation, microgrid energy management systems, and power supply adequacy and forecasting (e.g., [12,13,14]). The power supply capability in islanded-mode operation was assessed in [12] over a few hours by using a simulation maximum time step of 1 min. Electro-technical aspects of an unexpected microgrid islanded operation were also analyzed in [14] while considering optimal energy management of the microgrid and anticipating an outage at any hour. The impacts of microgrids with renewable generation, particularly on radial lines in distribution networks, have been studied, for example, in [15]. A grid-connected microgrid economic operating strategy was proposed in [16] to minimize the operating cost for the operating period of 24 h ahead.
Characteristics of, for example, the Finnish rural medium voltage (MV) networks, are long distances and low loads, and thus, underground cabling of the overhead line connections to increase reliability is not an economical option as it is for the distribution network development. However, the legislation steers towards underground cabling, and cabling is incentivized by the regulation framework.
The question of which reliability indices the network development actions should be based on is posed in [17]: optimizing the number of faults, the duration of faults, outage costs, or yet some other index. The indices in several Finnish studies considering the economics of cabling and increasing the reliability of the power supply are based on the results and data of a study from 2005 and the regulation model framework (e.g., [17,18,19,20]). The studies evaluate the DSO investment profitability only compared to the outage costs (or cost of energy not supplied (CENS)). Customer-side and possible co-operative technical and shared economic alternatives have not been considered.
Studies have shown other alternatives’ feasibility potential, as opposed to underground cabling, e.g., BESS as a backup to cope with short interruptions of up to a couple of hours [20,21]. The layout principle of the relevant network topology is presented in [21], and the BESS connection topology is presented in [20]. BESS sizing methods in different microgrid applications were reviewed in [22], and an analytical approach at the general level for the sizing of a backup storage unit is presented in [23].
Microgrids have been identified to have several positive impacts on distribution network cost components when using optimal network planning, considering even a substantial microgrid penetration [24]. Furthermore, energy storage in distribution networks can have different benefits for different stakeholders, as reviewed in [24,25].
The legislation and regulations, as subject to changes, are omitted in this study. Compared to network cabling, the primary focus is on using microgrids as a means to increase consumer reliability of the power supply in addition to increasing energy self-sufficiency of the prosumer, possibly benefitting from other revenue streams. The microgrid option, being the overall optimal economic solution, would provide cost reductions for electricity users, the DSO, or both. The incentives and possibilities to invest in microgrids, however, might not be common for all the relevant stakeholders.
This paper presents a cost and performance analysis of microgrids to be enabled up to a few days of islanded operation compared to the underground cabling option as a means to reach a high level of reliability of the power supply. Two case studies of typical and significant rural customers are analyzed for demonstrating the assessment framework and to illustrate the potential economic feasibility of the microgrid option over underground cabling.
Section 2 presents background information for the framework, the assessment method for microgrid power adequacy is presented in Section 3, the economic comparison method is given in Section 4, the case studies’ data is given in Section 5, and the results are presented in Section 6. Finally, the results are discussed in Section 7, and conclusions are provided in Section 8.
2. Distribution Networks, Reliability, and Microgrids—Formation of the Case Studies
General distribution network cabling and reliability issues, particularly in Finland, where the study cases were located, are discussed in Section 2.1; the background for the microgrid cases for the study are given in Section 2.2; and electricity market data are given in Section 2.3, covering general consumer electricity purchases and small-scale producer electricity sales, as well as other possible microgrid income options.
2.1. Distribution Network Reliability and Underground Cabling
The maximum interruption duration to be endured is difficult to determine. The average interruption duration may be only a few hours, but individual interruptions may last for several days. The probability of short interruptions is higher, but long interruptions cause larger damage to consumers. The required BESS backup power supply capacity and related costs depend greatly on the dimensioning interruption duration. A relatively long network outage duration should be considered, and thus up to a few days’ duration is assumed in this study.
Farms, in practice, invest in reserve power generator sets to prepare for outages. A simple generator set with a low investment cost is assumed in this study (see Appendix A).
A DSO considers profitability and costs from its own perspective in accordance with the regulations, and the consumers consider their own finances. In the alternative method presented in this paper, the specific network-cabling-case overall costs are compared in a straightforward manner to the microgrid-option overall costs, combining the costs of the consumer/microgrid owner and the network company. The data used is presented in Appendix A. Cable costs are rough mean costs of the cost data used in the network regulation model in Finland [26].
2.2. Microgrid Case Studies
Small microgrids consisting of a single customer or a few of them most likely will require a BESS and some local electricity production in order to guarantee the reliability of the supply in islanded operation. The more useful functions the microgrid and its components have, the more the profitability of the microgrid increases.
In addition to BESS contributing to secure the power supply during network outages, it would be used for balancing own power production with consumption and would enable handling the microgrid islanded operation electro-technically in a stable manner. Appropriate measures and careful technical planning are required, but the technical and control aspects were not considered in this study.
The selected case studies were (i) a large dairy farm and (ii) a regular-size detached house with electric heating. The case studies reflect well the typical rural-area electricity users and the main customer groups, particularly those with most critical needs of uninterrupted electricity supply within the respective customer groups.
Both case studies included a BESS and photovoltaics (PV) production. In addition, the farm had a micro combined heat and power (micro-CHP) plant operating with wood chips (the technology feasibility of which was already proven). Microgrid data is provided in Appendix A.
2.3. Electricity Market Data
For the electricity consumption, the general electricity cost and distribution fee in Finland were considered. The possible excess power in the microgrid can be sold to the network, and the typical electricity price and power transmission fee for grid-infeed power were considered. The electricity purchase and sales figures presented in Appendix A were roughly estimated on the basis of recent historical prices in Finland. The small-scale production of electricity for one’s own use in Finland is tax-free.
The relevant reserve market and revenue possibility for the microgrid with BESS capacity are on the frequency control reserve for disturbances (FCR-D). Prosumer participation in the reserve market would take place via an aggregator service provider (e.g., as in [6,7]), which would take care of the formalities with a reasonable fee for the services. This fee is expected to be relatively small and thus was omitted in the calculations.
Load response could be an opportunity also for earnings as a system service as well as a means to prioritize produced-electricity own use and minimize the exchange of electricity with the network. Demand response and load control were not considered in this study for simplicity.
3. Electricity Supply Adequacy Assessment in Microgrids during Network Outages
The microgrid electricity supply adequacy was assessed considering a full year from hour to hour. For the assessment, hourly data and simulation were used. Intra-hour variability and control were assumed to be able to be handled with the BESS and other possible microgrid components. Hourly time sampling was needed in order to catch the variability of PV generation and diurnal electricity consumption behavior in addition to seasonal and weekly variations, combined with the requirement of having sufficient electricity supply to meet the consumption at all times during network outages.
The calculation of the power supply adequacy was implemented in a MATLAB (R2016b, MathWorks, Natick, MA, USA) script. The general normal-state analysis is described in Section 3.1, and Section 3.2 describes the subroutine for the islanded-operation calculations.
3.1. Microgrid Operation under Normal State
The principles of the proposed calculation procedure are presented in a flowchart in Figure 1. In order to prepare for an unexpected network outage taking place at any time, a minimum charge in the BESS is maintained. The minimum charge may be, for example, a fixed constant charging level of the BESS throughout the year, dependent on the historical electricity usage or dependent on the time of year. The momentary BESS charge level can be (i) at the minimum charge limit; (ii) below the observation-hour minimum charge limit; (iii) fully charged; or (iv) between the minimum limit and fully charged. Considering the observation-hour electricity consumption and total own power production, the BESS is charged and discharged depending on the status of the BESS and the microgrid electricity deficit or surplus. For simplicity, this is not depicted in the flowchart.
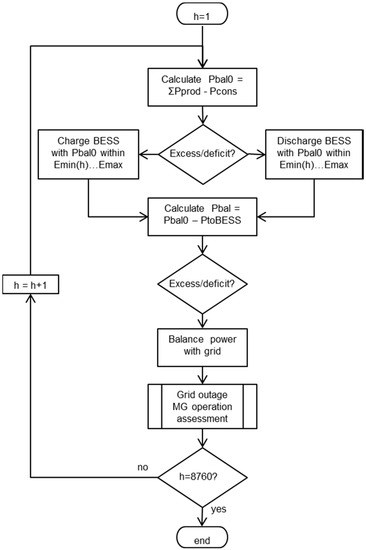
Figure 1.
The procedure used in the MATLAB script for calculating the hourly power balance and power supply adequacy throughout the year in normal operation: h is the hour of the year in the simulation; Pbal0 is the power balance of production and consumption; ∑Pprod is the sum of hourly production; Pcons is the hourly consumption; “excess/deficit” refers to hourly power excess or deficit when considering power production and consumption; Emin and Emax refer to battery energy storage system (BESS) minimum and maximum charge; Pbal is the power balance after considering the discharging/charging of the BESS if possible; PtoBESS represents the electricity stored in the BESS at the hour in question; MG refers to microgrid.
3.2. Microgrid Operation during Network Outage
The microgrid should be prepared for a network outage at all times. The durations of the possible outages are unknown. Comparing the microgrid option (to increase the reliability of the power supply) to the distribution network underground cabling option, the microgrid power supply adequacy should reflect a similar reliability to that of the cabled network. Thus, a few days’ islanded-operation capability was used as the target.
In islanded-mode operation, a micro-CHP plant is assumed to be able to be put in operation within an hour and would be able to produce the maximum electric power during islanded operation.
The microgrid options, by varying different parameters and assumptions used, could be assessed for the duration of power supply adequacy over the whole year, for each hour of the year. Section 3.1 and the flowchart in Figure 1 present the calculations for the normal states and thus the initial situations for the microgrid islanded operation for each hour of the year. The flowchart in Figure 2 presents the calculation procedure (“Grid outage microgrid (MG) operation assessment” subprocedure in Figure 1 flowchart) for the assessment of the microgrid islanded-mode operation and electricity supply adequacy for each respective hour.
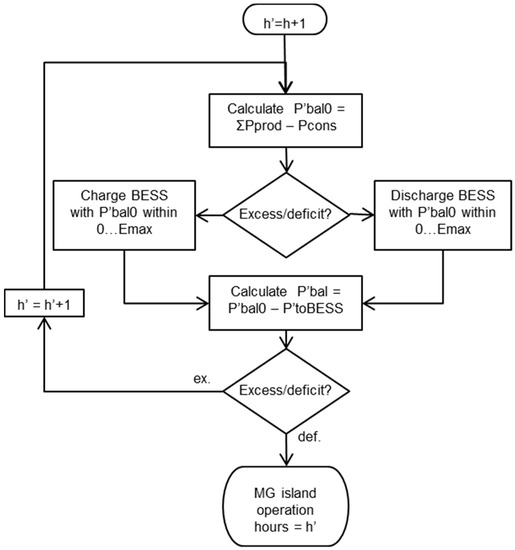
Figure 2.
The MATLAB script subprocedure for calculating the power supply adequacy and maximum duration in islanded operation. Notation’ signifies the variable values in islanded-operation state, where the variable and parameter names are similar to those used in Figure 1 flowchart.
4. Overall Economic Comparison and Economic Influence on Stakeholders
The DSO’s regulated monopoly business is to provide electricity consumers with a sufficiently reliable electricity distribution at a reasonable fee. Network company business should also be profitable for the company owners.
An interest rate of 2% was used. Equivalent annual costs were calculated for all the investments, thus enabling the comparison of costs at an annual level. Value-added tax in Finland applicable for most of the relevant taxed items is 24%. For simplicity, this tax rate was used in the calculations for all the taxed items.
The calculations for the overall economic comparison of the underground cabling and microgrid options are described in Section 4.1. In addition, the cabling-investment and microgrid-option economic influences on the different stakeholders (the network company, the consumer, and the state) are presented in Section 4.2.
4.1. Calculations for the Overall Economic Comparison
The overall economical option is determined by comparing the equivalent annual cabling-option index costs Ccab,ann,TOT and microgrid-option index costs CMG,ann,TOT.
Consumer power purchase from the market and thus the electricity delivered by the network company to the consumer/prosumer affect the network company income from power distribution. As income to the network company, power distribution fee is an expense to the consumer. If considering both in the overall economic calculations, the distribution fee (which could be large) would be cancelled out and would not affect the results. The interest of the consumer is considered more significant, and in this context, the aim should not be to increase the network company income by cabling investments (indirectly through regulation) or prevent a decrease in income over possible consumer benefits. Furthermore, the consumer could become a prosumer regardless of the cabling or other means of securing the power supply, for example, by the microgrid option and BESS. Therefore, “index costs”, omitting the DSO power distribution income in the overall economic calculations, were used for comparative purposes for the two options.
4.1.1. Underground Cabling Option
In the underground cabling option, only the investment cost of the cable and the cable trench were considered, according to the specified price data provided by the Finnish Energy Authority. Other component investments were omitted. In the illustrative farm case study, an investment of a 20 kV cable of 10 km was considered, and in the detached-house case study, an investment of a 0.4 kV low-voltage cable was considered. The cable-investment equivalent annual cost Ccab.inv,ann was calculated.
The consumer costs in the cabling option consisted of the total annual electricity costs Ccons.cab, including the energy purchase from the market and power distribution fee. In addition, a consumer investment cost, Cgs.inv,ann, of the mandatory generator set for reserve power during outages was considered in the farm case study. The expenses of the possible use of this generator set were omitted.
Thus, the total index costs of the cabling option for the comparison were
4.1.2. Microgrid Option
The microgrid-option costs consisted of the investment costs of the BESS (CBESS.inv,ann), PV (CPV.inv,ann), and CHP power plant (CCHP.inv,ann) as the appropriate share of the total plant investment of electricity production (electricity production capacity per total electricity and heat production capacity), all expressed as equivalent annual costs. Other costs consisted of annual maintenance with CHP-plant fuel-related expenses (Cmaint) and electricity purchase cost (Ccons,MG), including energy and power distribution fees. The possible prosumer income from surplus electricity sales (Yprod, with transmission fees subtracted) and system services (Yserv) were also considered in the cost calculation.
The total index costs of the microgrid option for the comparison were
4.2. Economic Influence on the Relevant Stakeholders
The underground cabling and microgrid options may have different influences on the different stakeholders. The same calculation data as in Section 4.1 was used for the assessment of the economic influences of the two options on different stakeholders, DSO, consumer/prosumer, and the state.
4.2.1. Distribution System Operator
A rough assessment of direct economic influences of the cabling and microgrid options on the DSO income were calculated as
where Ydist.fee,cab and Ydist.fee,MG are the distribution net incomes of the power supplied to the customer in the cabling and microgrid options, respectively, and Ytrans.fee,MG is the power transmission net income of the microgrid power fed to the grid.
4.2.2. Consumers/Prosumers
All the microgrid investments and costs were assumed to be covered by the consumer/prosumer. The economic influence of the cabling and microgrid options for the consumer/prosumer as costs were thus
4.2.3. State
The economic influences of the alternative options on the state tax income may be relevant for consideration. Very rough estimates were calculated for the assessment of the comparison of the state tax income level in the cabling and microgrid options in order to obtain an indication of possible significant differences. The calculations were made with total component investment costs C and lifetimes L:
where s represents value-added tax; tel represents the electricity tax; and Ecab and EMG represent the electricity bought from the grid in the cabling and microgrid cases, respectively.
5. Microgrid Data and Specifics for the Case Studies
The case study loads are described in Section 5.1, the BESS units are described in Section 5.2, PV production is described in Section 5.3, and the CHP power plant is described in Section 5.4. The technical and economic data specifics and parameter values for the case studies are presented in Appendix A.
5.1. Electricity Consumption
A predetermined hourly data series of electricity consumption was used. The consumption was considered independent from the microgrid operating-state network-connected or islanded operation. Load was not controlled in order to obtain longer islanded-operation capability, nor to minimize power exchange with the network in normal state.
In addition to electric heating, the detached house had a fireplace for heating. Thus, it was a house rather typical of rural areas in Finland with a high electricity consumption of approximately 14 MWh/a. Actual historical electricity consumption data series of a consumer was used.
The dairy farm case included about 180 cows and a corresponding electricity consumption of approximately 261 MWh/a. The farm data series was created on the basis of data from similar-size farms. The daily consumption profile was based on diurnal consumption data of a large cowhouse on a winter day, and the variation from day to day throughout the year was approximated by creating sliding data series on the basis of monthly electricity consumption. The dataset was then suitably scaled for the specified annual consumption (see the supplementary material).
5.2. BESS Units
Despite the significant difference in annual electricity consumption, both case studies were assumed to have identical BESS units because of the backup power supply needed during long network outages.
The calculations presented in this paper were made without considering a decrease in electric capability of the BESS units over time. The data was estimated on the basis of the recent global BESS market trends, but the investment costs may easily change. In addition, the cost range of prices used in different studies is rather broad (e.g., [20,21]).
Different BESS minimum charge principles were determined for the case studies. In the farm case, the minimum charge was predetermined as a function of the electricity consumption, ranging from 50% of Emax,BESS to Emax,BESS. The hourly minimum was determined by a scaling coefficient calculated as a sliding average of the electricity consumption of the previous 24 h.
For the detached house, the BESS minimum charge was predetermined by assessing the consumption and production data. During high consumption and low PV production in winter months, December and January, the limit was set to Emax,BESS, and it was set to 75% of Emax,BESS during the low consumption and high PV production in the summer time, approximately from March to October. For the other times, the limit was determined by linear interpolation between 75% and 100% of Emax,BESS.
In normal operation, the BESS charging level was at least the minimum charge at all times, that is, at least 50% in the farm case and 75% of Emax,BESS in the detached-house case. Thus, a relatively large amount of energy was stored in the BESS, and it would be able to provide nominal power easily for a short period of time (from seconds to minutes) without discharging a significant portion of energy. Therefore, the BESS minimum charge was considered to be sold as FCR-D on an annual agreement. In the case studies, the BESS was charged to at least the specified minimum charge level 100% of the time (excluding possible network outage and post-outage periods). There may be times when the BESS charge is unavailable or is fully needed for the preparation of islanded operation, and thus the BESS capacity was assumed to be sold to the FCR-D market at only 7000 h/a in the study cases. The possible income for activated FCR-D capacity was not taken into account in the calculations.
5.3. PV Production
An hourly PV production data series was created for a specific location (in Finland) on the basis of the Modern-Era Retrospective analysis for Research and Applications, Version 2 (MERRA-2) time series data on radiation [27] and air temperature [28]. The daily average radiation and temperature were scaled to match monthly values from the Photovoltaic Geographical Information System (PVGIS) database [29,30]. PV panel generation (in per units) was calculated considering location and temperature, and selected panel tilt was given by the PVGIS “optimal inclination angle”. The PV generation data series (see the supplementary material) was then scaled appropriately for the selected PV capacity in the case study. The same per-unit dataset was used for both the detached house and the farm.
5.4. Micro-CHP Production
Gasification-based CHP power plants have a cold start time of less than an hour and a controllability of 1 kW/s. Furthermore, a wood-chip-fueled CHP plant can be controlled, whereas its optimal production level and electricity production depend also on heat demand.
For this case study—combined with substantial PV production and BESS—the CHP plant was offline during the warm and sunny summer period. At other times, its production was scaled according to predetermined data series on the basis of the annual total production of 150 MWh and a scaling coefficient. The coefficient was determined for each hour as a sliding average of the electricity consumption of the previous 24 h.
In the case of network outage occurring and the CHP plant being offline, the CHP plant was assumed to be started within one hour to support the microgrid islanded-operation power supply.
6. Case Study Results
The assessment of the microgrid configuration for acceptable reliability of the power supply was made on the basis of the procedure described in Section 3, and the results are presented here in Section 6.1. The calculations for the economic comparison of the microgrid and underground cabling option were made in accordance with Section 4.1, and the influences on different stakeholders were assessed on the basis in Section 4.2. All economic calculation results are presented in Section 6.2.
6.1. Analysis of Reliability of Power Supply
With the specified and adjusted assumptions and data, the microgrid electricity consumption and electricity production hourly data curves for the whole year are presented in Figure 3a, the BESS charging level is presented in Figure 3c, and the power feed to and intake from the network are presented in Figure 3e for the farm case. The corresponding data for the detached-house case are presented in Figure 3b,d,f, respectively. The total consumption and power production of the case-study microgrids are presented in Table 1.
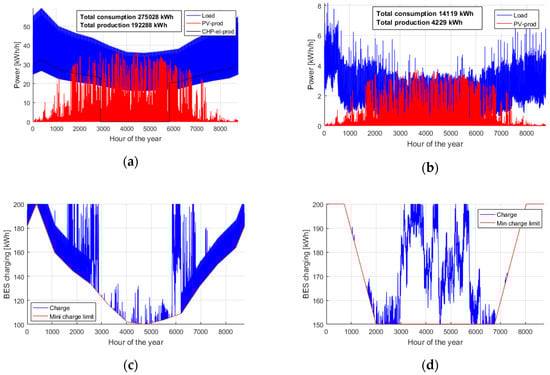
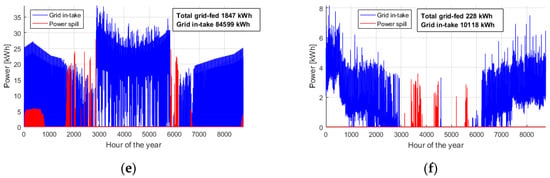
Figure 3.
Farm and detached-house case studies’ hourly input and resultant data series for the study year: electricity consumption and production for (a) farm, and (b) detached house; battery energy storage system (BESS) charging level between dynamic minimum charge level and Pn for (c) farm, and (d) detached house; electricity taken from and fed to the grid for (e) farm, and (f) detached house.

Table 1.
Microgrid consumption and production in the case studies.
The analysis of the islanded operation throughout the year for each hour indicated that the microgrid electricity supply would be sufficient during an interruption at a minimum of 58 h in the farm case and 41 h in the detached-house case. The islanded-operation capability incidents were binned on the basis of the duration of the adequate power supply. The numbers of occurrences with the shortest durations are presented in Table 2. For the rest of the hours of the year, the power adequacy was sufficient for more than 3 days.
Table 2.
Case-study microgrid islanded operation with adequate power supply if less than 3 days.
6.2. Calculations for Economic Comparison
The total equivalent annual costs for the cabling and microgrid options were calculated using Equations (1) and (2). In addition, the economic influences of the options on each stakeholder were assessed individually using Equations (3)–(5). The case study results are presented and compared in Figure 4.
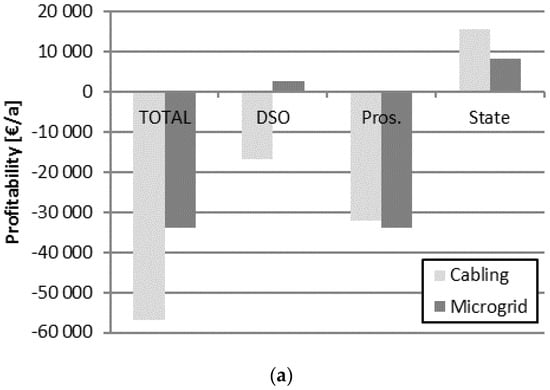
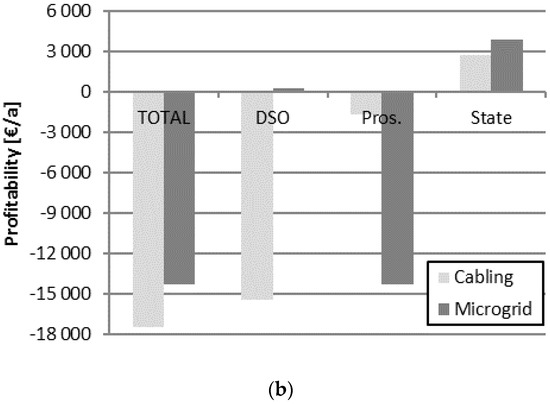
Figure 4.
Cabling- and microgrid-option total costs and economic influence on the distribution system operator (DSO), consumers/prosumers, and the state in (a) the farm case study, and (b) detached-house case study.
7. Discussion
A number of assumptions were considered, particularly regarding the calculation of the economic comparison between the microgrid option and the distinct underground cabling investment option. The results provide insight for further studies and an indication of the effects.
The two case studies were a single-consumer detached house and a farm. Despite an almost 20-fold difference in electricity consumption and own PV production of appropriate capacity, both prosumers required an identical BESS capacity in order to be able to reach approximately the same sufficiently high level of reliability of the power supply in case of network outages. This result implies that own variable production combined with storage may not be a sufficient or profitable solution to guarantee the reliability of the supply in the case of long network outages.
In the farm case study, the total costs of the microgrid option were significantly less than in the cabling option; thus favoring the microgrid as a means to cope with the reliability of power supply instead of cabling. Most of the costs would be covered by the prosumer. In addition, the microgrid option—with the given assumptions—would be slightly more expensive for the prosumer. The DSO’s income was negative in the cabling case but positive in the microgrid case. Thus, the benefits and the costs could be shared between the DSO and the prosumer. In the case of the microgrid option, the state tax income was somewhat less than in the cabling option in the reasonable case of the farm.
The total costs in the detached-house case also indicated the microgrid option to be more economic. However, the costs would be practically totally covered by the prosumer, and the BESS investment was extremely expensive compared to the prosumer annual costs in the cabling alternative. Thus, this option is not feasible as is.
8. Conclusions
Microgrids in rural areas could be an economic alternative to underground cabling in specific cases. Underground cabling being costly to the DSO, the microgrid BESS could be partially or fully invested in by the DSO in order to make the microgrid option profitable to consumers as well as the DSO.
Furthermore, combining controllable generation into a microgrid in addition to weather-dependent generation results in a more feasible solution and enables a reasonable duration of islanded operation.
The microgrid option would be a solution based on a willingness and common understanding between the DSO and the consumers, among the relevant stakeholders, and is a question of shared benefit that also depends on the network company regulation model and its development.
Supplementary Materials
The created farm consumption data and per-unit PV data series are available from Zenodo at https://zenodo.org/record/1294967 in files Farm_load_kW_data.txt and PV_pu_data.txt.
Author Contributions
The literature review, modeling, simulations, and analysis were done by S.U.; E.R. created the PV dataset and provided the relevant description for the manuscript; S.U. prepared the manuscript; J.S. contributed to the revision of the manuscript, particularly to the reliability issues.
Funding
This research was funded by the Strategic Research Council at the Academy of Finland, under the project “Transition to a resource efficient and climate neutral electricity system” (EL-TRAN) Grant No. 293437.
Acknowledgments
The contribution of our colleague Kim Forssén is very much appreciated for his efforts in collecting information and data for the case studies. The authors thank our colleague Riku Pasonen for the load data of a detached house and Jari Ihonen for the advice on possibilities to increase BESS profitability. In addition, we owe gratitude to Jukka Konttinen and his team at Tampere University of Technology for information and advice regarding micro-CHP power plants and Tapani Jokiniemi from Helsinki University for the efforts in providing data of large farms. Furthermore, background information provided by farmers for this study is greatly appreciated.
Conflicts of Interest
The authors declare no conflict of interest. The funders had no role in the design of the study; in the collection, analyses, or interpretation of data; in the writing of the manuscript; or in the decision to publish the results.
Appendix A
Table A1.
Cabling-option case study data assumptions.
Table A1.
Cabling-option case study data assumptions.
| Mandatory Farm Gen-Set: | ||
|---|---|---|
| Cinv,gs | Investment cost for mandatory gen-set | 4000 € |
| Lgs | Expected lifetime/investment period | 10 a |
| Cable Investment Data: | ||
| Cinv,cab | Investment cost for MV (20 kV) cable 1 | 55,000 €/km |
| Cinv,cab | Investment cost for LV (0.4 kV) cable 1 | 35,000 €/km |
| xcab | Cable length used in the investment | 10 km |
| Lcab | Expected lifetime/investment period | 40 a |
1 Excluding tax.
Table A2.
Microgrid-option case study data assumptions.
Table A2.
Microgrid-option case study data assumptions.
| PV: | ||
|---|---|---|
| PPV,f | Farm PV rated power | 50 kWp |
| PPV,h | Detached-house PV rated power | 5 kWp |
| LPV | Expected lifetime/investment period | 30 a |
| Cinv,PV,f | Investment cost for 50 kWp PV (10–250 kW cost level) | 60,000 € |
| Cinv,PV,h | Investment cost for 5 kWp PV (few kW cost level) | 10,000 € |
| CHP: | ||
| PCHP,el | CHP rated electrical power | 40 kW |
| (PCHP,TOT: 140 kW; PCHP,heat: 100 kW) | ||
| ECHP,ann | Annual electricity produced in the study year | 150 MWh/a |
| CHP power plant investment cost | 400,000 € | |
| Cinv,CHP | Electricity share of CHP plant investment cost | 114,285 € |
| LCHP | Expected lifetime/investment period | 30 a |
| Cfuel | Approximated annual cost for fuel (wood chips) | 2800 € |
| Cmaint | Estimate for other annual maintenance costs | 1000 € |
| BESS: | ||
| Pmax,BESS | Maximum power for charging/discharging | 100 kW |
| Emax, BESS | Maximum/nominal charge | 200 kWh |
| LBESS | Expected lifetime/investment period | 10 a |
| Cinv,BESS | Investment cost for the BES (100 kW; 200 kWh) | 144,000 € |
| FCR-D Reserve Market Data for the Study Cases: | ||
| pFCR-D | FCR-D reserve capacity market price for annual agreements in 2017 | 4.7 €/MW,h |
| PBES,FCR-D | BES capacity available to FCR-D reserve market | 100 kW |
| TBES,FCR-D | Availability of BES for FCR-D reserve market | 7000 h |
Table A3.
Electricity market and other economics data assumptions.
Table A3.
Electricity market and other economics data assumptions.
| Retail Electricity Costs: | ||
|---|---|---|
| Cel.ret | Retail electricity price for consumer | 0.05 €/kWh |
| Cel.trans | Electricity distribution price for consumer | 0.065 €/kWh |
| Cel.sold | Price paid for sold electricity for prosumer | 0.027 €/kWh |
| Cel.s.tr | Electricity transmission price for prosumer | 0.0007 €/kWh |
| tel | Electricity tax (included in electricity distribution fee) | 0.02253 €/kWh |
| Economics Calculation Parameters: | ||
| r | Interest rate | 2% |
| s | Value-added tax | 24% |
References
- Marnay, C.; Robipalatio, F.J.; Siddiqui, A.S. Shape of the microgrid. In Proceedings of the 2001 IEEE Power Engineering Society Winter Meeting (Conference Proceedings (Cat. No. 01CH37194)), Columbus, OH, USA, 28 January–1 February 2001; Volume 1, pp. 150–153. [Google Scholar]
- Lasseter, B. Microgrids. In Proceedings of the Power Engineering Society Winter Meeting, Columbus, OH, USA, 28 January–1 February 2001; IEEE: Piscataway, NJ, USA, 2001; Volume 1, pp. 146–149. [Google Scholar]
- Dimeas, A.L.; Hatziargyriou, N.D. A Multiagent System for Microgrids. In Proceedings of the 13th International Conference on, Intelligent Systems Application to Power Systems, Samos, Greece, 5–8 May 2004; Volume 2, pp. 396–401. [Google Scholar]
- Lasseter, R.H.; Paigi, P. Microgrid: A Conceptual Solution. In Proceedings of the 35th Annual IEEE Power Electronics Specialists Conference, Aachen, Germany, 20–25 June 2004; pp. 4285–4290. [Google Scholar] [CrossRef]
- Stadler, M.; Cardoso, G.; Mashayekh, S.; Forget, T.; DeForest, N.; Agarwal, A.; Schönbein, A. Value streams in microgrids: A literature review. Appl. Energy 2016, 162, 980–989. [Google Scholar] [CrossRef]
- Vatanparvar, K.; Al Faruque, M.A. Design Space Exploration for the Profitability of a Rule-Based Aggregator Business Model within a Residential Microgrid. IEEE Trans. Smart Grid 2015, 6, 1167–1175. [Google Scholar] [CrossRef]
- Yuen, C.; Oudalov, A.; Timbus, A. The Provision of Frequency Control Reserves from Multiple Microgrids. IEEE Trans. Ind. Electron. 2011, 58, 173–183. [Google Scholar] [CrossRef]
- Avendano-Mora, M.; Camm, E.H. Financial Assessment of Battery Energy Storage Systems for Frequency Regulation Service. In Proceedings of the 2015 IEEE Power & Energy Society General Meeting, Denver, CO, USA, 26–30 July 2015; pp. 1–5. [Google Scholar] [CrossRef]
- Haakana, J. Impact of Reliability of Supply on Long-Term Development Approaches to Electricity Distribution Networks. Ph.D. Thesis, Lappeenranta University of Technology, Lappeenranta, Finland, 2013. [Google Scholar]
- Ahokas, J. Maatilojen Energiankäyttö. Enpos-Hankkeen Tulokset (In Finnish, Energy Use on Farms. Results of Enpos Project). 2013. Available online: https://helda.helsinki.fi/bitstream/handle/10138/40241/energian_sst.pdf?sequence=1 (accessed on 25 July 2018).
- Meta Economics Consulting Group Pty Ltd. Electricity Supply Issues for Farmers; Meta Economics Consulting Group Pty Ltd.: Newcastle, Australia, 2013. Available online: https://energyconsumersaustralia.worldsecuresystems.com/grants/442/AP-442-Meta-Economics-Farmers-electricity-supply-report.pdf (accessed on 25 July 2018).
- Oliveira, D.Q.; Zambroni de Souza, A.C.; Santos, M.V.; Almeida, A.B.; Lopes, B.I.L.; Saavedra, O.R. A fuzzy-based approach for microgrids islanded operation. Electr. Power Syst. Res. 2017, 149, 178–189. [Google Scholar] [CrossRef]
- Liu, G.; Starke, M.; Xiao, B.; Zhang, X.; Tomsovic, K. Microgrid optimal scheduling with chance-constrained islanding capability. Electr. Power Syst. Res. 2017, 145, 197–206. [Google Scholar] [CrossRef]
- Vergara, P.P.; López, J.C.; Silva, L.C.P.; Rider, M.J. Security-constrained optimal energy management system for three-phase residential microgrids. Electr. Power Syst. Res. 2017, 146, 371–382. [Google Scholar] [CrossRef]
- Zehir, M.A.; Batman, A.; Sonmez, M.A.; Font, A.; Tsiamitros, D.; Stimoniaris, D.; Kollatou, T.; Bagriyanik, M.; Ozdemir, A.; Dialynas, E. Impacts of microgrids with renewables on secondary distribution networks. Appl. Energy 2017, 201, 308–319. [Google Scholar] [CrossRef]
- El-Hendawi, M.; Gabbar, H.A.; El-Saady, G.; Ibrahim, E.N.A. Control and EMS of a grid-connected microgrid with economical analysis. Energies 2018, 11, 129. [Google Scholar] [CrossRef]
- Haakana, J.; Lassila, J.; Kaipia, T.; Partanen, J. Comparison of Reliability Indices from the Perspective of Network Automation Devices. IEEE Trans. Power Deliv. 2010, 25, 1547–1555. [Google Scholar] [CrossRef]
- Verho, P.; Mäkinen, A.; Kivikko, K.; Repo, S.; Lassila, J.; Partanen, J.; Pylvänäinen, J. Visionary development of distribution networks. In Proceedings of the 19th International Conference on Electricity Distribution, Vienna, Austria, 21–24 May 2007; Volume 4. [Google Scholar]
- Antikainen, J.; Repo, S.; Järventausta, P.; Verho, P. Interruption Costs Management in Distribution Network by Intentional Islanding Based on Mobile Stand-by Generation Units. In Proceedings of the 8th Nordic Electricity Distribution and Asset Management Conference (NORDAC 2008), Bergen, Norway, 8–9 September 2008. [Google Scholar]
- Vilppo, O.; Markkula, J.; Järventausta, P.; Repo, S.; Hakala, T. Cost-benefit analysis for using the Li-ion batteries in low-voltage network for decreasing the outage time experienced by customers. In Processed of the CIRED 24st International Conference on Electricity Distribution, Glasgow, Scotland, 12–15 June 2017; IEEE: Piscataway, NJ, USA, 2017. [Google Scholar]
- Haakana, J.; Lassila, J.; Kaipia, T.; Partanen, J. Utilisation of energy storages to secure electricity supply in electricity distribution networks. In Proceedings of the 22nd International Conference on Electric Distribution, CIRED, Stockholm, Sweden, 10–13 June 2013; pp. 1–4. [Google Scholar] [CrossRef]
- Alsaidan, I.; Alanazi, A.; Gao, W.; Wu, H.; Khodaei, A. State-Of-The-Art in Microgrid-Integrated Distributed Energy Storage Sizing. Energies 2017, 10, 1421. [Google Scholar] [CrossRef]
- Mitra, J. Reliability-based sizing of backup storage. IEEE Trans. Power Syst. 2010, 25, 1198–1199. [Google Scholar] [CrossRef]
- Millar, R.J.; Kazemi, S.; Lehtonen, M.; Saarijärvi, E. Impact of MV Connected Microgrids on MV Distribution Planning. IEEE Trans. Smart Grid 2012, 3, 2100–2108. [Google Scholar] [CrossRef]
- Zidar, M.; Georgilakis, P.S.; Hatziargyriou, N.D.; Capuder, T.; Škrlec, D. Review of energy storage allocation in power distribution networks: Applications, methods and future research. IET Gener. Trans. Distrib. 2016, 10, 645–652. [Google Scholar] [CrossRef]
- Energiavirasto. Päätös xxx/430/2015, Liite 2: Sähkön Jakeluverkkotoiminta ja Sähkön Suurjännitteinen Jakeluverkkotoiminta—Valvontamenetelmät neljännellä 1.1.2016-31.12.2019 ja Viidennellä 1.1.2020-31.12.2023 Valvontajaksolla; Energiavirasto: Helsinki, Finland, 2015; p. 120. Available online: www.energiavirasto.fi (accessed on 25 July 2018).
- Global Modeling and Assimilation Office (GMAO). MERRA-2 tavg1_2d_rad_Nx: 2d,1-Hourly, Time-Averaged, Single-Level, Assimilation, Radiation Diagnostics V5.12.4; Goddard Earth Sciences Data and Information Services Center (GES DISC): Greenbelt, MD, USA, 2015. [Google Scholar]
- Global Modeling and Assimilation Office (GMAO). MERRA-2 tavg1_2d_flx_Nx: 2d,1-Hourly, Time-Averaged, Single-Level, Assimilation, Surface Flux Diagnostics V5.12.4; Goddard Earth Sciences Data and Information Services Center (GES DISC): Greenbelt, MD, USA, 2015. [Google Scholar]
- Huld, T.; Müller, R.; Gambardella, A. A new solar radition database for estimating PV performance in Europe and Africa. Sol. Energy 2012, 86, 1803–1815. [Google Scholar] [CrossRef]
- European Communities. PVGIS Interactive Application. Available online: http://re.jrc.ec.europa.eu/pvgis/apps4/pvest.php# (accessed on 25 July 2018).
© 2018 by the authors. Licensee MDPI, Basel, Switzerland. This article is an open access article distributed under the terms and conditions of the Creative Commons Attribution (CC BY) license (http://creativecommons.org/licenses/by/4.0/).