Experimental and Numerical Study of an Electrical Thermal Storage Device for Space Heating


1
State Key Laboratory of Advanced Power Transmission Technology, Global Energy Interconnection Research Institute Co., Ltd., Changping District, Beijing 102211, China
2
Key Laboratory of Condition Monitoring and Control for Power Plant Equipment of MOE, School of Energy Power and Mechanical Engineering, North China Electric Power University, Beijing 102206, China
*
Author to whom correspondence should be addressed.
Energies 2018, 11(9), 2180; https://doi.org/10.3390/en11092180
Submission received: 6 July 2018
/
Revised: 14 August 2018
/
Accepted: 15 August 2018
/
Published: 21 August 2018
(This article belongs to the Section D: Energy Storage and Application)
Abstract
:An electrical thermal storage (ETS) device for space heating is designed in this study. The proposed device is charged by the off-peak electricity and releases its thermal energy to warm the space all day long. The natural convection occurring in the flow channel drives the flowing of air to be heated up and warm the space. The dynamic process of a fully charging/discharging cycle of the device is tested. Meanwhile, a three-dimensional model is developed to simulate the transient thermal behavior. It is found that the experimental and numerical results agree with each other which indicates the validation of the proposed numerical model. The results show that the temperatures of the bricks and the outlet air can be as high as 1002 K and 835 K, respectively. The natural convection occurring in the flow channel transfers 40.4% of the total electrical heating energy to the space for the charging process and 26.9% for the discharging process. Heat losses to the space through the adiabatic material shares 13.3% of the total heating energy for the charging process and 7.2% for the discharging process. Based on those findings, three methods are recommended to improve the device in the successive research.
1. Introduction
Recently, using electrical power for space heating in winter is strongly encouraged by Chinese government [1,2]. One reason is that electricity, instead of coal combustion, can greatly reduce the emitted pollution gases and thus relieve the “fog-haze” in central and north China [3]. The other reason is to decrease the heavy wind and photo-voltage energy curtailment in northern China by increasing the electrical demand at night. In this context, the State Grid Corporation of China (SGCC), the biggest Chinese company in the construction and operation of the power grids, actively promotes the electrical space heating [4]. One of the effort is to develop an ETS device for space heating.
The history of ETS can be tracked back to the air-raid shelter in UK during the World War Two and then the electrical space heating in USA during the oil-crisis of 1970s [5,6]. Thereafter, decreasing the peak load demand for the grids and reducing the cost of space heating for the residential sector drive the development of ETS. A typical ETS device contains heating elements, thermal energy storage medium, a fan and an auxiliary circuit [7]. The ceramic brick (magnetite or olivine) is the most used storage medium, which can be heated up to 800 °C by the electrical heating element [7,8]. During the off-peak hours, usually 11:00 PM to 7:00 AM, when the electrical rate is much lower than the peak rate, the heating elements directly heat the dense bricks up to a very high temperature. During the peak period (7:00 AM to 11:00 PM), the heating elements are powered off and the ETS continues warming the space by releasing its thermal energy stored in the storage medium. Generally, the storage capacity of a single ETS device ranges from 13.5 kWh to 40.5 kWh with 80–240 kg bricks [9].
In the last two decades, many research on ETS have been focused on the system simulation and the operating strategies. Bedouani et al. [10] used TRNSYS (v14.2) to simulate a multi-zone building equipped with a central ETS, in which hourly weather data were inputted to describe the energy flow under different heating system designs and control strategies. Bedouani et al. [11] then studied the techno-economic feasibility of the central ETS system for the residential sector in Quebec Canada. They concluded that such ETS system is economic unless the hourly based differential rates are in effect. Molina et al. [12,13] developed dynamic models to evaluate the peak load management performance of ETS devices. In those models, the thermal performance of all the bricks were represented by their average temperature that was calculated based on the energy balance. Ali et al. [14] used a linear programming method to optimize the control of partial storage electrical space heating based on the dynamic prices. The results showed that 46% cost saving can be achieved by using optimal demand response control. Patrick et al. [15] developed an ETS-EMS model to study the effect of the ETS systems on the operation of the Northern Communities’ microgrids in Germany. It was found that the ETS can reduce the operating costs up to 23% and allow a higher penetration of wind and solar sources.
The storage material of all the above mentioned ETS systems uses the sensible heat of the storage medium to store thermal energy. Compared to the sensible heat storage, the ETS device using phase change material (PCM) can achieve a higher thermal storage density and thus a more compact design by using latent heat. Therefore, the ETS system with PCM has drawn attention. Dolado et al. [16] developed an electrical heating thermal storage system using PCM, where the PCM was charged by hot air coming from an independent electrical resistance heater. A one-dimensional numerical model was built to analyze the melting (charging process) and the solidification (discharging process) of the thermal energy storage. The results showed that the numerical model can predict the charging and discharging process with an error less than 12%. Stathopoulos et al. [17] designed and tested an air-PCM heat exchanger composed of 16 aluminum plates containing paraffin for an ETS system. During the charging process, the exchanger stores the thermal energy carrying by hot air that is heated up by an independent electrical heater. During the discharging process, the exchanger warms the cold air for the building ventilation system. A two-dimensional model was developed based on the energy balance and the apparent heat capacity method. The validation presented that the proposed model can well predict the behavior of the heat exchanger. Li et al. [18] tested the charging behavior of an ETS device using a high temperature composite phase change material with a phase change temperature of 650 °C. The heating elements were inserted into the air flow channel and heated the bricks through convection and irradiation. The results showed that the average temperature of the bricks and the outlet air temperature were 960 and 560 K, respectively, after eight hours’ charging.
In this study, an ETS device with PCM is fabricated. Different from the above reported designs, the proposed ETS device uses natural convection to drive the flowing of air through the flow channel. In addition, a special brick, which is a form-stable high temperature phase change material, is used as the thermal energy storage medium. All the bricks are divided into two parallel rows and the gap between those two rows is the air flow channel where the heating elements are inserted. The dynamic process of a fully charging/discharging cycle of the ETS device is tested. Furthermore, a transient three-dimensional numerical model is developed to simulate the heat and mass transfer of the above-mentioned charging and discharging processes. Finally, the transient thermal behavior and the energy analysis of the ETS device are discussed in detail.
2. Experiment Setup
The present ETS device consists of two electrical heating elements and twelve bricks. As shown in Figure 1a, these bricks are stacked into two parallel rows and each row has a height of three bricks and a length of two bricks. By adding adiabatic material, the gap between those two rows is divided into two independent channels where electrical heating elements are inserted. Except for the inlet and outlet of the flow channels, these bricks are wrapped by rock wool as the adiabatic material, which is not shown in Figure 1a. Figure 1b shows the appearance of the whole ETS device, which is enveloped in a metal casing. Figure 1c shows the configuration of the tested ETS device where the auxiliary circuit is set at the left side and the metal casing is removed.
The thermal properties of the self-made form-stable composite phase change bricks are listed in Table 1. The geometric dimension of each brick is 237 mm (length) × 115 mm (width) × 53 mm (thickness). The gap distance of the flow channel is 15 mm. The thickness of the surrounding adiabatic material is 30 mm of the four lateral surfaces and 20 mm of the bottom and top surfaces.
The operating principle of the proposed ETS device is described as follows.
- (1)
- Charging process. During the off-peak period, the electrical heating elements are powered on to heat up the bricks. Simultaneously, due to the temperature difference between these two flow channels and the outside space, the resulting natural convection drives the air flowing upward through the channels to be heated up by the heating elements. Then, the hot air flows out from the channels and warms the space.
- (2)
- Discharging process. During the peak period at the daytime, the heating elements are powered off. Then, the hot bricks release their thermal energy to heat the continuously flowing air, which is still driven by the natural convection in the flow channel. Therefore, the space keeps warm by the hot air.
It should be noted that the convective and radiative heat losses transferring through the adiabatic material and the metal casing also warm the space in both the charging and discharging processes.
The test is performed in a lab of the Global Energy Interconnection Research Institute Co. Ltd. in Beijing. Several K-type Omega thermocouples are inserted into the bricks to measure the temperatures. Another two thermocouples are set at the outlet of the flow channel to get the outlet air temperature and at the outside of the ETS device to get the ambient temperature, respectively. A data acquisition system is used to collect all the measured data. Before the test, the whole device was fully cooled down to the ambient temperature. At the time t = 0, the electrical heating elements are powered on and the charging process begins. Eight hours later, the electrical heating elements are powered off and the following discharging process lasts for 16 h.
3. Numerical Approach
3.1. Governing Equations
Due to the structure symmetry, half of the inner structure with one air flow channel is used as the physical model for the presented numerical analysis. The physical model can be divided into two zones: the fluid zone for air flow channel and the solid zone for the bricks and the adiabatic material.
3.1.1. Fluid Zone
According to the complex structure, the flow in the fluid zone is assumed to be turbulent and compressible. The governing equations for air are described as follows.
The continuity equation:
The momentum equation:
The energy equation:
3.1.2. Solid Zone
The energy equation for solid zone is expressed as follow:
The equivalent heat capacity method is used to treat the latent heat during the phase change of the brick [19]. Thus, the heat capacity of the brick can be expressed as:
where ∆T is 3 K in the present study.
3.2. Radiation Model
The Surface-to-Surface radiation model is used to calculate the exchange of the thermal radiation between the electrical heating element and the bricks [20]. In the Surface-to-Surface model, the scattering, emission and absorption in air are neglected. The radiative heat flux leaving from a given surface i is:
where εi is the emissivity and σ is the Stefan-Boltzmann constant. The incident heat flux can be calculated by summarizing the energy flux leaving all other surfaces:
where Ai and Aj are the area of surfaces i and j, respectively and Fji is the view factor between surfaces j and i. According to the view factor reciprocity relationship , Equation (6) can be rewritten as:
Therefore:
For all the surfaces, Equation (9) can be expressed as matrix form.
where F is a N × N matrix, is the radiosity vector and is the emissive power vector.
3.3. Boundary Conditions
The adiabatic material that warped the physical model (not shown in Figure 1a) is considerate by an equivalent thermal resistance. The thickness of the metal casing is neglected. The outer surfaces of the adiabatic material are treated as a combined natural convection and radiation boundary, where the heat transfer coefficient of the natural convection is assumed to be 5 W m−2 K−1 and the external emissivity of those surfaces is 0.9 with an external temperature of 299 K.
The power of a single electrical heating element is 800 W. The surface of electrical heating element is treated as a heat flux boundary, where the heat flux can be calculated from dividing the electrical power by the surface area. During the test, the measured ambient temperature is about 299 K because an air condition keeps working to control the space temperature. The outlet of the flow channel is treated as a pressure outlet boundary. The interfaces between air and bricks and between air and adiabatic material satisfy the requirements of temperature and energy equivalences. The inlet of the channel is a mass flow rate boundary with a temperature of 299 K. With the aid of the theory model presented in Chen et al. [21] and Peppes et al. [22], the mass flow rate of air flowing through a channel driving by the natural convection can be calculated by:
where α is the velocity coefficient, H is the characteristic length, Thot is the characteristic temperature of the flow channel and Tam is the ambient temperature.
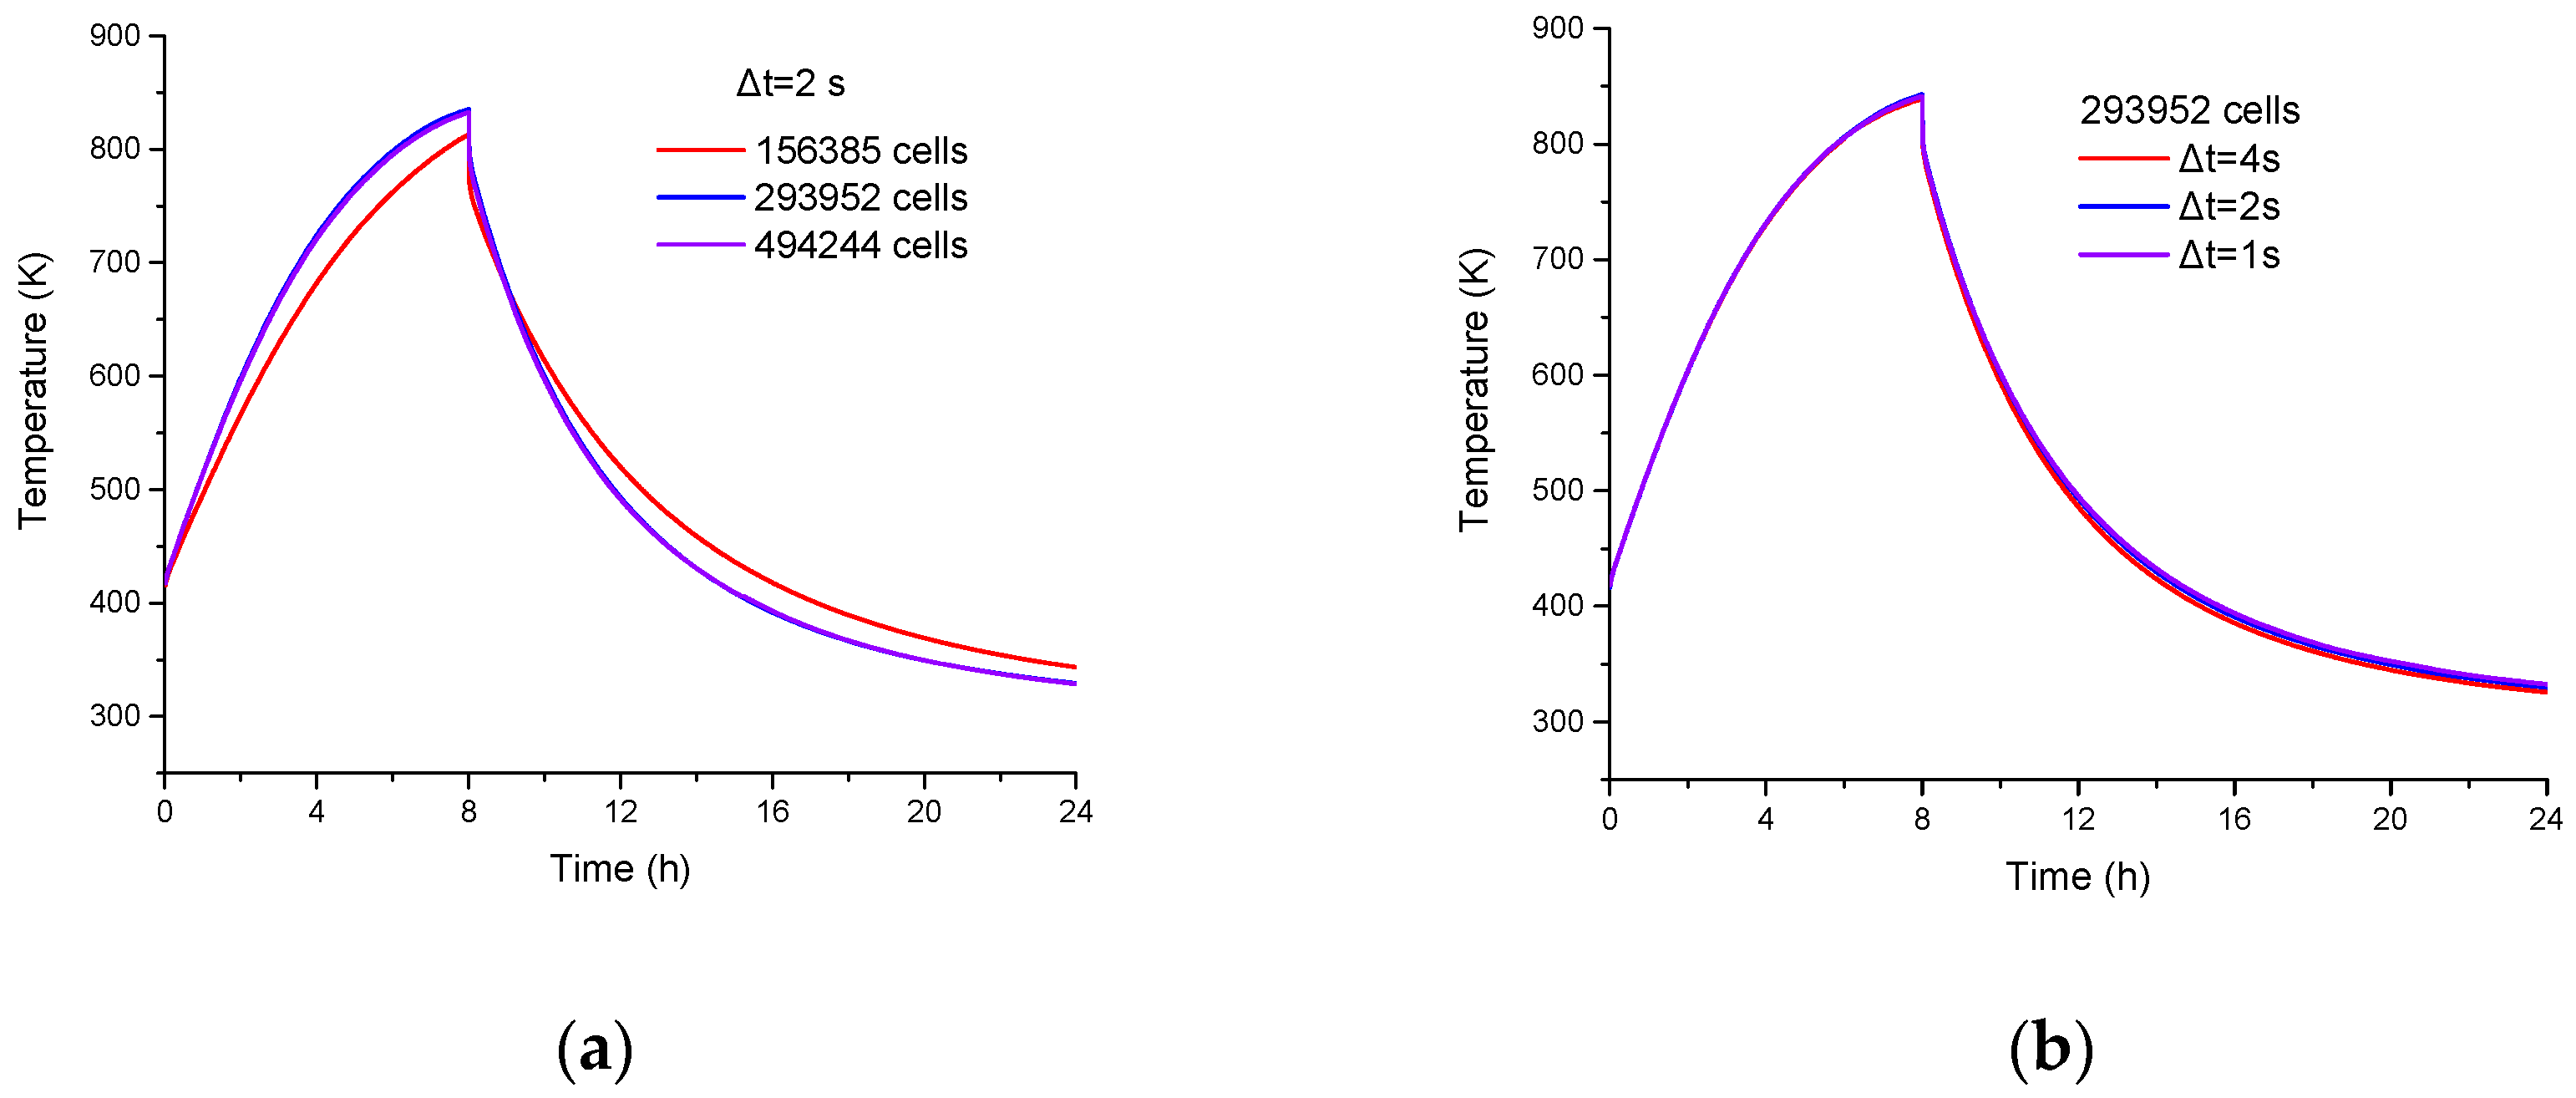
The finite volume method is used to discrete the computational domain. The diffusion and convection terms in the above governing equations are discretized with second order accuracy. The unsteady term is solved by fully implicit scheme. The SIMPLE algorithm is used for the pressure-velocity coupling. Due to the view factor between any two faces is dependent on the discretized geometry, it can be pre-calculated using the ray-tracing model in ANSYS FLUENT (v15) [20]. The convergence criteria of the continuity, velocity and energy equations are 10−3, 10−3 and 10−6, respectively. Three grids (156,358, 293,952 and 494,244 cells) with different time steps (4, 2 and 1 s) are used to check the grid and time step independences. As shown in Figure 2, the difference of the air temperature at the outlet between the grids of 293,952 and 156,358 cells and between the grids of 494,244 and 293,952 cells are less than 6% and 1%, respectively. With the grid of 293,952 cells, the difference of the air temperature at the outlet among those three time steps are smaller than 1%. Thus, it is concluded that the grid of 293,952 cells with the time step of 2 s is in the convergence region and is used for the following study.
4. Results and Discussion
4.1. Model Validation
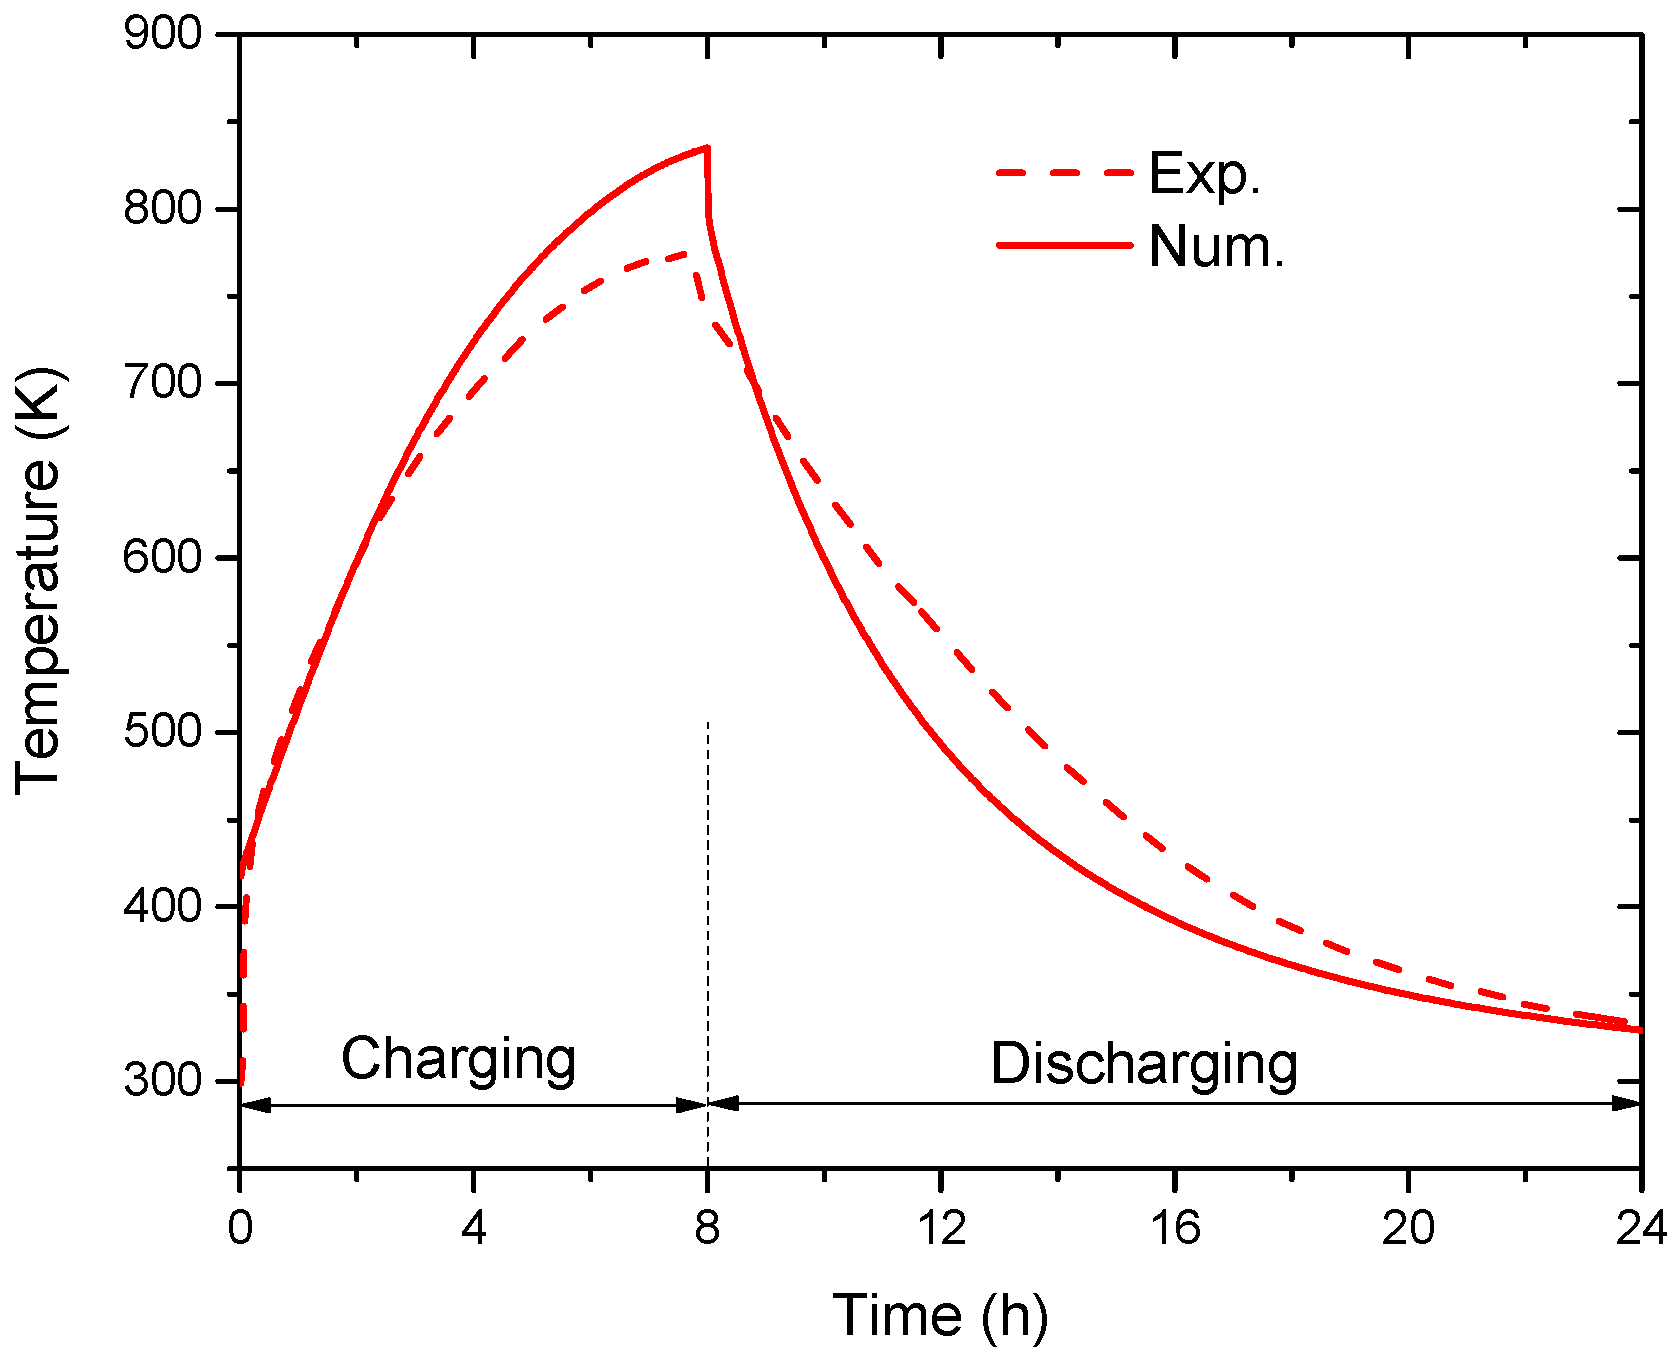
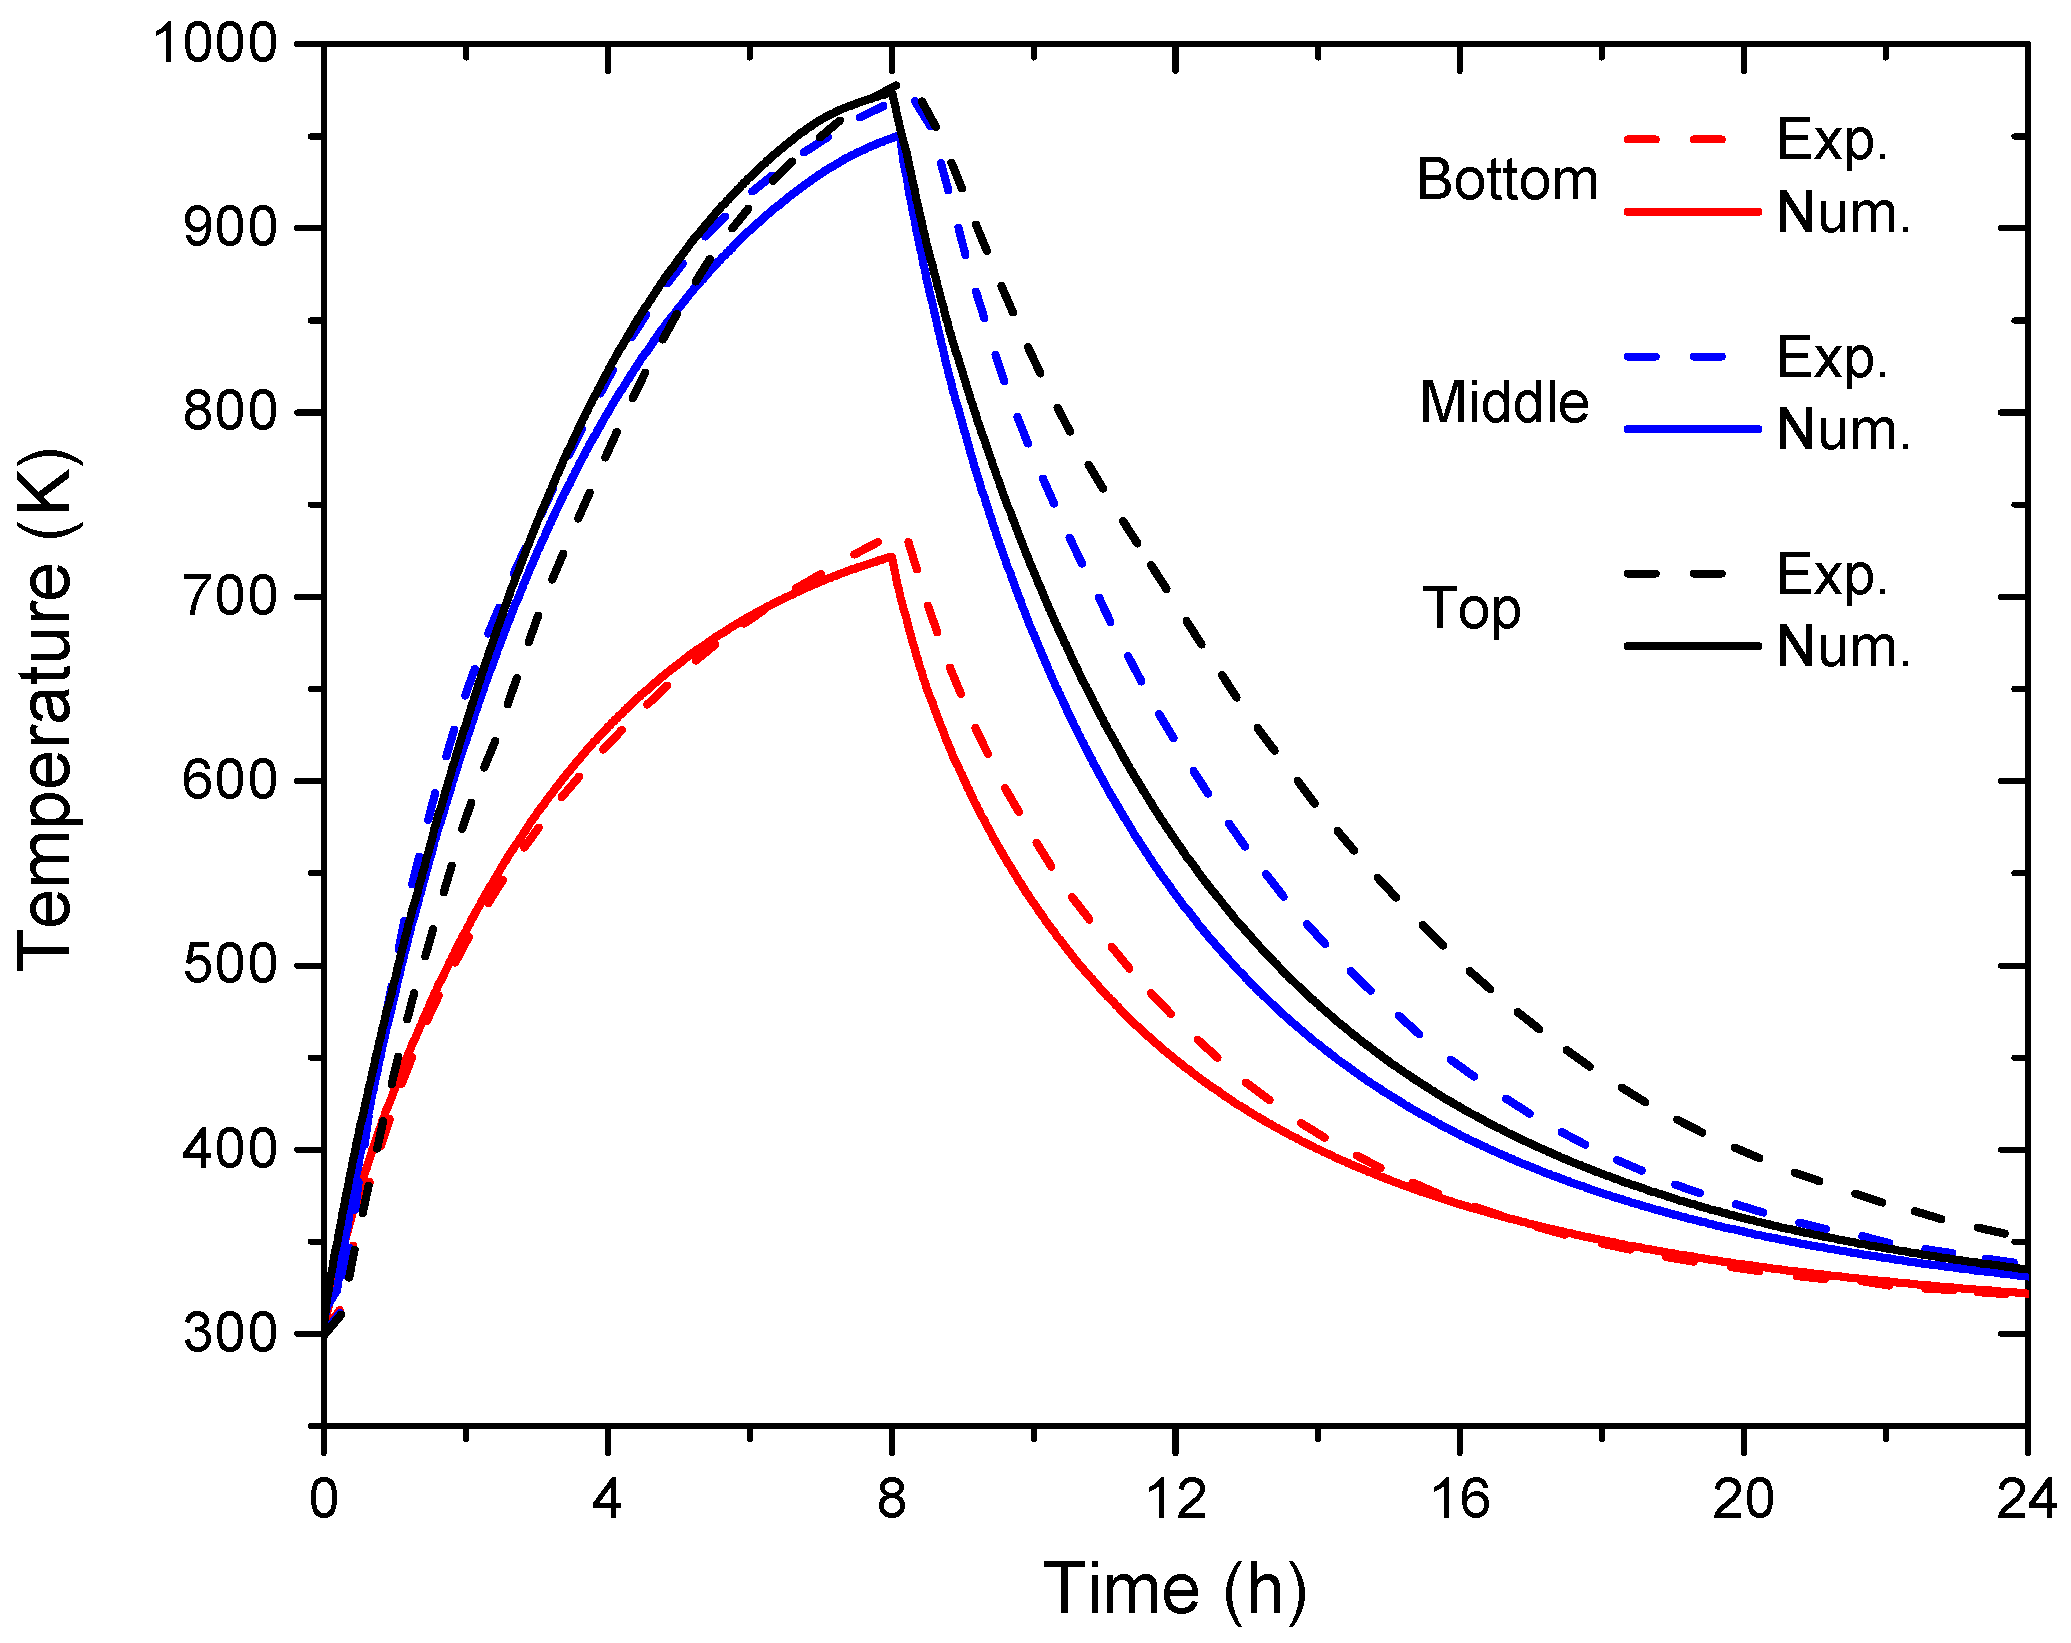
For validation, the numerical results of the present model are used to compare against the experimental results. Figure 3 presents the air temperature at the outlet of the experimental and the numerical results during both the charging and discharging processes. It shows that the difference between the experimental and numerical results is less than 10%. Figure 4 shows the evolution of the brick temperatures at three different points of the experimental and numerical results during both the charging and discharging processes. These three points (the bottom, middle and top points) are located at the centers of the three bricks’ surfaces against the electrical heating element with a depth of 10 mm, respectively. From Figure 4, the temperature differences between the experimental and numerical results of the bottom, middle and top points are less than 7%, 14% and 19%, respectively. Therefore, the numerical results of the proposed model agree well with the experimental results. It can be concluded the present model can be used to simulate the dynamic thermal performance of the proposed ETS device.
4.2. Dynamical Performance
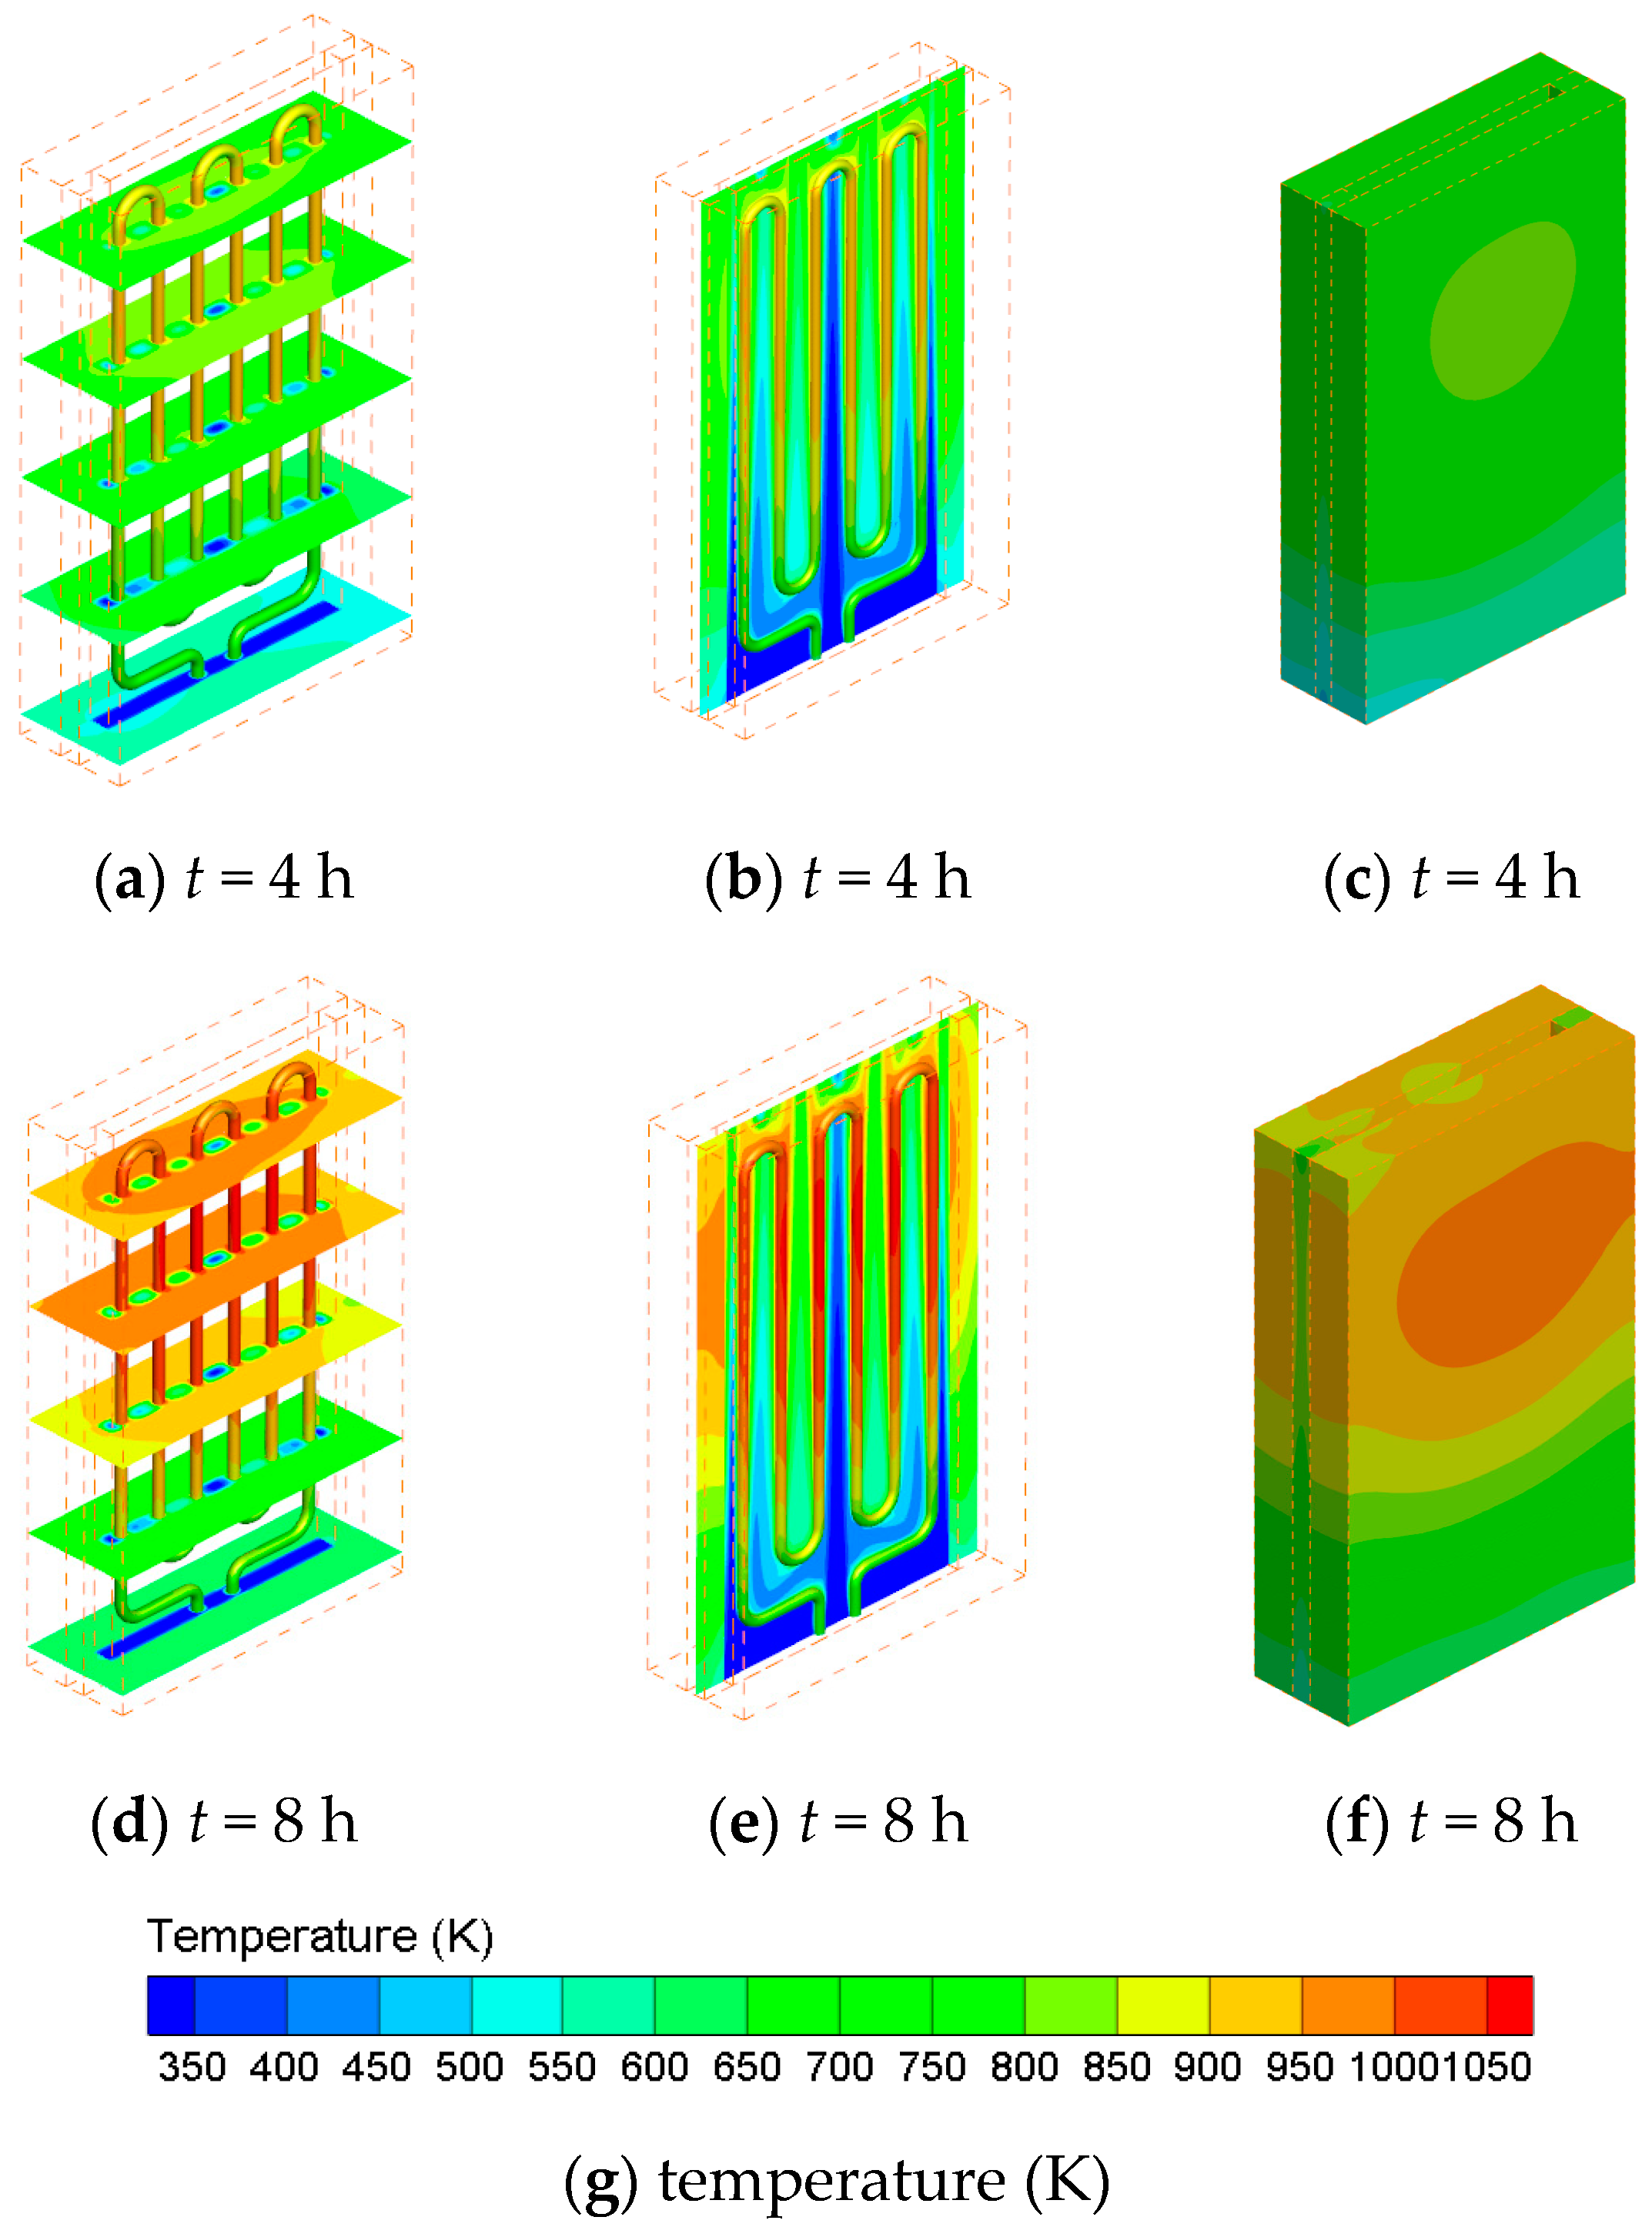
Figure 5 presents the temperature contours of the cross-sections of the bricks with different heights (Figure 5a,d), the middle cross-section of the flow channel (Figure 5a,e), the surface of the electrical heating element (Figure 5a,b,d,e) and the outer surfaces of the bricks (Figure 5c,f) at different charging time (t = 4 and 8 h). It can be seen the electrical heating element has the highest temperature. The top part of the device has higher temperatures than that of the bottom part during the charging process. However, the highest temperature of the bricks does not occur at the outlet, which is because the heating element does not extend to the outlet and thus has little irradiation on the brick surface near the outlet. At t = 4 h, the average temperatures of the heating element surface, all the bricks and the outer surfaces of the bricks are 862 K, 728 K and 655 K, respectively; while they increase to 956 K, 863 K and 774 K, respectively, at t = 8 h. It can be seen that the temperature difference between the heating element decreases from 134 K to 93 K. At t = 8 h, the highest and lowest temperatures of the bricks are 1002 K and 595 K, respectively. Thus, the temperature difference of the bricks is as high as 407 K. After 8 h charging, the average temperature of all the bricks of the proposed ETS device is close to that of the ETS device with PCM presented in Ref. [18] (863 K), while the outlet air temperature of the present ETS device (840 K) is much higher than that of the ETS device with PCM presented in Ref. [18] (560 K). Thus, the proposed ETS device can provide a higher air temperature at the outlet.
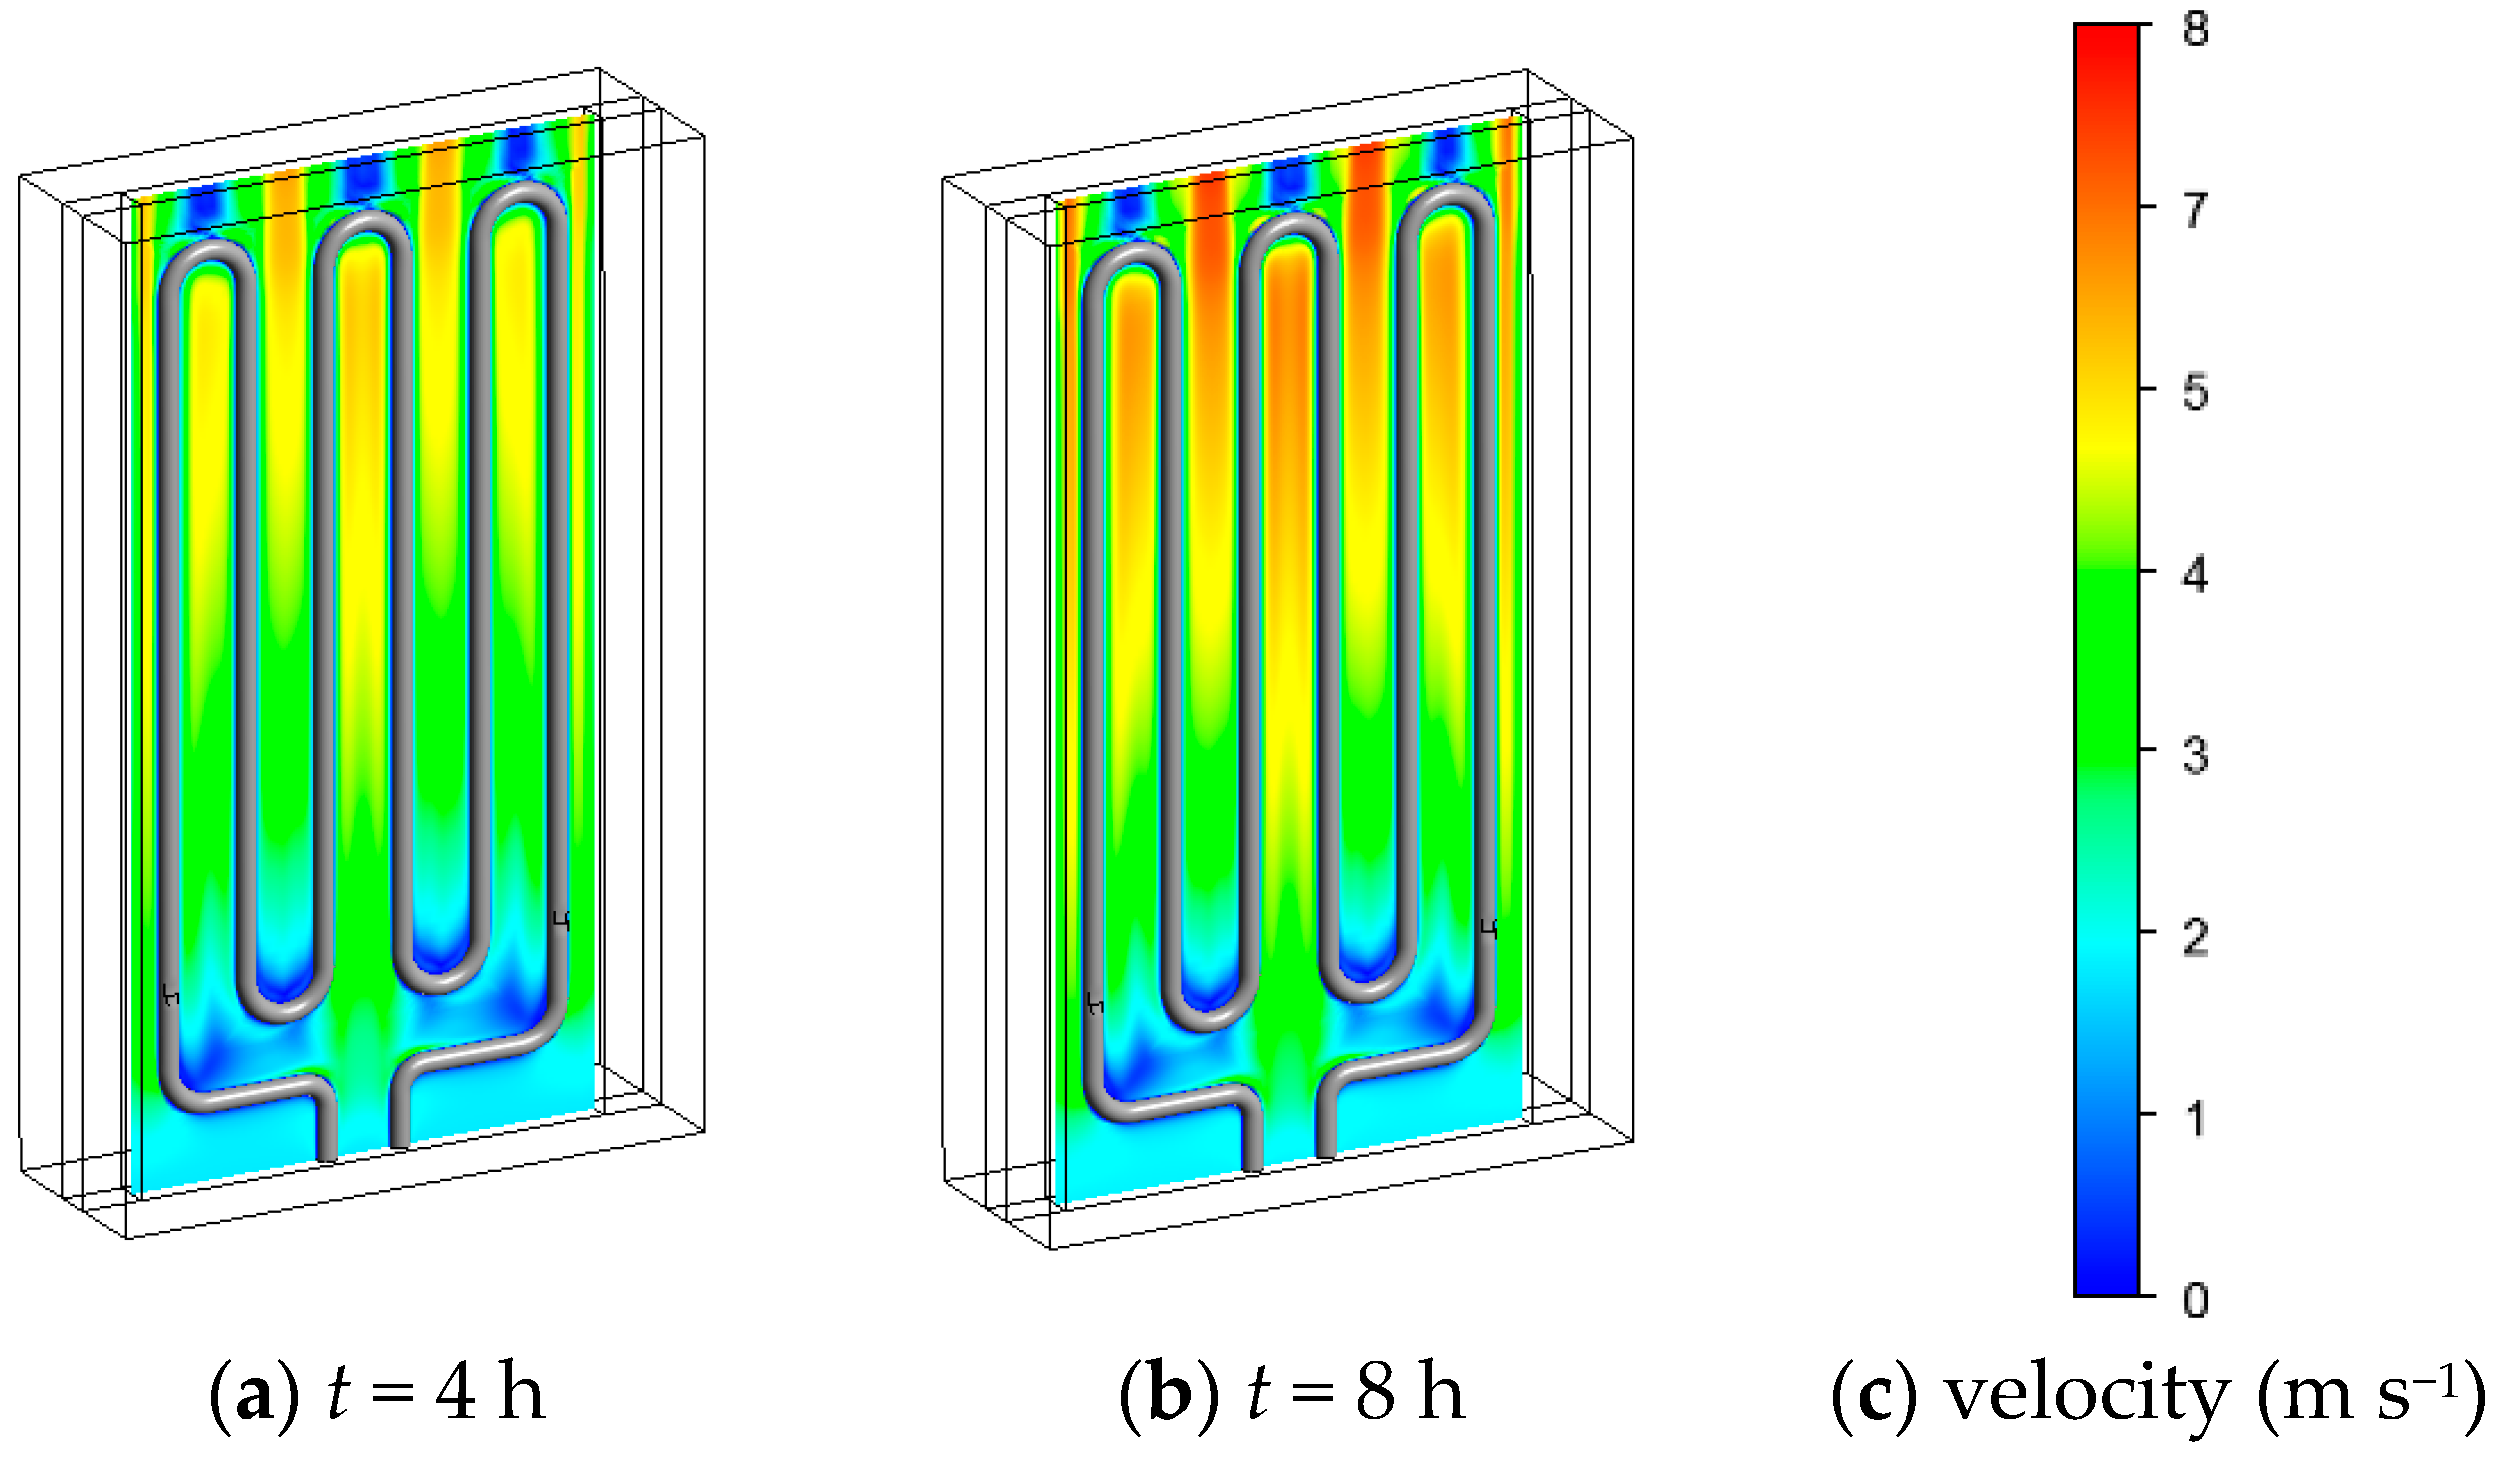
Figure 6 presents the velocity contours at the middle cross-section of the flow channel at different charging time. It can be seen that the air velocity increases from bottom to top in the flow channel which can be attributed to the increased air temperature as shown in Figure 5b,e. The highest velocity rises from 6.8 to 7.7 m s−1 when the charging time increases from 4 to 8 h.
Eight hours later, the electrical heating element is powered off. Due to the thermal energy stored in the bricks, the temperature in the flow channel is still much higher than the ambient temperature and thus the natural convection still exists. The hot bricks discharge their thermal energy to the continuously flowing air. Figure 7 presents the temperature contours of the cross-section of the bricks with different heights (Figure 7a,d), the middle cross-section of the flow channel (Figure 7b,e), the surface of the electrical heating element (Figure 7a,b,d,e) and the outer surfaces of the bricks (Figure 7c,f) at different discharging time (t = 12 h and 16 h). Different from the charging process, the temperature of the bricks gradually increases from bottom to top and the highest temperature occurs at the outer surface of the bricks in the discharging process. At t = 12 h, the average temperatures of all the bricks and the outer surfaces of the bricks are 415 K and 498 K, respectively; while they decrease to 356 K and 392 K at t = 16 h, respectively.
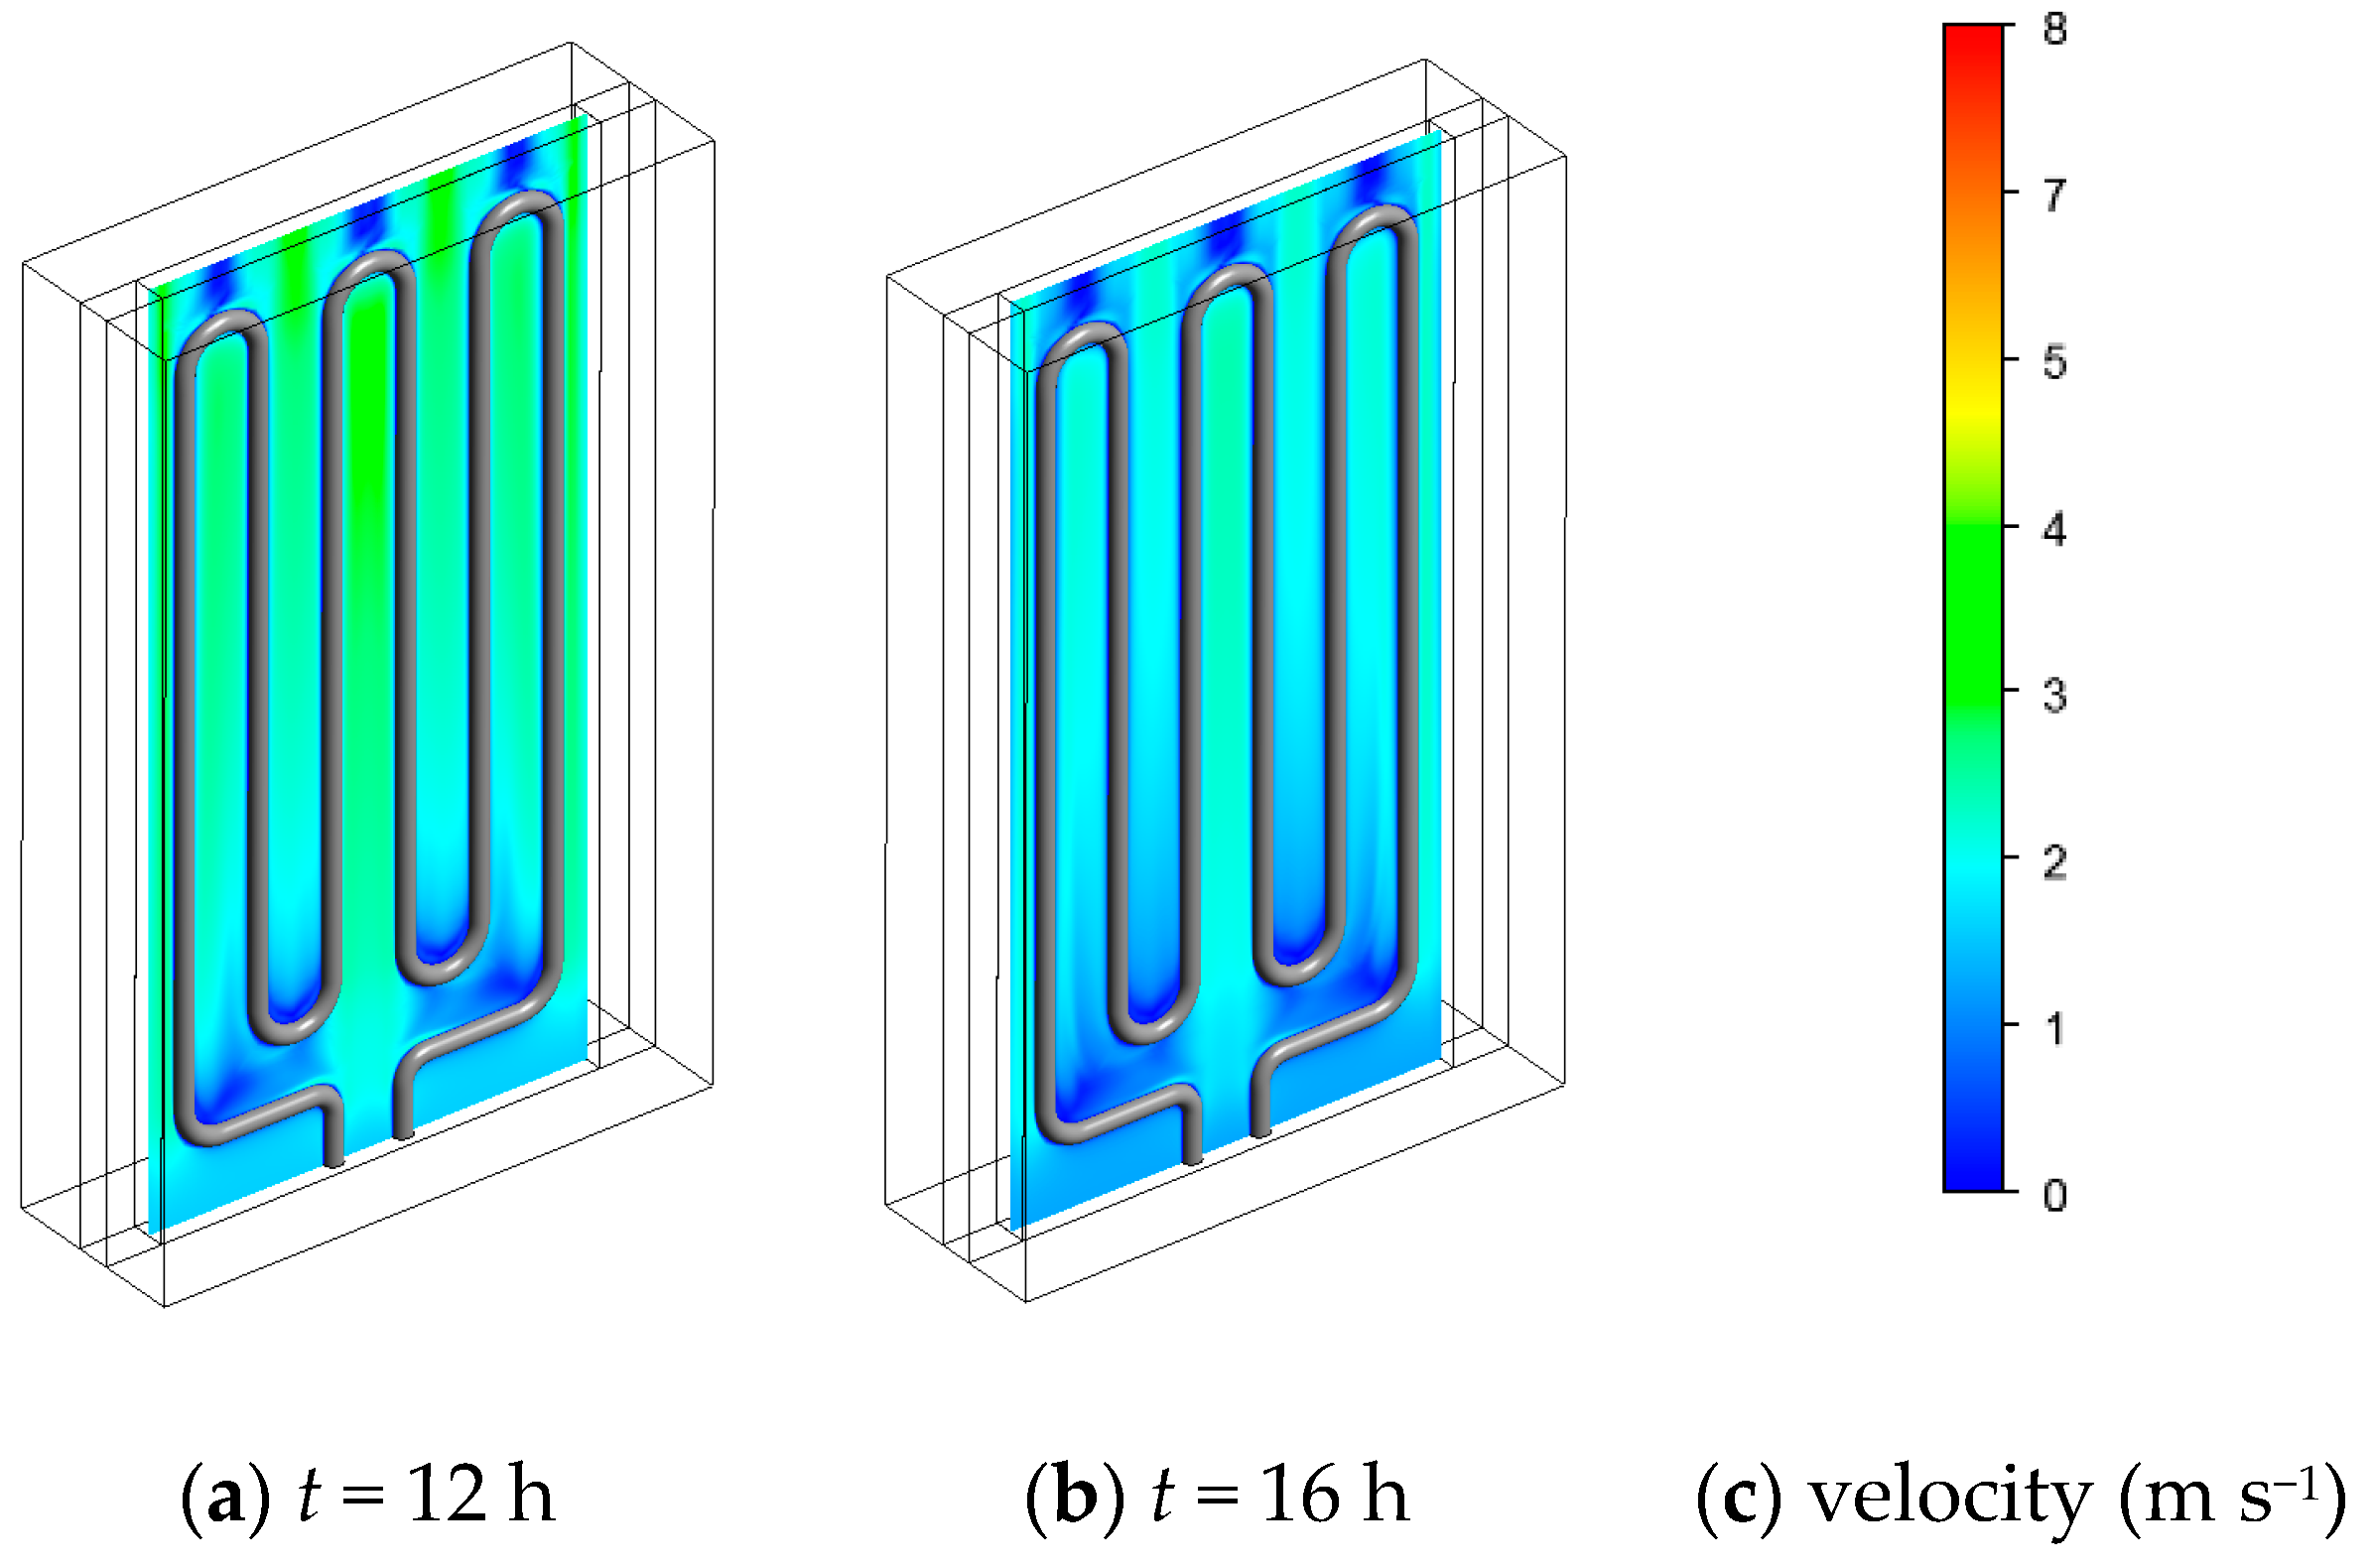
Figure 8 shows the velocity contours at the middle cross-section of the flow channel at different discharging time. It can be seen that the air velocity decreases with the discharging time. The highest velocity decreases from 4.4 to 3.1 m s−1 as the discharging time increasing from 12 to 16 h.
Figure 9 shows the change of air mass flow rate during the charging and discharging processes. As shown in Figure 9, the air mass flow rate increases to 3.2 × 10⁻³ kg s−1 after 8 h charging. In the discharging process, due to the intensity of the natural convection decreases with the ETS temperature, the air mass flow rate decreases to 1.0 × 10⁻³ kg s−1 after 16 h discharging. The air mass flow rate dramatically decreases after the charging process switches to the discharging process. This is because the temperature of the flow channel is dominated by the heating element in the charging process, while it is dominated by the surfaces of the bricks around the flow channel in the discharging process. The large temperature difference (>130 K) between the surface of the electrical heating element and the bricks’ temperature around the flow channel results in a rapid decrease of the intensity of natural convection. Thus, the air mass flow rate suddenly decreases from 3.2 × 10⁻³ to 2.7 × 10⁻³ kg s−1 at the beginning of the discharging process.
4.3. Energy Analysis
Figure 10 illustrates the changes of the electrical power qe, the heat flow transferred to air qair and stored by the bricks qbricks and the heat losses to the space through the adiabatic material qloss during the charging and discharging processes. During the charging process, qe keeps at a constant of 800 W. Due to the increasing intensity of the natural convection mentioned above, qair increases to 555 W. qbricks decreases to 85 W, which is because the total radiation from the electrical heating element reduces by the decreased temperature difference between the heating element and the bricks, as discussed before. Due to the increased temperature of the bricks, qloss increases from 0 to 160 W. The total heat flow to the ambient increases from 0 to 715 W during the charging process. It can be seen during the initially 4 h’ charging, qair is less than 400 W, which indicates the irradiation dominates the heat transfer of the heating element. However, four hours later, the natural convection transfers more energy from the heating element than the irradiation.
During the discharging process, the heating element is powered off and thus qe is zero. qbricks becomes negative because the bricks discharge its thermal energy to air. Part of qbricks is transferred to air qair by natural convection and the other part is lost to the space through the adiabatic material qloss. Due to the decreased temperature of the bricks, qair and qloss decrease from 516 to 10 W and from 160 to 9 W, respectively. Thus, the total heat flow transferred to the space decreases from 676 W to 19 W during the discharging process.
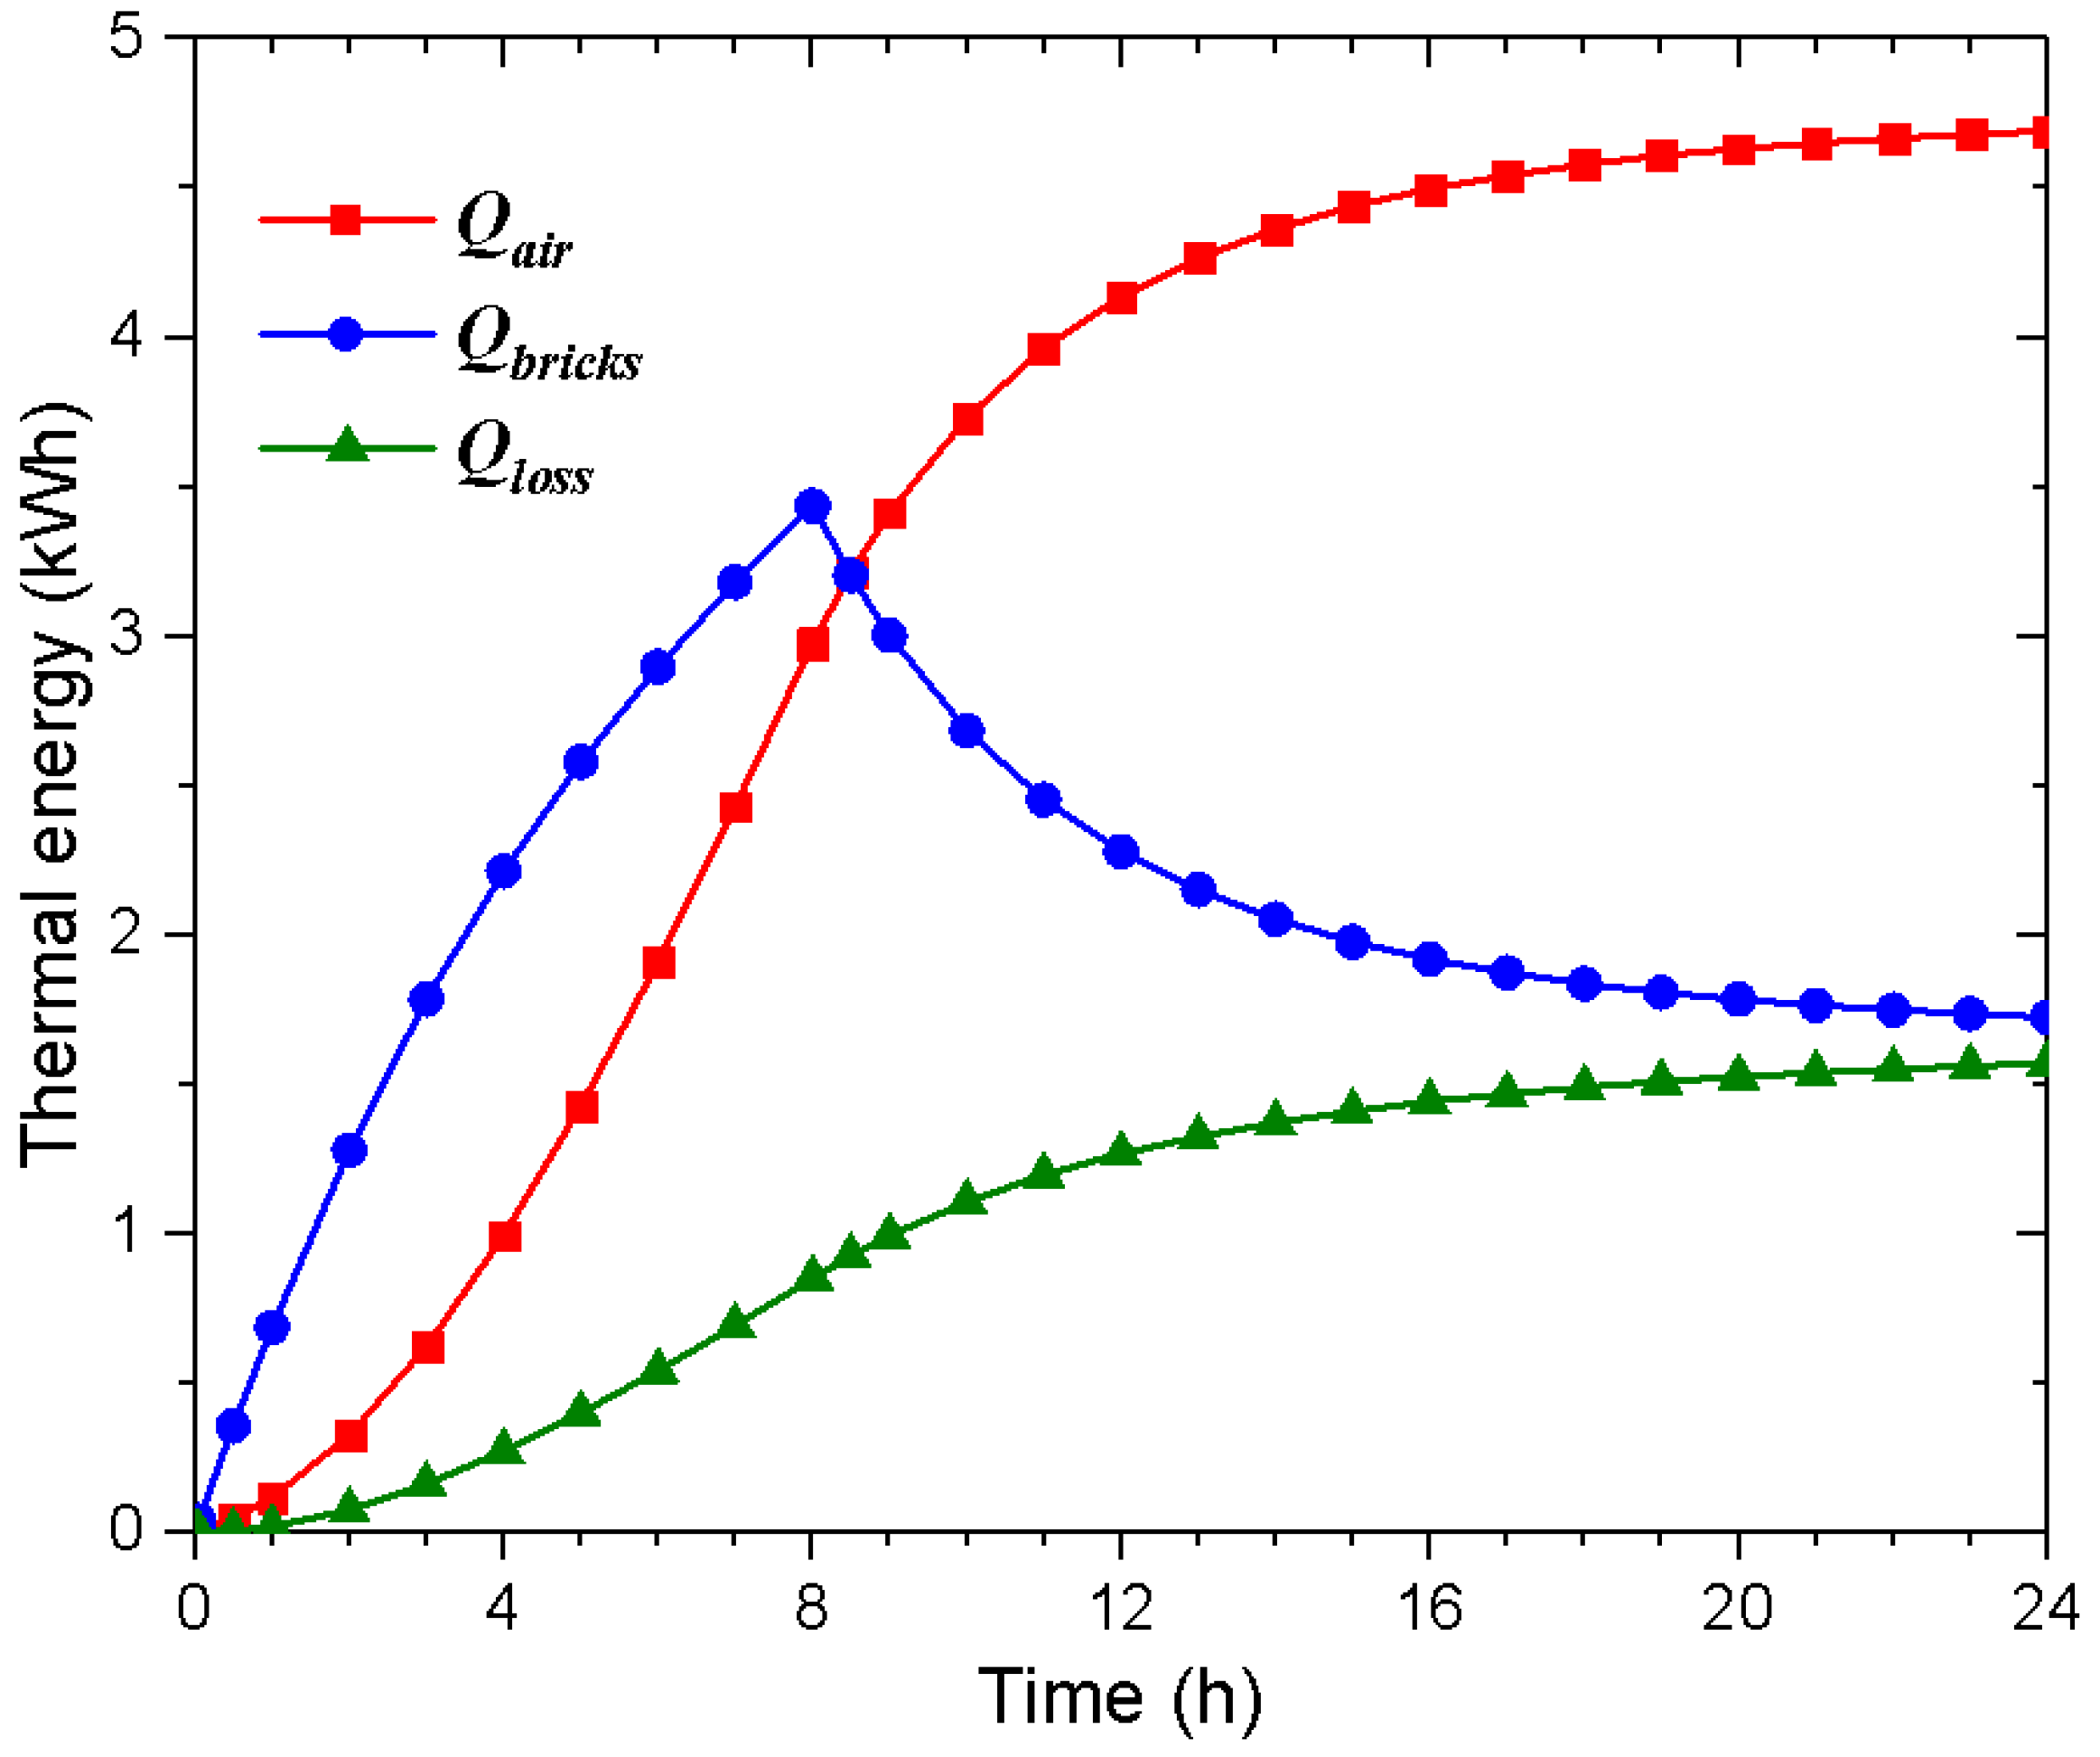
Figure 11 shows the accumulated energy transferred to air Qair, stored by the bricks Qbricks and lost to the space through the adiabatic material Qloss during the charging and discharging processes. During the charging process, Qair, Qbricks and Qloss increase to 2.97, 2.59 and 0.85 kWh, respectively. During the discharging process, Qbricks decreases from 2.59 to 0.87 kWh, which means a thermal energy of 0.87 kWh is stored in the brick after this cycle. While both Qair and Qloss further increase to 4.69 and 1.57 kWh, respectively. It can be calculated that the total electrical heating energy is 6.4 kWh. For the charging process, 40.4% of the total heating energy is transferred to the space through the natural convection in the flow channel and 13.3% is lost to the space through the adiabatic material. For the discharging process, 26.9% of the total heating energy is transferred to the space through the natural convection in the flow channel and 7.2% is lost to the ambient through the adiabatic material. Therefore, 53.7% of the total heating energy is released to the space and 46.3% is stored in the storage medium for the presented device during the 8 h’ charging process, while they are 24.7% and 75.3% of the reported ETS device in Ref. [18]. It should be noted that both of these two ETS devices should be further tested in a space in the wintertime to evaluate their practical performances.
From the above energy analysis, more than half of the heating energy is released to the space for the charging process, while it is only 34.1% for the discharging process. In addition, the thermal flow used to warm the space significantly decreases during the discharging process. The following three methods could be used to improve the thermal performance of the presented ETS device in the next research.
- (1)
- An adjustable inlet or outlet of the flow channel can be designed to limit or enlarge the natural convection in the flow channel;
- (2)
- The thickness of adiabatic material should be further designed to achieve a heat loss that can provide a comfortable heat flow to the space with the natural convection in the flow channel;
- (3)
- A regulable electrical heating element can be used to offer a high heating power at the beginning of the charging process and a low heating power at the end of the charging process, which can help to decreases the maximum temperature of the bricks.
5. Conclusions
This study tests a fully charging/discharging cycle of an ETS device with PCM for space heating. In addition, a three-dimensional numerical model is developed to simulate the thermal behavior of the proposed device. The main conclusions are listed as follows.
- (1)
- The numerical results agree well with the experimental results, which indicates the present numerical model can be a useful tool to simulate the dynamical performance and optimize the design of the proposed ETS device.
- (2)
- For the charging and the discharging processes, the average temperature of all the bricks and the outlet air temperature can be as high as 1002 K and 835 K. 67.3% of the total charging electrical energy is transferred to the space by the natural convection, while 20.5% is lost to the space through the adiabatic material.
- (3)
- The heat flow warming the space is quite uneven during the charging and discharging processes, which indicates the present design should be further improved to provide suitable thermal energy and make the space comfortable.
Further study may be focused on designing an adjustable inlet or outlet of the flow channel, optimizing the thickness of the adiabatic material, fabricating a new auxiliary circuit to regulate the power of the heating element and testing the device in a space without temperature control.
Author Contributions
Conceptualization, G.X., C.Y. and Z.D.; Methodology, X.H. and C.X.; Software, X.H. and Z.L.; Validation, X.H. and Z.L.; Formal Analysis, X.H. and Z.L.; Investigation, X.H. and Z.L.; Experiment, X.H.; Writing-Original Draft Preparation, Z.L.; Writing-Review & Editing, C.X.; Supervision, G.X., C.Y. and Z.D.
Funding
This work is supported by the State Grid Cooperation of China: Research on Key Technologies of Megawatt-Hours Scale PCM Thermal Energy Storage System (SGRIDLKJ[2016]1095).
Acknowledgments
The authors want to thank Yi Jin for his help with the experiment.
Conflicts of Interest
The authors declare no conflict of interest.
References
- Guidance on the Promotion of Electric Power Substitution. Available online: http://www.ndrc.gov.cn/zcfb/zcfbtz/201605/t20160524_804425.html (accessed on 22 May 2018). (In Chinese)
- Guidance on the Promoting of Space Heating by Renewable Energy in Northern Areas. Available online: http://www.mohurd.gov.cn/wjfb/201709/t20170913_233287.html (accessed on 22 May 2018). (In Chinese)
- Niu, D.; Song, Z.; Xiao, X. Electric power substitution for coal in China: Status quo and swot analysis. Renew. Sustain. Energy Rev. 2017, 70, 610–622. [Google Scholar] [CrossRef]
- China makes great progress in switch from coal to power heating. Available online: http://www.sxcoal.com/news/4562751/info/en (accessed on 23 May 2018).
- Darby, S.J. Smart electric storage heating and potential for residential demand response. Energy Effic. 2017, 11, 67–77. [Google Scholar] [CrossRef]
- Carlsson-Hyslop, A. Past management of energy demand: Promotion and adoption of electric heating in britain 1945–1964. Environ. Hist. 2016, 22, 75–102. [Google Scholar] [CrossRef]
- Arteconi, A.; Hewitt, N.J.; Polonara, F. State of the art of thermal storage for demand-side management. Appl. Energy 2012, 93, 371–389. [Google Scholar] [CrossRef]
- Sarbu, I.; Sebarchievici, C. A comprehensive review of thermal energy storage. Sustainability 2018, 10, 191. [Google Scholar] [CrossRef]
- All the Electrical Thermal Storage Information You’ll Ever Need. Available online: http://www.steffes.com/electric-thermal-storage/resources/downloads/ (accessed on 26 May 2018).
- Youcef, B.B.; Alain, M.; Michel, P.; Blaise, L. Central electric thermal storage (ETS) feasibility for residential applications: Part 1. Numerical and experimental study. Inter. J. Energy Res. 2001, 25, 53–72. [Google Scholar]
- Youcef, B.B.; Blaise, L.; Michel, P.; Alain, L. Central electric thermal storage (ETS) feasibility for residential applications: Part 2. Techno-economic study. Inter. J. Energy Res. 2001, 25, 73–83. [Google Scholar]
- Molina, A.; Gabaldon, A.; Fuentes, J.A.; Gomez, E.; Alvarez, C. Electrical thermal storage modeling: A tool to evaluate new opportunities and bids for residential users in a deregulated market. In Proceedings of the 2003 IEEE Bologna Power Tech Conference Proceedings, Bologna, Italy, 23–26 June 2003. [Google Scholar]
- Molina, A.; Gabaldon, A.; Fuentes, J.A.; Alvarez, C. Implementation and assessment of physically based electrical load models: Application to direct load control residential programmes. IEE Proc. Gener. Transm. Distrib. 2003, 150, 61–66. [Google Scholar] [CrossRef]
- Ali, M.; Jokisalo, J.; Siren, K.; Lehtonen, M. Combining the demand response of direct electric space heating and partial thermal storage using LP optimization. Electr. Power Syst. Res. 2014, 106, 160–167. [Google Scholar] [CrossRef]
- Sauter, P.S.; Solanki, B.V.; Canizares, C.A.; Bhattacharya, K.; Hohmann, S. Electric thermal storage system impact on northern communities’ microgrids. IEEE Trans. Smart Grid 2017, 99, 1–12. [Google Scholar] [CrossRef]
- Dolado, P.; Lazaro, A.; Marin, J.M.; Zalba, B. Characterization of melting and solidification in a real scale pcm-air heat exchanger: Numerical model and experimental validation. Energy Convers. Manag. 2011, 52, 1890–1907. [Google Scholar] [CrossRef]
- Stathopoulos, N.; El Mankibi, M.; Issoglio, R.; Michel, P.; Haghighat, F. Air-PCM heat exchanger for peak load management: Experimental and simulation. Sol. Energy 2016, 132, 453–466. [Google Scholar] [CrossRef]
- Chuan, L.; Yanyang, S.; Guanghui, L.; Yong, X.; Yufeng, D.; Likui, W.; Yulong, D. Charging behavior of an electrical storage heater using a high temperature composite phase change material. Energy Storage Sci. Technol. 2017, 6, 739–747. [Google Scholar]
- Amir, F.; Yuwen, Z.; John, H. Advanced Heat and Mass Transfer; Global Digital Press: Columbia, MO, USA, 2010. [Google Scholar]
- Ansys Inc. Ansys Fluent Theory Guide; Ansys Inc.: Canonsburg, PA, USA, 2015. [Google Scholar]
- Chen, H.; Liu, N.; Chow, W. Wind effects on smoke motion and temperature of ventilation-controlled fire in a two-vent compartment. Build. Environ. 2009, 44, 2521–2526. [Google Scholar] [CrossRef]
- Peppes, A.A.; Santamouris, M.; Asimakopoulos, D.N. Buoyancy-driven flow through a stairwell. Build. Environ. 2001, 36, 167–180. [Google Scholar] [CrossRef]
Figure 1.
The proposed ETS device: (a) the inner structure, (b) the appearance with metal casing, (c) the configuration of the device being tested.
Figure 1.
The proposed ETS device: (a) the inner structure, (b) the appearance with metal casing, (c) the configuration of the device being tested.
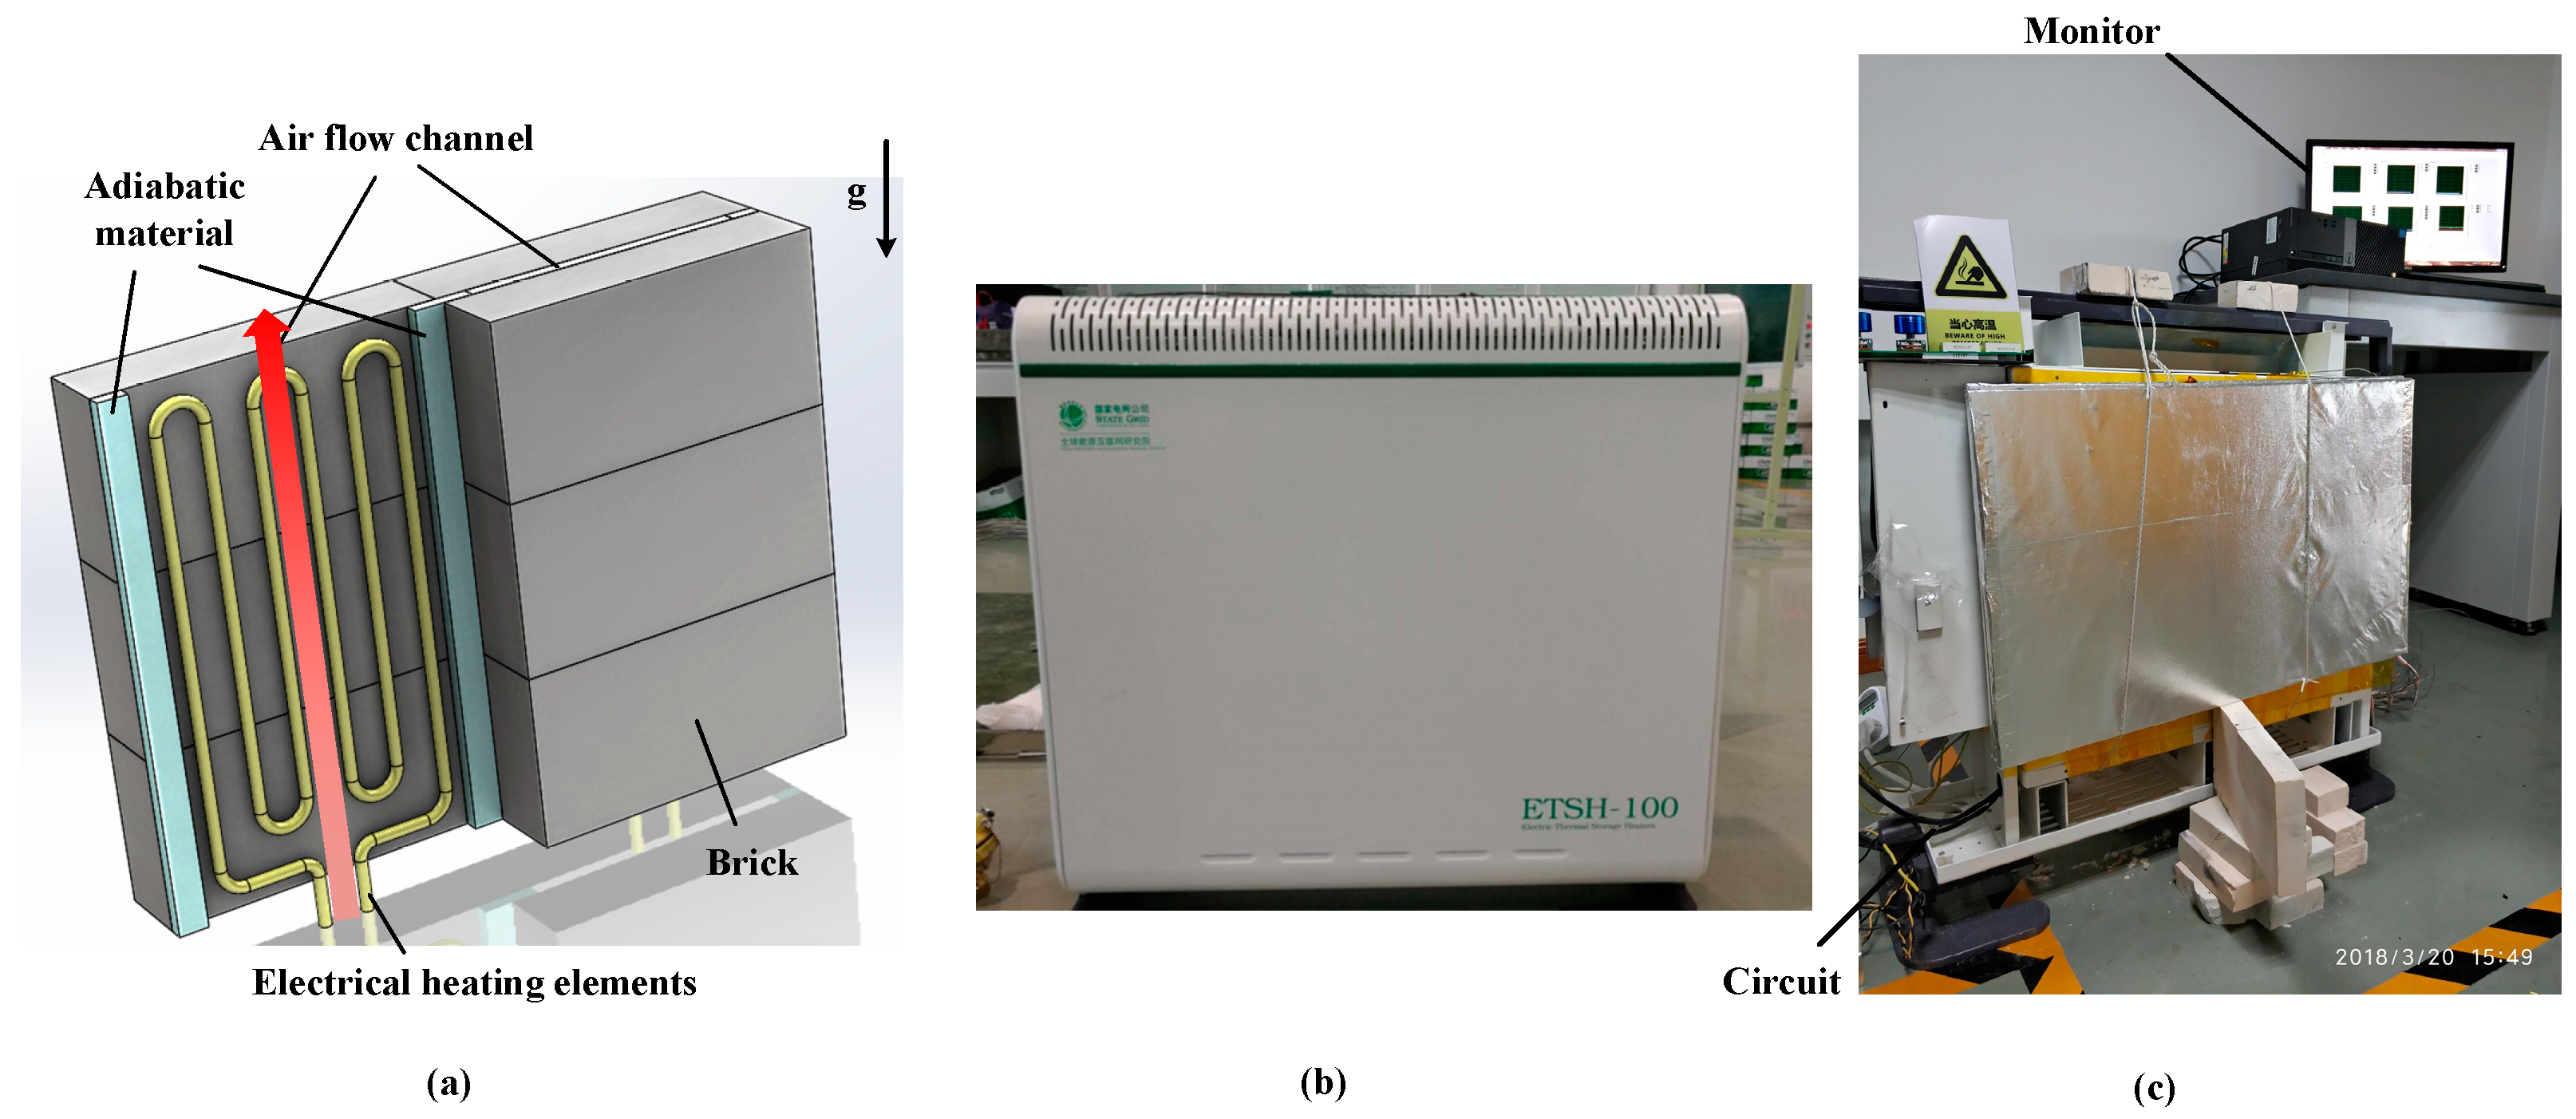
Figure 2.
The evolution of the air temperature at the outlet with different grids (a) and different time steps (b).
Figure 2.
The evolution of the air temperature at the outlet with different grids (a) and different time steps (b).

Figure 3.
The evolution of the air temperature at the outlet of the experimental (Exp.) and numerical (Num.) results.
Figure 3.
The evolution of the air temperature at the outlet of the experimental (Exp.) and numerical (Num.) results.

Figure 4.
The evolution of the brick temperatures at the bottom, middle and top points of the experimental (Exp.) and numerical (Num.) results.
Figure 4.
The evolution of the brick temperatures at the bottom, middle and top points of the experimental (Exp.) and numerical (Num.) results.

Figure 5.
The temperature contours of the cross-sections of the bricks with different height (a,d), the middle cross-section of the flow channel (b,e), the surface of the electrical heating element (a–d), the outer surfaces of bricks (c,f) at different charging time (t = 4 h and 8 h), and the temperature scale (g).

Figure 6.
The velocity contour at the middle cross-section of the flow channel at different charging time.
Figure 6.
The velocity contour at the middle cross-section of the flow channel at different charging time.

Figure 7.
The temperature contours of the cross-sections of the bricks at different heights (a,d), the middle cross-section of the flow channel (b,e), the surface of the heating element (a,b,d,e), the outer surfaces of the bricks (c,f) at different discharging time (t = 12 h and 16 h), and the temperature scale (g).
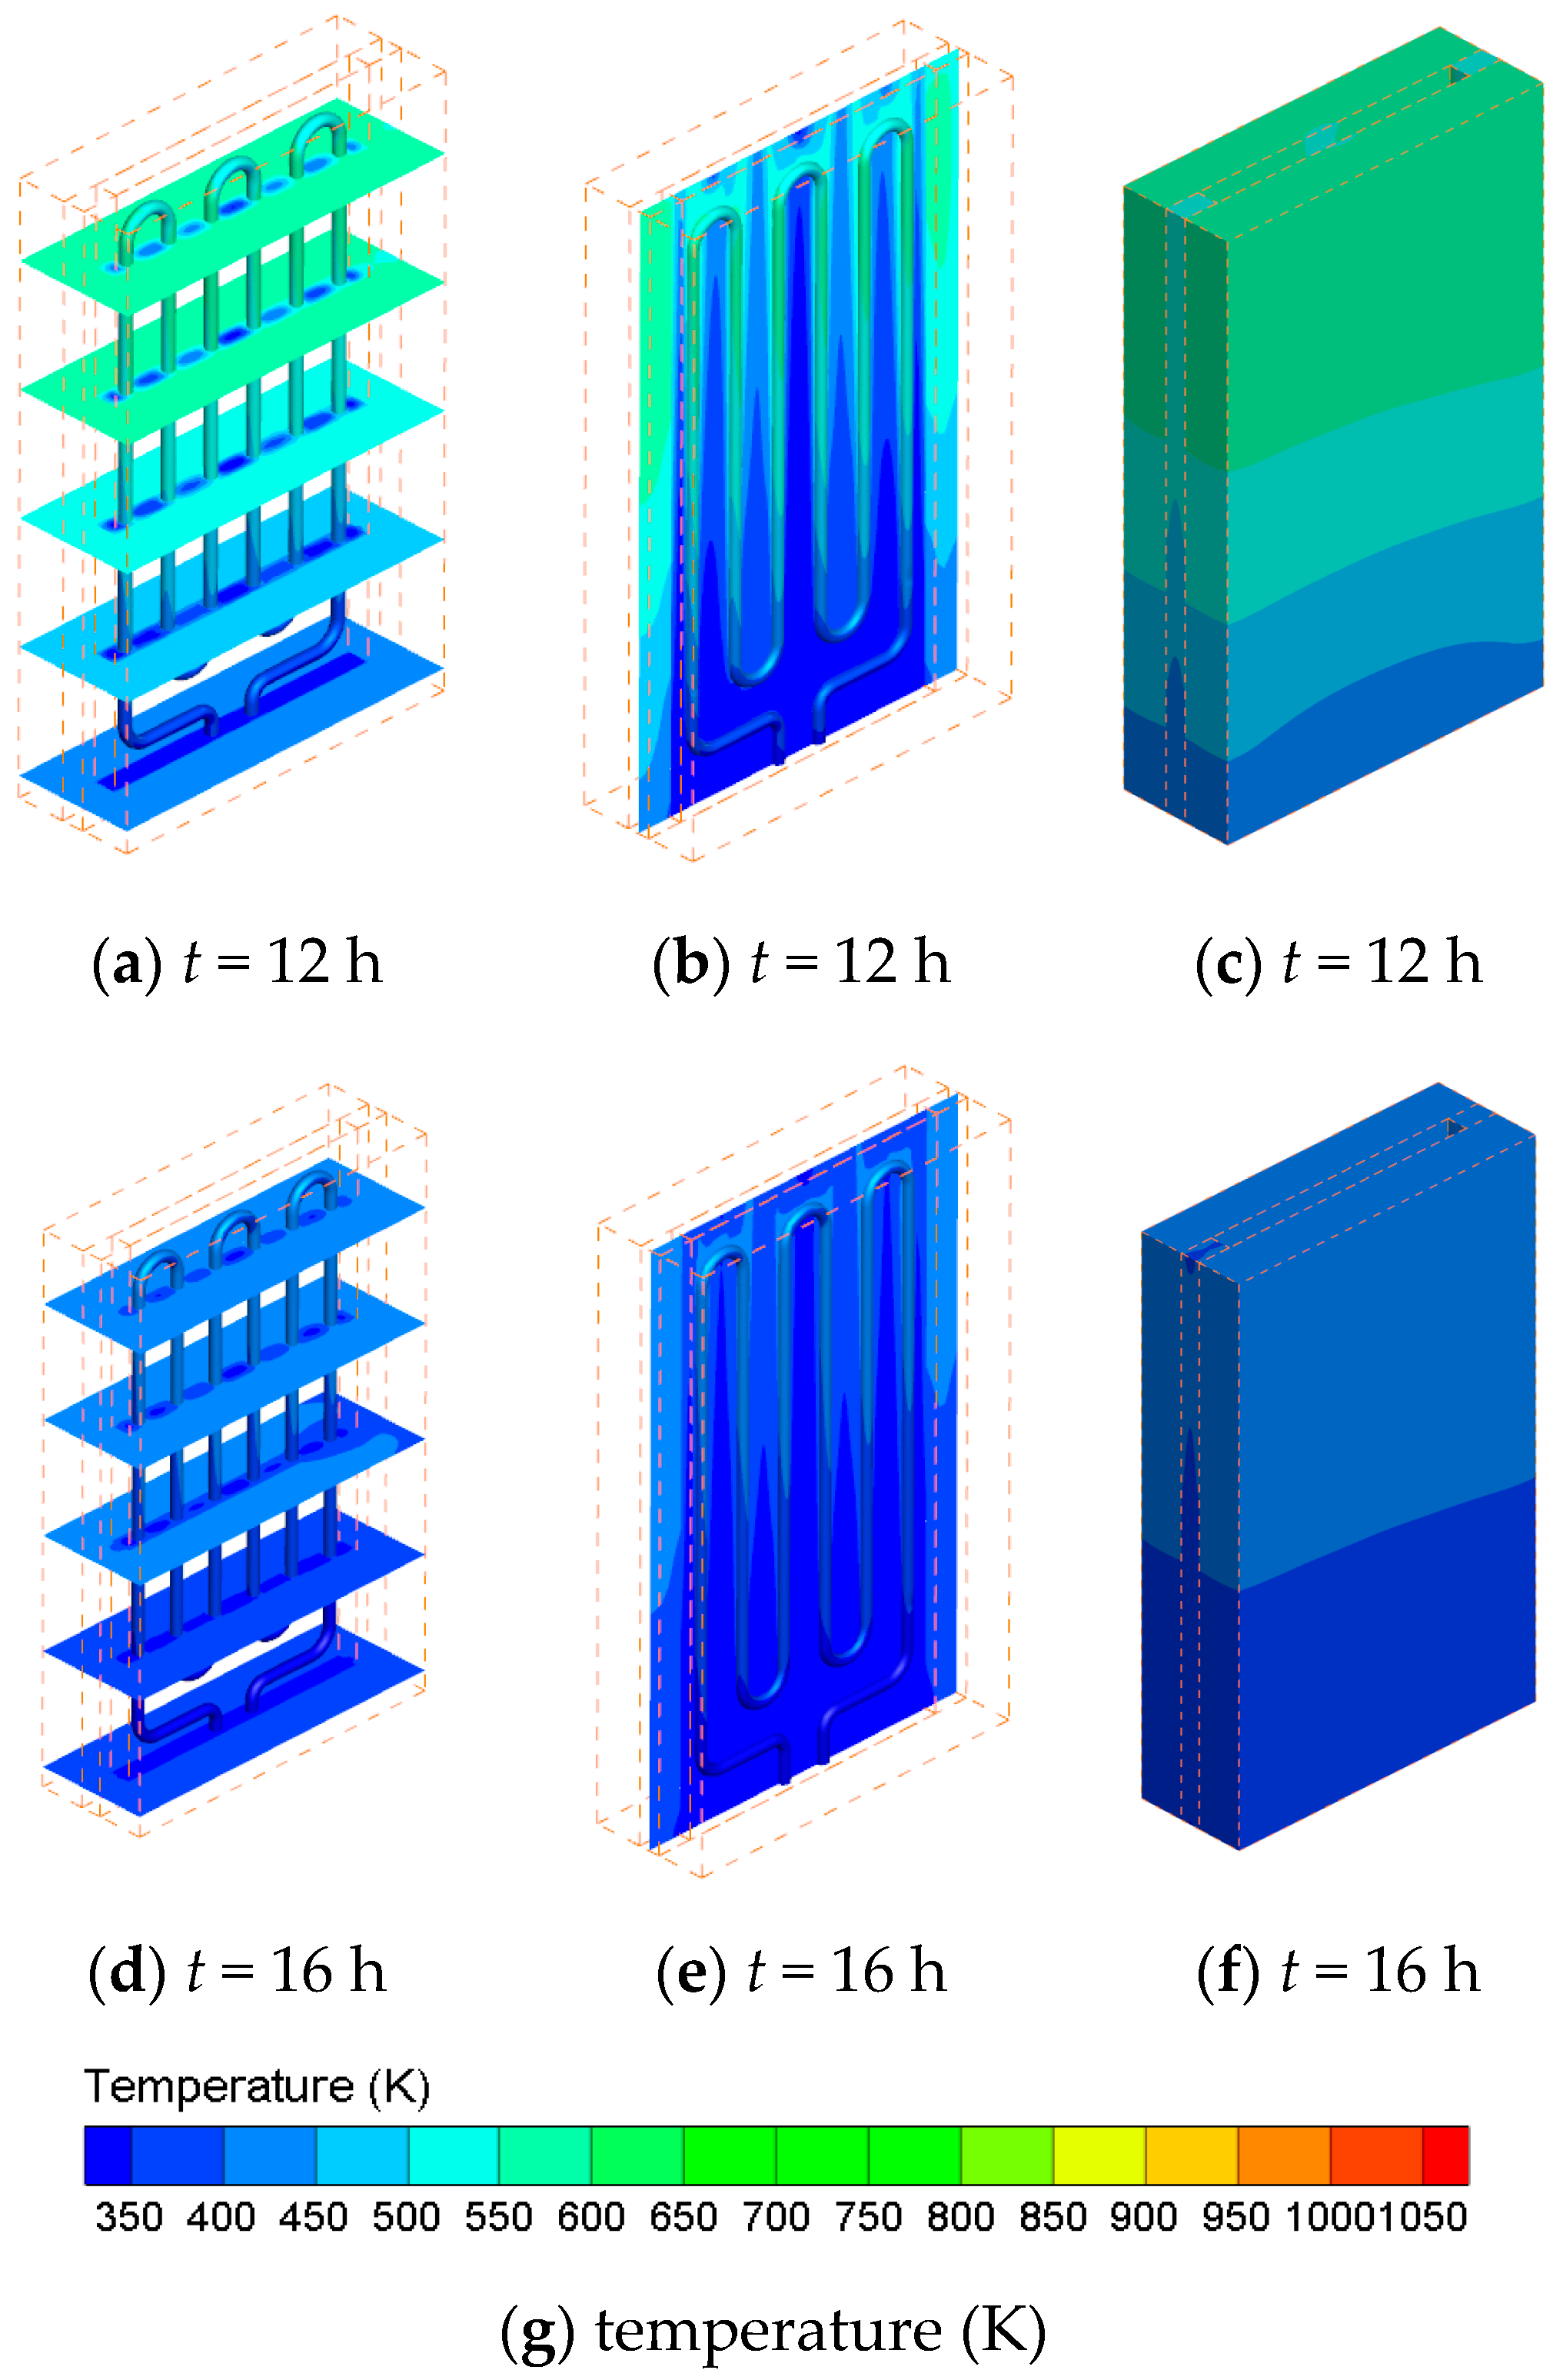
Figure 8.
The velocity contours at the middle cross-section of the flow channel at different discharging time.
Figure 8.
The velocity contours at the middle cross-section of the flow channel at different discharging time.

Figure 9.
The change of air mass flow rate during the charging and discharging processes.
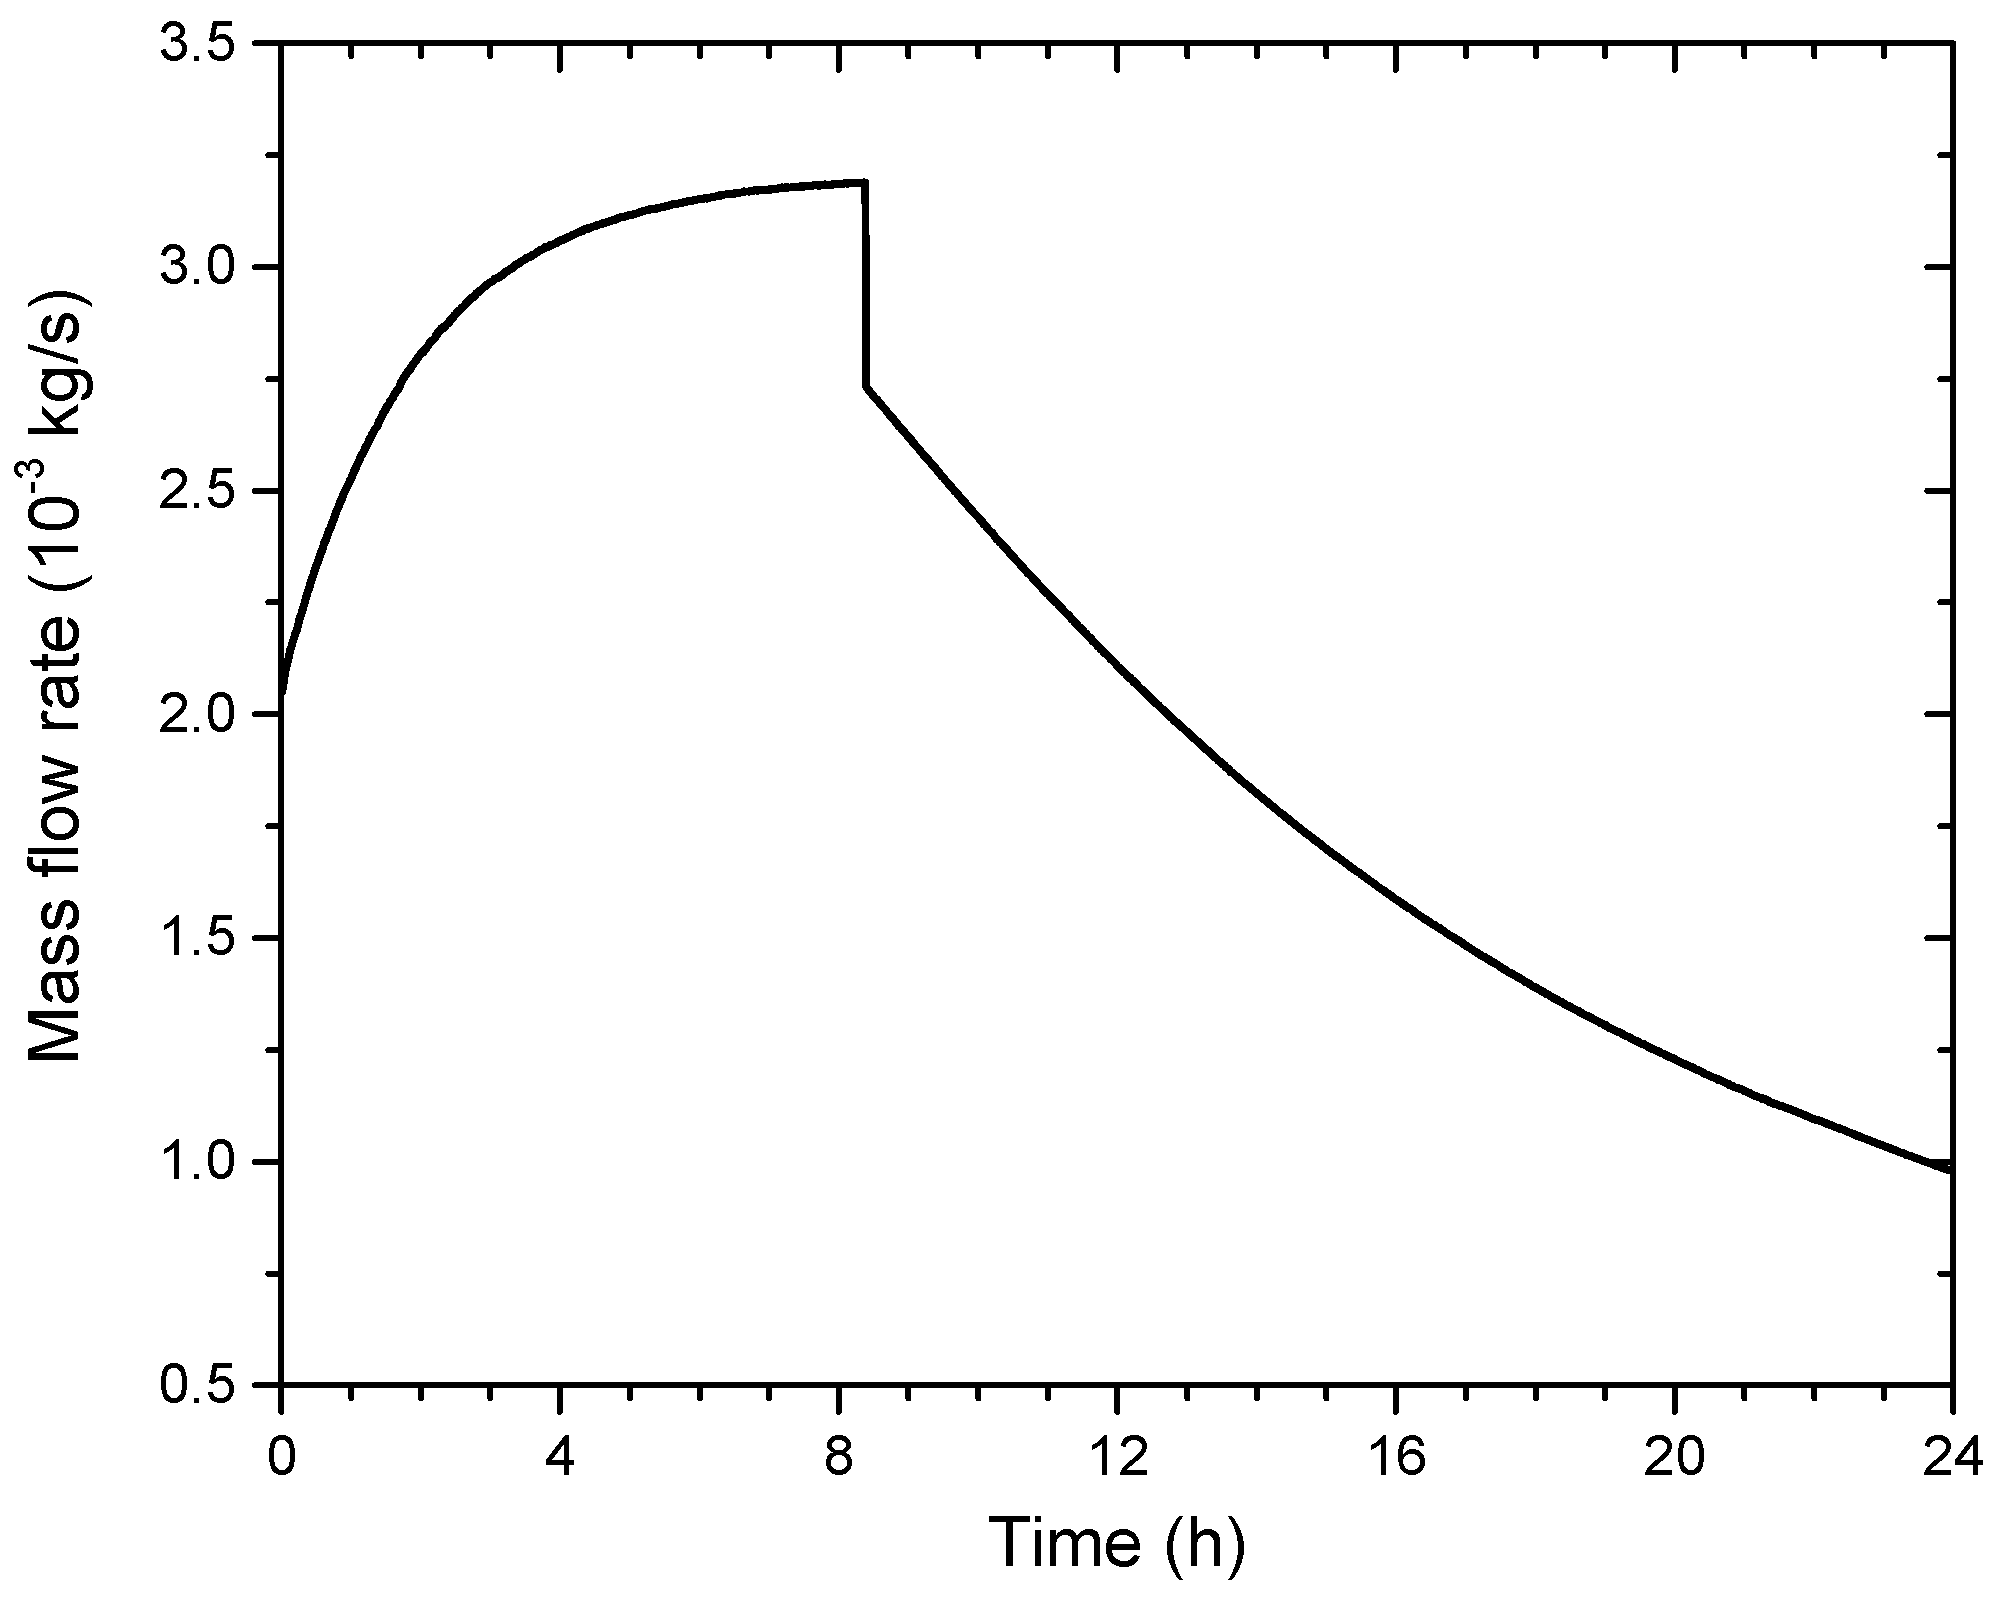
Figure 10.
The changes of the electrical power qe, the heat flow transferred to air qair, stored by the bricks qbricks and the heat losses to the ambient through the adiabatic material qloss during the charging and discharging processes.
Figure 10.
The changes of the electrical power qe, the heat flow transferred to air qair, stored by the bricks qbricks and the heat losses to the ambient through the adiabatic material qloss during the charging and discharging processes.
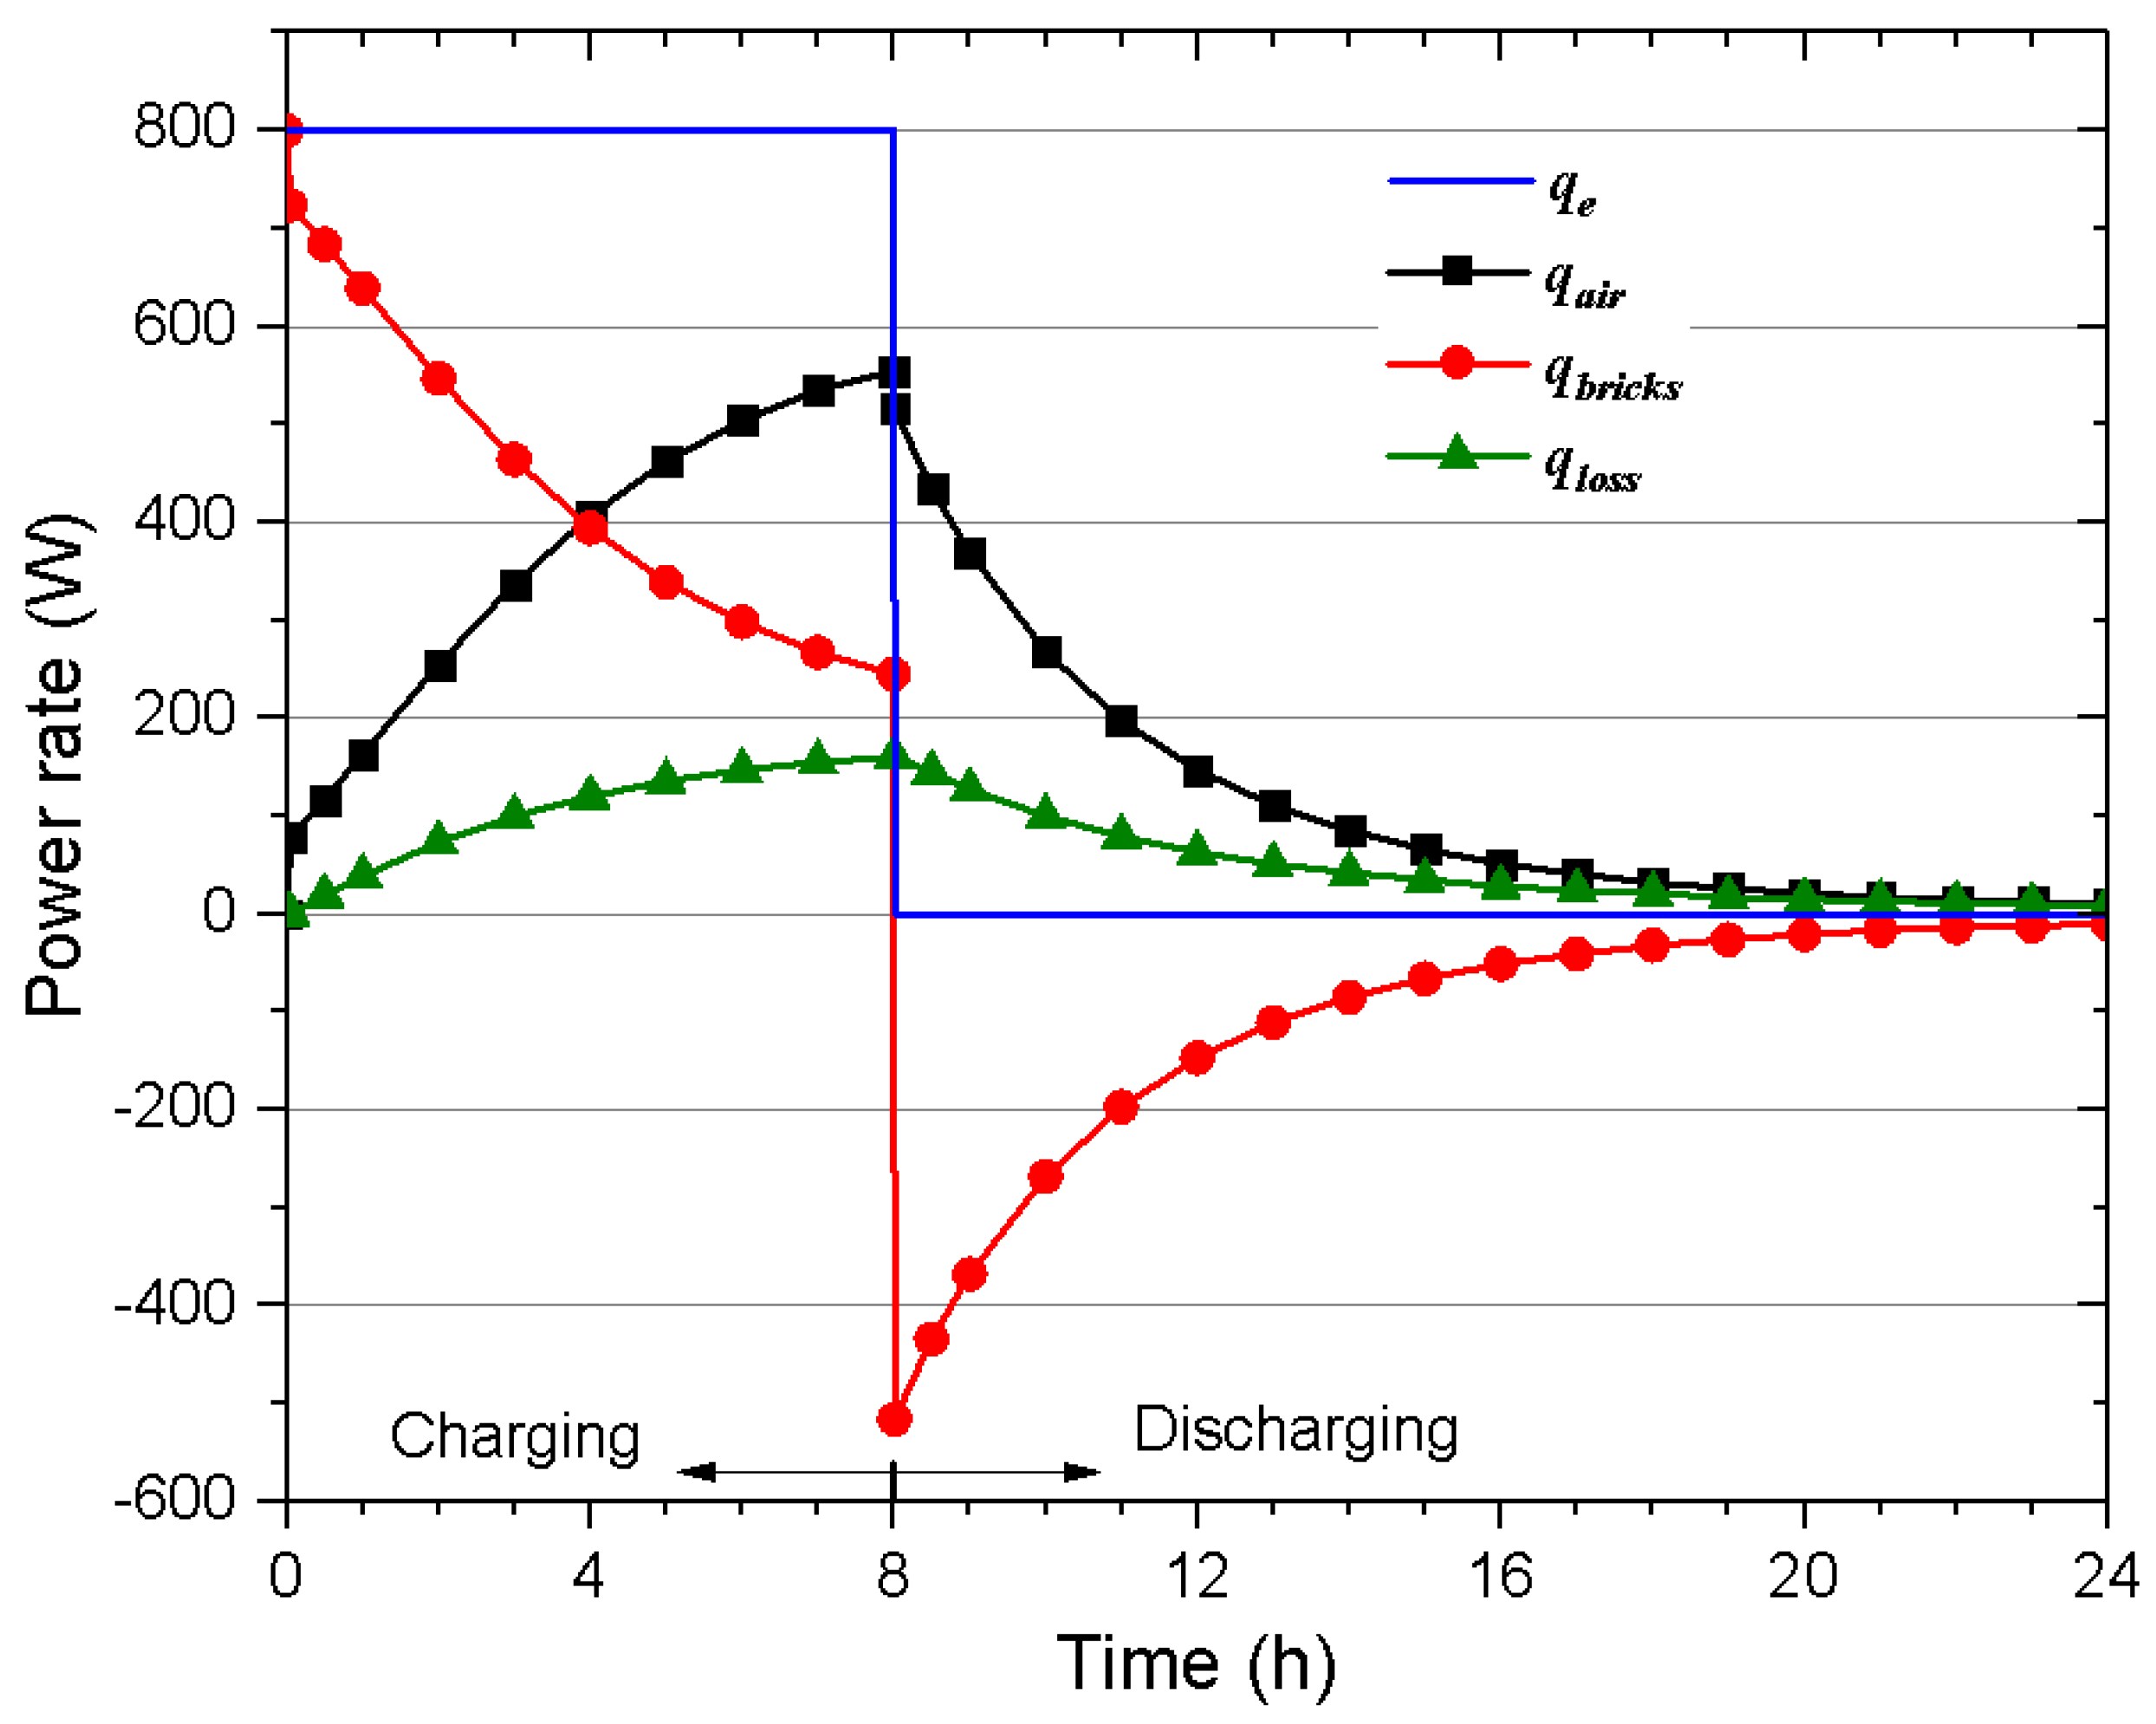
Figure 11.
The total energy transferred to the air Qair, stored by the bricks Qbricks and lost to the space Qloss during the charging and discharging processes.
Figure 11.
The total energy transferred to the air Qair, stored by the bricks Qbricks and lost to the space Qloss during the charging and discharging processes.

Table 1.
The thermal properties of the form-stable composite phase change brick.
| Property | Value |
|---|---|
| Density, ρ (kg m−3) | 2150 |
| Heat capacity, cp (J kg−1 K−1) | 1240 |
| Thermal conductivity, k (W m−1 K−1) | 1.3 |
| Phase change temperature, Tm (K) | 986 |
| Latent heat, hl (kJ kg−1) | 63.5 |
© 2018 by the authors. Licensee MDPI, Basel, Switzerland. This article is an open access article distributed under the terms and conditions of the Creative Commons Attribution (CC BY) license (http://creativecommons.org/licenses/by/4.0/).
Share and Cite
MDPI and ACS Style
Xu, G.; Hu, X.; Liao, Z.; Xu, C.; Yang, C.; Deng, Z. Experimental and Numerical Study of an Electrical Thermal Storage Device for Space Heating. Energies 2018, 11, 2180. https://doi.org/10.3390/en11092180
AMA Style
Xu G, Hu X, Liao Z, Xu C, Yang C, Deng Z. Experimental and Numerical Study of an Electrical Thermal Storage Device for Space Heating. Energies. 2018; 11(9):2180. https://doi.org/10.3390/en11092180
Chicago/Turabian StyleXu, Guizhi, Xiao Hu, Zhirong Liao, Chao Xu, Cenyu Yang, and Zhanfeng Deng. 2018. "Experimental and Numerical Study of an Electrical Thermal Storage Device for Space Heating" Energies 11, no. 9: 2180. https://doi.org/10.3390/en11092180
Note that from the first issue of 2016, this journal uses article numbers instead of page numbers. See further details here.