Practical Endurance Estimation for Minimizing Energy Consumption of Multirotor Unmanned Aerial Vehicles


1
EV Components & Materials R&D Group, Korea Institute of Industrial Technology, 6 Cheomdan-gwagiro, 208 beon-gil, Buk-gu, Gwangju 61012, Korea
2
Department of Mechanical Engineering, Chosun University, 309 Pilmun-Daero, Dong-gu, Gwangju 61452, Korea
*
Author to whom correspondence should be addressed.
Energies 2018, 11(9), 2221; https://doi.org/10.3390/en11092221
Submission received: 25 July 2018
/
Revised: 21 August 2018
/
Accepted: 22 August 2018
/
Published: 24 August 2018
Abstract
:The practically applicable endurance estimation method for multirotor unmanned aerial vehicles (UAVs) using a battery as a power source is proposed. The method considers both hovering and steady-level flights. The endurance, thrust, efficiency, and battery discharge are determined with generally available data from the manufacturer. The effects of the drag coefficient related to vehicle shape and payload weight are examined at various forward flight speeds. As the drag coefficient increases, the optimum speed at the minimum required power and the maximum endurance are reduced. However, the payload weight causes an opposite effect, and the optimal flying speed increases with an increase in the payload weight. For more practical applications for common users, the value of S × Cd is determined from a preliminary flight test. Given this value, the endurance is numerically estimated and validated with the measured flight time. The proposed method can successfully estimate the flight time with an average error of 2.3%. This method would be useful for designers who plan various missions and select UAVs.

1. Introduction
Drones are autonomous flying machines and range from large UAVs flying thousands of kilometers to small vehicles flying in confined spaces [1]. The global expenditures on commercial drones in 2014 stood at $700 million, and the market for drones is expected to increase to $1 billion by 2018, and reach $1.7 billion by 2025 [2]. UAVs are utilized in carrying out a variety of operations including military tasks, search-and-rescue missions, reconnaissance, and load transportation [3]. Because rotary wing UAVs can hover and have high maneuverability, most commercially used UAVs today have rotary wings with four or more propellers [4,5,6].
The endurance is an important issue in commercial applications, although multirotor UAVs can fly at various speeds and perform vertical take-off, landing, and hovering due to the advances in their control. The endurance depends on the power consumption of the propulsion system, and the flight time is limited due to the limited energy storage capacity. In addition to the propulsion system, the drag and weight of the craft strongly affect the flight time. The drag is related to geometrical and physical parameters such as the body shape, the wing shape, and the flight speed [7]. In most previous studies, endurance is typically estimated using the ratio of an available energy and power consumption based on the flight velocity, lift, and drag forces [8,9,10,11,12]. These works study aircrafts with fixed or one-rotary wings with quite different dynamics than UAVs based on multirotor platforms.
In the last few years, studies estimating endurance of multirotor UAVs using batteries as the energy source became available [13,14,15,16,17]. Verbeke, Hulens, Ramon, Goedeme, and De Schutter [13] reported that higher diameter propellers increased endurance and smaller propellers were more suitable for an attitude control. Gatti and Giulietti [14] estimated the gross take-off weight with respect to the hovering time and payload requirements. Gatti, Giulietti and Turci [15] proposed an analytical model for the estimation of hovering time with consideration of the rotor figure of merit and payload. Abdilla, Richards, and Burrow [16] derived a formula for the endurance estimation of hovering flight using a battery model with available and usable capacity factors. Cheng, Hua and Pin [17] estimated endurance for hovering and circular flights using a battery model with a discharged capacity-terminal voltage describing the discharge process of the batteries. Even though several researches have suggested endurance estimation methods, most common users of UAVs are difficult to apply these methods because detailed information about the airframe shape, propeller shape, size, and pitch are required. In addition, most previous approaches only can be applied to a hovering condition.
The purpose of this study is to propose a practical endurance estimation method applicable in the selection stage for designers, who are most common users integrating propulsion system, battery, and other equipment such as camera and nozzle according to the mission objective. To calculate the endurance for both hovering and steady-level flights, thrust is determined from the data on drag and weight using the Momentum Theory. The required power for propulsion is calculated given the thrust and efficiency information, which is generally available from the manufacturers. The final endurance is estimated with the battery discharge model. This method is validated with experimental results.
2. Materials and Methods
Let us consider commonly used multirotor drones with a payload in commercial applications. Multirotor drones employ propellers and electric motors for propulsion. In addition, the power is provided by lithium batteries, which are used in over 90% of these drones, owing to their high energy density and low weight [18]. The procedure for the endurance estimation is presented in Figure 1. The procedure is divided into two main steps: the calculation of the required power for propulsion and the battery discharge calculation. In the calculation of the required power, first, thrust is determined from the mission and weight information, and then the required power is obtained for propeller and motor specifications, which are currently available on the market. Thereafter, endurance is finally estimated for the required power and battery discharge.
2.1. Required Power Calculation
The flight maneuvers of multirotor UAVs are commonly controlled by the variation in the rotational speed of each motor. In a forward flight (pitch/roll), the vehicle is slightly inclined as shown in Figure 2. When the vehicle is straight and is in the steady-level flight mode, all forces should be balanced. Therefore, the thrust (T) can be expressed as
where W is the vehicle total weight and D is the drag force. The total weight includes weights of the vehicle (Wv), payload (Wp), and battery (Wb). Thus, the total weight is
The drag force can be written as [7]
where Cd is the drag coefficient, ρ is the air density at flight level, S is the projected frontal area, and U is the forward flight speed.
The required power of the rotor (Pre,rotor) for a forward flying aircraft is a sum of the induced power and the power for overcoming the drag [8]:
According to the momentum theory [8], the induced velocity (Ui) is given by
and
where A and θ are the disk area and the aircraft inclination angle, respectively. Given the tilt angle and flight speed, the induced velocity can be calculated using an iterative process. For multirotor UAVs, the total disk area A is calculated by the following equation:
where N is the number of propellers and r is the blade radius.
To calculate the required power for propulsion, the efficiencies (η) of all elements including the propeller and electric motors are considered. Then, the required power is expressed as
η is obtained from the generally available data from the manufacturer or by running an experiment. Manufacturers commonly give corresponding input powers of rotors with respect to various static thrusts. Then η is determined with an assumption that η is a function of only T.
2.2. Battery Discharge
In general, the available power (Pb,av) from batteries is given by
where i and Vb are the current draw and the battery voltage, respectively. From the definition, the capacity is calculated by multiplying the current draw and the discharge time (t). Peukert [15,19,20,21] established that the battery discharge rate affected its effective capacity. The actual available capacity C at the current draw i is expressed as
where C0 is the nominal battery capacity, t0 is the rated discharge time, and P is the Peukert’s coefficient, which depends on the battery type and temperature.
For a constant power discharge, the voltage of lithium batteries linearly decreases [22], and it is a function of the residual capacity (Cre) as follows:
where V0 is the rated full-charged voltage and k is the slope of the linear curve representing a battery voltage drop. When the voltage linearly decreases from V0 to the standard voltage (VS), the k is obtained from the following equation:
where λ is the fraction of the nominal capacity, where the discharge process shows linear behavior in which UAVs commonly operate for stable power supply.
2.3. Endurance Estimation
For a steady-level forward flight that requires constant power consumption, the endurance can be estimated by an iterative process as shown in Figure 3 because the voltage, current drawn, and effective capacity vary with the change in the residual battery capacity.
- Specify the time increment Δt, then time t is jΔt (j = 0, 1, 2, 3, …).
- In each time step, the battery voltage is calculated by Equation (11).
- The available battery power should be the same with the required power for propulsion (Pb,av = Pre). To maintain the same power, the required current with a decrease in voltage is increased and obtained in C (8).
- Based on the current, the actual available capacity is obtained in Equation (9) and the residual capacity can then be estimated using:
- Steps 2 through 4 are repeated until the remaining capacity converges Cj+1 ≈ (1 − λ) C0.
2.4. Specifications of UAV Employed for Validation
To estimate and validate the endurance, the multirotor UAV with six propellers (P22×6.6 Prop, T-MOTOR-HQ, Nanchang, Jiangxi, China), an electric motor (P60-KV170, T-MOTOR-HQ, Nanchang, Jiangxi, China), and a LiPo battery (Tattu, Dublin, CA, USA) as a power source was employed. Figure 4 shows a picture of the used UAV, and important parameters are summarized in Table 1. The rotor manufacturers commonly give information about input power and static thrust with respect to various rotating speeds, which are controlled by manipulating the throttle. The provided data from the manufacturer is presented in Figure 5. More thrust and power data are obtained by using spline interpolation from the given data, and then η is calculated by Equations (4)–(8) for U = 0. In this study, it is assumed that η is a function of only T, although propeller efficiency is actually influenced by the forward flight speed.
3. Results and Discussion
Pre,rotor is strongly influenced by the shape of the airframe because Cd of a structure depends on the object shape. In several works, the information about Cd for various objects is available [23,24], and some typical drag coefficients are presented in Table 2. To investigate the effect of an airframe shape, the Pre,rotor and endurance are calculated using various drag coefficients, and results are presented in Figure 6a,b, respectively. With two series batteries, the total vehicle weight W is 17.06 kg, C0 is 16,000 mAh and V0 is 49 V. Previous studies suggest that the LiPo battery has a Peukert’s coefficient P of 1.05 [21,25]. In this study, this value was used for endurance estimation. When UAVs are in the hovering mode (U = 0), the required power and endurance are the same regardless of body shape. When Cd is 0.004, Pre,rotor gradually decreases and the endurance has an opposite tendency when U ranges from 0 to 20 m/s. Except for the minimum drag coefficient case, the optimal flight speeds with minimum required power and maximum endurance exist. As the drag coefficient increases, the optimum speed is reduced.
As it was previously stated, both the induced power and the power for overcoming the drag determined the magnitude of Pre,rotor. To investigate the contribution of each power to the required power and endurance, Pre,rotor is represented in terms of the induced velocity, induced power, and the power for overcoming the drag in Figure 7. As U increases, the induced velocity Ui gradually decreases. Therefore, the induced power is reduced, although the magnitude of the thrust increases with an increase in flight speed. In contrast, as noted in Equations (3) and (4), the drag force and the power for overcoming the drag are proportional to the square and the third power of U, respectively. As a result, Pre,rotor initially decreases owing to a larger reduction in the induced power compared with increases in the power for overcoming the drag and reaches the minimum value. Thereafter, Pre,rotor increases owing to a large increase in the power for overcoming the drag force. However, Pre,rotor at the minimum value of Cd has a different behavior and gradually decreases, as in Figure 6a. In comparison with the reduction in the induced power, a relatively slow increase in the drag due to a small drag coefficient in the range of the observed flying speed is the cause of this difference.
UAVs for delivery missions have various payload weights. Figure 8a,b show Pre,rotor and the estimated endurance for various payloads. The ratio of Wp to Wv changes from 0 to 1 and Cd is fixed at 0.96. In the hovering mode (U = 0), Pre,rotor increases as Wp increases. When Wp/Wv is 1, the endurance is 9.3 min, which is less than half of the endurance (22.2 min) when Wp/Wv is 0. As Wp/Wv changes from 0 to 1, the optimum flying speed gradually increases. When Wp changes, the power for overcoming the drag remains constant at the same flight speed U, because the frontal area and Cd are unchanged. Therefore, an increase in the induced power leads to a larger optimal speed.
Both Cd and S are required to calculate the drag force. Cd could be measured in the wind tunnel test with the drag force measurement made at various wind speeds. However, it is not possible for common drone users to run this test. In addition, it is difficult to determine the exact S value due to complicated shape of drones. The value of S × Cd is determined by comparing an estimated optimal flight speed with the measured value from a preliminary flight test, and this value is 0.67 m2.
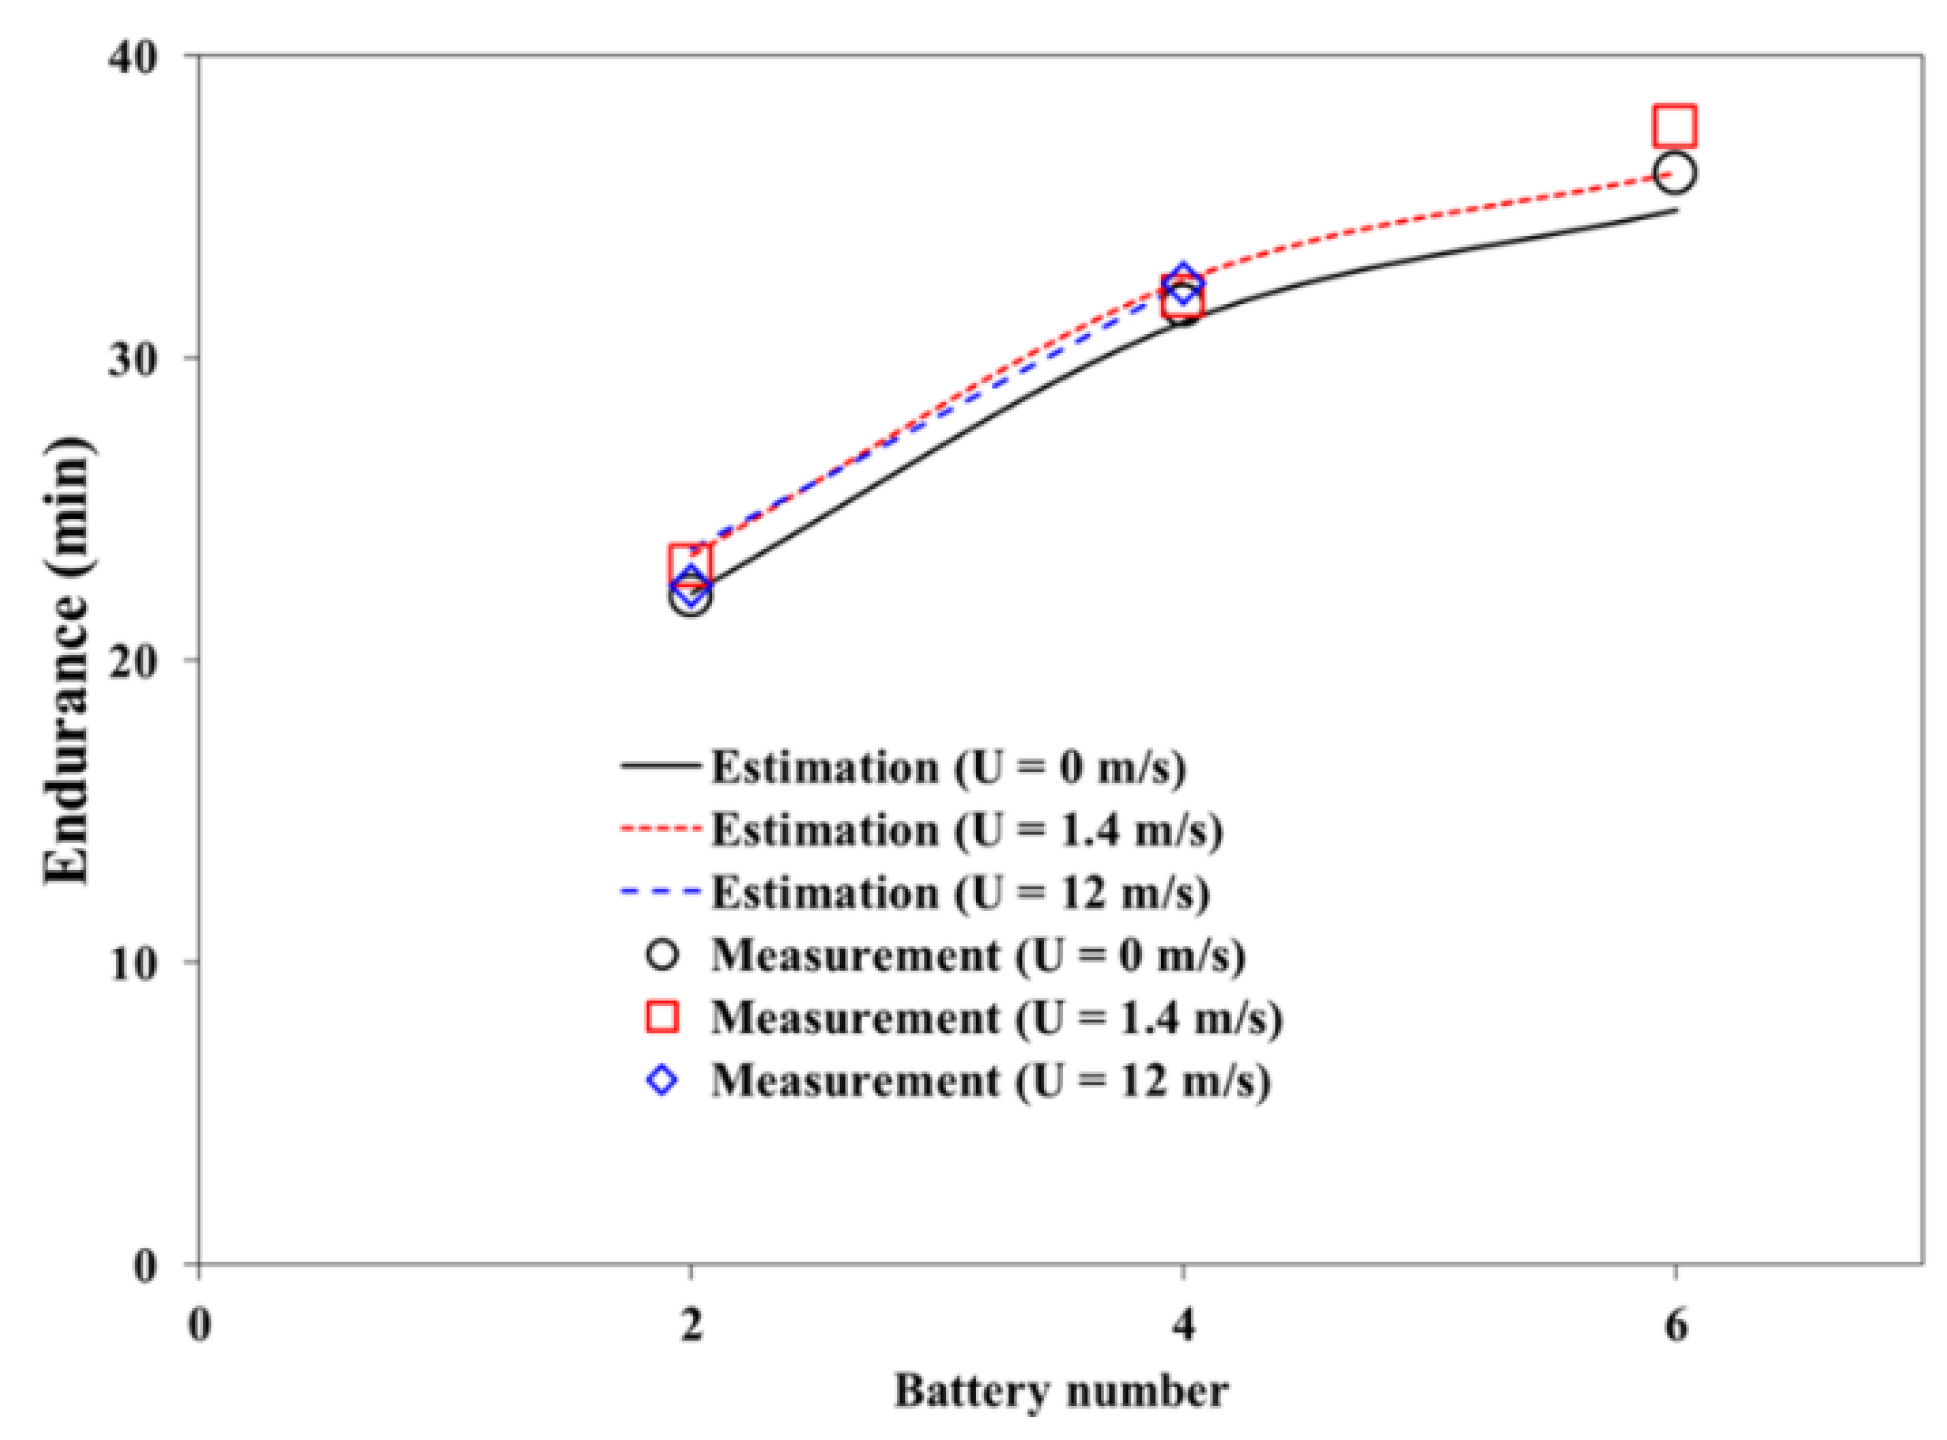
To validate the proposed endurance estimation, several endurance measurements are made for drones with various total weights and nominal capacities. W and C0 are varied by changing the number of batteries, and the test conditions are provided in Table 3. The endurance estimated by the proposed method is compared with the experimental results in Figure 9. Results show that the positive slope of the flight time decreases with an increase in the battery capacity. This implies that additional batteries are not an effective solution to increasing the endurance. The maximum difference between the measured and the estimated endurances is 5.47% and the average estimation error is 2.3%. Results show that the proposed method is suitable in the preliminary design phase.
The validation was conducted with a good weather condition for reducing external factors. However, weather conditions, especially a wind, can strongly influence the endurance. Winds along flight and vertical directions have similar effects with the forward flight speed and the payload change, respectively. When a wind blows in the opposite direction to a flight, it has a same effect with the increase of the forward flight speed. When a wind blows upwards, it affects like the reduction in payload weights. Therefore, the error could be occurred due to the external factors such as a wind although the estimation in this study shows a good agreement.
4. Conclusions
In this study, the practically applicable method for the estimation of the endurance of multirotor UAVs is proposed. This method considers both hovering and steady-level flights. The endurance, thrust, efficiency, and the battery discharge are determined with the generally available data from the manufacturer. The required power is calculated by considering thrust, drag force and efficiencies of the propeller and electric motors. The effective capacity and voltage drop are calculated to determine the battery discharge for a constant power discharge. The endurance is estimated by an iterative process. The effects of the drag coefficient related to vehicle shape and payload weight are examined at various forward flight speeds. As the drag coefficient increases, the optimum speed at the minimum required power and maximum endurance are reduced. However, the payload weight causes an opposite effect, and the optimal flying speed increases with an increase in the payload weight. For more practical applications for most common users, the value of S × Cd is determined from a preliminary flight test. Given this value, the endurance is numerically estimated and validated with the measured flight time. The proposed method can successfully estimate the flight time with an average error of 2.3%. The endurance can be estimated with this method if the flight path, distance, flight speed, and hovering time are known when a mission is made. This study would be useful for designers who plan various missions and select drones.
Author Contributions
Conceptualization, M.-h.H., H.-R.C. and S.Y.J.; Data curation, M.-h.H. and H.-R.C.; Formal analysis, S.Y.J.; Methodology, S.Y.J.; Supervision, S.Y.J.; Validation, M.-h.H.; Visualization, S.Y.J.; Writing—original draft, M.-h.H. and S.Y.J.; Writing—review & editing, M.-h.H., H.-R.C. and S.Y.J.
Funding
This study was supported by research fund from Chosun University, 2016.
Conflicts of Interest
The authors declare no conflicts of interest.
References
- Newcome, L.R. Unmanned Aviation: A Brief History of Unmanned Aerial Vehicles; American Institute of Aeronautics and Astronautics: Orlando, FL, USA, 2004. [Google Scholar]
- Rao, B.; Gopi, A.G.; Maione, R. The societal impact of commercial drones. Technol. Soc. 2016, 45, 83–90. [Google Scholar] [CrossRef]
- Cummings, M.L.; Bruni, S.; Mercier, S.; Mitchell, P. Automation Architecture for Single Operator, Multiple UAV Command and Control; Massachusetts Institute of Technology: Cambridge, MA, USA, 2007. [Google Scholar]
- Han, W.; Lei, Y.; Zhou, X. Application of unmanned aerial vehicle survey in power grid engineering construction. Electr. Power Surv. Des. 2010, 3, 019. [Google Scholar]
- Cai, G.; Dias, J.; Seneviratne, L. A survey of small-scale unmanned aerial vehicles: Recent advances and future development trends. Unmanned Syst. 2014, 2, 175–199. [Google Scholar] [CrossRef]
- Hoffmann, G.; Huang, H.; Waslander, S.; Tomlin, C. Quadrotor helicopter flight dynamics and control: Theory and experiment. In Proceedings of the AIAA Guidance, Navigation and Control Conference and Exhibit, Hilton Head, SC, USA, 20–23 August 2007. [Google Scholar]
- Bronz, M.; Moschetta, J.M.; Brisset, P.; Gorraz, M. Towards a long endurance mav. Int. J. Micro Air Veh. 2009, 1, 241–254. [Google Scholar] [CrossRef]
- Gordon, L.J. Principles of Helicopter Aerodynamics; Cambridge University: Cambridge, UK, 2000. [Google Scholar]
- Beekman, D.W. Micro air vehicle endurance versus battery size. In Proceedings of the SPIE International Society for Optical Engineering, Orlando, FL, USA, 5–9 April 2010. [Google Scholar]
- Figliozzi, M.A. Lifecycle modeling and assessment of unmanned aerial vehicles (Drones) CO2e emissions. Transp. Res. Part D 2017, 57, 251–261. [Google Scholar] [CrossRef]
- D’Andrea, R. Guest Editorial Can Drones Deliver? IEEE Trans. Autom. Sci. Eng. 2014, 11, 647–648. [Google Scholar] [CrossRef]
- Traub, L.W. Range and endurance estimates for battery-powered aircraft. J. Aircr. 2011, 48, 703–707. [Google Scholar] [CrossRef]
- Verbeke, J.; Hulens, D.; Ramon, H.; Goedeme, T.; De Schutter, J. The design and construction of a high endurance hexacopter suited for narrow corridors. In Proceedings of the International Conference on Unmanned Aircraft Systems, Orlando, FL, USA, 27–30 May 2014; pp. 543–551. [Google Scholar]
- Gatti, M.; Giulietti, F. Preliminary design analysis methodology for electric multirotor. IFAC Proc. 2013, 46, 58–63. [Google Scholar] [CrossRef]
- Gatti, M.; Giulietti, F.; Turci, M. Maximum endurance for battery-powered rotary-wing aircraft. Aerosp. Sci. Technol. 2015, 45, 174–179. [Google Scholar] [CrossRef]
- Abdilla, A.; Richards, A.; Burrow, S. Power and endurance modelling of battery-powered rotorcraft. In Proceedings of the IEEE/RSJ International Conference on Intelligent Robots and Systems (IROS), Hamburg, Germany, 28 September–2 October 2015; pp. 675–680. [Google Scholar]
- Cheng, F.; Hua, W.; Pin, C. Rotorcraft flight endurance estimation based on a new battery discharge model. Chin. J. Aeronaut. 2017, 30, 1561–1569. [Google Scholar] [CrossRef]
- Hassanalian, M.; Radmanesh, M.; Sedaghat, A. Increasing flight endurance of MAVS using multiple quantum well solar cells. Int. J. Aeronaut. Space Sci. 2014, 15, 212–217. [Google Scholar] [CrossRef]
- Peukert, W. Über die Abhängigkeit der Kapazität von der Entladestromstärke bei Bleiakkumulatoren. Elektrotechnische Zeitschrift 1897, 20, 20–21. [Google Scholar]
- Su, Y.; Liahng, H.; Wu, J. Multilevel Peukert equations based residual capacity estimation method for lead-acid batteries. In Proceedings of the IEEE International Conference on Sustainable Energy Technologies, Singapore, 24–27 November 2008; pp. 101–105. [Google Scholar]
- Traub, L.W. Calculation of constant power lithium battery discharge curves. Batteries 2016, 2, 17. [Google Scholar] [CrossRef]
- Tremblay, O.; Dessaint, L.-A. Experimental validation of a battery dynamic model for EV applications. World Electr. Veh. J. 2009, 3, 289–298. [Google Scholar] [CrossRef]
- Blevins, R.D. Applied Fluid Dynamics Handbook; Van Nostrand Reinhold Company: New York, UY, USA, 1984. [Google Scholar]
- Hoerner, S.F. Fluid-Dynamic Drag: Practical Information on Aerodynamic Drag and Hydrodynamic Resistance; Hoerner Fluid Dynamics: Bakersfield, CA, USA, 1965. [Google Scholar]
- Andrea, D. Battery Management Systems for Large Lithium Ion Battery Packs; Artech House: Boston, MA, USA, 2010. [Google Scholar]
Figure 1.
Procedure for estimating endurance.
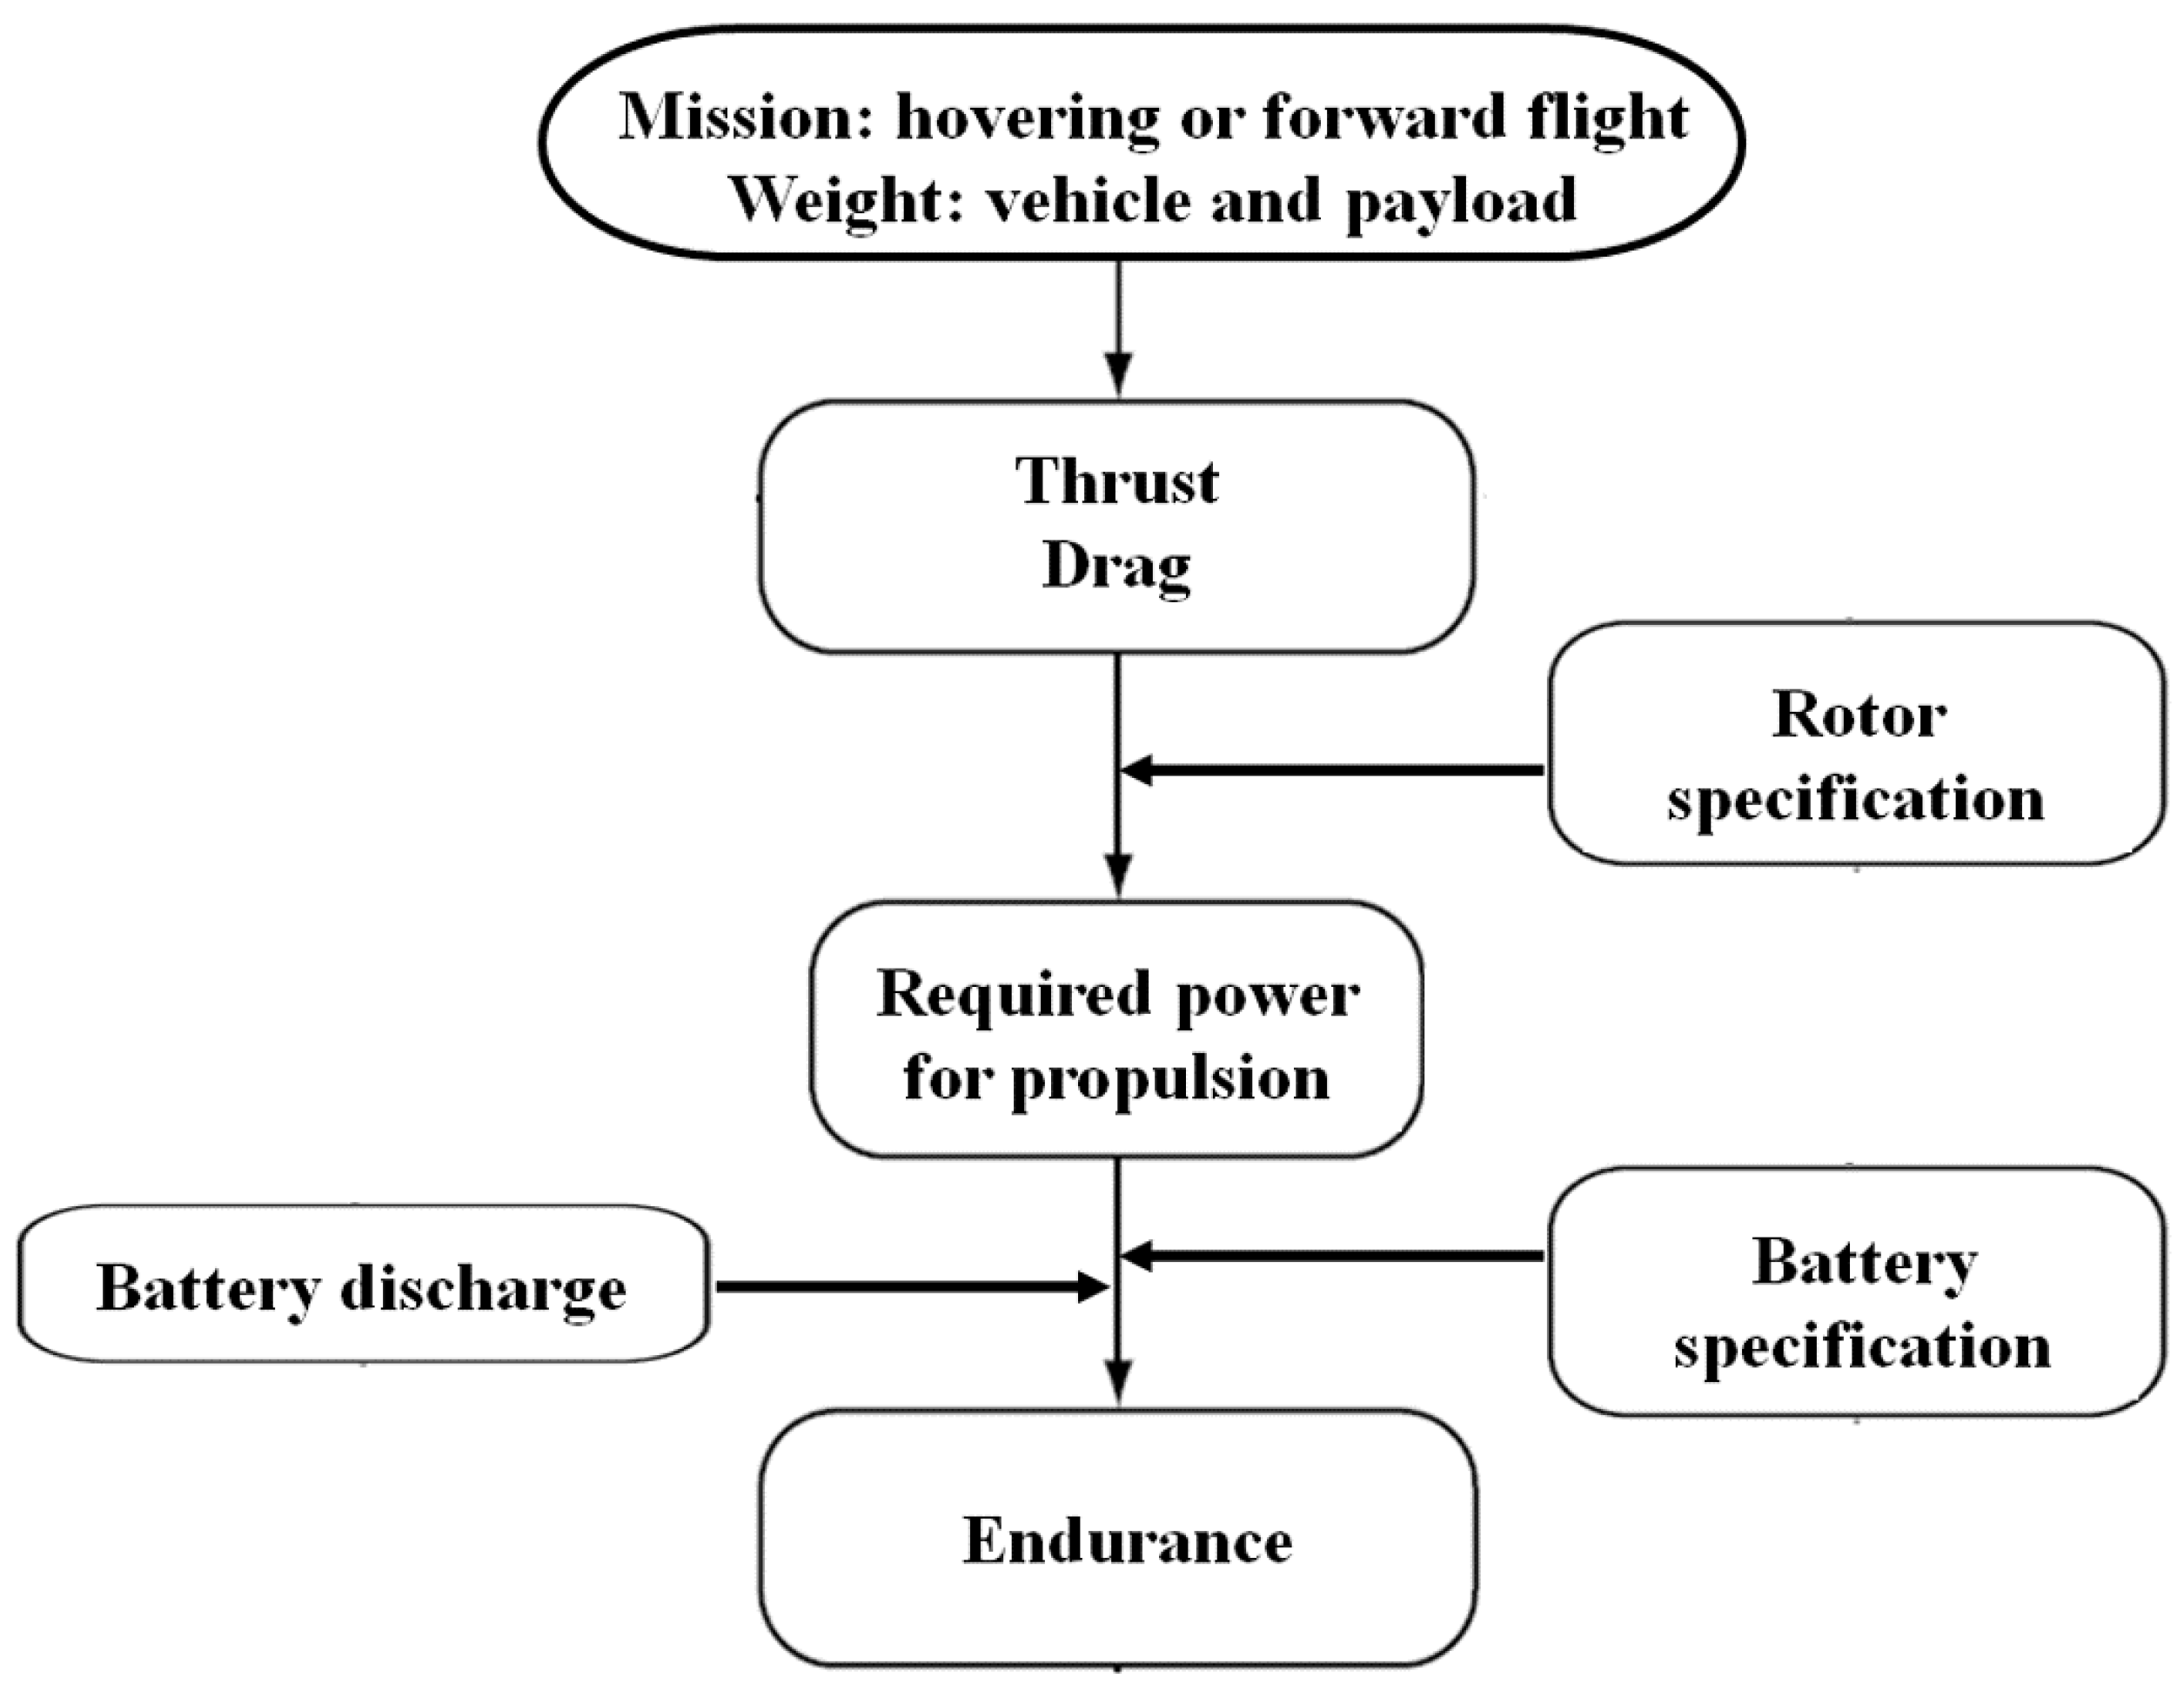
Figure 2.
Schematics of a planar view for a forward flight drone.
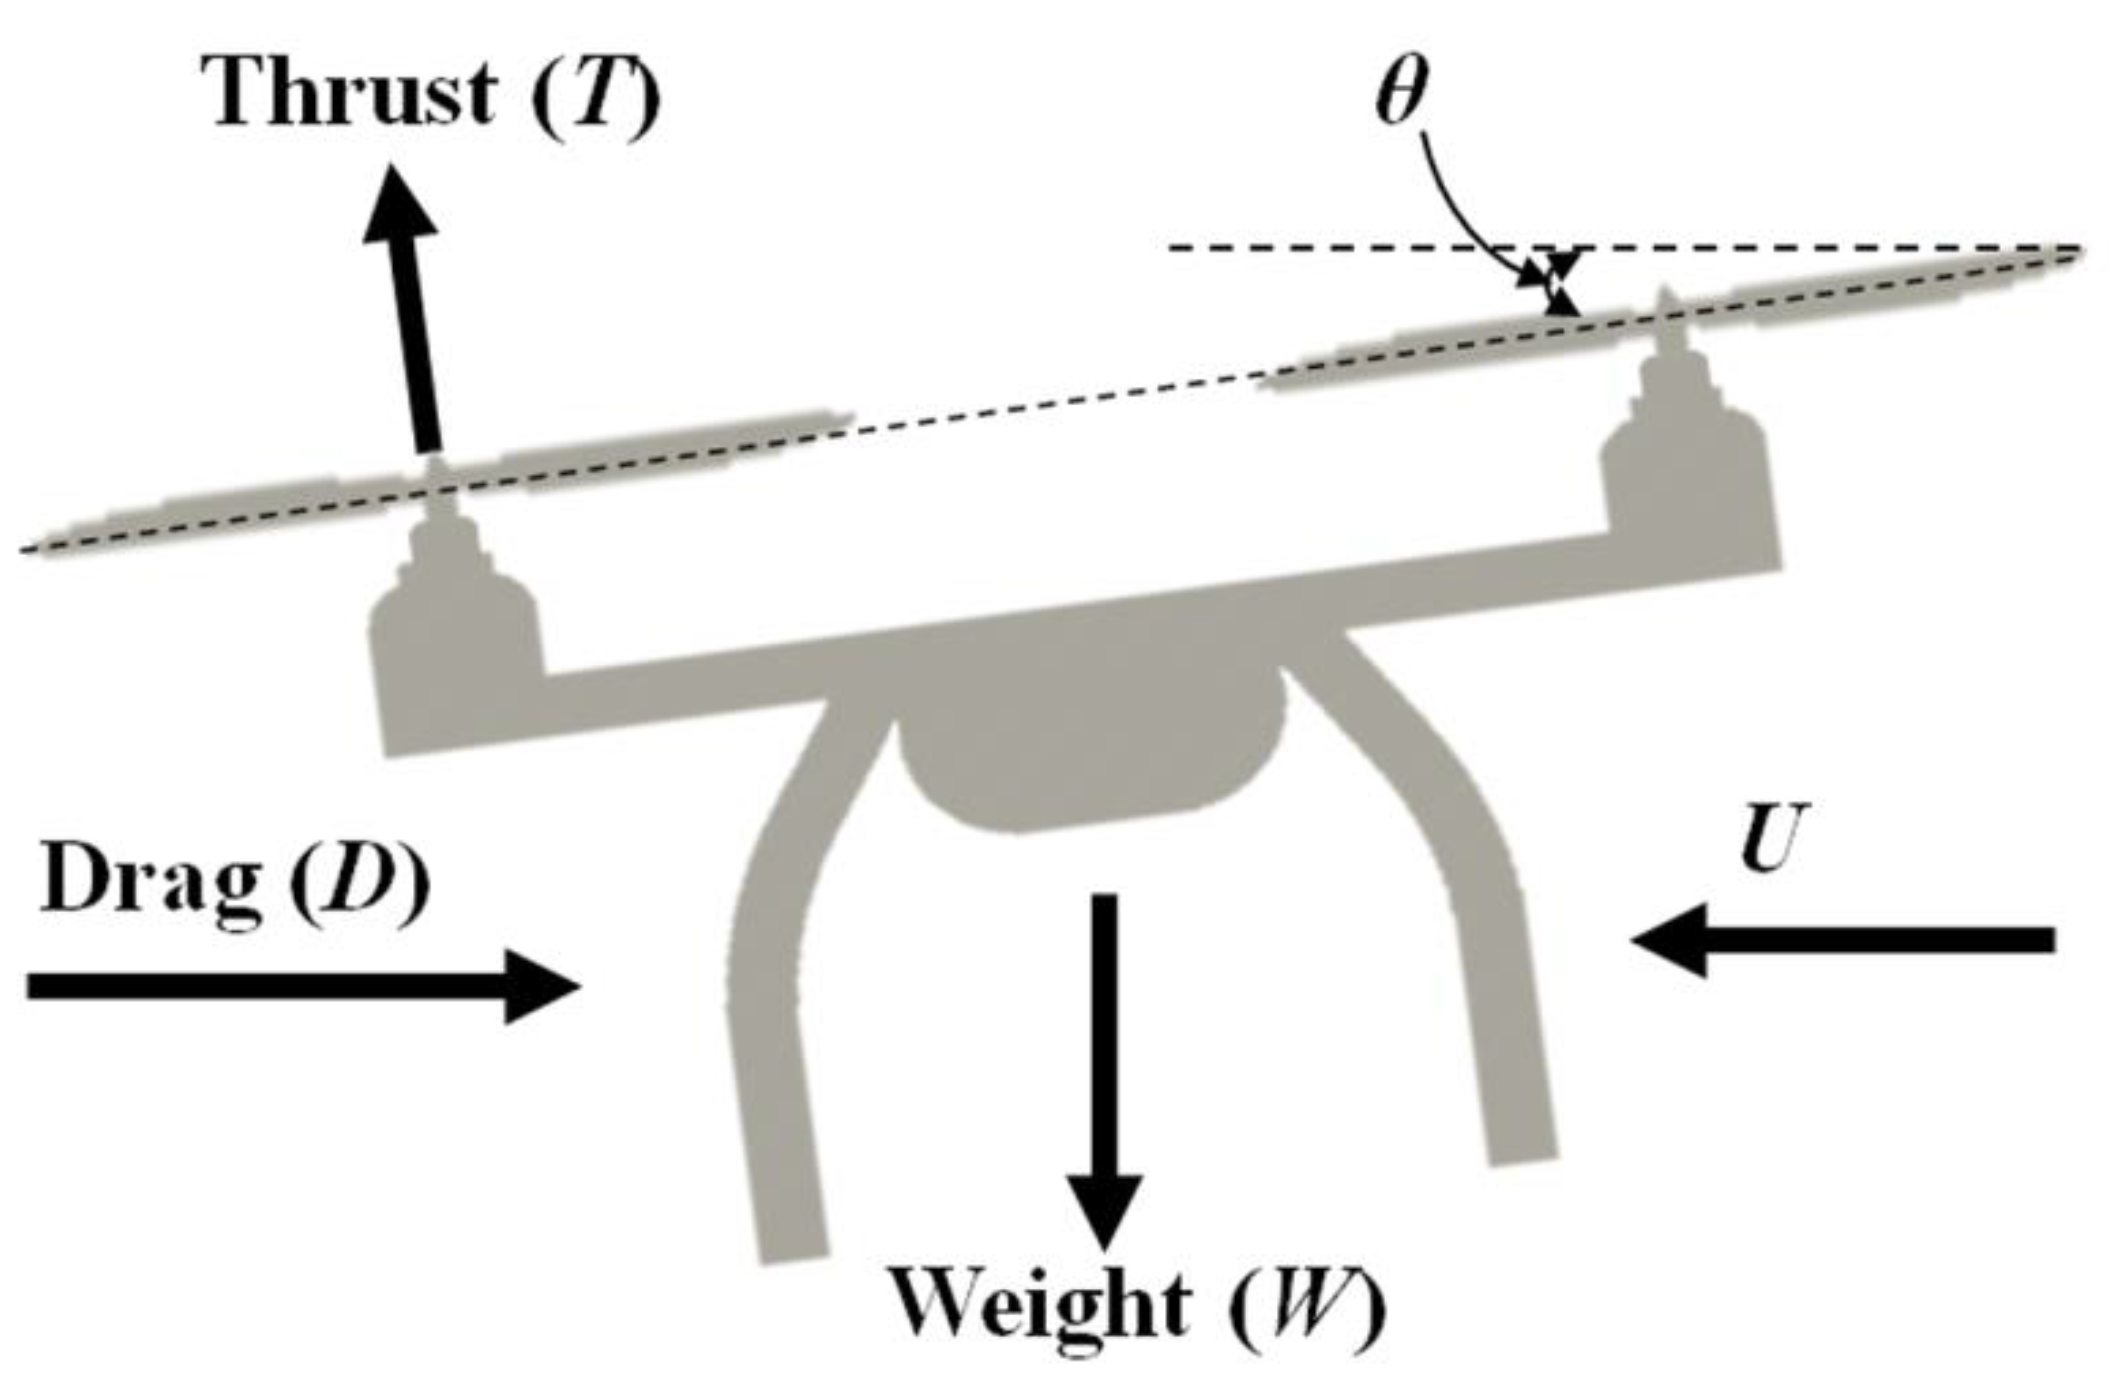
Figure 3.
Iteration process to estimate endurance from required power with consideration of battery discharge.
Figure 3.
Iteration process to estimate endurance from required power with consideration of battery discharge.

Figure 4.
Multirotor UAV used for numerical predication and experimental validation.

Figure 5.
Required power and thrust of rotor (propeller + motor) as a function of the rotating speed which is changed by changing throttle from 50 to 100%. The data is provided by manufacturer.
Figure 5.
Required power and thrust of rotor (propeller + motor) as a function of the rotating speed which is changed by changing throttle from 50 to 100%. The data is provided by manufacturer.
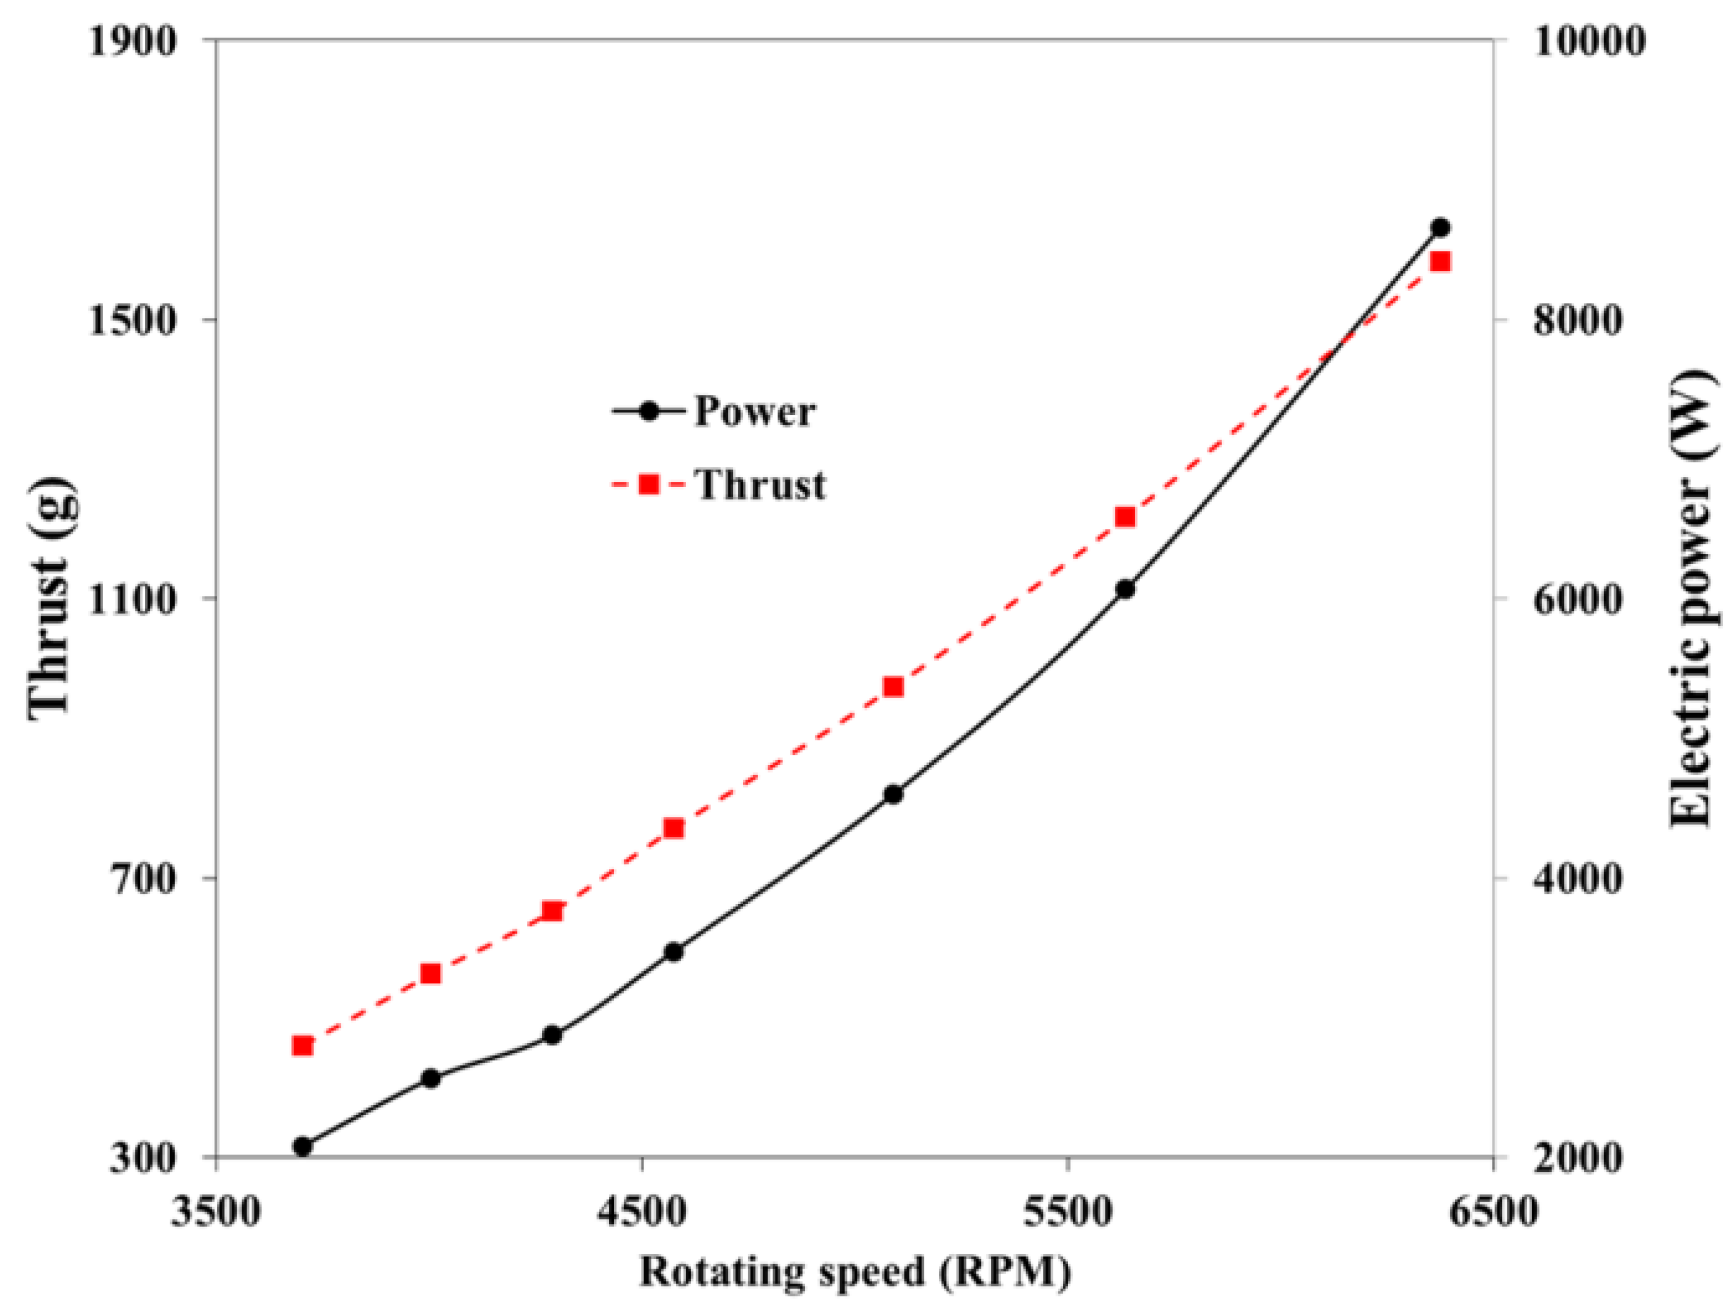
Figure 6.
(a) Rotor required power; (b) estimated endurance with various drag coefficients. W is 14 kg, C0 is 16,000 mAh and V0 is 49 V.
Figure 6.
(a) Rotor required power; (b) estimated endurance with various drag coefficients. W is 14 kg, C0 is 16,000 mAh and V0 is 49 V.
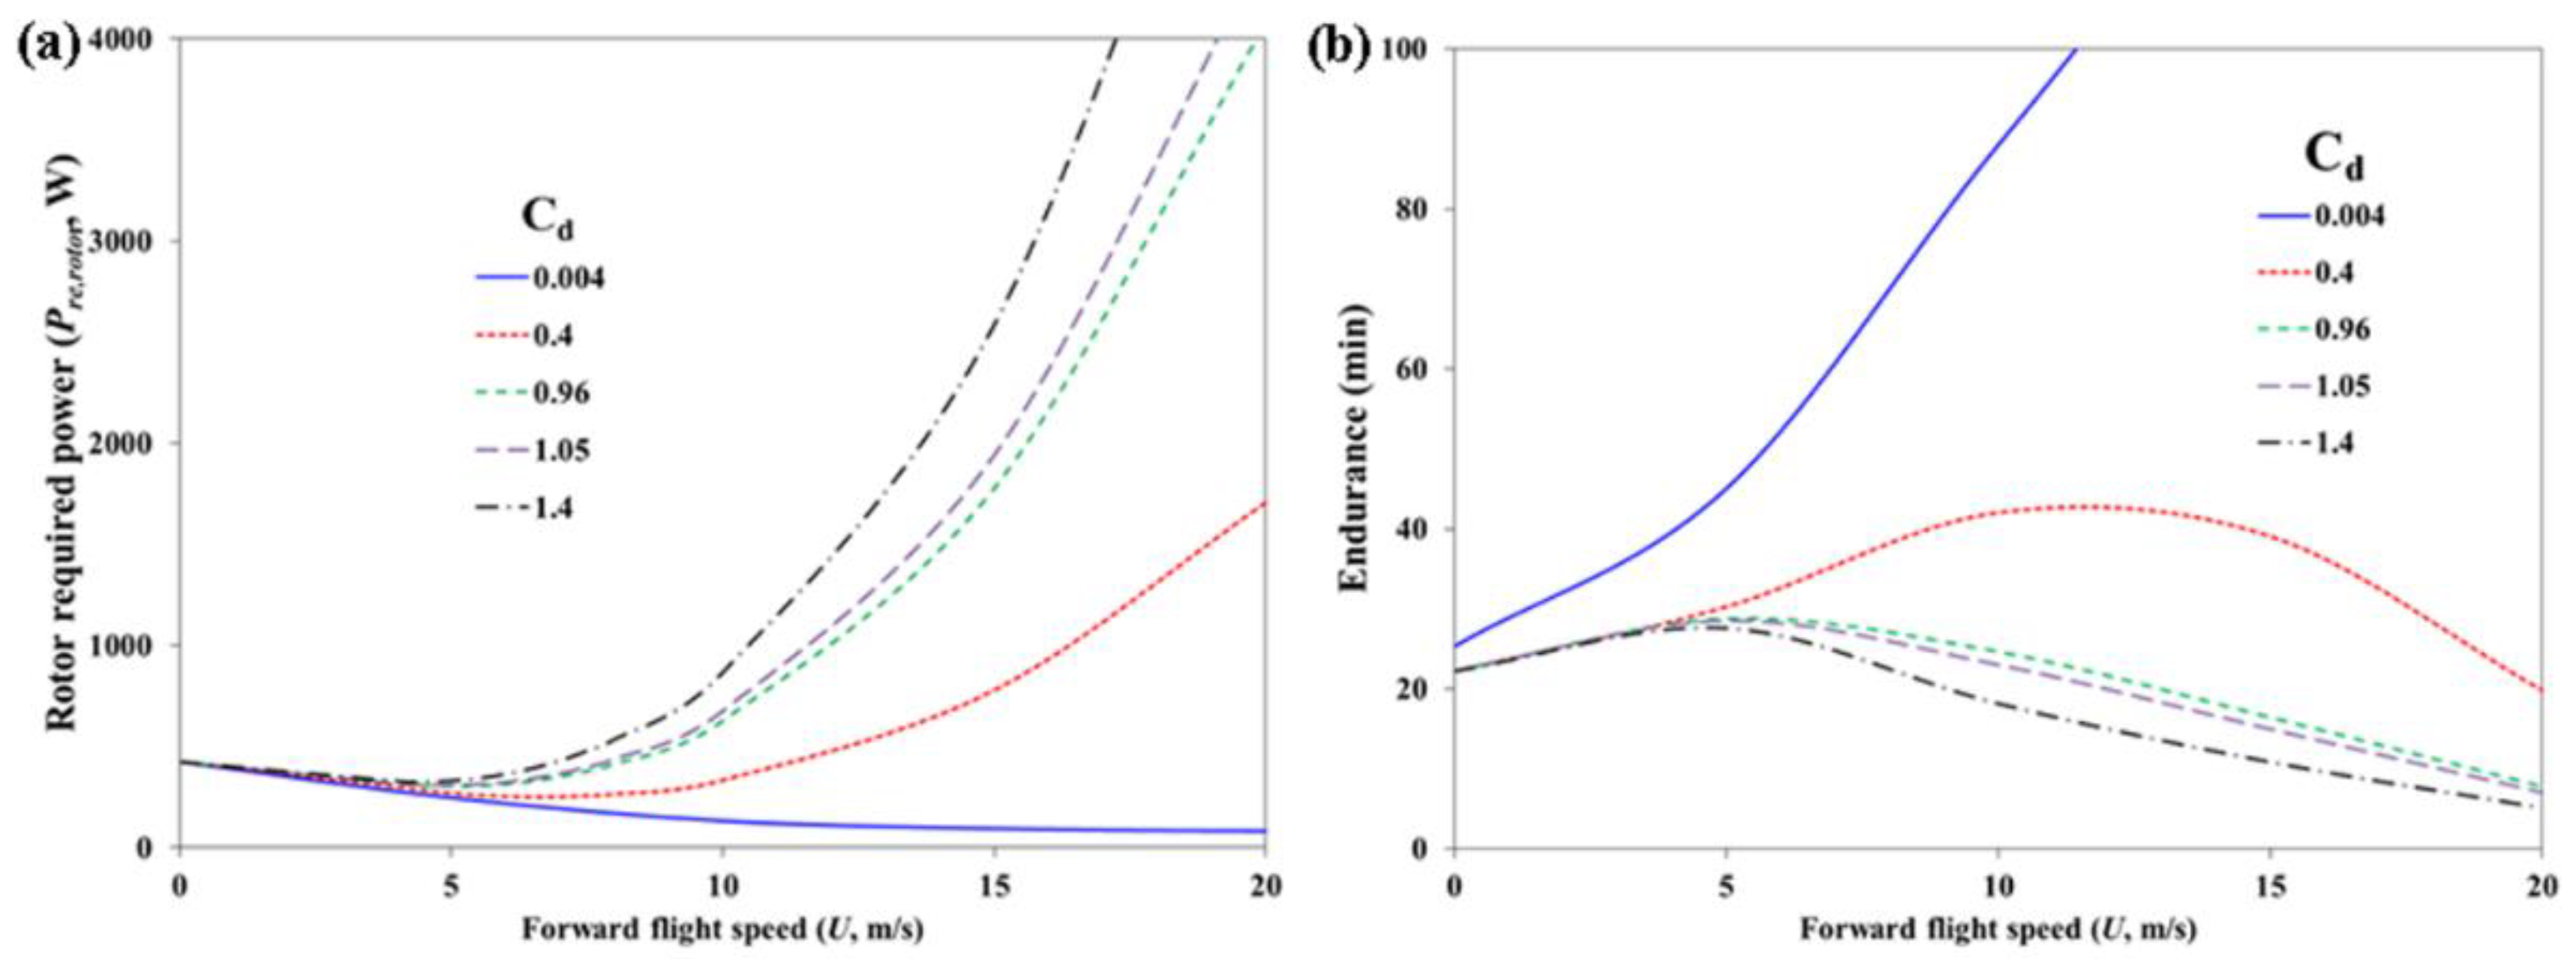
Figure 7.
Required rotor power, induced power and drag overcoming power with various flight speed. Induced velocity is also represented. W is 14 kg, Cd is 0.96, C0 is 16,000 mAh and V0 is 49 V.
Figure 7.
Required rotor power, induced power and drag overcoming power with various flight speed. Induced velocity is also represented. W is 14 kg, Cd is 0.96, C0 is 16,000 mAh and V0 is 49 V.

Figure 8.
(a) Rotor required power; (b) estimated endurance with various payload weights. Drag coefficient is 0.96, C0 is 16,000 mAh and V0 is 49 V.
Figure 8.
(a) Rotor required power; (b) estimated endurance with various payload weights. Drag coefficient is 0.96, C0 is 16,000 mAh and V0 is 49 V.
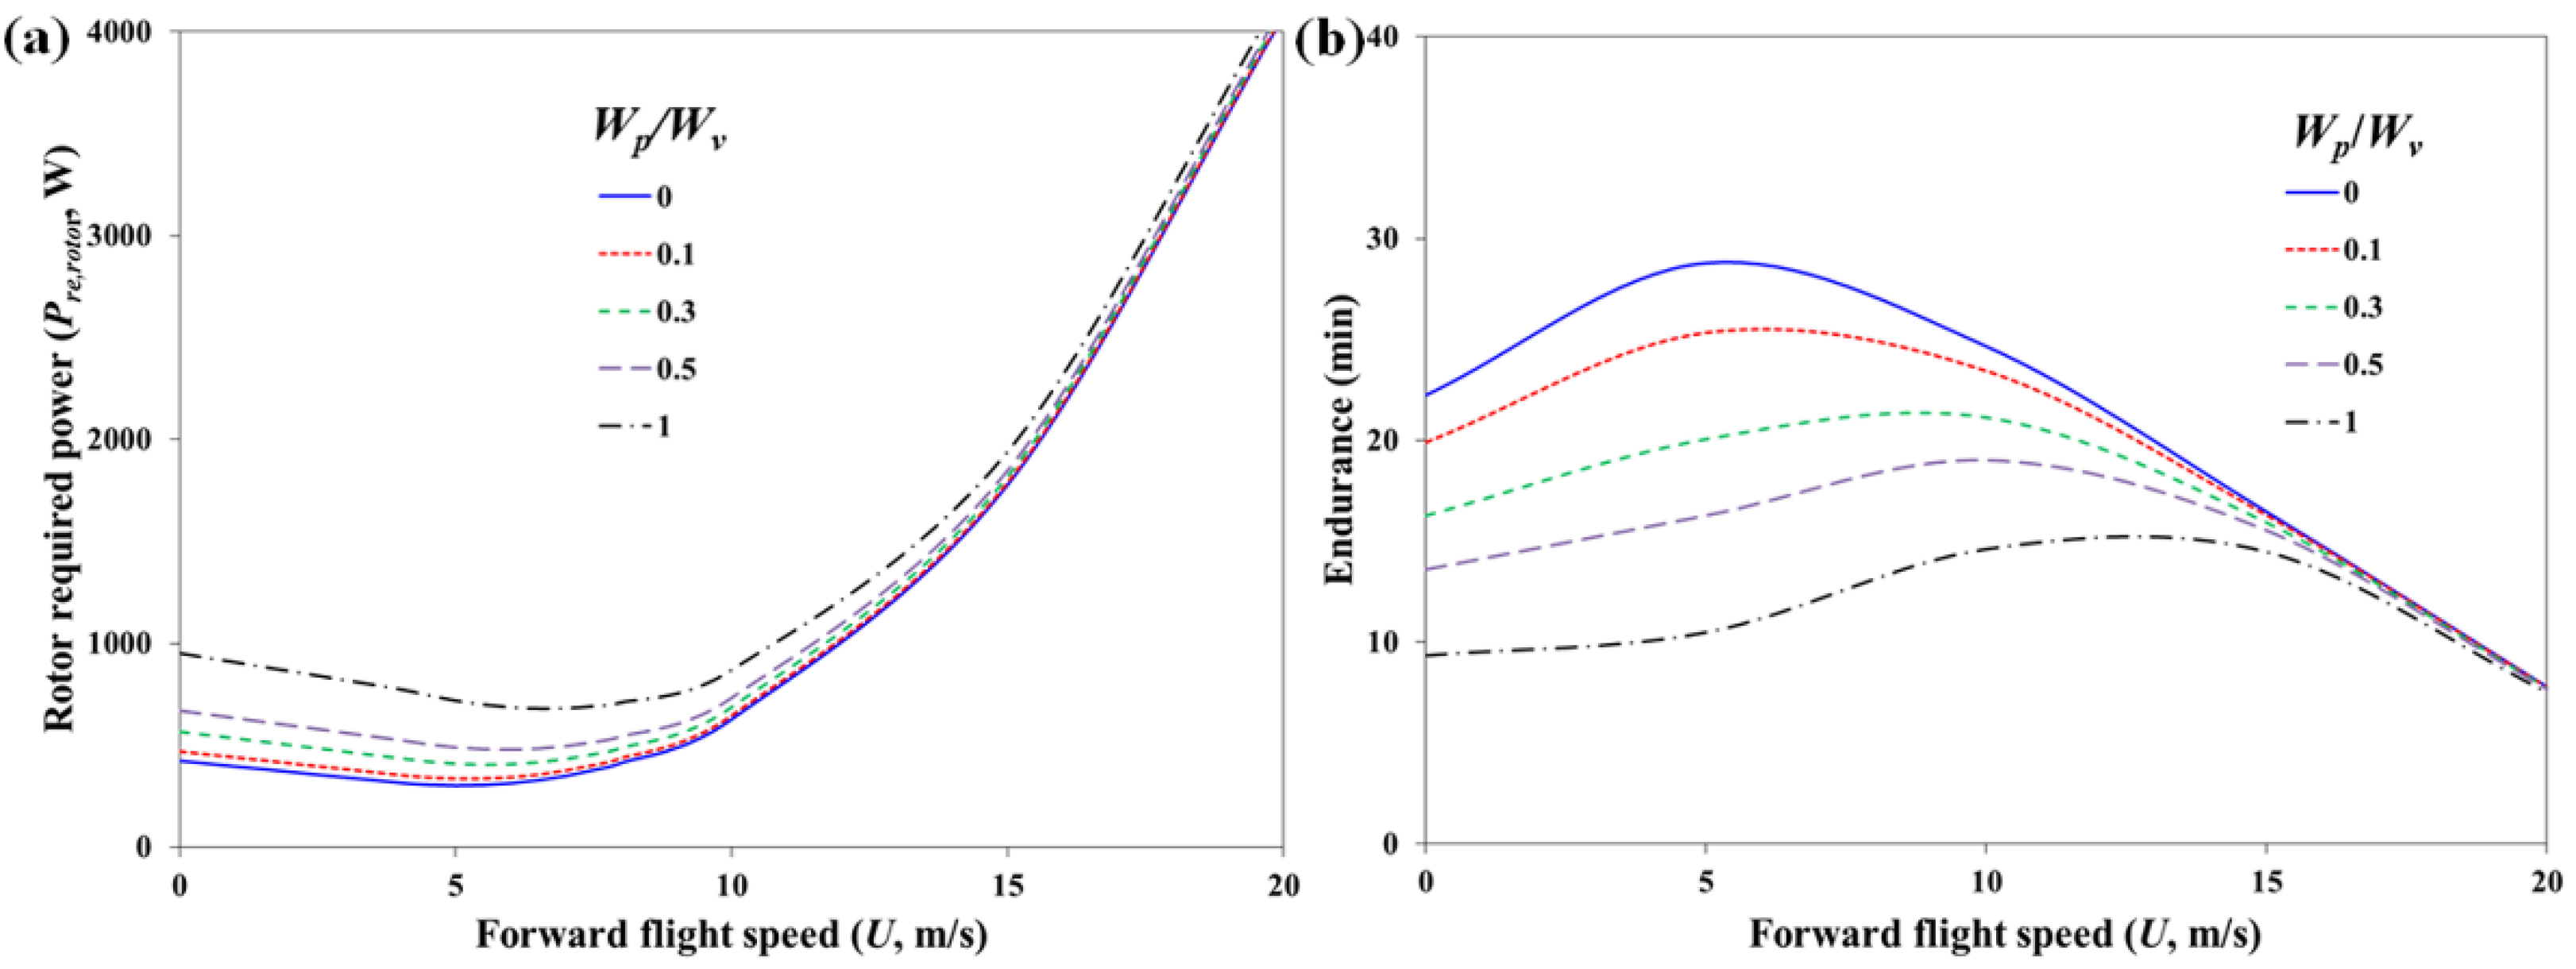
Figure 9.
Experimental validation of the proposed method.

Table 1.
Important parameters of employed multirotor UAV.
| Parameter | Symbol | Value | Units |
|---|---|---|---|
| Airframe | |||
| Number of rotor | N | 6 | |
| Vehicle weight | Wv | 10 | kg |
| Frontal area | S | 0.827 | m2 |
| Propeller radius | r | 558.8 | mm |
| Battery | |||
| Nominal capacity | C0 | 16,000 | mAh |
| Rated discharge time | t0 | 12 | min |
| Fully charged voltage | V0 | 24.5 | V |
| Standard voltage | VS | 22.2 | V |
| Weight | Wb | 2 | kg |
| Discharge fraction | λ | 0.7 | |
| Shape | Drag Coefficient | |
|---|---|---|
| Cube |  | 1.05 |
| Parachute |  | 1.4 |
| Truck |  | 0.96 |
| Large bird |  | 0.4 |
| Dolphin |  | 0.004 |
Table 3.
Tested condition and comparison of estimated/measured endurance.
| Number of Battery | Measured Full Charged Voltage (V0, V) | Nominal Capacity (C0, mAh) | Total Weight (W, kg) | Flight Velocity (U, m/s) | Endurance (min) | |
|---|---|---|---|---|---|---|
| Estimation | Measurement | |||||
| 2 | 49 | 16,000 | 14 | 0 | 22.24 | 22.15 |
| 2 | 49 | 16,000 | 14 | 1.4 | 23.50 | 23.11 |
| 2 | 49 | 16,000 | 14 | 12 | 23.70 | 22.47 |
| 4 | 49 | 32,000 | 18 | 0 | 31.21 | 31.73 |
| 4 | 49 | 32,000 | 18 | 1.4 | 32.58 | 32.04 |
| 4 | 49 | 32,000 | 18 | 12 | 32.47 | 32.48 |
| 6 | 49 | 48,000 | 22 | 0 | 34.91 | 36.15 |
| 6 | 49 | 48,000 | 22 | 1.4 | 36.15 | 37.67 |
© 2018 by the authors. Licensee MDPI, Basel, Switzerland. This article is an open access article distributed under the terms and conditions of the Creative Commons Attribution (CC BY) license (http://creativecommons.org/licenses/by/4.0/).
Share and Cite
MDPI and ACS Style
Hwang, M.-h.; Cha, H.-R.; Jung, S.Y. Practical Endurance Estimation for Minimizing Energy Consumption of Multirotor Unmanned Aerial Vehicles. Energies 2018, 11, 2221. https://doi.org/10.3390/en11092221
AMA Style
Hwang M-h, Cha H-R, Jung SY. Practical Endurance Estimation for Minimizing Energy Consumption of Multirotor Unmanned Aerial Vehicles. Energies. 2018; 11(9):2221. https://doi.org/10.3390/en11092221
Chicago/Turabian StyleHwang, Myeong-hwan, Hyun-Rok Cha, and Sung Yong Jung. 2018. "Practical Endurance Estimation for Minimizing Energy Consumption of Multirotor Unmanned Aerial Vehicles" Energies 11, no. 9: 2221. https://doi.org/10.3390/en11092221
Note that from the first issue of 2016, this journal uses article numbers instead of page numbers. See further details here.