Evaluation of Energy Consumption in German Hospitals: Benchmarking in the Public Sector


1
Department of Mechanical, Energy and Materials Engineering, University of Extremadura, 06006 Badajoz, Spain
2
Department of Graphical Expression, University of Extremadura, 06006 Badajoz, Spain
*
Author to whom correspondence should be addressed.
Energies 2018, 11(9), 2279; https://doi.org/10.3390/en11092279
Submission received: 20 June 2018
/
Revised: 7 August 2018
/
Accepted: 28 August 2018
/
Published: 30 August 2018
(This article belongs to the Special Issue Building Energy Use: Modeling and Analysis)
Abstract
:The use of benchmarking in the management of healthcare facilities enables immediate comparison between hospitals. Benchmarking allows ascertaining their expected energy consumption and estimating the possible savings margin. In the 2005–2015 period, 90 EU Eco-Audits of 23 public hospitals in Germany were studied to analyze the energy consumption related with weather conditions, built surface area, gross domestic product (GDP), geographic location (GL), bed numbers, and employee numbers. The results reveal that the average annual energy consumption of a hospital under normal conditions, both climatic and operational, is 0.27 MWh/m2, 14.37 MWh/worker, and 23.41 MWh/bed. The indicator dependent on the number of beds proved to be the most suitable as a reference to quantify the energy consumption of a hospital.
1. Introduction
Hospitals and healthcare centers actively contribute to the global emission of potentially harmful gases and particles into the atmosphere. According to Eckelman and Sherman (2016) [1], the US health sector was responsible for many air-pollution emissions and impacts (acid rain (12%), greenhouse gas emissions (10%), air pollution (10%), air pollutants (9%), stratospheric-ozone depletion (1%) and carcinogenic and noncarcinogenic air toxics (1%–2%)). These authors also highlighted that hospitals are the second most energy-consuming commercial buildings in the country, after the food service.
The total annual expenditure of about 2100 German hospitals is about EUR 60 billion, of which EUR 1.5 billion is spent on energy consumption. On average, Germany consumes around 6000 kWh of electricity and 29,000 kWh of heat per bed per year, which corresponds to the annual heating requirement of two single-family houses [2]. This means a hospital in Germany could easily spend EUR 500,000 per year in energy. Depending on their date of construction and the size, it is estimated that around 40% of electricity and 32% of heat could be saved, depending on the condition of the existing facilities, which in some cases do require some renovation [2]. A study by Christiansen et al. [3] revealed that the total gross expenses for German hospitals amounted to around EUR 87 billion, of which EUR 33.5 billion corresponded to material costs. Water and energy accounted for 6.6% of such expenditures, leading to a total of EUR 2.2 billion.
A study of healthcare establishments by Daschner et al. (2001) [4] showed that most of the air emissions from such installations are generated in the production and consumption of energy. This study also revealed that the generation of heat per bed per year in German hospitals required an energy input of 17,000,000 MWh.
A study on energy efficiency carried out in Spain in 2005 showed that energy consumption in the hospital sector reached 0.6 Mtoe, 6% of the consumption in the service sector, which, in economic terms, represents an expenditure of nearly EUR 600 million [5]. A similar study by Benke et al. (2009) [6] on energy efficiency in Austrian hospitals revealed that energy costs in Austrian hospitals were similar to those in German clinics and amounted to around EUR 1.5 billion, with energy consumption per bed of 5800 kWh of electricity and 28,500 kWh of heat per year.
In another energy-saving study, Thinate et al. [7] compared real energy use to predicted power consumption in 45 large-scale hospitals. The energy-saving evaluation was performed by using six factors: air conditioning areas, non-air-conditioning areas, inpatient department, outpatient department, staff members, and temperature.
Hu et al. [8] studied energy consumption in a hospital in Taiwan, noting that the use of heating, ventilation, and air-conditioning (HVAC) systems have a significant impact on electricity consumption, accounting for more than 50% of the hospital’s total energy consumption.
On the other hand, Rohde and Martinez [9] determined the power and usage patterns of medical equipment used in hospitals in Norway, finding that the daytime energy intensity of installed equipment alone was approximately 90 kWh/m2 per year.
The use of benchmarking in the management of healthcare facilities enables immediate comparison between different hospitals, offering information on whether the savings strategy used is appropriate, and the calculation of the margin for improvement. In Germany, the energy-saving potential of thermal and electrical energy management in public hospitals has not yet been studied systematically. However, a study conducted by the Fraunhofer-Institut für Umwelt-, Sicherheits- und Energietechnik [10] in 2009 revealed an average annual consumption of 24,670 kWh of heat and 7786 kWh of electricity per bed [11]. This study shows that all German hospitals generate heat consumption of 12.5 million MWh/year and an energy consumption of 3.9 million MWh/year. This leads to costs of around EUR 1.7 billion and an equivalent of €3448 per bed and year per hospital [12]. However, the actual average consumption in this type of building is currently unknown, and these indicators are not valid due to substantial progress in both efficient technologies and user sensitivity concerning environmental sustainability.
Since hospitals are usually set in a large number of old facilities that need renovation because they have become obsolete, and many hospitals do not have an optimized energy supply, there is significant potential for savings [10]. According to the North Rhine-Westphalia Energy Agency (NRW), successful examples show that it is possible to reduce energy costs in hospitals by up to 40%. A comparatively modest energy saving, for example, 5%, would mean an average annual saving of approximately €84,000 in a 500-bed hospital [10].
This research aims to analyze and quantify the average energy consumption in German public hospitals through different variables, establishing energy-operation ratios according to different structural indicators of the hospital: built area, number of beds, and number of workers. This research also explores the importance of energy benchmarking as a suitable methodology for measuring the performance of facilities against the healthcare objectives of a hospital. The results are hoped to be useful to the technicians and managers of a hospital when it comes to sizing, designing, and managing infrastructures.
2. Results
This section first presents the correlation analyses corresponding to the morphological analysis of hospitals and the studies that analyze the average annual energy consumption and the indicators considered in the study (number of beds, built surface area, and number of workers) [13]. It then explains the results of the analysis of variance (ANOVA), according to the factors listed in Table 1. Third, baseline indicators are proposed to measure the energy consumption of a hospital regarding the indicators analyzed.
2.1. Morphological Analysis of Hospitals
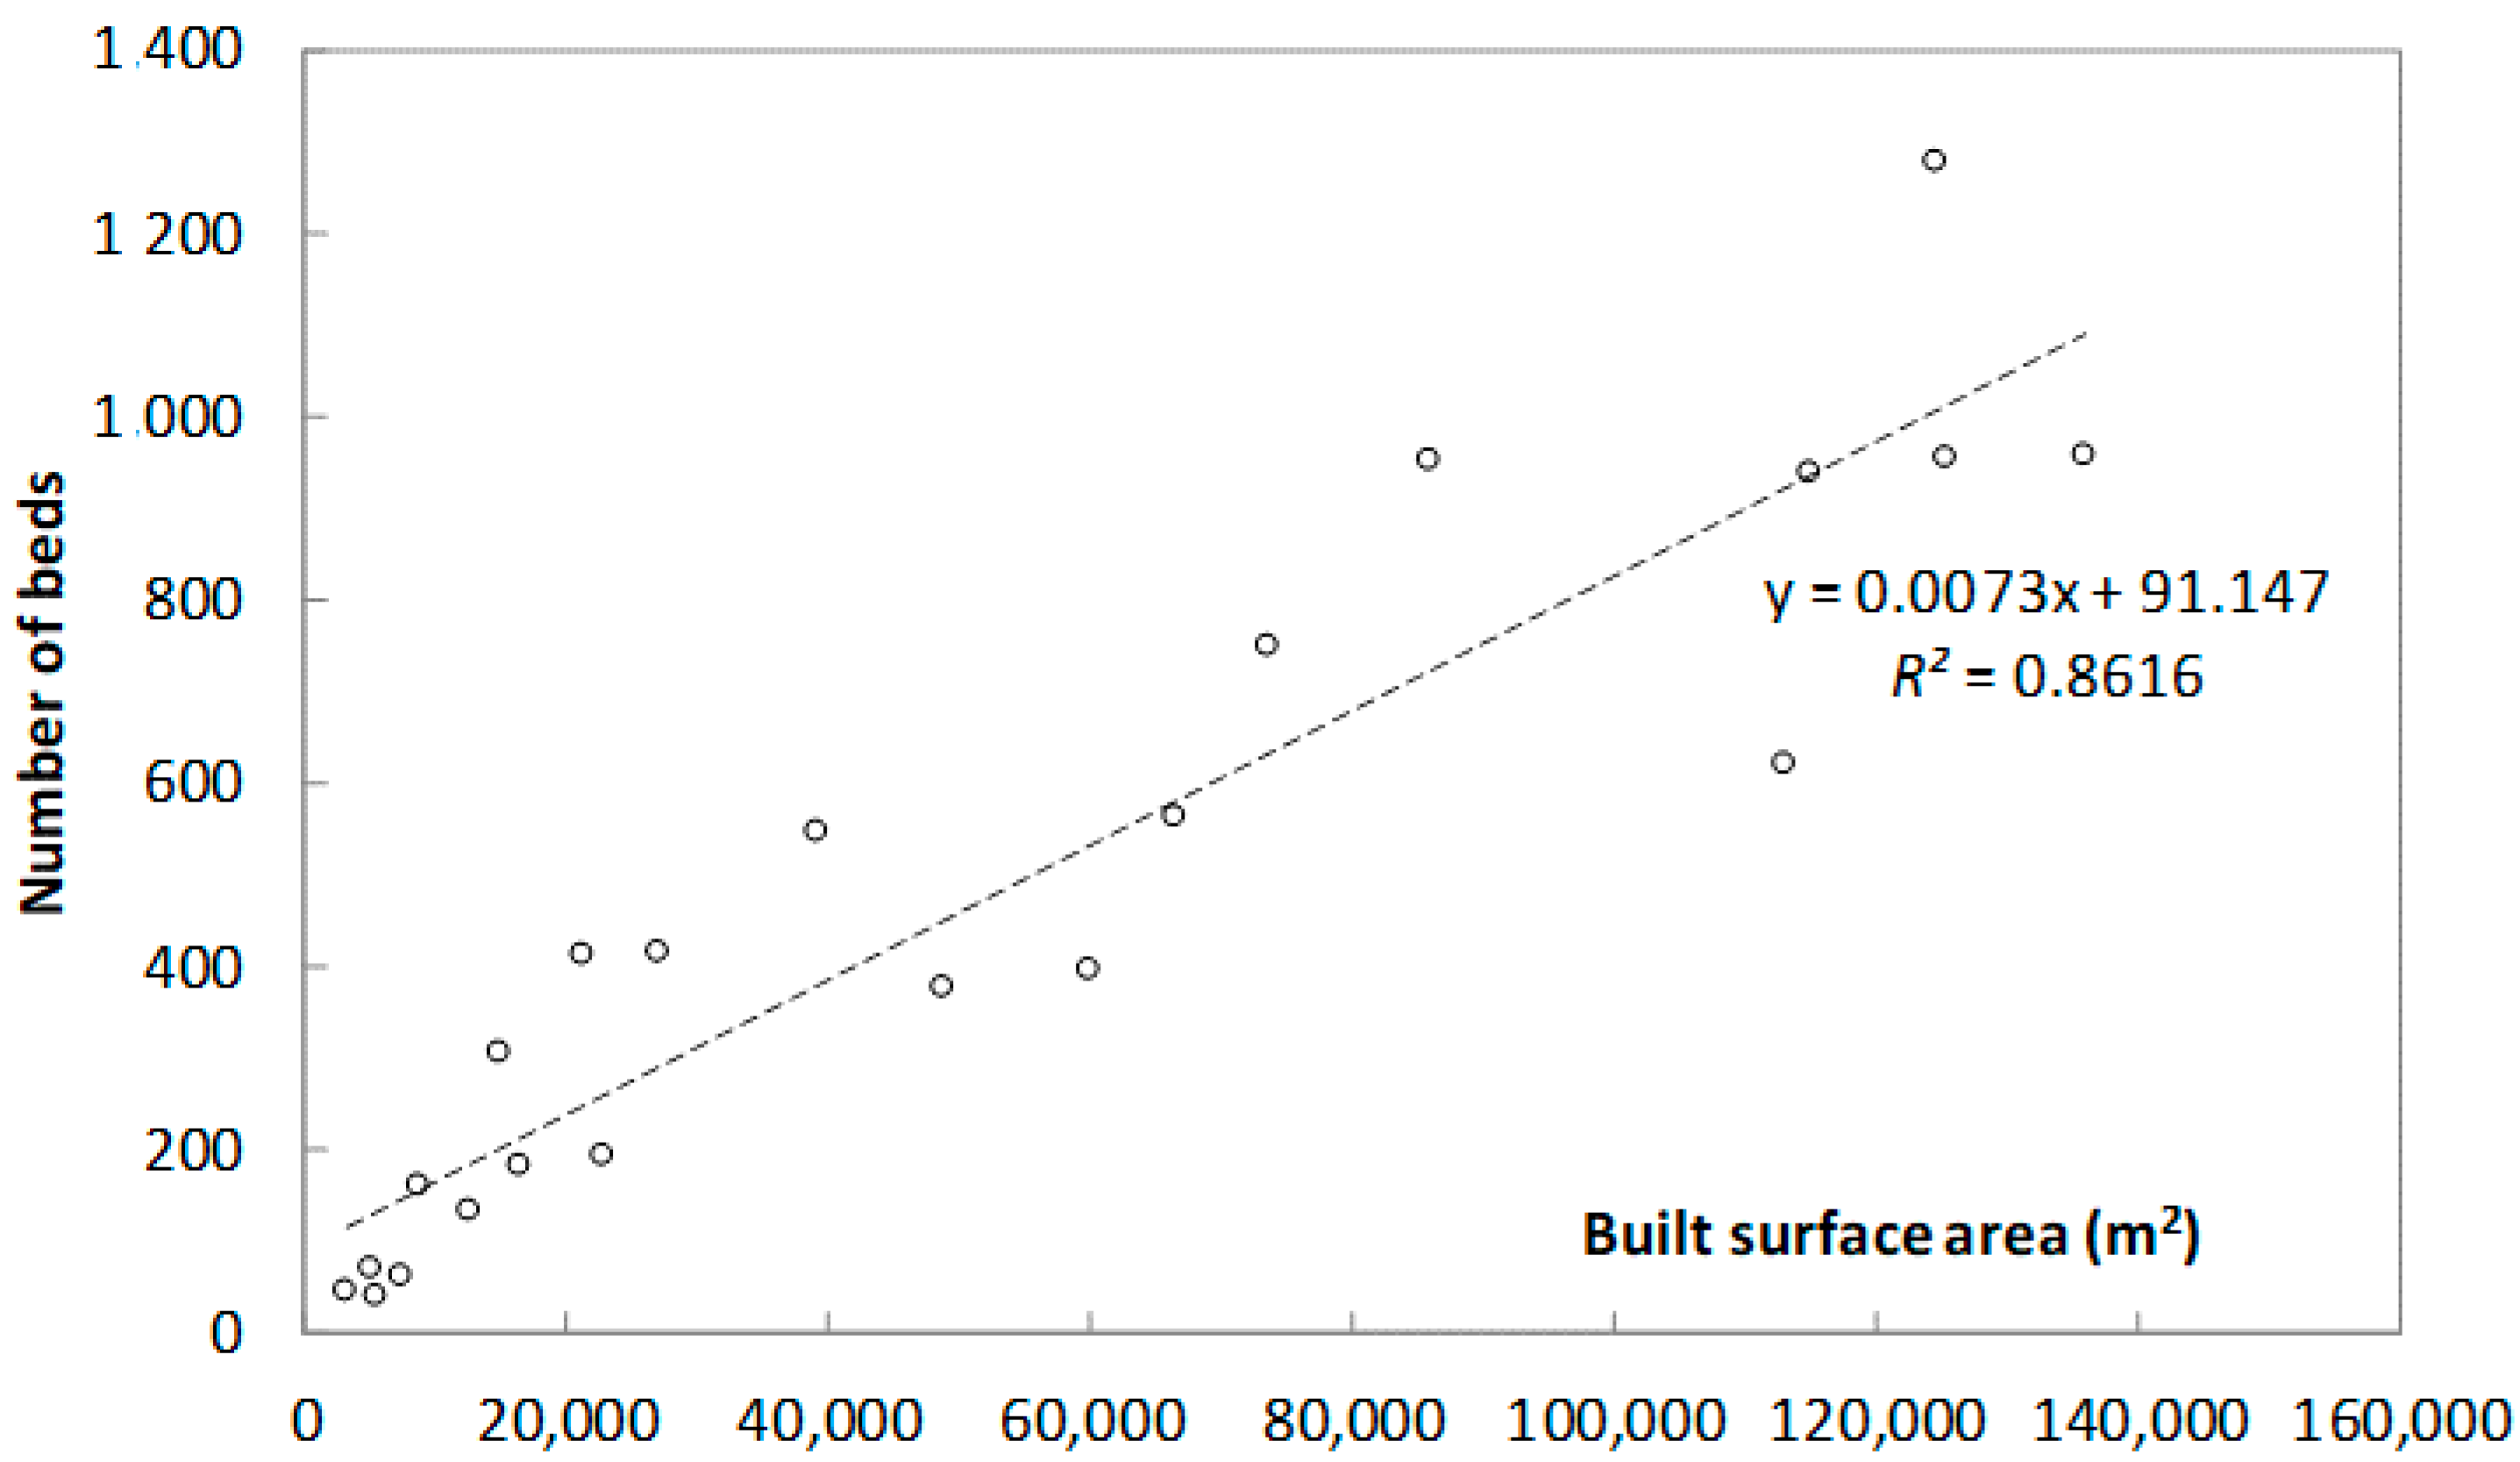
Figure 1 shows the relationship between the built surface area and number of hospital beds in the hospitals analyzed in the sample. It shows a high correlation between both variables, which implies that all the hospitals analyzed are similar from a morphological point of view.
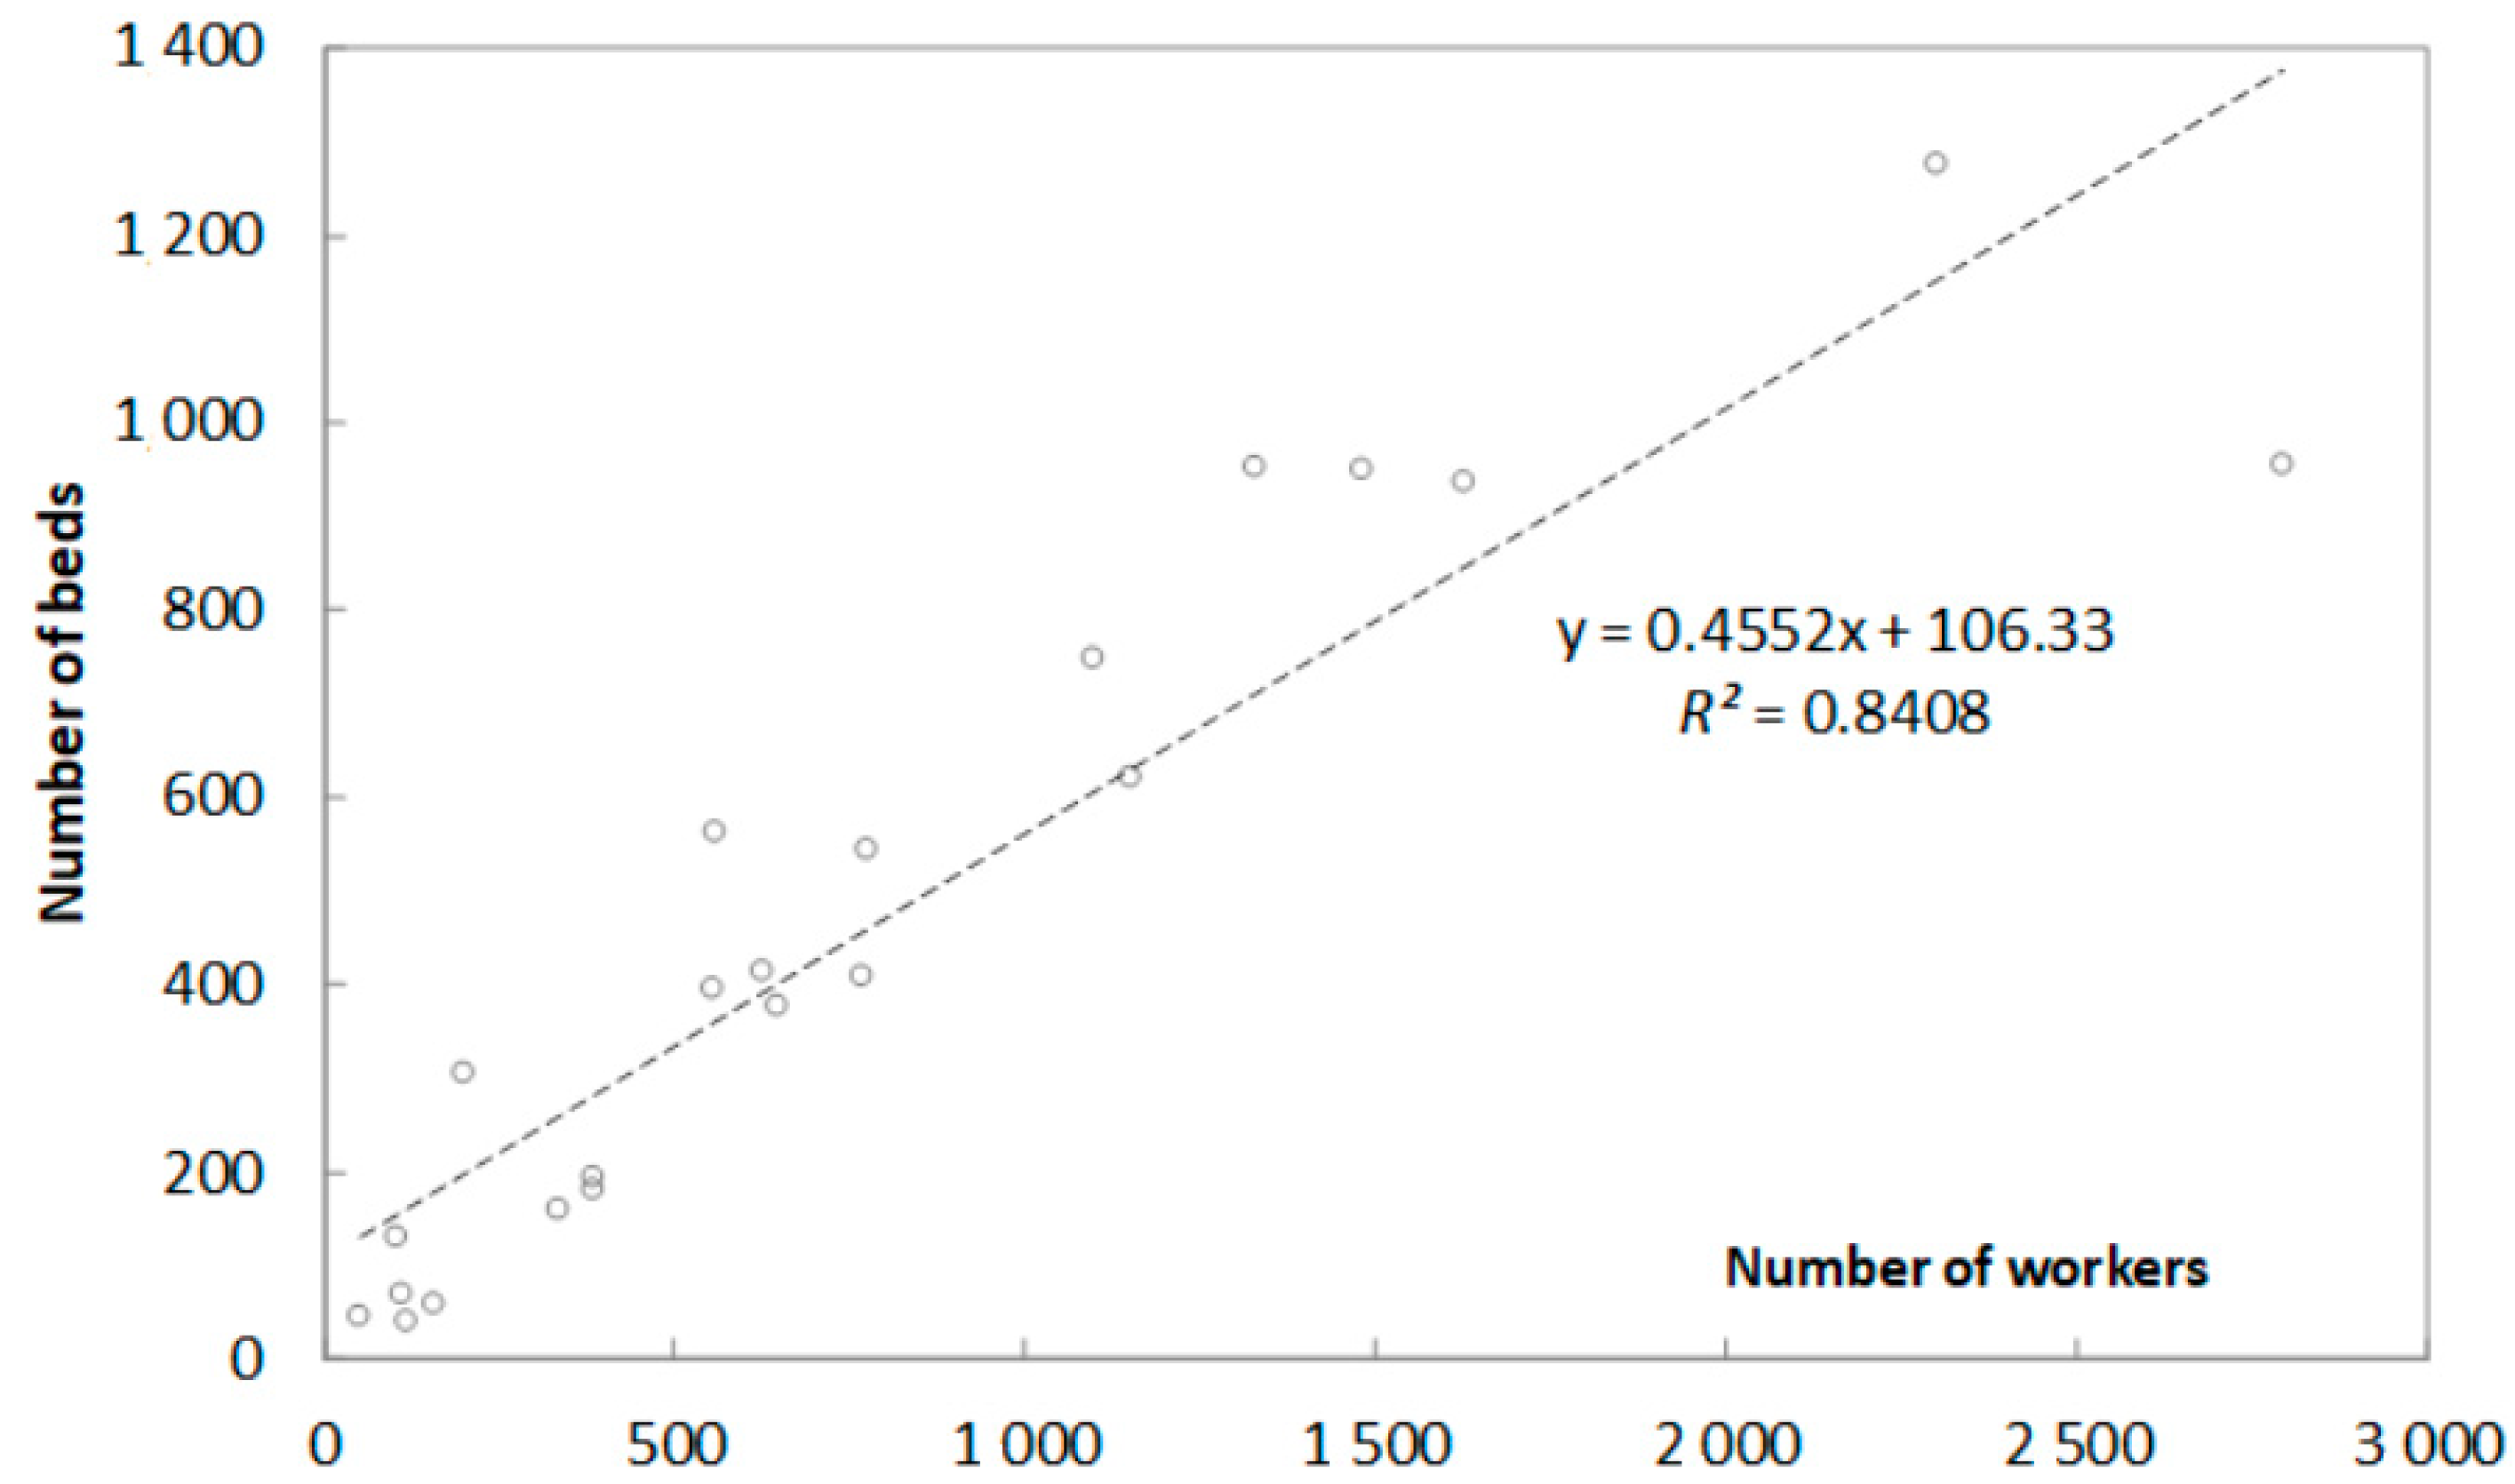
The relation between the number of beds and the number of workers in a hospital was also analyzed, and the correlation shown in Figure 2 was found. This confirms that all the hospitals analyzed are similar from a morphological point of view.
2.2. Correlation between Average Annual Energy Consumption and Built Surface Area, Number of Workers, and Number of Beds
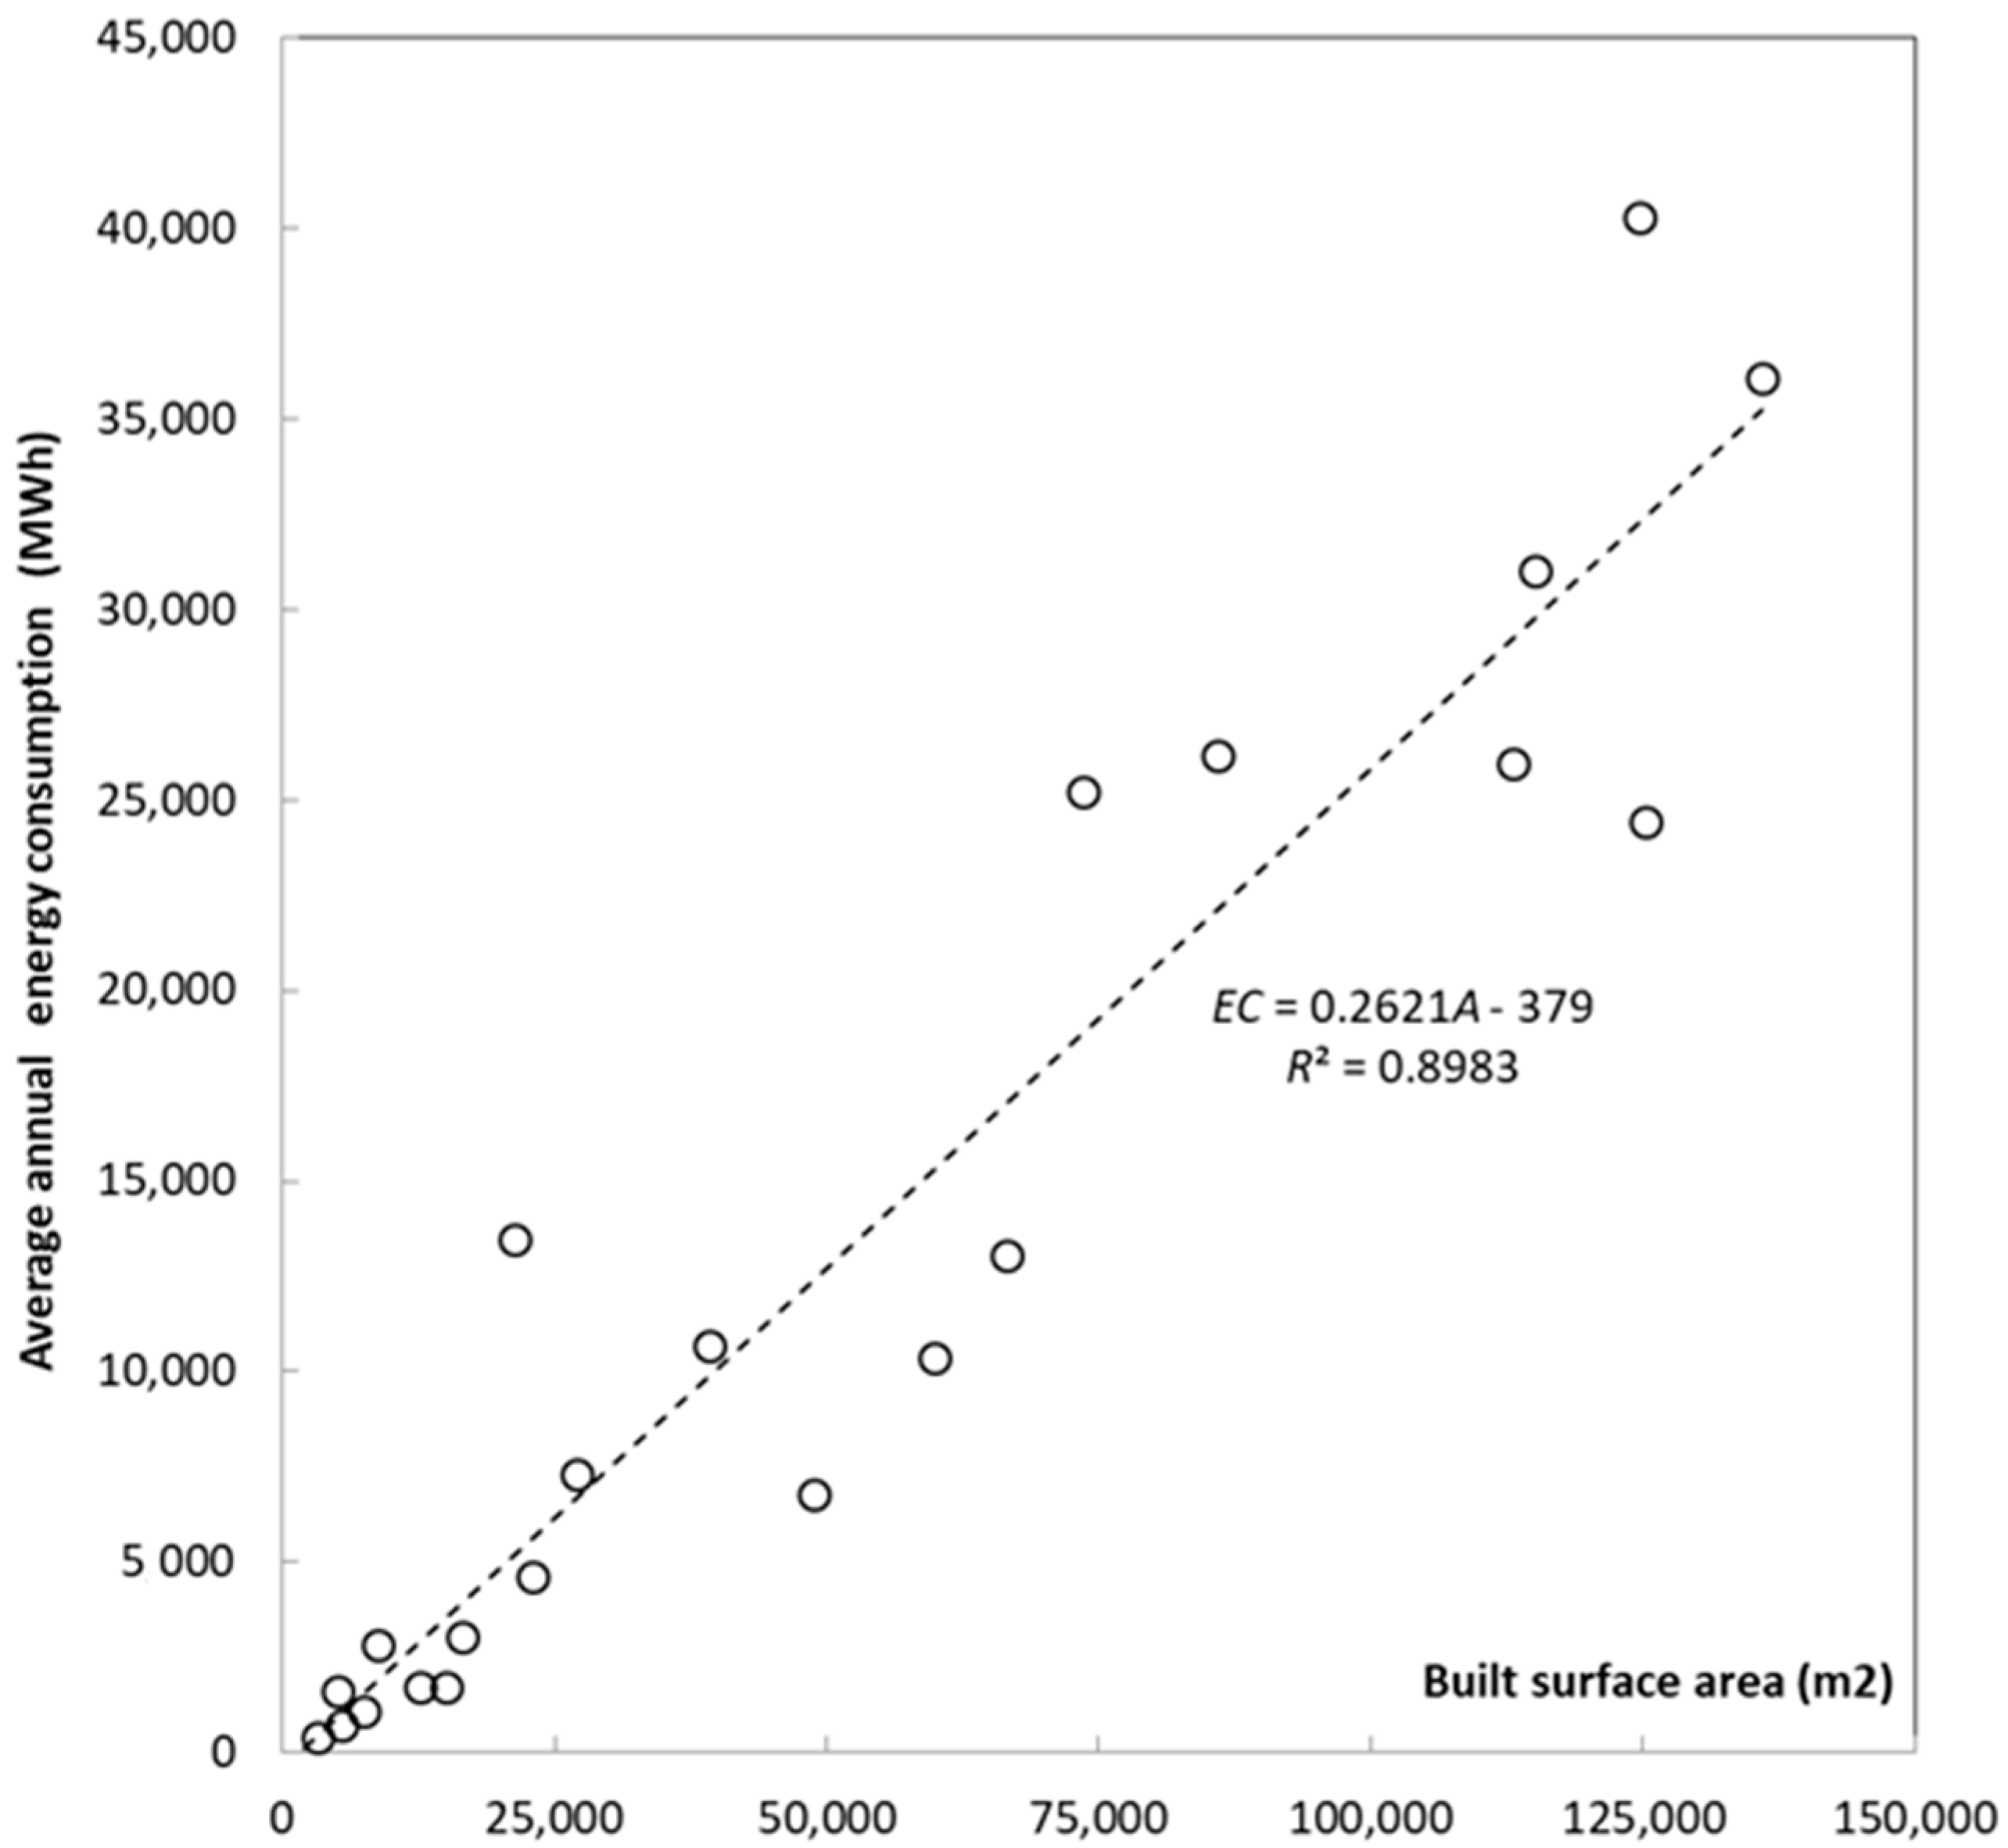
Figure 3 shows the model corresponding to the linear dependence of energy consumption and the built area of the analyzed sample, indicating the corresponding Pearson correlation coefficient. A high linear correlation (R2 = 0.8983) between the variables is observed.
The equation that characterizes the regression line can be seen in Figure 3. It defines the relationship between the average annual energy consumption in terms of the built area of each hospital, with EC being the value of the average annual energy consumption expressed in MWh. A and the value of the built area of each hospital are expressed in m2.
The negative coefficient corresponds to the independent term of the regression lines. It is true that if the variable (abscissa axis) is null (built surface area, number of workers, or number of beds), the regression lines obtained indicate that the energy consumption of the hospital is negative, this circumstance being impossible. The regression line must be considered as approximate adjustments and valid for values of the abscissa among the values of the evaluated data and, therefore, not valid for data in the extremes, i.e., for values close to zero or for values much higher than the maximum values obtained from the data analyzed.
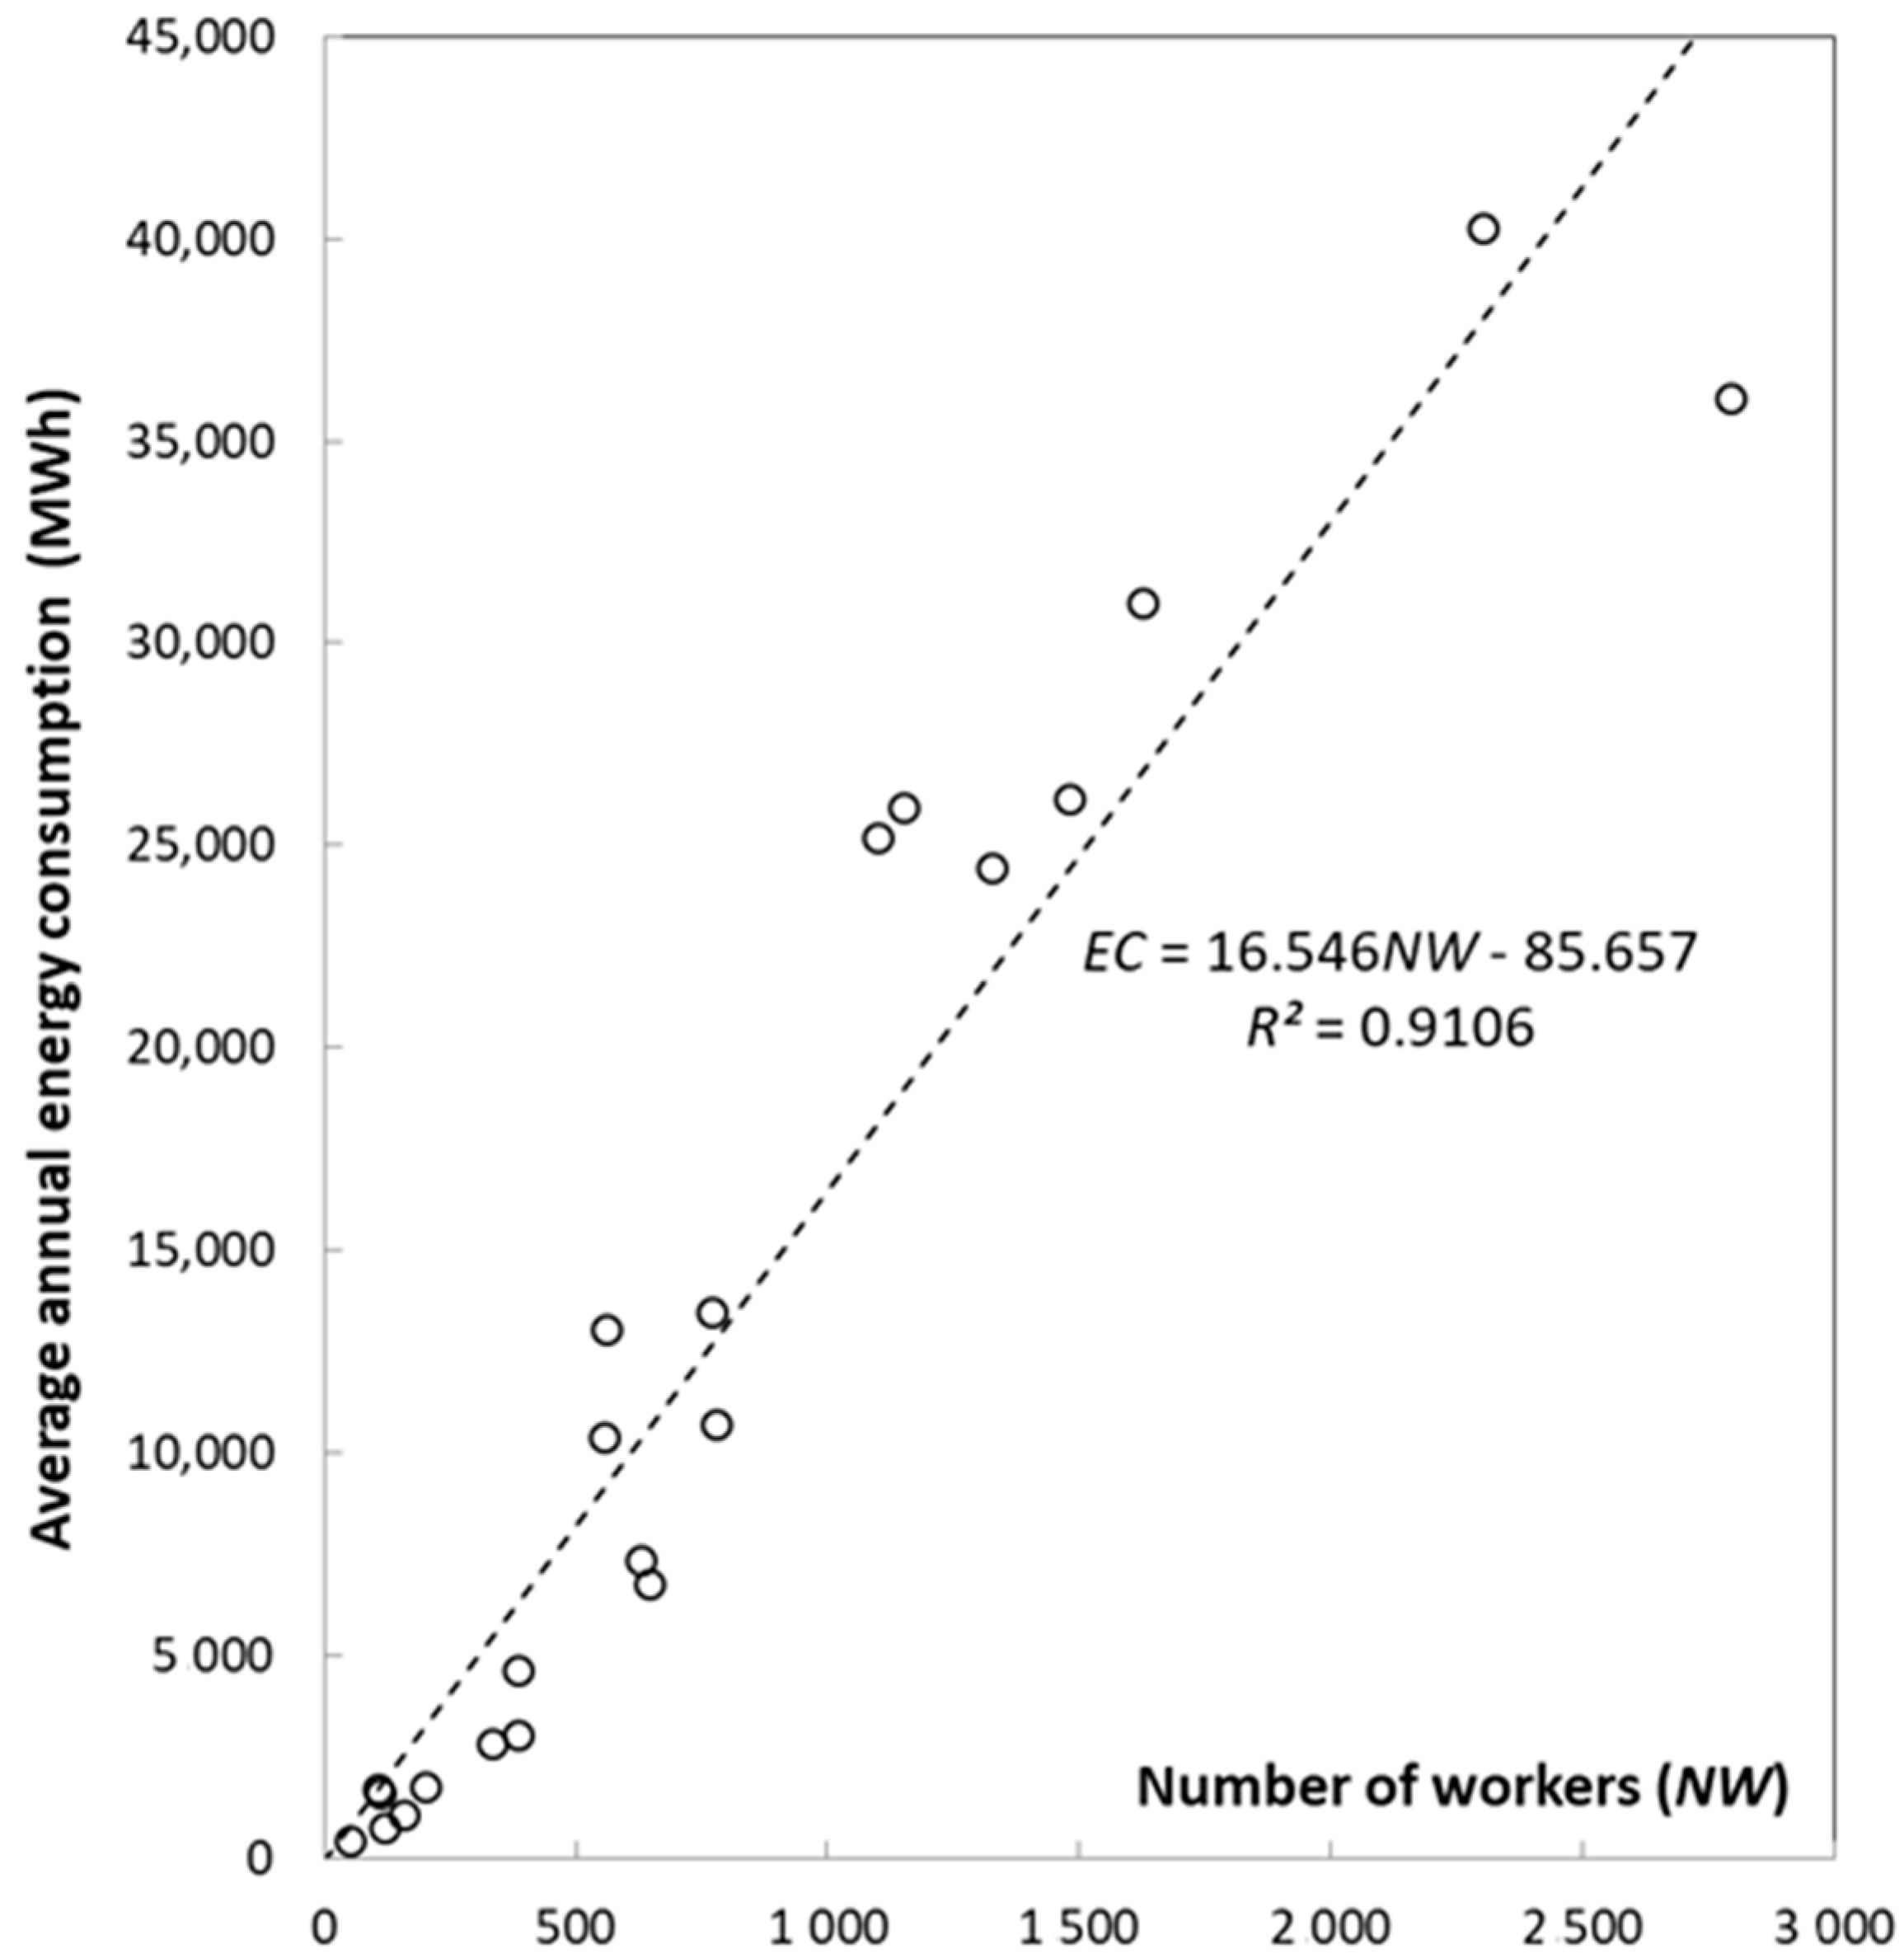
Figure 4 shows a scatter plot representing energy consumption and the number of workers in a hospital. Again, a high linear correlation between variables is observed (R2 = 0.9106). It can, therefore, be concluded that there is a dependent relationship between the number of workers and the average annual energy consumption.
The equation that defines the linear-dependency ratio between the average annual energy consumption in each hospital as a function of the number of workers has been represented in Figure 4, in which EC is the value of the average annual energy consumption, expressed in MWh, and NW is the number of workers in each hospital.
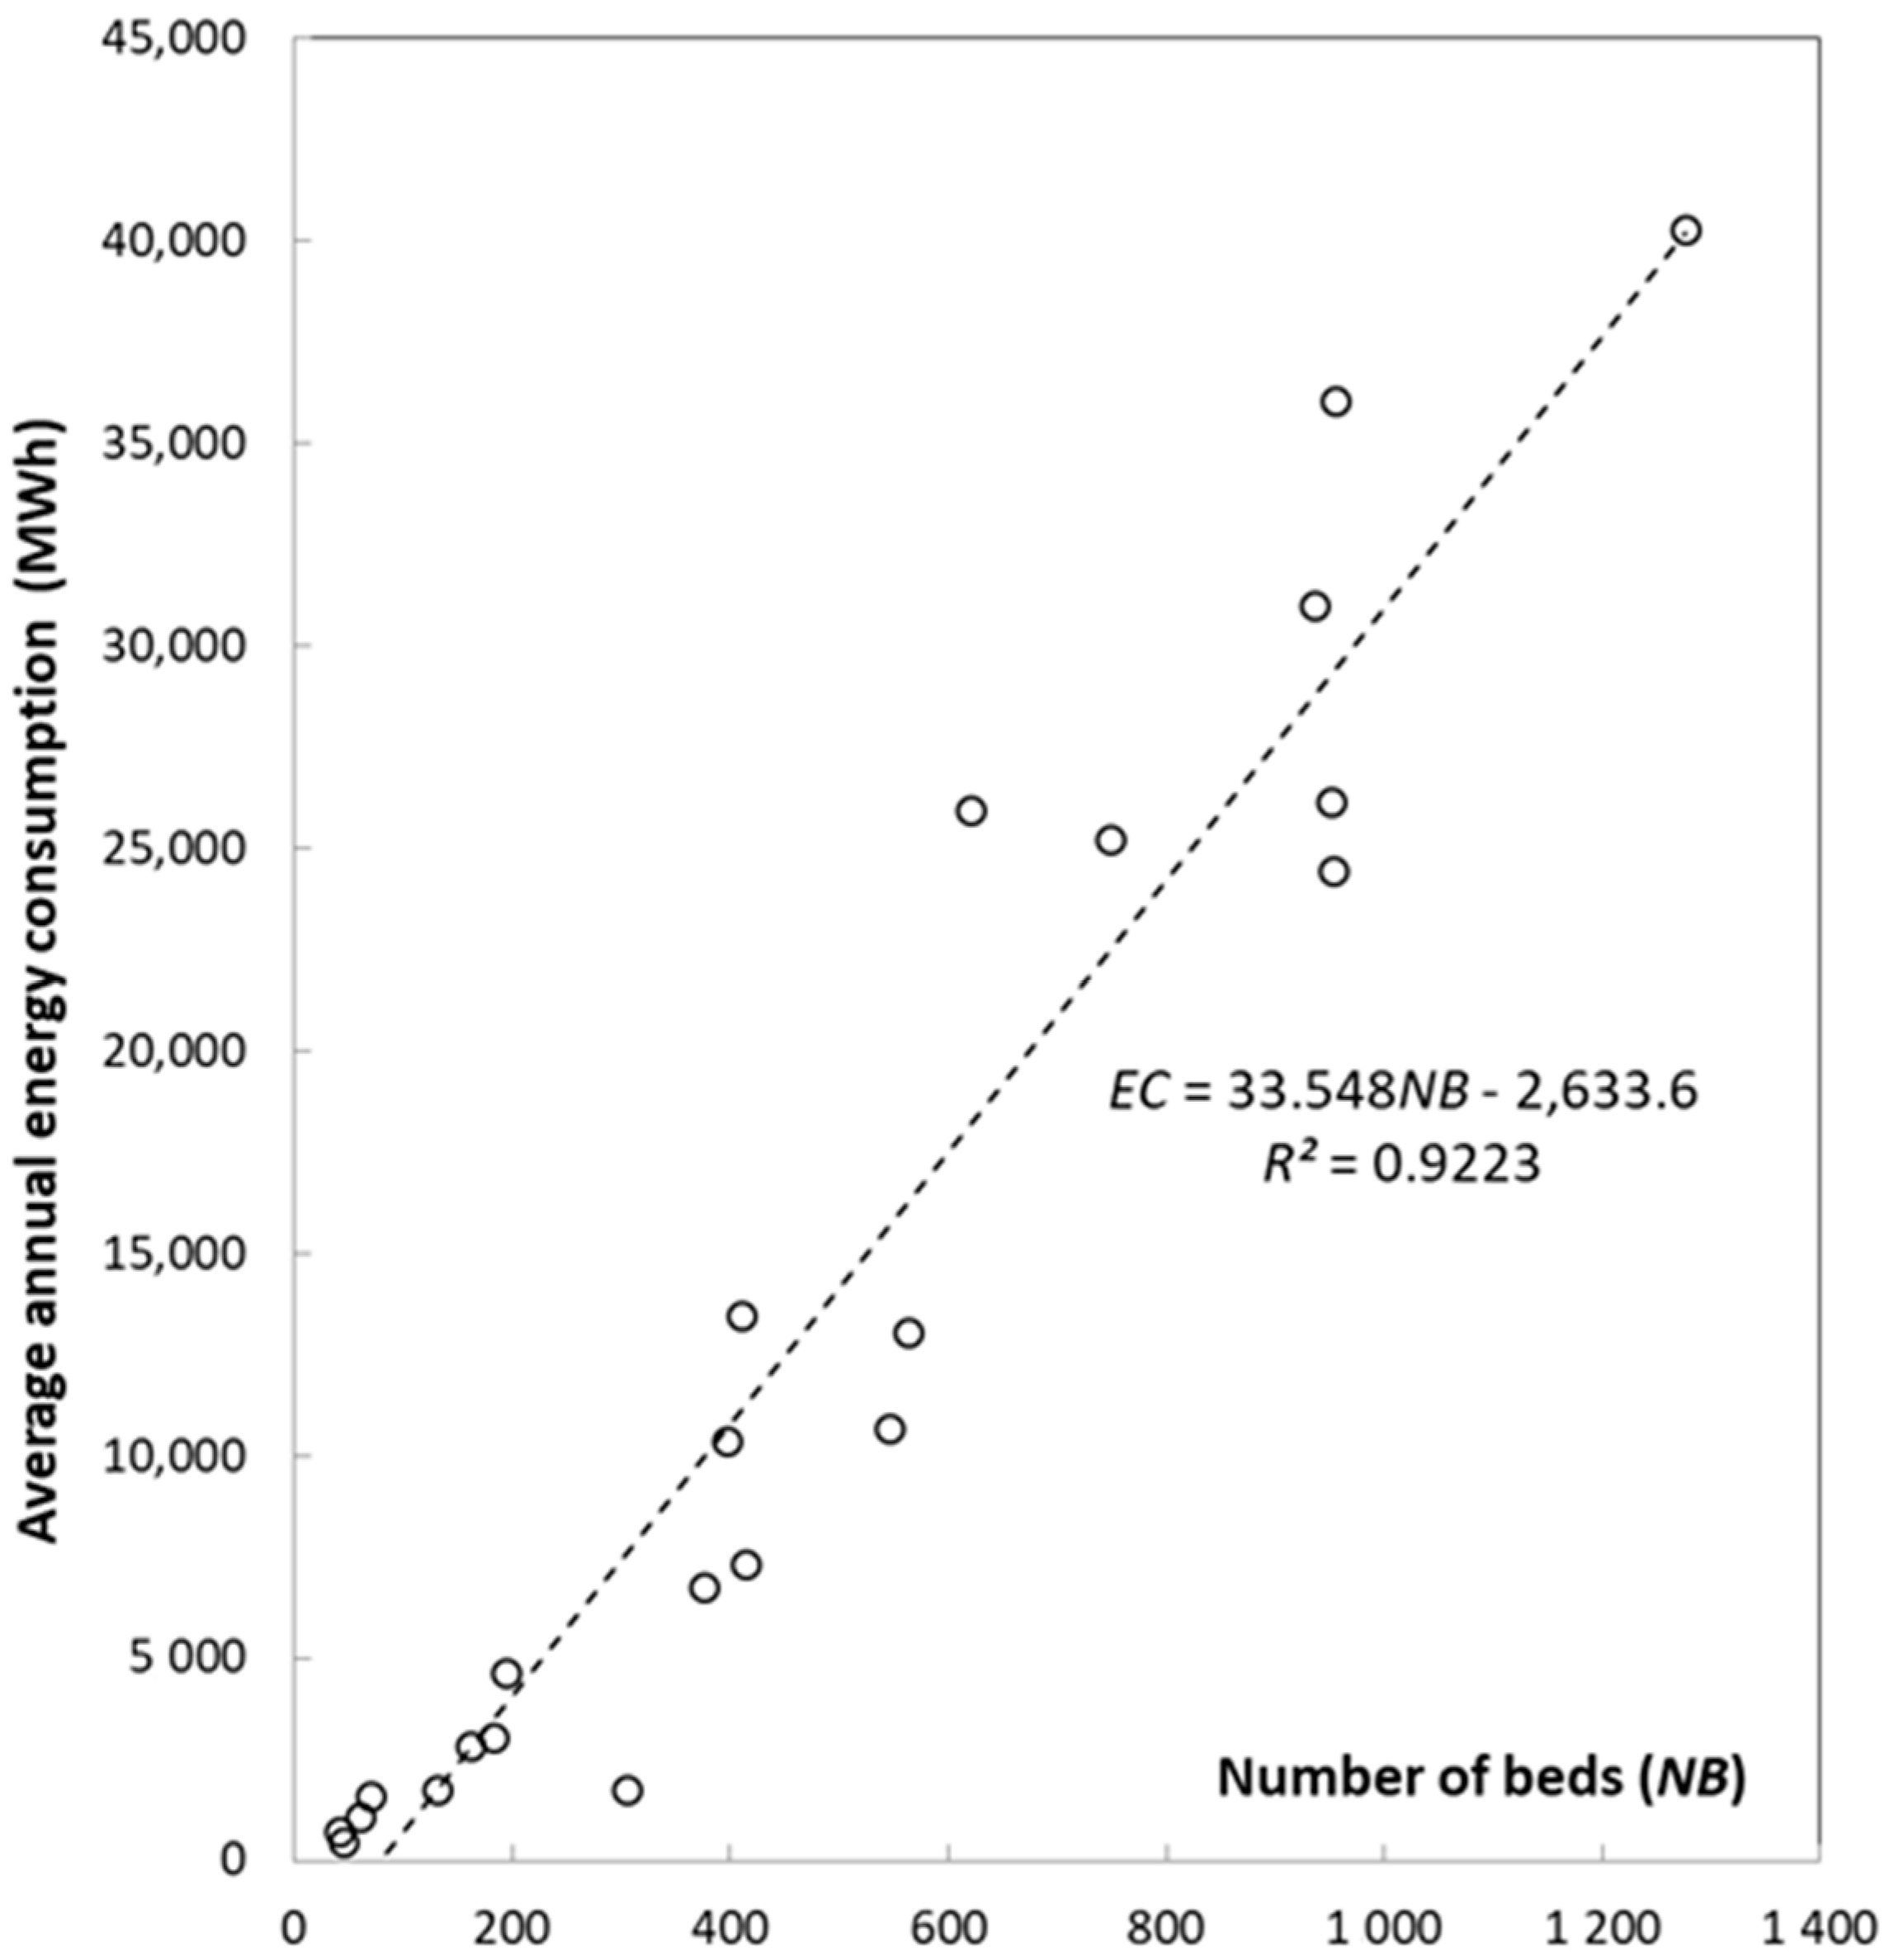
The relationship between the average annual energy consumption and the number of beds in a hospital has been represented in Figure 5 and is mathematically expressed in the equation that defines the regression line represented, in which EC is the value of the average annual energy consumption expressed in MWh and NB is the number of beds in the hospital. In this case, the linear correlation coefficient is R2 = 0.9223. A high correlation was found between energy consumption and the number of beds in a hospital—the highest value of the studies conducted.
2.3. Results of the Statistical ANOVA
The results obtained from the statistical ANOVA are presented below. This analysis studies the relationship between the factors listed in Table 1 and the average annual energy consumption in a German hospital, in relation to the three indicators analyzed (built area, number of workers, and number of beds). The value of p was compared with the level of significance to assess the null hypothesis and determine whether any of the differences between the means were statistically significant. A significance level of α = 0.05 has been considered for this study. If the p-value was less than or equal to the level of significance, i.e., p-value ≤ 0.05, the null hypothesis could be rejected. In this case, it is possible to conclude that not all population means are equal. If the value of p was greater than the level of significance, there was not enough evidence to reject the null hypothesis.
Table 2 shows the p-values obtained in the analysis of the variance, considering the type of heating degrees-day year (HDDY) and cooling degrees-day year (CDDY) as factors, which do not show significant differences with the three indicators used. Significant differences were also not found in the climatic zone where the hospital is located. However, there are some factors in which a direct relationship between these factors and energy consumption in hospitals was identified: Hospital category depending on the number of beds (HCNB), gross domestic product (GDP), and geographic location (GL) and for the period 2005–2015.
These studies are developed in greater depth in the following sections.
2.3.1. Study of Energy Consumption per HCNB
The analysis of the variance, considering the classification of the hospital by category depending on the number of beds as a factor, showed significant differences in two of the three indicators used, specifically those corresponding to the number of workers and the number of beds per hospital, with the indicator relating to energy consumption as a function of the number of workers being the most significant difference (F(3,18) = 8.04; p ≤ 0.05). Given these significant differences, an analysis of multiple comparisons (post-hoc test) was performed using Fisher’s test. Table 3 shows the values obtained in Fisher’s test for the indicator as a function of the number of beds. It was concluded that, considering the HCNB factor, there is a direct relationship between energy consumption as a function of the number of workers and the number of beds in each hospital, but not for the built area indicator.
Table 3 shows that the two categories that represent significant differences from, but not between, the other categories are those corresponding to HCNB 3 and HCNB 4. These categories correspond to the hospitals with the highest number of beds, namely over 501 and 1000 beds, respectively. It was also observed that in the couple groups in which lower bed categories coincide with higher bed categories, HCNB 3–HCNB 1, HCNB 4–HCNB 2, and HCNB 4–HCNB 1, show significant differences. This can be considered normal. However, it should be noted that there is one case in which this criterion is not met, namely the HCNB 3–HCNB 2 group.
2.3.2. Energy Consumption as Related to GDP
The results collected when considering the GDP as a factor show significant differences in the average annual consumption of energy in a hospital in regard to the built area of the hospital (pSurface 0.01) and the number of beds (pBeds 0.04), and no statistical significance according to the number of workers (pWorkers 0.43). Therefore, it can be concluded that there is a direct relationship between the energy consumption based on the number of beds in a hospital. It is interesting to note that of the three GDP groups analyzed with respect to the surface indicator, the average energy consumption values obtained were very similar in the hospitals of GDP1 (0.19 MWh/m2) and GDP2 (0.24 MWh/m2). However, this energy consumption increases considerably in the case of hospitals within the GDP3, where a value of 0.45 MWh/m2 is obtained. This increase also occurs in the analysis of the number of beds. In this case, the data obtained were 26.83 MWh/m2 for GDP1, 20.25 MWh/m2 for GDP2 and 35.28 MWh/m2 for GDP3.
2.3.3. Energy Consumption as Related GL
In this study, the only indicator that has had statistical significance in the ANOVA is the one that analyzed the consumption per unit of built area (pSurface 0.04) in relation with the factor that takes into account the geographical location factor, unlike the consumption/number workers (pWorkers 0.74) or consumption/number beds (pBeds 0.11), where no significance is observed. Therefore, geographical location indeed influences the energy consumption in the hospitals analyzed.
2.3.4. Study of Energy Consumption in Time Intervals
With regard to the question raised in Section 2.3 on energy consumption in relation to the number of beds, workers, and the surface area of hospitals, one of the possible causes of the sharp reduction in energy consumption between 2005 and 2009 was the result of the economic crisis in Europe, which also had a major impact on the German economy. An ANOVA test was carried out to verify this possible influence, using the average energy consumption between 2005 and 2009 and between 2010 and 2015 as an indicator. Significant differences were found in one of the three indicators used. Specifically, statistical significance was observed (Table 2) with the indicator related to the number of beds (pBeds 0.02) but it did not exist for the indicators related to the built area of the hospital (pSurface 0.59) and the number of workers (pWorkers 0.64).
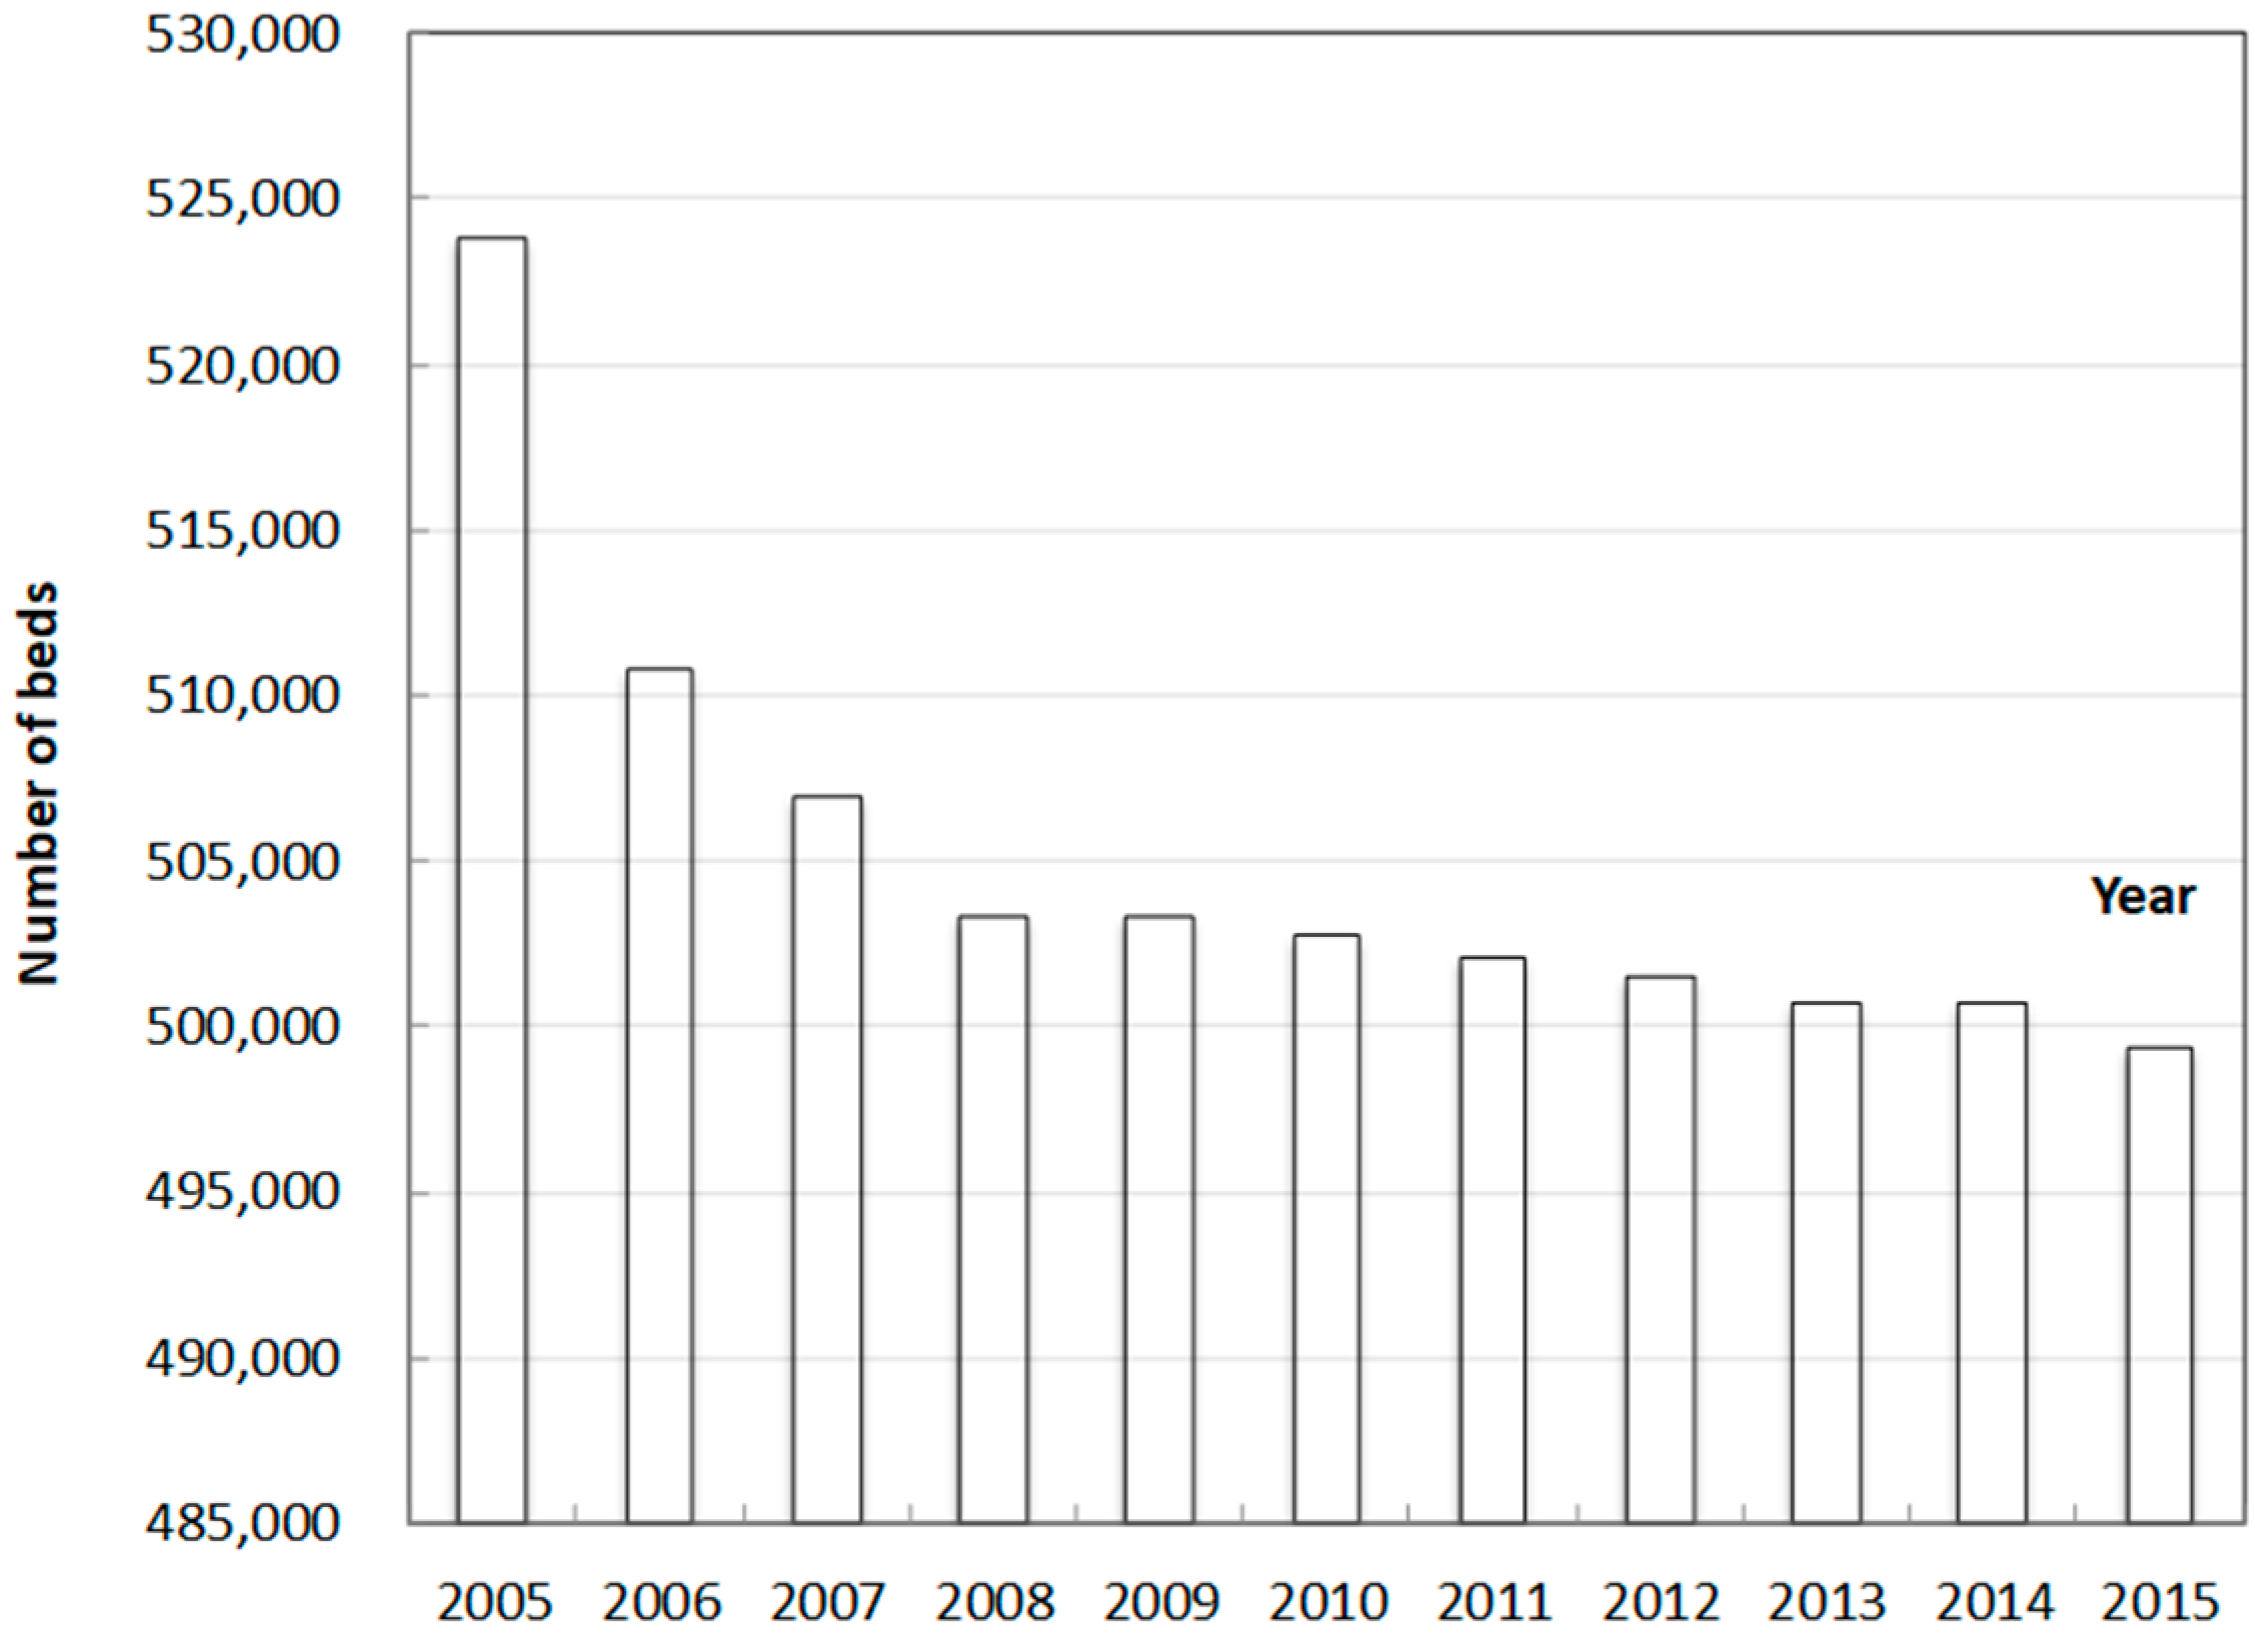
According to a study conducted by Destatis (2015) in Germany [14], number of hospital beds decrease by 10% between 2000 and 2015. However, Germany still has the densest network of hospital beds in all EU states; in 2015, 611 hospital beds per 100,000 inhabitants were available in Germany. This was almost three times more than in Sweden, where there were 226 hospital beds per 100,000 inhabitants (−27% compared to 2000). In most other EU countries, bed capacity has also declined significantly in recent years. The reasons for this decrease lie in the shorter hospital stays due to cost pressure, the coincidence of a period of economic decline, and finally, the emergence of more effective treatment methods. Figure 6 shows the significant and progressive decline in the number of beds in Germany from 2005 to 2009, the year in which the decline stabilized, coinciding with the period of the most significant impact of the economic crisis in Europe [15].
2.3.5. Indicators of Average Annual Energy Consumption in Public Hospitals in Germany
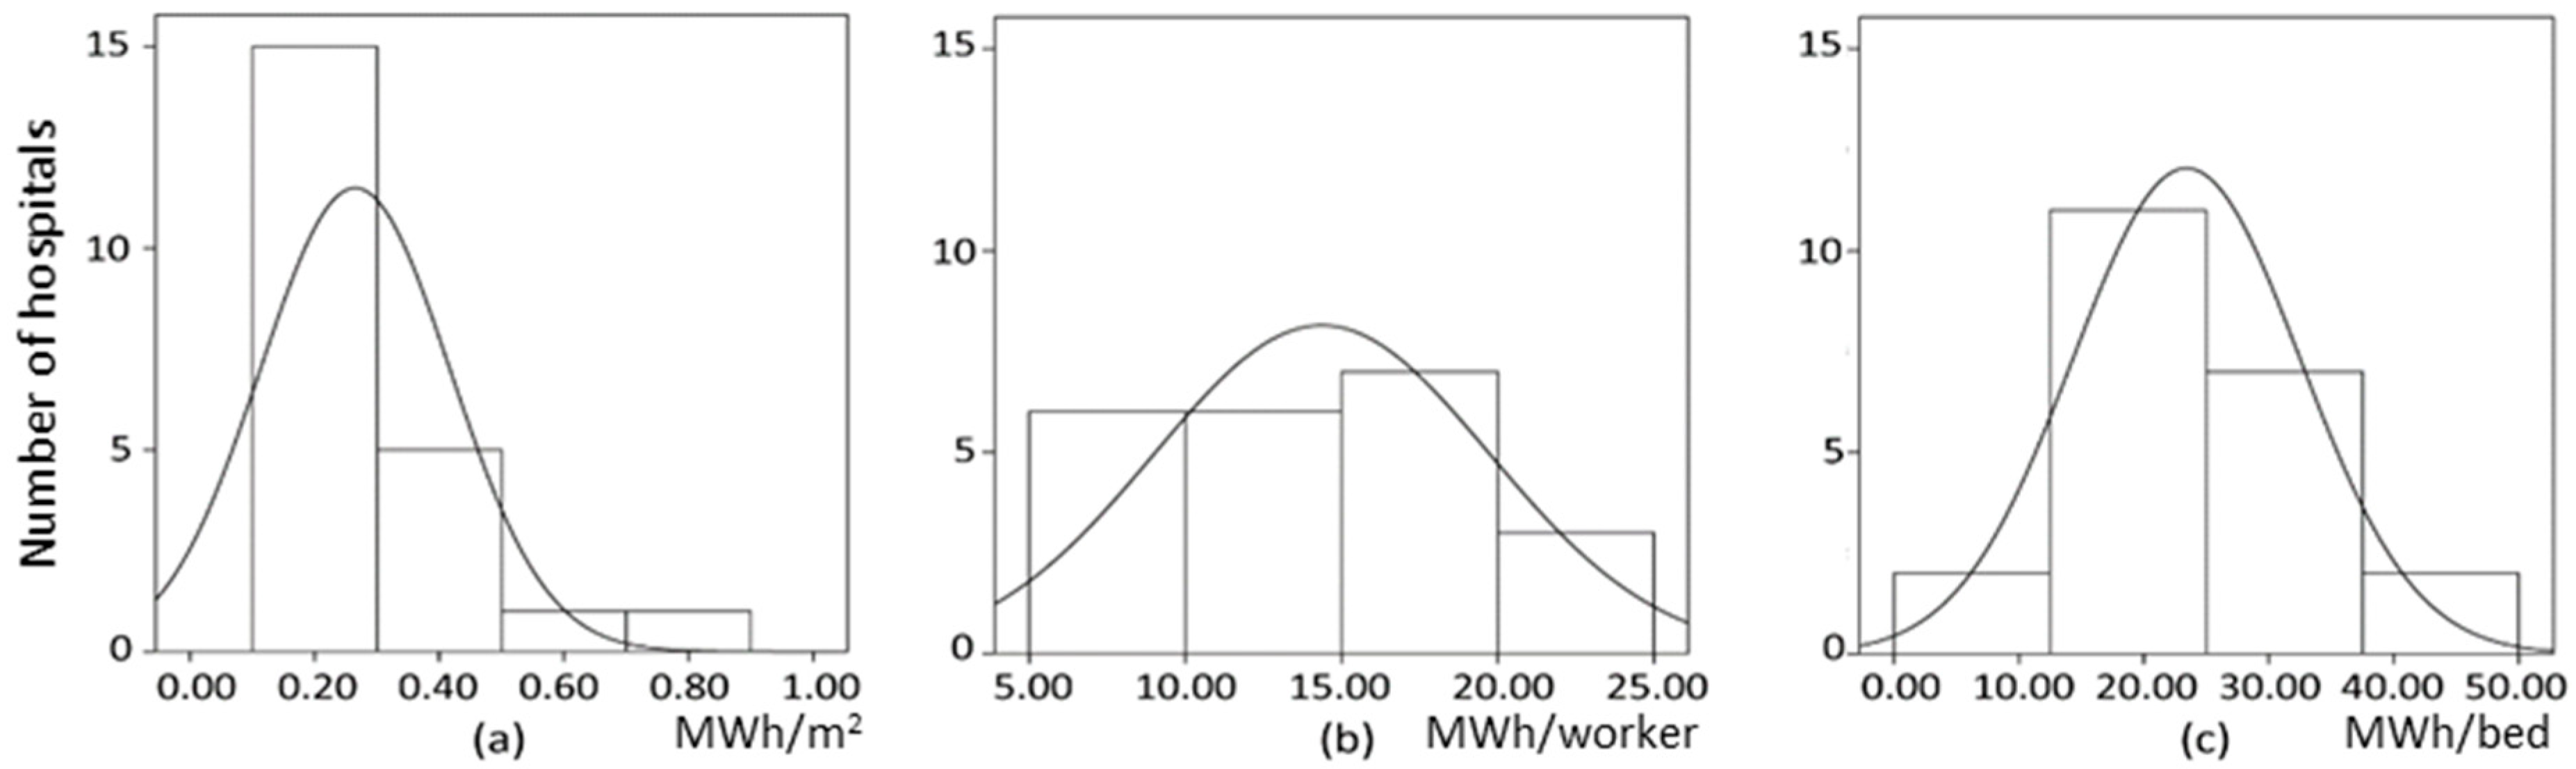
The three histograms shown in Figure 7 show the distribution of the average annual energy consumption according to (a) the built area, (b) the number of workers, and (c) the number of beds, with each bar representing the frequency of the values proportionally. This figure also shows that all the distributions are reasonably close to the Gaussian distribution (normal). The average values of these distributions can, therefore, be considered as indicators of the consumption of German hospitals. In particular, the average values found are as follows: 0.27 MWh/m2, 14.37 MWh/worker, and 23.41 MWh/bed.
3. Discussion
The hospitals analyzed in the sample are similar in terms of size and basic infrastructure, as a high correlation between the values analyzed has been observed. A large part of the potential energy savings in a hospital has been found to be directly related to its daily management [16]. It is, therefore, possible to act directly through workers, through energy-saving awareness and training campaigns, seeking comfort in the hospital through the rational use of energy [17]. In general, there has been a growing awareness of the need to optimize resources and facilities to reduce energy consumption [18].
The key performance indicator (KPIs) used to measure energy consumption in a hospital must be understandable, measurable, and practical in terms of cost and time [19]. The information on hospitals in Germany included in the EU Eco-Audit has been found to not always be homogeneous, nor have the same criteria when recording data and, therefore, not adequately quantifying the parameters analyzed. However, the EU Eco-Audit is considered to be an excellent tool for designing and implementing procedures that help to obtain the appropriate information to generate conclusions about the sustainability of a hospital. Besides, there has been an increase in the number of hospitals joining the EU Eco-Audits in Germany in recent years.
It is interesting exploring how meaningful energy benchmarks can be constructed for hospital buildings. It is a category encompassing complex buildings with different setups and large variability between them [20].
The adjustments of the regression lines obtained in the research are exact in terms of the three indicators considered: built area, and number of workers and beds. The conclusions from the point of view of energy consumption are that German hospitals behave quite proportionally to the area, the number of beds, and the number of workers. This coincides with the results obtained in a similar study in Spanish hospitals [21]. A high correlation was also obtained in the three indicators, similar to that obtained in the paper [22]. However, when analyzing the equations of the regression lines, the slopes of the surface area and number of workers indicators were different, but not compared to the number of beds, where the value obtained for the slope in the case of Spain compared to the slope obtained in the German hospitals was very similar. The percentage value obtained was 7.98% higher in Germany, which makes it possible to use the indicator according to the number of beds as an overall estimator when comparing the energy consumption of hospitals in both countries.
Operational hospitals should implement an energy conservation and efficiency program that progressively reduces their energy consumption [23]. An appropriate strategy would include reducing energy consumption by at least 5% in the first year and then reaching an annual energy saving of 2.5% progressively. An energy-management system to be implemented in hospitals [24] to set energy goals, objectives, and action plans would help to achieve this [25]. However, inadequate temperature or lighting levels in a hospital can alter the medical diagnosis, and the regulation and careful use of ventilation can also directly affect infection control. Energy-saving measures cannot compromise the health of the users due to the particular characteristics of this type of building [26].
However, lighting loads are dominant in low-energy-intensity department types. In addition, intensive department types have high loads, which they used for specialist ventilation and laboratory equipment [27].
The analysis of each one of the areas of a hospital should be studied in further depth in the future. The consumption of each medical-assistance service must be known with a certain degree of accuracy and so that specific energy-saving measures can be designed. For this purpose, enthalpy meters should be installed, which allow obtaining homogeneous readings on which internal consumption parameters to establish.
4. Materials and Methods
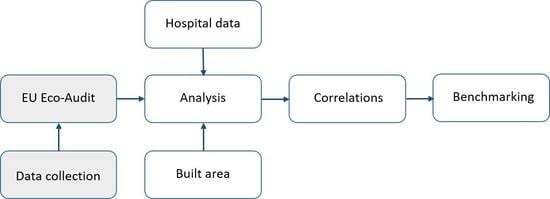
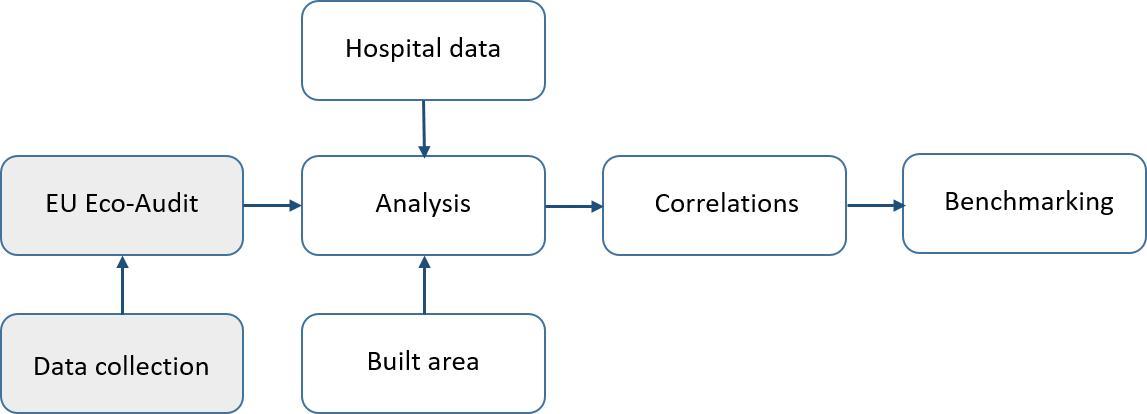
The energy consumption of 23 public hospitals located in various German states was analyzed, using the different factors shown in Table 1. The data analyzed were obtained from the different EU Eco-Audits carried out in the hospitals mentioned above during the period 2005–2015. The Eco-Management and Audit Scheme, known as EU Eco-Audits, is a voluntary environmental-management procedure established in the EU [28], which recognizes organizations that have implemented an Environmental Management System [29] and have made a commitment to continuous improvement, verified by independent audits [30].
In total, 90 EU Eco-Audits hospital statements were analyzed [31]. The number of beds has been obtained from data published annually by the Deutsches Krankenhaus Gesellschaft [32] and the number of information workers from the included in the EU Eco-Audit. The average was calculated over the range of years analyzed. In terms of built area, the area adapted for care use and common areas was taken into account [33].
The final energy consumption was obtained as electricity consumption after conversion of the corresponding thermal energy into equivalent electricity consumption [34].
In all the correlations represented in figures, the time period considered was from 2005 to 2015 and the data were modulated through variables subject to control. In this way, the Pearson correlation coefficient was calculated to measure the linear correlation between two variables.
Two analyses were carried out to assess the energy consumption of hospitals and to determine the factors influencing this consumption. In the first analysis, the average energy consumption was studied according to the following indicators: built surface area, number of employees, and number of hospital beds. The second analysis was carried out to obtain more detailed results from the statistical data used; in particular, ANOVA was used with the factors presented in Table 1. The factors used for this research are those corresponding to the hospital category depending on the HCNB, the GDP, the HDDY, the CDDY, the GL, and the Range of years corresponding to the temporal analysis. Table 4 shows the distribution of factors by hospital. In this sense, it is important to emphasize that the ANOVA test requires that the samples follow a normal distribution and have the same variance. The normality was contrasted by Levene’s test [35], taking into account that, if the p-value obtained in this test is higher than the 5% level of significance, the normality hypothesis cannot be rejected and is, therefore, assumed to be true.
GDP is a monetary measure in a period of time of the market value of all the final goods and services produced in a country. To determine the economic performance of a region, GDP estimates were used. The GDP was divided into three groups according to the average GDP in Germany.
German hospitals were divided according to the climatic zone where they were located, using the criteria established in Norm DIN 4710:2003-01 [36].
The HDDY was defined as the sum of the difference between a base temperature (15 °C) and the average temperature of the day when it is lower than the base temperature.
Moreover, the CDDY was defined as the sum of the hourly differences of the maximum average outside air temperature above a base cooling temperature (20 °C), for all days of the year.
In order to detect outliers [37], outliers have been considered to be all those outside the range , where is the average energy consumption according to different indicators: built surface area, number of staff, and number of beds; and the standard deviation of the sample.
5. Conclusions
Considering the outcome, there are grounds to confirm that there is a direct relationship between the average energy consumption of German hospitals and their number of workers, number of beds, and built area. Inferential statistics also demonstrated that Geographical Location and GDP influence the energy consumption of a hospital. In Germany, energy consumption in the period 2010–2015 was lower than in the period 2005–2009. However, no relationship was found between energy consumption and the weather conditions outside hospitals, according to their degree-days.
The indicator dependent on the number of beds was shown to be the most suitable as a reference indicator to quantify the average energy consumption of a hospital. This indicator is one of the most widely used indicators in the EU Eco-Audit reports analyzed, and has been found to be consistent and is usually adequately quantified.
The average annual energy consumption of a German hospital under normal operating conditions has been determined to be 0.27 MWh per m2, 14.37 MWh per worker, and 23.41 MWh per bed.
Author Contributions
Conceptualization, J.G.-S.-C.; data curation, A.G.G.; formal analysis, D.R.S.; investigation, A.G.G. and J.G.-S.-C.; methodology, J.G.-S.-C.; supervision, J.G.-S.-C.; validation, J.G.-S.-C. and D.R.S.
Funding
This research received no external funding.
Acknowledgments
The authors wish to thank the Junta de Extremadura, the European Social Found (FEDER), and the Ministry of Education, Culture, and Sports for their support towards this research. This study has been carried out through the Research Project GR-18029 linked to the VI Regional Research and Innovation Plan of the General Government of Extremadura.
Conflicts of Interest
The authors declare no conflict of interest.
References
- Eckelman, M.J.; Sherman, J. Environmental impacts of the US healthcare system and effects on public health. PLoS ONE 2016, 11, e0157014. [Google Scholar] [CrossRef] [PubMed]
- Verband der Krankenhausdirektoren Deutschlands eV. KLINERGIE 2020. 2018. Available online: https://www.vkd-online.de/aktuelles/archiv/klinergie-2020/ (accessed on 29 March 2018). (In German).
- Christiansen, N.; Kaltschmitt, M.; Dzukowski, F.; Isensee, F. Electricity consumption of medical plug loads in hospital laboratories: Identification, evaluation, prediction and verification. Energy Build. 2015, 107, 392–406. [Google Scholar] [CrossRef]
- Daschner, F.; Kummerer, K.; Scherrer, M.; Hubner, P.; Metz, L. Krankenhäuser, Arztpraxen, Apotheken und Andere Einrichtungen des Gesundheitswesens; Bristol-Myers Squibb: New York, NY, USA, 2001. (In German) [Google Scholar]
- Intelligent Energy Europe. El Uso Racional de la Energía en Los Edificios Públicos. 2007. Available online: http://www.cecu.es/campanas/medio%20ambiente/Guia%20Edif%20Publicos.pdf/ (accessed on 29 March 2018). (In Spanish).
- Benke, G.; Leutgöb, K.; Varga, M.; Kolpek, M.; Greisberger, H. Das Energie Effiziente Krankenhaus (No. 22/2009); Berichte aus der Energie und Umweltforschung; Energie Markt Analyse GmbH, Österreichische Gesellschaft für Umwelt und Technik-ÖGUT: Wien, Austria, 2009. (In German) [Google Scholar]
- Thinate, N.; Wongsapai, W.; Damrongsak, D. Energy Performance Study in Thailand Hospital Building. Energy Procedia 2017, 141, 255–259. [Google Scholar] [CrossRef]
- Hu, S.; Chen, J.; Chuah, Y. Energy cost and consumption in a large acute hospital. Int. J. Arch. Sci. 2004, 5, 11–19. [Google Scholar]
- Rohde, T.; Martinez, R. Equipment and energy usage in a large teaching hospital in Norway. J. Healthc. Eng. 2015, 6, 419–434. [Google Scholar] [CrossRef] [PubMed]
- Umsicht, E.; Beier, D.I.C. Analyse des Energieverbrauchs und Exemplarische Best-Practice-Lösungen für Relevante Verbrauchssektoren in Krankenhäusern; Fraunhofer-Institut für Umwelt-, Sicherheits- und Energietechnik: Oberhausen, Germany, 2009. (In German) [Google Scholar]
- Tippkötter, R. Rationelle Energienutzung in Krankenhäusern: Leitfaden für Verwaltung und Betriebstechnik; Springer: Berlin/Heidelberg, Germany, 2003. (In German) [Google Scholar]
- Gesundheit, Kostennachweis der Krankenhäuser. In Fachserie 12 Reihe 6.3.; Statistisches Bundesamt: Wiesbaden, Germany, 2008. (In German)
- Samuels, M.L.; Witmer, J.A.; Schaffner, A.A. Statistics for the Life Sciences; Pearson Education: London, UK, 2012. [Google Scholar]
- Destatis. Krankenhausbetten: Deutschland Hat das Dichteste Versorgungsnetz der EU; Destatis: Wiesbaden, Germany, 2015; (In German).
- Destatis. Einrichtungen, Betten und Patientenbewegung; Destatis: Wiesbaden, Germany, 2016; (In German).
- García-Sanz-Calcedo, J.; Gómez-Chaparro, M. Quantitative Analysis of the Impact of Maintenance Management on the Energy Consumption of a Hospital in Extremadura (Spain). Sustain. Cities Soc. 2017, 30, 217–222. [Google Scholar] [CrossRef]
- Chiang, C.Y.; Yang, R.; Yang, K.H.; Lee, S.K. Performance Analysis of an Integrated Heat Pump with Air-Conditioning System for the Existing Hospital Building Application. Sustainability 2017, 9, 530. [Google Scholar] [CrossRef]
- García-Sanz-Calcedo, J.; López-Rodríguez, F. Analysis on the Performance of a High-Efficiency Administrative Building in Spain. Int. J. Green Energy 2017, 14, 55–62. [Google Scholar] [CrossRef]
- Loosemore, M.; Hsin, Y.Y. Customer-focused benchmarking for facilities management. Facilities 2001, 19, 464–476. [Google Scholar] [CrossRef]
- Morgenstern, P.; Li, M.; Raslan, R.; Ruyssevelt, P.; Wright, A. Benchmarking acute hospitals: Composite electricity targets based on departmental consumption intensities? Energy Build. 2016, 118, 277–290. [Google Scholar] [CrossRef]
- García-Sanz-Calcedo, J.; Al-Kassir, A.; Yusaf, T. Economic and Environmental Impact of Energy Saving in Healthcare Buildings. Appl. Sci. 2018, 8, 440. [Google Scholar] [CrossRef]
- González, A.G.; García-Sanz-Calcedo, J.; Salgado, D.R. A quantitative analysis of final energy consumption in hospitals in Spain. Sustain. Cities Soc. 2018, 36, 169–175. [Google Scholar] [CrossRef]
- Rodriguez, F.L.; Blazquez, F.C.; Vegas, C.P.S.; Celma, A.R.; Nieto, A.M.; Castro, S.S.; Giancola, E.; Tevar, J.A.F.; Ceramin, M.d.H.; Garcia Sanz-Calcedo, J.; et al. Edificio Peter: Un ejemplo de construcción bioclimática y de integración de energías renovables. DYNA 2011, 86, 212–221. (In Spanish) [Google Scholar] [CrossRef]
- Kolokotsa, D.; Pouliezos, A.; Stavrakakis, G.; Lazos, C. Predictive control techniques for energy and indoor environmental quality management in buildings. Build. Environ. 2009, 44, 1850–1863. [Google Scholar] [CrossRef]
- Singer, B.C.; Tschudi, W.F. High-Performance Healthcare Buildings: A Roadmap to Improved Energy Efficiency; No. LBNL-2737E; Ernest Orlando Lawrence Berkeley National Laboratory: Berkeley, CA, USA, 2009. [Google Scholar]
- Ekvall, T.; Hirschnitz-Garbers, M.; Eboli, F.; Śniegocki, A. A Systemic and Systematic Approach to the Development of a Policy Mix for Material Resource Efficiency. Sustainability 2016, 8, 373. [Google Scholar] [CrossRef]
- Morgenstern, P.; Raslan, R.; Ruyssevelt, P. Reducing hospital electricity use: An end-use perspective. In Proceedings of the 9th International Conference on Improving Energy Efficiency in Commercial Buildings and Smart Communities (IEECB&SC’16), Frankfurt, Germany, 16–18 March 2016. [Google Scholar]
- European Communities. Towards Sustainability: A European Community Programme of Policy and Action in Relation to the Environment and Sustainable Development; Office for Official Publications of the European Communities: Luxembourg, 1993. [Google Scholar]
- Iraldo, F.; Testa, F.; Frey, M. Is an environmental management system able to influence environmental and competitive performance? The case of the eco-management and audit scheme (EMAS) in the European Union. J. Clean. Prod. 2009, 17, 1444–1452. [Google Scholar] [CrossRef]
- European Commission, Environment EMAS. 2017. Available online: http://ec.europa.eu/environment/emas/index_en.htm/ (accessed on 1 April 2018).
- Sammlung EMAS Umwelterklaerungen. 2018. Available online: http://www.emas.de/teilnahme/umwelterklaerungen/sammlung/ (accessed on 6 April 2018). (In German).
- Deutsches Krankenhaus Gesellschaft. Deutsches Krankenhauverzeichnis. 2018. Available online: http://dkg.promato.de/de/suche/Regional.html/ (accessed on 1 April 2018). (In German).
- Sleiman, H.A.; Hempel, S.; Traversari, R.; Bruinenberg, S. An assisted workflow for the early design of nearly zero emission healthcare buildings. Energies 2017, 10, 993. [Google Scholar] [CrossRef]
- Lindner, M.; Bachhiesl, U.; Stigler, H. Das Exergiekonzept als Analysemethode am Beispiel Deutschlands. In Proceedings of the 13th Symposium Energieinnovation, Graz, Austria, 12–14 April 2014. (In German). [Google Scholar]
- Devore, J.; Farnum, N.; Doi, J. Applied Statistics for Engineers and Scientists; Nelson Education: Scarborough, ON, Canada, 2013. [Google Scholar]
- Norm DIN 4710:2003-01. In Statistics on German Meteorological Data for Calculating the Energy Requirements for Heating and Air Conditioning Equipment; Beuth Verlag: Berlin, Germany, 2003.
- Barnett, V.; Lewis, T. Outliers in Statistical Data; Wiley: Hoboken, NJ, USA, 1974. [Google Scholar]
Figure 1.
The relation between number of beds and built surface area for the hospitals under study.

Figure 2.
The relation between the number of beds and the number of workers for the hospitals under study.
Figure 2.
The relation between the number of beds and the number of workers for the hospitals under study.

Figure 3.
The relationship between the average annual energy consumption and the built area per hospital.
Figure 3.
The relationship between the average annual energy consumption and the built area per hospital.

Figure 4.
The ratio of average annual energy consumption and number of workers per hospital.

Figure 5.
The ratio of average annual energy consumption and number of beds per hospital.

Figure 6.
Relationship of beds per hospital in the years 2005 to 2015 in Germany.

Figure 7.
Average consumption in MWh of energy for each indicator: (a) built surface area (MWh/m2), (b) the number of workers (MWh/worker), and (c) the number of beds (MWh/bed).
Figure 7.
Average consumption in MWh of energy for each indicator: (a) built surface area (MWh/m2), (b) the number of workers (MWh/worker), and (c) the number of beds (MWh/bed).


Table 1.
Hospital rating factors.
| Factors | Distribution Regarding Factors |
|---|---|
| Hospital category based on number of beds (HCNB) | HCNB 1: <200 beds |
| HCNB 2: 200–500 beds | |
| HCNB 3: 500–1000 beds | |
| HCNB 4: >1000 beds | |
| Gross domestic product (GDP) | GDP 1: €35,001–€40,000 |
| GDP 2: €40,001–€45,000 | |
| GDP 3: >€45,001 | |
| Heating degrees-day year (HDDY) | HDDY 1: 1000–1250 °C |
| HDDY 2: 1250–1500 °C | |
| HDDY 3: 1500–1750 °C | |
| HDDY 4: 1750–2000 °C | |
| HDDY 5: 2000–2250 °C | |
| HDDY 6: 2250–2500 °C | |
| HDDY 7: >2501 °C | |
| Cooling degrees-day year (CDDY) | CDDY 1: ≤100 °C |
| CDDY 2: 101–200 °C | |
| CDDY 3: 201–300 °C | |
| CDDY 4: 301–400 °C | |
| CDDY 5: >401 °C | |
| Geographic location (GL) | Bavaria |
| Baden-Württemberg | |
| Bremen | |
| North Rhine-Westphalia | |
| Hessen | |
| Range of years | 2005–2009 |
| 2010–2015 |
Table 2.
Results for the p-value corresponding to the analysis of variance (ANOVA) for the average annual energy consumption.
Table 2.
Results for the p-value corresponding to the analysis of variance (ANOVA) for the average annual energy consumption.
| Indicators Consumption Ratios | Experiments Factors (p-Value) | |||||
|---|---|---|---|---|---|---|
| HCNB | GDP | HDDY | CDDY | GL | Period 2005–2009 and 2010–2015 | |
| 0.44 | 0.01 * | 0.18 | 0.14 | 0.04 * | 0.54 | |
| 0.00 * | 0.43 | 0.24 | 0.19 | 0.74 | 0.64 | |
| 0.01 * | 0.04 * | 0.25 | 0.17 | 0.11 | 0.02 * | |
* At the 0.05 level, the population means are significantly different.
Table 3.
Fisher’s test for means comparison with 0.05 of significance level.
| Hospital Category | MeanDiff | SEM | t Value | Prob | Sig. | LCL | UCL |
|---|---|---|---|---|---|---|---|
| HCNB 1–HCNB 2 | −2.52 | 4.09 | −0.62 | 0.54 | 0 | −11.11 | 6.07 |
| HCNB 3–HCNB 2 | 9.14 | 4.20 | 2.18 | 0.04 | 1 | 0.32 | 17.96 |
| HCNB 3–HCNB 1 | 11.66 | 3.71 | 3.14 | 0.01 | 1 | 3.87 | 19.46 |
| HCNB 4–HCNB 2 | 14.54 | 6.00 | 2.42 | 0.03 | 1 | 1.93 | 27.14 |
| HCNB 4–HCNB 1 | 17.06 | 5.67 | 3.01 | 0.01 | 1 | 5.15 | 28.97 |
| HCNB 4–HCNB 3 | 5.39 | 5.75 | 0.94 | 0.36 | 0 | −6.68 | 17.47 |
Table 4.
List of hospitals analyzed with the distribution by factors.
| Hospital | GL | Climatic Zone [36] | Hospital Category (HCNB) | GDP | HDDY | CDDY |
|---|---|---|---|---|---|---|
| Bezirkskrankenhaus-Kaufbeuren | Bavaria | 15 | HCNB 2 | GDP 2 | HDDY 4 | CDDY 2 |
| Klinik Immenstadt | 15 | HCNB 1 | HDDY 5 | CDDY 2 | ||
| Klinik Sonthofen | 15 | HCNB 1 | HDDY 5 | CDDY 3 | ||
| Klinik Oberstdorf | 15 | HCNB 1 | HDDY 5 | CDDY 2 | ||
| KH Rotthalmünster | 13 | HCNB 1 | HDDY 3 | CDDY 2 | ||
| KH Vilshofen | 13 | HCNB 1 | HDDY 5 | CDDY 3 | ||
| KH Wegscheid | 10 | HCNB 1 | HDDY 3 | CDDY 3 | ||
| Klinikum Bogenhausen | 13 | HCNB 3 | HDDY 4 | CDDY 2 | ||
| Klinikum Harlaching | 13 | HCNB 3 | HDDY 4 | CDDY 2 | ||
| Klinikum Neuperlach | 13 | HCNB 3 | HDDY 4 | CDDY 2 | ||
| Klinikum Schwabing | 13 | HCNB 3 | HDDY 4 | CDDY 2 | ||
| Klinik Thalkirchen Strasse | 13 | HCNB 1 | HDDY 4 | CDDY 2 | ||
| Klinikum Karlsruhe | Baden-Württemberg | 12 | HCNB 4 | GDP 2 | HDDY 3 | CDDY 5 |
| Psychiatric Clinics | 12 | HCNB 2 | HDDY 3 | CDDY 5 | ||
| Klinikum Bad-Hersfeld | Hessen | 7 | HCNB 3 | GDP 1 | HDDY 5 | CDDY 5 |
| Orthopädie Bad-Hersfeld | 7 | HCNB 1 | HDDY 5 | CDDY 5 | ||
| Klinikum Bremen-Mitte | Bremen | 3 | HCNB 4 | GDP 3 | HDDY 4 | CDDY 5 |
| Diakonie-Krankenhaus | 3 | HCNB 2 | HDDY 4 | CDDY 5 | ||
| LWL-Klinik Münster | North Rhine-Westphalia | 5 | HCNB 2 | GDP 1 | HDDY 3 | CDDY 1 |
| LVR-Klinikums Düsseldorf | 5 | HCNB 3 | HDDY 3 | CDDY 1 | ||
| LVR Klinik Bedburg-Hau | 5 | HCNB 4 | HDDY 3 | CDDY 5 | ||
| LVR Kliniken at the Standort Viersen | 5 | HCNB 3 | HDDY 3 | CDDY 5 | ||
| LWL-Klinik Lengerich | 5 | HCNB 2 | HDDY 3 | CDDY 1 |
© 2018 by the authors. Licensee MDPI, Basel, Switzerland. This article is an open access article distributed under the terms and conditions of the Creative Commons Attribution (CC BY) license (http://creativecommons.org/licenses/by/4.0/).
Share and Cite
MDPI and ACS Style
González González, A.; García-Sanz-Calcedo, J.; Rodríguez Salgado, D. Evaluation of Energy Consumption in German Hospitals: Benchmarking in the Public Sector. Energies 2018, 11, 2279. https://doi.org/10.3390/en11092279
AMA Style
González González A, García-Sanz-Calcedo J, Rodríguez Salgado D. Evaluation of Energy Consumption in German Hospitals: Benchmarking in the Public Sector. Energies. 2018; 11(9):2279. https://doi.org/10.3390/en11092279
Chicago/Turabian StyleGonzález González, Alfonso, Justo García-Sanz-Calcedo, and David Rodríguez Salgado. 2018. "Evaluation of Energy Consumption in German Hospitals: Benchmarking in the Public Sector" Energies 11, no. 9: 2279. https://doi.org/10.3390/en11092279
Note that from the first issue of 2016, this journal uses article numbers instead of page numbers. See further details here.