Thermal 3D CFD Simulation with Active Transparent Façade in Buildings
by
 , and
, and
Cristina Ramírez-Balas
1, 
Enrique Fernández-Nieto
2,
Gladys Narbona-Reina
2,
Juan José Sendra
1 and
Rafael Suárez
1,* 1
Instituto Universitario de Arquitectura y Ciencias de la Construcción, Escuela Técnica Superior de Arquitectura, Universidad de Sevilla, 41012 Sevilla, Spain
2
Departamento de Matemática Aplicada I, Escuela Técnica Superior de Arquitectura, Universidad de Sevilla, 41012 Sevilla, Spain
*
Author to whom correspondence should be addressed.
Energies 2018, 11(9), 2265; https://doi.org/10.3390/en11092265
Submission received: 12 July 2018
/
Revised: 13 August 2018
/
Accepted: 20 August 2018
/
Published: 28 August 2018
(This article belongs to the Special Issue Building Energy Use: Modeling and Analysis)
Abstract
:In recent years active façades have acquired greater importance given their capacity to improve the energy efficiency of buildings. One such type is the so-called Active Transparent Façade (ATF). A 3D numerical model based on computational fluid dynamics (CFD) and the Finite Element Method (FEM) has been generated to simulate the thermal performance of buildings equipped with this type of façade. This model is introduced for general application and allows the design parameters to be adapted for this system. The case study of Le Corbusier’s proposal for the City of Refuge in Paris, the clearest example of previous use of an ATF is examined. In addition, a proposal is presented for the energy improvement of Le Corbusier’s original solution. In order to do so, the conditions for the supply of air into the ATF cavity and in the mechanical ventilation system are assessed to guarantee comfort conditions.
1. Introduction
The use of active façades is one of the main lines of research for increasing energy efficiency in buildings. Their design and operation are essential in ensuring a comfortable indoor climate under different outdoor environmental conditions. The Active Transparent Façade (ATF) is an architecturally relevant type of Double-Skin Façade (DSF) consisting of double glazing panes with a mechanically ventilated air cavity between them.
The use of a DSF constitutes an improvement on Single-Skin Façades, as analysed by Gratia and de Herde [1] in different climates. However, one of the factors to be controlled in these façades is potential overheating in a building due to the increase in air temperature in the cavity resulting from the high temperatures reached on the surface of the outer glass. This can in turn generate an increase in cooling loads. There is also a need to control surface condensation, especially at night in humid tropical climates, as it leads to the use of mechanical fans with the subsequent increase in electric consumption [2].
The corrective measures to prevent overheating problems in DSFs has been studied by various authors. Gratia and André [3] propose solutions using solar protection, assessing the efficient position of shading devices, given that the location of the blinds, the colour of the blinds and the opening of the double skin are the most important factors. Barbosa and Ip [4] analyse the use of DSFs in buildings with natural ventilation by assessing the influence of the façade and building as well as the site parameters: the features of the cavity and the external layer of the façade, the configurations of the building and the effects of outdoor environmental conditions. The efficiency of the ventilation in the air cavity as dynamic insulation with respect to solar radiation was studied by Hazem et al. [5]. Based on thermal measurements, Larsen et al. [6] proposed corrective measures in Mediterranean climates according to orientation and selecting the most suitable types of glazing and ventilation of the interior cavity in order to reduce overheating. Gelesz and Reith [7] also analysed the behaviour of these façades in central European buildings based on orientation. According to this study the need to heat a fully glazed cell is minimal and by applying the ventilation and shading system to the cavity the cooling loads can be reduced by 7% and 9–12% on average compared to a façade with double or triple glazing, respectively.
Graf and Marino [8] propose energy conservation and reduction strategies that are suited to comfort and thermo-acoustic performance. Presenting a different approach, Zuazua-Ros et al. [9] apply animal biomorphic models as a system for building energy management, taking into account morphology and modifying spaces for use.
Ibañez-Puy et al. [10] analysed the energy efficiency of a building with the addition of a Ventilated Active Thermoelectric Envelope (VATE). The modular façade prototype features a Ventilated Active Façade (VAF) as a passive design strategy for the optimised performance of the Opaque Ventilated Façade (OVF), while the active technology used to improve sustainability is made up of renewable energy devices with Thermoelectric Cooling and Heating Unit (TCHUs) which act as heat pumps.
Le Corbusier’s mur neutralisant [11,12,13] is the best-known antecedent of an ATF. His innovative proposal, formulated a century earlier but never executed, included a ventilation system in its interior air cavity and thermal control of initial airflow. In addition, in his design for the City of Refuge in Paris [14,15,16], Le Corbusier combined the use of the mur neutralisant with a mechanical ventilation system to control the indoor air quality in the dormitories - a system which he named respiration exacte, using a biological simile [17].
Although some experiments predict the behaviour of a DSF using Computational Fluid Dynamics (CFD) [18], to date very few studies analyse the joint effect of a DSF with a mechanical ventilation system in controlling indoor air quality in buildings. Among these it is worth noting that by Fallahi et al. [19], which develops a numerical model for predicting the thermal profiles of different DSF configurations in order to calculate the cooling/heating loads resulting from an interior area adjoining the façade. Pappas and Zhai [20] used an iterative model with CFD and a Building Energy Simulation Program (BESP) to establish a series of correlations for airflow values for the cavity, stratification of air temperature and interior convection coefficient. Based on these, they carried out an energy analysis of a DSF with buoyancy-driven airflow adjacent to a habitable space at a constant temperature of 20 °C.
A wide range of simulation tools is currently used to assess the energy behaviour of DSFs, including TRNSYS, EnergyPlus, BSim and BESP. Kim and Park [21,22] analysed whether simulation tools are able to provide accurate descriptions of the transient heat and mass transfers occurring within the complex 3D geometry of DSFs. They showed the differences occurring in thermal behaviour and in airflow in the chamber between the measurements of experimental data and the EnergyPlus simulation results. Errors are mainly caused by the degree of uncertainty of input parameters in the simulation, simplifications during the modelling process, or the limitations of the simulation tool. They propose the use of more advanced models with broader access to software, as EnergyPlus does not allow certain parameters to be exported. New expressions are needed for the coefficients for heat transfer through convection, based on air speed within the cavity.
There are interesting studies on the energy behaviour of ATFs in buildings in Mediterranean climate based on CFD [23,24]. The prediction of heat transfer in CFD simulation continues to be a complex task. Peng et al. [25] analysed error factors such as in turbulence models, software used, influence of surrounding conditions, meshing, convergence criteria and simulation strategies. In addition, differences are observed depending on whether the model is generated in 2D or 3D. In most of the literature published, energy models are conditioned by room measurements and the complexity of their shape, by the model type (1D, 2D or 3D), as well as by the long computation times due to numerical complexity, command of space, the passing of time and simulation periods [26]. As a result of this, Fuliotto et al. [27] proposed a simple computer tool using uncoupling methods to obtain simplified software to assess the operation of these façades using 2D models.
This study aims to develop a 3D mathematical model combining the simultaneous action of an ATF and mechanical ventilation system of the room as a thermal conditioning system. The case study used is a dormitory from the City of Refuge in Paris (1929–1933). In the building of the City of Refuge Le Corbusier incorporated both his proposals for technological innovation—the mur neutralisant and respiration exacte—as a way to adapt the new glazing architecture of the Modernist Movement to the environmental conditions. Le Corbusier proposed the application of this type of active façade in all environmental conditions. The building as a machine for habitation had to function from Dakar to Moscow [28]. In addition to establishing the effectiveness of the system proposed by Le Corbusier, an energy improvement of the system is proposed by modifying airflow supply temperature into the ATF cavity and the mechanical ventilation system.
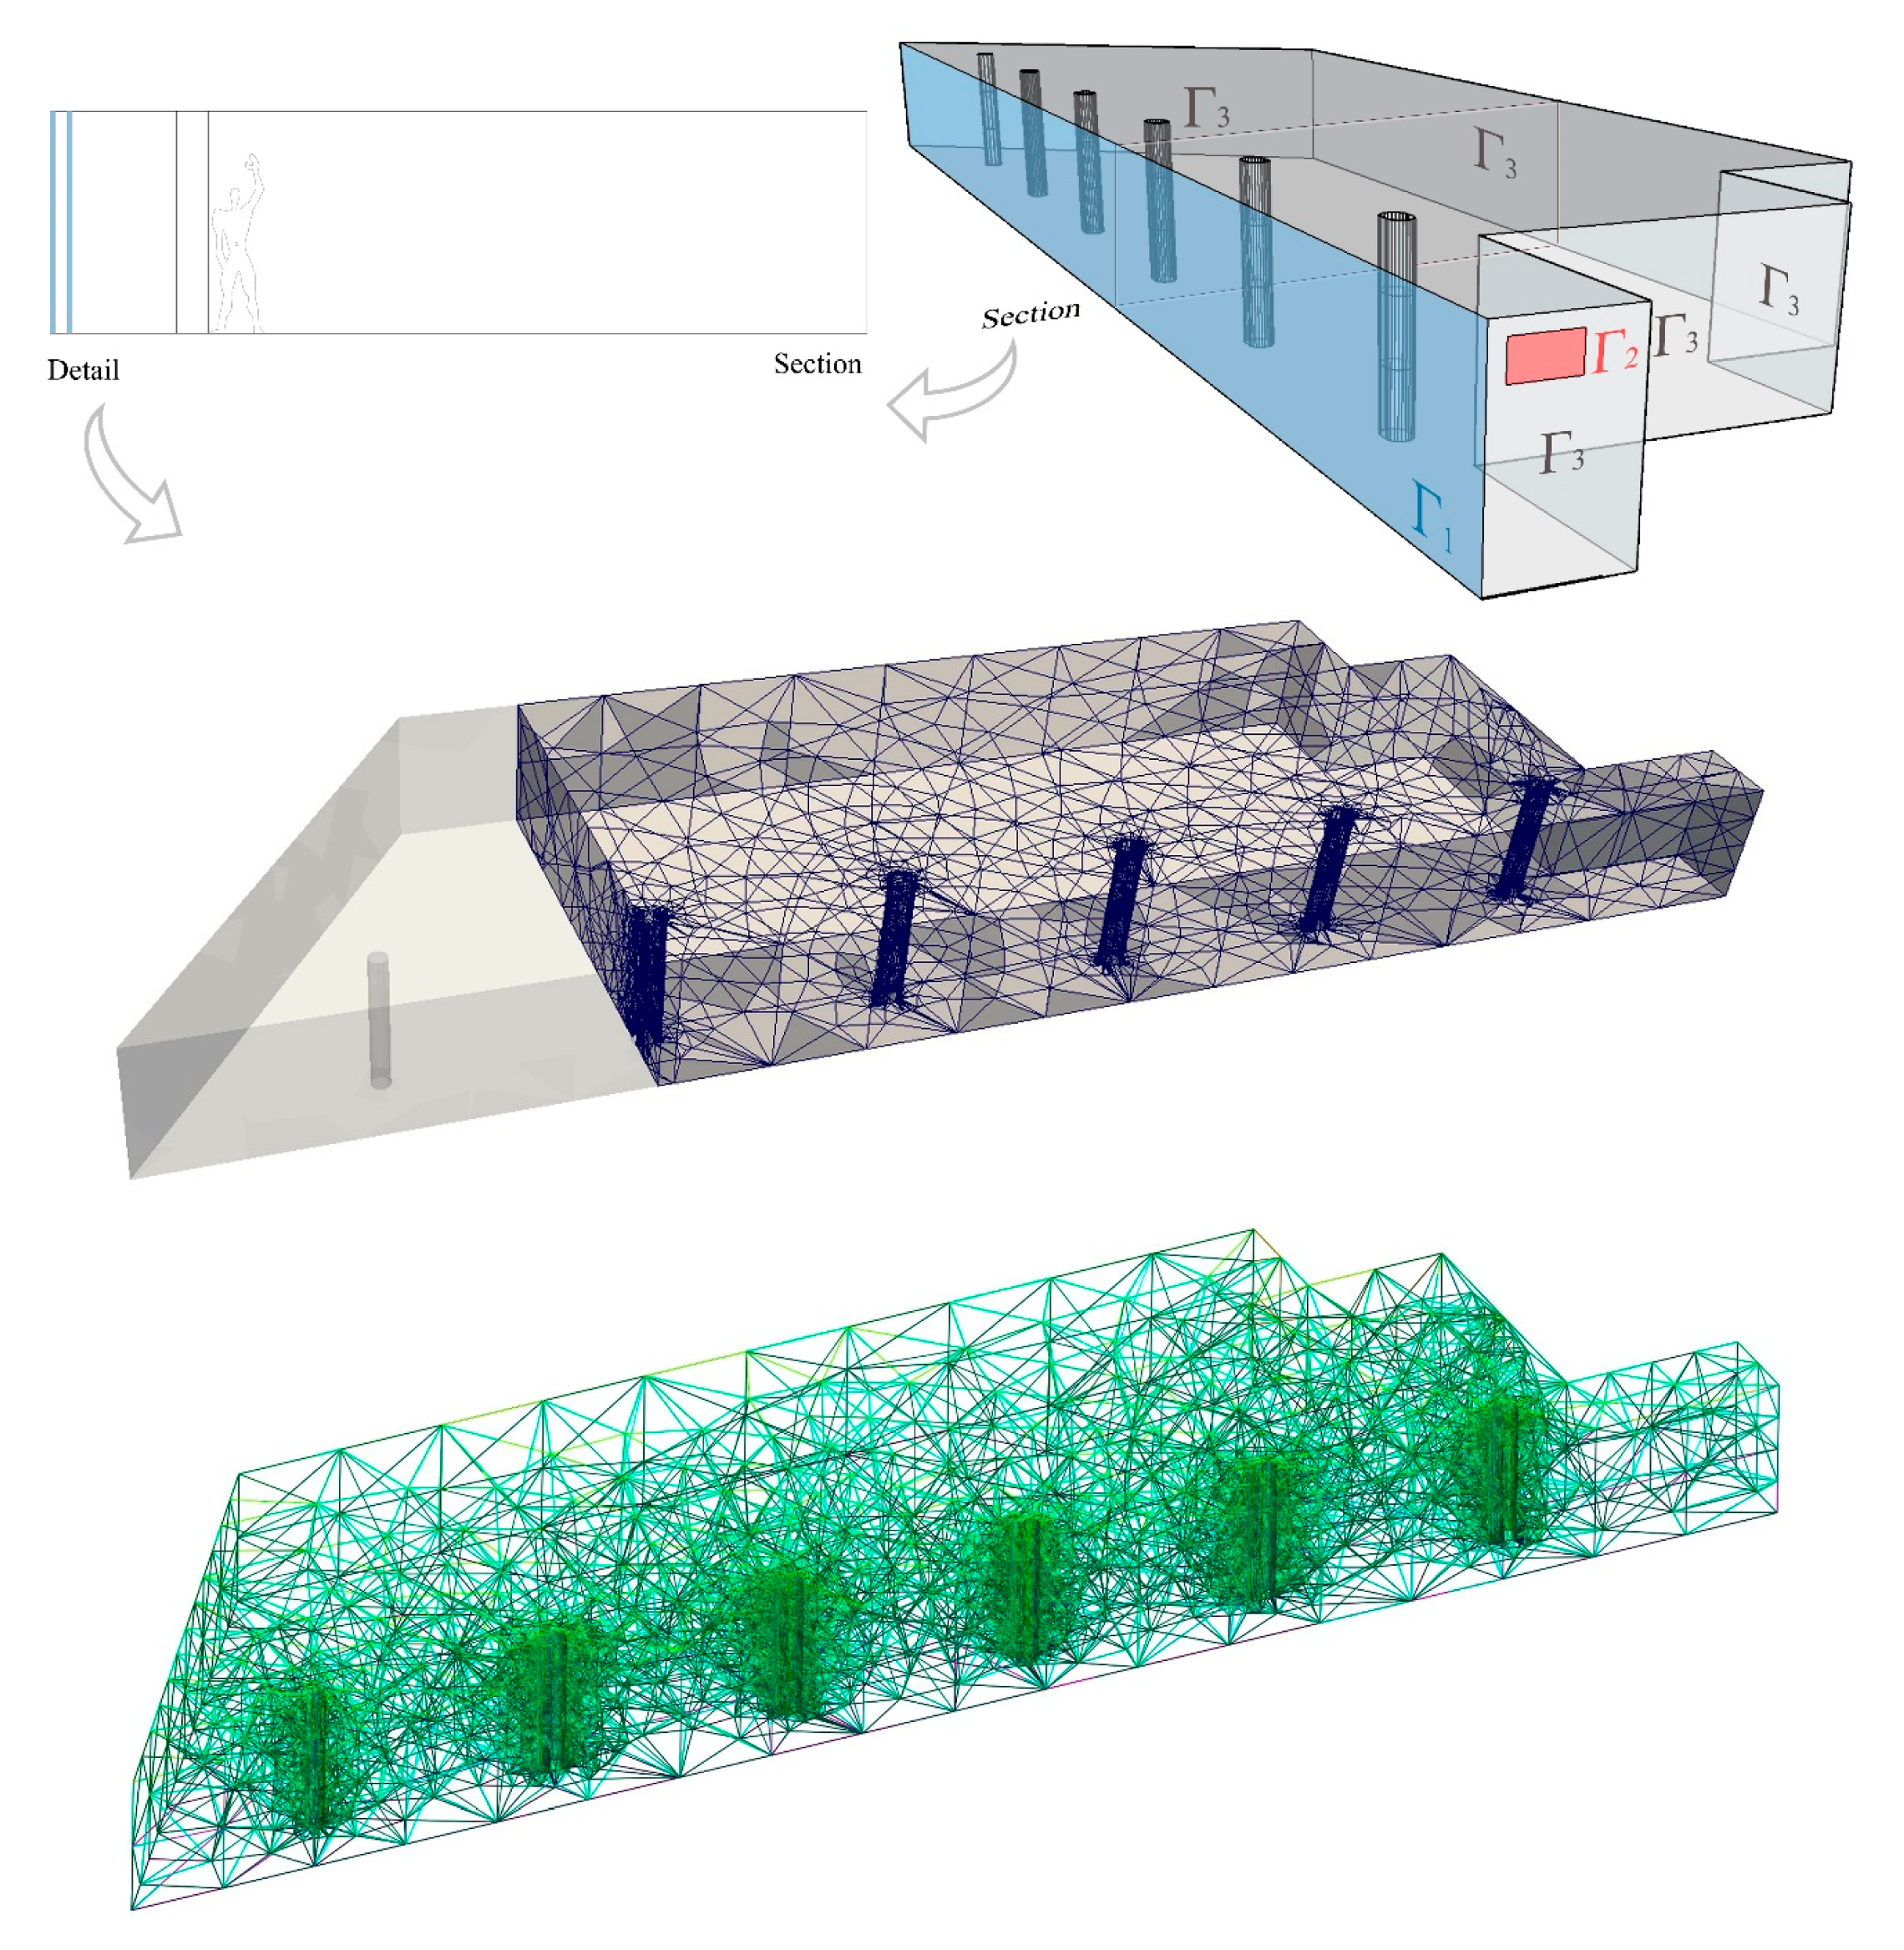
Previous work by the authors [29,30] proposed a 1D numerical model of the active façade designed by Le Corbusier for the City of Refuge. In order to assess its thermal effect in the dormitory (case study) this 1D model was coupled with a 2D model of the room using an implicit finite volume method for individual resolution of the façade. This study constitutes significant progress over the previous one as the mathematical model for the case study has been formulated in 3D. Nevertheless, the façade system can be reduced to a 1D problem, almost without reducing the general application of the model. The 3D model simulation for the room using CFD allows the thermal behaviour of the case study room to be established, improving results over those of the previous research and also incorporating the effects caused by the set of pillars placed indoors parallel to the active façade (Figure 1). This produces a truly 3D indoor distribution of the flow, conditioned by the vertical temperature gradient of the façade as well as by the mechanical ventilation in the room, now executed with greater precision.
2. A Coupled 3D CFD and ATF Model
This section presents a general model to solve the complete problem of ATFs, including the resolution of the dynamics within the room. As mentioned above, the study of the influence of the active façade systems in indoor temperatures [14] is challenging. This study is only possible if the whole system, façade and interior space are simulated as a single physical problem. Thus, the general framework includes a complete 3D formulation with interactions between the façade and the interior space. However, there are some ways of simplifying the numerical calculations without loss of generality. The aim is to work with a model that is accurate in calculations and not too computationally expensive.
The problem can be split into two systems. The first involves the calculation of the air and temperature dynamics inside the room adjacent to the ATF (Proom), while the second solves the thermal problem within the façade (Pfaçade). The natural coupling between these two systems affecting the thermal conditions must be defined.
Regarding the problem inside the room, is used to denote the 3d velocity field, while is the pressure and the temperature. Following this, the model is a coupling of the Navier-Stokes equations for incompressible fluids and a convection-diffusion equation for temperature. If considering a constant density of air , it reads:
The first two equations in this problem solve the dynamics of the air in the room where is the air dynamic viscosity and the gravity force. The last convection-diffusion equation provides the temperature for the room where is the air specific heat, the volume of the room, the air thermal diffusion parameter, and a source term representing the total heat charge. Time is denoted by . The initial conditions are denoted by superscript 0 for velocity, pressure and temperature. The boundary represents the internal layer of the façade wall; is the mechanical ventilation grille; and the rest of the walls are denoted by . It is assumed that there is an inflow condition with inlet velocity and inlet temperature in the ventilation grille.
The interaction of the room with the ATF is taken into account in the boundary conditions of the problem (Proom). It should be highlighted that the internal layer is the common surface in both systems. The influence of , the temperature inside the room, in the evolution of the temperature of the internal layer is already taken into account in its dynamic equation for each time (see third equation in the façade problem (Pfaçade) defined in (3)). However, the influence of the temperature of this wall on the temperature inside the room is imposed through a time-dependent boundary condition:
This condition is applied for each time where denotes the outer normal vector to the internal layer and is the transmittance of the internal layer. Finally, a free boundary condition is considered for the rest of the walls , as temperature evolves according to room temperature.
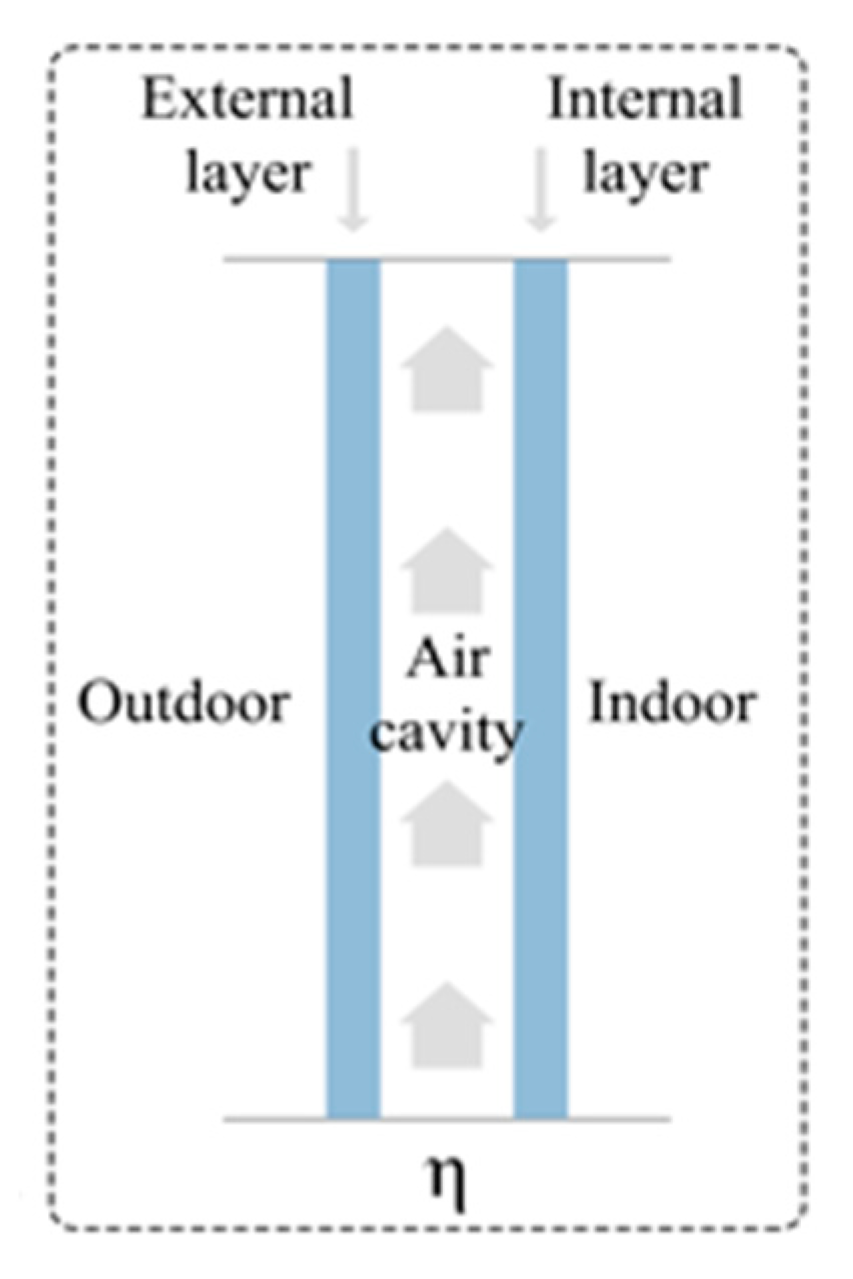
The model presented to solve this system was introduced by Ismael et al. [31]. The thermal problem in the façade can be reduced to a 1D simplified model without loss of generality in the framework. The behaviour of the active wall is assumed to be uniform longitudinally, the focus is placed on a perpendicular section of the wall, maintaining the verticality and depth components (see the Figure 2 and Equation (3)). Subsequently, the evolution in time of the temperatures coupled in the active façade system (external wall, air cavity and inner wall) is resolved. The equations to solve this system involve the calculation of the three temperatures of the external layer , internal layer and the temperature of the air inside the cavity, (see [32] for details). Hereafter, properties referring to the external layer are denoted by the subscript ‘el’, the air chamber by the subscript ‘a’, and the internal layer by the subscript ‘il’. The system reads:
with , being the height of the wall and the temperature inside the room (see notation in Table 1). Note that in cases where the external layer is opaque, the short wave transmission coefficient of the external layer in the last equation vanishes. Initial conditions for each temperature are denoted as before by superscript 0. The active system in the façade problem is included through the boundary conditions representing the flow supply into the cavity. The airflow temperature at the base of the cavity ( and a free boundary condition at the top ( are imposed.
It should be noted that since the volume is , for being the thickness of the layer , the only geometrical measurement involved in this system is the thickness of each layer. The net radiant heat transfer per unit area is calculated as the difference between the rate of radiant energy leaving the surface per unit area and the rate of irradiation received per unit area , that is, See [30] for further details.
The problem is solved using FreeFEM3D software [32], the current version for 3D calculations with Finite Element Method of the original Freefem++ used in [30]. The numerical approximation of is carried out directly using the mixed Finite Element method in FreeFEM3D (3.61-1, Université Pierre et Marie Curie and Laboratoire Jacques-Louis Lions, Paris, France). Given that the problem is the same as in [30], further details on the numerical approximation can be found in this paper.
3. Application to the City of Refuge by Le Corbusier
This section focuses specifically on the application of the 3D model mentioned above to a dormitory in Le Corbusier’s City of Refuge. Firstly, given that this problem has already been examined in previous research [30,31], it is appropriate to highlight innovations and improvements resulting from the use of the 3D model. Secondly, a description is provided for the specific boundary conditions and parameters appearing in the model for the case study. In addition to these, ‘design parameters’, specific data greatly affecting the comfort and energy efficiency of the system, are introduced here. Finally, the numerical results obtained in this framework for two cases, the design parameters originally proposed by Le Corbusier and a proposal for improving the energy efficiency of the combined system are presented and discussed.
3.1. The Case Study
The case study is a shared dormitory of Le Corbusier’s City of Refuge (1929–1933) in Paris. This is the first known building where an ATF, termed mur neutralisant by its author, was developed. This system was devised to act in combination with mechanical ventilation in the room, known as respiration exacte. In this case, the objective is to analyse the operation of the combined innovative solution of ATF-mechanical ventilation (mur neutralisant-respiration exacte).
This problem was already considered in previous papers [30,31] and solved using a simplified 2D model for a horizontal section of the room. The thermodynamics of the room (Proom) were calculated avoiding the vertical component of the magnitudes. Even if this approximation yields satisfactory results, the vertical component in the fluid dynamics of the air inside the room may play an important role, as can be seen in the 3D profile of the air dynamics relevant in the meeting with walls and pillars.
It should also be noted that as ventilation of the active façade occurs in a vertical direction, a temperature gradient is found along this glass wall, at least initially. Additionally, when applied to the City of Refuge, a mechanical ventilation system inside the room is considered. This involves a supplementary flow at a fixed height into the room which may strongly affect the vertical structure of the temperature.
All these considerations are now taken into account in the 3D model proposed. The objectives are therefore two-fold. The first of these, in terms of modelling and CFD, is the improvement of the results through the addition of the following effects:
- Real 3D geometry by including obstacles inside the room, such as pillars, that may influence the air circulation,
- 3D dynamic flow with vertical structure,
- Influence of the inflow conditioning inside the room in vertical behaviour,
- Influence of the vertical gradient of temperature in the ATF.
The second more analytical objective is to predict the thermal behaviour of the room under study, helping to:
- Further explore the conclusions about the climate system of the City of Refuge devised by Le Corbusier;
- Establish the relationship between the outdoor climate and the operating conditions of the combined mur neutralisant-respiration exacte system, for typical extreme weather conditions in Paris for both winter and summer, in search of an indoor comfort temperature;
- Establish the influence of occupation in order to meet the conditions for indoor comfort, for winter and summer, searching for an energy-efficient solution.
3.2. Specific 3D Model
The room analysed is 37.2 m long and 10 m deep, with a height m and it was furnished with 67 beds. Six pillars at a distance of 1.32 m from the façade are lined up 4.75 m apart. It should be noted that occupancy is taken into account through the definition of the occupancy load . The beds are not considered in the generation of the mesh.
The south-facing ATF occupies the longest wall of the room. The system consists of two layers of glass, 7 mm thick and 3 m high, and separated by a 10 cm air cavity. Figure 1 shows the plan of the space under study and a picture of the computational mesh. A mesh with 20,739 tetrahedrons has been established to present the numerical results of this paper. A turbulent model was not considered for these simulations, given the range of the characteristic velocity norm corresponding to a laminar regime. Figure 3 shows the room and velocity vector coloured and scaled in terms of the velocity norm for the summer experiment presented in Section 3.3.3. The most unfavourable case studied is found in the summer when the maximum velocity value of the inflow velocity is imposed (3.55 m/s). It is observed that the characteristic velocity in the room is that of a laminar regime (the characteristic Reynold number is lower than 3000). Nevertheless, the 3D CFD coupled code developed can be also applied in turbulent regimes when needed.
The main purpose of this façade is to act as a barrier for the indoor space and to counteract the outdoor climate. In this sense, the ‘active’ action is to supply conditioned air through the cavity for heating in winter or cooling in summer. This entails two design parameters: airflow temperature by and the flow supply into the cavity in relation to the mass flow rate . These parameters only affect the (Pfaçade) problem, the values of which are introduced in Section 3.3.2 below. The façade problem for the City of Refuge is studied by considering the system defined by Equation (3), where the values of fixed parameters are specified in Table 2. It should be noted that the values of , , and the initial data depend on winter or summer and are specified in Section 3.3.1.
The problem (Proom) is slightly more complex and requires the selection of additional parameters. The different boundaries of the 3D domain are tagged in Figure 1.
Specifically, mechanical ventilation is propelled into the room through a grille in the wall (marked as in red in Figure 1). The condition of the ventilation grille affects both the velocity and the temperature problems, known as inlet conditions and denoted by the subscript ‘in’. Thus, the design parameters for the problem (Proom) are the inlet temperature , the inlet velocity and the location and size of the ventilation grille.
As stated in the previous section, a free boundary condition is assumed at the walls (including the ceiling, floor and pillars). In the common boundary with the glazed wall () a time-dependent condition is assumed in terms of the transmittance and the temperature of the internal layer of the façade system as described in Equation (2). This condition is calculated for each time interval as a solution of the 1D problem .
In the complete 3D model (1), the dynamic air viscosity is kg/ms, the air thermal diffusion m2/s and the gravity force m2/s. The initial data together with the occupancy load are specified later in Section 3.3.1, and the design parameters are included in Table 3 and Table 4.
3.3. Numerical Results
The coupled system - is solved for two climate situations, winter and summer, and for two representative days in each case, 29 and 30 December and 1 and 2 July respectively. For each of these the values for weather and initial data must be introduced. The design parameters defined in the previous section are also specified for each case. Furthermore, in Section 3.3.2 the simulation for the original climatic hypothesis by Le Corbusier is developed, followed by a proposal in Section 3.3.3 for a new climatic framework in order to obtain better results in comfort and energy efficiency.
3.3.1. Specific Data
The climate data for outdoor drybulb temperature (Tout) and solar radiation (Io), as the sum of normal direct solar radiation and horizontal diffuse solar radiation, are taken from DesignBuilder software [33]. This tool allows climate data to be exported following the energy simulation. DesignBuilder uses the EnergyPlus data base [34], weather data by location: Europe WMO Region 6—France—Paris Orly 071490 (IWEC). Real initial values cannot be used in the City of Refuge for thermal magnitudes as the solution designed by Le Corbusier was never executed. Therefore, the initial values used here were obtained through the simulation of an energy model using DesignBuilder software. This model was generated in two areas: the case study room and the mur neutralisant.
The initial data for air temperature in the case study and cavity match the results of the operating temperature of energy simulation at 0:00 on the first day of study. The initial temperature data for glazing and walls were obtained from the radiant temperature values generated by DesignBuilder and based on the calculations of EnergyPlus. These initial values are specified below (Table 3):
Finally, the occupancy load appearing in the temperature equation of the room is calculated for a ratio of 0.25 persons/m2 and an energy load of 46 W/person; resulting in W, from 18:00 to 08:00 h am each day.
3.3.2. Case 1: Original Hypothesis by Le Corbusier
In problem the airflow temperature to the ATF is fixed at 30 °C in winter and 15 °C in summer. The other parameter to be chosen is the supply flow into the air cavity, set at 216 m3/h, and the resulting mass flow is kg/sm2, see [30] for details.
For the room problem the mechanical ventilation is propelled into the room through a 0.9 m long and 0.5 m high grille located 2.28 m from the floor above the entrance door to the room (see Figure 1). The frontal velocity is fixed based on the ventilation flow, 300 m3/h in winter, resulting in m/s; and 1050 m3/h in summer, corresponding to m/s. Table 4 shows the design data adopted by Le Corbusier in his proposed system.
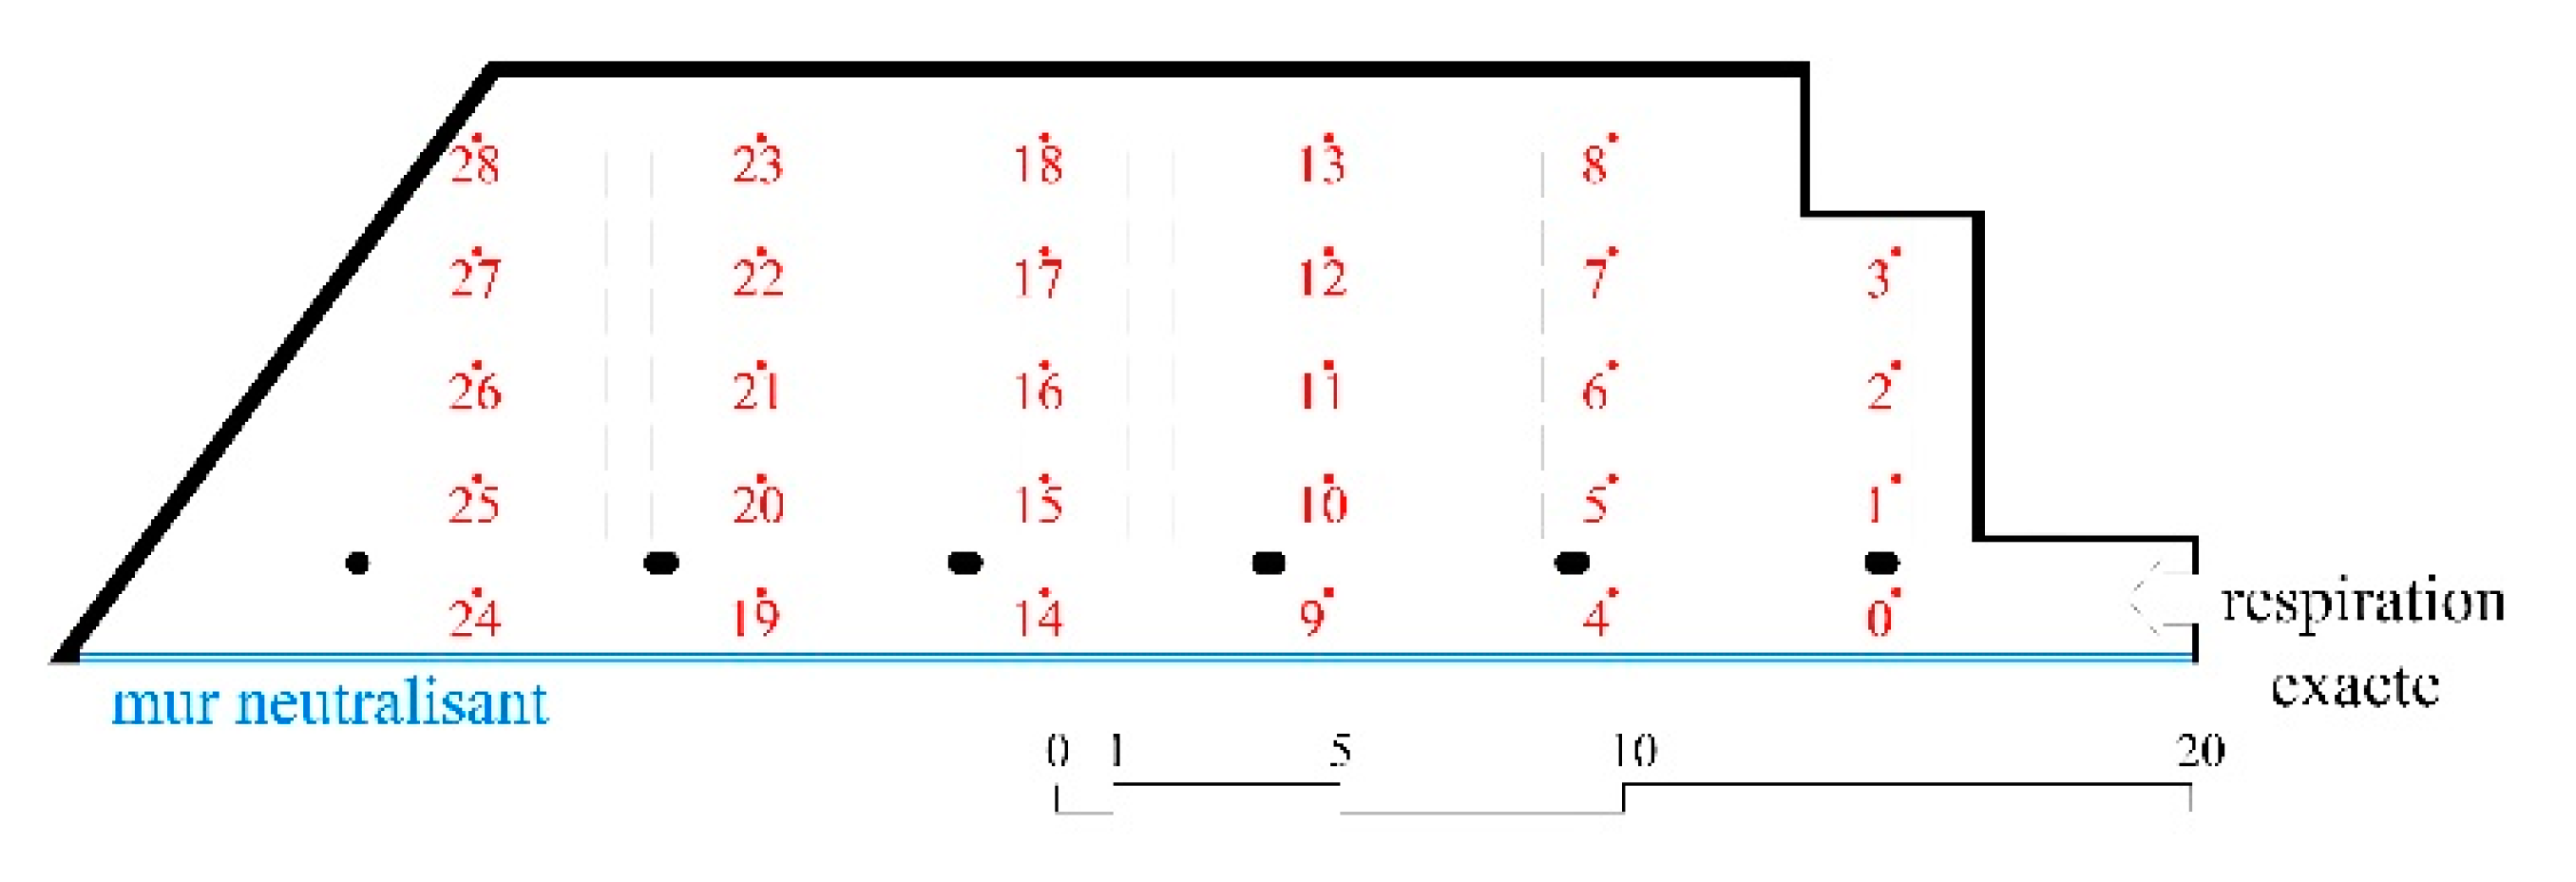
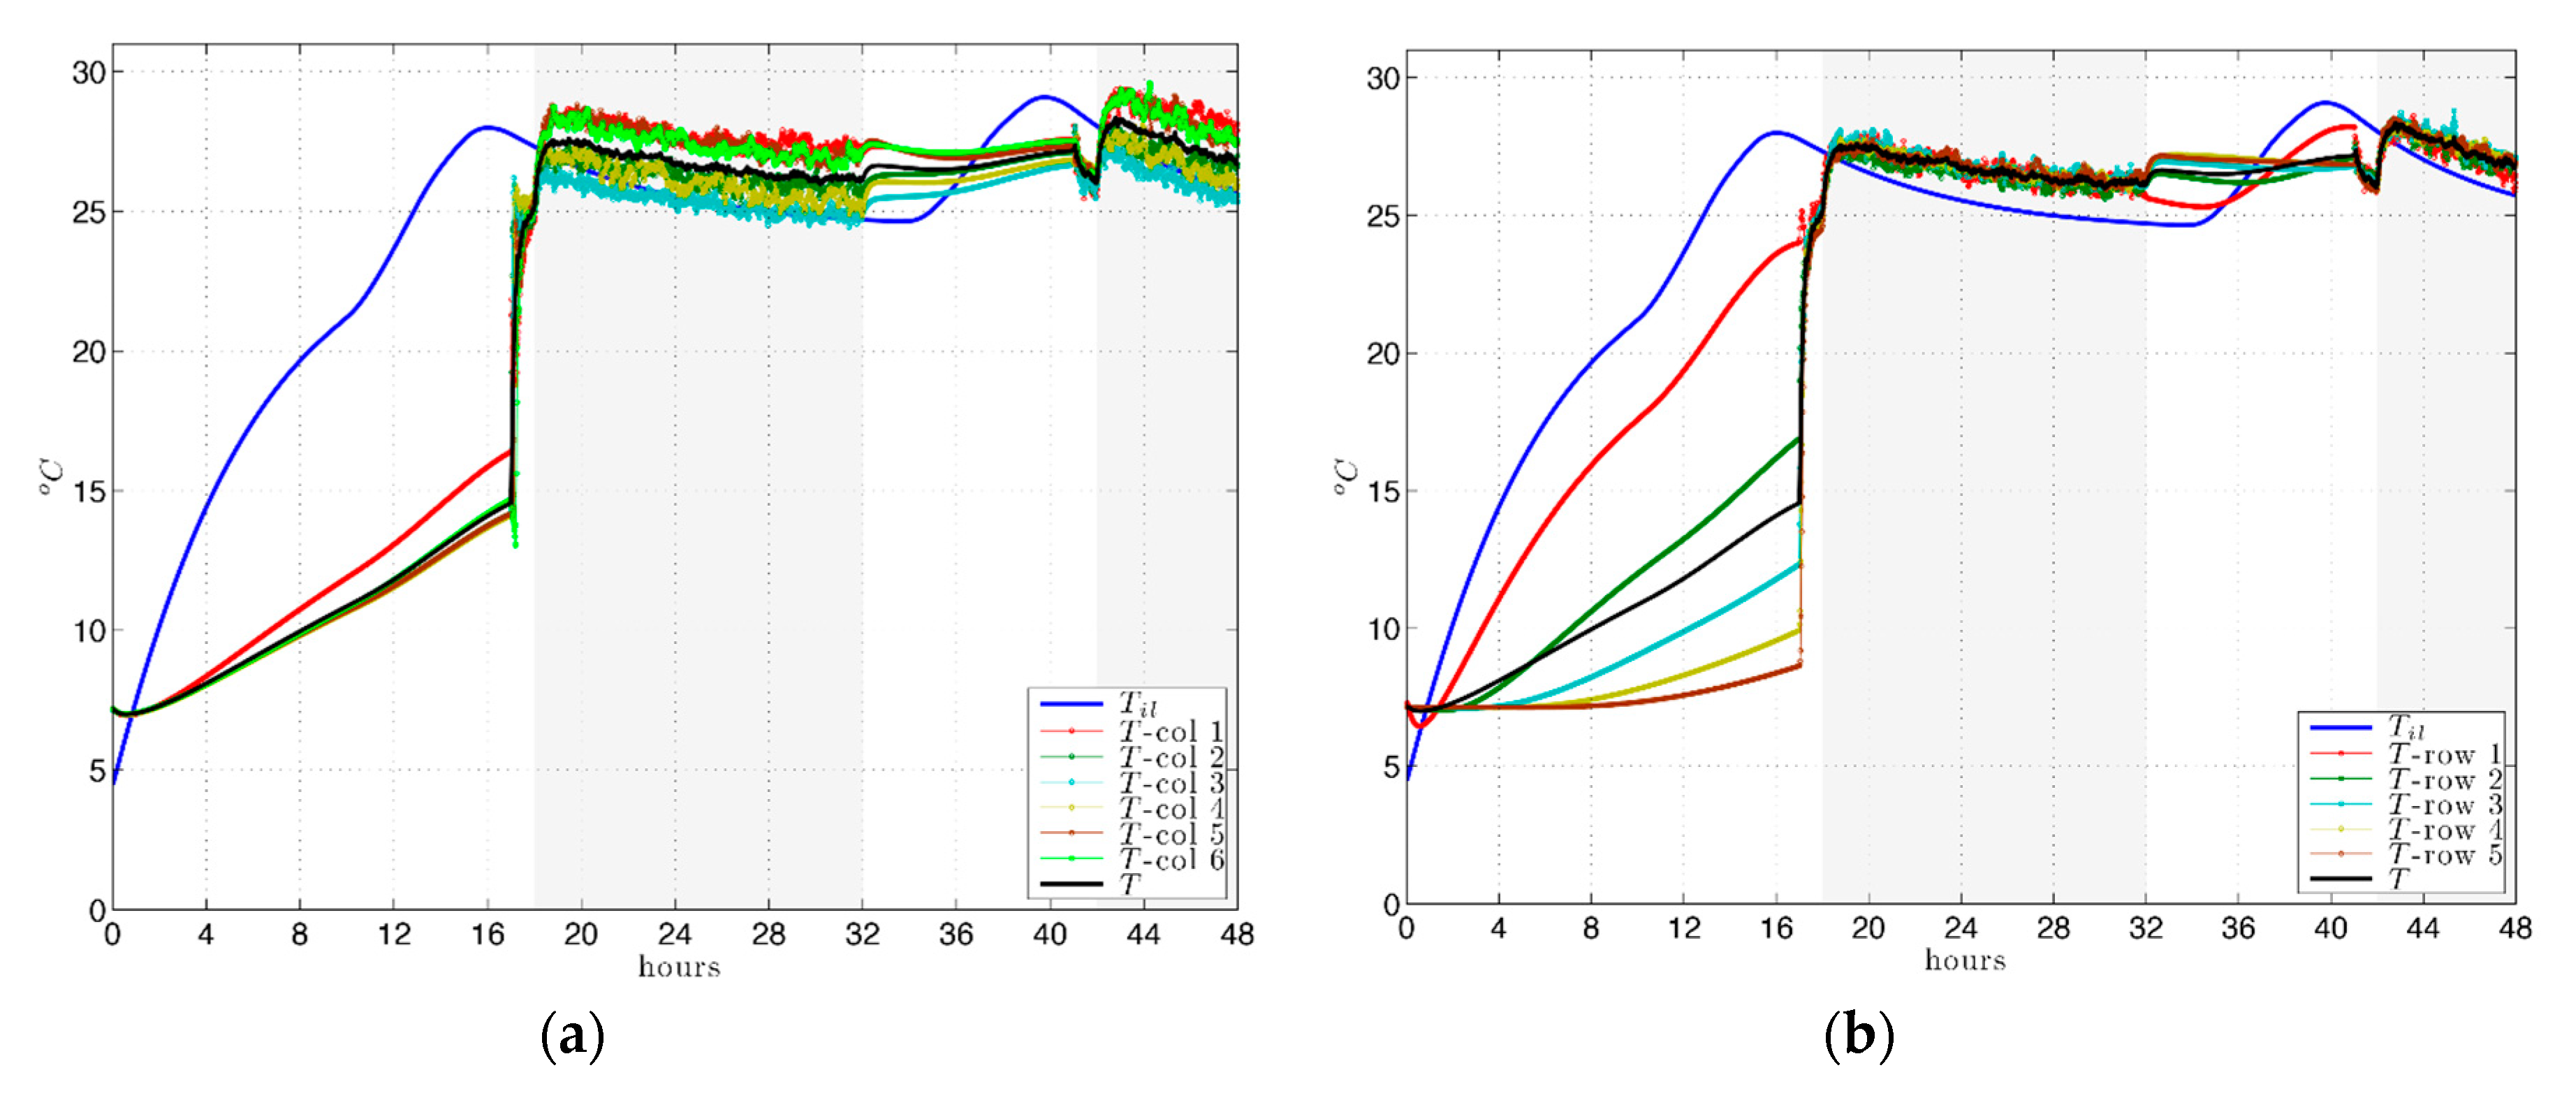
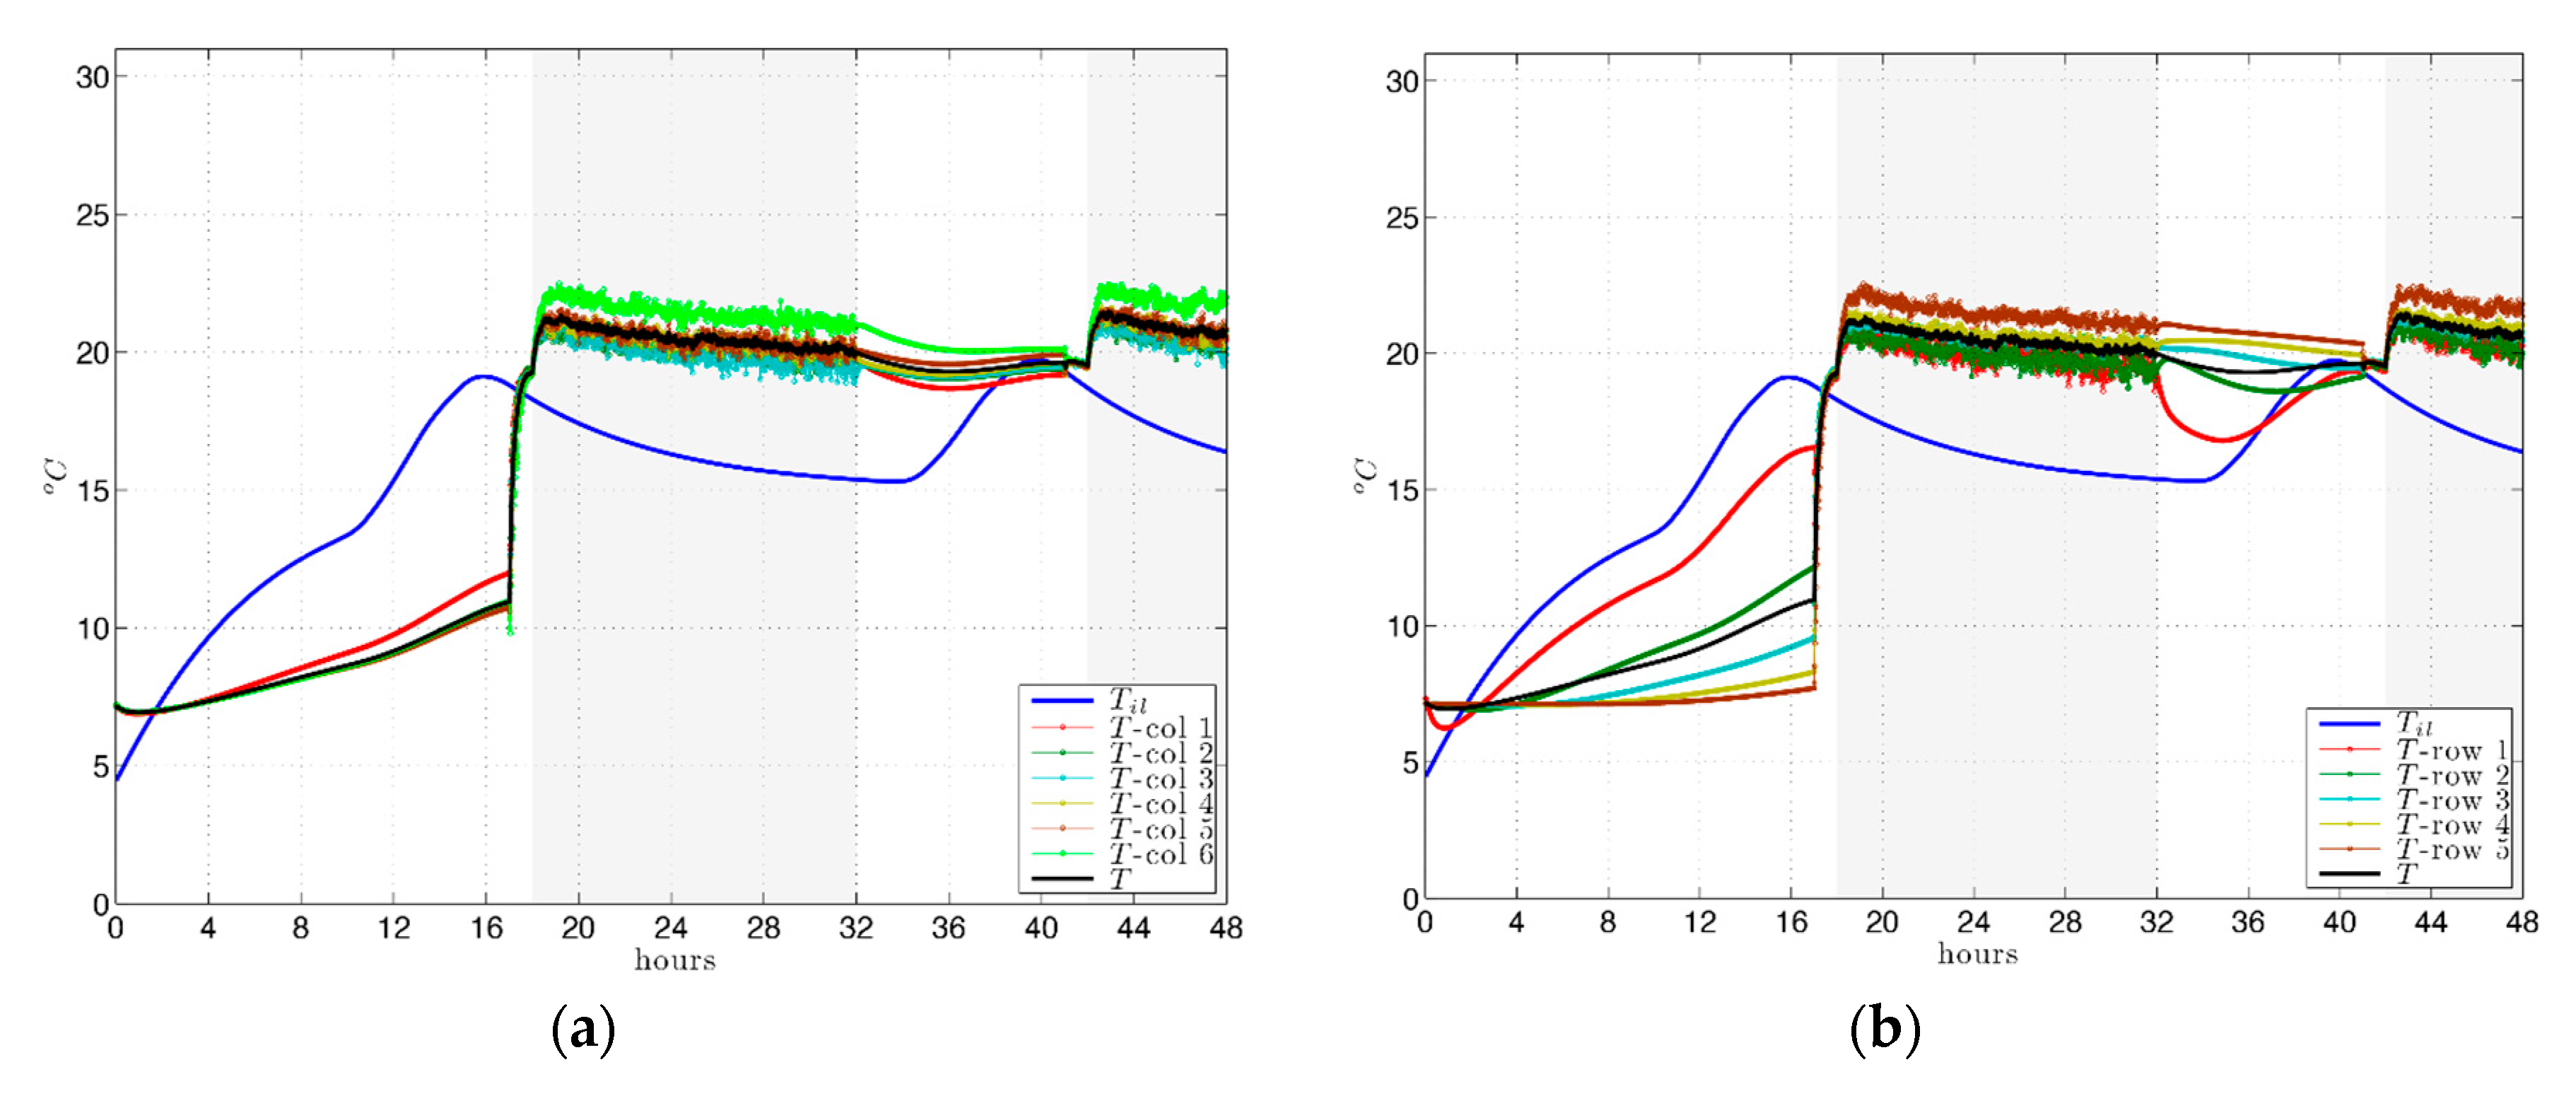
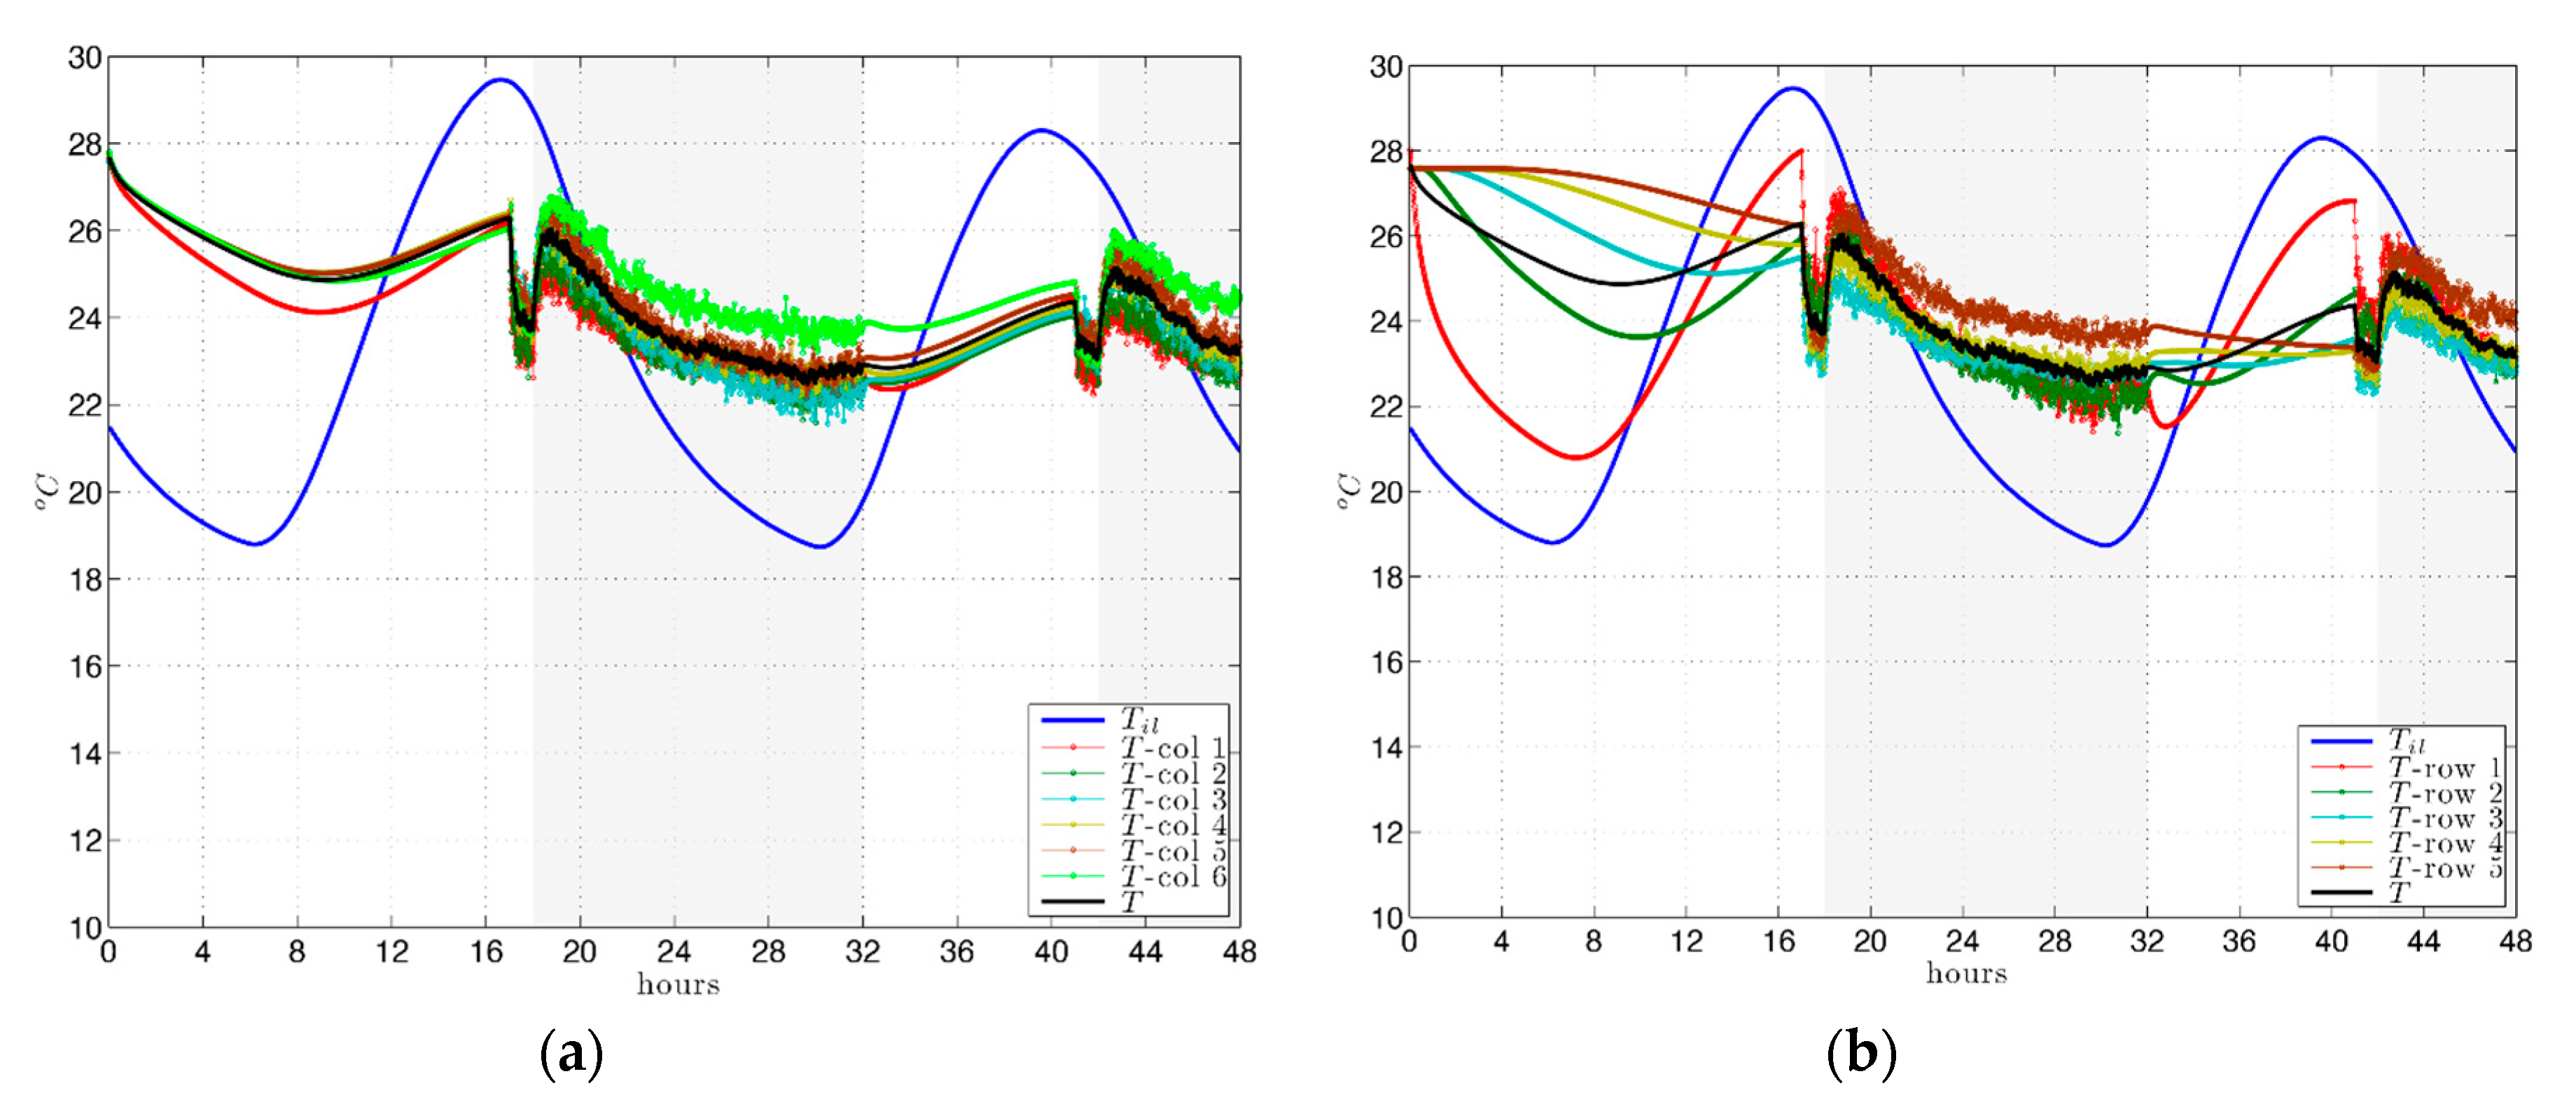
Specifically, the plotted temperature of the room is calculated as the average of the temperature obtained in the 29 probe points marked in Figure 4. Additionally, the average temperature for each column is plotted (Figures 6a and 8a), where column 1 is closest to the ventilation grille (points 0–3 in Figure 4) and for each row (Figures 6b and 8b), where row 1 is closest to the ATF (points 0, 4, 9, 14, 19, 24 in Figure 4).
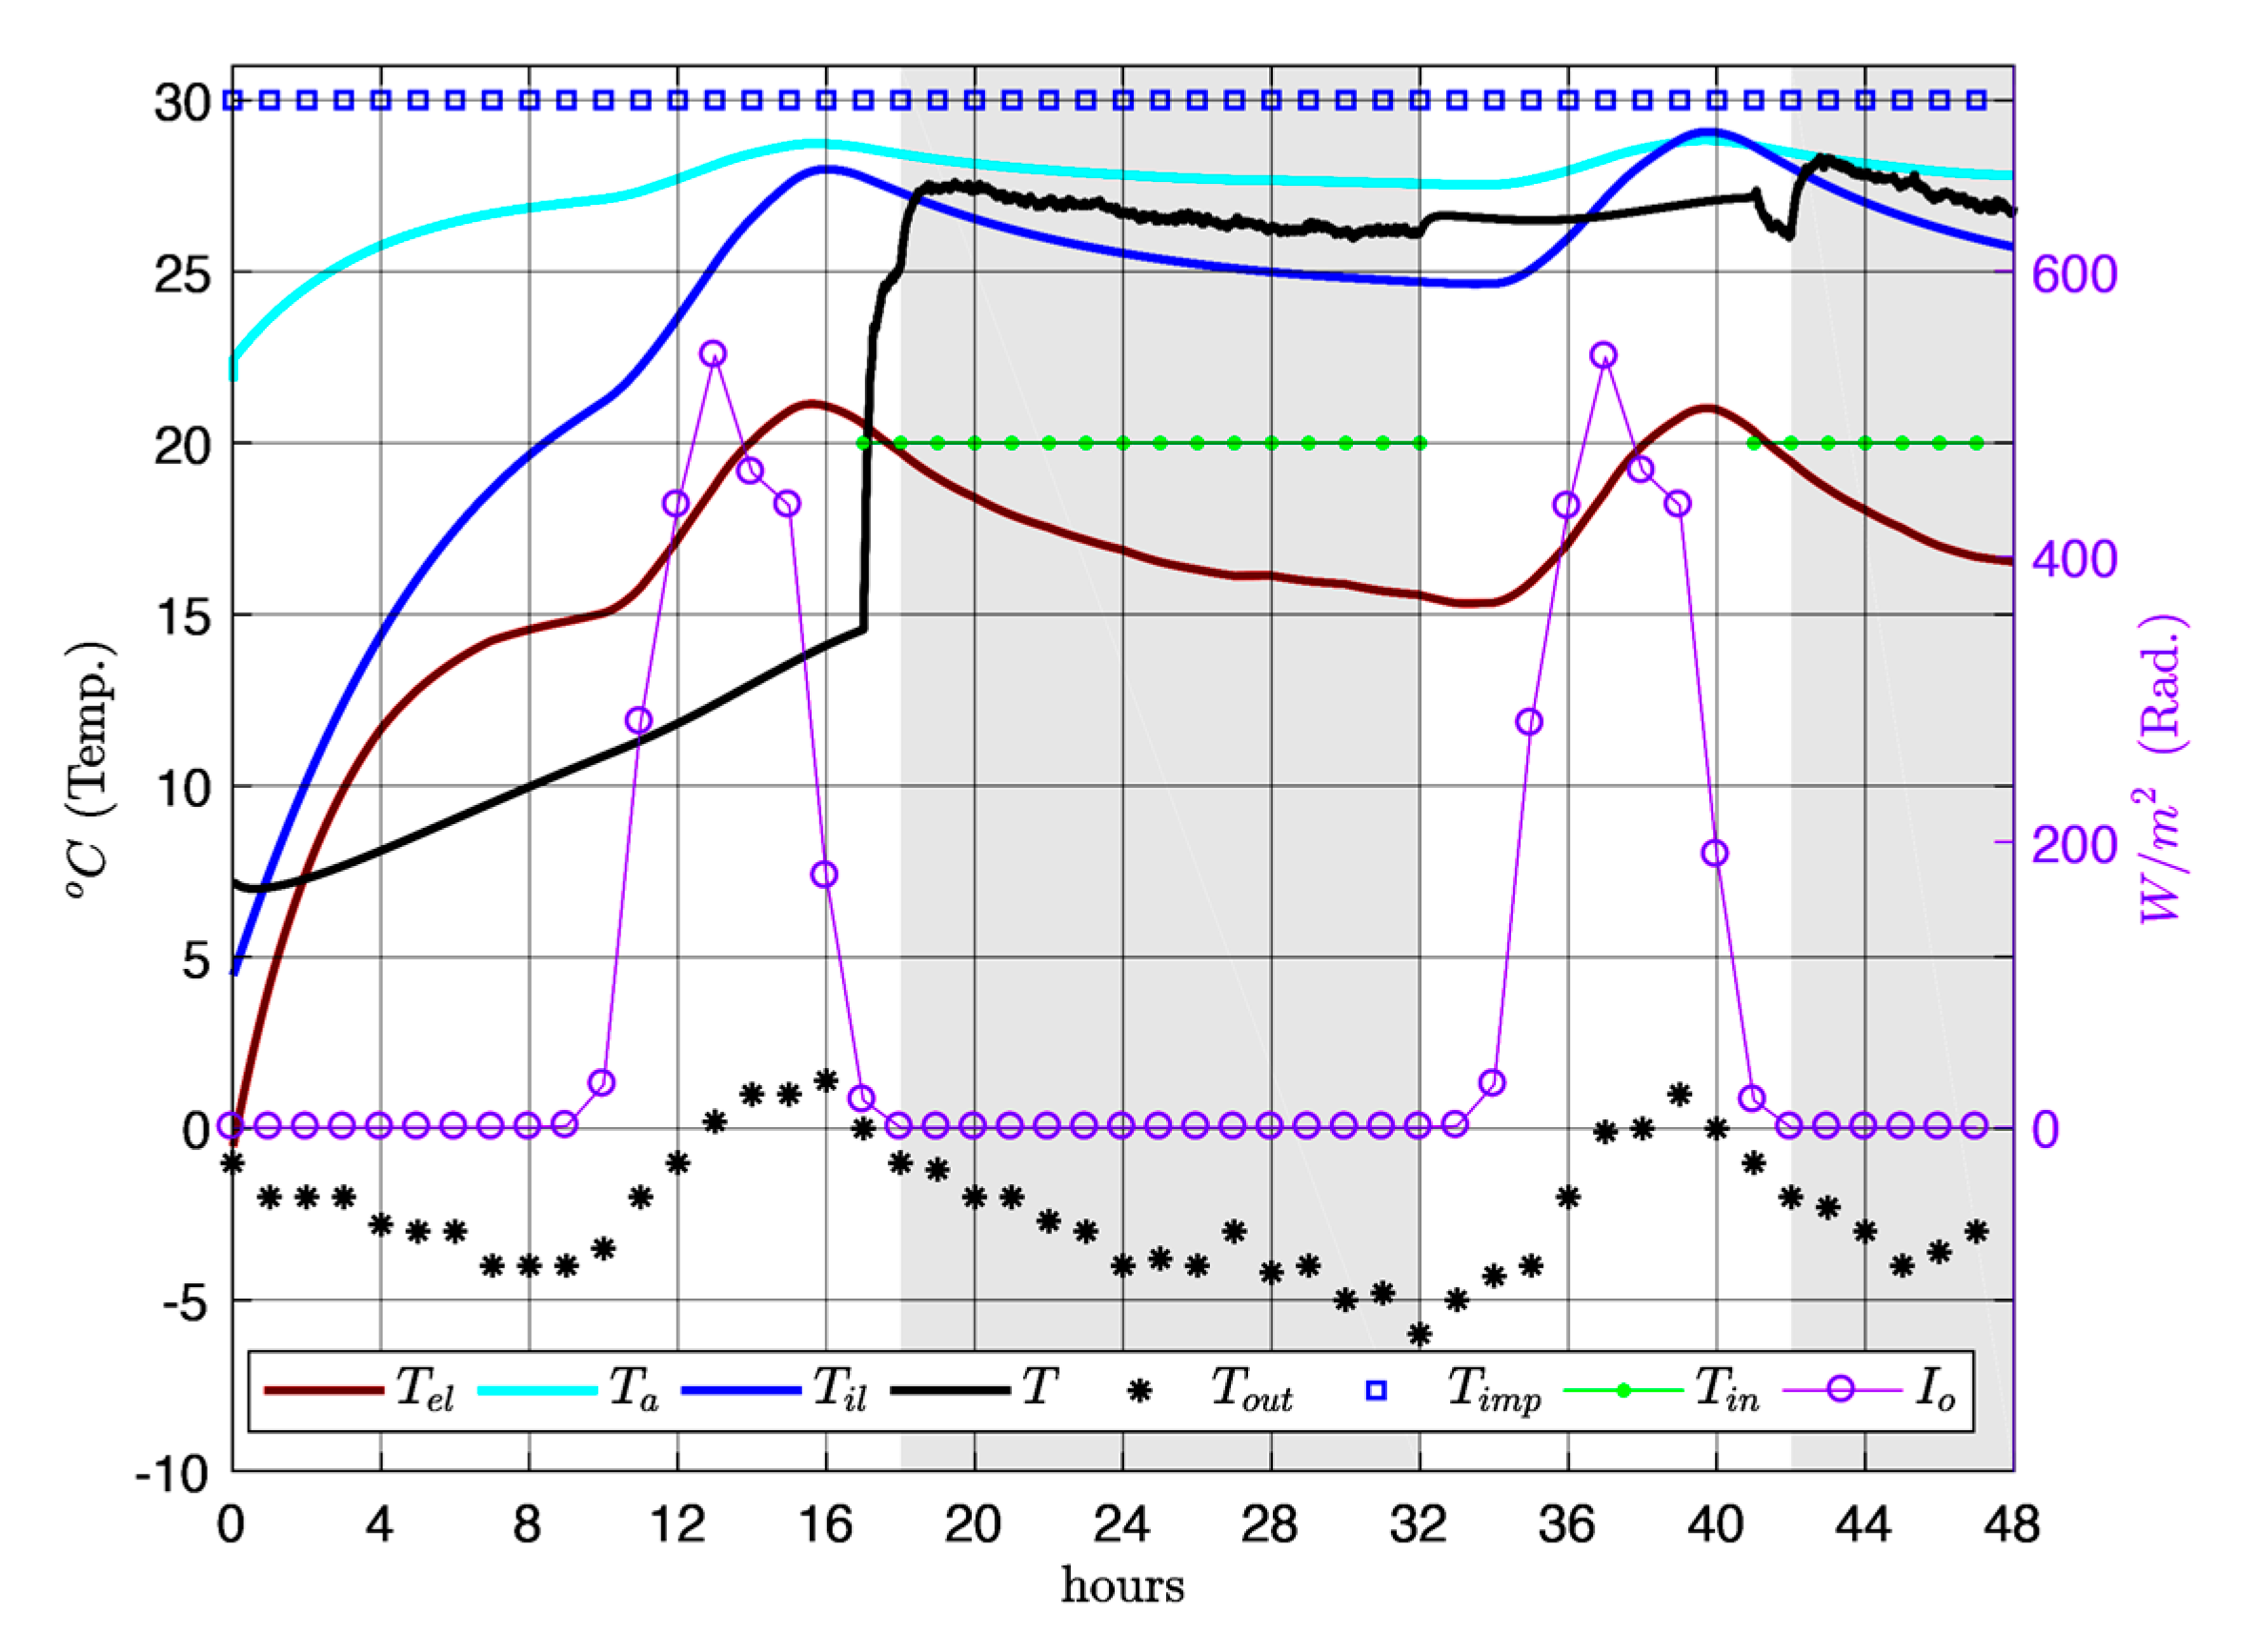
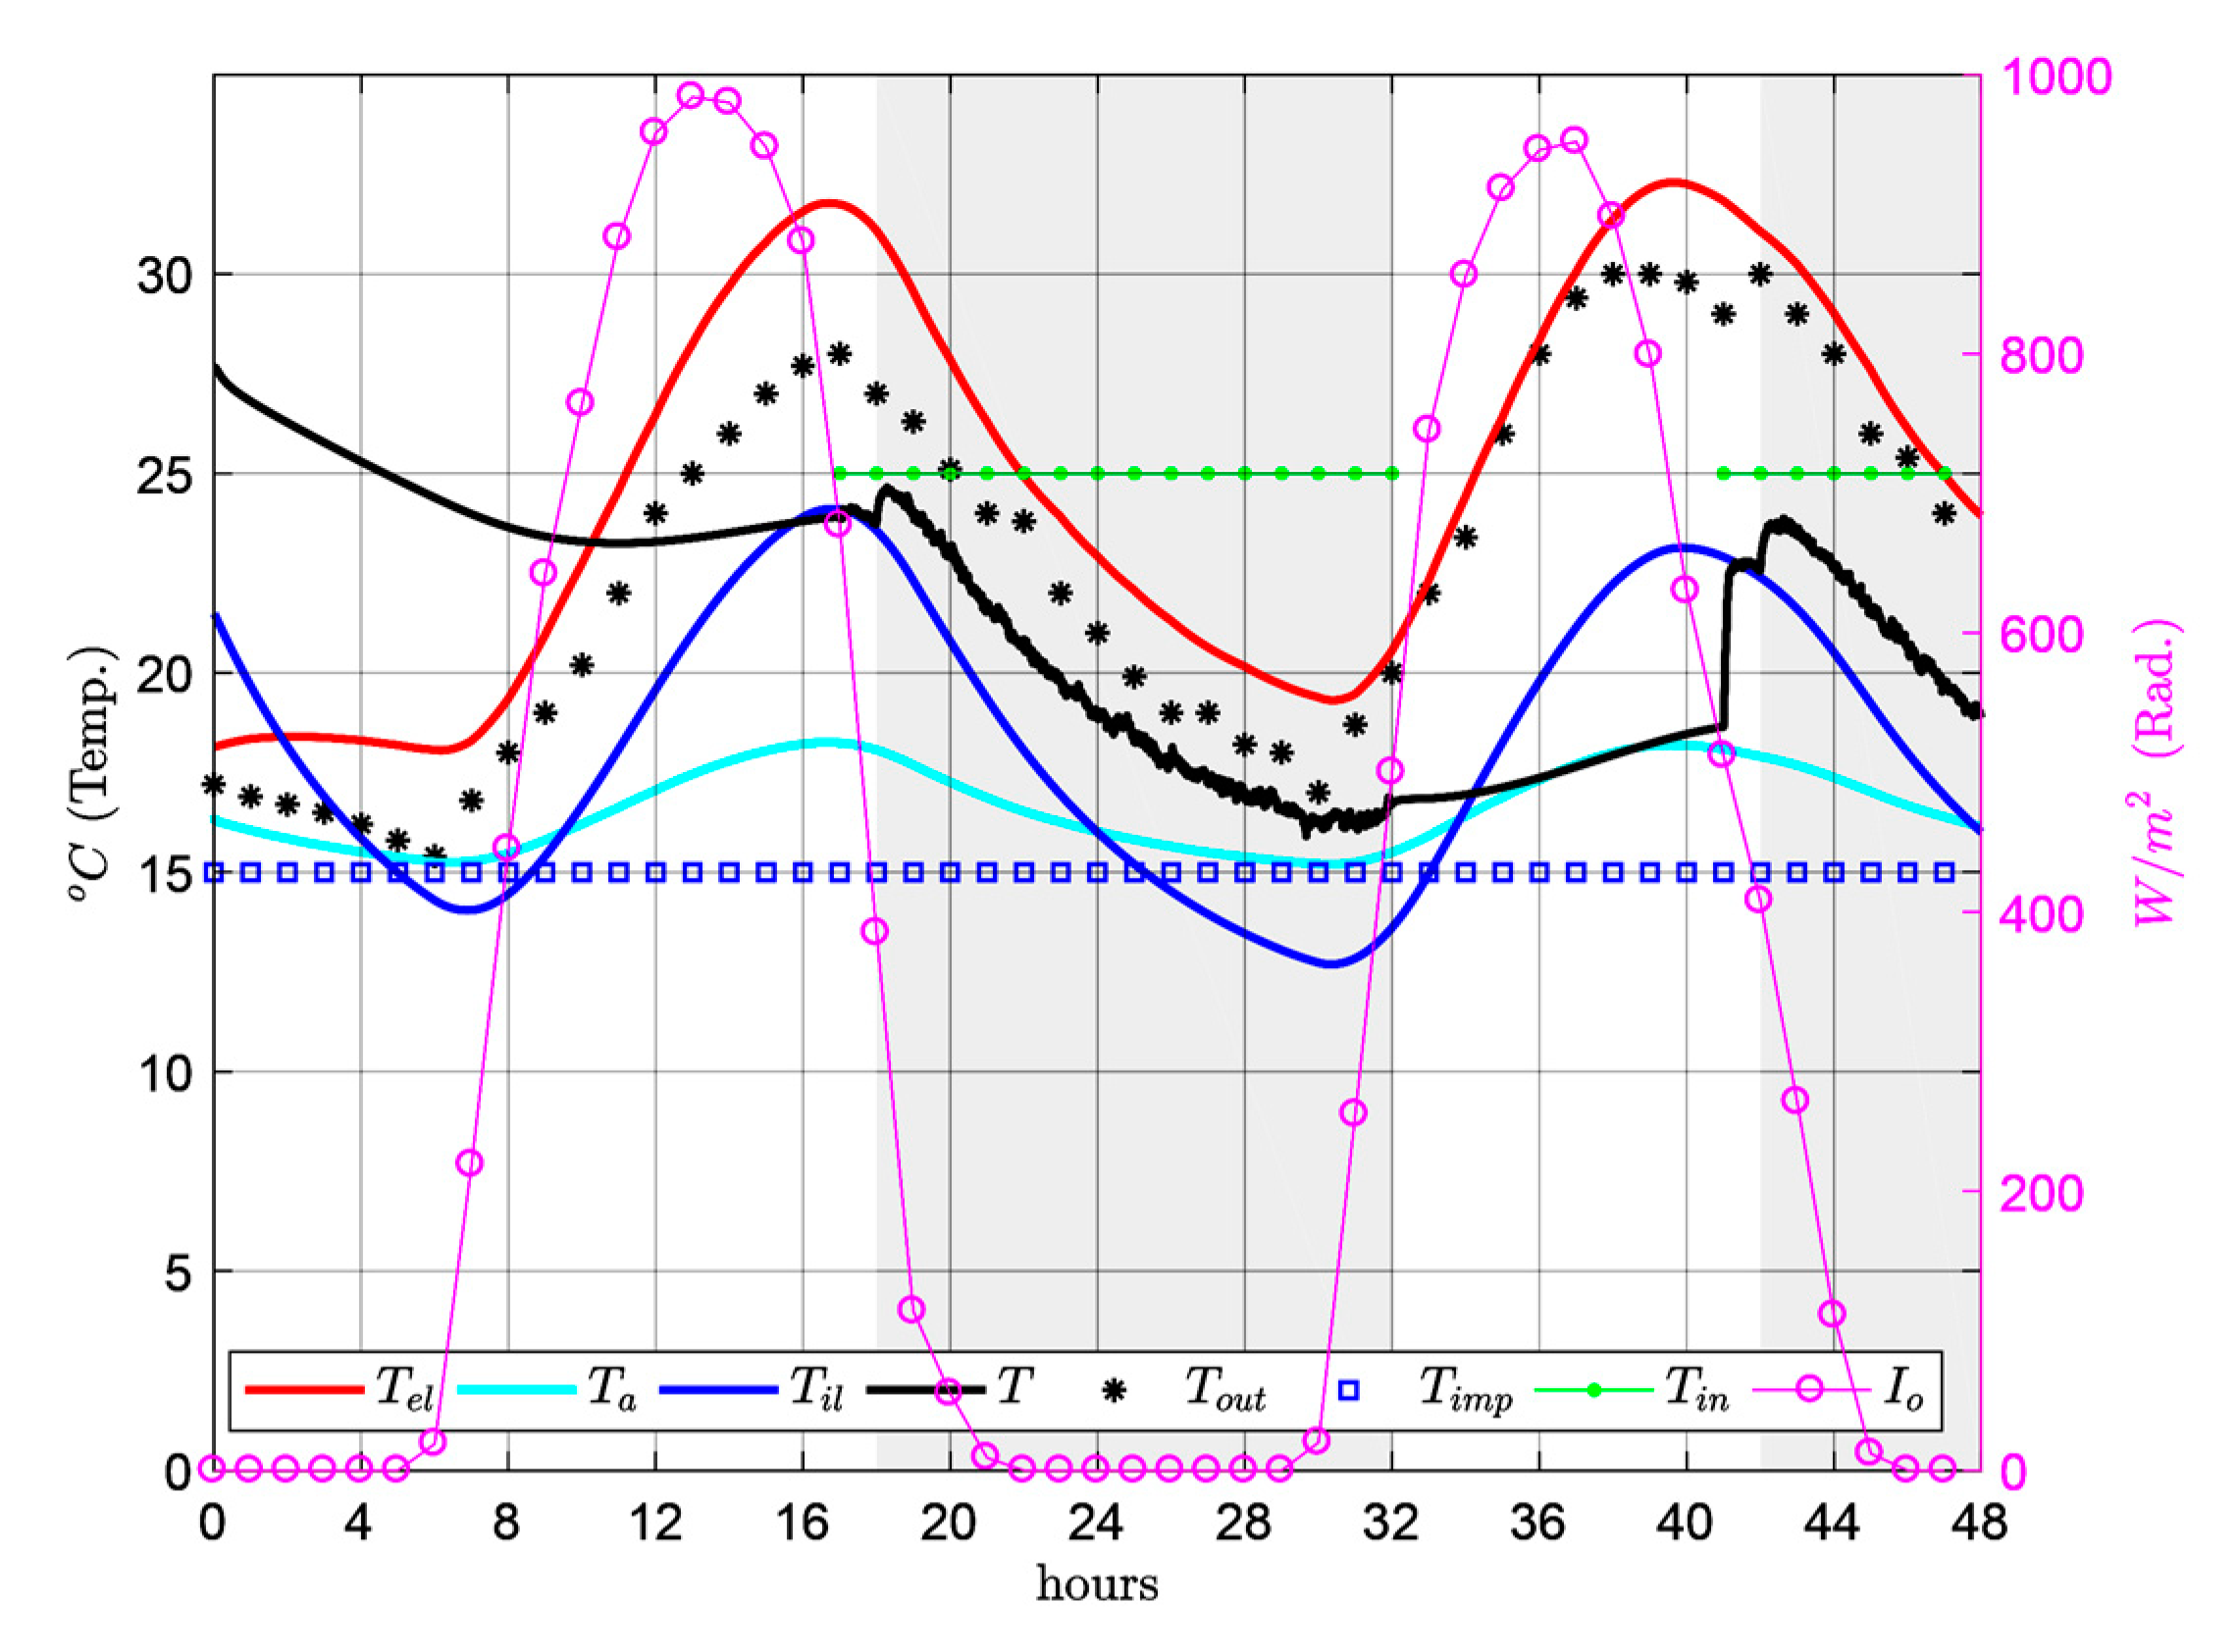
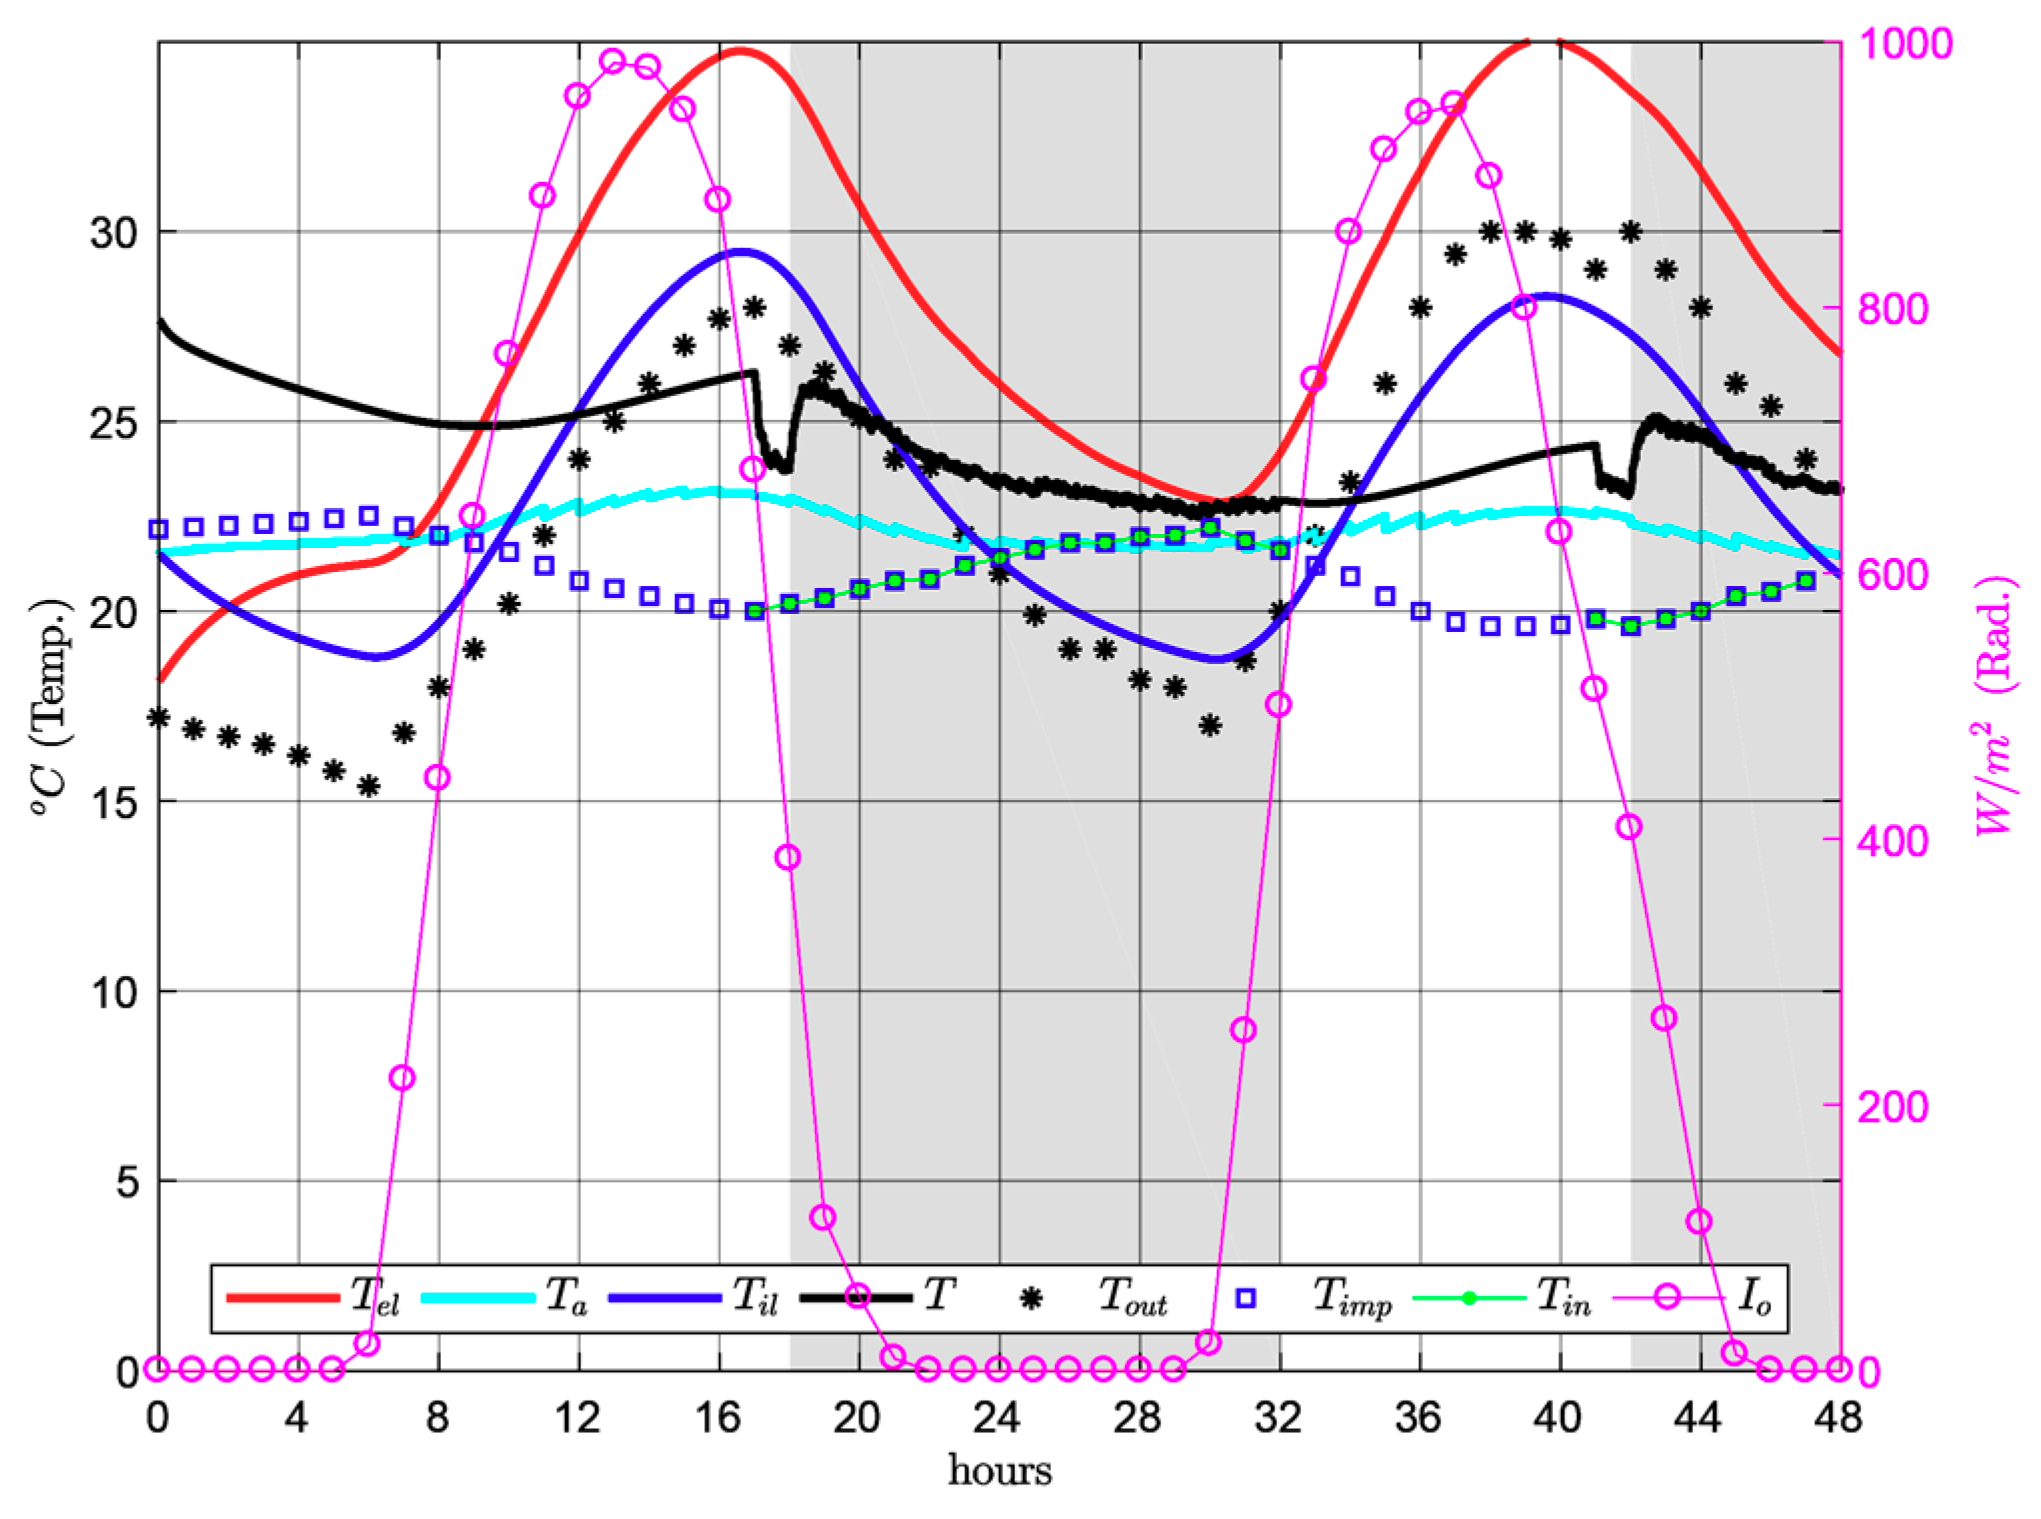
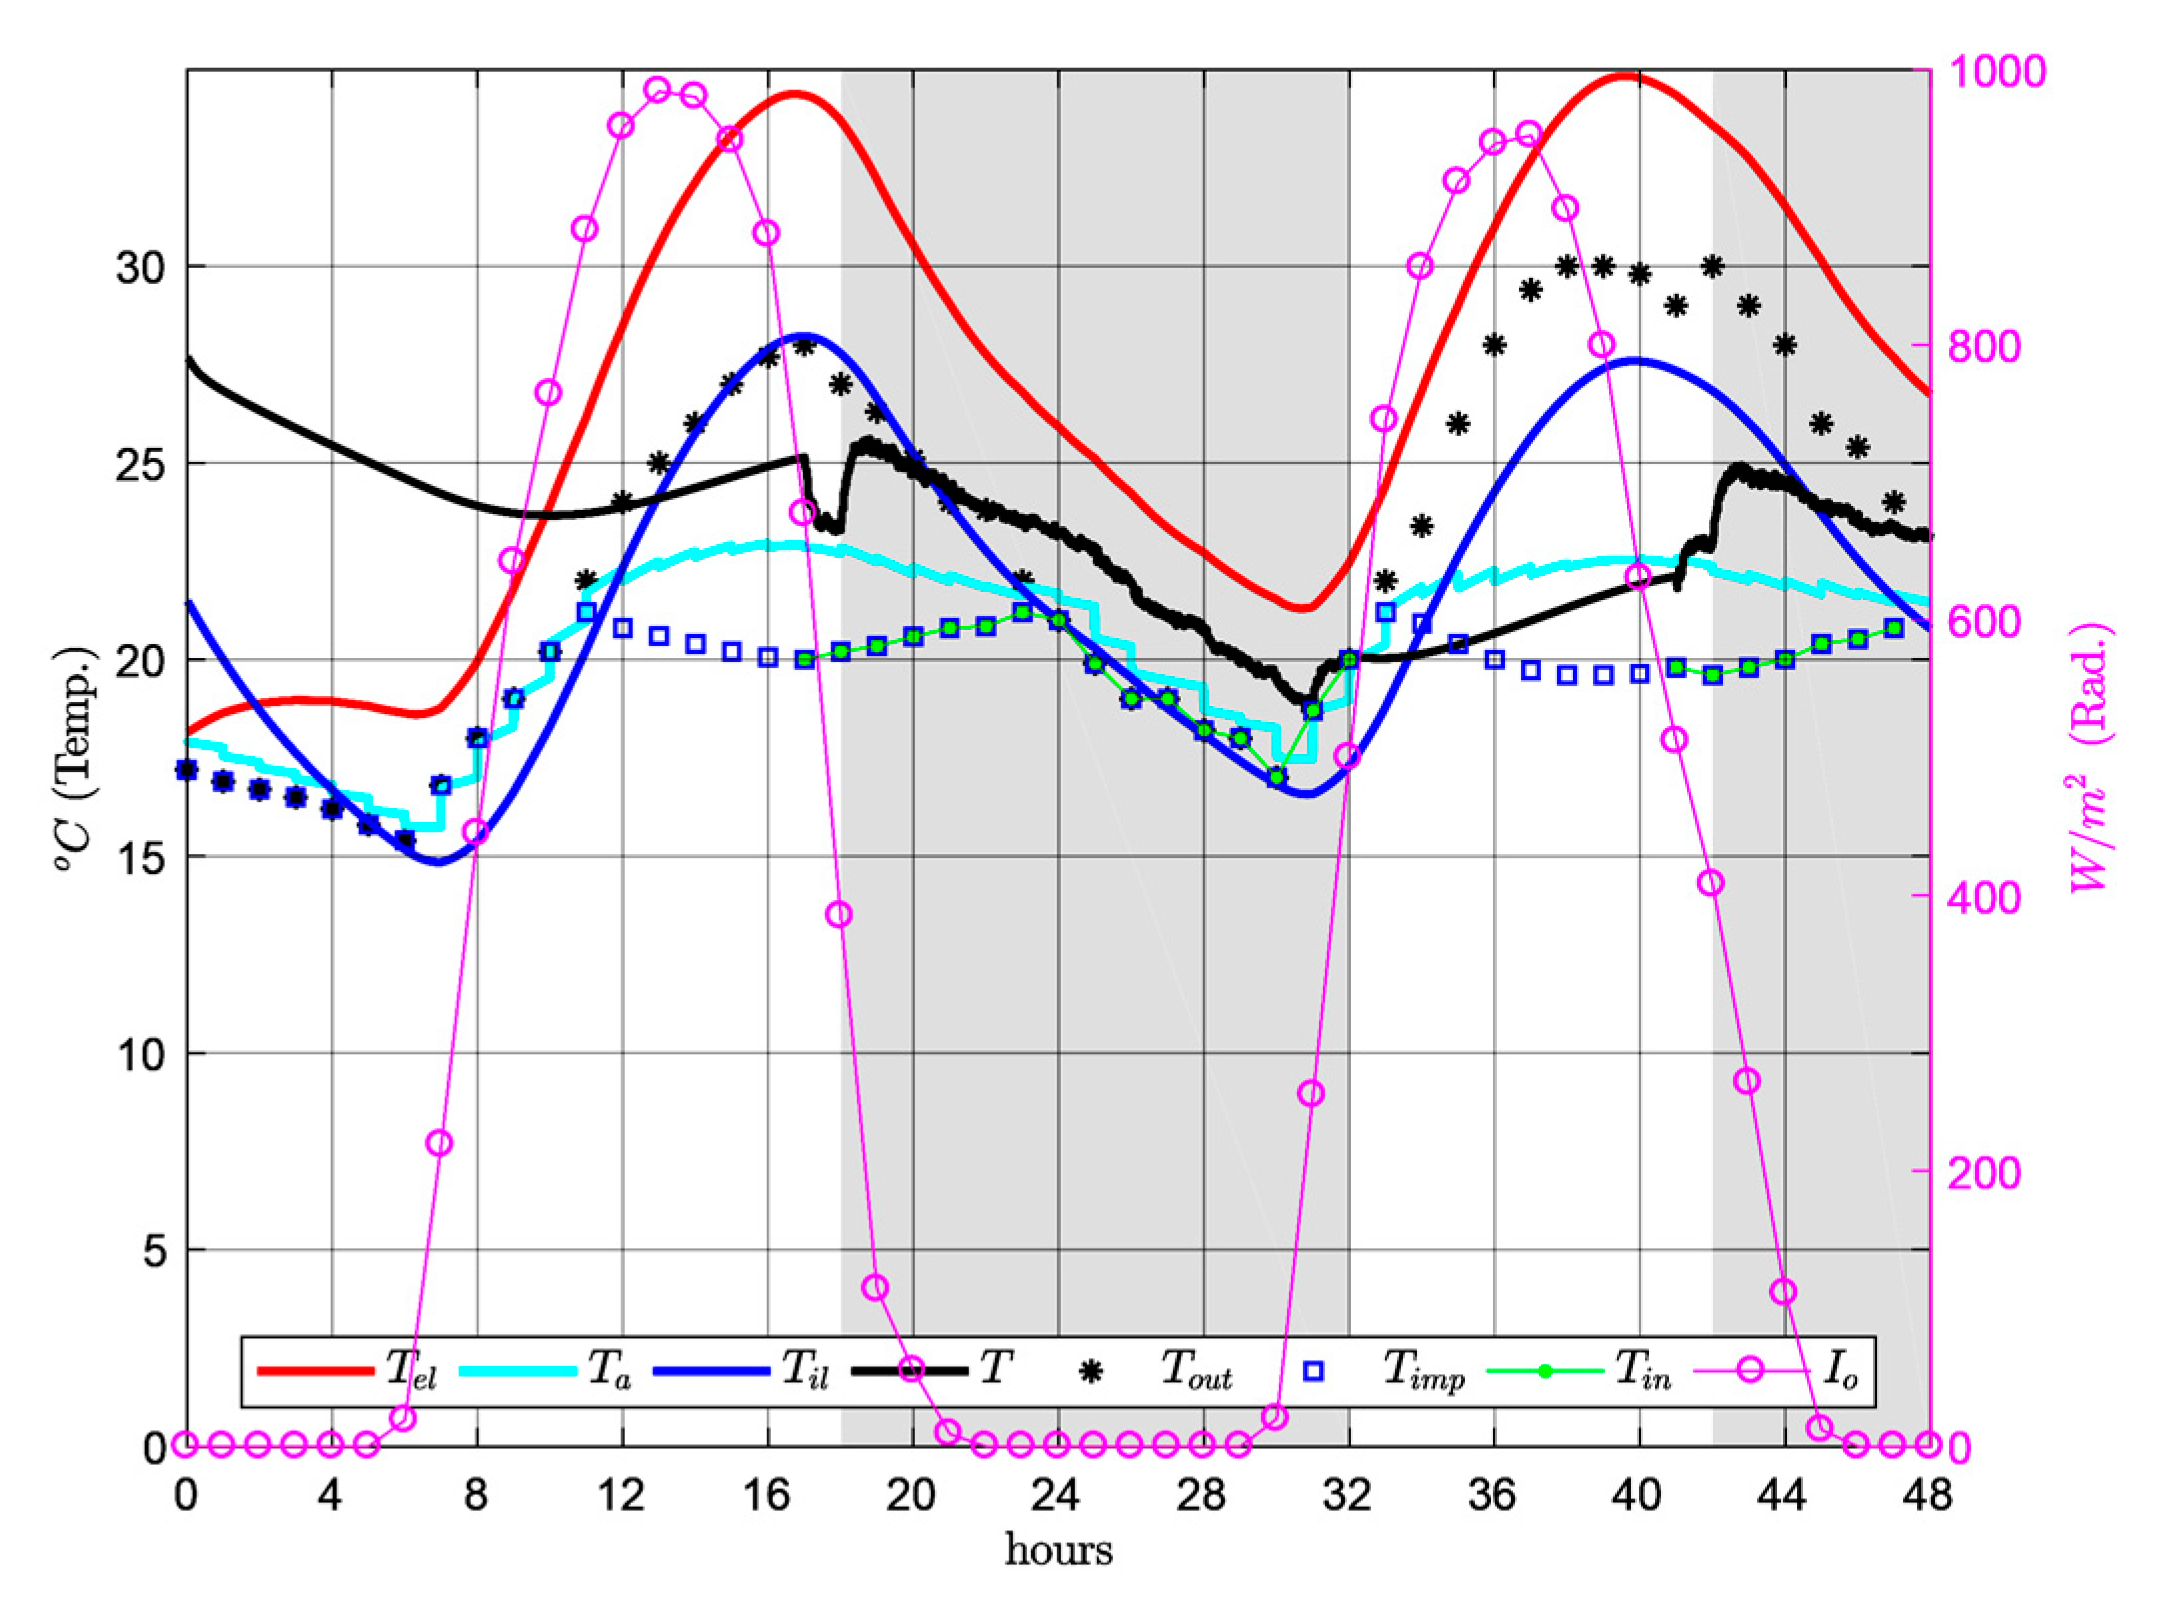
The results shown in Figure 5, Figure 6, Figure 7, Figure 8 and Figure 9 reflect the data involved in the problems: outdoor temperature , airflow temperature , inlet temperature , radiation and the different solutions, at a height of 1.5 m. It should be noted that two y-axes format has been used in graphics plotting the radiation due to the different scales (Figure 5 and Figure 7).
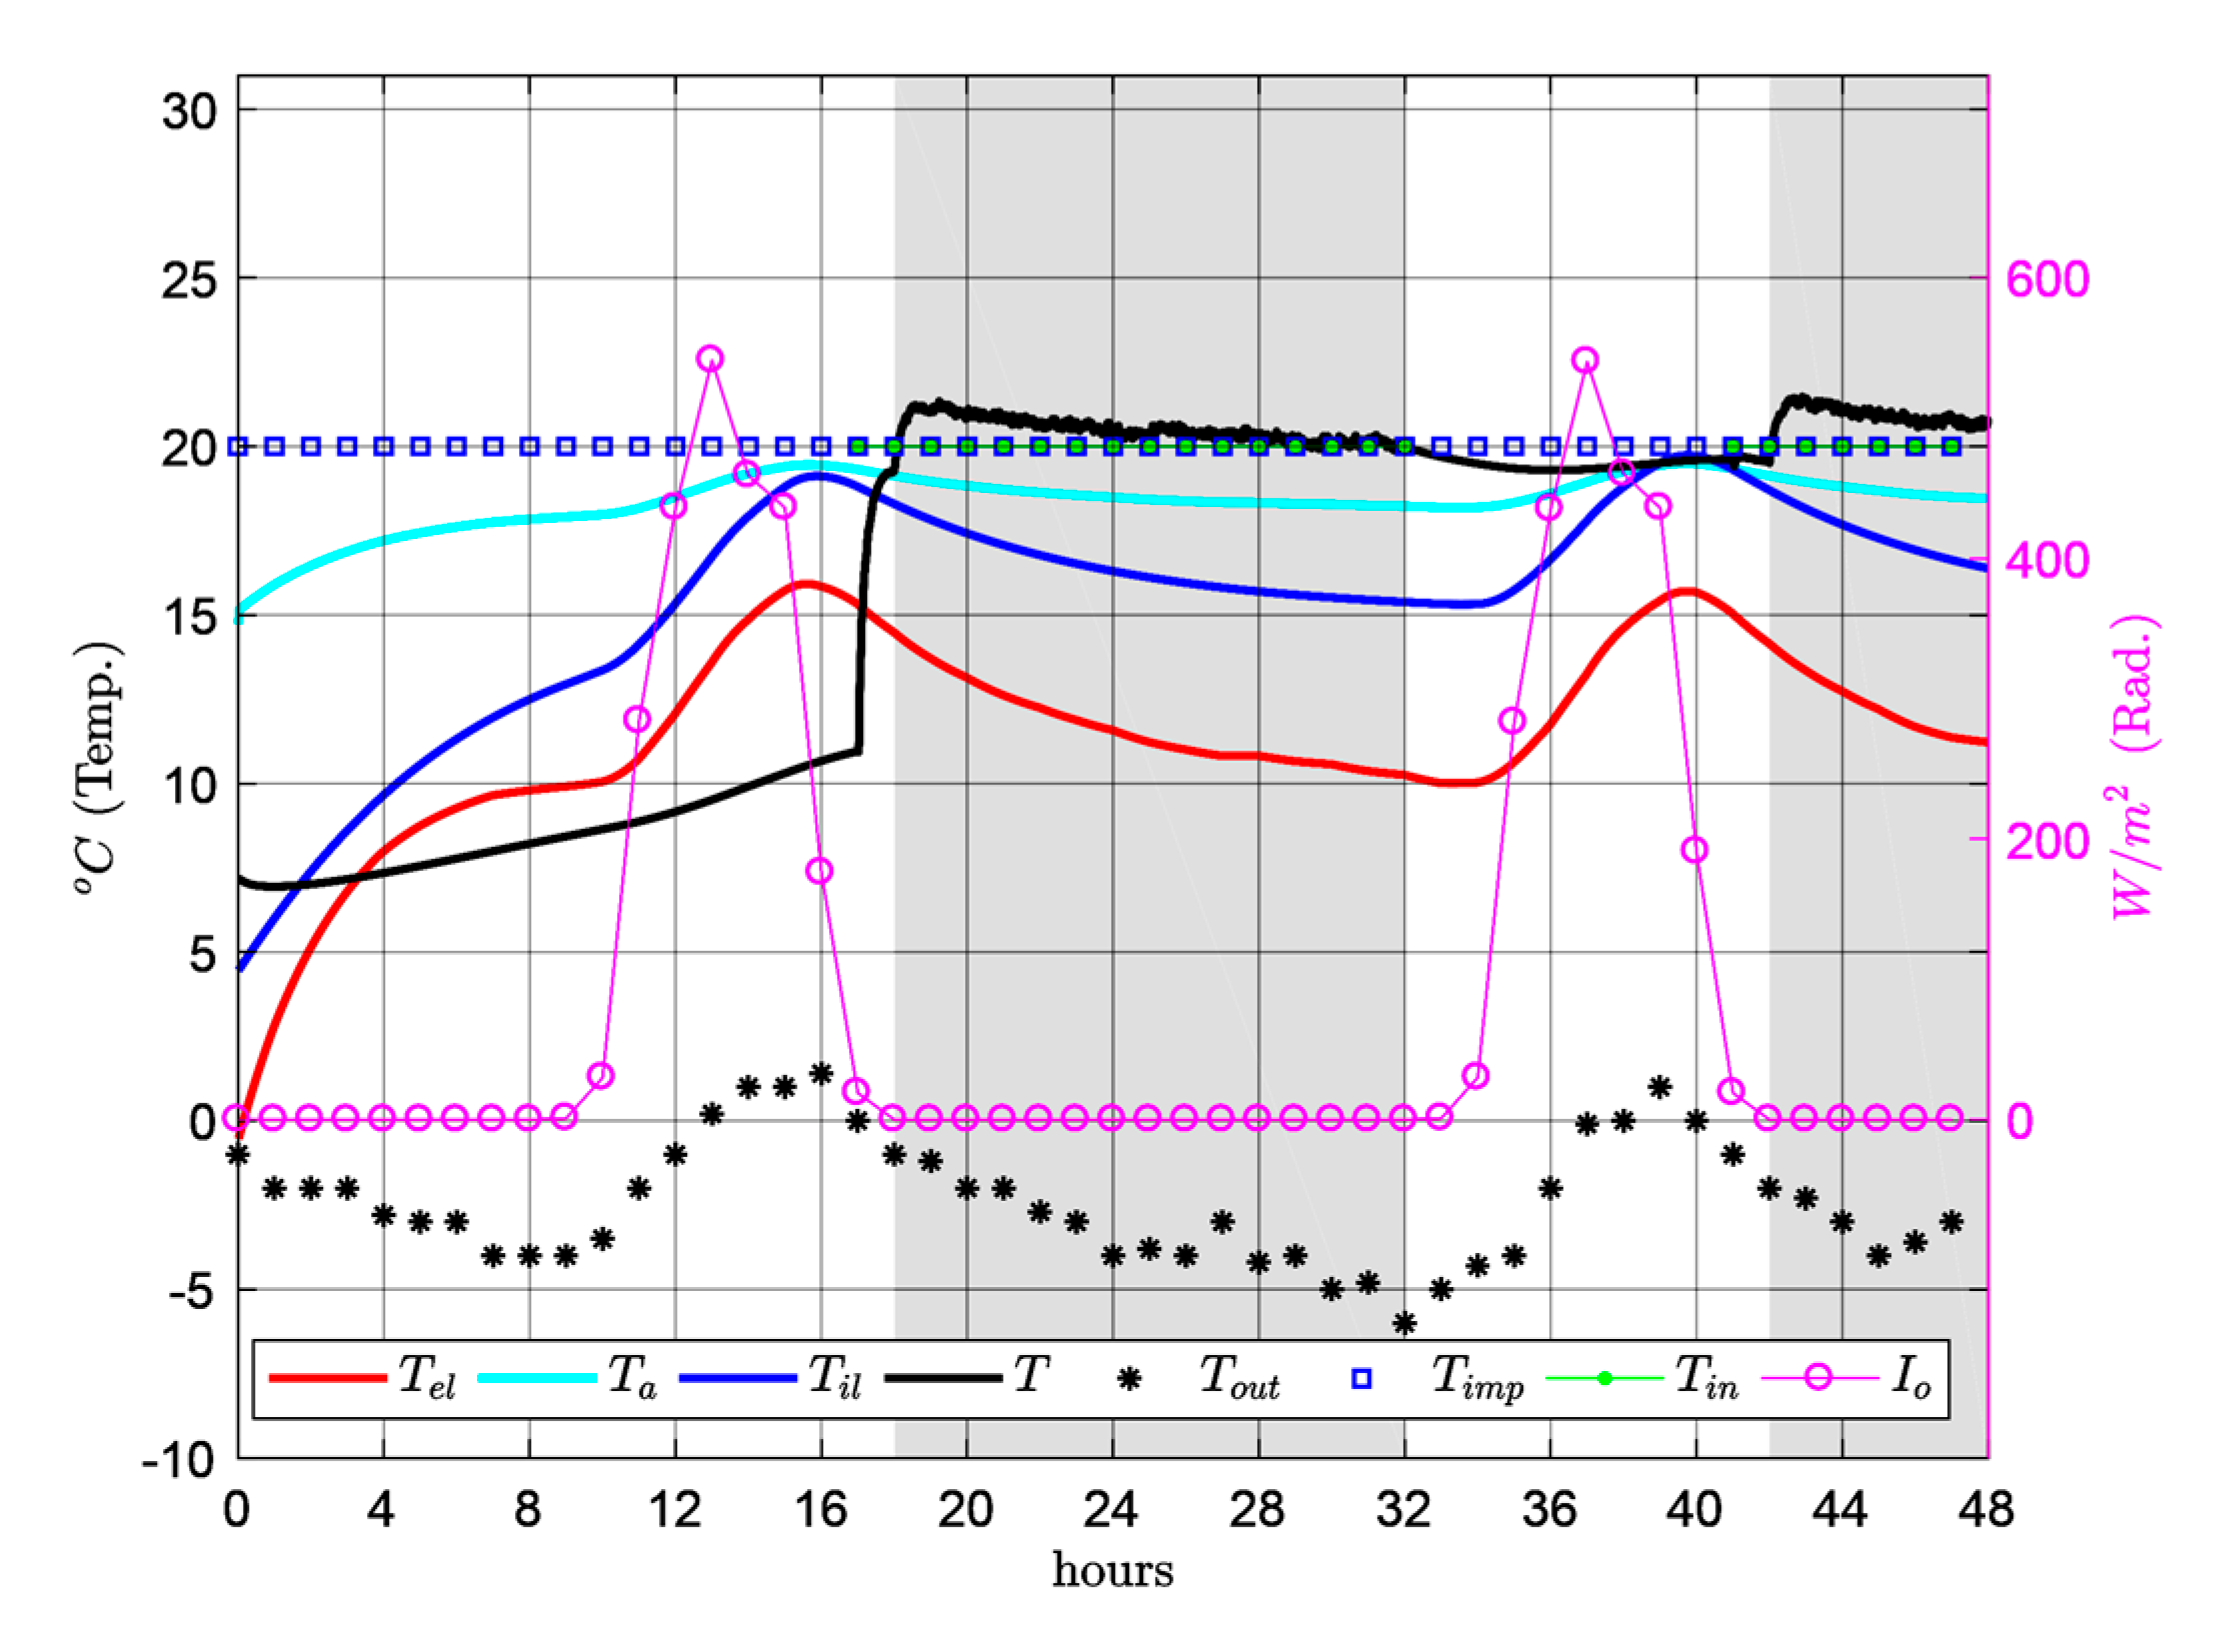
Figure 5 shows the winter temperatures. When the room is occupied (from 18:00 to 08:00 h), the mean indoor temperatures in the room tend to be rather uniform, between 26 °C and 28 °C. However, for the same time slot in summer (Figure 7) indoor temperature displays greater thermal oscillation, 16 °C–25 °C. This indoor temperature behaviour reflects the thermal oscillation of outdoor temperature , which is greater in summer (maximum 28 °C and minimum 15 °C) and more uniform in winter (maximum 1 °C and minimum −6 °C). However, the indoor temperatures obtained are outside the comfort range detailed in international organization for standardization (ISO) 7730 [35]: 20–24 °C in winter and 23–26 °C in summer, as well as being far from the values of the airflow temperature for respiration exacte considered by Le Corbusier: 20 °C in winter and 25 °C in summer.
In winter, with a constant airflow temperature of 30 °C in the air cavity of the mur neutralisant, the indoor temperature is higher than the comfort temperature, resulting in an increase in energy usage when the indoor temperature is higher than the comfort temperature, resulting in an energy increase when the air within the cavity is overheated. Equally, in summer with a constant airflow temperature in the cavity of 15 °C, indoor temperature is excessively low, also resulting in an unnecessary increase in energy usage, in this case due to excessive cooling of the air in the cavity. As Figure 5 and Figure 7 show, the temperature in the façade air cavity greatly influences thermal behaviour within the room.
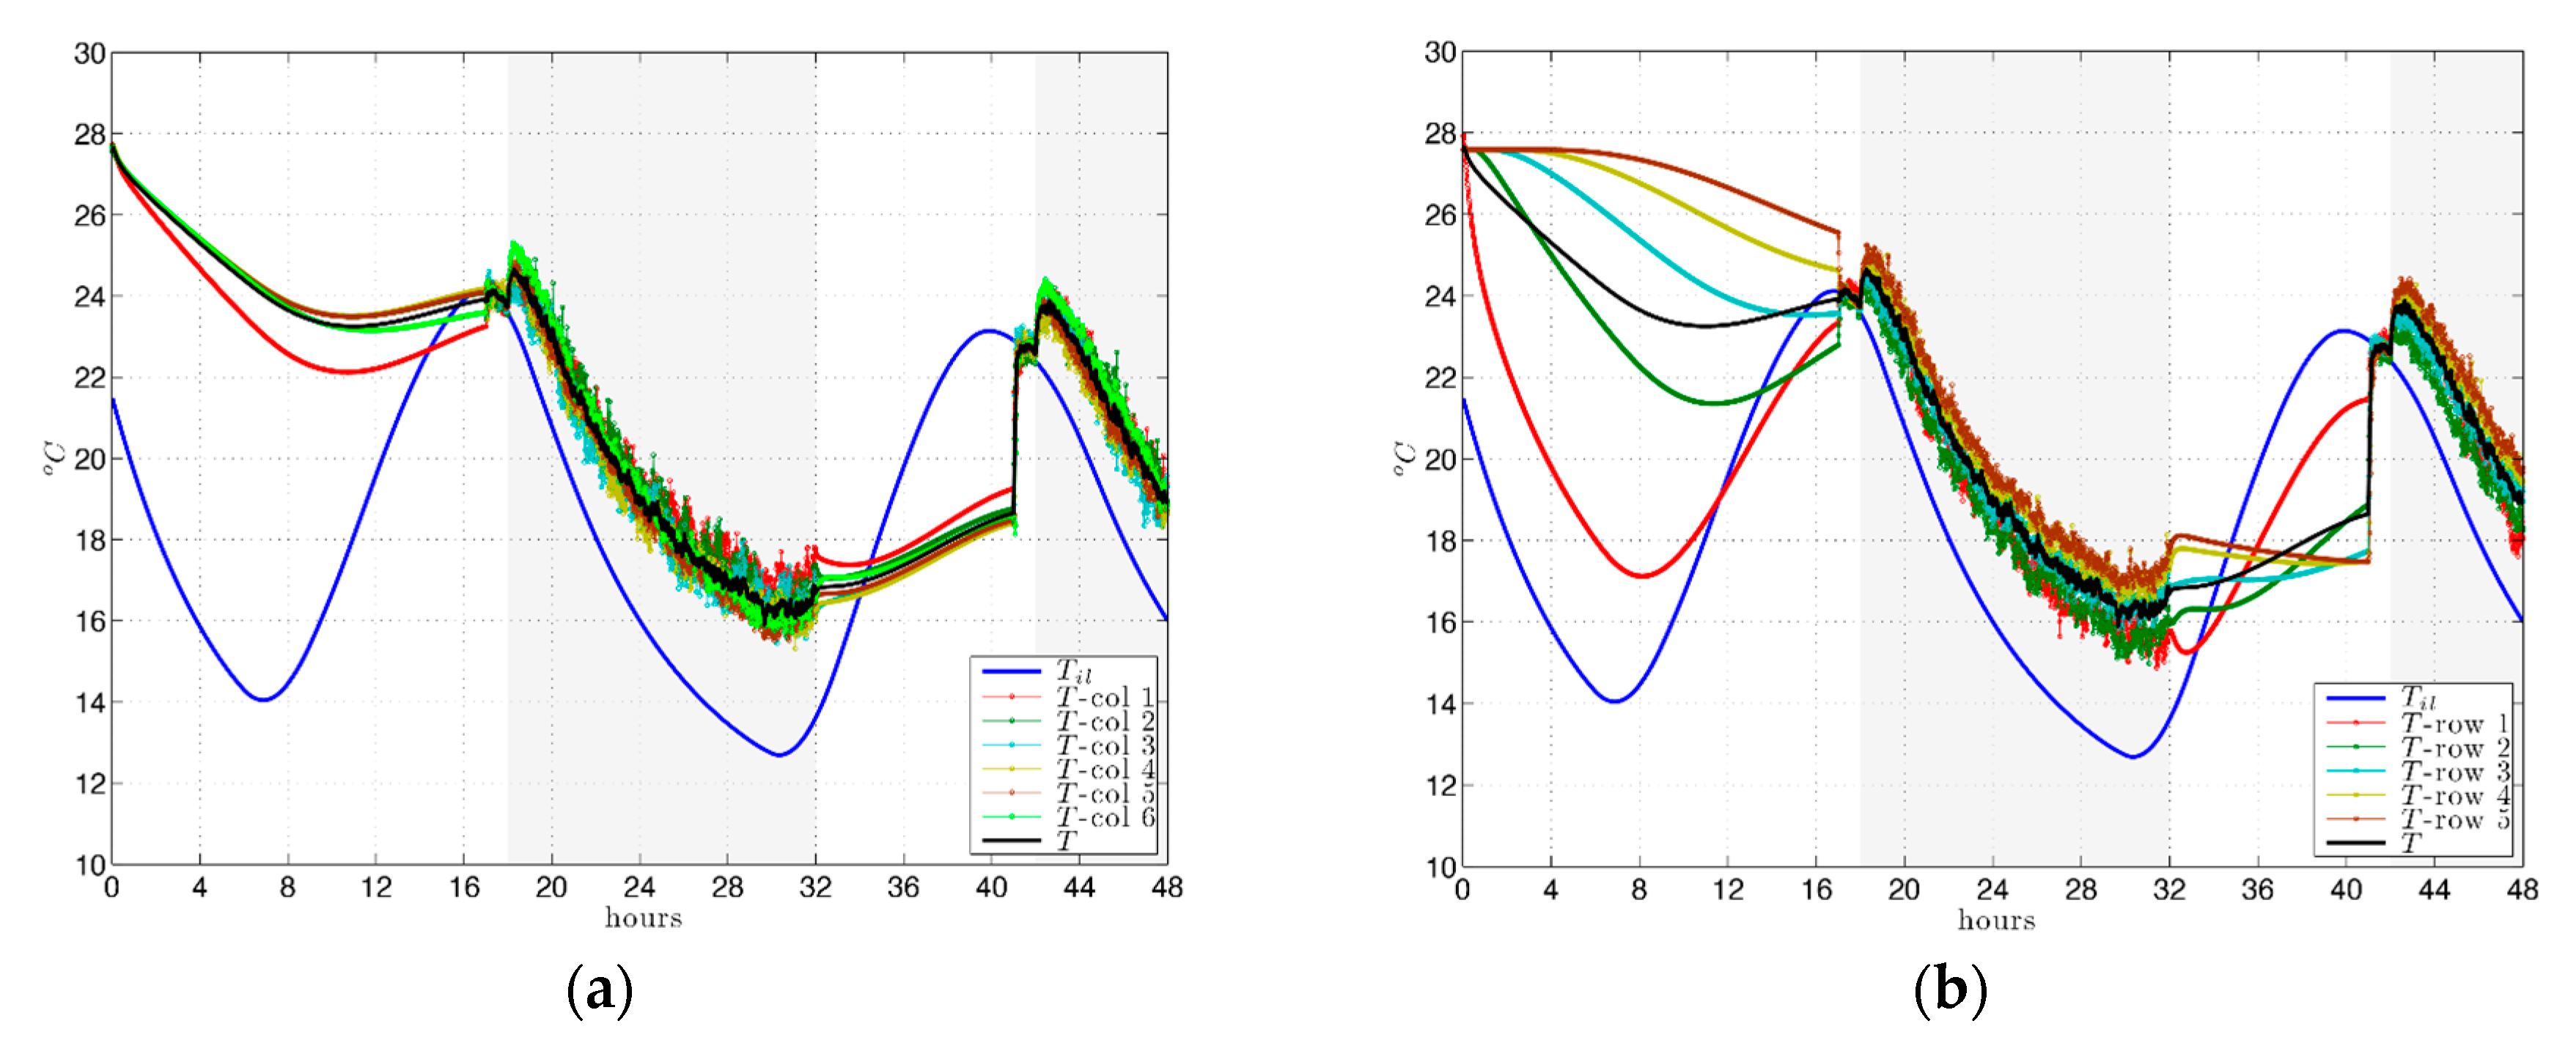
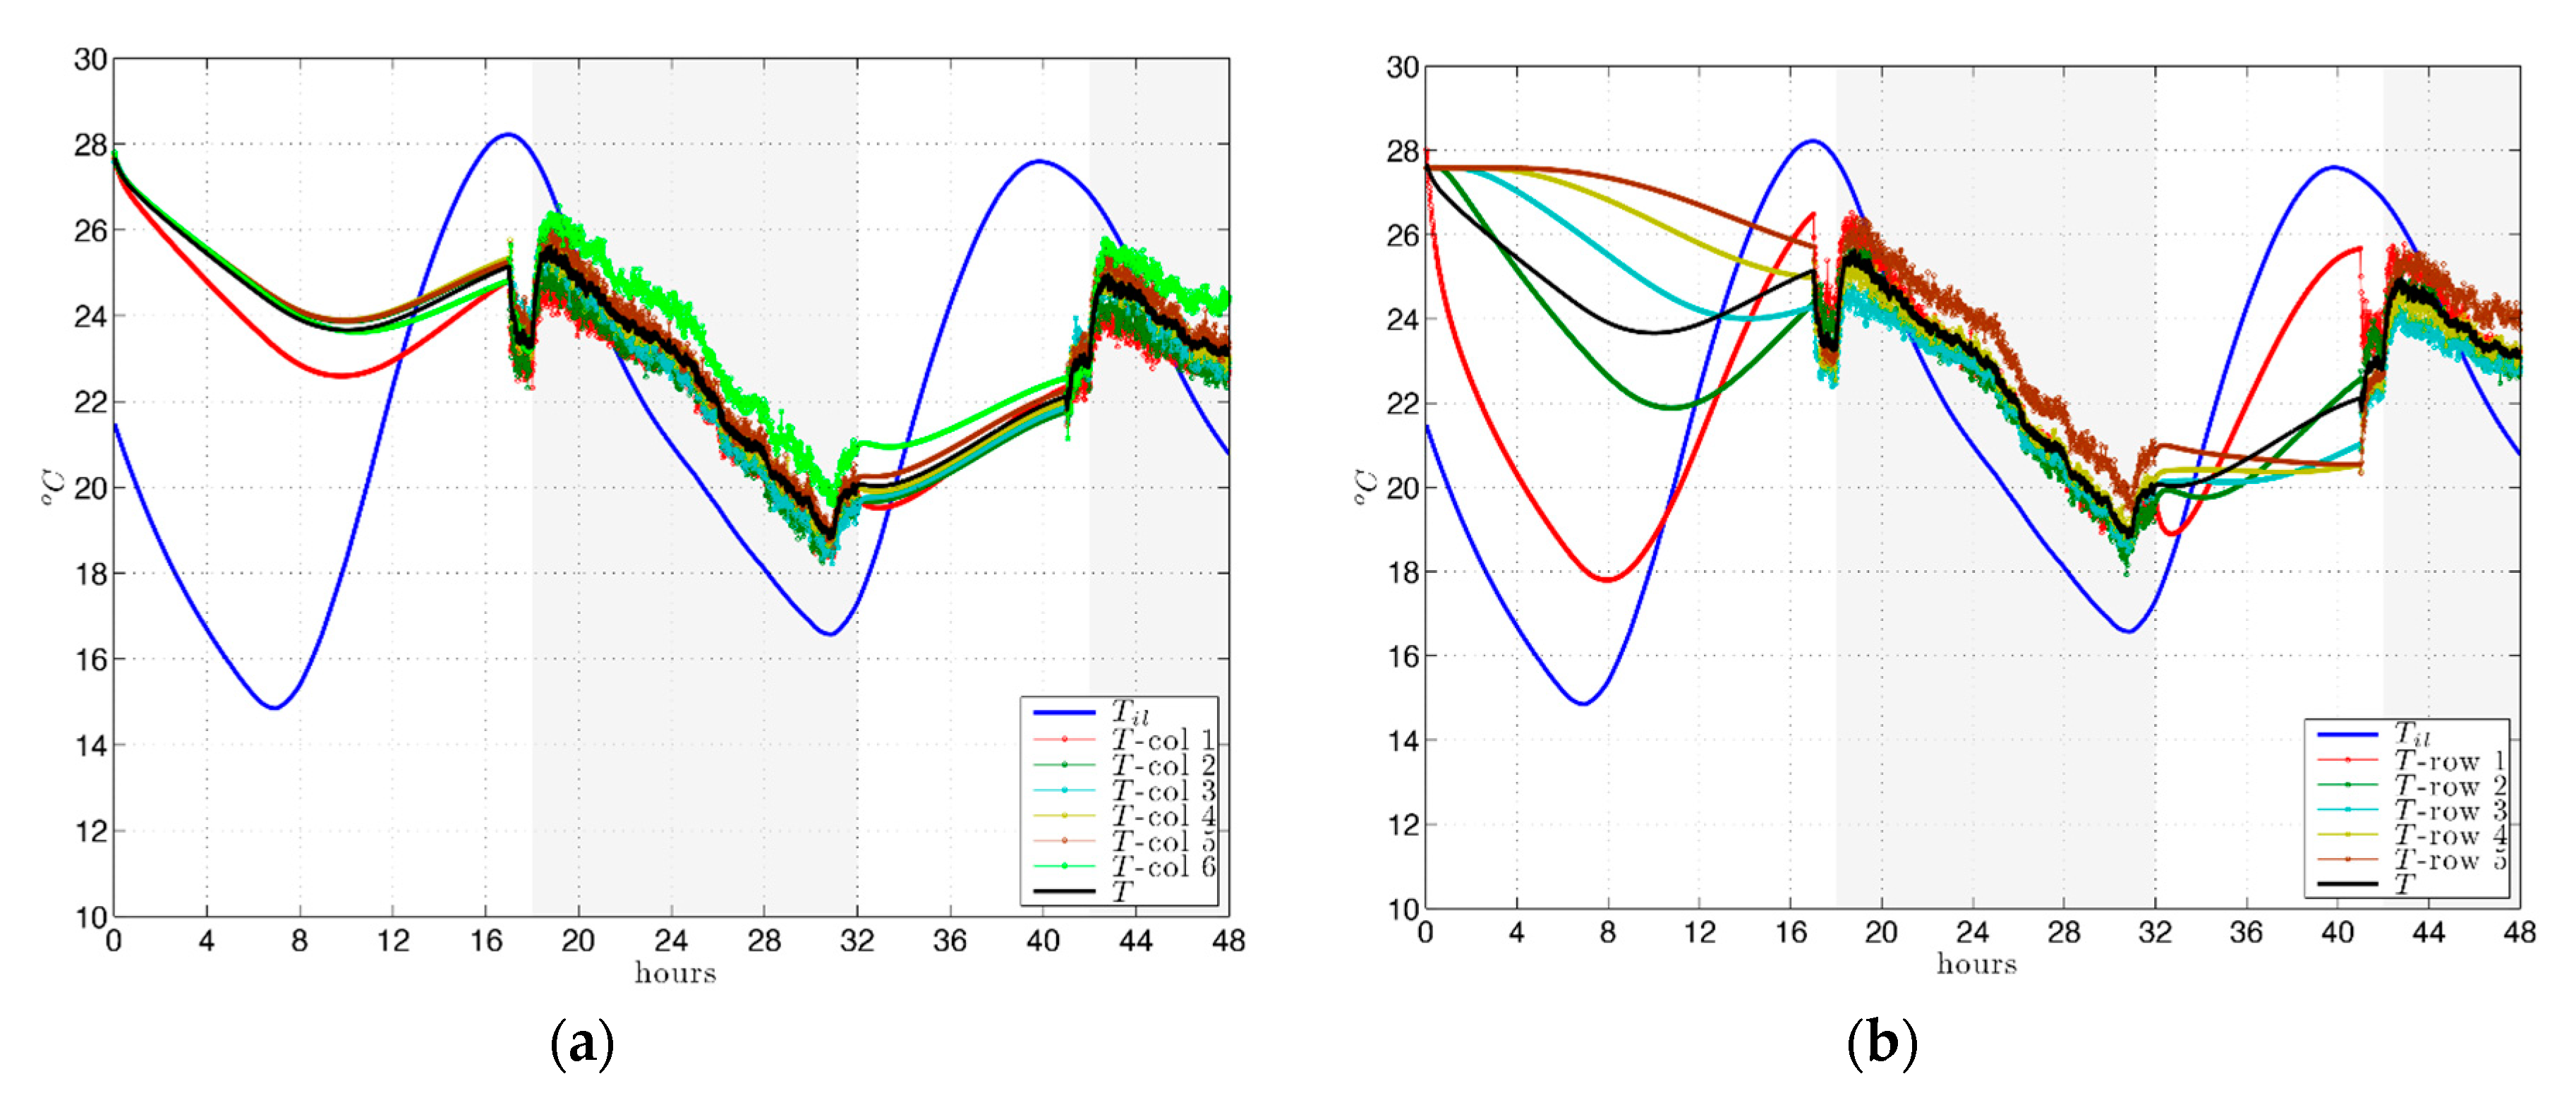
In terms of the results due to position in the room, defined by a point mesh with rows parallel to the mur neutralisant and columns perpendicular to it (Figure 4), in the hours in which the room is occupied in winter, the temperature results observed per row are very uniform, close to those of the mean temperature of the room (Figure 6b), while the scattering of temperature values is greater by columns (Figure 6a), especially due to the limited reach of airflow. However, in summer the scattering is similar for rows and columns (Figure 8a,b).
Although the combined effect proposed by Le Corbusier for the mur neutralisant and respiration exacte acts as a counterbalance for the influence of exterior conditions, comfort conditions and a suitable distribution of indoor temperatures could not be obtained efficiently.
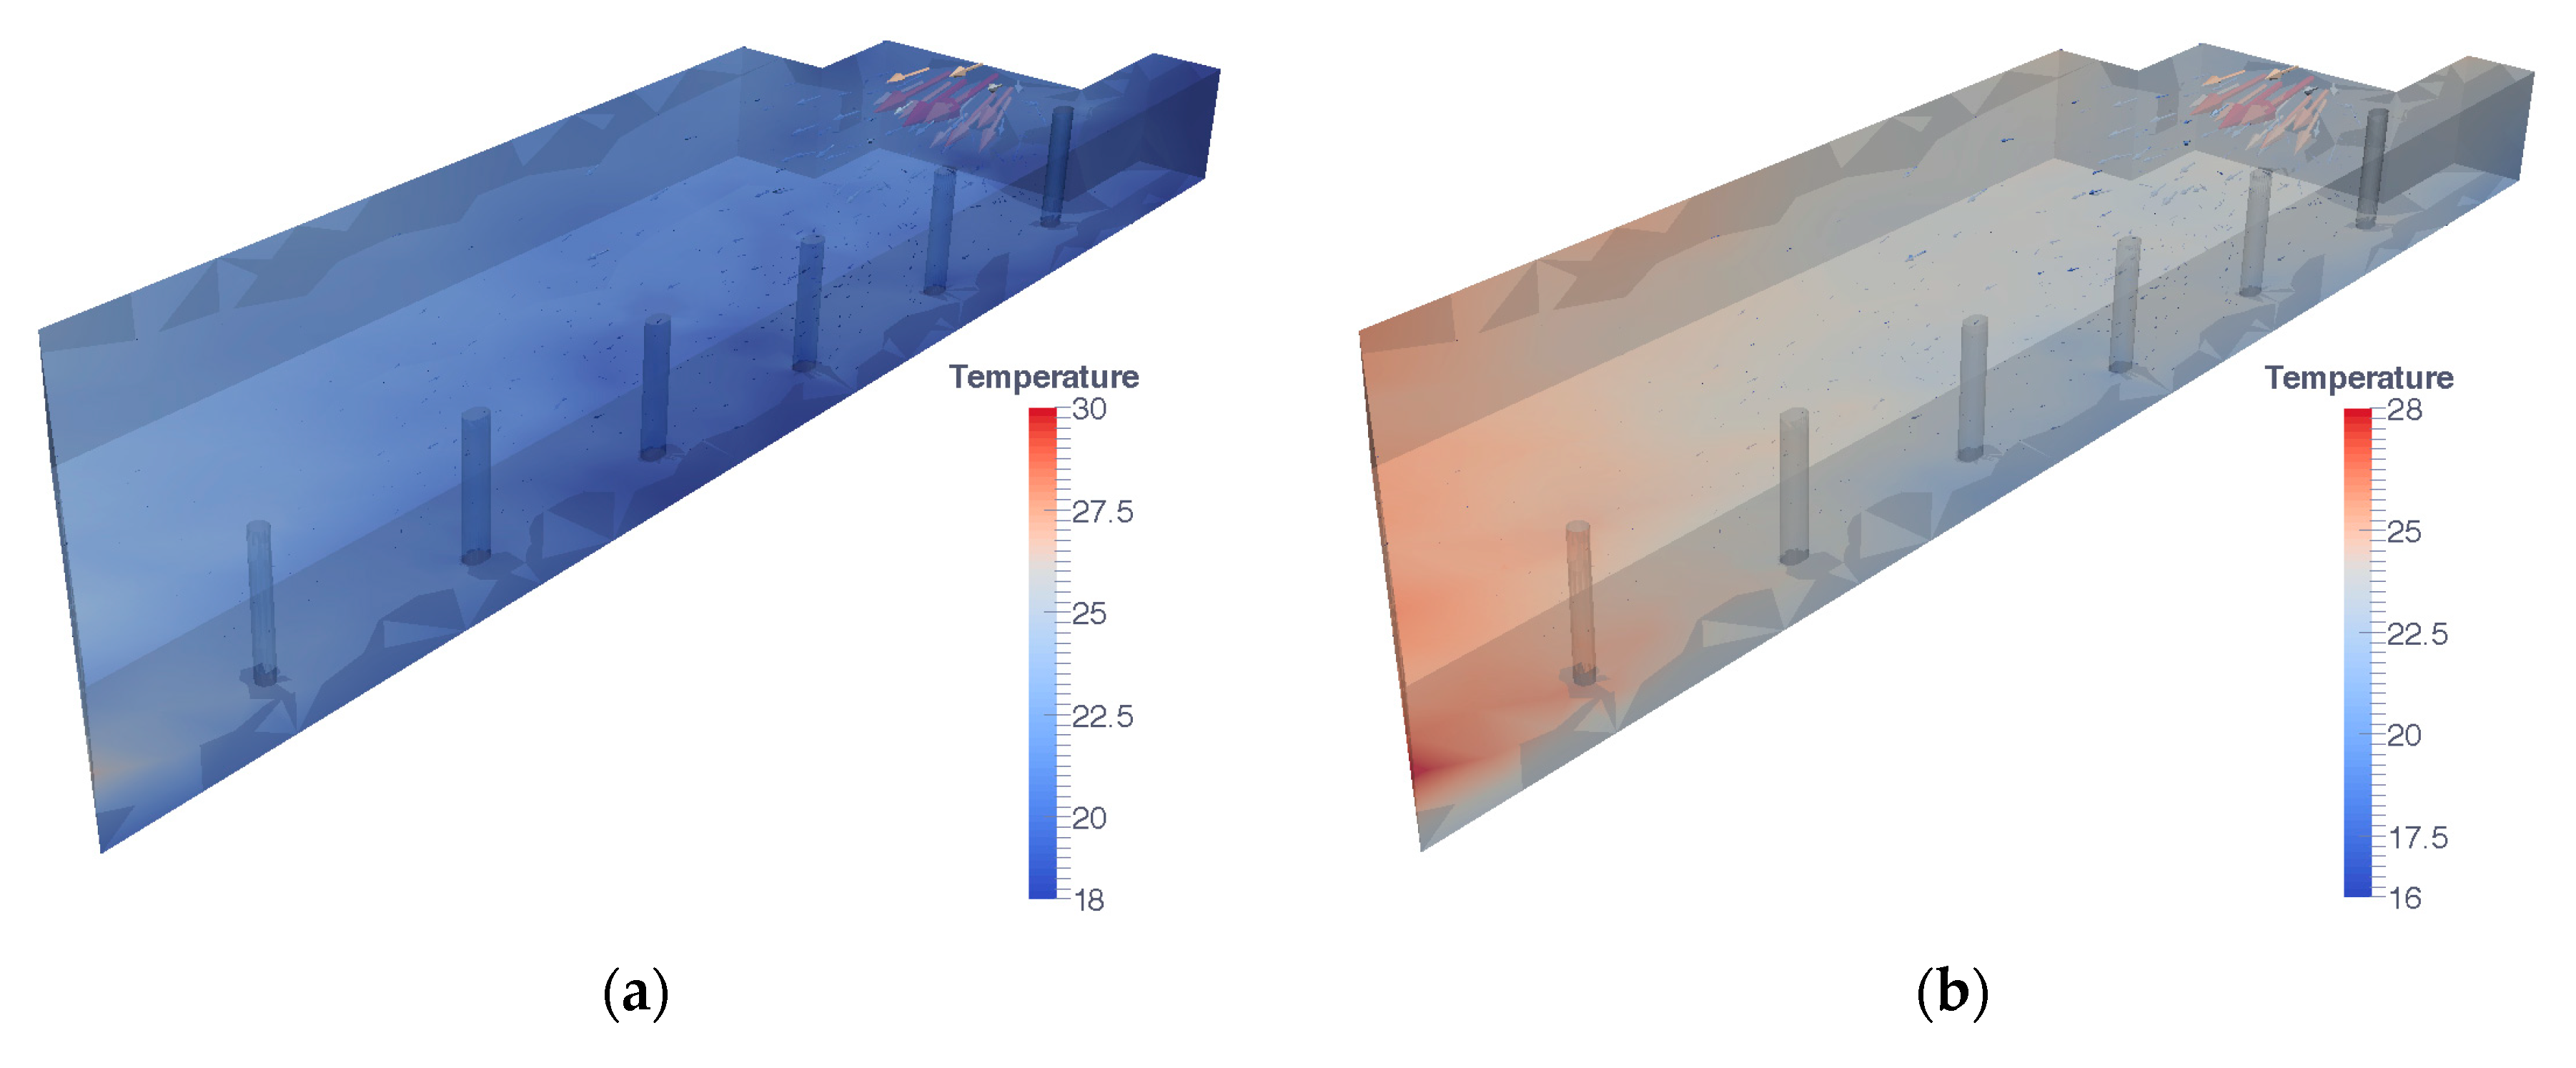
Examining the temperature distribution in 3D images for winter and summer (Figure 9) and the videos (original_ hyphotesis_winter.avi, Video S1: Simulation of Case 1: Le Corbusier hypothesis in winter, and original_hyphotesis_summer.avi, Video S2: Simulation of Case 1: Le Corbusier hypothesis in summer, on line) the following are observed:
- An incorrect airflow temperature into the cavity of the mur neutralisant, too high in winter and low in summer;
- A very limited reach of the airflow temperature of mechanical ventilation, due to insufficient flow both in winter (300 m3/h) and summer (1050 m3/h);
- The unsuitable position of the inlet grille for the mechanical ventilation system.
This, in combination with the shape of the room and column position, results in irregular temperature distribution in the room.
3.3.3. Case 2: An Efficient Energy Proposal
An appropriate configuration of the ATF-mechanical ventilation system is proposed in order to ensure indoor comfort temperature with an energy efficient thermal conditioning system. Several solutions were considered for this data: constant or variable inlet temperature, time in operation in relation to occupancy hours, different mass flows in the cavity and ventilation, different grille positions and sizes, etc. The proposal with the best results is presented below.
Some proposals are common to winter and summer cases:
- The use of the same thermal air flow treatment in the air cavity of the mur neutralisant and mechanical ventilation to ensure that the airflow temperature is the same in both cases.
- The mass flow in the cavity is the same as that proposed by Le Corbusier (Table 4).
- Modified position and size of ventilation grille in the room. As suggested by Liu et al. [36], a suitable air supply location and size improve the indoor environment. In case 1 its location in line with the pillars hinders the flow and the temperatures are not uniform along the room (see Figure 9). Moving the grille to the centre of the same wall and doubling its surface are proposed. In addition, airflow ventilation is modified to fit in a ventilation rate of 28.8 m3/h per person, common in this type of venue, leading to a frontal velocity of 3.25 m/s.
- The activation time of the ventilation system. Given that the aim of this is to ensure comfort in occupancy hours, mechanical ventilation is only activated one hour before occupancy, that is to say, from 17:00 to 20:00 p.m. each day.
All these hypotheses lead to a more uniform and compact system, which is only dependent on the appropriate airflow temperature for winter and summer. The specific airflow temperatures considered in winter and summer are examined below and summarised in Table 5 in order to improve the energy efficiency of the proposed system. In the summer case, the formula followed is that by Lyon considered in [30], which estimates the airflow temperature in terms of outdoor temperature and a reference temperature :
In [30], °C was used as in the original formula by Lyon, considered mostly for winter conditions. However, following different numerical simulations in the case analysed here, the decision was made to increase this reference temperature by 4 °C in order to better adjust the thermal solution:
In this particular case it was observed that in some hours the temperature resulting from this formula is higher than the outdoor temperature. Therefore, a second option was proposed in search of an efficient energy system, that of recording the outdoor temperature for these hours. The airflow temperature is thus defined as the minimum of and in each instance, as a free cooling system.
Initially, the Lyon formula was also considered for defining the airflow temperature in winter. However, on occasion, the result obtained was °C, involving a supplementary energy expense which was not necessary for achieving good indoor climate conditions. Subsequently, a constant airflow temperature of °C was chosen.
The results are shown in Figure 10, Figure 11, Figure 12, Figure 13, Figure 14, Figure 15 and Figure 16, in the same format as in case 1. The vertical range scale in figures was also maintained for ease of comparison.
Firstly, when observing the results for mean temperature in the room in winter (Figure 10), it is seen that in the hours of occupancy of the room the mean temperature remains relatively uniform, close to the comfort temperature: 20 °C–21 °C. The results dependent on the position of the probes (Figure 11) show little scatter, about ± 1 °C.
When comparing the results for the mean temperatures for the room for both summer proposals, with and without free cooling (Figure 12 and Figure 14) and for the same hours, it is observed that considering only the airflow temperature based on the modified formula from Lyon, the indoor temperature is more uniform, with values of around 23 °C–26 °C, and therefore within the comfort range. However, Figure 12 shows that there is a large number of hours, from 0:00 to 8:00 a.m., in which the outdoor temperature is lower than the airflow according to Lyon’s formula. Consequently, if air is supplied in exterior conditions in these last 8 hours of the occupancy of the room, both in the mur neutralisant and respiration exacte, demand is reduced, albeit with greater thermal oscillation in the room due to the great reduction in outdoor temperature at night, resulting in a mean indoor temperature below 20 °C from 4 a.m. to 8 a.m. approximately. As in the winter case, the interior temperature distribution is more uniform, as can be seen in the results by rows and columns (Figure 13 without free cooling and Figure 15 with free cooling).
In short, the modifications proposed as alternatives to Le Corbusier’s own proposals constitute a substantial improvement, both in average indoor temperatures and in the temperature distribution within the room. However, given the large room size a slight variation is maintained depending on depth, as observed at the end of the room, on the opposite wall to the grille, in 3D images (Figure 15) and Supplementary Materials (efficient_energy_proposal_winter.avi, Video S3: Simulation of Case 2: Efficient energy proposal in winter, and efficient_energy_proposal_summer.avi, Video S4: Simulation of Case 2: Efficient energy proposal in summer, on line).
4. Conclusions
The use of ATFs as building thermal envelopes needs to be complemented with mechanical ventilation systems in order to guarantee comfort and hygiene conditions within the buildings during hours of occupancy.
A 3D mathematical model was generated to simulate the behaviour of an ATF when combined with a mechanical ventilation system and the thermal effects these produce indoors. The proposed model uses FreeFEM3D for CFD-based thermal simulation. The model is for general application and allows the design parameters to be adapted for these two systems which can be combined depending on climate conditions, while taking into consideration the internal occupancy load.
This model was applied to the City of Refuge by Le Corbusier to assess indoor thermal conditions reached in the dormitory (occupied by 67 people from 18:00 pm to 08:00 am), assuming the façade had been executed following the design of Le Corbusier with an ATF (mur neutralisant), combined with a mechanical ventilation system (respiration exacte). This application confirms the validity of Le Corbusier’s proposal, concluding that the combined effect of these two thermal systems counters the influence of outdoor conditions indoors. However, given that in his proposal the airflow temperatures are constant in the cavity of the mur neutralisant, 30 °C in winter and 15 °C in summer, and with respiration exacte, 20 °C in winter and 25 °C in summer, indoor temperatures are too high for indoor comfort conditions, thus increasing energy consumption.
The 3D mathematical model proposed allows the improvement of the solution put forward by Le Corbusier to obtain comfort conditions, increasing the energy efficiency of both systems combined in summer and in winter, mainly through the control of the airflow temperature into the air cavity of the ATF and the airflow supply into the room from the mechanical ventilation system.
Given the Parisian climate it is observed that on winter days with low outdoor temperatures, heating the airflow in order to supply it at a constant temperature of only 20 °C, both into the active cavity and into the room through the mechanical ventilation system, thermal comfort conditions are obtained in the case study room, with very stable mean temperatures: around 20 °C, at 1.5 m height, when occupied (afternoon and night).
Equally, on the hotter summer days indoor thermal comfort is also obtained, by slightly cooling the airflow to supply it, both into the cavity and the room, at a temperature 4 °C higher than that proposed by Lyon, around 20 °C, providing this value does not exceed outdoor temperature (free cooling conditions). The indoor thermal comfort obtained, with mean temperatures that are less stable than in winter, is around 19 °C–26 °C, at a height of 1.5 m, when occupied.
These conclusions can be applied to buildings with similar geometries, updating room dimensions, outdoor climate conditions, airflow temperature and speed. The process of applying the code to other geometries is a simple one as it simply requires a new computational mesh. The spacial variation of solar radiation is a code function which can be applied broadly. This variation of solar radiation in space and time can be taken into account in more precise simulations by coupling the CFD Freefem code with a 2D version of the ATF model presented in this paper.
Supplementary Materials
The following are original_hyphotesis_winter.avi, Video S1: Simulation of Case 1: Le Corbusier hypothesis in winter. original_hyphotesis_summer.avi, Video S2: Simulation of Case 1: Le Corbusier hypothesis in summer. efficient_energy_proposal_winter.avi, Video S3: Simulation of Case 2: Efficient energy proposal in winter. efficient_energy_proposal_summer.avi, Video S4: Simulation of Case 2: Efficient energy proposal in summer.
Author Contributions
C.R.-B., J.J.S. and R.S. conceived and designed the experiments; C.R.-B., E.F.-N. and G.N.-R. developed the software; all authors analysed the data; all authors have written, reviewed and approved the final manuscript.
Funding
This research was partially supported by the Spanish Government and FEDER grant number [MTM2015-70490-C2-2-R].
Conflicts of Interest
The authors declare no conflict of interest. The funders had no role in the design of the study; in the collection, analyses, or interpretation of data; in the writing of the manuscript, and in the decision to publish the results.
References
- Gratia, E.; de Herde, A. Optimal operation of a south double-skin façade. Energy Build. 2004, 36, 41–60. [Google Scholar] [CrossRef]
- Hien, W.N.; Liping, W.; Chandra, A.N.; Pandey, A.R.; Xiaolin, W. Effects of double glazed facade on energy consumption, thermal comfort and condensation for a typical office building in Singapore. Energy Build. 2005, 37, 563–572. [Google Scholar] [CrossRef]
- Gratia, E.; De Herde, A. The most efficient position of shading devices in a double-skin façade. Energy Build. 2007, 39, 364–373. [Google Scholar] [CrossRef]
- Barbosa, S.; Ip, K. Perspectives of double-skin façades for naturally ventilated buildings: A review. Renew. Sustain. Energy Rev. 2014, 40, 1019–1029. [Google Scholar] [CrossRef]
- Hazem, A.; Ameghchouche, M.; Bougriou, C. A numerical analysis of the air ventilation management and assessment of the behavior of double skin facades. Energy Build. 2015, 102, 225–236. [Google Scholar] [CrossRef]
- Flores Larsen, S.; Rengifo, L.; Filippín, C. Double skin glazed façades in sunny Mediterranean climates. Energy Build. 2015, 102, 18–31. [Google Scholar] [CrossRef]
- Gelesz, A.; Reith, A. Climate-based Performance Evaluation of Double Skin Facades by Building Energy Modelling in Central Europe. Energy Procedia 2015, 78, 555–560. [Google Scholar] [CrossRef]
- Graf, F.; Marino, G. Les Dispositifs du Confort dans L’architecture du XXe Siècle: Connaissance et Stratégies de Sauvegarde; Presses Polytechniques et Universitaires Romandes: Lausanne, Switzerland, 2016; ISBN 978-2-88915-062-5. [Google Scholar]
- Zuazua-Ros, A.; Martín-Gómez, C.; Bermejo-Busto, J.; Vidaurre-Arbizu, M.; Baquero, E.; Miranda, R. Thermal energy performance in working-spaces from biomorphic models: The tuna case in an office building. Build. Simul. 2016, 9, 347–357. [Google Scholar] [CrossRef]
- Ibañez-Puy, M.; Martín-Gómez, C.; Bermejo-Busto, J.; Sacristán, J.A.; Ibañez-Puy, E. Ventilated Active Thermoelectric Envelope (VATE): Analysis of its energy performance when integrated in a building. Energy Build. 2018, 158, 1586–1592. [Google Scholar] [CrossRef]
- Ramírez Balas, C.; Suárez Medina, R.; Sendra Salas, J.J. Future tecnologies in Le Corbusier’s enviromental conditioning systems: City of Refuge in Paris. In Proceedings of the 29th International Conference—Sustainable Architecture for a Renewable Future, München, Germany, 10–12 September 2013. [Google Scholar]
- Bryan, H. Le Corbusier and the Mur Neutralisant: An Early Experiment in Double Envelope Construction. In Proceedings of the Ninth International PLEA Conference, Seville, Spain, 22–24 September 1991; ISBN 0792314182 9780792314189. [Google Scholar]
- Le, C. Précisions sur un État Present Del’architecture et Del’urbanisme; Collection de “L’Esprit Nouveau”; G. Crès: Paris, France, 1930. [Google Scholar]
- Taylor, B.B. La Cité de Refuge di Le Corbusier; Officina Edizioni: Roma, Italian, 1979. [Google Scholar]
- Brooks, A. Le Corbusier: Armée du Salut-Cité de Refuge; Garland Publishing: New York, NY, USA, 1983. [Google Scholar]
- James Inglis, D. Le Corbusier: The City of Refuge, Paris 1929–1933; University of chicago Press: Chicago, IL, USA, 1987. [Google Scholar]
- Harris, S. From L’ir Exact to L’Aérateur: Ventilation and its Evolution in the Architectural Work of Le Corbusier. In The Green Braid: Towards an Architecture of Ecology, Economy and Equity; Judith, K., Kenneth, S., Eds.; Routledge: London, UK, 2007; pp. 140–152. [Google Scholar]
- Manz, H.; Schaelin, A.; Simmler, H. Airflow patterns and thermal behavior of mechanically ventilated glass double facades. Build. Environ. 2004, 39, 1023–1033. [Google Scholar] [CrossRef]
- Fallahi, A.; Haghighat, F.; Elsadi, H. Energy performance assessment of double-skin façade with thermal mass. Energy Build. 2010, 42, 1499–1509. [Google Scholar] [CrossRef]
- Pappas, A.; Zhai, Z. Numerical investigation on thermal performance and correlations of double skin façade with buoyancy—Driven airflow. Energy Build. 2008, 40, 466–475. [Google Scholar] [CrossRef]
- Kim, D.W.; Park, C.S. Difficulties and limitations in performance simulation of a double skin façade with EnergyPlus. Energy Build. 2011, 43, 3635–3645. [Google Scholar] [CrossRef]
- Kim, D.W.; Park, C.S. Corrigendum to “Difficulties and limitations in performance simulation of a double skin façade with EnergyPlus”. Energy Build. 2012, 49, 647. [Google Scholar] [CrossRef]
- Guardo, A.; Coussirat, M.; Egusquiza, E.; Alavedra, P.; Castilla, R. A CFD approach to evaluate the influence of construction and operation parameters on the performance of Active Transparent Façades in Mediterranean climates. Energy Build. 2009, 41, 534–542. [Google Scholar] [CrossRef]
- Ascione, F.; De Masi, R.F.; De Rossi, F.; Ruggiero, S.; Vanoli, G.P. MATRIX, a multi activity test-room for evaluating the energy performances of ‘building/HVAC’ systems in Mediterranean climate: Experimental set-up and CFD/BPS numerical modeling. Energy Build. 2016, 126, 424–446. [Google Scholar] [CrossRef]
- Peng, L.; Nielsen, P.V.; Wang, X.; Sadrizadeh, S.; Liu, L.; Li, Y. Possible user-dependent CFD predictions of transitional flow in building ventilation. Build. Environ. 2016, 99, 130–141. [Google Scholar] [CrossRef]
- Berger, J.; Mazuroski, W.; Mendes, N.; Guernouti, S.; Woloszyn, M. 2D whole-building hygrothermal simulation analysis based on a PGD reduced order model. Energy Build. 2016, 112, 49–61. [Google Scholar] [CrossRef]
- Fuliotto, R.; Cambuli, F.; Mandas, N.; Bacchin, N.; Manara, G.; Chen, Q. Experimental and numerical analysis of heat transfer and airflow on an interactive building façade. Energy Build. 2010, 42, 23–28. [Google Scholar] [CrossRef]
- Banham, R. The Architecture of the Well-Tempered Environment; Architectural Press: London, UK, 1969. [Google Scholar]
- Ramírez-Balas, C.; Fernández-Nieto, E.D.; Narbona-Reina, G.; Sendra, J.J.; Suárez, R. Numerical simulation of the temperature evolution in a room with a mur neutralisant. Application to “The City of Refuge” by Le Corbusier. Energy Build. 2015, 86, 708–722. [Google Scholar] [CrossRef]
- Ramírez Balas, C.; Sendra Salas, J.J.; Suárez Medina, R.; Fernández Nieto, E.D.; Narbona Reina, G. The mur neutralisant as an active thermal system: Saint Gobain tests (1931) versus CFD simulation (2015). In LC2015-Le Corbusier, 50 Years Later; Universitat Politècnica de València: Valencia, Spain, 2015. [Google Scholar] [Green Version]
- Ismail, K.A.R.; Henríquez, J.R. Simplified model for a ventilated glass window under forced air flow conditions. Appl. Therm. Eng. 2006, 26, 295–302. [Google Scholar] [CrossRef]
- FreeFEM3D. Available online: http://www.freefem.org/ff3d/ (accessed on 25 July 2017).
- DesignBuilder v.2.4.2.026. Available online: http://www.designbuilder.es/descargas/software-designbuilder (accessed on 27 November 2017).
- EnergyPlus. Available online: https://energyplus.net/weather-location/europe_wmo_region_6/FRA//FRA_Paris.Orly.071490_IWEC (accessed on 17 July 2017).
- ISO 7730:2005. Ergonomics of the Thermal Environment—Analytical Determination and Interpretation of Thermal Comfort Using Calculation of the PMV and PPD Indices and Local Thermal Comfort Criteria. Available online: https://www.iso.org/standard/39155.html (accessed on 15 November 2005).
- Liu, W.; Jin, M.; Chen, Ch.; Chen, Q. Optimization of air supply location, size, and parameters in enclosed environments using a computational fluid dynamics-based adjoint method. J. Build. Perform. Simul. 2016, 9, 149–161. [Google Scholar] [CrossRef]
Figure 1.
Plan of room and active transparent façade (ATF). Boundary labels for the problem () and details of the computational mesh.
Figure 1.
Plan of room and active transparent façade (ATF). Boundary labels for the problem () and details of the computational mesh.

Figure 2.
Sketch of the section of the façade.

Figure 3.
Room and velocity vector coloured and scaled in terms of the velocity norm for the case studied with maximum velocity value for inflow velocity.
Figure 3.
Room and velocity vector coloured and scaled in terms of the velocity norm for the case studied with maximum velocity value for inflow velocity.

Figure 4.
Probe points to measure the indoor temperature marked in red.

Figure 5.
Case 1: Le Corbusier hypothesis. Winter. Data: calculated temperatures: at a height of 1.5 m, outdoor temperature , impulse temperature , inlet temperature , all of them against the left y-axis, and radiation against the right y-axis.
Figure 5.
Case 1: Le Corbusier hypothesis. Winter. Data: calculated temperatures: at a height of 1.5 m, outdoor temperature , impulse temperature , inlet temperature , all of them against the left y-axis, and radiation against the right y-axis.

Figure 6.
Case 1: Le Corbusier hypothesis. Winter. Internal layer temperature and averaged room temperature together with calculated indoor temperatures at the probe points given in Figure 3. (a) by columns; (b) by rows.
Figure 6.
Case 1: Le Corbusier hypothesis. Winter. Internal layer temperature and averaged room temperature together with calculated indoor temperatures at the probe points given in Figure 3. (a) by columns; (b) by rows.

Figure 7.
Case 1: Le Corbusier hypothesis. Summer. Data: calculated temperatures: at a height of 1.5m, outdoor temperature , impulse temperature , inlet temperature , all of them against the left y-axis, and radiation against the right y-axis.
Figure 7.
Case 1: Le Corbusier hypothesis. Summer. Data: calculated temperatures: at a height of 1.5m, outdoor temperature , impulse temperature , inlet temperature , all of them against the left y-axis, and radiation against the right y-axis.

Figure 8.
Case 1: Le Corbusier hypothesis. Summer. Internal layer temperature and averaged room temperature together with calculated indoor temperatures at the probe points given in Figure 4. (a) by columns; (b) by rows.
Figure 8.
Case 1: Le Corbusier hypothesis. Summer. Internal layer temperature and averaged room temperature together with calculated indoor temperatures at the probe points given in Figure 4. (a) by columns; (b) by rows.

Figure 9.
Case 1: Le Corbusier hypothesis. 3D image of temperature distribution at 00:00 hours on the second day of calculation. (a) winter; (b) summer.
Figure 9.
Case 1: Le Corbusier hypothesis. 3D image of temperature distribution at 00:00 hours on the second day of calculation. (a) winter; (b) summer.

Figure 10.
Case 2: Efficient energy proposal. Winter. Data: calculated temperatures: at a height of 1.5m, outdoor temperature , impulse temperature , inlet temperature , all of them against the left y-axis, and radiation against the right y-axis.
Figure 10.
Case 2: Efficient energy proposal. Winter. Data: calculated temperatures: at a height of 1.5m, outdoor temperature , impulse temperature , inlet temperature , all of them against the left y-axis, and radiation against the right y-axis.

Figure 11.
Case 2: Efficient energy proposal. Winter. Internal layer temperature and averaged room temperature together with calculated indoor temperatures at the probe points given in Figure 4. (a) by columns; (b) by rows.
Figure 11.
Case 2: Efficient energy proposal. Winter. Internal layer temperature and averaged room temperature together with calculated indoor temperatures at the probe points given in Figure 4. (a) by columns; (b) by rows.

Figure 12.
Case 2: Efficient energy proposal. Summer. Data: calculated temperatures: at a height of 1.5m, outdoor temperature , impulse temperature , inlet temperature , all of them against the left y-axis and radiation against the right y-axis.
Figure 12.
Case 2: Efficient energy proposal. Summer. Data: calculated temperatures: at a height of 1.5m, outdoor temperature , impulse temperature , inlet temperature , all of them against the left y-axis and radiation against the right y-axis.

Figure 13.
Case 2: Efficient energy proposal. Summer. Internal layer temperature and averaged room temperature together with calculated indoor temperatures at the probe points given in Figure 4. (a) by columns; (b) by rows.
Figure 13.
Case 2: Efficient energy proposal. Summer. Internal layer temperature and averaged room temperature together with calculated indoor temperatures at the probe points given in Figure 4. (a) by columns; (b) by rows.

Figure 14.
Case 2: Efficient energy proposal. Summer with free cooling. Data: calculated temperatures: at a height of 1.5 m, outdoor temperature , impulse temperature , inlet temperature , all of them against the left y-axis and radiation against the right y-axis.
Figure 14.
Case 2: Efficient energy proposal. Summer with free cooling. Data: calculated temperatures: at a height of 1.5 m, outdoor temperature , impulse temperature , inlet temperature , all of them against the left y-axis and radiation against the right y-axis.

Figure 15.
Case 2: Efficient energy proposal. Summer with free cooling. Internal layer temperature and averaged room temperature together with calculated indoor temperatures at the probe points given in Figure 4. (a) by columns; (b) by rows.
Figure 15.
Case 2: Efficient energy proposal. Summer with free cooling. Internal layer temperature and averaged room temperature together with calculated indoor temperatures at the probe points given in Figure 4. (a) by columns; (b) by rows.

Figure 16.
Case 2: Efficient energy proposal. 3D image of temperature distribution at 0:00 hours on the second day of calculation. (a) winter; (b) summer without free cooling.
Figure 16.
Case 2: Efficient energy proposal. 3D image of temperature distribution at 0:00 hours on the second day of calculation. (a) winter; (b) summer without free cooling.


Table 1.
Notation in problem (Pfaçade).
| Symbols | Nomenclature |
|---|---|
| Density | |
| Specific heat | |
| Volume | |
| Mass flow rate in the channel per unit area | |
| Transmittance | |
| Area | |
| Stephan-Boltzman constant | |
| Emissivity coefficient | |
| Absorbance coefficient | |
| Short wave transmission coefficient | |
| Solar radiation | |
| Net radiant heat transfer per unit area | |
| Outdoor temperature | |
| Subscripts | |
| Façade air cavity | |
| External layer of the façade | |
| Internal layer of the façade |
Table 2.
Fixed parameters involved in () problem.
| Parameter | External Layer | Air Cavity | Internal Layer |
|---|---|---|---|
| Density (kg/m3) | |||
| Specific heat (J/kg K) | |||
| Thickness (m) | |||
| Transmittance (W/ m2 K) | |||
| Emissivity | - | ||
| Absorbance | - | ||
| Short wave transmission | - | - |
Table 3.
Initial data for and problems.
| Data | Winter | Summer |
|---|---|---|
| (°C) | −0.58 | 18.13 |
| (°C) | 2.48 | 20.26 |
| (°C) | 4.45 | 21.51 |
| (m/s) | 0 | 0 |
| (N/m2) | 0 | 0 |
| (°C) | 7.14 | 27.58 |
Table 4.
Design parameters for Case 1: Le Corbusier hypothesis.
| Data | Winter | Summer |
|---|---|---|
| (°C) | 30 | 15 |
| (kg /sm2) | 0.7758 | 0.7758 |
| (°C) | 20 | 25 |
| (m/s) | 1.02 | 3.55 |
Table 5.
Design parameters for Case 2: Energy-efficient proposal.
| Data | Winter | Summer | |
|---|---|---|---|
| Without Free Cooling | Free Cooling | ||
| (°C) | 20 | ||
| (kg/sm2) | 0.7758 | 0.7758 | |
| (°C) | 20 | ||
| (m/s) | 3.25 | 3.25 | |
© 2018 by the authors. Licensee MDPI, Basel, Switzerland. This article is an open access article distributed under the terms and conditions of the Creative Commons Attribution (CC BY) license (http://creativecommons.org/licenses/by/4.0/).
Share and Cite
MDPI and ACS Style
Ramírez-Balas, C.; Fernández-Nieto, E.; Narbona-Reina, G.; Sendra, J.J.; Suárez, R. Thermal 3D CFD Simulation with Active Transparent Façade in Buildings. Energies 2018, 11, 2265. https://doi.org/10.3390/en11092265
AMA Style
Ramírez-Balas C, Fernández-Nieto E, Narbona-Reina G, Sendra JJ, Suárez R. Thermal 3D CFD Simulation with Active Transparent Façade in Buildings. Energies. 2018; 11(9):2265. https://doi.org/10.3390/en11092265
Chicago/Turabian StyleRamírez-Balas, Cristina, Enrique Fernández-Nieto, Gladys Narbona-Reina, Juan José Sendra, and Rafael Suárez. 2018. "Thermal 3D CFD Simulation with Active Transparent Façade in Buildings" Energies 11, no. 9: 2265. https://doi.org/10.3390/en11092265
Note that from the first issue of 2016, this journal uses article numbers instead of page numbers. See further details here.