Article

Failure Modes, Effects and Criticality Analysis for Wind Turbines Considering Climatic Regions and Comparing Geared and Direct Drive Wind Turbines

1
Earth and Environmental Engineering Department, Columbia University, 116th St & Broadway, New York, NY 10027, USA
2
Fraunhofer Institute for Energy Economics and Energy System Technology—IEE, Königstor 59, 34119 Kassel, Germany
*
Author to whom correspondence should be addressed.
Energies 2018, 11(9), 2317; https://doi.org/10.3390/en11092317
Submission received: 30 July 2018 / Revised: 19 August 2018 / Accepted: 27 August 2018 / Published: 3 September 2018

Abstract

:
The wind industry is looking for ways to accurately predict reliability and availability of newly installed wind turbines. Failure modes, effects and criticality analysis (FMECA) is a technique utilized to determine the critical subsystems of wind turbines. There are several studies in the literature which have applied FMECA to wind turbines, but no studies so far have used it considering different weather conditions or climatic regions. Furthermore, different wind turbine design types have been analyzed applying FMECA either distinctively or combined, but no study so far has compared the FMECA results for geared and direct-drive wind turbines. We propose to fill these gaps by using Koppen-Geiger climatic regions and two different turbine models of direct-drive and geared-drive concepts. A case study is applied on German wind farms utilizing the Wind Measurement & Evaluation Programme (WMEP) database which contains wind turbine failure data collected between 1989 and 2008. This proposed methodology increases the accuracy of reliability and availability predictions and compares different wind turbine design types and eliminates underestimation of impacts of different weather conditions.

1. Introduction

Wind energy is one of the most profitable among renewable and clean energy sources and its deployment is constantly increasing having doubled during the last six years [1]. However, large deployment of a variable energy source creates some concerns regarding reliability and availability. Reliability is defined as the ability to perform as required, without failure, for a given time interval under given conditions, whereas availability is defined as the ability to be in a state to perform as required in the International Electrotechnical Commission (IEC) 60050 standards [2,3]. In order to improve the reliability and availability of wind turbines (WTs) the first step is to accurately determine the causes of failures, failure frequencies, effects of failures and criticalities. The aim of this study is to generalize the findings on the reliability predictions to guide the deployment of new wind turbines.
Failure Modes and Effects Analysis (FMEA) is a method which detects potential failure modes of a product during its life cycle, the effects of these failures and the criticality of these failure effects in product functionality [4]. It is widely utilized for mechanical, electrical, electronical and structural systems as well as chemical processes in the industry to sufficiently allocate budget for components or processes which carry high risk of failures. Failure Modes, Effects and Criticality Analysis (FMECA) is an extension of FMEA including criticality analysis which is used to quantify criticality of the failure modes in a specific subsystem or component. There are several studies in the literature which have applied FMEA to wind turbines [5,6,7,8,9,10,11,12,13,14,15,16].
Andrawus et al. [5] conducted FMECA to optimize the maintenance strategy for a 26 × 600 kW wind farm whereas qualitative FMEA is utilized to prioritize the failure modes in other studies using data from specific turbine models [6,7,8]. Dinmohammadi and Shafiee [9] used a fuzzy-FMEA and compared the results with traditional FMEA but they only used a single turbine model and did not consider climatic conditions. Shafiee and Dinmohammadi [10] compared onshore and offshore FMEA results using field data from several resources [17,18,19,20] whereas a combined field data is utilized in [11] to apply FMEA. Direct-drive wind turbine model is distinctively considered for FMEA in [12] whereas other studies either used combined field data or geared-drive wind turbine models for FMEA application. FMEA is applied for design improvement perspective in references [13,14] considering a specific turbine model while required maintenance action is added to FMEA in [15]. Tazi et al. [16] proposed a hybrid cost-FMEA for wind turbine reliability analysis and used a combined field data from several sources [20,21,22,23,24].
The impacts of climatic conditions on wind turbine failures have been investigated in many studies. Tavner et al. [25] asserted that low temperatures could lead to lubricant freezing and brittleness in the components while temperature variations could cause expansions and contractions. They also concluded that high wind speed, turbulence and gust lower reliability of wind turbine blade, pitch and mechanical drive train, whereas temperature and humidity affect electrical components rather than mechanical ones. Slimacek and Lindqvist [26] found that external factors such as lightning, icing and high winds increase the failure rate of wind turbines by 1.713 times. Reder et al. [27] determined the effects of weather conditions on wind turbine failures and concluded that winter is the season in which failure frequencies are increased and wind speed did not show any impact on failure occurrences. Chou et al. [28] asserted that 30% of the blade damage cases are caused by thunderstorms, followed by heavy rainfall with 28%. Climatic conditions can not only have an impact on failure rates, but also affect the repair times of any failures, thus eventually causing variation in the resulting downtime. It is intuitive that repair time for a wind turbine in a snowy region when there is a heavy snowfall is not as the same as a region with no environmental obstacles for repair time. However, no studies have, so far, applied FMECA considering different weather conditions or climatic regions. Furthermore, direct-drive and geared-drive wind turbines are never compared in terms of FMECA. Perez et al. [29] compared the failure rates and downtime values based on different turbine types and aspects stating that direct-drive wind turbines failure rates in electrical and electronical components are greater than geared-drive wind turbines where gearbox failures cause the most downtime. Therefore, there is a need to determine the criticalities in these two different types of wind turbine.
As stated, the FMECA studies in the literature have not considered the climatic conditions of wind turbines and compared the wind turbine types. However, underestimating the impacts of climatic conditions of wind turbines and turbine types misguide the wind farm operators and other stake holders. Therefore, climatic conditions and different wind turbine types must be considered for FMECA since they have an impact on both failure rates, downtimes and affected subsystems. The significance of this paper comes with filling these gaps by applying FMECA to reveal criticality differences of wind turbine subsystems depending on climatic conditions and types of wind turbines. In this study, it is aimed to fill these literature gaps in by achieving the following:
(1)
Determining impacts of climatic regions on wind turbine subsystem annual failure rate and downtime per failure values by using failure data from an identical turbine model.
(2)
Investigating wind turbine subsystem and component failure causes, effects and criticalities considering climatic regions.
(3)
Defining the differences in annual failure rate and downtime for direct drive and geared wind turbines and revealing differences in failure causes of such failures, effects and criticalities.
This study is expected to help for decision-making of wind farm operators as well as the other stakeholders such as insurance companies, turbine manufacturers and government officials.

2. Materials and Methods

This study has four different methodological dimensions; namely: (a) obtaining reliability and availability metrics for an identical turbine model for different climatic regions, (b) applying FMECA on the identical turbine models for different climatic regions, (c) revealing reliability metrics for two different turbine types for the same climatic region and (d) applying FMECA on different turbine types. To achieve the first objective, there is a need to classify wind turbine locations based on the meteorological parameters. To attain the second objective a FMECA is applied to all wind turbines considering a turbine model which is spread to different climatic regions. To reach the third objective, two turbine models which represent two different turbine designs are selected from WMEP database and FMECA is applied considering on them.

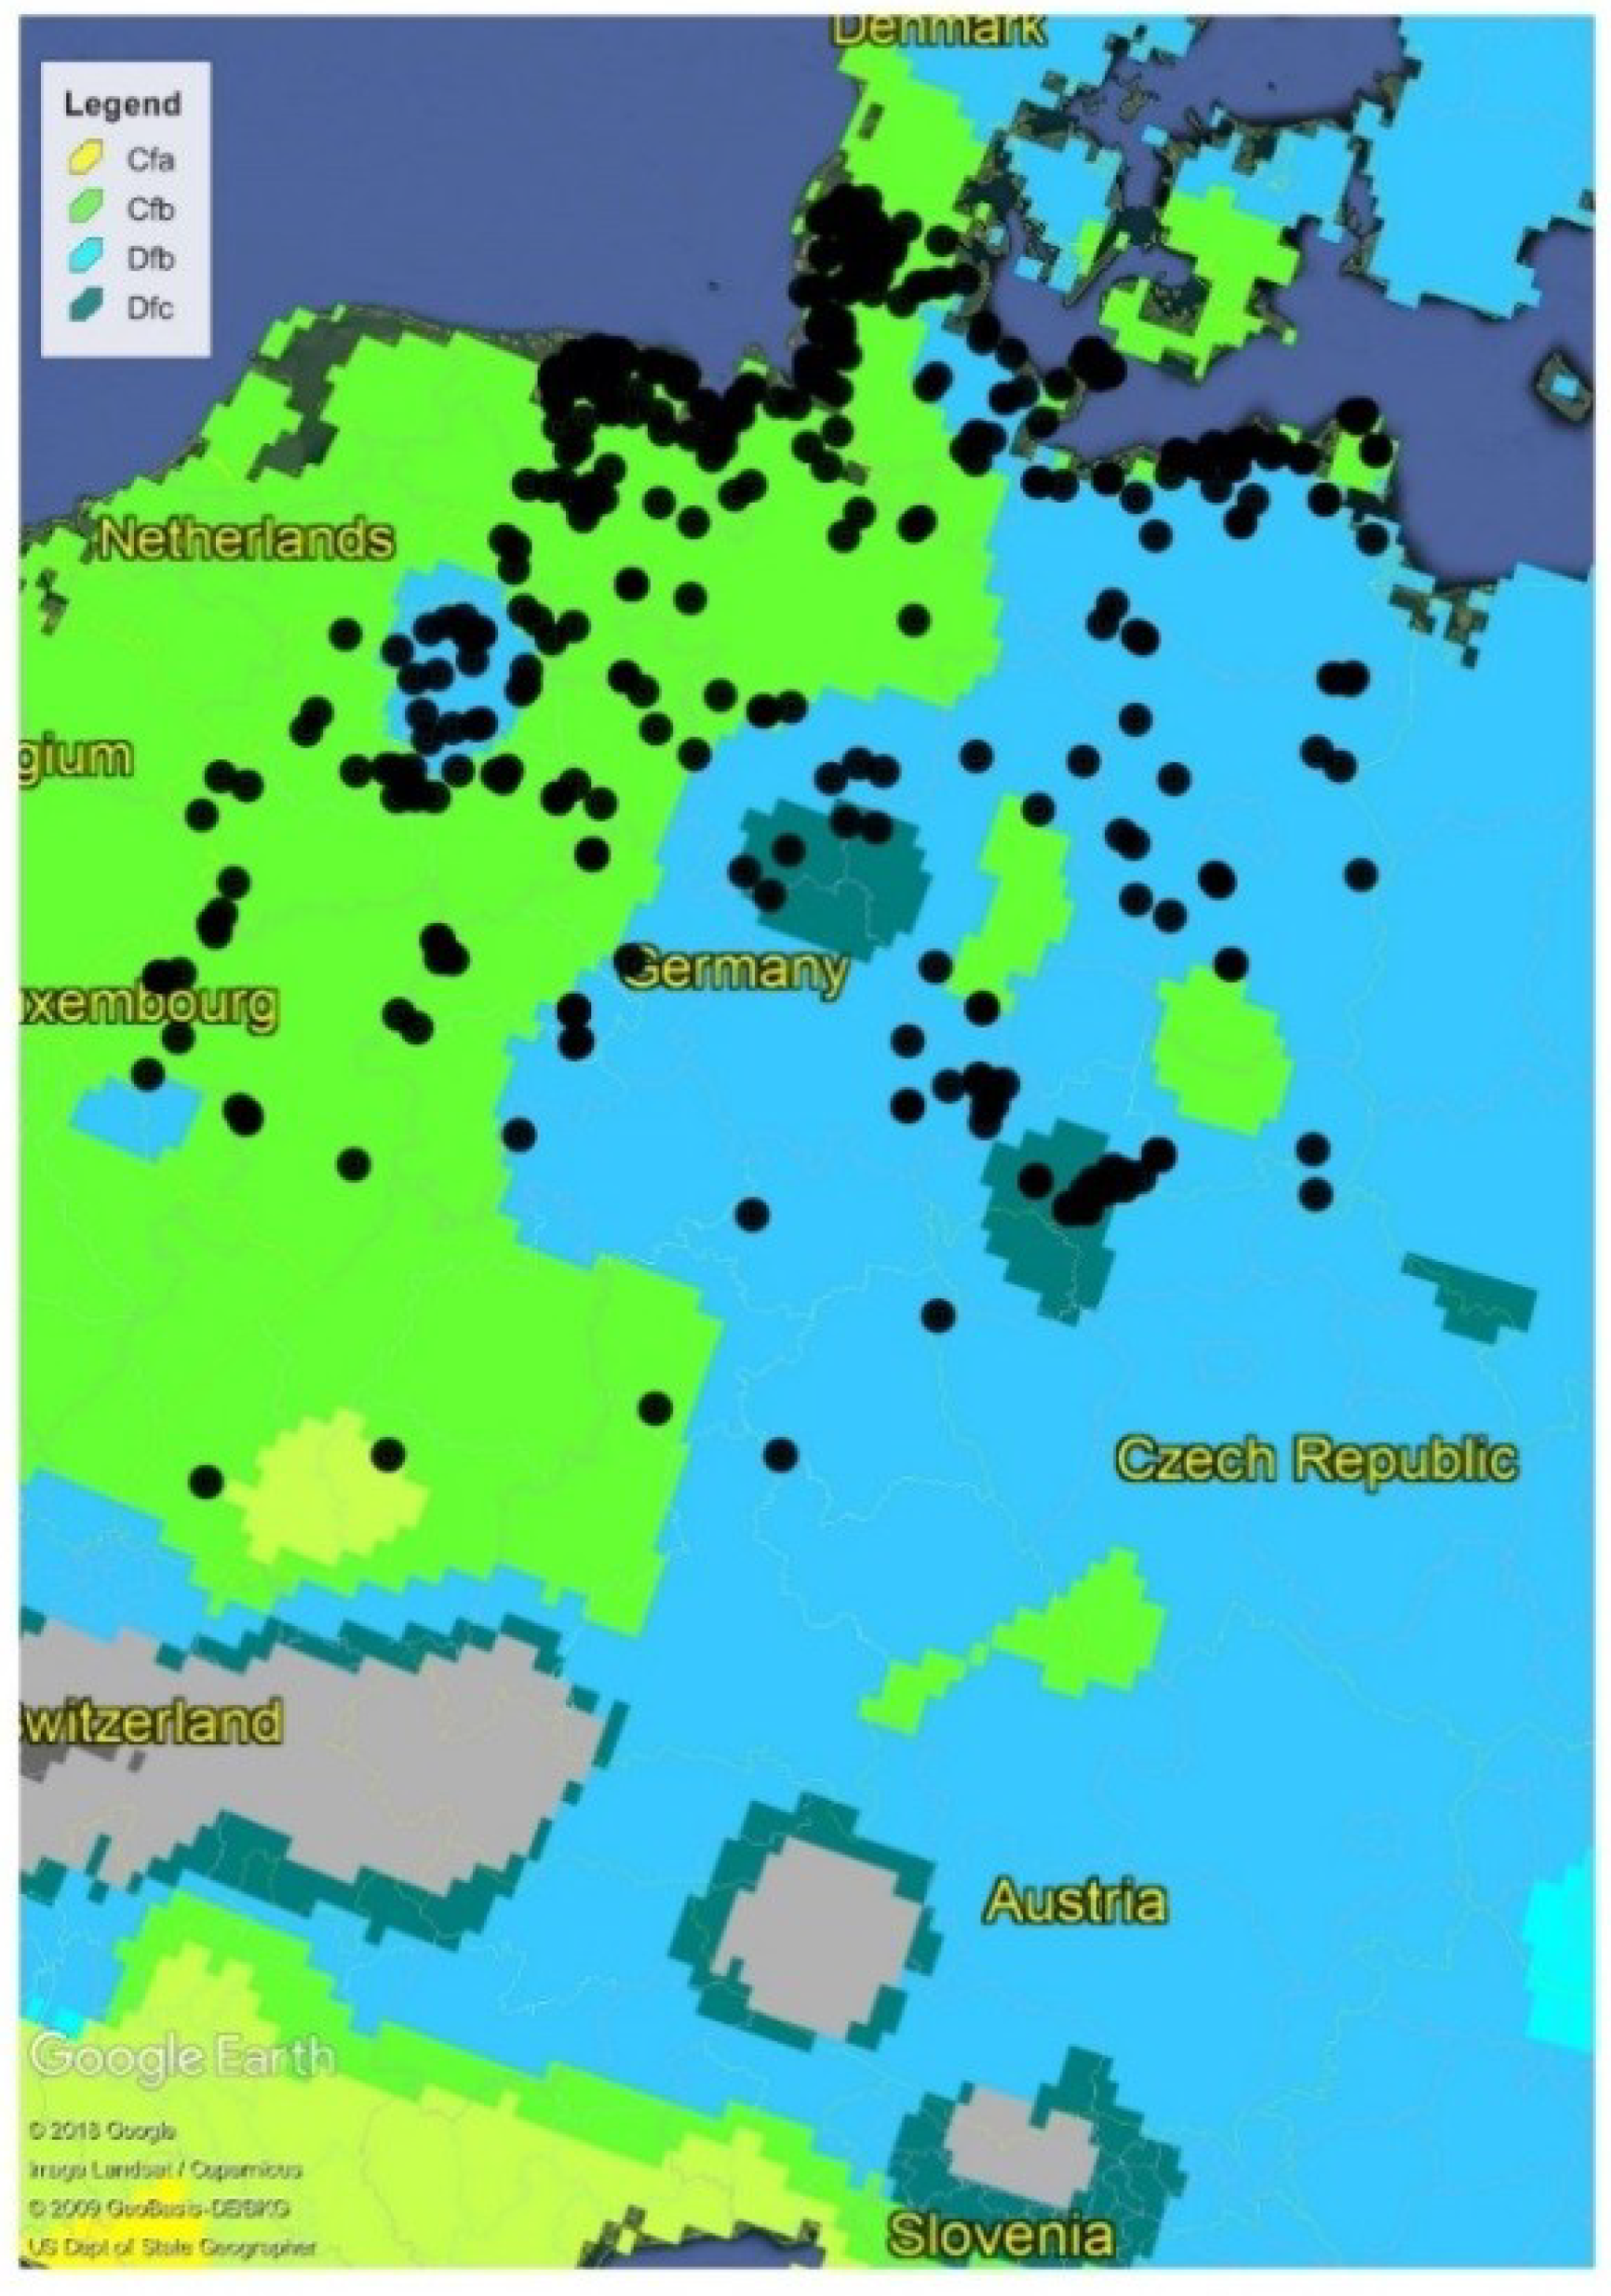
2.1. Climatic Regions

Koppen-Geiger is a climate classification cited by almost 5000 studies in a variety of disciplines [30]. Koppen-Geiger climatic regions which are determined based on annual precipitation and temperature records along with seasonal temperature records utilize 12,396 precipitation and 4844 temperature data stations globally and apply several temperature and precipitation criteria [30]. For example, Cfb is a temperate-without dry season-warm summer region. It can be seen from Table 1 that Cfb is a temperate region because average temperature of the hottest month is more than 10 °C and temperature of the coldest month is between 0 °C and 18 °C. Cfb is a without dry season because it is neither dry summer nor dry winter. A region is a dry summer if it gets less than 40 mm precipitation in the driest month and wettest month in winter gets more than three times the precipitation in the driest summer. A region is claimed to be a dry winter if precipitation of the wettest month in summer is 10 times more than the precipitation in the driest month winter. A warm summer has average temperature of hottest month less than 22 °C and at least 4 months above 10 °C. In short, Cfb is a region with a temperate climate which gets rain during the year without any seasonal exemption. Similar inferences can be made from Table 1 for the other climatic regions. Koppen-Geiger climate classification is a representation of a climatic regime rather than representing temporal changing data. For example, it differentiates regions with arid climate regimes from regions where extremely rainy days are observed. As stated, climatic conditions have an impact on wind turbine failure rates, modes, effects and downtimes and Koppen-Geiger is a good tool to classify wind turbine locations to determine impacts of climatic conditions.
In Germany, there are four Koppen-Geiger climatic regions as seen in Figure 1. These climatic regions which are present in Germany are the following:
  • Cfa: Temperate-without dry season-hot summer
  • Cfb: Temperate-without dry season-warm summer
  • Dfb: Cold-without dry season-warm summer
  • Dfc: Cold-without dry season-cold summer
The corresponding criteria for the classification of the climatic regions of interest are given in Table 1 [30].

2.2. Reliability Data

In the period from 1989 to 2006, a large monitoring survey for onshore wind turbines in Germany, the Scientific Measurement and Evaluation Programme (WMEP), had been conducted under the German publicly funded programme ‘250 MW Wind’. The WMEP survey collected 64,000 maintenance and repair reports from 1500 WTs that have been captured and analyzed, covering approximately 15,357 operational turbine-years. Hence, the WMEP database contains detailed information about both the reliability and availability of WTs.
The events in the WMEP database include scheduled maintenance, scheduled maintenance with replacement or repair, and unscheduled maintenance with a replacement or repair with additional information such as energy delivery. The definitions used in the WMEP survey are set out in detail in the WMEP annual reports and previous publications, e.g., reference [31]. An incident report from WMEP containing definitions of different WT subassemblies can be found in reference [32].
For the recent study a subset of the WMEP-database was used, containing the most relevant turbines. Data from 575 WTs are ready to be utilized with 6188 turbine years of operation and including 19,242 events considering a repair or replacement.
Figure 1 shows the wind turbine locations in Germany in the WMEP database that we use in this study. There are 427 wind turbines—4526 turbine years in Cfb region, 122 wind turbines—1346 turbine years in Dfb region, 25 wind turbines—306 turbine years in Dfc region in the WMEP database.
For the investigation of the climatic region effect, a control wind turbine model is selected among the highest most common in the WMEP database. For the investigation of turbine type impact, two different wind turbine models are selected as detailed in Table 2. A sensitivity analysis has been conducted to see the impacts of turbine capacity, rotor diameter and hub heights for wind turbine model reliability comparison.

2.3. FMECA Approach and Components

FMECA requires a taxonomy for wind turbine subsystems. In this study, subsystems and assemblies of wind turbines are adopted considering the classification in reference [16] and WMEP database classifications. Table 3 lists the subsystems and assemblies of a typical wind turbine.
FMECA consists of four main components such as failure modes, failure causes, effects of the failures and failure mode criticality numbers. Failure modes represent the type of failure occurring in every subsystem whereas failure mechanisms are the causes that lead to failures. Effects of the failures are simply consequences whereas failure mode criticality numbers are calculated as sum of expected cost from the failures and loss of energy production for every subsystem.

2.3.1. Failure Modes

Failure modes can be classified as the failures which happen in the specific subsystem (i.e., blade failure, gearbox failure, generator failure, etc.) reference [14] or more specific ones such as fatigue and fractures in the toothed shaft of a gearbox, loss of function in the lubricant system [33] depending on the data availability. The database which is used in this study does not include detailed data about the failure modes beyond the subsystem where the failure occurred.

2.3.2. Failure Causes

In this study, failure causes in the WMEP database which are given in Table 4 are used. They are high wind, grid failure, lightning, icing, malfunction of control systems, component wear or failure, loosening of parts, other causes and unknown causes. Grid failures in the WMEP database is assumed to occur only if there is a systematic grid failure rather than an indirect failure whose main cause is some other external factors. Thus, it is not an interest of investigation.

2.3.3. Failure Effects

Failure effects can be classified in the same way with failure causes which are given in Table 4. Eight effects of failures are used for FMECA in this study. They are overspeed, overload, noise, vibration, reduced power, causing follow-up damage, plant stoppage and other consequences.

2.3.4. Criticality of Failure Modes

Criticality Priority Number (CPN) is the one of the most important outcomes of this FMECA application. Criticality Priority Number (CPN) is very similar to Risk Priority Number (RPN) which is a traditional FMEA metric, the only difference is that RPN is a unitless ranking rate whereas proposed CPN is evaluated in two different terms such as Cost Criticality Number (CCN) and Downtime Criticality Number (DCN) in this paper. CPN is estimated as in the following product:
Criticality   Priority   Number                                                             = O c c u r r e n c e   S e v e r i t y   C o n s e q u e n c e   S e v e r i t y   N o n                                                             d e t e c t i o n   S e v e r i t y
It is stated in the literature that 99% of the equipment failures give malfunctioning signals about the potentiality of the malfunction of the equipment [16]. Condition monitoring systems (CMS) enable the detection of the failures in wind turbine subsystems such as gearbox, drive train, generator and tower by use of vibration, heat and pressure sensors [34]. In wind turbines, however, failures often appear suddenly and cannot be detected. Visual inspection, checking the lubrication level in gearboxes, vibration analysis and non-destructive testing methods which include ultrasound and acoustic emissions in scheduled maintenances are also other ways to detect potential anomalies in a wind turbine [35]. WMEP database consists of information of scheduled maintenances which were applied regularly on the wind turbines but does not cover the detection rate for the failures. Therefore, it is assumed that visual inspection detects potential failures equally for every subsystem. Although this is a strong assumption, there is no other practical option for estimating detection rate other than assuming that it is equal for every subsystems for this study.
In this study, CPN is demonstrated by two different metrics: Cost Criticality Number (CCN) and Downtime Criticality Number (DCN). Although in most cases cost criticality is important for the wind operators, downtime criticality would be more important for some rare cases such as energy security for military or health operations. Furthermore, the behavior of CCN and DCN can be very different depending on the external and internal conditions of wind turbines and thus operators can arrange their actions based on their prioritization. CCN measures the risk of having failure in terms of cost in a subsystem of wind turbine while DCN represents the risk of having failure in terms of time. To estimate DCN downtime per failure is calculated by multiplying total downtime per failure and annual failure rate. Evaluation of cost criticality number requires two subcomponents which are cost for the failure mode and cost for loss of energy production for this study. Cost for the failure mode is evaluated by multiplication of annual failure rate and cost per failure whereas cost for loss of energy production is calculated by multiplying lost energy production and electricity price. This paper utilizes Equations (2)–(6) to evaluate criticalities in each subsystem of a wind turbine as proposed in earlier studies [10,12,16]. The generic cost criticality number is estimated by Equation (2). Equations (3) and (4) are used to estimate the cost for the failure mode and loss of energy production, respectively [19]. Equation (5) evaluates lost energy production and Equation (6) estimates the downtime criticality number:
Cost   Criticality   Number   [ $ ]                                                                   = C o s t   f o r   t h e   f a i l u r e   m o d e   [ $ ]                                                                 + c o s t   o f   l o s t   e n e r g y   p r o d u c t i o n   [ $ ]
Cost   for   the   failure   mode   ( $ )   = n c o m p o n e n t s p n c n
where n represents subsystems, pn is annual failure rate occurring and cn is cost per failure in subsystem “n”:
Cost   of   lost   energy   production   [ $ ]   = L o s t   E n e r g y   p r o d u c t i o n   [   kWh ] E l e c t r i c i t y   s e l l i n g   t a r i f f   [ $ kWh ]   
Lost   energy   production   [ kWh ]                                                               = C a p a c i t y   f a c t o r W i n d   t u r b i n e   n o m i n a l   p o w e r   [ kW ]                                                               D o w n t i m e   p e r   f a i l u r e   [ hours ] A n n u a l   F a i l u r e   R a t e  
D o w n t i m e   C r i t i c a l i t y   N u m b e r   [ h o u r s ]                                                           =   D o w n t i m e   p e r   f a i l u r e   [ hours ]     A n n u a l   f a i l u r e   r a t e  
To estimate the lost energy production in Equation (5), the capacity factor is assumed to be 33% and average electricity selling tariff in the US is assumed to be 12 cents/kWh in Equation (4). It should be noted that this is a conservative assumption since most of the failures occur with the high wind rather than no wind conditions. The FMECA methodology is applied as follows:
(1)
Annual failure rates and downtime per failure values are determined.
(2)
Downtime and cost criticality values are computed for every subsystem for wind turbines.
(3)
The failures in wind turbines in different climatic regions are sorted.
(4)
Failure rates, downtime per failures, failure modes, and effects of different subsystems in different climatic regions are determined and their downtime and cost criticality values are computed.
(5)
The results are compared between climatic regions and targeted turbine population.
The comparison between geared and direct-drive wind turbines are applied on 500 kW geared and direct-drive wind turbines whose specifications are given in Table 2 for the same climatic region Cfb. A short example on CCN and DCN computations for rotor blades for climatic region Cfb is demonstrated in Table 5.

3. Results

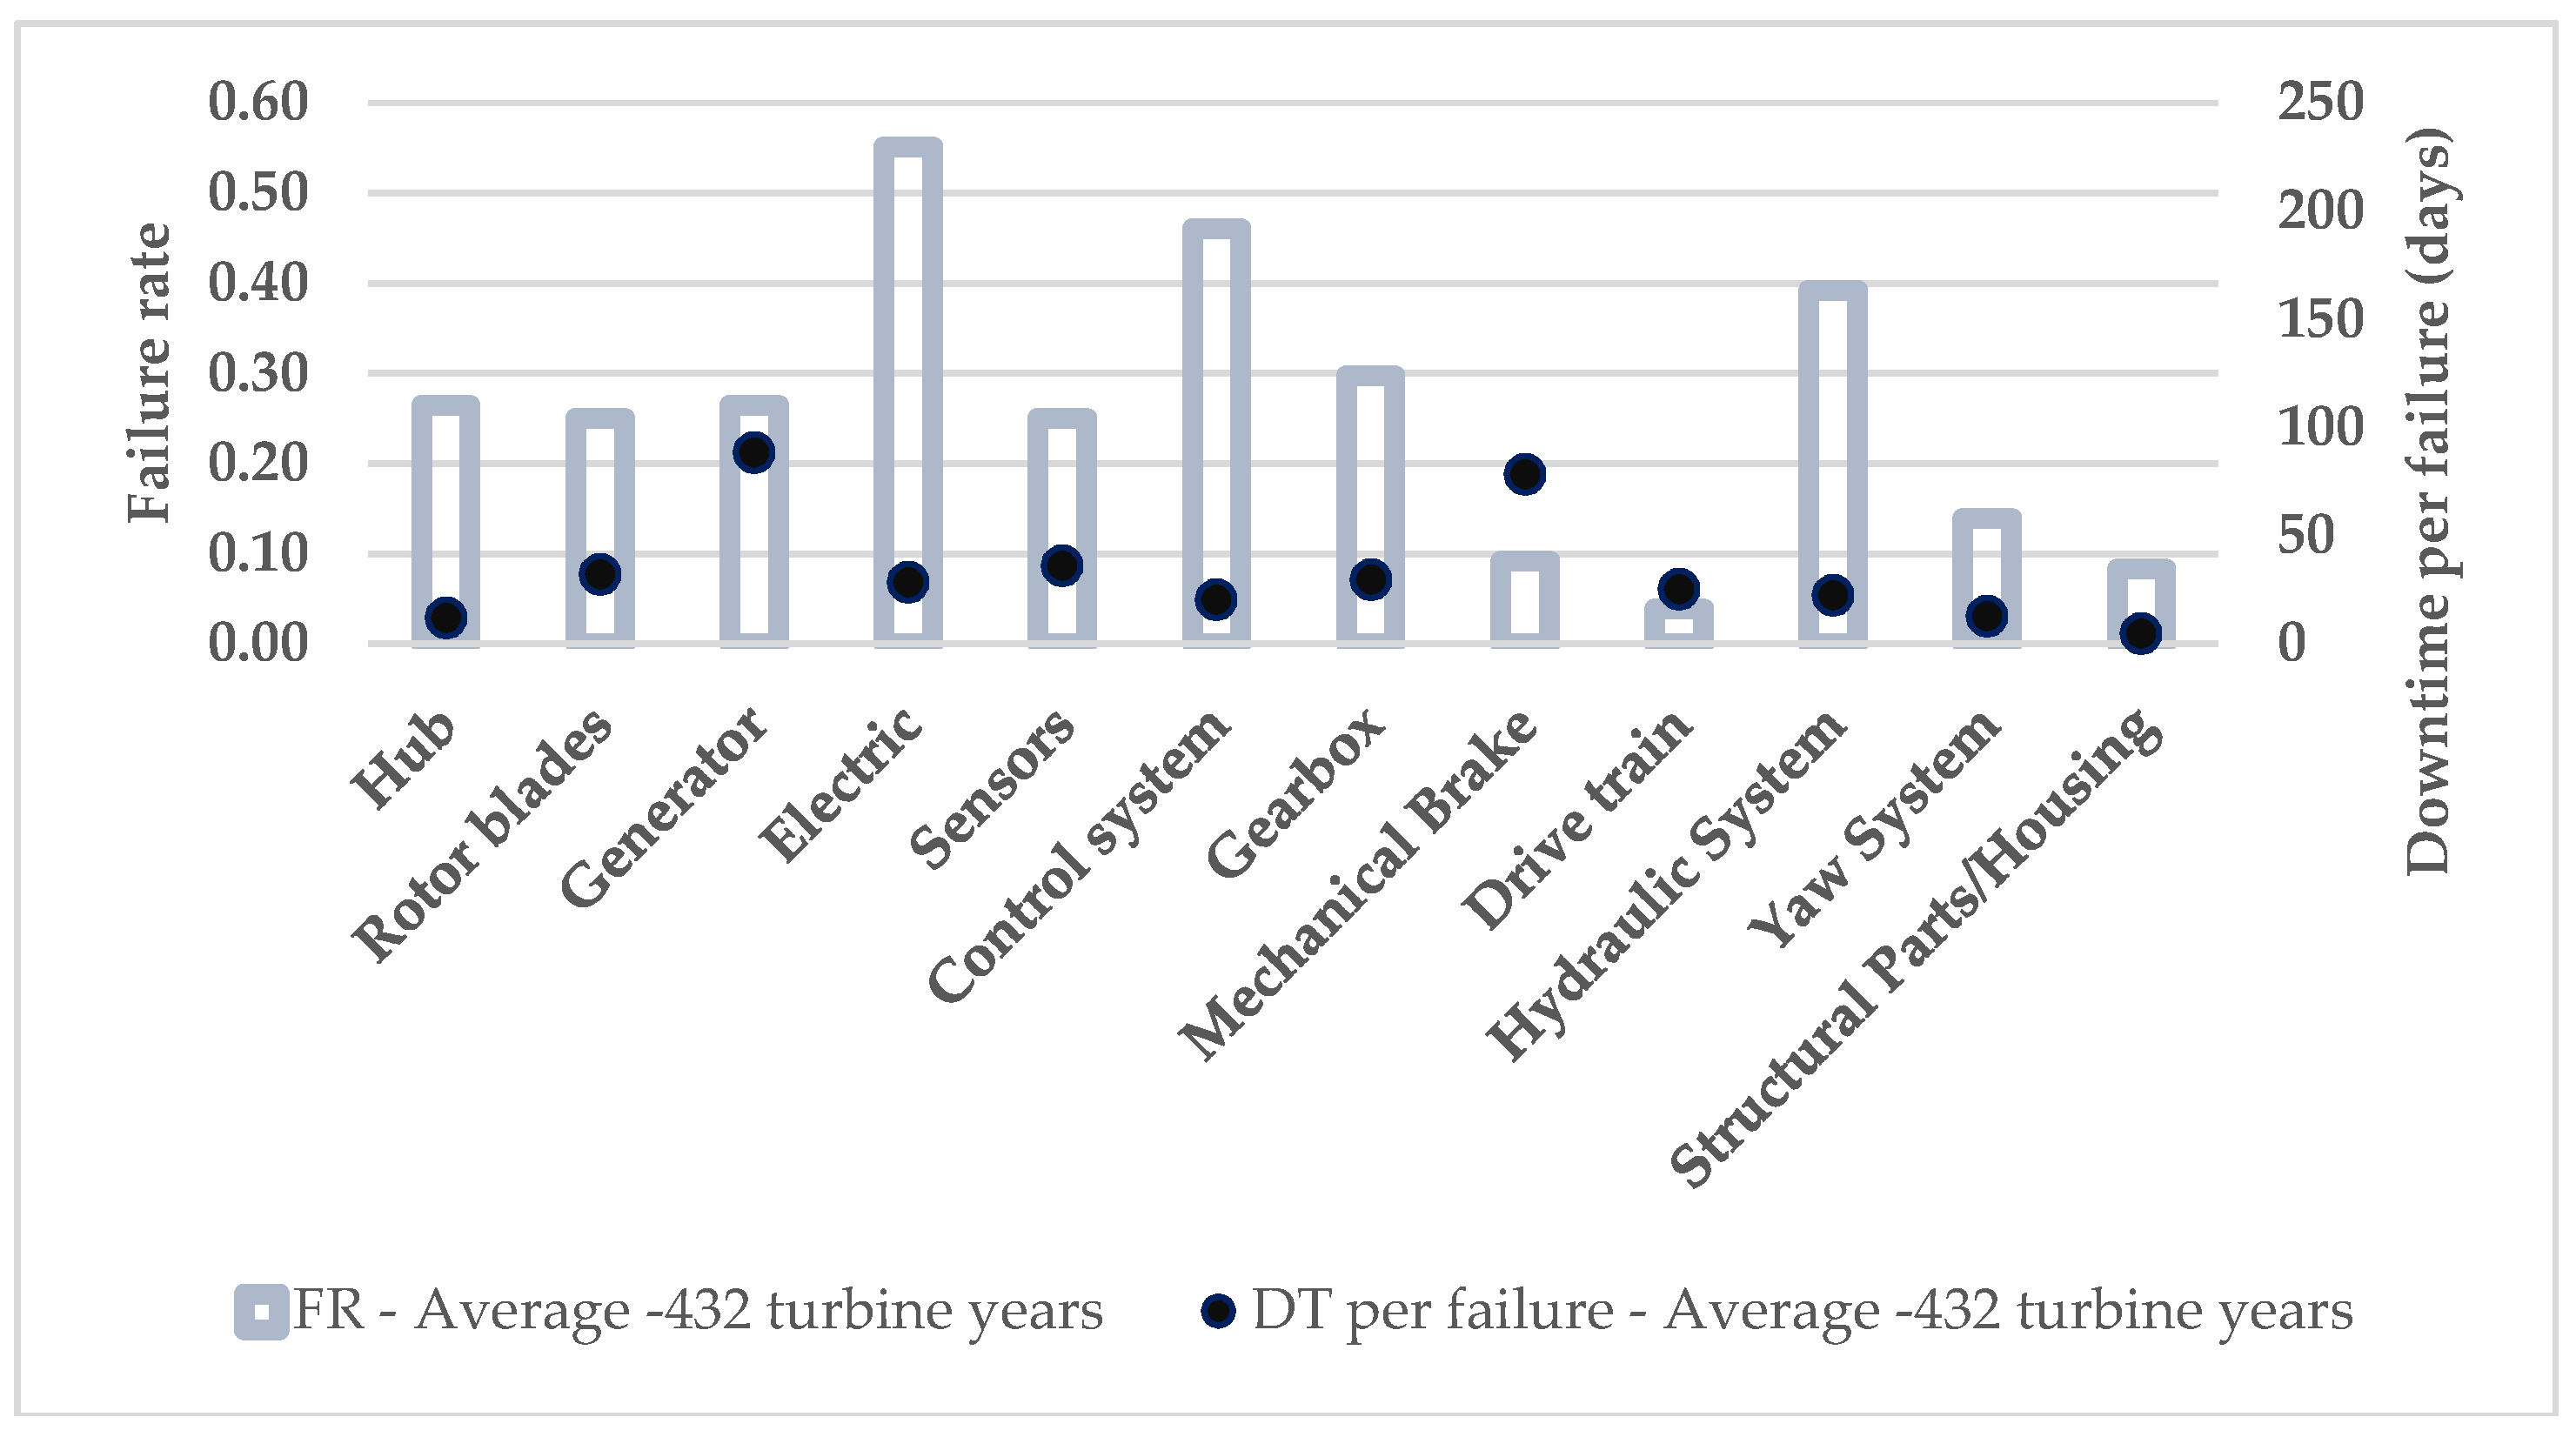
3.1. Investigation of Climatic Region Impact on WT Reliability and Availability

Figure 2 shows the average failure rate and downtime values if the breakdown for climatic regions are not considered.
Figure 3 shows that annual failure rate per turbine values are at similar range in all climatic regions for subsystems except for hub, rotor blades, generator, gearbox and hydraulic system which happen in Dfc. Rotor blade failures have higher annual failure rates in Dfc than in the other climatic regions whereas hub, generator, gearbox and hydraulic system failures have lower failure rates in Dfc than in the others. Dfc, being a colder climatic region than the rest of the climatic regions in Germany, intuitively impacted on rotor blade failures however lower hub, generator and gearbox failure rates are counterintuitive. The distortion of the results in gearbox, generator and hub might be attributed to scarcity of data in the Dfc climatic region where there are only six wind turbines. For example, six turbines in Dfc region had no more than 0.23 annual failure rate in their gearboxes with two of them had no failures during their survey period, whereas eight in eighteen wind turbines having more than 0.23 annual failure rates in Dfb region six of them being more than 0.5. Figure 3 also demonstrates that the downtime per failure values tend to change depending on the climatic regions. Hub, control system, hydraulic system, yaw system, structures and housing subsystems show comparable results in different climatic regions. Rotor blades and electric system failures show significantly higher downtime per failure values in Dfc, whereas sensor failures have the highest downtime value in Dfb. This might be attributed to severe operational conditions in cold climates. Subsystems in Cfb region tend to have low downtime per failure—below 24 h except for generators.

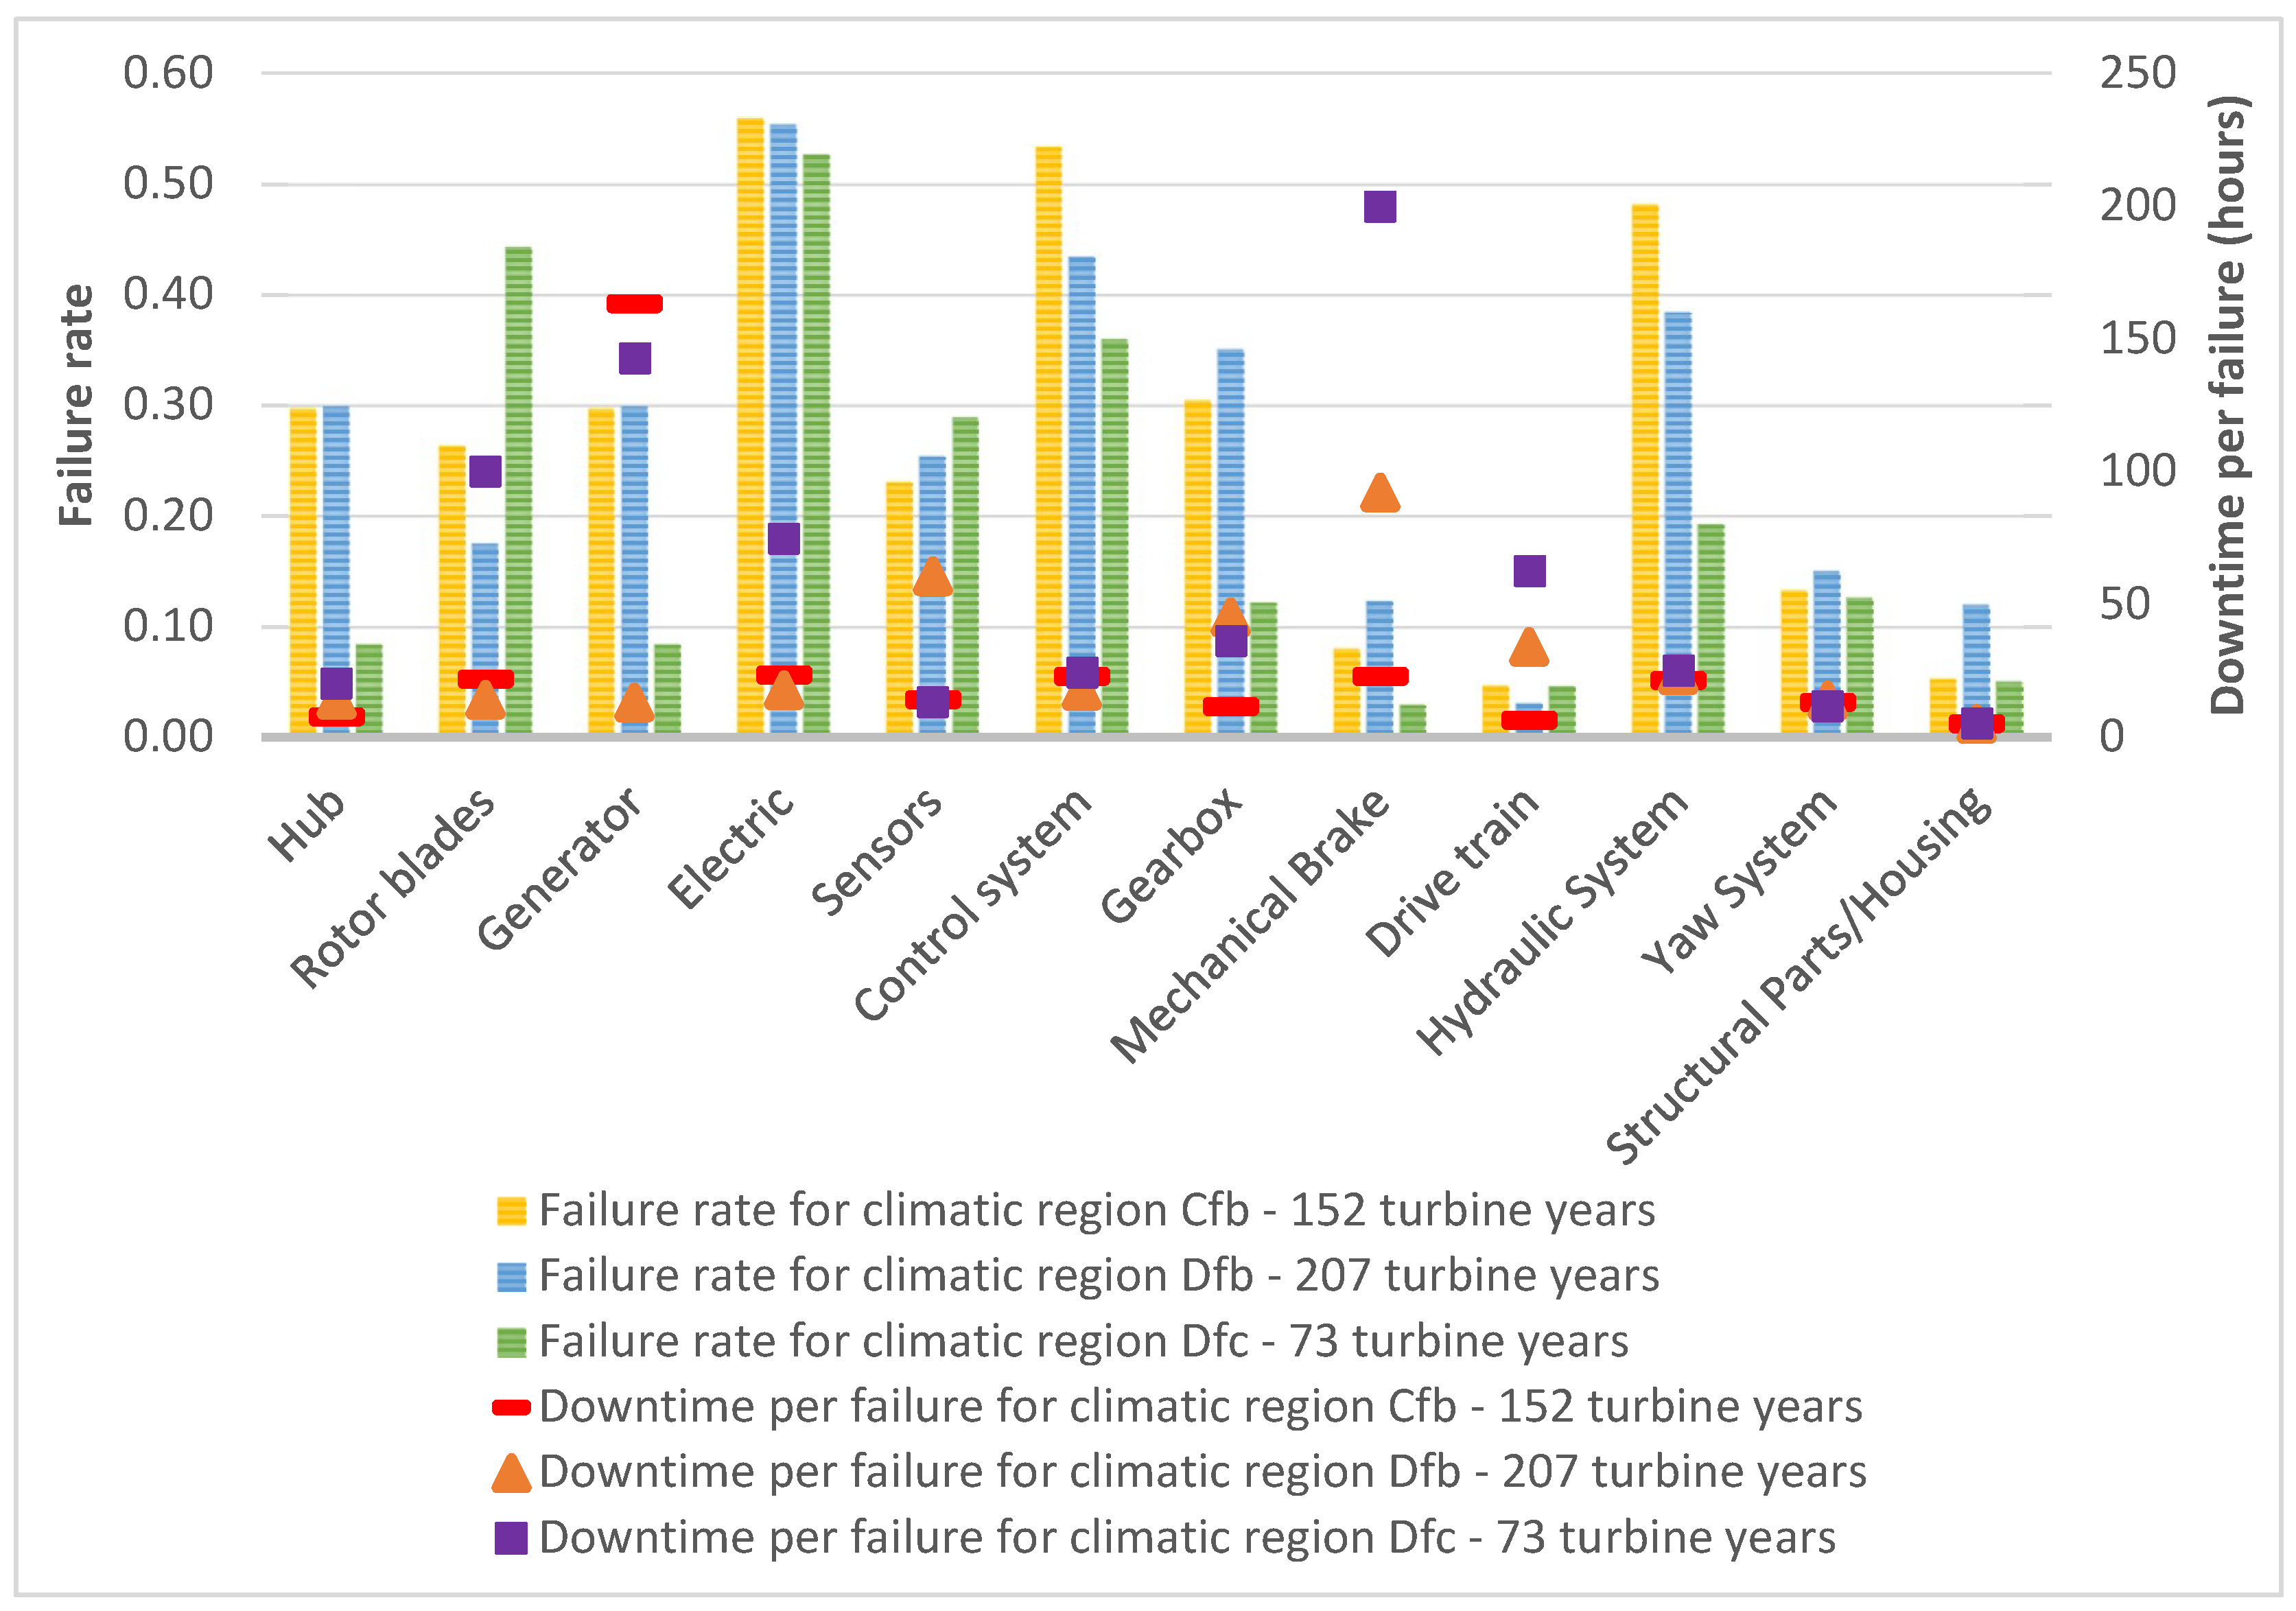
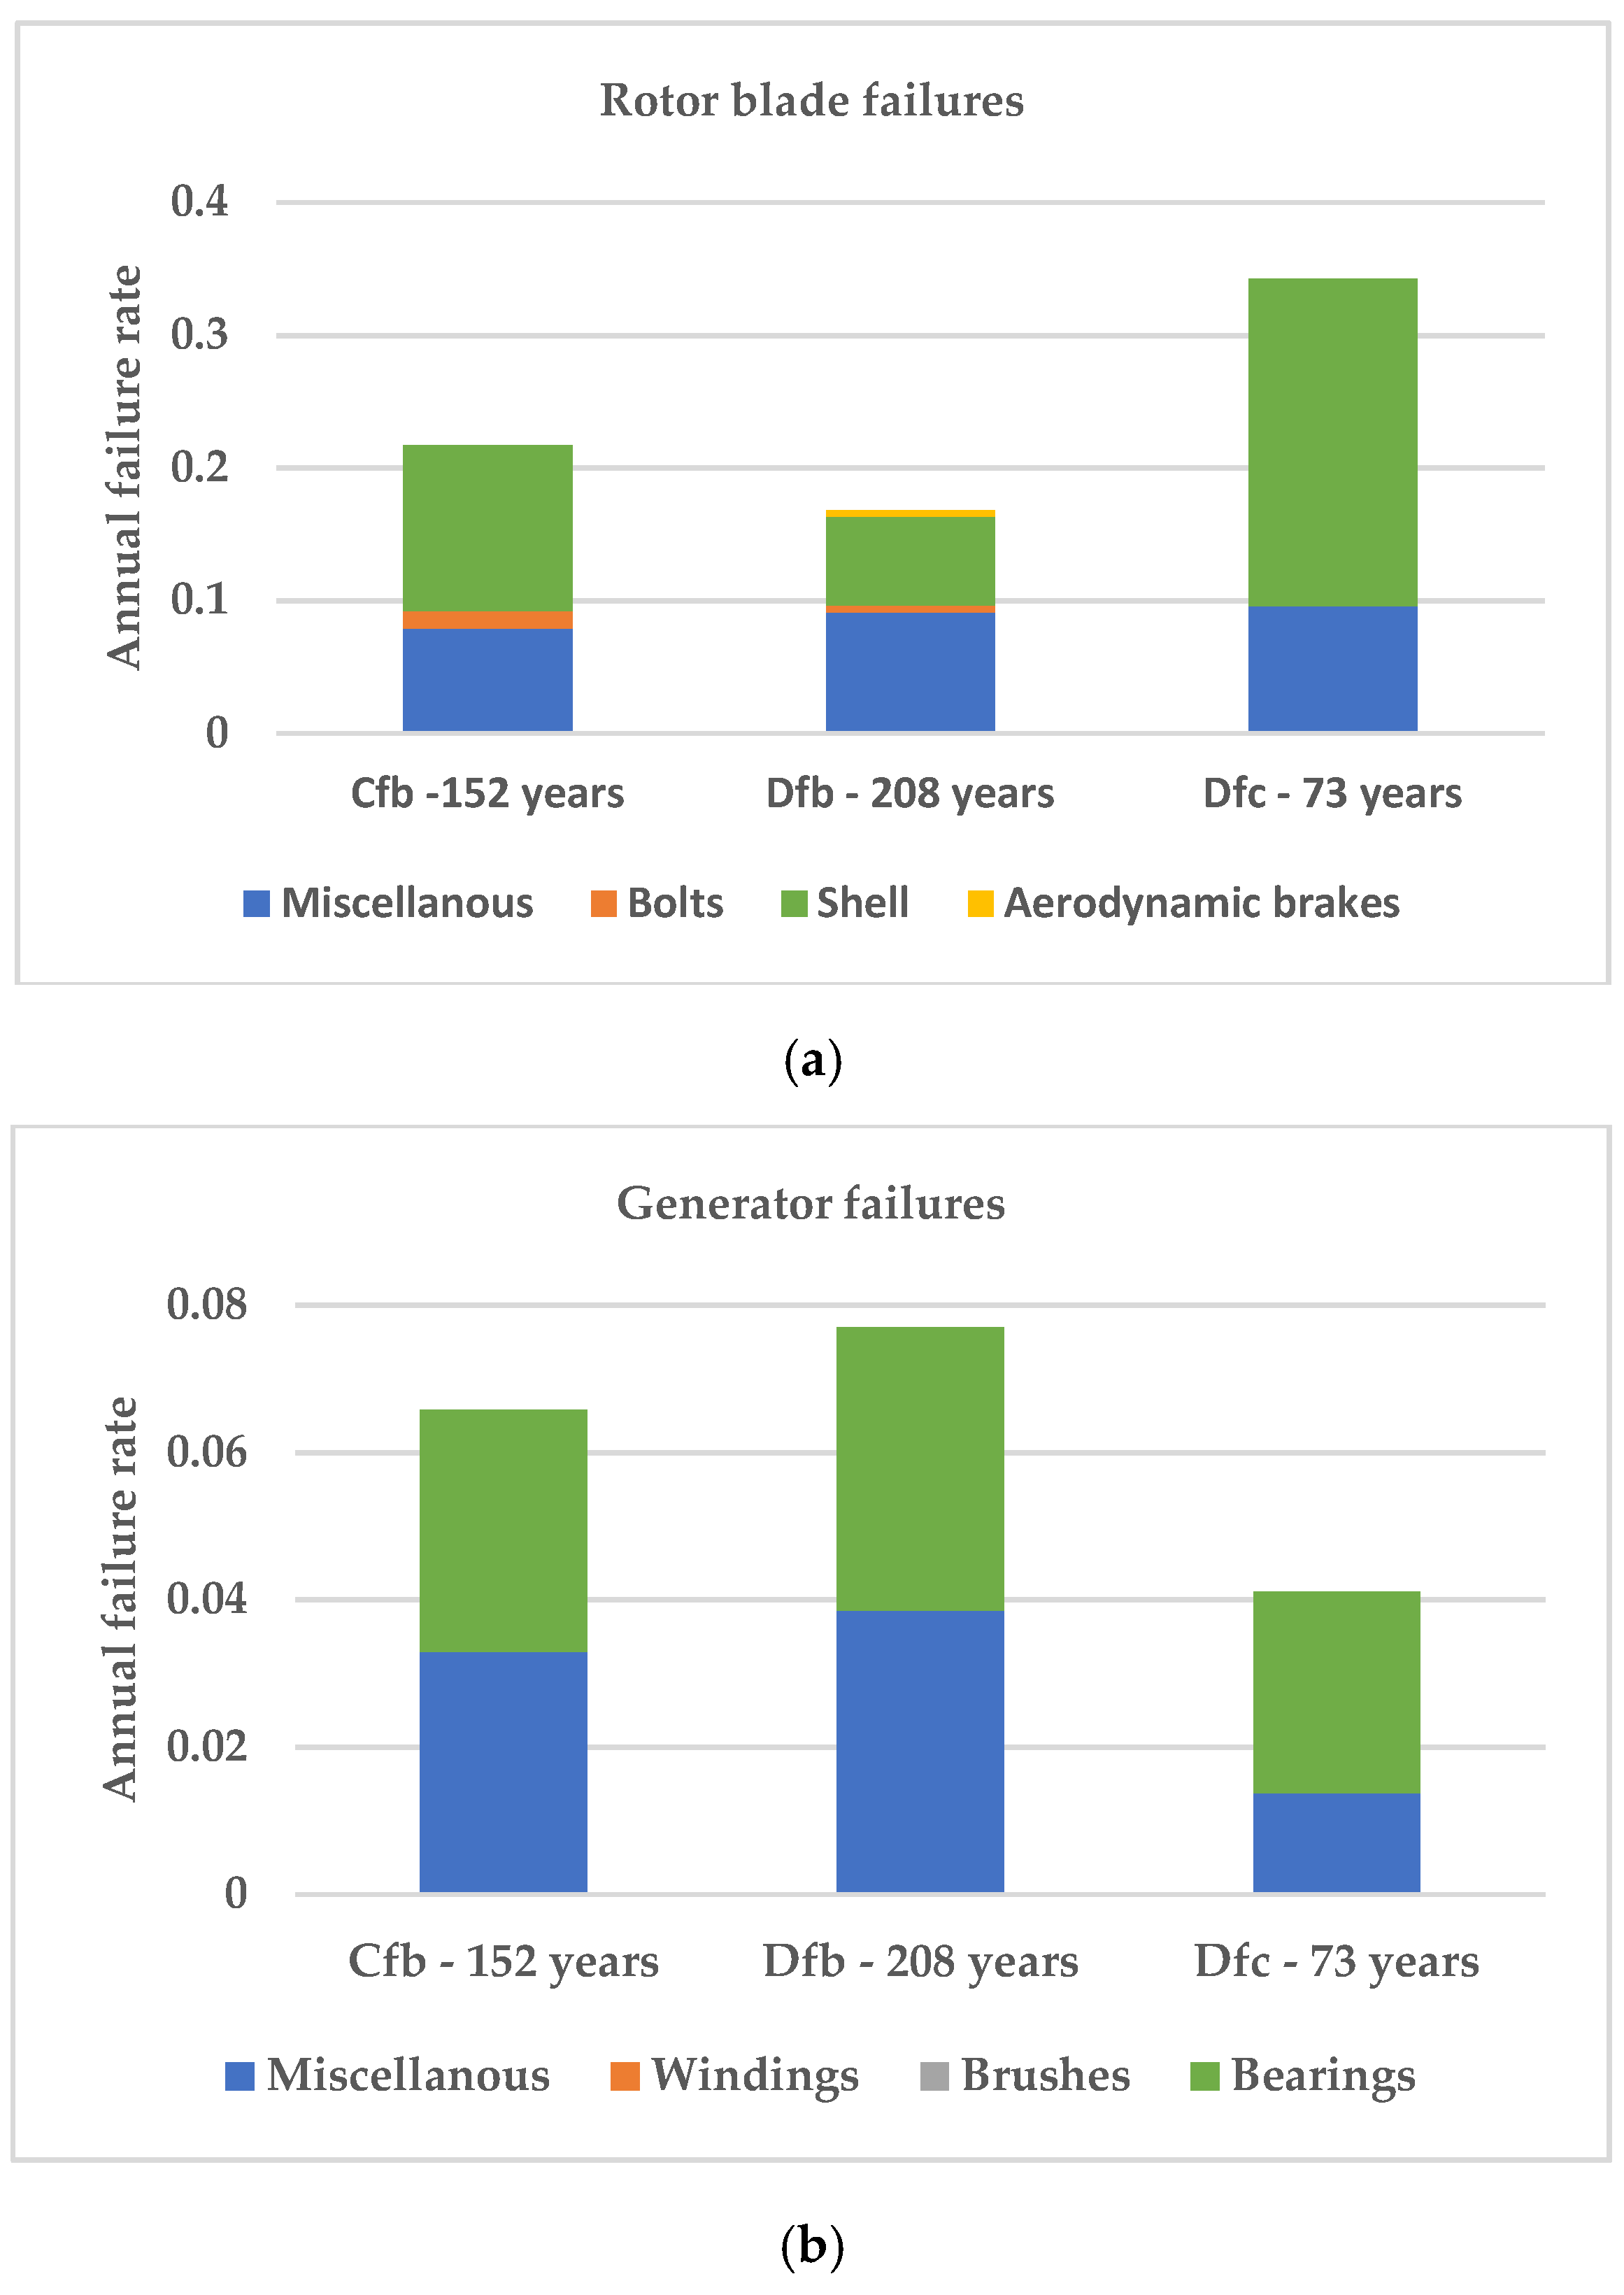
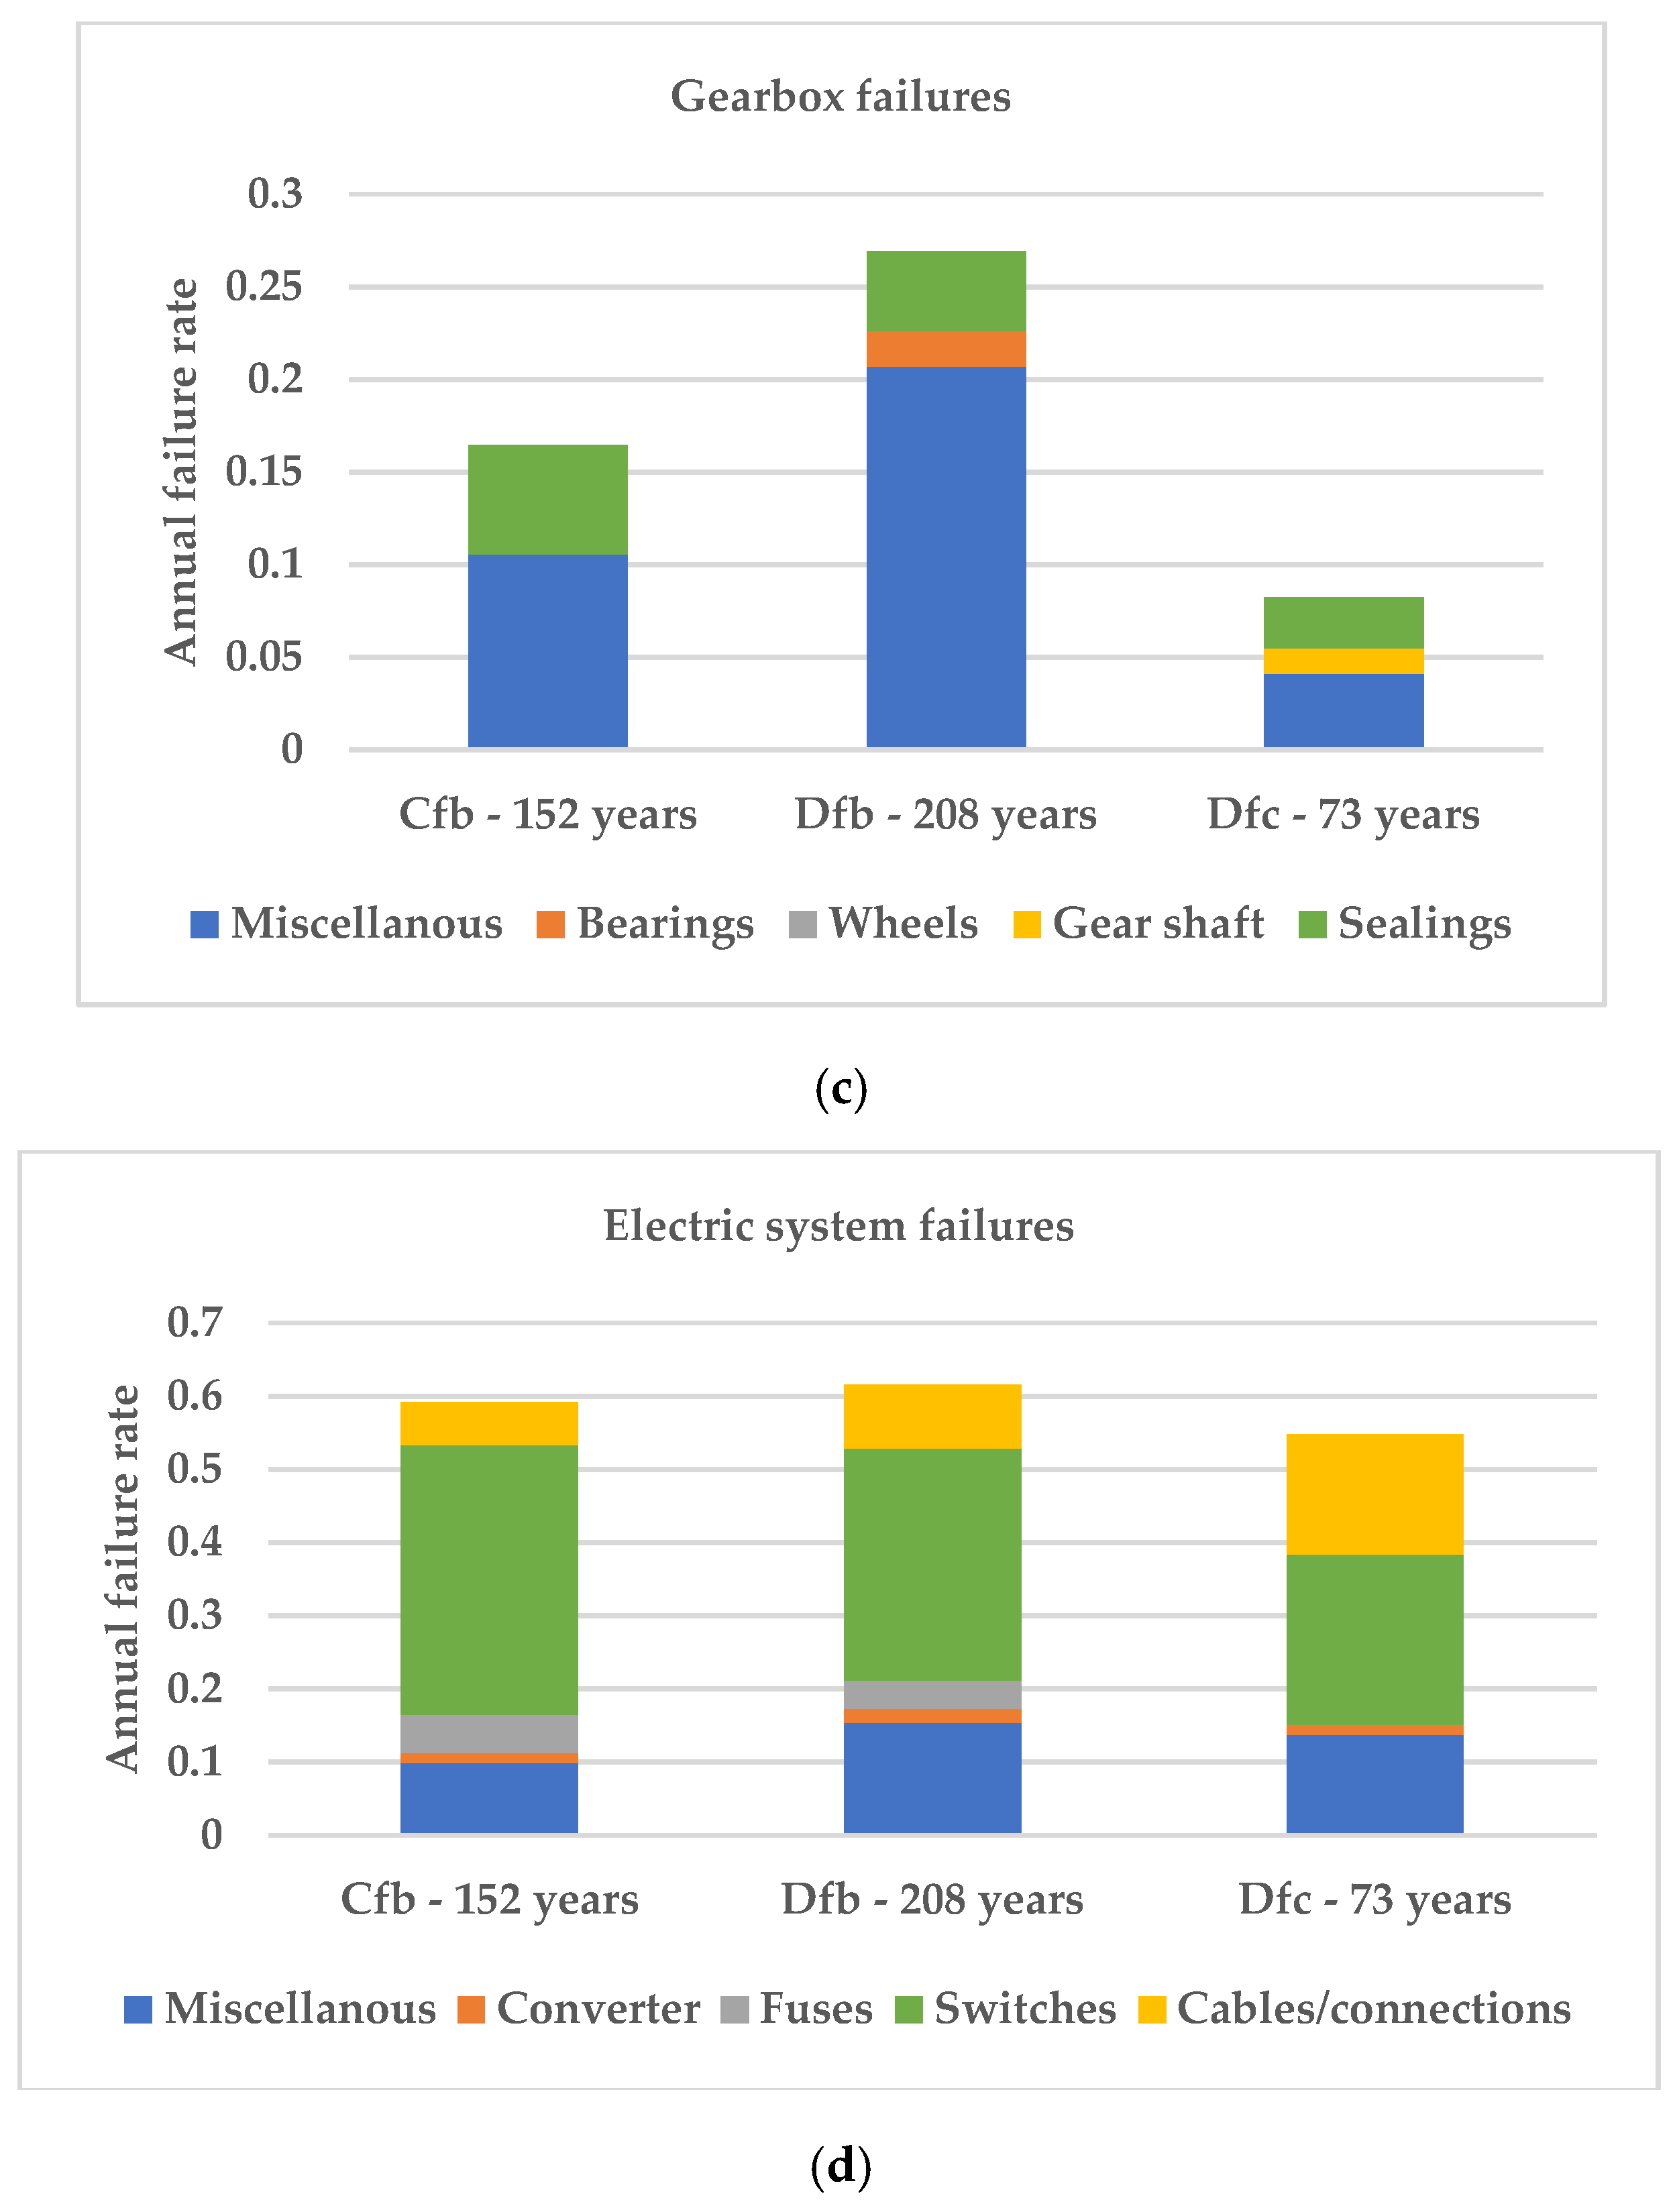
3.2. FMECA Results Considering Climatic Regions

Table 6 shows the results of downtime and cost criticality values for every subsystem of wind turbines considering their climatic regions. Cost criticality of a subsystem is calculated using Equations (1)–(4). Downtime criticality is calculated by multiplying downtime per failure and annual failure rate per subsystem as in Equation (5).
As shown in Table 6 the downtime criticality of subsystems differs depending on the climatic regions. Generator, electric system and control system have higher downtime criticality in Cfb, sensors and gearboxes have higher downtime criticality in Dfb, whereas rotor blades and electric system have much higher downtime criticality in the climatic region Dfc compared to the other subsystems.
There is no common cost critical subsystem for wind turbines among different climatic regions as it can be seen from Table 6. Electric systems and gearboxes are the most critical subsystems for Cfb and Dfb, whereas rotor blades are the most cost critical subsystem in climatic region Dfc.
Although structural parts and housing cost criticality shows a significant value in Dfb since the replacement cost imposes a total replacement of tower, foundations and nacelle which is not in the case in the WMEP database, it is ignored for this study. The main cause for all failures of components of three critical subsystems is component wear or failure, and the associated effect is wind turbine stoppage.
Blade shells are the most affected component by climatic conditions in the rotor blade subsystem as it can be inferred from Figure 4. The climatic region impact is observed in the shares of causes and effects on the components of rotor blades. Loosening of parts are the second major cause after wear of blade components in Cfb whereas lightning is the biggest major cause for blade shell repairs or replacement in Dfc. Effects of failures in rotor blades are observed to be similar in all climatic regions and being mostly plant stoppage and reduced power.
The most critical components in the generator subsystem are bearings as it can be seen in Figure 4. Wear is the only failure cause in all climatic regions. The significant effect of generator failures is noise, and this is observed in Cfb and Dfb.
Figure 4 shows that miscellaneous gearbox parts are the most affected components in every climatic region, followed by seals in gearbox failures. Wear is the dominant failure cause whereas plant stoppage is the main effect for gearbox in every component. Bearing failures have the noise and vibration effect following plant stoppage predominantly in Dfc climatic region. If it is not the artifact of the data, the reason might be the colder climate with more turbulence that induces more vibration.
The highest failed component in the electric system is switches which in climatic region Cfb have the highest share with 62% of total failures as can be seen in Figure 4. This share is reduced to the minimum 43% in Dfc where cables and connections are the other highly failure components with 30% of the failures. Only 10% of the total failures occurred in cables and connections in Cfb region. The dominant cause is wear in all climatic regions, but the second highest cause vary depending on the region. Lightning and malfunction of control system are the other main failure causes in Cfb whereas grid failure, which has no contributions in Cfb and Dfb, significantly contributes to the failures in climatic region Dfc. However, it should be noted that although grid failures are related with regions they are however not related with climatic effects. Plant stoppage is the main cause after failures in all climatic regions only follower is reduced power with slight shares in the failures of switches only in Dfb and Dfc.

3.3. Direct-Drive and Geared-Drive Reliability and Availability Comparison Controlling the Climatic Region Effect

Figure 5 shows that annual failure rate per subsystem differs between direct-drive and geared-drive wind turbines. Hub, generator, sensors, control system, structural parts and housing subsystems have significantly higher annual failure rates in a 500 kW-direct-drive turbine than a 500 kW-geared-drive wind turbine whereas rotor blades, electric and yaw systems have slightly higher values in the same climatic region. Mechanical brakes and drive trains have slightly higher annual failure rates in the direct-drive turbines than geared-drive turbines, whereas hydraulic systems have a significantly higher value.
Figure 5 also demonstrates that downtime per failures vary with the drive design types of wind turbines. Hub, rotor blades, yaw system, structural parts and housing subsystems have significantly higher downtime per failure in 500 kW direct-drive turbines while generators and hydraulic systems have significantly higher downtime per failure in 500 kW geared-drive wind turbines. Sensors and drive train have slightly higher downtime per failure in direct drive concept whereas electric system, control system and mechanical brake have higher downtime per failure in geared-drive concept.
Furthermore, sensitivity analysis results in Table 7 show that geared-drive capacity change has impacts on downtime per failure values. 200 kW and 500 kW turbine models are the same while 300 kW turbine is another brand. Table 7 shows that the downtime per failure values are significantly higher in 300 kW turbine for gearbox, rotor blades, drive train and yaw system. Gearbox annual failure rates seem to be increased with capacity increase while downtime per failure has no trend. Control system and electric system are the common highest frequently failed subsystems.

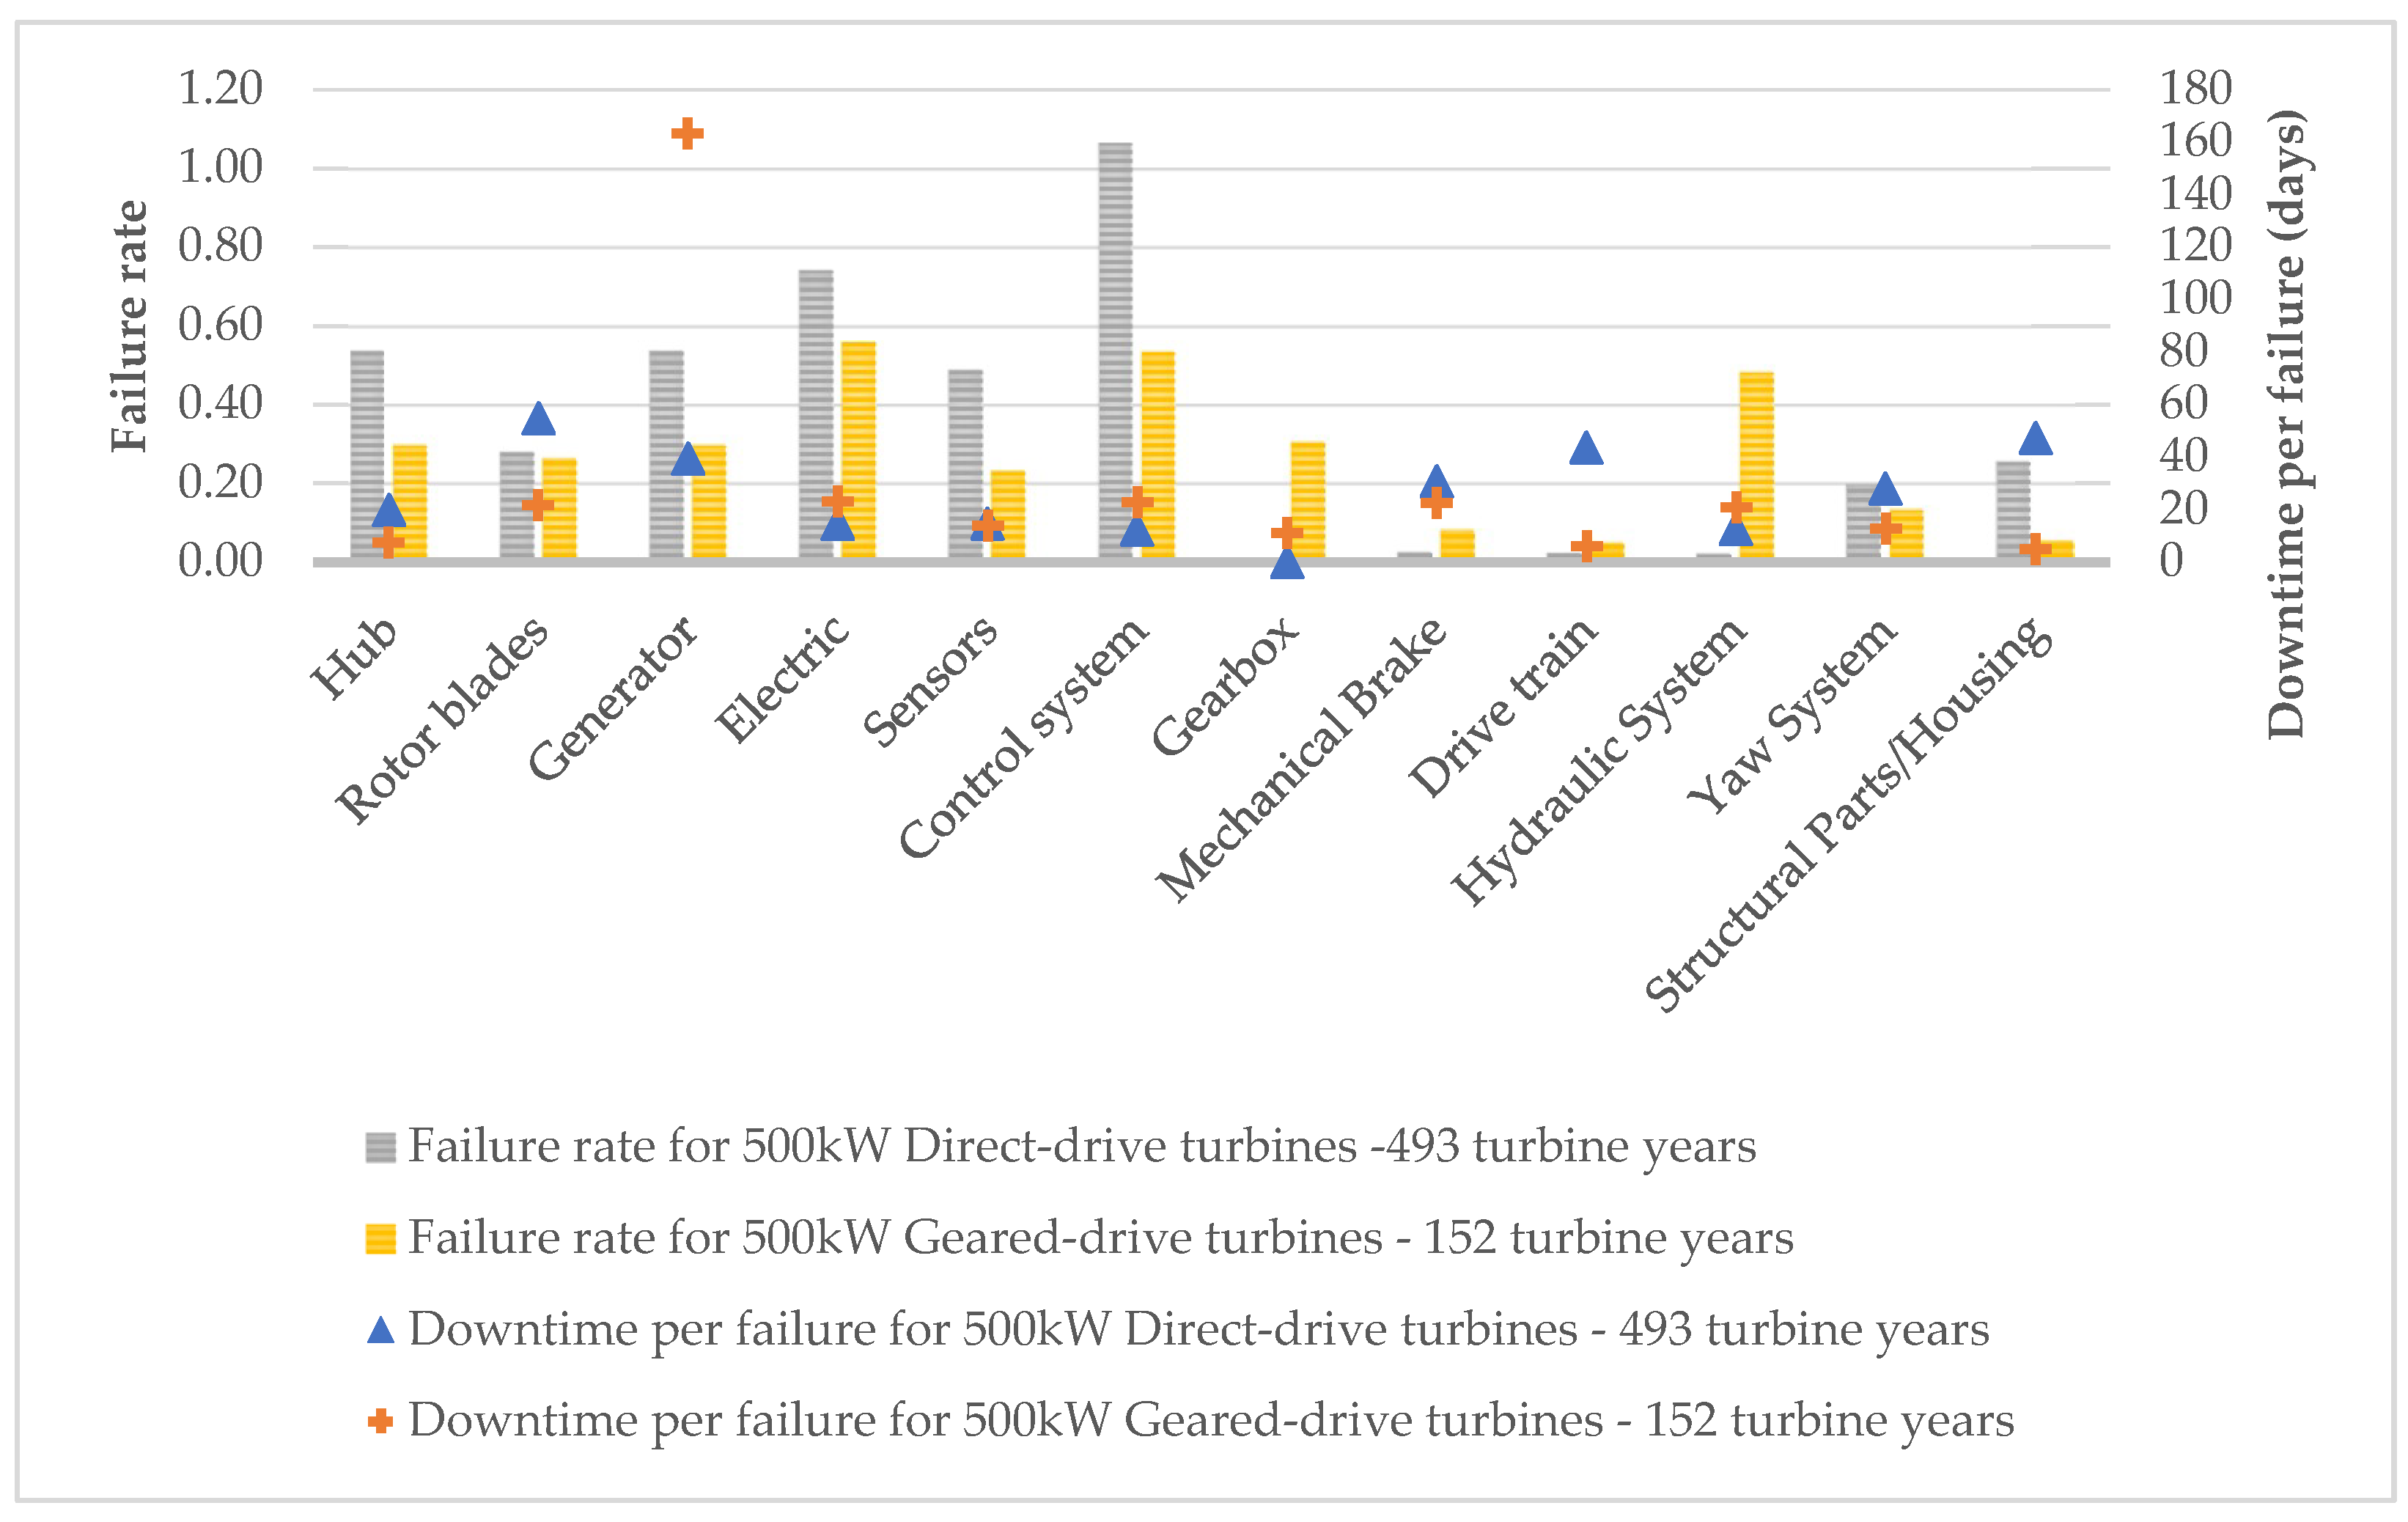
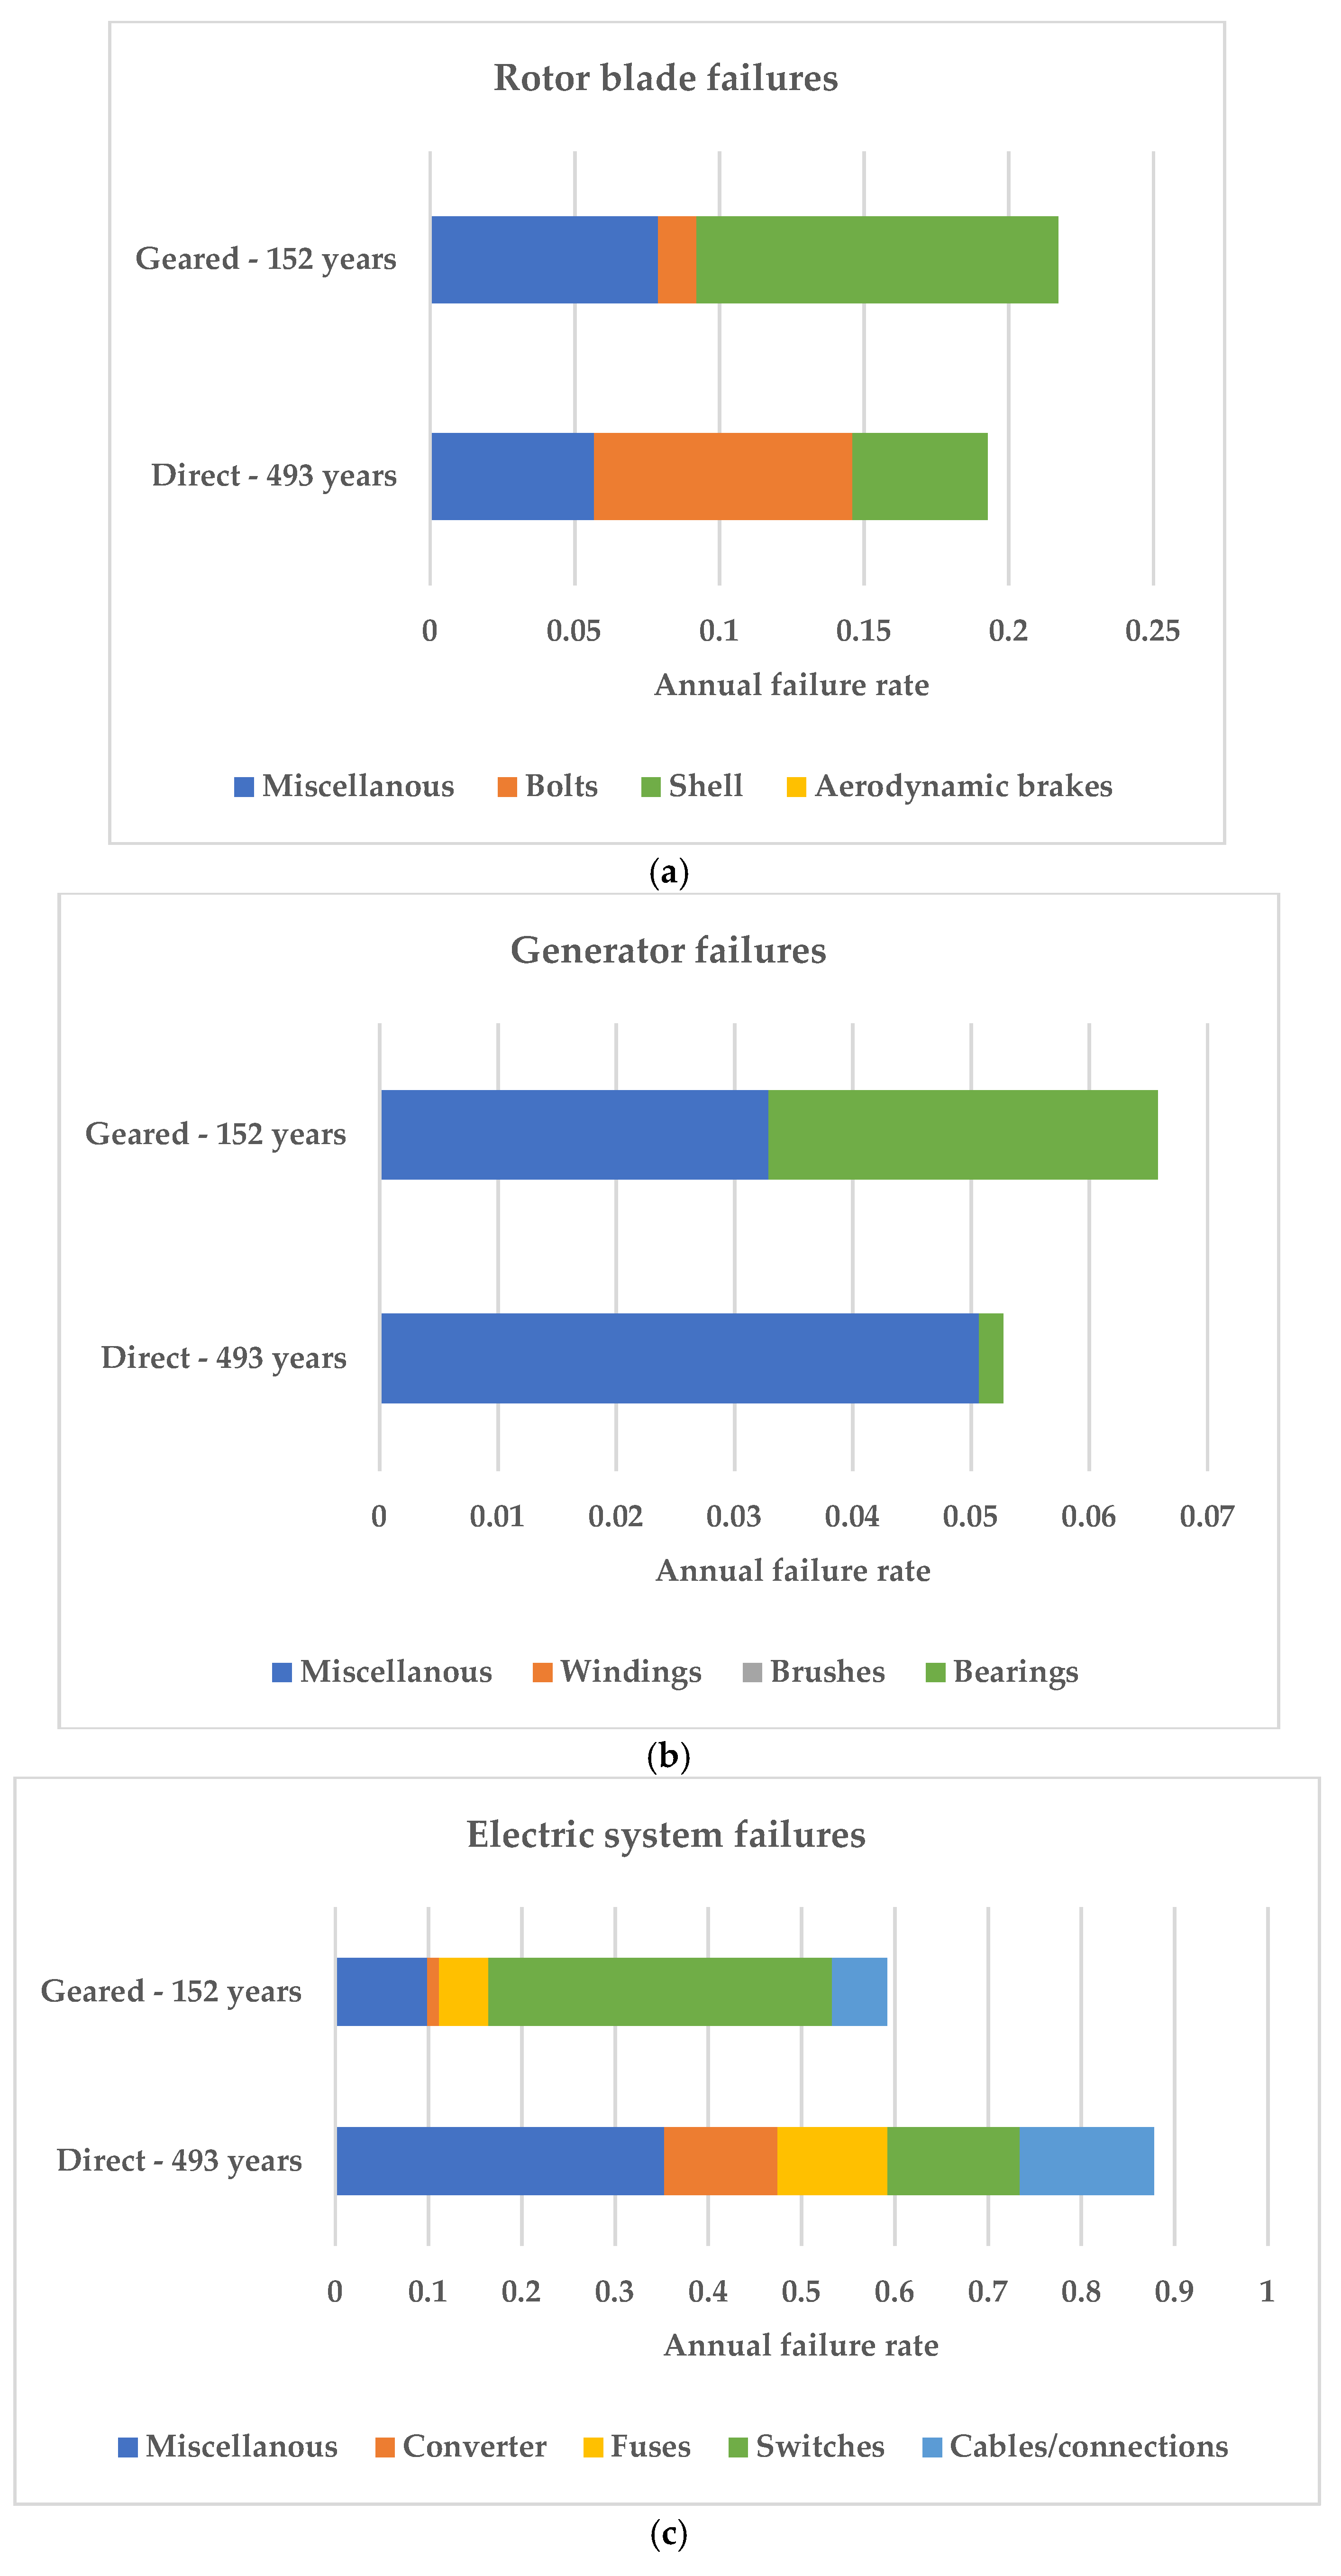
3.4. FMECA Results on Direct-Drive and Geared-Drive Wind Turbines

Table 8 shows that the cost criticality of rotor blades, generator, hub, control system and yaw system are significantly higher in direct-drive concepts. Electric system, generator and gearbox are the most cost critical subsystems in the geared-drive wind turbines while generator and electric system have the highest cost criticality in direct-drive wind turbines. On the other hand, generators show the highest downtime criticality for both turbine types.
The dominant failure cause for direct-drive designed wind turbines for rotor blades is wear whereas loosening of parts, high wind and lightning come into play for geared-drive wind turbines. Blade bolts are the most problematic components in the rotor blade subsystems in the direct-drive turbine model whereas the highest failure rate occurred in blade shells in geared-drive wind turbines, as it can be seen in Figure 6. The effects of the failures vary depending on the gearing concept of the turbines. The dominant effect is the plant stoppage while noise is the second highest for the direct-drive turbines, whereas reduced power is the main effect for geared-drive wind turbines. It can be seen from Figure 6 that generator bearings are where the failures mostly occur in geared-drive wind turbines. It is observed that the dominant failure effect is noise in the generator bearings. In direct-drive designed wind turbines miscellaneous parts in the generator subsystem are observed to be as the most affected parts by failures.
Converters, fuses and switches fail mainly because of the wear or component failure followed by the malfunction of the control system in direct-drive design wind turbines as it is seen in Figure 6, where 62% of the failures occur in switches in a geared-drive wind turbine, while this is reduced to 16% for switches in direct-drive turbine. It is found that lightning is the only different cause other than common causes such as component wear or failure, malfunction of control system, other causes and cause unknown for electric systems in geared-drive wind turbines in this study with 3.3% (three in 90) occurrence whereas there is a 0.7% (three in 433) occurrence of lightning-caused-failures in the electrical systems of direct-drive turbines. All these differences might be attributed to the quality and durability of materials used in these turbines.

4. Discussion

Comparing different wind turbines, the main differences are in generator types of two wind turbine types and namely those having gearbox and those with direct-drive. The rest of the subsystems have same functionality although they might be made of different materials with varying quality. The considered direct-drive wind turbine in this study has a synchronous type generator with 38 rotations per minute (rpm) generating 440 V output whereas the geared-drive wind turbine has an asynchronous generator with 1522 rpm and 690 V output. The total weight of the direct-drive wind turbine is much higher than the geared-drive wind turbine generator, 125 t and 85 t, respectively. Furthermore, electric system, control system, yaw system and hydraulic system might differ in two turbine designs, as well as in general between any turbine models.
Shafiee and Dinmohammadi [10] found the highest criticalities in rotor blades, gearbox, transformer and generator with 5326 €, 4542 €, 1371 € and 1229 € cost criticality numbers for onshore wind turbines, respectively. For offshore wind turbines, cost criticality of rotor blades increased dramatically to 16,831 € and gearbox reached 7831 € which confirms the results from our study that criticality of subsystems can change abruptly in a harsh environment [10]. Kahrobaee and Asgarpoor [12] used a 3 MW direct-drive wind turbine as a case study. The generator was determined as the highest critical subsystem with $14,110 followed by electrical system including converters with $5215 and rotor blades $2541. This represents the similar criticality order for subsystems with our study for a direct-drive turbine where the generator is the highest critical subsystem with $64,865, followed by the electrical system which is $44,461 and rotor hub and rotor blades with $20,646 and $14,569, respectively. The scale of cost criticality values is different than our study that may be attributed to the differences of replacement cost assumptions of the two studies. Tazi et al. [16] found the gearbox, rotor blades, yaw system and electric system including converter with the highest cost criticality numbers of 49,356 €, 45,367 €, 30,811 € and 29,891 €, respectively, ignoring the tower, for 2 and 3 MW wind turbines. We found that electric system, gearbox, generator, rotor blades and rotor hub are the most critical subsystems in a geared-wind turbine with $33,709, $15,788, $13,792 and $12,621 cost criticalities, respectively. In our study, the electric system seems to be an addition into the highest cost critical subsystems mainly because of having higher material and installation cost share in a small-scale turbine like 500 kW than a bigger turbine such as a 2–3 MW turbine. It must be noted that the results for comparison from this study is climatic region-specific. In all previously mentioned studies, it is noted that mechanical brake, hydraulic system and drive train are found to be the lowest critical subsystems. Yaw system, on the other hand, is found to be one of the most critical subsystems in [16] with $30,810, whereas it is found to be low-critical subsystem in [10,12] as well as in our study with 62 €, $586 and $2134, respectively. On the other hand, some studies in the literature used a traditional FMEA metric—RPN to determine criticalities. Dinmohammadi and Shafiee [9] found the gearbox, rotor blades, electric system and generator to be the high criticality subsystems with 105, 105, 90 and 70 RPN values, respectively. Tavner et al. [14] found that drive train as the most critical component with 100 RPN, followed by the gearbox, converter and generator with 30.4, 21.7 and 17.5 RPN values, respectively. It is the only one which found the drive train as the highest critical subsystem in a wind turbine [14]. Bharatbai [15] stated that wind turbine blades, turbine shafts and controller systems are the most critical subsystems with 32, 32 and 24 criticality ratings, respectively. These FMEA results with RPN rankings also support the idea of expecting different results from different types of wind turbines since in different studies reliability data from different types of wind turbines are utilized.
The highest cost critical subsystems agree between our study and studies in the literature which used same approach for cost criticality evaluations [10,12,16]. Slight differences are observed which are presumed to be due to the differences of reference wind turbine sizes, locations and types.

5. Conclusions

This paper aims to control the impacts of weather and turbine type while applying Failure Modes Effects and Criticality Analysis on wind turbines as well as demonstrating the impact of weather and turbine types on FMECA with a case study. The reliability and availability behavior of the wind turbine design in different climatic regions of Germany are investigated and differences determined. FMECA is also applied to compare the criticalities of geared-drive and direct-drive wind turbine subsystems controlling climatic conditions for the first time in the literature. Our findings can be summarized as follows:
  • Considering climatic regions in FMECA revealed differences in failure rate and downtime behaviors of subsystems in the wind turbines that were not reported in the previous studies.
  • Climatic regions have an impact on the critical subsystems and failure causes in wind turbines. This implies that the wind turbine operations and maintenance strategies for subsystems should be arranged taking local climatic conditions of the turbines into account. For example, rotor blade downtimes and failure rates are impacted by colder climates where longer downtime and higher failure rates are observed. Also, lightning became an important failure cause in cold climatic regions for rotor blade failures.
  • In most of the subsystems direct-drive wind turbines seemed to have a higher failure rate than geared-drive wind turbine in the same climatic region. Direct-drive technology would be thought to be an ideal design for offshore applications because of its less complexity, however this study shows opposite. To come to a solid conclusion though, this comparison should be done with and extensive data with many different make and models of wind turbines in the future.
The main outcome from the current study is that downtime and cost criticalities of subsystems of wind turbines depend on the locations and types of wind turbines. Wind farm operators should consider location and type of turbine factors for their O&M budget allocation and arrange the maintenance strategies correspondingly. Furthermore, the insurance companies can benefit utilizing climatic regions such as Koppen-Geiger to evaluate and classify the risk of turbine subsystems. Although this study is limited to 1989–2008 data, the proposed methodology and lessons from this study are expected to be applicable globally. Further research would include relatively newer wind turbines which spread on a geographic area with many different climatic regions along with failure data to better improve our understanding on distinguishing climatic regions effect on FMECA for wind turbines.

Author Contributions

S.O., V.F. and S.F. defined the research question and structured the paper. S.O. analyzed the data, performed the literature research and wrote the paper. V.F. and S.F. supervised the work and reviewed the paper.

Funding

This research was funded by Ministry of Education of Republic of Turkey. The research work of Fraunhofer IEE for this paper was funded by the German Federal Ministry for Economic Affairs (BMWi) through the WInD-Pool (grant No. 0324031A) project.

Conflicts of Interest

The authors declare no conflict of interest.

References

  1. GWEC (2017). Global Wind Report 2016—Annual Market Update. Available online: http://gwec.net/publications/global-wind-report-2/global-wind-report-2016// (accessed on 3 March 2018).
  2. IEC 60050-192:2018. International Electrotechnical Vocabulary—Part 192: Reliability. Available online: http://www.electropedia.org/iev/iev.nsf/display?openform&ievref=192-01-24 (accessed on 15 June 2018).
  3. IEC 60050-192:2018. International Electrotechnical Vocabulary—Part 192: Availability. Available online: http://www.electropedia.org/iev/iev.nsf/display?openform&ievref=192-01-23 (accessed on 15 June 2018).
  4. Teng, S.-H.; Ho, S.-Y. Failure Mode and Effects Analysis an Integrated Approach for Product Design and Process Control. Int. J. Qual. Reliab. Manag. 1996, 13, 8–26. [Google Scholar] [CrossRef]
  5. Andrawus, J.A.; Watson, J.; Kishk, M.; Adam, A. The Selection of a Suitable Maintenance Strategy for Wind Turbines. Wind Eng. 2006, 30, 471–486. [Google Scholar] [CrossRef] [Green Version]
  6. Arabian-Hoseynabadi, H.; Oraee, H.; Tavner, P.J. Failure Modes and Effects Analysis (FMEA) for Wind Turbines. Int. J. Electr. Power Energy Syst. 2010, 32, 817–824. [Google Scholar] [CrossRef] [Green Version]
  7. Das, M.K.; Panja, S.C.; Chowdhury, S.; Chowdhury, S.P.; Elombo, A.I. Expert-Based FMEA of Wind Turbine System. In Proceedings of the 2011 IEEE International Conference on Industrial Engineering and Engineering Management, Singapore, 6–9 December 2011. [Google Scholar]
  8. Fischer, K.; Besnard, F.; Bertling, L. Reliability-Centered Maintenance for Wind Turbines Based on Statistical Analysis and Practical Experience. IEEE Trans. Energy Convers. 2012, 27, 184–195. [Google Scholar] [CrossRef]
  9. Dinmohammadi, F.; Shafiee, M. A fuzzy-FMEA risk assessment approach for offshore wind turbines. Int. J. Progn. Health Manag. 2013, 4, 59–68. [Google Scholar]
  10. Shafiee, M.; Fateme, D. An FMEA-Based Risk Assessment Approach for Wind Turbine Systems: A Comparative Study of Onshore and Offshore. Energies 2014, 7, 619–642. [Google Scholar] [CrossRef] [Green Version]
  11. Sinha, Y.; Steel, J.A. A Progressive Study into Offshore Wind Farm Maintenance Optimisation Using Risk Based Failure Analysis. Renew. Sustain. Energy Rev. 2015, 42, 735–742. [Google Scholar] [CrossRef]
  12. Kahrobaee, S.; Asgarpoor, S. Risk-Based Failure Mode and Effect Analysis for Wind Turbines (RB-FMEA). 2011 N. Am. Power Symp. 2011, 1–7. [Google Scholar] [CrossRef]
  13. Sheng, S.; Paul, V. Wind Turbine Drivetrain Condition Monitoring—An Overview. Available online: https://www.researchgate.net/profile/Shuangwen_Sheng/publication/255247583_Wind_Turbine_Drivetrain_Condition_Monitoring_-_An_Overview/links/545a4ec50cf25c508c307c63.pdf (accessed on 29 July 2018).
  14. Tavner, P.J.; Higgins, A.; Arabian, H.; Long, H.; Feng, Y. Using an FMEA Method to Compare Prospective Wind Turbine Design Reliabilities. In Proceedings of the European Wind Energy Conference, Warsaw, Poland, 20–23 April 2010. [Google Scholar]
  15. Bharatbhai, M.G. Failure mode and effect analysis of repower 5 MW wind turbine. Int. J. Adv. Res. Eng. Sci. Technol. 2015, 2, 2393–9877. [Google Scholar]
  16. Tazi, N.; Châtelet, E.; Bouzidi, Y. Using a Hybrid Cost-FMEA Analysis for Wind Turbine Reliability Analysis. Energies 2017, 10, 276. [Google Scholar] [CrossRef]
  17. Karyotakis, A. On the Optimization of Operation and Maintenance Strategies for Offshore Wind Farms. Ph.D. Thesis, Department of Mechanical Engineering, University College London, London, UK, 2011. [Google Scholar]
  18. Besnard, F. On Maintenance Optimization for Offshore Wind Farms. Ph.D. Thesis, Chalmers University of Technology, Gothenburg, Sweden, 2013. [Google Scholar]
  19. Shafiee, M.; Patriksson, M.; Strömberg, A.-B.; Bertling, L. A Redundancy Optimization Model Applied to Offshore Wind Turbine Power Converters. In Proceedings of the IEEE PowerTech Conference, Grenoble, France, 16–20 June 2013. [Google Scholar] [CrossRef]
  20. Estimation of Turbine Reliability Figures within the DOWEC Project. Available online: https://www.ecn.nl/fileadmin/ecn/units/wind/docs/dowec/10048_004.pdf (accessed on 7 June 2018).
  21. Faulstich, S.; Lyding, P.; Hahn, B. Electrical components of wind turbines, a substantial risk for the availability. In Proceedings of the European Wind Energy Conference and Exhibition (EWEC), Warsaw, Poland, 20–23 April 2010. [Google Scholar]
  22. Vindkraft. Available online: http://vindstat.com/files/M%C3%A5nadsrapport-201606.pdf (accessed on 7 June 2018).
  23. Stenberg, A. Analys av Vindkraftsstatistik i Finland (Wind Turbine Analysis in Finland). Available online: http://www.vtt.fi/files/projects/windenergystatistics/diplomarbete.pdf (accessed on 6 June 2018).
  24. Herman, K.; Walker, R.; Winikson, M. Availability Trends Observed at Operational Wind Farms. In Proceedings of the European Wind Energy Conference & Exhibition (EWEC) 2008, Brussels, Belgium, 31 March–3 April 2008. [Google Scholar]
  25. Tavner, P.J.; Greenwood, D.M.; Whittle, M.W.G.; Gindele, R.; Faulstich, S.; Hahn, B. Study of Weather and Location Effects on Wind Turbine Failure Rates. Wind Energy 2013, 16, 175–187. [Google Scholar] [CrossRef]
  26. Slimacek, V.; Lindqvist, B.H. Reliability of Wind Turbines Modeled by a Poisson Process with Covariates, Unobserved Heterogeneity and Seasonality. Wind Energy 2016, 19, 1991–2002. [Google Scholar] [CrossRef]
  27. Reder, M.; Yürüşen, N.Y.; Melero, J.J. Data-Driven Learning Framework for Associating Weather Conditions and Wind Turbine Failures. Reliab. Eng. Syst. Saf. 2018, 169, 554–569. [Google Scholar] [CrossRef]
  28. Chou, J.-S.; Chiu, C.-K.; Huang, I.-K.; Chi, K.-N. Failure Analysis of Wind Turbine Blade under Critical Wind Loads. Eng. Fail. Anal. 2013, 27, 99–118. [Google Scholar] [CrossRef]
  29. Pinar Pérez, J.M.; García Márquez, F.P.; Tobias, A.; Papaelias, M. Wind Turbine Reliability Analysis. Renew. Sustain. Energy Rev. 2013, 23, 463–472. [Google Scholar] [CrossRef]
  30. Peel, M.C.; Finlayson, B.L.; Mcmahon, T.A. Updated World Map of the Koppen-Geiger Climate Classification. Hydrol. Earth Syst. Sci. Discus. 2007, 4, 439–473. [Google Scholar] [CrossRef]
  31. Pfaffel, S.; Faulstich, S.; Rohrig, K. Performance and Reliability of Wind Turbines: A Review. Energies 2017, 10, 1904. [Google Scholar] [CrossRef]
  32. Faulstich, S.; Hahn, B.; Tavner, P.J. Wind Turbine Downtime and Its Importance for Offshore Deployment. Wind Energy 2011, 14, 327–337. [Google Scholar] [CrossRef]
  33. Andrawus, J. Maintenance Optimization for Wind Turbines. Ph.D. Thesis, Robert Gordon University, Aberdeen, UK, 2008. [Google Scholar]
  34. Amirat, Y.; Benbouzid, M.E.H.; Al-Ahmar, E.; Bensaker, B.; Turri, S. A Brief Status on Condition Monitoring and Fault Diagnosis in Wind Energy Conversion Systems. Renew. Sustain. Energy Rev. 2009, 13, 2629–2636. [Google Scholar] [CrossRef] [Green Version]
  35. Tchakoua, P.; Wamkeue, R.; Ouhrouche, M.; Slaoui-Hasnaoui, F.; Tameghe, T.A.; Ekemb, G. Wind Turbine Condition Monitoring: State-of-the-Art Review, New Trends, and Future Challenges. Energies 2014, 7, 2595–2630. [Google Scholar] [CrossRef] [Green Version]
  36. Wind Turbine Design Cost and Scaling Model. Available online: http://citeseerx.ist.psu.edu/viewdoc/download?doi=10.1.1.581.6248&rep=rep1&type=pdf (accessed on 18 August 2018).
  37. Poore, R.; Watford, C. Development of an Operations and Maintenance Cost Model to Identify Cost of Energy Savings for Low Wind Speed Turbines; National Renewable Energy Laboratory (NREL): Albuquerque, NM, USA, 2008. [Google Scholar]
Figure 1. Map of the 575 wind turbines (black dots) in different climatic regions in Germany (This image is 394 pixels × 556 pixels).
Energies 11 02317 g001
Figure 2. Averaged failure rate and downtime per failure values for subsystems of one 500-kW geared-drive wind turbine model with 40 m tower height in different climatic regions (FR: Failure rate, DT: downtime).
Energies 11 02317 g002
Figure 3. Annual failure rate and downtime per failure values of subsystems of 500-kW geared-drive wind turbine model with 40 m tower height in different climatic regions.
Energies 11 02317 g003
Figure 4. Distribution of failure rates in components of the most critical subsystems which are mentioned in Table 3 based on climatic regions. (a) Rotor blade failures (b) Generator failures (c) Gearbox failures (d) Electric system failures.
Energies 11 02317 g004aEnergies 11 02317 g004b
Figure 5. Annual failure rate per subsystems comparison for direct-drive and geared-drive concept wind turbines.
Energies 11 02317 g005
Figure 6. Distribution of failure rates in the components of the common critical subsystems which are mentioned in Table 3 in geared and direct-drive wind turbines. (a) Rotor blade failures (b) Generator failures (c) Electric system failures.
Energies 11 02317 g006
Table 1. Criteria for the climatic region classifications for Germany.
1st2nd3rdDescriptionCriteria
C--TemperateThot ≥ 10 & 0 < Tcold < 18
-s-- Dry SummerPsdry < 40 & Psdry < Pwwet/3
-w-- Dry WinterPwdry < Pswet/10
-f-- Without dry seasonNot (Cs) or (Cw)
--a- Hot SummerThot ≥ 22
--b- Warm SummerNot (a) & Tmon10 ≥ 4
--c- Cold SummerNot (a or b) & 1 ≤ Tmon10 < 4
D--ColdThot ≥ 10 & Tcold ≤ 0
-s-- Dry SummerPsdry < 40 & Psdry < Pwwet/3
-w-- Dry WinterPwdry < Pswet/10
-f-- Without dry seasonNot (Ds) or (Dw)
--a- Hot SummerThot ≥ 22
--b- Warm SummerNot (a) & Tmon10 ≥ 4
--c- Cold SummerNot (a, b or d)
--d- Very Cold WinterNot (a or b) & Tcold < –38
Note: Thot = temperature of the hottest month, Tcold = temperature of the coldest month, Tmon10 = number of months where the temperature is above 10, Pdry = precipitation of the driest month, Psdry = precipitation of the driest month in summer, Pwdry = precipitation of the driest month in winter, Pswet = precipitation of the wettest month in summer, Pwwet = precipitation of the wettest month in winter.
Table 2. Selected wind turbines from WMEP database for this study.
SpecificationsDirect-Drive WTsGeared-Drive WTsControl Group of WTs (Geared-Drive)
AllCfbDfbDfc
Number of WTs48153915186
Operation Years493 turbine-years152 turbine-years43215220873
Capacity500 kW500 kW500 kW
Rotor Diameter40 m39 m39 m
Cut-in/Cut-out Wind Speed2.5 m/s–25 m/s4 m/s–25 m/s4 m/s–25 m/s
Generator Type/SpeedSynchronous/38 rpmAsynchronous/1522 rpmAsynchronous/1522 rpm
Rotor Speed38 rpm30 rpm30 rpm
Blade MaterialGFK/EpoxyGFK/EpoxyGFK/Epoxy
Table 3. Subsystems and assemblies of wind turbines.
Subsystems of Wind TurbinesComponents of Wind Turbines
HubHub body, pitch mechanism, pitch bearings
StructureFoundations, tower/tower bolts, nacelle frame, nacelle cover and ladder
Rotor BladesBlade bolts, blade shell and aerodynamic brakes
Mechanical BrakeBrake disc, brake pads and brake shoe
Drive TrainRotor bearings, drive shafts and couplings
GearboxBearings, wheels, gear shaft and sealings
GeneratorGenerator windings, generator brushes and bearings
Yaw SystemYaw bearings, yaw motor, wheels and pinions
SensorsAnemometer/wind vane, vibration switch, temperature, oil pressure switch, power sensor and revolution counter
Hydraulic SystemHydraulic pump, pump motor, valves and hydraulic pipes/hoses
Electrical SystemConverter, fuses, switches and cables/connections
Control SystemElectronic control unit, relay, measurement cables and connections
Table 4. Locations, causes and effects of the failure which are included in WMEP database.
Failure LocationsFailure CausesFailure Effects
Structures FailuresHigh windOverspeed
Rotor Blade FailuresGrid failureOverload
Mechanical Brake FailuresLightningNoise
Drive Train FailuresIcingVibration
Gearbox FailuresMalfunction of control systemReduced power
Generator FailuresComponent wear or failureCausing follow-up damage
Yaw System FailuresLoosening of partsPlant stoppage
Sensor FailuresOther causesOther consequences
Hydraulic System FailuresCause unknown-
Electrical System Failures--
Control System Failures--
Hub Failures--
Table 5. An example of calculation of CCN and DCN.
SubsystemReplacement Cost $ [36,37]AFRDowntime per FailureCost of Lost Energy ProductionCCN ($)DCN (h)
Rotor blades47,5840.26220.33 × 500 × 22 × 0.26 × 0.12 = $11247,584 × 0.26 + 112 = $12,62122 × 0.26 = 6 h
Table 6. Downtime and cost criticality comparison based on climatic regions.
SubsystemsDowntime Criticality Number (h)Cost Criticality Number ($)
Average (432 Turbine Years)Cfb (152 Turbine Years)Dfb (207 Turbine Years)Dfc (73 Turbine Years)Replacement Cost ($) [36,37]Average (432)Cfb (152)Dfb (207)Dfc (73)
Hub324238,27110,20511,38811,5353236
Rotor blades8624447,58412,05212,621836521,958
Generator234841243,29811,93913,79213,0333860
Electric1613103959,80433,30733,70933,30732,274
Sensors9315425,0006429581766397304
Control System9128910,0004796557444923766
Gearbox9316451,75015,55115,78818,4346368
Mechanical Brake721161185251130370150
Drive Train101313,912558645441695
Hydraulic System9109561142573314225261272
Yaw System222115,9002252213424272025
Structural Parts/Housing0010132,25710,987686715,8616664
Table 7. Sensitivity analysis for wind turbine capacities.
SubsystemsDirect-Drive-500Kw (493 Turbine Years)Geared-Drive-200 kW (524 Turbine Years)Geared-Drive-300 kW (508 Turbine Years)Geared-Drive-500 kW (152 Turbine Years)
Annual Failure RateDowntime Per Failure (h)Annual Failure RateDowntime Per Failure (h)Annual Failure RateDowntime Per Failure (h)Annual Failure RateDowntime Per Failure (h)
Hub0.54200.10100.15120.307
Rotor blades0.28550.09160.08750.2622
Generator0.54390.1080.15900.30163
Electric0.74140.32191.15170.5623
Sensors0.49140.05130.30150.2314
Control System1.06120.36160.52200.5323
Gearbox0.0000.09390.151380.3011
Mechanical Brake0.02310.0160.13230.0822
Drive Train0.02430.0360.08520.056
Hydraulic System0.02130.1190.40150.4821
Yaw System0.20280.0980.38280.1313
Structural Parts/Housing0.26470.04160.19260.055
Table 8. Downtime and cost criticality comparison based on drive concept of wind turbines in climatic region Cfb.
SubsystemsDowntime Criticality Number (hours)Cost Criticality Number ($)
500 kW Direct-Drive (493 Turbine Years)500 kW Geared-Drive (152 Turbine Years)Direct Drive Turbine Replacement Cost ($) [36,37]Cost of Lost Energy Production ($)500 kW Direct-Drive (493 Turbine Years)Geared-Drive Turbine Replacement Cost ($) [36,37]Cost of Lost Energy Production ($)500 kW Geared-Drive (152 Turbine Years)
Hub11238,20020820,64638,2714311,388
Rotor blades15651,26230114,56947,58411212,621
Generator2148120,46341664,86543,29895713,792
Electric111359,80421144,46159,80425633,709
Sensors7325,00013912,34325,000635817
Control System131210,00025610,90010,0002405574
Gearbox0313,0970051,7506715,788
Mechanical Brake1211851544118535130
Drive Train1013,9972033813,9125645
Hydraulic System0106114512761141993142
Yaw System5216,260109330515,900332134
Structural Parts/Housing120228,09523858,511132,25756867

