Life Cycle Assessment of a Buoy-Rope-Drum Wave Energy Converter

Department of Mechanical Engineering, Shandong University at Weihai, Weihai 264209, China
*
Authors to whom correspondence should be addressed.
Energies 2018, 11(9), 2432; https://doi.org/10.3390/en11092432
Submission received: 7 August 2018
/
Revised: 6 September 2018
/
Accepted: 10 September 2018
/
Published: 13 September 2018
(This article belongs to the Special Issue Modeling and Simulation of Carbon Emission Related Issues)
Abstract
:This study presents a life cycle assessment (LCA) study for a buoy-rope-drum (BRD) wave energy converter (WEC), so as to understand the environmental performance of the BRD WEC by eco-labeling its life cycle stages and processes. The BRD WEC was developed by a research group at Shandong University (Weihai). The WEC consists of three main functional modules including buoy, generator and mooring modules. The designed rated power capacity is 10 kW. The LCA modeling is based on data collected from actual design, prototype manufacturing, installation and onsite sea test. Life cycle inventory (LCI) analysis and life cycle impact analysis (LCIA) were conducted. The analyses show that the most significant environmental impact contributor is identified to be the manufacturing stage of the BRD WEC due to consumption of energy and materials. Potential improvement approaches are proposed in the discussion. The LCI and LCIA assessment results are then benchmarked with results from reported LCA studies of other WECs, tidal energy converters, as well as offshore wind and solar PV systems. This study presents the energy and carbon intensities and paybacks with 387 kJ/kWh, 89 gCO2/kWh, 26 months and 23 months respectively. The results show that the energy and carbon intensities of the BRD WEC are slightly larger than, however comparable, in comparison with the referenced WECs, tidal, offshore wind and solar PV systems. A sensitivity analysis was carried out by varying the capacity factor from 20–50%. The energy and carbon intensities could reach as much as 968 kJ/kWh and 222 gCO2/kWh respectively while the capacity factor decreasing to 20%. Limitations for this study and scope of future work are discussed in the conclusion.
1. Introduction
Carbon dioxide emissions from electricity generation are a major cause of anthropogenic climate change [1]. Around 30% of the world’s population is currently exposed to climatic conditions exceeding a deadly threshold for at least 20 days a year. By 2100, this percentage is projected to increase to 48% and 74% under scenarios with drastic reductions and no considerable reductions of GHG emissions [2]. Overtaking the United States, China has become the world’s biggest carbon emission contributor since 2007 due to its reliance on fossil fuel. In 2009, China committed to reduce its carbon intensity (CO2 per unit of GDP) by 40% to 45% percent below 2005 levels by 2020. Achieving this ambitious 2020 goal, China will have to further expand its renewable energies’ portion in its power supply structure [3].
Among various renewable energies, marine energy has been believed as one to partially replace conventional fossil fuel energy due to its carbon free electricity production mechanism. In recent years the world has witnessed the emergence of marine energy conversion technologies. Research and development programmes on wave energy extraction have been carried out in many countries, such as USA, Australia, UK, Portugal, Norway and Japan. Thousands of patents were granted on how to absorb wave energy and convert it to electricity or other forms of energy [4]. Since the beginning of the century, tidal stream technology and wave energy technology development have started to ramp up [5]. Although there no large-scale WEC installation has been reported in the U.S., the U.S. Department of Energy sponsored the Wave Energy Prize in 2015, an 18-month public design-build-test competition to increase the diversity of organizations involved in WEC technology development, while motivating and inspiring existing stakeholders [6]. The UK and Portugal have the vast majority of wave energy deployments in Europe [5]. The Carbon Trust estimates that a contribution of up to 20% of total UK energy generation could be provided by marine energy by 2050 [7,8]. China possesses a total marine area of 4,700,000 km2 [9]. With annual mean wave power of up to 7.73 kW/m wave front, China has a wave power potential of 128.5 GW, nearly half of the electricity production of China [10,11]. However, the majority of China’s wave energies are without any exploitation and thus far, most of the WECs in China are still in concept design or pre-commercial stages. Aiming to stimulate and encourage the marine renewable energy technology research and development, China National Oceanic Administration set up the Specific Fund for Marine Renewable Energies in 2010. Sponsored by this specific funding, quite a few new WECs have been invented, prototyped and sea tested. Representative systems of these WECs include 100 kW Sharp Eagle by Guangzhou Institute of Energy Conversion, 120 kW oscillating Buoy WEC by Shandong University, 300 kW floating hydromantic WEC device Hailong I, etc. Most of these Chinese WECs are still in their early stages under research and development and are not ready for commercial scale production.
On the other hand, marine energy extraction technology is still at its infancy stage as wave energy conversion has been proven to be difficult [12]. In spite of decades of research and thousands of patents there is still no consensus on the best way to harness the energy of ocean waves [13]. In this context, efforts for current wave conversion technologies’ research and development are still focused on the concept optimization and efficiency improvement, as well as reliability enhancement. These technologies have not emphasized much on the WECs’ life cycle environmental performance improvement. Although new technologies of marine energy conversion are constantly emerging, only few full LCAs have been carried out and reported [14]. None of these studies are based on devices developed in China.
Up to 2016, only a few LCA case studies reported the energy and carbon intensities of wave and tidal energy devices. Most among those studies have looked only at energy and carbon as impact categories [8,15,16]. Douglas et al. in the LCA study of Seagen, the world’s first commercial-scale grid-connected tidal current energy installation, reported the energy and carbon intensities with 214 kJ/kWh and 15 gCO2/kWh. The energy payback period is approximately 14 months and the CO2 payback is around 8 months [15]. LCA studies for Pelamis WEC conducted by Parker et al. in 2007 and Thomson et al. in 2011 demonstrate the Pelamis’ energy and carbon intensities with 293 kJ/kWh and 22.8 g CO2/kWh [8]. Thomson et al. expanded this analysis by covering more environmental impacts, demonstrating the same energy intensity of 293 kJ/kWh, and a justified carbon intensity of 23 gCO2/kWh [8,14]. The estimated energy and carbon payback periods are approximately 20 months and 13 months, respectively [8,14]. Walker et al. and Douziech et al. in their studies compared the life cycle environmental performance of wave and tidal energy plants [16,17]. The studied WEC, Oyster, was reported to have energy and carbon intensities of 236 kJ/kWh and 25 gCO2/kWh, with energy and carbon payback periods of 12 months and 8 months. Claimed to be the first LCA study for tidal current energy devices taking impacts beyond climate change into account, Douziech et al. demonstrated the WEC Oyster800 has on average 3.5 times higher impact than offshore wind power, but eight times lower impact than electricity generated from coal power [17]. Uihlein et al. presented a LCA study to assess the environmental impacts of eight types of WECs and seven types of tidal energy devices. The reported total greenhouse gas emissions of ocean energy devices range from about 15 to 105 gCO2-eq/kWh. Average global warming potential for all device types is 53 ± 29 gCO2-eq/kWh [18].
These pioneering in-depth LCA studies indicate that wave energy conversion have the advantage and potential to become a promising contributor to achieve reduction of energy and carbon intensities from energy sector, by comparison with the high carbon intensity level of typical fossil fuel energy ranging from 400–1000 gCO2/kWh [15,16]. These studies compare wave energy favorably against current renewable energy sources such as wind (8–12 gCO2/kWh), solar PV (~30 gCO2/kWh) and nuclear (~70 gCO2/kWh) [16]. As per these studies, the WEC environmental impacts are closely linked to material inputs and are caused mainly by structural components and mooring foundations; while impacts from assembly, installation and use are insignificant for all device types [8,13,18]. Possible improvement to reduce WECs’ entire life cycle environmental impact, especially energy and carbon intensity, can be achieved by using more environmentally sustainable materials for the structural components, utilizing more fuel-efficient transportation, as well as reducing the shipping associated with maintenance [8,13].
The purpose of this work is to increase the knowledge of life cycle environmental performance of wave energy conversion technologies and identify high environmental impact stages and processes for future system development and improvement. While marine energy sources are carbon-free, there are indirect GHG emissions related to the manufacturing, operation, and maintenance as well as decommissioning of generators and other system components. Detail understanding of the life cycle impacts of WECs is important for future developments of the WEC system and environmental impact evaluation for technology maturating and commercializing. In this study, the life cycle of a BRD WEC is analytically modeled using SimaPro v 8.3.0.0, a widely used LCA software developed by PRé Consultants (Amersfoort, The Netherlands). The life cycle of the BRD WEC consists of stages such as materials extraction, manufacture and assembly, installation, operations and maintenance (O&M), decommissioning and recycling. The LCI and LCIA analyses are performed for the BRD WEC device to identify significant energy and carbon intensity and environmental impact contributing stages and processes. In order to comprehensively understand its environmental impacts beyond energy and carbon, the ReCiPe Midpoint method is applied to cover as wide range of environmental impacts. The LCI and LCIA results are benchmarked with reported pioneering LCA studies of other WECs, tidal, offshore wind and solar PV systems.
2. Method
2.1. BRD WEC Structural Breakdown
The studied BRD WEC system was designed by a research group of Shandong University (Weihai). The prototype device has been manufactured, deployed offshore and sea tested. The first stage of the project has been fully conducted and completed. With additional financial support by National Marine Renewable Energy Specific Fund, the research group has been focusing on the efficiency improvement and partial redesign of its structural components. As illustrated in Figure 1, the BRD WEC consists of such modules as buoy, generator and mooring modules. A rope with its lower end connected to a gravity anchor on the seabed is attached and wound around the drum of the generator casing through the rope guide. The wave energy extraction and energy conversion mechanism consists of two primary strokes. As shown in Figure 1a, buoy heaves upward due to coming wave’s pushing; the drum rotates by pulling force from the rope; the coaxial permanent magnet rotates around the stator winding to generate alternating current which will supply power for the resistive load. During this stroke, wave energy is extracted and converted to elastic potential energy and stored by the coiled spring and mechanical kinetic energy of the drum, and then converted to electrical energy generated through the rotation of the coaxial rotator.
Figure 1b shows that, when the buoy heaves downward when waves coming off, the built in coiled spring will reposition the drum by releasing its elastic potential energy and winding the rope back to its initial position. During this stroke, with an overrunning clutch installed between the drum and magnetic steel casing, the magnetic steel casing does not rotate when the drum rotates backward, and the buoyant hull does not generate power during falling [19]. Figure 1c,d show the deployment and in situ status of the prototype BRD WEC at offshore.
2.2. LCA Goal and Scope for BRD WEC
The aim of this LCA study is to analyze the environmental performance of the BRD WEC over its entire life cycle, identify stages and processes with significant environmental impacts, suggest environmental improvement approaches, as well as benchmark its environmental performance with reported LCA studies of other renewable energy systems.
Functional unit is normally defined as the marine energy system itself in existing LCA studies for marine tidal and wave energy systems [16,20,21]. Nevertheless, it is sometimes defined as 1 kWh produced electricity delivered to grid by the marine energy power system, so as to compare its environmental impacts with other renewable energies [13,16,17,18,21]. As the designed BRD WEC will be primarily used for electricity supply for navigation buoys and small islands rather than delivering electricity to the grid on mainland, the functional unit of this LCA study is thus defined as the entire BRD WEC system during its service lifespan of 20 years.
As illustrated in Figure 2, the system boundary encompasses all the materials and processes through the BRD WEC life cycle, including raw materials extraction and manufacturing, component manufacturing, module production, system assembly, installation, O&M, decommissioning and recycling. Physically, the system boundary excludes small mechanical components used for upstream module and system assembly as well as downstream maintenance (repairs and replacement), such as bolts, nuts and studs, which account for negligible portion of weight and minimal environmental impacts. For this LCA model, materials include the entire raw material extraction and processing. Manufacturing and assembly include materials and processes for the components manufacturing, module assembly through to the WEC system assembly. Installation primarily includes the transportation to ship the assembled system to the installation location at sea, as well as energy and materials consumption. O&M includes energy and materials consumption and component replacement associated with materials and energy used within the O&M during the service life span of the WEC. O&M also includes the transportation of replacement material and disposal of demolished materials. Decommissioning and recycling includes energy and emissions related to the disassembly process as well as recycling or disposal of materials. Related transportation at the end of the life cycle is included as well. The end of life (EoL) includes materials to be recycled and reused to avoid raw materials extraction. Due to the fact that there has no industrial practice of WEC system decommissioning and recycling or disposal [8,18], here it is assumed that majority of metals will be recycled; the gravity anchors and chains will remain in the seabed and reused for subsequent WEC anchoring; and other materials will be sent to either landfill or incineration.
The ReCiPe method is applied for the LCIA at a midpoint level, so as to examine as much wide range of environmental impacts of the BRD WEC beyond energy and carbon intensities. The environmental impacts of materials, energy consumptions as well as emissions are evaluated for each life cycle stage.
2.3. Inventory Analysis of BRD WEC
2.3.1. Inventory Analysis of Raw Material Extractions
A LCI is conducted by following the flow chart in Figure 2, according to the system boundary definition, including all stages associated with primary materials and unit processes. Embodied energy and emissions of raw materials acquisition and manufacturing are based on the normalized values by Ecoinvent 3 database and published LCA studies [8,21,22]. The materials and processes inputs are listed in Table 1.
2.3.2. Inventory Analysis of Manufacturing, Assembly and Installation
The buoy structure is designed to be made of 10,467 kg of carbon steel, while 640 kg of polyurethane foam equipped in void spaces in the buoy structure to provide protection by absorbing and reservoiring flooded sea water in case of local structural damage and failure. A total amount of 63 kg of alkyd paint is applied to both inside and outside surfaces of the buoy structure so as to provide antifouling and as anticorrosive protection. Zinc blocks are applied as a cathodic protection mechanism to provide additional anticorrosive protection for the submerged steel structural components. Primary processes include arc welding, painting and transportation in between manufacturing plants in different locations in Shandong to the installation location 2 km off the shore at Weihai, Shandong.
The generator module contains two identical 5 kW generators made of 2056 kg of electrical steel, 171 kg of copper windings and a 75 kg neodymium magnet. The primary process is the machining and arc welding for the generator manufacturing. Other processes such as wire drawing and transportation from manufacturing plant in Tai’an to the assembly plant in Zibo are also taken into consideration. Since the input data of electrical steel is not available in the Ecoinvent database, here the data from [21] is used for the inventory input. Input data of machining is referenced from [8,22].
The mooring module contains four gravity anchors and three steel mooring chains. Each mooring chain connects the buoy structure with one gravity anchor sitting in the seabed touchdown site. The lower end of the rope is fixed on the 4th gravity anchor and the upper end is connected to the drum. The gravity anchors are made of square shaped concrete block in a local concrete factory. The mooring chains are made of steel and manufactured in a mooring manufacturing facility in Qingdao. The process of transportation from Qingdao to the WEC installation location is included in the analysis. Another included process is the steel casting of chain links. The distances taken into account in this study are listed in Table 2.
2.3.3. Inventory Analysis of O&M
The BRD WEC does not consume energy and produces negligible amount of emissions during its electricity production. The use and maintenance connected with energy and emissions are mainly from replacements and routine inspection caused material consumption and transportations. Here two assumptions are made: one is that routine inspections are planned at an annual basis; the other is that the entire BRD WEC system’s structural integrity is well maintained with no need of major repairs and replacements. In this case, only the transportations are taken into consideration for the inventory analysis of the use and maintenance phase. The transportation is modeled as workboat commuting in between the BRD WEC offshore installation site and the onshore maintenance workshop.
2.3.4. Inventory Analysis of EoL and Waste Scenarios
Up to date of the conduction of this study, there has no reported or published disposal or recycling practice of WECs, thus reasonable assumptions have to be made in order for the LCA to be convincing. According to ISO 14040, a credit is given to reduce the total energy and emissions, as the recycling of certain components avoid the extraction of raw materials [8]. Given the level of uncertainty, different recycling rates are taken for modeling by currently existing LCA studies. A recycling rate of 90% was applied for steel recycling [8]. In order to investigate the impacts of including and excluding recycling activities at EoL, a 100% recycling rate for metals and concretes was applied by [13] for the purpose of sensitivity analysis. Another study excluded the disposal or recycling stage because of the unavailability of information [21]. A comprehensive list of recycling or disposal rates regarding the material categories are given in [18].
Here in this study, four EoL routes—recycling, incineration, landfill and reuse—are assumed for the EoL modeling. For offshore steel facilities, current industrial practice suggests a corrosion rate 0.2–0.4 mm/year for offshore steel structures [23]. With the assumption of good protection by the built in zinc sacrificial anodes and anticorrosive coating, here the lower corrosion rate value of 0.2 mm/year was applied for the BRD WEC steel structure corrosion estimation, which results in a 0.75% annual corrosion rate, in terms of steel weight. Due to lack of data for the design life of actual WEC installations, the service life of WECs is usually assumed to be 20–25 years [8,13,15,18,20], in order to set up the temporal coverage for LCA studies. Here in this work a service life of 20 years is assumed considering the structural similarity of this BRD WEC with other WECs and other types of offshore energy systems. The life time corrosion rate of the steel is then calculated to be 15%, which indicates that a remaining 85% of the structural steel is available for recycling at its EoL. As for the mooring module, with the assumption that both the gravity anchors and mooring chains can be well maintained during the WEC’s lifetime, the 85% of mooring module can be left in seabed for reuse for subsequent WEC deployments and fixation. The waste routes at EoL for this study are shown in Table 3.
2.3.5. Uncertainties
There are a few uncertainties for this LCA study due to the lack of available data such as geographical difference, specific technological parameters, alternative materials, as well as assumptions made in this study. Here the geographical difference refers to the actual embodied energy and emissions from materials and manufacturing processes in China versus Europe, as most of the data for input come from Europe cases based database by Ecoinvent. Technological parameters are another group of factors that can have significant impact on the LCA results. For instance, the capacity factor, the generator efficiency, as well as the system reliability among others, are directly related to the input of for the analysis, thus the change of these parameters will directly result in difference of the environmental impacts. As discussed in the LCI and LCIA analysis, consumption of materials is the most significant contributor to the environmental impact of the entire life cycle of the WEC system. Applying alternative materials in any components can have expected impact on the LCA results due to the embodied energy and emission differences in raw material acquisition and manufacturing processes. Assumptions made for this LCA study introduce uncertainties to the analysis results. For instance, the service lifetime, the installation location at sea, the O&M requirements, the recycling rate of wasted materials at EoL, among others, are all important input data which can have impact on the analysis results.
Numerically quantifying of the impacts of these uncertainties on the LCA results can be investigated through the calculation of those interested indicators. Here an example is given by looking into the following calculation formula of embodied energy or carbon intensity as shown below:
where Iem. represents the embodied energy or carbon intensity; Eij is the embodied energy or carbon of the jth material or process in the ith life cycle stage for its unit amount of consumption; Aij is the amount of the jth material or process in the ith life cycle stage; Pins. represents the installed capacity; CFact. is the actual capacity factor; is the system efficiency; Tlc is the design service life of the entire system. From this mathematical expression it can be indicated that any specific parameter as an input for the calculation is not necessarily linearly related with the embodied intensity calculation result. For instance, adopting an alternative material with lower unit embodied energy or emission is not necessarily expected to reduce the system embodied energy or emission intensity because it is possible that at the same time the total amount of material consumption could also be changed, not to mention that the system specs such as capacity factor, efficiency and design life could also be changed due to the new material adoption. In this regard, the final embodied energy or emission is not necessarily reduced with the application of such material with low embodied energy or emission per unit amount. Assuming another case that the O&M related activities are planned with shortened time intervals, the associated with energy and emissions are expected to increase, on the other hand, this enhanced maintenance plan may also lead to the system’s functional life extension beyond its design life, which provides more electricity production. Taking these possibilities into consideration, the above formula gives possibilities for either reduction or increase of energy or carbon intensities.
3. LCA Results
3.1. Life Cycle Inventory of the BRD WEC
The inventory analysis results show that the most significant contribution to the life cycle embodied energy comes from the manufacturing stage of the BRD WEC system, with buoy structure contributing 52.97%, generator contributing 26.77% and mooring contributing 13.12%. It is noted that the contribution of mooring manufacturing is compensated by the reuse of the mooring module after its design life. The EoL and O&M contribute much less to the total energy consumption compared with the manufacturing stage. For the embodied CO2, the largest contributor is also the WEC system manufacturing, with 62.22% of the total embodied CO2. The manufacturing of buoy structure contributes the most with 35.31% which mainly comes from the structural steel consumption, followed by the manufacturing of generator with 21.45% of the total CO2. The embodied CO2 from the generator module manufacturing primarily comes from the consumption of electrical steel and permanent magnet. The EoL disposal of buoy structure contributes 37.42% of total embodied CO2, which is primarily due to the emissions from treatment of the waste polyurethane. The O&M contributes only 0.13% of total embodied energy and 0.15% of total embodied CO2 coming from the transportation for annual inspection activities to maintain the structural and functional integrity of the WEC system during its service life time.
3.2. Life Cycle Impact Assessment Results
3.2.1. Life Cycle Impact Analysis Results
With application of ReCiPe midpoint method, a sum of 18 environmental impact categories are analyzed, including climate change, ozone depletion, terrestrial acidification, freshwater eutrophication, marine eutrophication, human toxicity, photochemical oxidant formation, particulate matter formation, terrestrial ecotoxicity, freshwater ecotoxicity, marine ecotoxicity, ionising radiation, agricultural and occupation, urban land occupation, natural land transformation, water depletion, metal depletion and fossil depletion. The total characterized environmental impacts are presented in Figure 3. Here a few results are highlighted: (1) the manufacturing stage of the WEC system is the most significant contributor to all categories of environmental impact except for marine eutrophication, freshwater ecotoxicity and marine ecotoxicity; (2) the O&M stage contributes relatively little to the total environmental impact; (3) manufacturing of the buoy structure by consumption of steel is the largest contributor to 14 out of 18 categories of impacts including climate change (with steel contributing 31.3%), Ozone depletion (with a steel contribution of 42.3%), terrestrial acidification (with steel contributing 50.6%), freshwater eutrophication (with steel contributing 65.5%), human toxicity (with steel contributing 36.7%), photochemical oxidant formation (with steel contributing 53.7%), particulate matter formation (with steel contributing 64.9%), ionising radiation (with concrete contributing 42.3%), agricultural land occupation (with concrete contributing 33.8%), urban land occupation (with concrete contributing 54.2%), natural land transformation (with concrete contributing 43.2%), water depletion (with concrete contributing 36.3%), metal depletion (with steel contributing 77%) and fossil depletion (with steel contributing 48.1%); (4) manufacturing of generator is the most significant contributor to terrestrial ecotoxicity (with permanent magnet contributing 50.2%); (5) disposal of buoy structure contributes the most to marine eutrophication (with treatment of waste polyurethane contributing 86.3%), freshwater ecotoxicity (with treatment of waste polyurethane contributing 57.4%) and marine ecotoxicity (with treatment of waste polyurethane contributing 49.2%).
3.2.2. Embodied Energy and Carbon: Intensities and Paybacks
In order to quantitatively ecolabel the high environmental impact associated with life cycle stages, annual electricity production has to be estimated. Here for the calculation of annual electricity output for the BRD WEC, a few assumed parameters are taken into calculation including the total wave energy conversion efficiency and the capacity factor of the BRD WEC system. Since the BRD WEC is in its development and test stages, the actual capacity factor has not been specified yet for use. Assumed capacity factor values 20–50% are suggested by other WEC LCA studies [15,18,21,25] for the purpose of calculating annual electricity productions. Here in this study, the capacity factor is assumed to be 50%, since this prototype WEC is still in its early stage of development and technologically immature. Assuming that the total design generator efficiency 80% [26] is taken into the calculation and given the design power capacity of 10 kW, the annual electricity output is then calculated to be about 35 MWh. Within a service lifetime of 20 years, the total electricity production is calculated to be 700 MWh.
The energy intensity is calculated by dividing the life cycle embodied energy with total life time energy production; likewise the carbon intensity is calculated by dividing the life cycle embodied carbon with total life time energy production [27]. The energy payback period is an important environmental indicator for renewable energies as it demonstrates the period of time for the renewable power system to produce as much amount of energy as the energy consumption to produce the energy system itself. Here the impact assessment method Cumulative Energy Demand [27,28,29] is applied for the calculation of the payback time of the BRD WEC system. The results show that the cumulative energy demand of the BRD WEC is 0.108 MJeq/MJelectricity, which gives the energy payback time is 26 month. The calculated energy intensity of the BRD WEC is 387 kJ/kWh. The carbon payback is another important environmental indicator for renewable energies, which is calculated by dividing the life cycle embodied carbon with annual avoided carbon [27]. Here the annual avoided carbon is calculated by taking the difference of the BRD WEC carbon intensity and carbon intensity of local conventional fossil fueled electricity. The fossil fueled electricity emission factor is taken as 1004 gCO2/kWh [30], which is the latest emission factor published in 2014 for Shandong, China. The calculated results of the carbon intensity and carbon payback are 89 gCO2/kWh and 23 months, respectively.
3.3. Improvement Potentials
The above analyses show that the consumption of materials is the most significant contributor of the BRD WEC’s life cycle inventory and life cycle impacts. However, reduction of the overall energy and carbon intensities should be comprehensively strategized. Here a few approaches are proposed so as to achieve overall life cycle environmental improvement: (1) to increase the system specific mass, according to the inherent connection between the specific mass with energy and carbon intensities; (2) to improve the system reliability and energy conversion so as to achieve system life time extension which results in more electricity production; (3) to utilize alternative materials with lower embodied energy and emissions per unit mass; (4) to involve more environmentally friendly transportations; among others.
3.4. Comparison with Other Renewable
In order to benchmark the environmental performance of the BRD WDC with other WECs as well as other renewables, a comparison of energy and carbon intensities is made with two other types of WECs including Pelamis and Oyster. The comparison is also included five types of tidal energy converters including Seagen, TGL, Openhydro, Flumill and ScoRenewables. Comparison with other renewable such as offshore wind and polycrystalline silicone photovoltaic systems is also conducted.
As shown in Figure 4, the energy intensity of BRD WEC is slightly larger than Pelamis and Oyster but still within the range of 200–400 kJ/kWh. These energy intensities of WECs are comparable to tidal energy converters. The carbon intensity of BRD WEC is approximately three times larger than Pelamis’ and Oyster’s, which is also larger than the referenced tidal, offshore wind and PV systems. Energy and carbon intensities of WECs are dependent on many factors, including geographical, technological, and temporal and among others. Specific mass in terms of kilograms per kilowatt nominal power capacity was introduced for comparison of different types of tidal and wave energy devices [18]. Here in this work the approximate linear dependence with specific mass is analytically illustrated in Figure 4. Comparison with Pelamis, Seagen and Oyster shows that BRD has much larger specific mass, which is most likely the inherit reason for its relatively larger energy and carbon intensities.
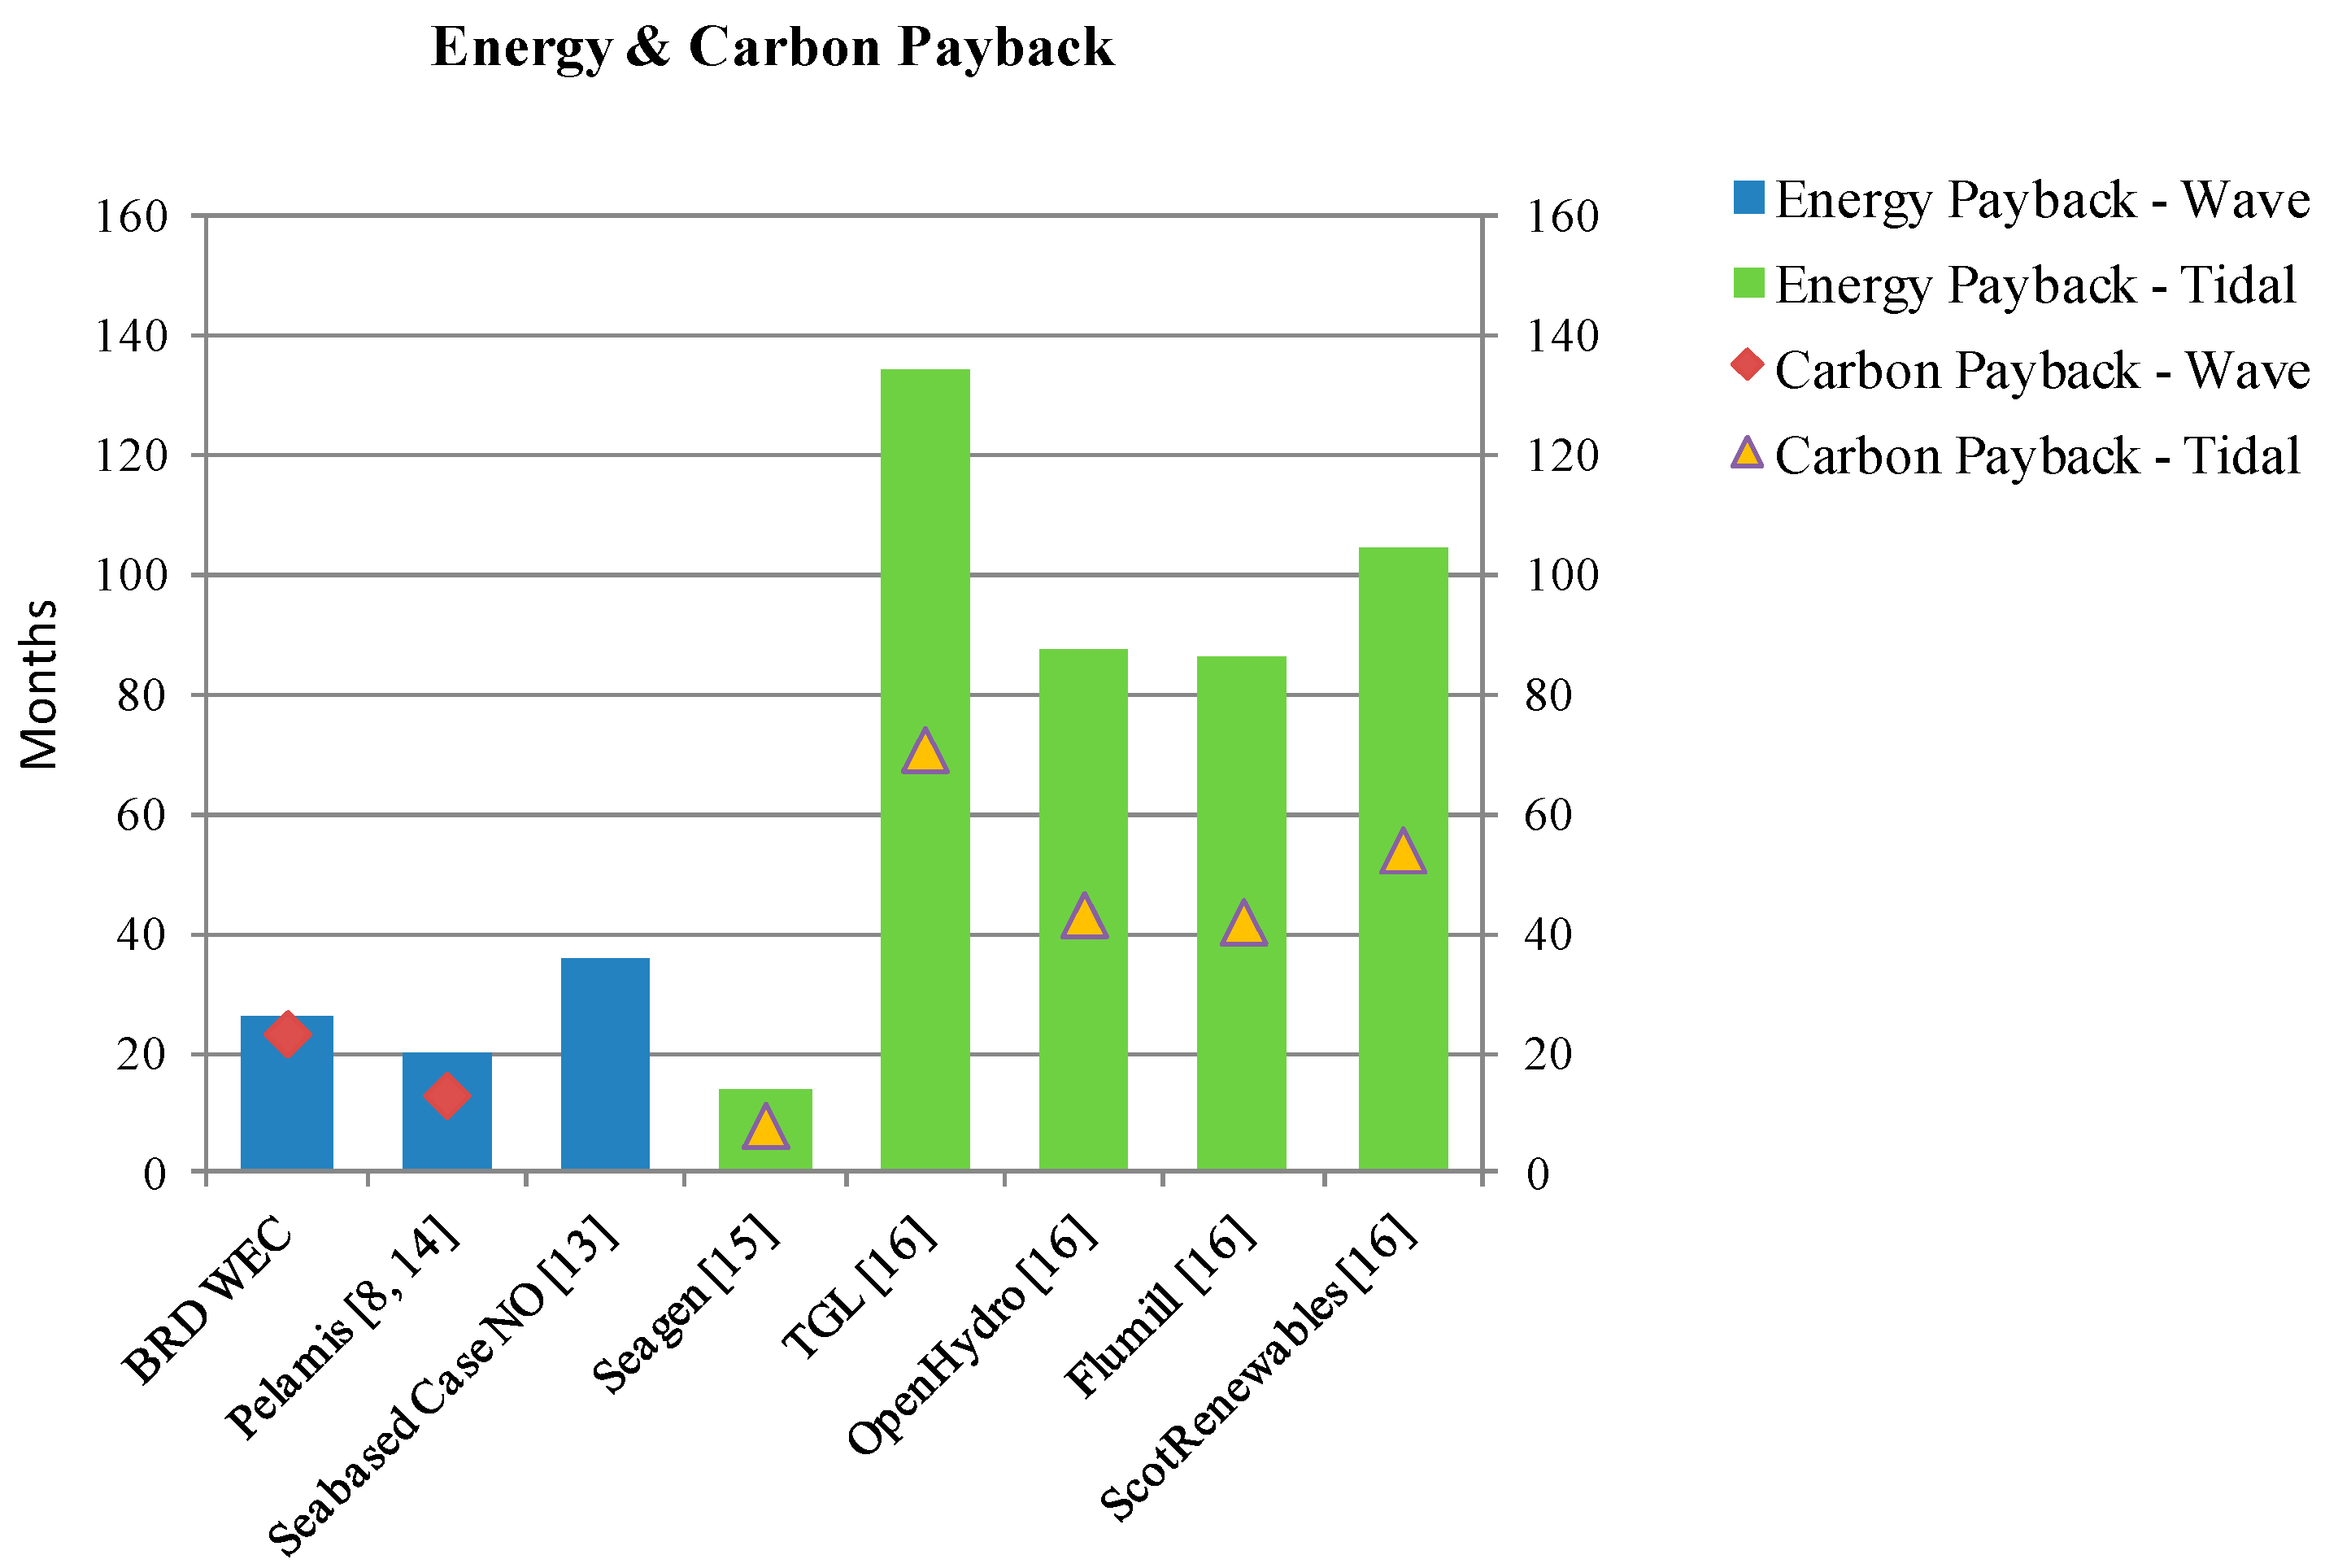
Figure 5 demonstrates the comparison of energy and carbon paybacks with other WECs including Pelamis and Seabased Case Norway, as well as tidal energy converters including Seagen, TGL, Openhydro, Flumill and ScoRenewables. It is indicated that the energy and carbon paybacks of BRD WEC are comparable with other WECs. Secondly, all the studied WECs have relatively less payback of energy and carbon than tidal energy converters, excluding Seagen. Further, the carbon payback of all WECs is expected to be shorter than tidal energy converters. This further indicates that application of wave energy conversion can achieve compensation for the system manufacturing related energy consumption and carbon emission within shorter period of time.
4. Sensitivities
Among the parameters that might have a significant influence on the environmental impact, capacity factor is one of the most interested ones for this study due to its uncertainty, since the system is still immature. Hence, a sensitivity analysis was carried out for the wave energy system by varying the capacity factor values in order to investigate its influence on the impact results. Here for the capacity factor values, 20–50% was taken, as discussed in Section 3.2.2. Figure 6 indicates that both carbon intensity and energy intensity decrease with the increase of capacity factor. For carbon intensity, a value of 222 gCO2/kWh is achieved, when the capacity factor decreases to 20%. Energy intensity could be as much as 968 kJ/kWh with a capacity factor 20%. Here for the sensitivity analysis, more specific examples or scenarios are not exhaustively discussed since the BRD WEC is still at its development and optimization stage. However, the above discussion should give the designers and interested stakeholders a sense of complexity to reduce the system’s energy and carbon intensities so as to improve its overall environmental performance. A tradeoff has to be taken into consideration among optimization of different technological parameters for future development and improvement.
5. Discussion and Conclusions
In this study, a full life cycle is analytically modeled for the BRD WEC. The conducted LCI and LCIA show that manufacturing is the most significant contributor to energy consumption, carbon emissions as well as interested environmental impacts. The energy and carbon intensities are calculated to be 387 kJ/kWh and 89 gCO2/kWh. The energy and carbon paybacks are calculated to be 26 and 23 months. Analytical comparisons show that the energy and carbon intensities and paybacks are comparable to reported LCA studies of other WECs and other renewables such as tidal, offshore wind and solar PV. Improvements can be achieved through optimization of the system’s specific mass, utilization of alternative materials which contains low unit embodied energy and carbon. Shipping of the structural components and modules through more environmentally friendly transportations with relatively low environmental impacts could also reduce the overall life cycle environmental impacts. Since the life cycle impacts cover a wide range of categories of indicators, a tradeoff is to be comprehensively and systematically made so as to achieve overall environmental performance improvement.
Novelty of this study consists of but not limited to: (1) this study is the first LCA case study for a WEC developed in China; (2) this study is one of the few LCAs for WECs based on an actual system installation; (3) this study originally suggests taking corrosion rate of offshore steel structures into account for wave energy converters at EoL stage for LCA; (4) this study is one of the few fully LCA studies taking into account not only energy and carbon, but also other environmental impacts.
Limitations of this study include: (1) lack of available data such as geographical difference, specific technological parameters such as input data for operation and maintenance; (2) system immaturity caused uncertainties such as materials, system efficiency and capacity factor; (3) accuracy of other assumptions made for the analysis such as the service lifetime, the O&M requirements, the recycling rate of wasted materials at EoL, and among others.
According to the above discussion, our future research will focus on acquisition of more available data, data update with the system improvement as well as consideration of wider marine environmental effects such as marine life. Last but not least, we realized that for any product or service, regular LCA practice does not take into account economic and social factors. In this context, researchers have been dedicated to the integration of economic models as well as ecological and social theories [31,32,33,34]. Nowadays life cycle sustainability assessment (LSCA) has been developed rapidly because of its comprehensiveness. Although this is currently beyond scope of our study, economic and social factors could be taken into consideration for our future research in order to comprehensively understand the system’s sustainability performance.
Author Contributions
Data collection, Q.Z. and L.Z.; Analysis and manuscript drafting, Q.Z.; Review, S.L.
Funding
This research was funded by National Marine Renewable Energy Specific Fund (GHME2011BL02). The APC was funded by Shandong University (Weihai) Scientific Research Funding (1050517300003) and the National Natural Science Foundation of China (No. 51605261).
Conflicts of Interest
The authors declare no conflict of interest.
References
- MacDonald, A.E.; Clack, C.T.M.; Alexander, A.; Dunbar, A.; Wilczak, J.; Xie, Y. Future cost-competitive electricity systems and their impact on US CO2 emissions. Nat. Clim. Chang. 2016, 6, 526–531. [Google Scholar] [CrossRef]
- Mora, C.; Dousset, B.; Caldwell, I.R.; Powell, F.E.; Geronimo, R.C.; Bielecki, C.R.; Counsell, C.W.W.; Dietrich, B.S.; Johnston, E.T.; Louis, L.V.; et al. Global risk of deadly heat. Nat. Clim. Chang. 2017, 7, 501–506. [Google Scholar] [CrossRef]
- Zhou, N.; Fridley, D.; McNeil, M.; Zheng, N.; Ke, J.; Levine, M. China’s Energy and Carbon Emissions Outlook to 2050; Lawrence Berkeley National Laboratory: Foshan, China, 2011.
- Sheng, S.; Wang, K.; Lin, H.; Zhang, Y.; You, Y.; Wang, Z.; Chen, A.; Jiang, J.; Wang, W.; Ye, Y. Model research and open sea tests of 100 kW wave energy converter Sharp Eagle Wanshan. Renew. Energy 2017, 113, 587–595. [Google Scholar] [CrossRef]
- Liu, Y.; Li, Y.; He, F.; Wang, H. Comparison study of tidal stream and wave energy technology development between China and some Western Countries. Renew. Sustain. Energy Rev. 2017, 76, 701–716. [Google Scholar] [CrossRef]
- Office of Energy Efficiency & Renewable Energy, U.S. Department of Energy. What Is the Wave Energy Prize? Available online: https://waveenergyprize.org/about (accessed on 26 October 2017).
- Carbon Trust. Future Marine Energy; Carbon Trust: London, UK, 2006; Available online: http://ukerc.rl.ac.uk/Roadmaps/Marine/Marine_Roadmaps_MEC_v2.pdf (accessed on 11 September 2018).
- Parker, R.P.M.; Harrison, G.; Chick, J. Energy and carbon audit of an offshore wave energy converter. Proc. Inst. Mech. Eng. Part A J. Power Energy 2007, 221, 1119–1130. [Google Scholar] [CrossRef] [Green Version]
- Map of People’s Republic of China. Available online: http://www.gov.cn/test/2005-06/15/content_18252.htm (accessed on 26 October 2017).
- Gao, H.; Zhang, A. Technology and Application of Renewable Energy; National Defense Industry Press: Beijing, China, 2007. [Google Scholar]
- Zhang, D.; Li, W.; Lin, Y. Wave energy in China: Current status and perspectives. Renew. Energy 2009, 34, 2089–2092. [Google Scholar] [CrossRef]
- Amponsah, N.; Troldborg, M.; Kington, B.; Aalders, I.; Hough, R.L. Greenhouse gas emissions from renewable energy sources: A review of lifecycle considerations. Renew. Sustain. Energy Rev. 2014, 39, 461–475. [Google Scholar] [CrossRef]
- Dahlsten, H. Life Cycle Assessment of Electricity from Wave Power; Swedish University of Agricultural Sciences: Uppsala, Sweden, 2009. [Google Scholar]
- Thomson, R.C.; Harrison, G.P.; Chick, J.P. Life Cycle Assessment in the Marine Renewable Energy Sector. In LCA Report—Instruments for Green Futures Markets, Proceedings of the LCA XI International Conference, Chicago, IL, USA, 4–6 October 2011; American Center for Life Cycle Assessment: Chicago, IL, USA, 2011; pp. 120–125. [Google Scholar]
- Douglas, C.A.; Harrison, G.; Chick, J. Life cycle assessment of the Seagen marine current turbine. Proc. Inst. Mech. Eng. Part M J. Eng. Marit. Environ. 2008, 222, 1–12. [Google Scholar] [CrossRef] [Green Version]
- Walker, S.R.; Howell, R.; Hodgson, P.; Griffin, A. Tidal energy machines: A comparative life cycle assessment study. Proc. Inst. Mech. Eng. Part M J. Eng. Marit. Environ. 2015, 229, 124–140. [Google Scholar] [CrossRef]
- Douziech, M.; Hellweg, S.; Verones, F. Are wave and tidal energy plants new green technologies. Environ. Sci. Technol. 2016, 50, 7870–7878. [Google Scholar] [CrossRef] [PubMed]
- Uihlein, A. Life cycle assessment of ocean energy technologies. Int. J. Life Cycle Assess. 2016, 21, 1425–1437. [Google Scholar] [CrossRef] [Green Version]
- Zhu, L.; Wang, Y.; Yang, Z.; Qu, Y. Buoy-Rope-Drum Wave Power System. Adv. Mech. Eng. 2013, 5, 609464. [Google Scholar] [CrossRef]
- Cavallaro, F.; Coiro, D. Life Cycle Assessment (LCA) of a marine current turbine for cleaner energy production. In Proceedings of the 3rd International Conference on Life Cycle Management, Zurich, Switzerland, 27–29 August 2007. [Google Scholar]
- Zepeda, L.G. Life Cycle Assessment of a Wave Energy Converter; Degree Project in Mechanical Engineering; KTH Royal Institute of Technology: Stockholm, Sweden, 2017. [Google Scholar]
- Kalpakjian, S. Manufacturing Processes for Engineering Materials; Addison-Wesley Publishing Company: Reading, MA, USA, 1992. [Google Scholar]
- Corrosion Protection of Ships. Available online: https://rules.dnvgl.com/docs/pdf/DNVGL/CG/2017-05/DNVGL-CG-0288.pdf (accessed on 11 September 2018).
- Zimmermann, T. Parameterized tool for site specific LCAs of wind energy converters. Int. J. Life Cycle Assess. 2012, 18, 49–60. [Google Scholar] [CrossRef]
- Banerjee, S.; Duckers, L.; Blanchard, R.E. An overview on green house gas emission characteristics and energy evaluation of ocean energy systems from life cycle assessment and energy accounting studies. J. Appl. Nat. Sci. 2013, 5, 535–540. [Google Scholar] [CrossRef] [Green Version]
- Ju, Y. Research on the Buoy-Rope-Drum Wave Energy Collection Device. Master’s Thesis, Shandong University, Weihai, China, 2016. [Google Scholar]
- Dalton, G.; Madden, D.; Daly, M.C. Life cycle assessment of the Wavestar. In Proceedings of the 2014 Ninth International Conference on Ecological Vehicles and Renewable Energies (EVER), Monte Carlo, Monaco, 25–27 March 2014; pp. 1–9. [Google Scholar]
- Weinzettel, J.; Reenaas, M.; Solli, C.; Hertwich, E.G. Life cycle assessment of a floating offshore wind turbine. Renew. Energy 2009, 34, 742–747. [Google Scholar] [CrossRef]
- Hischier, R.; Weidema, B.; Althaus, H.-J.; Bauer, C.; Doka, G.; Dones, R.; Frischknecht, R.; Hellweg, S.; Humbert, S.; Jungbluth, N.; et al. Implementation of Life Cycle Impact Assessment Methods; Final Report ecoinvent 2000; Swiss Centre for LCI: Duebendorf, Switzerland, 2003. [Google Scholar]
- Ma, C.; Ge, Q. Method for calculating CO2 emissions from the power sector at the provincial level in China. Adv. Clim. Chang. Res. 2014, 5, 92–99. [Google Scholar]
- Curran, M.A. Life cycle assessment: A review of the methodology and its application to sustainability. Curr. Opin. Chem. Eng. 2013, 2, 273–277. [Google Scholar] [CrossRef]
- Falcone, P.M.; Imbert, E. Social Life Cycle Approach as a Tool for Promoting the Market Uptake of Bio-Based Products from a Consumer Perspective. Sustainability 2018, 10, 1031. [Google Scholar] [CrossRef]
- Schaubroeck, T.; Rugani, B. A revision of what life cycle sustainability assessment should entail: Towards modeling the Net Impact on Human Well-Being. J. Ind. Ecol. 2017, 21, 1464–1477. [Google Scholar] [CrossRef]
- Weidema, B. The integration of economic and social aspects in life cycle impact assessment. Int. J. Life Cycle Assess. 2006, 11, 89–96. [Google Scholar] [CrossRef]
Figure 1.
(a) Wave energy extraction stroke; (b) Drum repositioning stroke; (c) BRD WEC transportation; (d) BRD WEC installation [19].
Figure 1.
(a) Wave energy extraction stroke; (b) Drum repositioning stroke; (c) BRD WEC transportation; (d) BRD WEC installation [19].

Figure 2.
Life cycle of BRD WEC and system boundary.

Figure 3.
Life cycle impact of BRD WEC.

Figure 4.
Energy and carbon intensities of WECs, comparison and vs. specific mass.

Figure 5.
Comparison of energy and carbon paybacks of wave and tidal energy converters.

Figure 6.
Carbon and energy intensities depending on capacity factors.


Table 1.
Primary materials and processes for BRD WEC manufacturing, assembly and installation.
| Material/Process | Weight (kg) | Source | Comments |
|---|---|---|---|
| Buoy Structure | |||
| Steel, general | 10,467 | Ecoinvent | Structural components of buoy |
| Polyurethane | 640 | Ecoinvent | Provides protection by absorbing flooded sea water |
| Alkyd paint | 63 | Ecoinvent | Antifouling and anticorrosive protection coating |
| Zinc | 86 | Ecoinvent | Used as sacrificial anode (cathodic protection) |
| Arc welding | - | Ecoinvent | Primary process for steel structural construction |
| Casting | - | Ecoinvent | Primary process for Zinc block manufacturing |
| Painting | - | Ecoinvent | - |
| Transportation | - | Ecoinvent | - |
| Generator | |||
| Electrical Steel | 2056 | [21] | Stator/Translator |
| Copper winding | 171 | Ecoinvent | Stator/Translator |
| Permanent magnet | 75 | Ecoinvent | Rotator |
| Wire drawing, copper | - | Ecoinvent | Copper winding manufacturing approximation |
| Machining | - | [8,22] | Generator manufacturing process approximation |
| Arc welding | - | Ecoinvent | Generator manufacturing process approximation |
| Transportation | - | Ecoinvent | - |
| Mooring | |||
| Concrete | 120,000 | Ecoinvent | Gravity anchor |
| Steel, low-alloyed | 4698 | Ecoinvent | Material for mooring chain |
| Transportation | - | Ecoinvent | Shipping for anchors and chains |
| Rope | |||
| Fleece | 30 | Ecoinvent | Approximating UHMWPE rope, due to unavailability of data |
| Polar fleece production | - | Ecoinvent | Rope production |
| Transportation | - | Ecoinvent | Shipping for rope from manufacturing plant to installation |
Table 2.
Distances taken into account for BRD WEC LCA.
| Location | Distance (km) | Comments |
|---|---|---|
| Zibo, Shandong, China | 20 | Manufacturing/Assembly location of BRD WEC structure; distance from Zibo to Weihai |
| Qingdao, Shandong, China | 270 | Manufacturing location of rope; distance from Qingdao to Weihai |
| Qingdao, Shandong, China | 270 | Manufacturing location of mooring chains; distance from Qingdao to Weihai |
| Weihai, Shandong, China | 20 | Manufacturing location of mooring module; distance from local plant to BRD WEC assembly location at Weihai |
| Tai’an, Shandong, China | 150 | Manufacturing location of generators; distance from Tai’an to Zibo |
| Xiaoshi Island, Weihai, Shandong, China | 2 | Offshore Weihai, Installation location of the BRD WEC; Operation and Maintenance location |
Table 3.
Assumed waste routes at EoL.
| Material | Recycling % | Incineration % | Landfill % | Reuse % | Comments |
|---|---|---|---|---|---|
| Ferrous metals (buoy) a | 85 | 0 | 0 | 0 | 15% of buoy ferrous metals assumed to be corroded |
| Non-ferrous metals b | 95 | 0 | 5 | 0 | Data source [18,24] |
| Plastics b | 80 | 20 | 0 | 0 | Data source [18,24] |
| Composites b | 0 | 100 | 0 | 0 | Data source [18,24] |
| Concrete (mooring) c | 0 | 0 | 0 | 85 | 15% of mooring concrete assumed to be deteriorated |
| Ferrous metals (other) a | 90 | 0 | 10 | 0 | Data source [18,24] |
© 2018 by the authors. Licensee MDPI, Basel, Switzerland. This article is an open access article distributed under the terms and conditions of the Creative Commons Attribution (CC BY) license (http://creativecommons.org/licenses/by/4.0/).
Share and Cite
MDPI and ACS Style
Zhai, Q.; Zhu, L.; Lu, S. Life Cycle Assessment of a Buoy-Rope-Drum Wave Energy Converter. Energies 2018, 11, 2432. https://doi.org/10.3390/en11092432
AMA Style
Zhai Q, Zhu L, Lu S. Life Cycle Assessment of a Buoy-Rope-Drum Wave Energy Converter. Energies. 2018; 11(9):2432. https://doi.org/10.3390/en11092432
Chicago/Turabian StyleZhai, Qiang, Linsen Zhu, and Shizhou Lu. 2018. "Life Cycle Assessment of a Buoy-Rope-Drum Wave Energy Converter" Energies 11, no. 9: 2432. https://doi.org/10.3390/en11092432
Note that from the first issue of 2016, this journal uses article numbers instead of page numbers. See further details here.