Optimization of Solar Energy System for the Electric Vehicle at University Campus in Dhaka, Bangladesh


1
Department of Electrical and Electronic Engineering, Daffodil International University, Dhaka, Bangladesh
2
Department of Electrical and Electronic Engineering, American International University-Bangladesh, Dhaka, Bangladesh
3
Department of Energy, Politecnico di Milano, via La Masa, 34-20156 Milano, Italy
4
CanmetENERGY Research Centre, Natural Resources Canada, 1 Haanel Drive, Ottawa, ON K1A 1M1, Canada
*
Author to whom correspondence should be addressed.
Energies 2018, 11(9), 2433; https://doi.org/10.3390/en11092433
Submission received: 4 July 2018
/
Revised: 7 September 2018
/
Accepted: 12 September 2018
/
Published: 14 September 2018
(This article belongs to the Special Issue Distribution System Operation and Control)
Abstract
:The incorporation of renewable energy and the transportation system can be significantly beneficial for the economy and environment of Bangladesh. The main energy source for vehicles in Bangladesh are the country’s natural gas and fuel. However, due to the rapid depletion of the gas reserve, soaring gas prices and global warming, alongside the environmental pollution caused by burning fuel, this raises concerns about these energy sources. Renewable energy offers a plausible solution to these problems. This paper’s objective is to focus on the maximum usages of a solar photovoltaic (PV) system in electrical vehicles and to minimize the environmental impact in terms of CO2 emission. This system may be partially used to power up the electric vehicle with a charging facility and contribute excess power to the national grid. The modeling, with its optimal analysis of the green transportation system, is simulated using the Hybrid Optimization of Multiple Energy Renewables (HOMER) software. The energy produced by the PV system can provide up to 13,792 kWh/year. Approximately 21% of the total production can be used in the charging station for charging the electrical vehicles and the rest of the energy can contribute to the national grid. Moreover, using the proposed concept of green transport will ultimately reduce greenhouse gas emissions by 52,944 kg/year.
1. Introduction
Transportation plays a vital role in every society. It facilitates the cultivation of a lifestyle and enables the delivery of goods and services that promote the development of society. Within global efforts to increase the sustainability of development patterns, certain strategies for increasing transportation’s sustainability have been articulated. These include vehicle technology improvements and clean fuels. Thus, the transportation system has a significant importance for the balanced development of economic and social systems of a country. One of the major problems of the global transport system is a high dependence on fossil fuels including oil and gas. One-third of the total final energy consumption is a result of the transport sector, including passenger and freight journeys, based on fossil fuels [1].
In particular, oil is the main energy provider in the transport energy. According to a report, 94% of the total energy demand for transport is provided by oil, 3% by natural gas and other fuels, 2% by biofuels, and 1% by electricity [2,3]. These non-renewable fossil fuels have the added disadvantage of releasing large quantities of harmful sulphur dioxide, nitrogen oxides, and especially carbon dioxide into the environment while burning. Each of these compounds are directly indicted in the problematic global warming phenomenon. These emission problems are the chief motivation for the increasing attention to the electrification of mobility. In recent years, there have been significant endeavors to examine the effects and approaches to decreasing on-road traffic pollutant emissions and the resultant consequences of these emissions on air quality [4,5,6]. Currently, the key goals of these methods are either (a) reducing the emissions per vehicle by implementing lower-polluting fuels and technologies, such as usage of renewable fuels or biofuels, natural gas vehicles, fuel cell vehicles, or (b) adopting mobility management strategies to decrease the maximum speed of circulation. Fleet electrification is one of the strategies under consideration for improving urban air quality [7].
Depending on the type of power plant that provides electric energy for EVs (electric vehicles), other potential advantages that can be assigned to fleet electrification are an enhancement in energy efficiency and reductions in energy reliance, fossil fuel consumption, and greenhouse gas (GHG) emissions. Nonetheless, EVs require an additional load on the electricity power system, causing increased emissions from electrical generation, dependent on the power mix [7]. For that reason, the country faces the energy resource problem of non-renewability, environment pollution, and adverse climate change impact.
Bangladesh has installed 13,555 MW to meet the demand of electricity where the per capita energy consumption is only 308 kWh [8,9,10]. Moreover, this electricity is generated using national resources like natural gas and coal where around 1890 MW of the power could not be generated from the public power plants due to a shortage of gas as fuel and others [11,12,13]. On the other hand, fuel burning in energy generation is responsible for global warming and environmental pollution. Recently in Dhaka City, the fuel used by every car and bus is 0.4 metric ton per capita [14]. Therefore, it is very important for the present transportation system to transition into a sustainable system. Hence, to improve this situation, Renewable Energy Technologies (RETs) should be used to power up the electric vehicle can be considered one solution to reduce carbon emissions and high fuel consumption. The 1 kWh of electricity generated by solar photovoltaic (PV) reduces approximately 660 tons of CO2 emissions per year [15]. The insolation in Bangladesh varies from 4 kWh/m2/day to 4.5 kWh/m2/day at an average of 4.25 kWh/m2/day [16]. Consequently, that this can be used to power up the electric vehicle for use as daily transport in Dhaka city as Green transport or Smart mobility is a new concept. Thus, renewable forms of energy emit far smaller amounts of greenhouse gases compared with fossil fuels and increases energy conservation [17].
Sustainable Transportation Infrastructure (STI) is developing rapidly throughout the world. To reduce the growing demand for fossil fuels and to eliminate environmental pollution and noise emission, eco-friendly transportation systems or Green transportation systems are becoming increasingly popular. Their comparative advantage is evident efficiency: whereas the gasoline engine has an efficiency of 25−28%, and a diesel up to 40%, an induction electric motor in alternating current has an efficiency of 90%. Equally beneficial is that it does not emit exhaust fumes or pollutant emissions and it generates zero pollution if supplied with energy from renewable sources [18]. Furthermore, renewable energy sources like solar, photovoltaic, and wind energy systems have been predominantly used to supply energy in several nations. Renewable energy sources are commonly exploited as distributed generations in conventional power distribution networks and new smart grids since they usually generate small-scale power on the locations that are nearby to the users [7].
The goal of this work is to offer an alternative use of RETs to provide a new transport system, which can reduce the operating cost and minimize the CO2 emissions. The modeling with its optimal analysis is simulated using HOMER software [18]. We have chosen HOMER as our simulation tool because it is an optimization tool where brute force technique is applied. This is a general problem-solving method that consists of systematically enumerating all possible combinations for the solution and checking whether each combination satisfies the problem’s statement.
The paper is structured in this manner: Section 2, provides a description of a solar photovoltaic system installed in Dhaka. Section 3 introduces the concept of electric buses with a connection and services for the Campus. In Section 4, the renewable energy sources, the load profiles, and the details of the system design using HOMER are presented. Section 5 provides the proposed green transportation model and discussion of the simulation results, while the conclusions are presented in Section 6.
2. Existing Solar PV System Installed in Dhaka University Campus
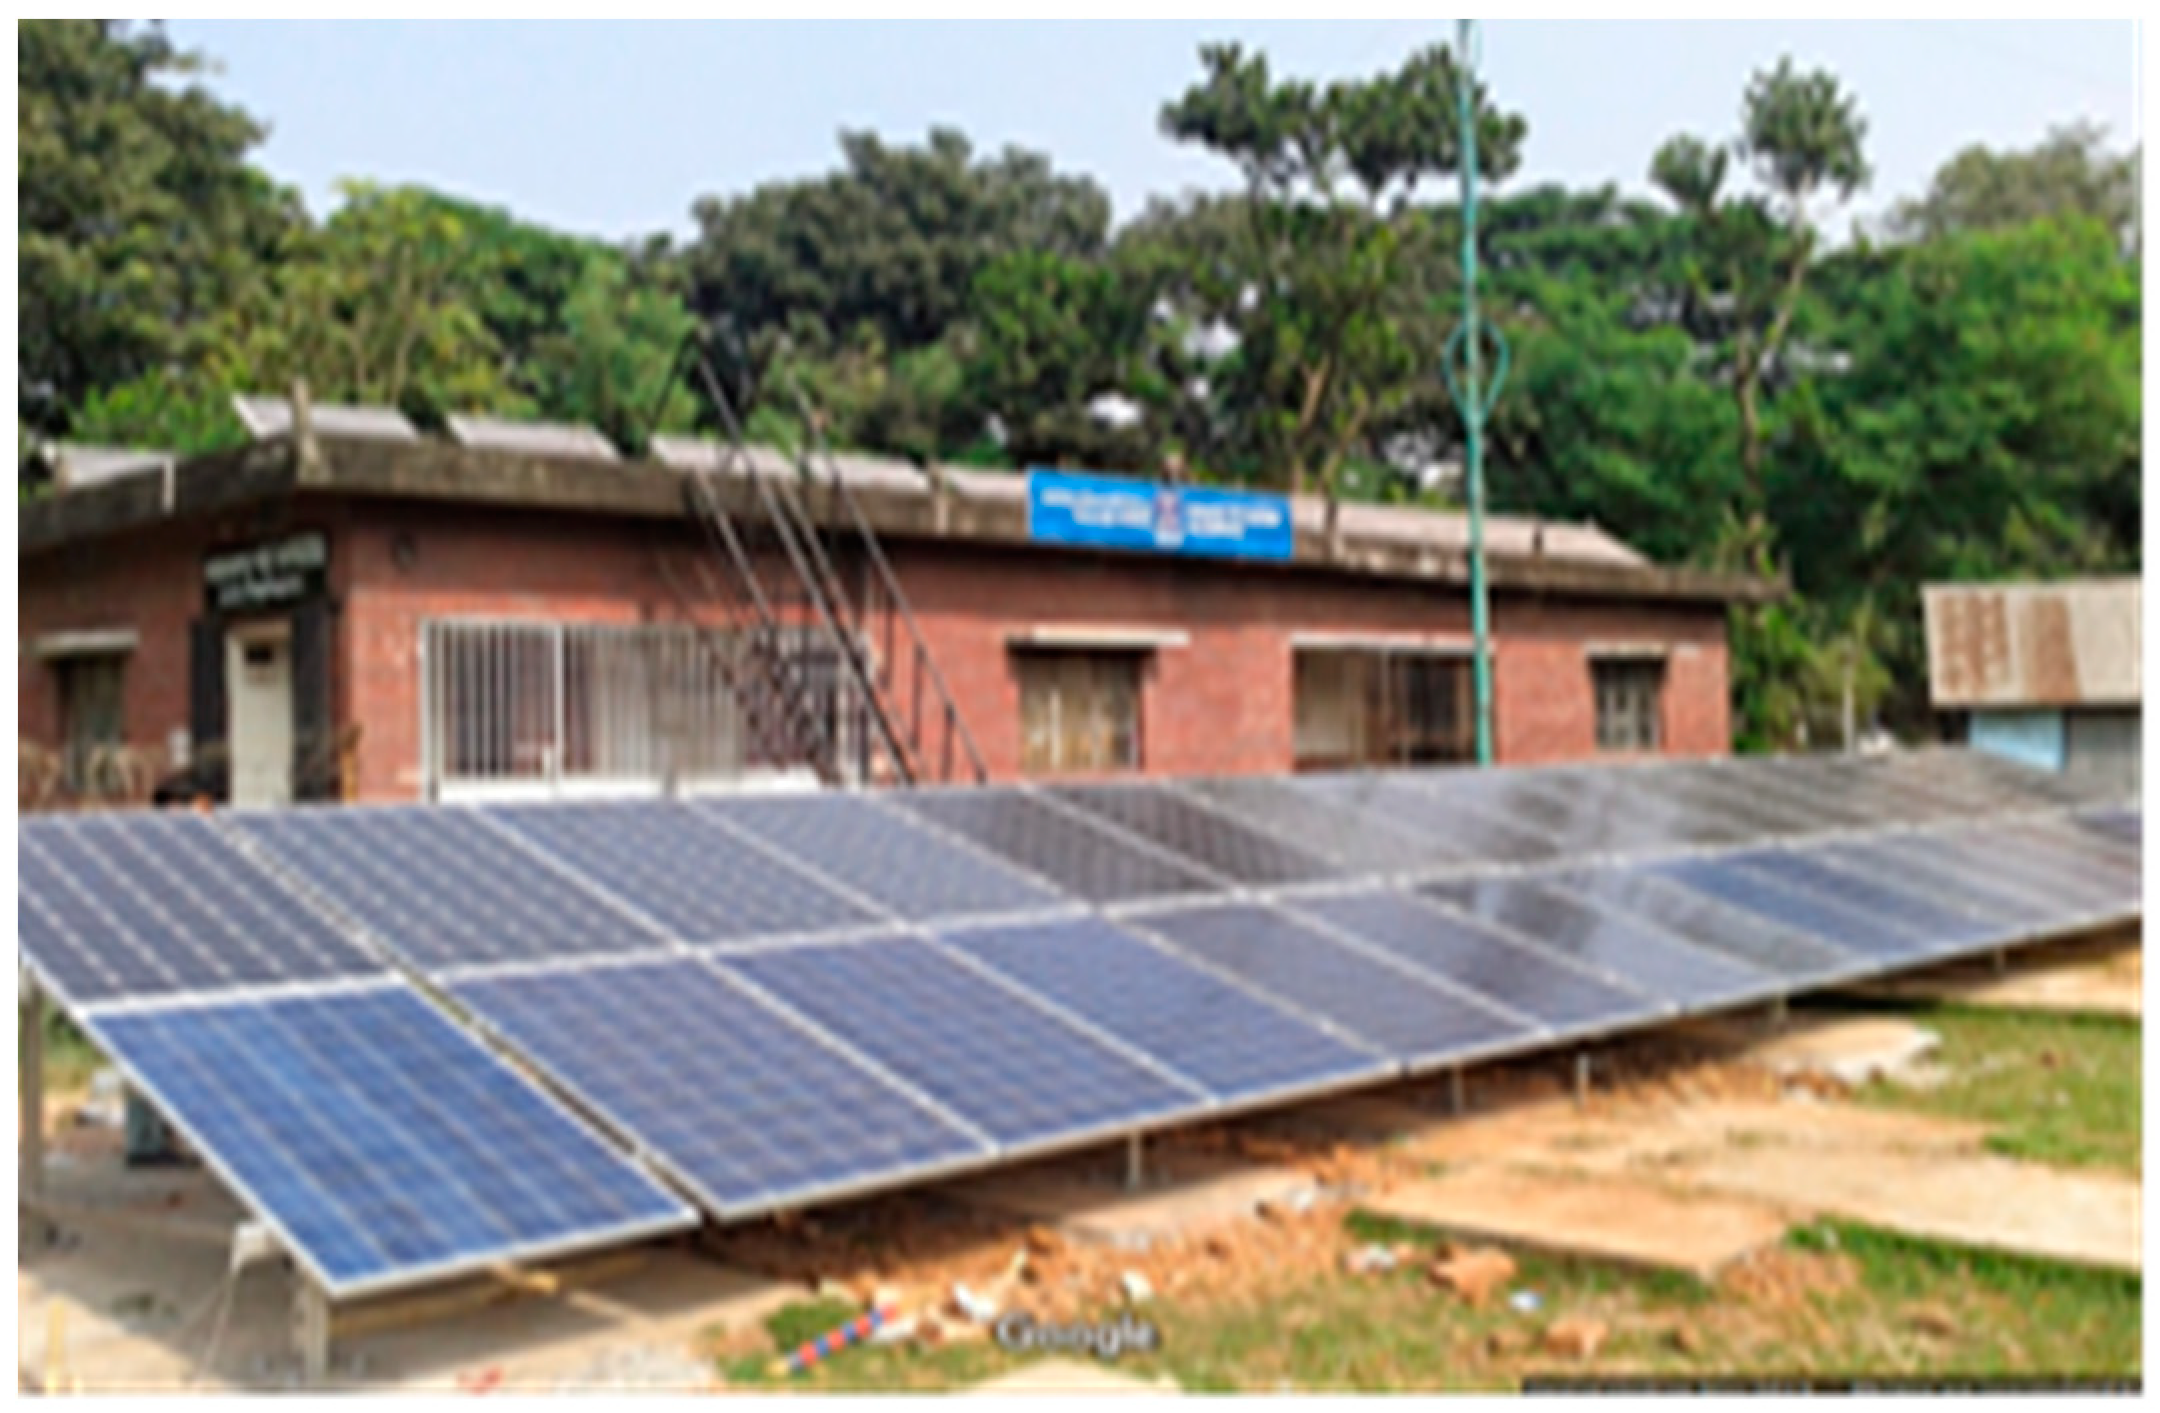
The Institute of Energy in the University of Dhaka (DU) is located near Curzon hall. It has a huge area covered with buildings, but one side of the adjacent area is equipped with a 9.9 kW solar Photovoltaic System with a capacity of 10 kW, active since January 2014. The electric characteristics of PV modules are labeled under the term of STC (Standard Test Conditions), which are solar irradiation of 1000 W/m2, solar spectrum AM 1.5 and temperature of 25 °C. Figure 1 shows the PV systems located in the University.
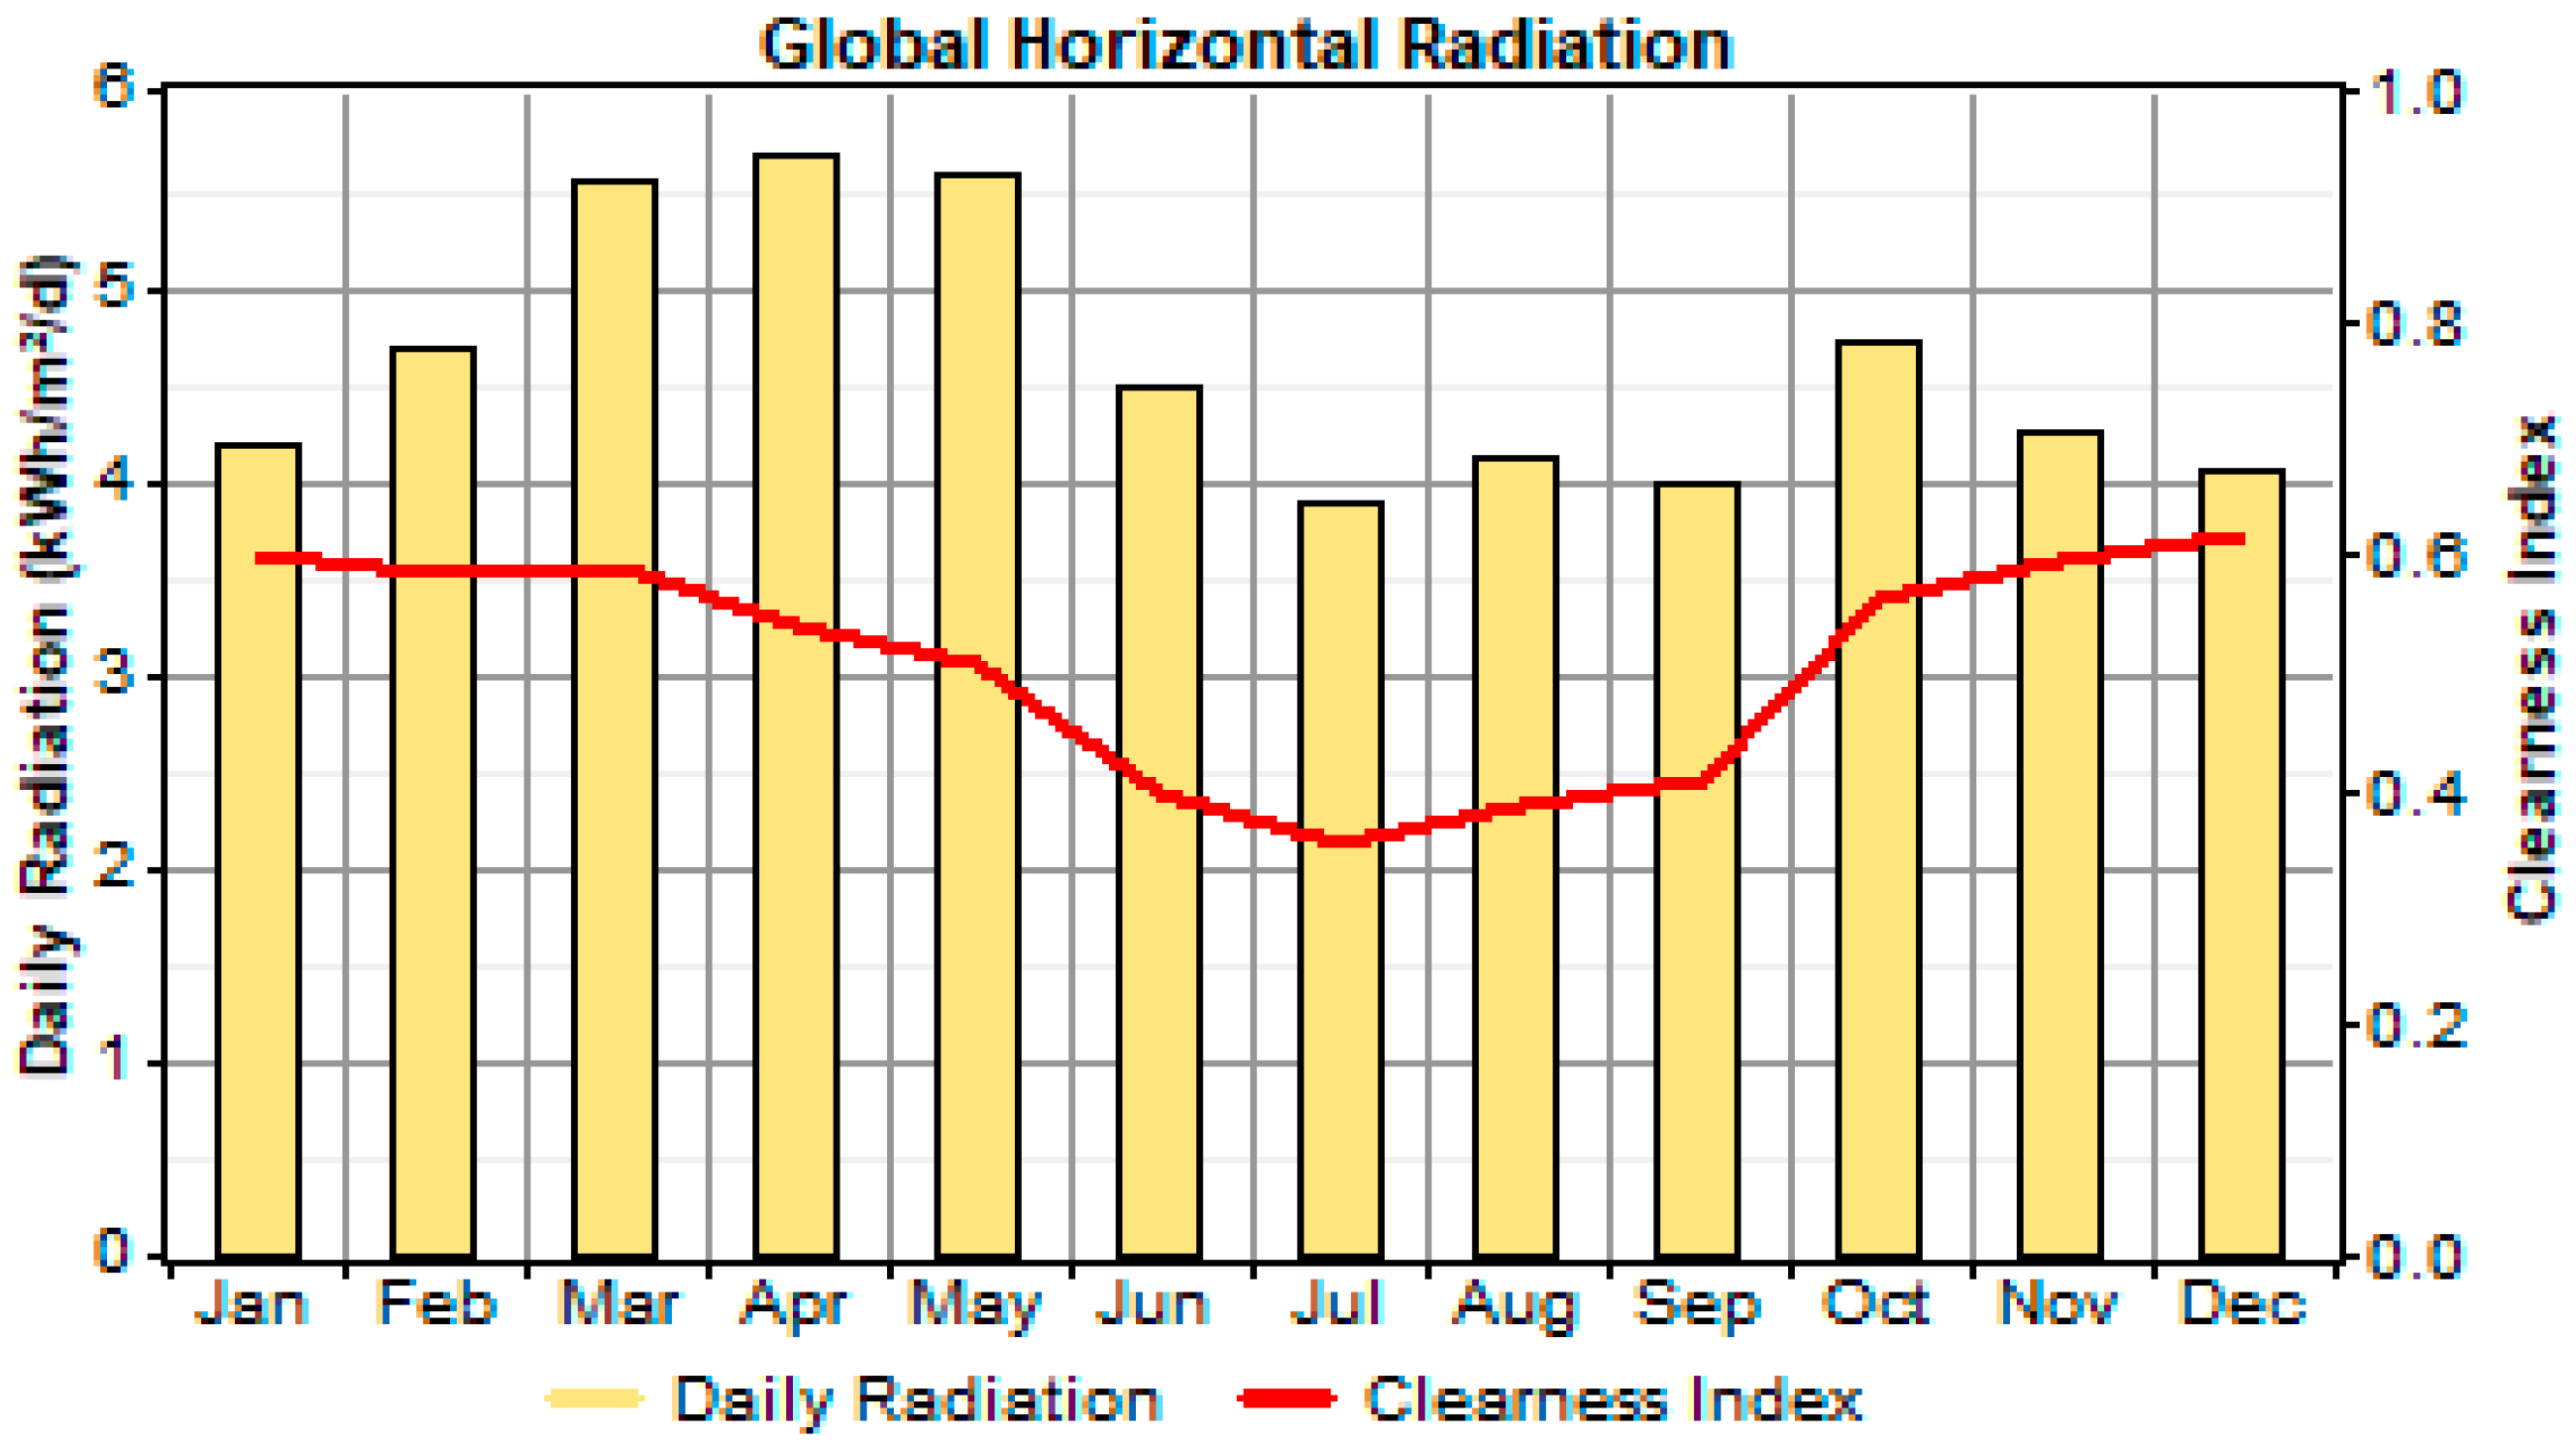
The monthly solar radiation data for the Dhaka university campus area (latitude of 23°43′ North and longitude of 90°25′ East) are collected from HOMER via a NASA satellite [19]. In Figure 2, the Global Horizontal Radiation (GHR) curve for twelve months is presented. The scaled annual average radiation for Bangladesh is equal to 4.59 kWh/m2/day.
3. Proposed Electric Buses for the University
According to the Bangladesh Road Transport Authority (BRTA), more than fifty thousand Electric Vehicles (EVs) are available in each of Bangladesh’s major cities. The EVs include battery-operated Auto rickshaw, electrically motorized rickshaw, electric two-wheelers, and electric bicycles [17]. While no electrical buses are currently available in Bangladesh, a battery operated electrical bus for the students of the Dhaka University is proposed. A charging station for this electric bus will be designed with a 9.9 kW solar Photovoltaic System near the University, described in the previous section. This bus will be useful for pick-up and drop-off for students at different locations throughout Dhaka city. Due to the unavailability, this kind of bus can either be imported, constructed, or fabricated from the local market. In this situation, the initial cost could be higher in the long run; however, it is highly beneficial for the country.
A bus with 14 seats is described in Table 1. It has a driving capacity of 100 km. Battery capacity has a range of 8.64 kWh, while its maximum speed is 40 km/h and the energy consumption is 0.086 kWh/km [20]. In this paper, two electrical buses have been considered and all characteristics are indicated in Table 1.
Obviously, the energy that must be provided to the vehicles depends on the difference between the initial and final States of Charge of the battery (ΔSOC). To calculate the energy required (Erich) for each type of Electric Bus, it is possible to use the expression in (1):
Particular attention is drawn to the time needed for recharging consumed energy (), which is equal to:
where Pcharge is the charging power of the battery.
As mentioned earlier, the electric bus as a form of green transportation is proposed for use by students of Dhaka University. It will be used for their pick-up and drop-off at the University. Once it is charged up from the CS, which is a 9.9 kW PV system, it would go on the drop-off and then return to the charging station.
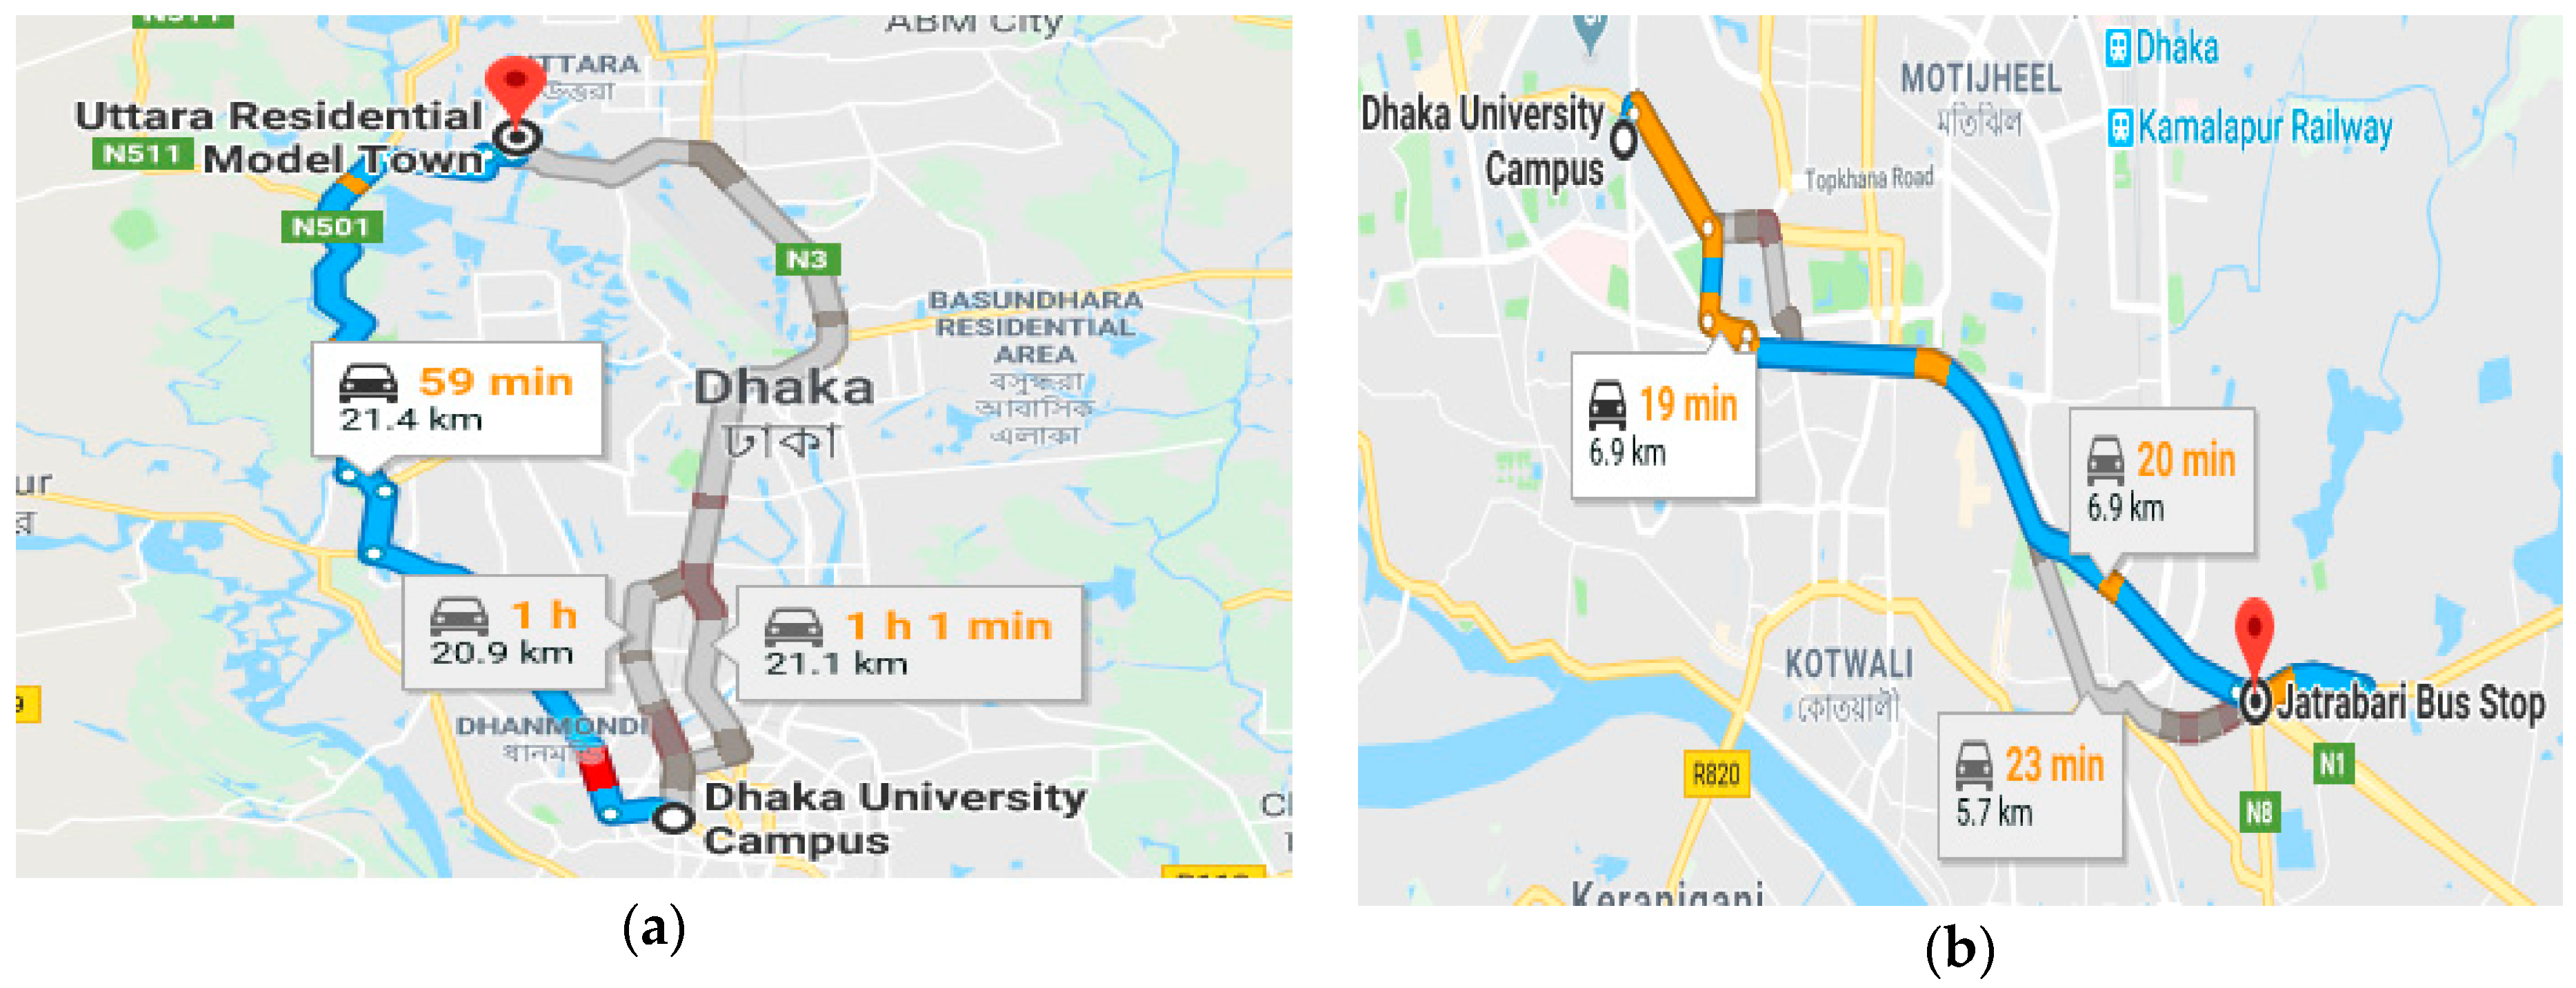
In this paper, two routes have been selected. The first route is from Dhaka University campus to Uttara and is approximately 21.4 km (Figure 3a). The second route is from Dhaka University campus to Jatra Bari. The bus could either move through the Jatrabari Gulsan flyover, which is 6.9 km, or through Kazi Nazrul Islam Avenue, which is 21.3 km from the campus (Figure 3b).
It has been considered that the bus must run four trips per day and each trip must cover 42.7 km, so the total number of monthly trips will be 100. Buses cover then 51,240 km/year and need to charge their battery 510 times per year. Therefore, annual energy consumption per year will be 4406.64 kWh.
4. Renewable Energy Sources, Load Profile, and System Design Using HOMER
The HOMER (Hybrid Optimization of Multiple Energy Resources) beta 2.68 version is a popular simulation tool used for designing micro-grids that combine traditionally generated and renewable power, storage, and load management with minimum per unit energy production cost. It is reliable for micro-grid design optimization and feasibility for variations in technology costs, electric load, and energy resource availability [18].
4.1. Load Profile Based on Collected Data
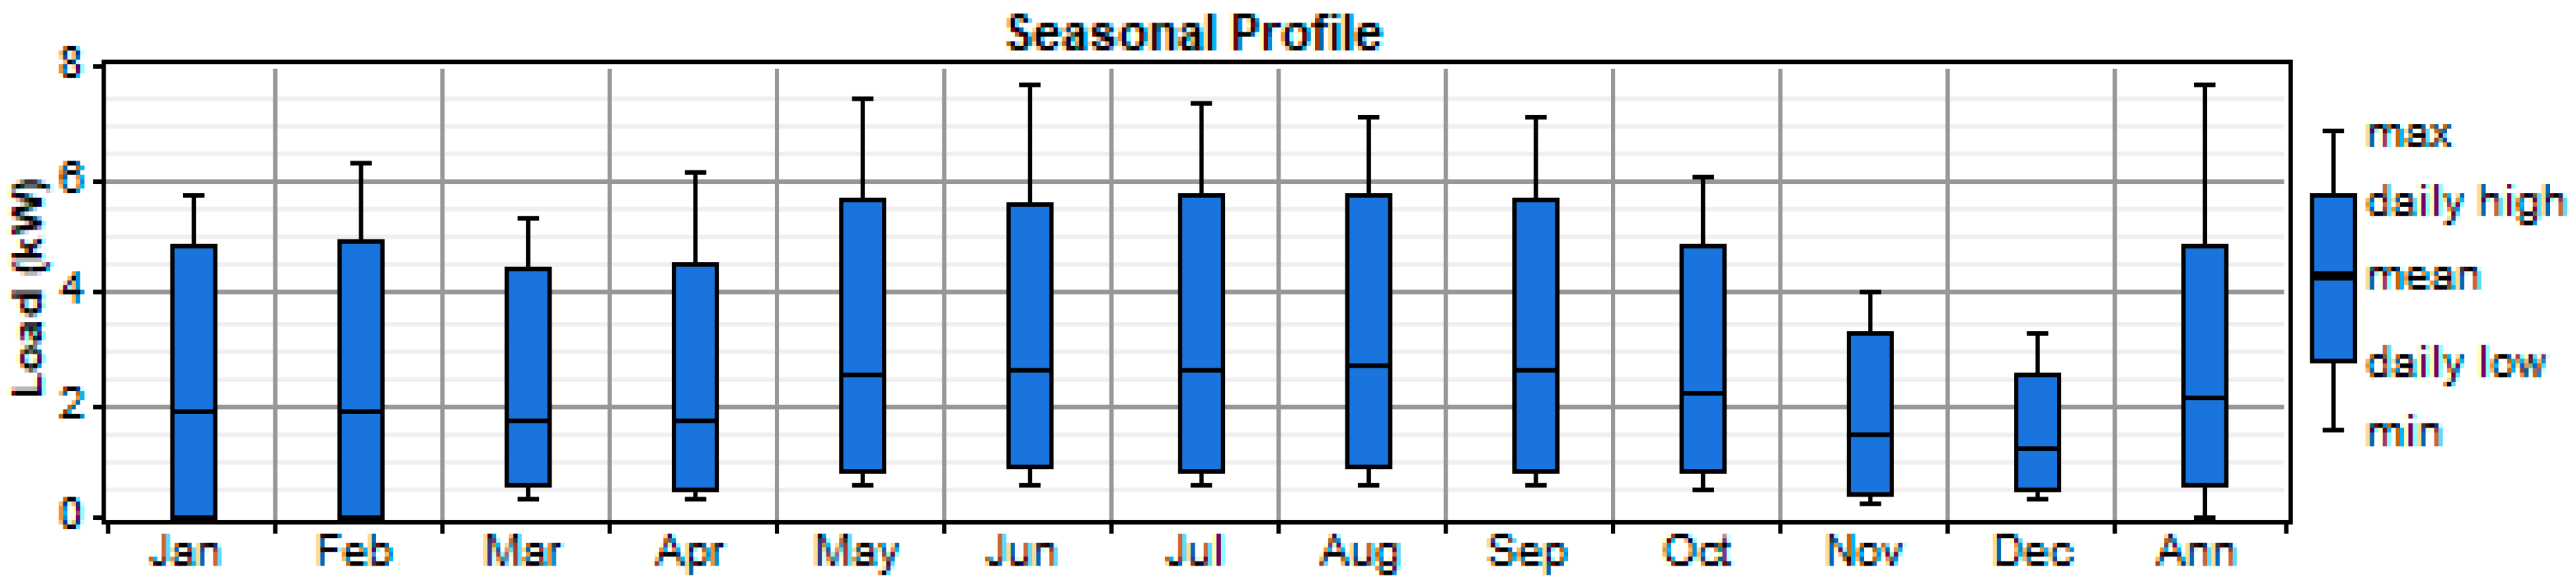
The monthly load profile is considered based on the demand of the campus. The load profile varies between November to January when it is very low because the university is closed at that time. From February to October, the load consumption becomes higher and the average kWh per day required is 50.3 with a peak demand of 7.64 kW where the load factor is 0.274. In Figure 4 the profile, a scaled data monthly averages of load, is provided [18].
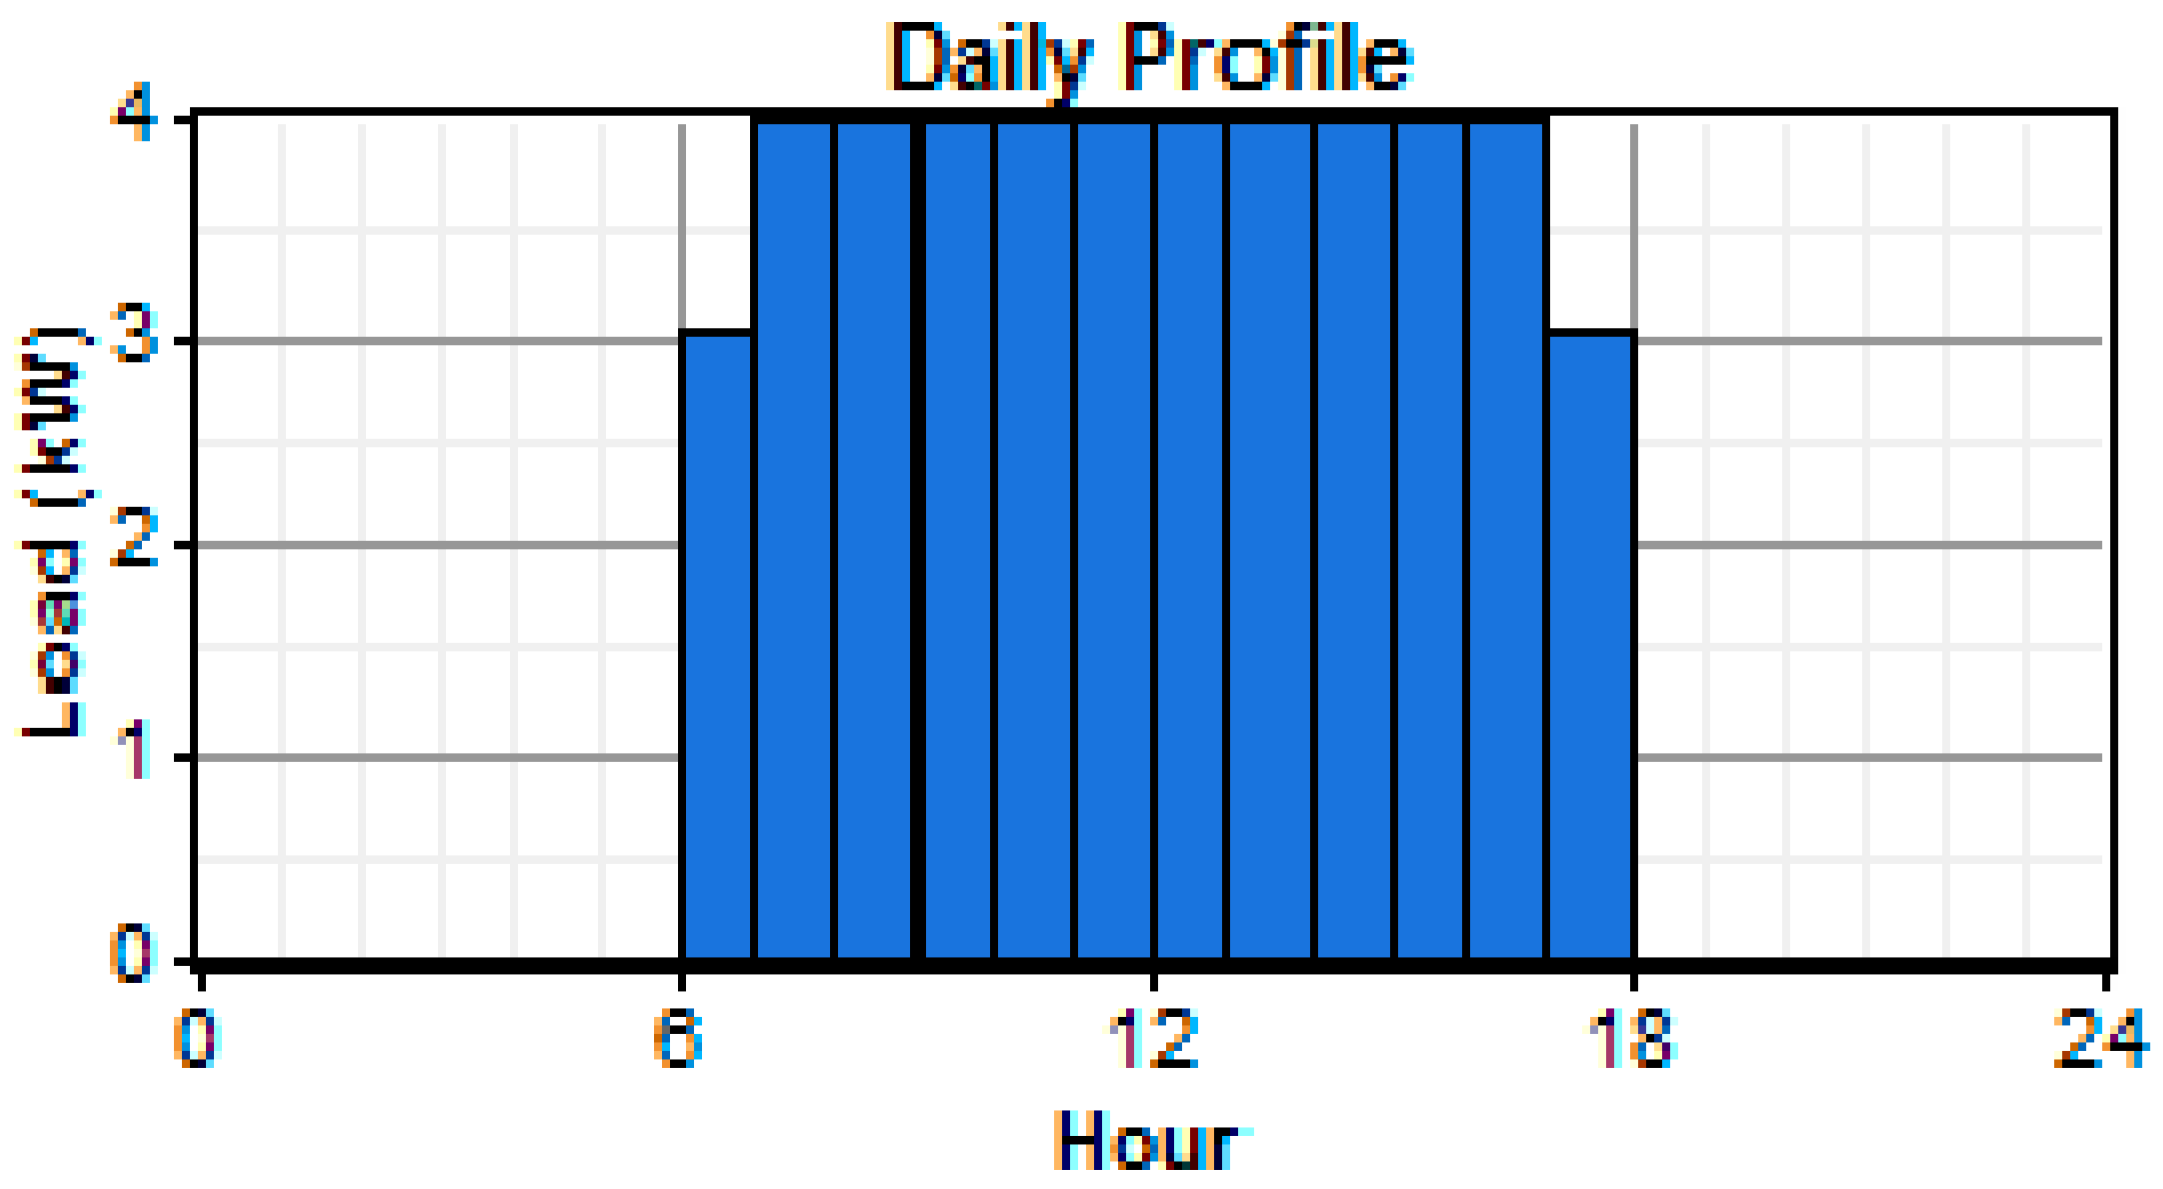
In HOMER according to the load consumption, an off peak time from 7 p.m. to 6 a.m. is assumed when the load consumption is low, while the peak time starts from 6 a.m. and ends at 6 p.m. The daily load variation is shown in Figure 5.
4.2. Size Consideration of Solar Photovoltaic Array
To determine the PV size, different panel combinations are inserted in the HOMER software along with other parameters to optimize the system’s performance. 20 years lifetime for the PV has been considered and no tracking system has been employed [21,22]. The installation cost of PV arrays is $0.0/WP because already 9.9 kW PV systems have been installed at the Dhaka University premises. Moreover, to charge up the full battery of one bus, 2.2 kW is required daily in view of use during peak hours 11 a.m. to 3 p.m. Therefore, two buses would require 4 kW per day, which can easily be supplied from the installed PV system. Installation, replacement, and operating and maintenance (O&M) costs for 1 kW PV are taken as $0, $1050 and $2/year respectively.
4.3. Battery Size and Converter
Electricity has been supplied from a battery to run the bus. This paper considered a battery that has nominal voltage of 6 V, and a nominal capacity of 120 Ah (8.64 kWh per day). The battery will be charged up from the charging station. The lifetime of the battery is assumed to be 5 years. The installation, replacement, and operating & maintenance costs of one battery are taken as $200, $800, and $1.2/year, respectively. A fully-charged battery requires 4 h of charging.
The converter is a vital part of the renewable power generating system. The converter is used to convert the power from AC to DC or vice versa. For a 1 kW converter, the installation and replacement costs are considered to be $220 and $250, respectively. Converter sizes considered in the simulations are 1 kW up to 11 kW as the installed PV capacity is 10 kW. Inverter lifetime and efficiency are taken as 15 years and 90%. Rectifier capacity relative to the inverter is considered as 100% and efficiency is considered as 85%. O&M costs of a 1 kW converter are $20 per year.
4.4. Grid Connection to Microgrid System
A grid integrated distributed generation has recently become popular. In this paper, it is considered that connecting the whole microgrid system, where the remaining power supplies the national grid of Bangladesh to further grow economic development with a profitable sell back price, will occur. Maximum grid demand is kept at zero, which means that the microgrid system cannot draw power from the grid other than sales of maximum 20 kW per year to the grid. Grid interconnection charge and standby charges are estimated at $0 (considering $270/kW) [23,24] and $100 per year. Scheduled rates of electricity in Bangladesh are given below in Table 2.
5. Green Transportation Model, Simulation Results, and Discussion
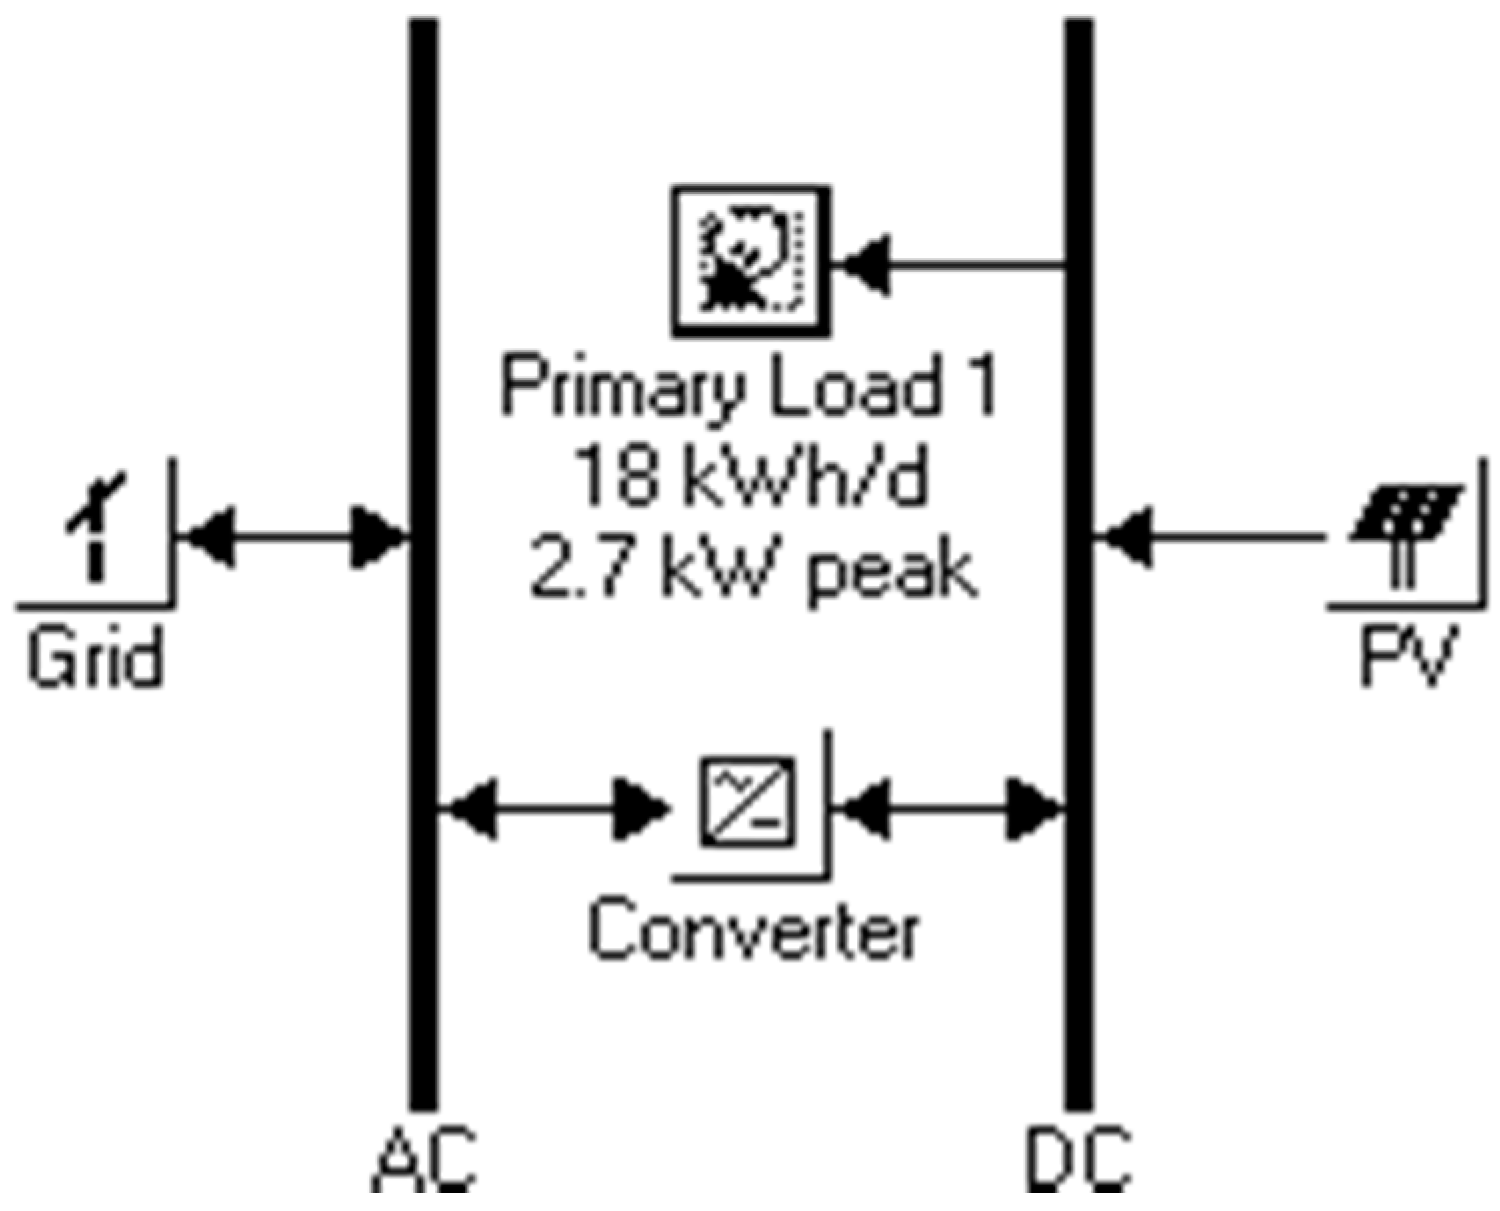
The microgrid system for green transportation in HOMER software chooses the option called “System is connected to grid”. All the components of producing renewable energy are stored in the HOMER library. In Figure 6, the designed system is shown with a proper arrangement to generate clean energy. Here the batteries act as a load that is fed by PV arrays. After charging the full battery, the remaining PV output is added to the grid. The converter is used here to convert the DC output into the AC output.
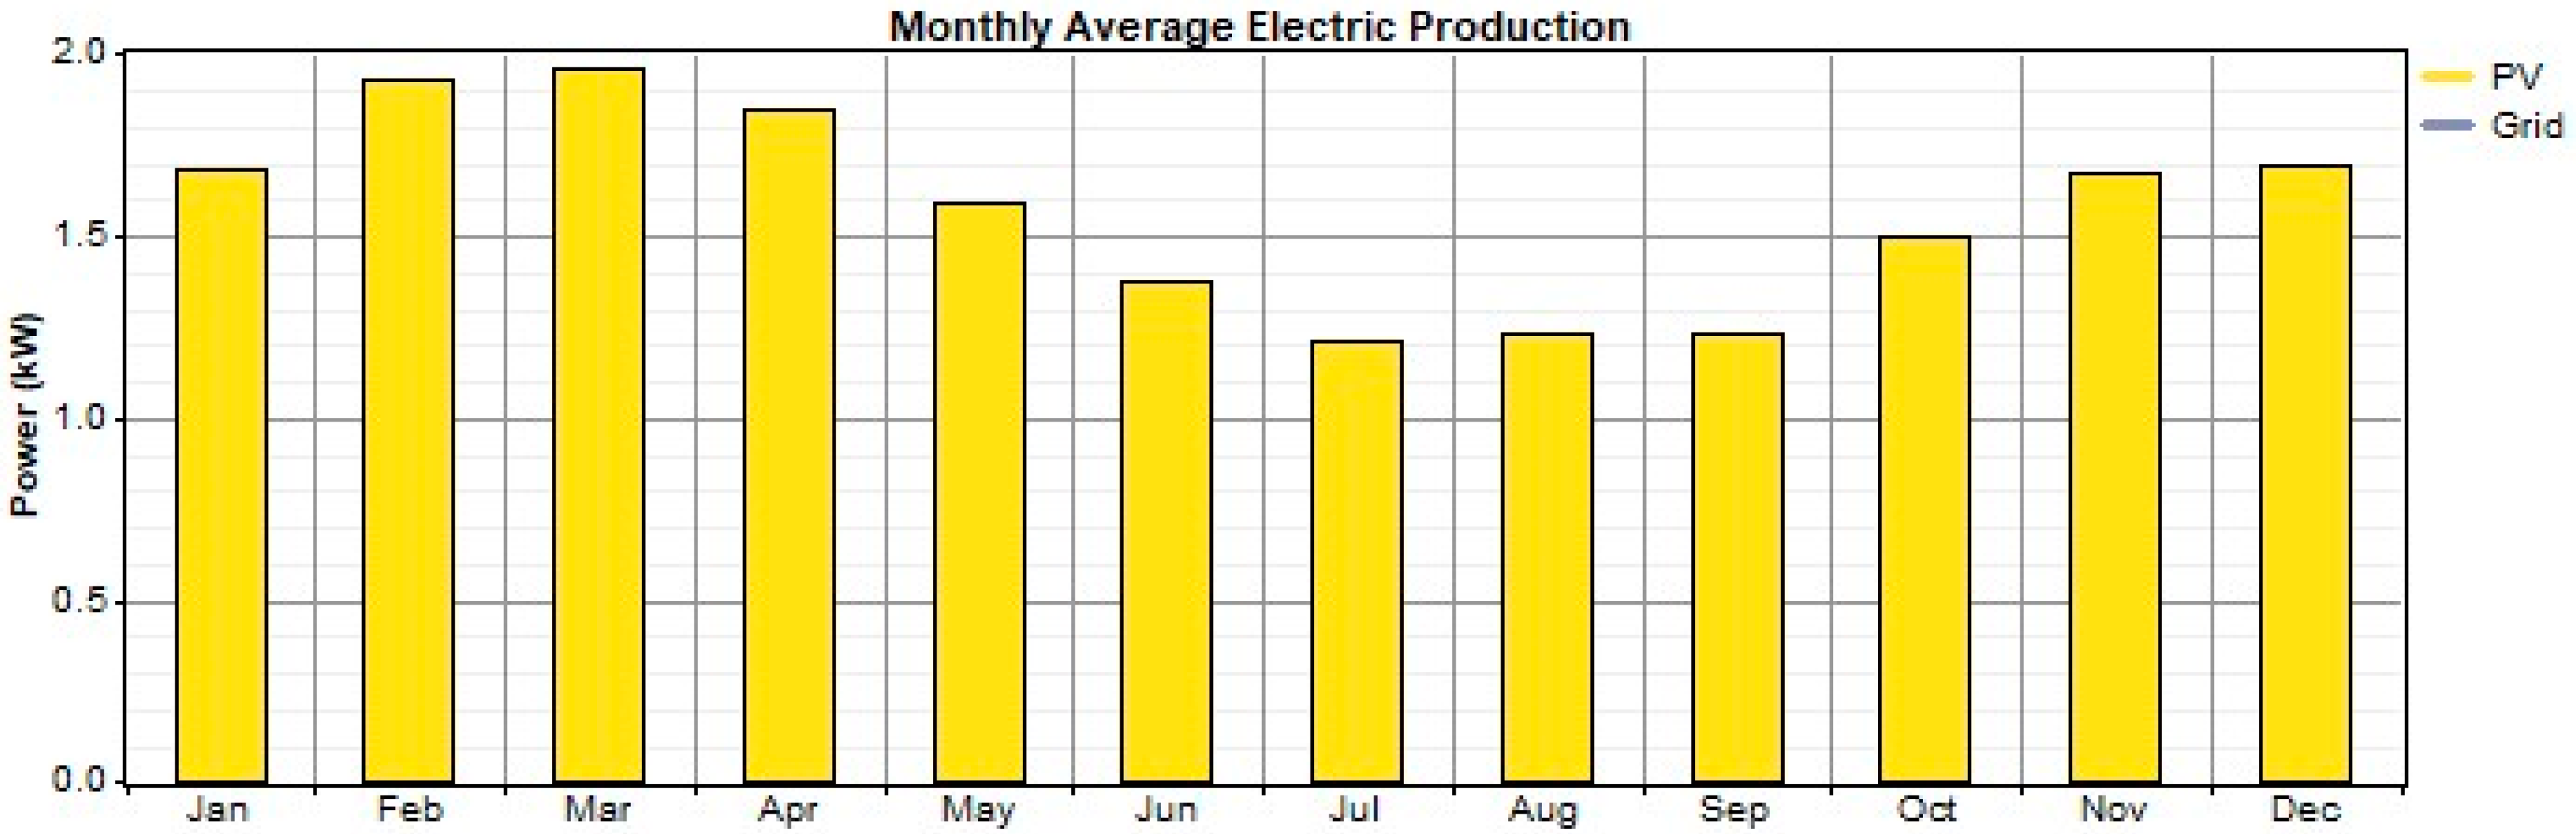
Before the simulations were initiated, all the costs of the components and monthly data of resources were mentioned in the HOMER simulation tool to find out the optimal size of the system. After simulations were done, HOMER finally showed the exact size & combination to build up the system with an initial capital of $2750, a minimum production cost of energy of $0.012 (BDT 0.936; 1 USD = BDT 78), and a renewable fraction of 1.00, which means the system is a 100% noiseless and decontaminated power generating project. HOMER showed the final optimum result for a 9 kW PV with a 11 kW converter. Figure 7 shows the monthly average electricity production by the PV array. The yellow portion resembles the monthly average electricity production by the PV array. In our proposed system the vehicles can be completely charged using the energy produced by RET, hence no additional energy is required from the grid, as a result the gray portion is not highlighted.
From the optimum result of the simulation, total annual generation from the PV array is 13,792 kWh and the annual demand for the charging station is 2861 kWh. The extra energy can be retailed to the grid, which is 9837 kWh/year.
Total kilometer cover per trip is 42.7 km. HOMER depicts only ~1 ($0.012) taka per unit cost for harnessing energy from the hybrid microgrid system deployed in the Dhaka University campus with a feasible net present cost (NPC) of $676 (equivalent to BDT 54080). The variability of services can be developed and distributed in different ways because the same services could be offered with different frequencies during the days of the week or month. However, from this analysis, the system provides 23% of its energy generated for charging up the electric vehicles while the remaining 77% of the energy is sold back to the grid annually. It is remarkable for a country like Bangladesh to be able to provide extra energy to meet the daily demand.
It is also important to consider the environmental impact in terms of CO2 emission by the consumption of such conventional vehicles. The total emissions of CO2 from a conventional vehicle can be calculated as [25]:
where CO2,CV is total emissions of CO2 from the conventional vehicle for each kilometer travelled; FC is fuel consumption expressed in g/km; is the amount of CO2 produced from the combustion of a gram of gasoline. The complete combustion of 1 L of gasoline produces 2.4 kg of CO2. Assuming a density of 700 kg/m3, 1 g of gasoline produces 3.42 g of CO2 [25]. Finally, is a correction factor that takes into account the production and distribution of gasoline. Sullivan et al. (2004) suggests a correction factor of 1.162 for gasoline cars [24].
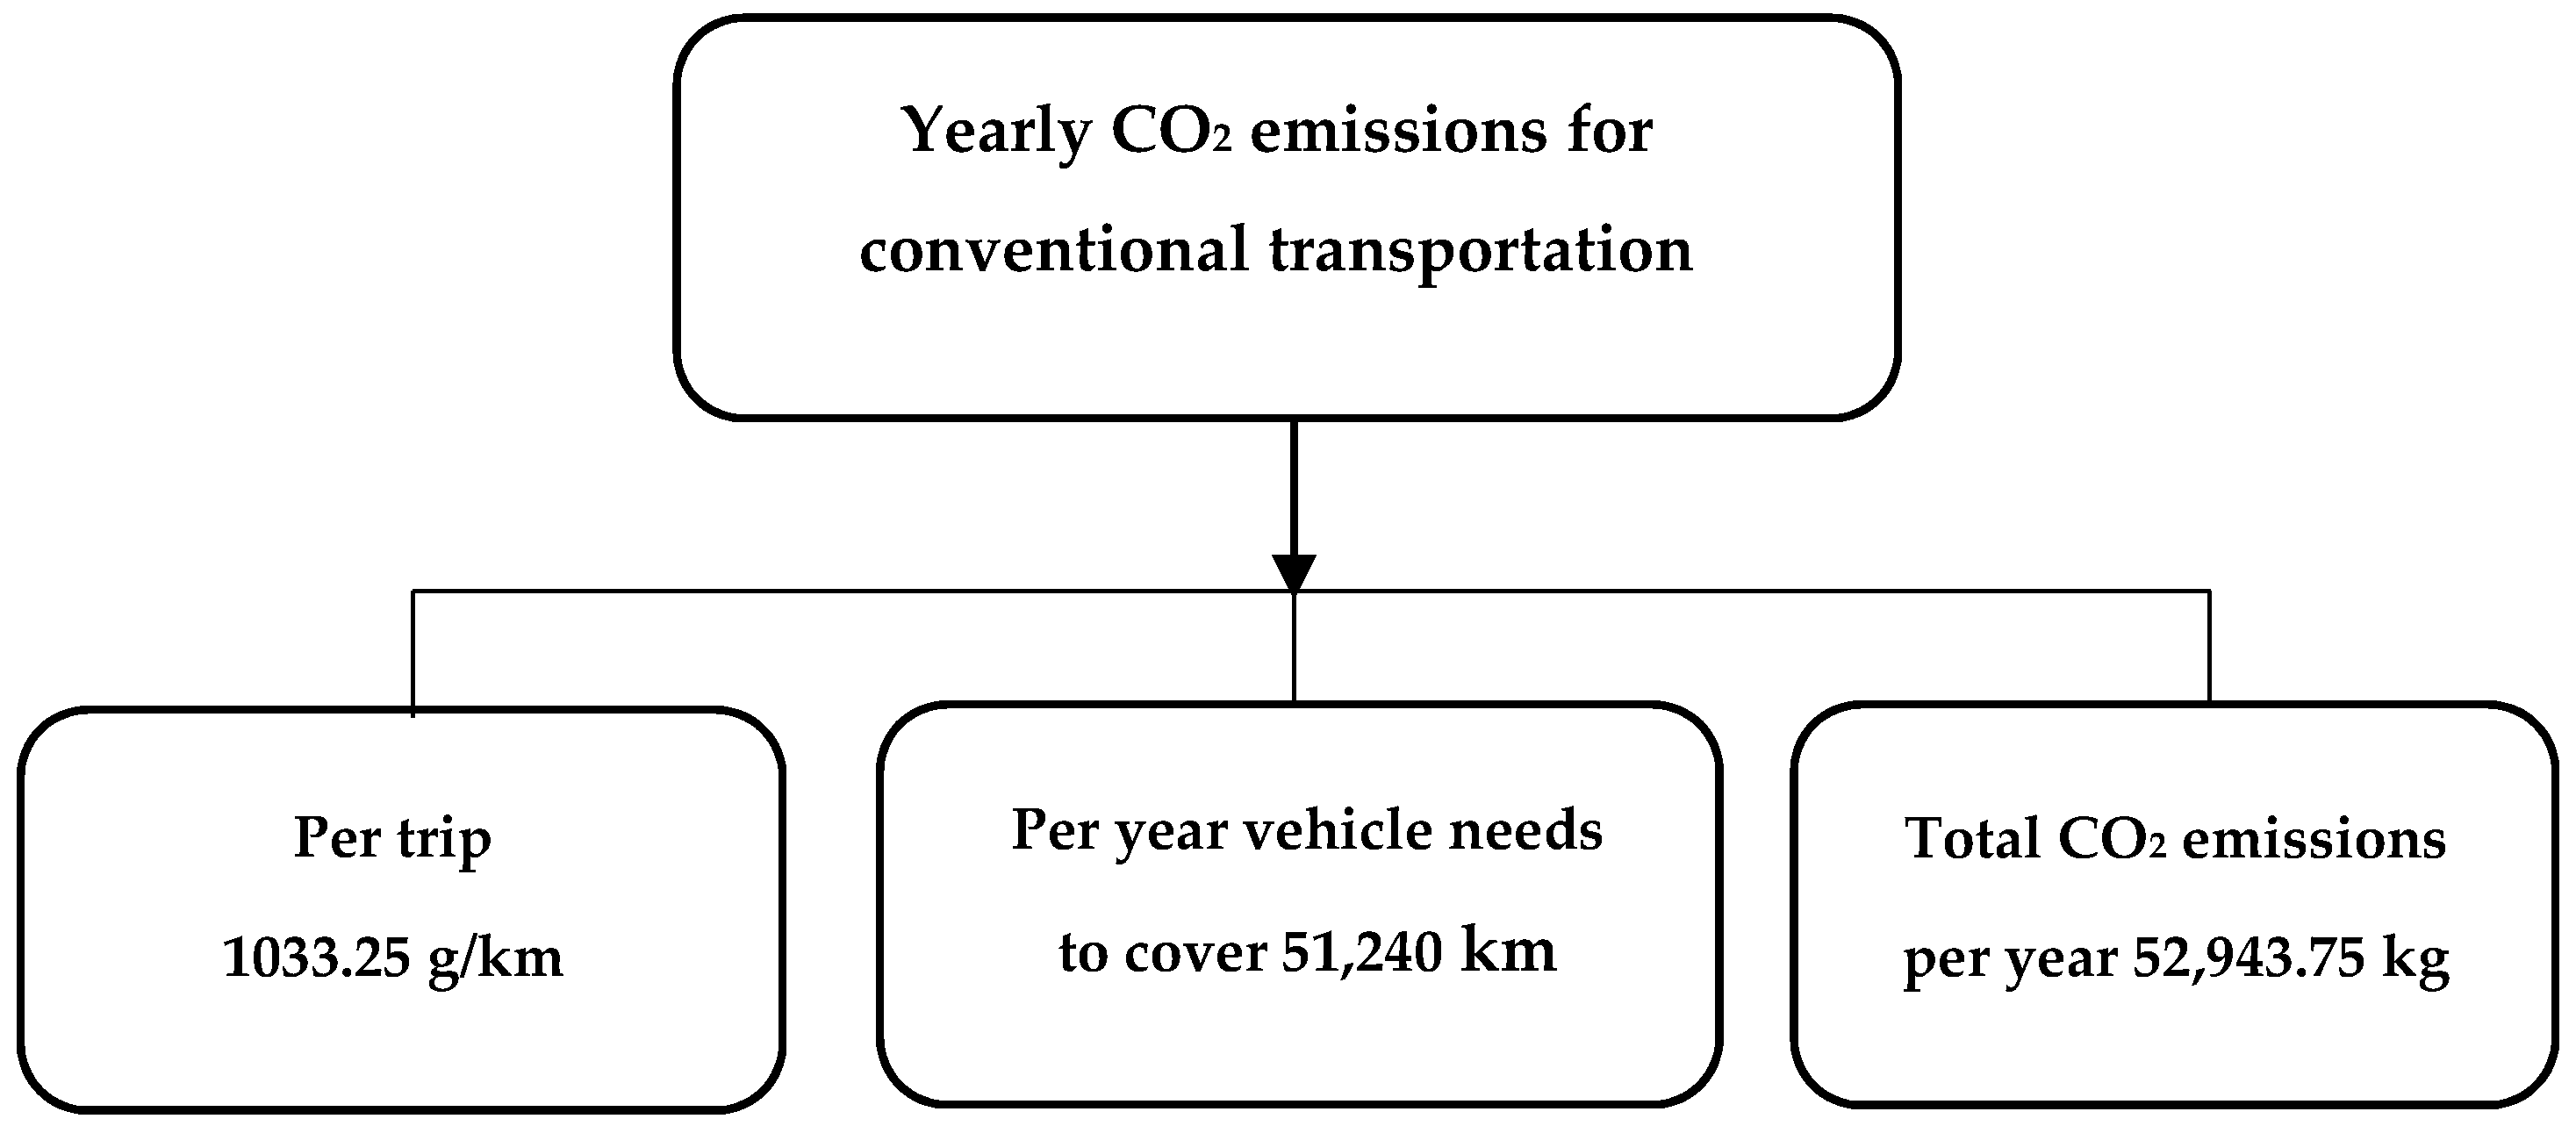
In conventional vehicles, which have on average 11.102 L/42.7 km of fuel consumption, the CO2 emission can be calculated around 1033.25 g/km/trip. In our case, per year the vehicle needs to cover around 51,240 km, which in turns gives per year CO2 emission of approximately 52,943.75 kg/year, this value has been calculated considering the route distance of 42.7 km per trip, which is currently being travelled using conventional gasoline engine busses whose approximate fuel consumption is around 11.102 L. We have considered 14 seated buses for our calculation. However, this value may vary depending on different road and driving conditions.
Figure 8 shows yearly CO2 emissions for the oil-based transport system. Hence, we can clearly see that our proposed model can also save the environment by reducing CO2 emissions.
From the foregoing discussion, the importance of green mobility at the urban level can be appreciated in a one-year period. Although producing clean energy is desirable, there are some drawbacks that are major concerns for future research work. The first limitation is that the two buses can only be charged up from the university campus. There are no other charging stations throughout the route. Therefore, if an unexpected mishap occurs and the bus cannot be charged up, then the transportation facility would have to be canceled for that day. Secondly, grid integration from the microgrid system is also a big challenge. If perchance there is difficulty to interconnect the system to the national grid, then the stored energy will be sold out, keeping a good profit margin [24].
6. Conclusions
In this paper, we have proposed a complete new use for the existing installed solar PV panels at the selected location, which will optimize the uses of the installed system. As the current system is only being used to supply energy to the grid, we have performed an analysis that proved that the efficiency of the generated energy can be enhanced by introducing an electric vehicle charging system. Our study has shown that the overall cost of energy will be reduced remarkably as the system is already built into the university campus so that the overall zero installation cost is needed to run the system. The energy produced by the solar photovoltaic system installed in the Institute of Energy of Dhaka University can provide up to 13,792 kWh/year, which can be utilized in a charging station (2861 kWh/year) for two electrical buses and can be imported or constructed from the local market. Approximately 21% of the total production can be used in the charging station for charging the electrical vehicles and the rest of the energy can contribute to the national grid (about 9837 kWh/year).
The maximization of the energy flow from the PV system to the electric vehicle requires quite long and low power charges that allow exploiting the hours when the production of the photovoltaic shelter is high. However, a good idea could be to use an energy storage system.
Moreover, using this new concept of green transportation will ultimately reduce the greenhouse gas emissions by 52,944 kg/year. Therefore, environmental pollution will reduce significantly. Overall, green transportation will be extremely beneficial for the economy of the country as it will reduce total load pressure on the electricity grid network and for the environment as it will lessen the CO2 emissions in the air.
Author Contributions
N.C. and A.H.C. proposed the core idea, developed the models. They performed the simulations, exported the results, and analyzed the data. W.Y. and M.L. revised the paper. N.C., A.H.C., M.L. and W.Y. contributed to the design of the models and the writing of this manuscript.
Funding
This research received no external funding.
Conflicts of Interest
The authors declare no conflict of interest.
References
- Chowdhury, N.; Hossain, C.A.; Zishan, S.R.; Brenna, M.; Longo, M. Eco-Friendly Transportation System in Proposed Permanent Campus of American International University-Bangladesh. In Proceedings of the 6th International Conference on Clean Electrical Power (ICCEP), Santa Margherita Ligure, Italy, 27–29 June 2017; pp. 1–5. [Google Scholar]
- García-Olivares, A.; Solé, J.; Osychenko, O. Transportation in a 100% renewable energy system. Energy Convers. Manag. 2018, 158, 266–285. [Google Scholar] [CrossRef]
- Bangladesh Development Board. Annual Report (2016–2017). Available online: http://www.bpdb.gov.bd/download/annual_report/Annual%20Report%202016-17%20.pdf (accessed on 24 April 2018).
- Iodice, P.; Senatore, A. Atmospheric pollution from point and diffuse sources in a National Interest Priority Site located in Italy. Energy Environ. 2016, 27, 586–596. [Google Scholar] [CrossRef]
- Costagliola, M.A.; Prati, M.V.; Florio, S.; Scorletti, P.; Terna, D.; Iodice, P.; Buono, D.; Senatore, S. Performances and emissions of a 4-stroke motorcycle fuelled with ethanol/gasoline blends. Fuel 2016, 183, 470–477. [Google Scholar] [CrossRef]
- Iodice, P.; Langella, G.; Amoresano, A. Ethanol in gasoline fuel blends: Effect on fuel consumption and engine out emissions of SI engines in cold operating conditions. Appl. Thermal Eng. 2018, 130, 1081–1089. [Google Scholar] [CrossRef]
- Longo, M.; Yaici, W.; Zaninelli, D. “Team Play” between Renewable Energy Sources and Vehicle Fleet to Decrease Air Pollution. Sustainability 2016, 8, 27. [Google Scholar] [CrossRef] [Green Version]
- Ahiduzzaman, M.D.; Sadrul Islam, A.K.M. Greenhouse gas emission and renewable energy sources for sustainable development in Bangladesh. Renew. Sustain. Energy Rev. 2011, 15, 4659–4666. [Google Scholar] [CrossRef]
- Islam, M.D.T.; Shahir, S.A.; Iftakhar Uddin, T.M.; Saifullah, A.Z.A. Current energy scenario and future prospect of renewable energy in Bangladesh. Renew. Sustain. Energy Rev. 2014, 39, 1074–1088. [Google Scholar] [CrossRef]
- Hasan, S.A.; Mozumder, P. Income and energy use in Bangladesh: A household level analysis. Energy Econ. 2017, 65, 115–126. [Google Scholar] [CrossRef]
- Islam, S.; Rahman Khan, M.Z. A Review of Energy Sector of Bangladesh. Energy Procedia 2017, 110, 611–618. [Google Scholar] [CrossRef]
- Karmaker, A.K.; Ahmed, M.R.; Hossain, M.A.; Sikder, M.M. Feasibility assessment & design of hybrid renewable energy based electric vehicle charging station in Bangladesh. Sustain. Cities Soc. 2018, 39, 189–202. [Google Scholar] [CrossRef]
- International Energy Agency. Electric Power Consumption (kWh Per Capita); The World Bank Group: Washington, DC, USA, 2015; Available online: http://data.worldbank.org/indicator/EG.USE.ELEC.KH.PC (accessed on 30 March 2018).
- Blueskymodel. Available online: http://blueskymodel.org/kilowatt-hour (accessed on 24 April 2018).
- Baten, M.Z.; Amin, E.M.; Sharin, A.; Islam, R.; Chowdhury, S.A. Renewable energy scenario of Bangladesh: Physical perspective. In Proceedings of the 1st International Conference on the Developments in Renewable Energy Technology (ICDRET), Dhaka, Bangladesh, 17–19 December 2009; pp. 1–5. [Google Scholar]
- Longo, M.; Akram Hossain, C.; Roscia, M. Smart Mobility for Green University Campus. In Proceedings of the 5th IEEE PES Asia-Pacific Power and Energy Engineering Conference (APPEEC 2013), Hong Kong, China, 8–11 December 2013; pp. 1–6. [Google Scholar]
- 14 Seater 72V 5KW DC System Electric Passenger Bus with CE Approved. Available online: http://langqing.en.alibaba.com/product/6019925602450125844/14_seater_72V_5KW_DC_system_Electric_passenger_bus_with_CE_approved.html (accessed on 24 April 2018).
- Getting Started Guide for HOMER Legacy (Version 2.68), January 2011. Available online: http://www.science.smith.edu/~jcardell/Courses/EGR325/Readings/HOMERGettingStartedGuide.pdf (accessed on 25 May 2018).
- Surface meteorology and Solar Energy, Ntrs.nasa.gov, 2018. Available online: https://ntrs.nasa.gov/search.jsp?R=20080012200 (accessed on 24 April 2018).
- Di Somma, M.; Graditi, G.; Heydarian-Forushani, E.; Shafie-khah, M.; Siano, P. Stochastic optimal scheduling of distributed energy resources with renewables considering economic and environmental aspects. Renew. Energy 2018, 116, 272–287. [Google Scholar] [CrossRef]
- Hasheminamin, M.; Agelidis, V.G.; Ahmadi, A.; Siano, P.; Teodorescu, R. Single-point reactive power control method on voltage rise mitigation in residential networks with high PV penetration. Renew. Energy 2018, 119, 504–551. [Google Scholar] [CrossRef]
- Consultant Report on “Distributed Generation Integration Cost Study” Prepared by Navigant Consultant, Inc. for California Energy Commission, November 2013. Available online: http://www.energy.ca.gov/2013publications/CEC-200-2013-007/CEC-200-2013-007.pdf (accessed on 24 April 2018).
- Electricity Prices for Different Periods of 11kV Distribution Line. Available online: http://www.bpdb.gov.com (accessed on 24 April 2018).
- Barua, S.; Hossain, C.A.; Rahman, M. Optimization of Grid-Tied Distributed Microgrid System with EV Charging Facility for the stadiums of Bangladesh. In Proceedings of the 2nd International Confernence on Electrical Engineering and Information & Communication Technology, Dhaka, Bangladesh, 21–23 May 2015; pp. 21–23. [Google Scholar]
- Donateo, T.; Congedo, P.M.; Malvoni, M.; Ingrosso, F. An integrated tool to monitor renewable energy flows and optimize the recharge of a fleet of plug-in electric vehicles in the campus of the University of Salento: Preliminary results. IFAC Proc. Vol. 2014, 19, 7861–7866. [Google Scholar] [CrossRef]
Figure 1.
Solar PV panels in the University of Dhaka.

Figure 2.
Average daily solar radiation and clearness.

Figure 3.
The typical map used for the calculation of the distance between (a) Dhaka University to Uttara and (b) Dhaka University to Jatra Bari.
Figure 3.
The typical map used for the calculation of the distance between (a) Dhaka University to Uttara and (b) Dhaka University to Jatra Bari.

Figure 4.
Seasonal load profile.

Figure 5.
A typical daily load profile.

Figure 6.
Model implemented in HOMER.

Figure 7.
Monthly average electricity production by the system.

Figure 8.
Yearly CO2 emissions for the oil-based transportation system.


Table 1.
Characteristics of the bus.
 | ||
|---|---|---|
| Model | LQY140A | LQY140AN (Gear Box) |
| Qty/20 GP container | Assembled: 1 unit, Disassembled: 2 units | |
| Qty/40 HQ container | Assembled: 2 units; Disassembled: 4 units | |
| Passenger Capacity | 14 | |
| Motor | 5 kW | |
| Battery | 6 V × 12 pcs | |
| Range | 100 km | |
| Max Speed | 40 km/h | |
| Climb Ability (loaded) | 15% | 28% |
| Charging Time | 8~10 h | |
| Kerb Weight | 1200 kg | 1220 kg |
| L × W × H (mm) | 4960 × 1430 × 2000 | |
Table 2.
Scheduled rate of National Grid Electricity in Bangladesh [23].
Table 2.
Scheduled rate of National Grid Electricity in Bangladesh [23].
| Model Rate (for 11 kV Line) | Grid Power Price ($/kWh) | Sell Back Rate ($/kWh) | Demand Rate ($/kW/month) |
|---|---|---|---|
| Off peak | 0.085 | 0.050 | 0.577 |
| Flat rate | 0.094 | 0.060 | 0.577 |
| Peak | 0.120 | 0.080 | 0.577 |
© 2018 by the authors. Licensee MDPI, Basel, Switzerland. This article is an open access article distributed under the terms and conditions of the Creative Commons Attribution (CC BY) license (http://creativecommons.org/licenses/by/4.0/).
Share and Cite
MDPI and ACS Style
Chowdhury, N.; Hossain, C.A.; Longo, M.; Yaïci, W. Optimization of Solar Energy System for the Electric Vehicle at University Campus in Dhaka, Bangladesh. Energies 2018, 11, 2433. https://doi.org/10.3390/en11092433
AMA Style
Chowdhury N, Hossain CA, Longo M, Yaïci W. Optimization of Solar Energy System for the Electric Vehicle at University Campus in Dhaka, Bangladesh. Energies. 2018; 11(9):2433. https://doi.org/10.3390/en11092433
Chicago/Turabian StyleChowdhury, Nusrat, Chowdhury Akram Hossain, Michela Longo, and Wahiba Yaïci. 2018. "Optimization of Solar Energy System for the Electric Vehicle at University Campus in Dhaka, Bangladesh" Energies 11, no. 9: 2433. https://doi.org/10.3390/en11092433
Note that from the first issue of 2016, this journal uses article numbers instead of page numbers. See further details here.