Enhancing Green Building Rating of a School under the Hot Climate of UAE; Renewable Energy Application and System Integration


Abstract
:1. Introduction
2. Analysis of the School Green Rating System Performance
3. Methodology
4. Results and Discussion
4.1. Photovoltaic System Performance
4.2. Solar Absorption Chiller Performance
4.3. Geothermal System Performance
5. Credit Enhancement Verification of the Local Green Rating System
6. System Integration
7. Conclusions
Author Contributions
Funding
Conflicts of Interest
References
- Statistics-Center. Energy and Water Statistics. 2015. Available online: http://ecocci.org/images/stories/ECO_data/Announcement/Energy_and_Water_Statistics_2015.pdf (accessed on 12 September 2017).
- Lin, M.; Afshari, A.; Azar, E. A data-driven analysis of building energy use with emphasis on operation and maintenance: A case study from the UAE. J. Clean. Prod. 2018, 192, 169–178. [Google Scholar] [CrossRef]
- Mokhtar, M.; Ali, M.T.; Bräuniger, S.; Afshari, A.; Sgouridis, S.; Armstrong, P.; Chiesa, M. Systematic comprehensive techno-economic assessment of solar cooling technologies using location-specific climate data. Appl. Energy 2010, 87, 3766–3778. [Google Scholar] [CrossRef]
- Friess, A.W.; Rakhshan, K. A review of passive envelope measures for improved building energy efficiency in the UAE. Renew. Sustain. Energy Rev. 2017, 72, 485–496. [Google Scholar] [CrossRef]
- Estidama. Available online: http://estidama.upc.gov.ae/estidama-and-pearl-rating-system.aspx?lang=en-US (accessed on 22 January 2017).
- Estidama. The Pearl Rating System for Estidama. Available online: http://estidama.upc.gov.ae/template/estidama/docs/PBRS%20Version%201.0.pdf (accessed on 18 April 2016).
- Sgouridis, S.; Griffiths, S.; Kennedy, S.; Khalid, A.; Zurita, N. A sustainable energy transition strategy for the United Arab Emirates: Evaluation of options using an integrated energy model. Energy Strategy Rev. 2013, 2, 8–18. [Google Scholar] [CrossRef]
- Sgouridis, S.; Abdullah, A.; Griffiths, S.; Saygin, D.; Wagner, N.; Gielen, D.; Reinisch, H.; McQueen, D. Re-mapping the uae’s energy transition: An economy-wide assessment of renewable energy options and their policy implications. Renew. Sustain. Energy Rev. 2016, 55, 1166–1180. [Google Scholar] [CrossRef]
- Alnaser, W.E.; Alnaser, N.W. The status of renewable energy in the GCC countries. Renew. Sustain. Energy Rev. 2011, 15, 3074–3098. [Google Scholar] [CrossRef]
- Doukas, H.; Patlitzianas, K.D.; Kagiannas, A.G.; Psarras, J. Renewable energy sources and rationale use of energy development in the countries of GCC: Myth or reality? Renew. Energy 2006, 31, 755–770. [Google Scholar] [CrossRef]
- Patlitzianas, D.K.; Doukas, H.; Psarras, J. Enhancing renewable energy in the Arab states of the gulf: Constraints & efforts. Energy Policy 2006, 34, 3719–3726. [Google Scholar]
- Taleb, H.; Al-Saleh, Y. Applying energy-efficient water heating practices to the residential buildings of the united arab emirates. Int. J. Environ. Sustain. 2014, 9, 35–51. [Google Scholar]
- Berg, A. Not roadmaps but toolboxes: Analysing pioneering national programmes for sustainable consumption and production. J. Consum. Policy 2011, 34, 9–23. [Google Scholar] [CrossRef]
- Cincera, J.; Krajhanzl, J. Eco-schools: What factors influence pupils’ action competence for pro-environmental behaviour? J. Clean. Prod. 2013, 61, 117–121. [Google Scholar] [CrossRef]
- Central-Intelligence-Agency. United Arab Emirates Electricity Consumption. Available online: http://www.indexmundi.com/g/g.aspx?c=tc&v=81 (accessed on 19 January 2017).
- ADEC. Educational Facilities Design Manual; Abu Dhabi Education Council: Abu Dhabi, UAE, 2010. [Google Scholar]
- ADEC. Sheikha Bint Sroor Public School Data; Dakheel, J.A., Ed.; ADEC: Abu Dhabi, UAE, 2016. [Google Scholar]
- World-Weather. Abu Dhabi Monthly Climate Average, United Arab Emirates. Available online: https://ar.worldweatheronline.com/abu-dhabi-weather-averages/abu-dhabi/ae.aspx (accessed on 14 January 2017).
- Radhi, H. Evaluating the potential impact of global warming on the uae residential buildings—A contribution to reduce the CO2 emissions. Build. Environ. 2009, 44, 2451–2462. [Google Scholar] [CrossRef]
- Climate-Consultant. Ground Temperatures of Abu Dhabi. In Climate Consultant, version 5.5; United States Department of Energy: Washington, DC, USA, 2017. [Google Scholar]
- Hasan, A.; Sarwar, J.; Alnoman, H.; Abdelbaqi, S. Yearly energy performance of a photovoltaic-phase change material (PV-PCM) system in hot climate. Sol. Energy 2017, 146, 417–429. [Google Scholar] [CrossRef]
- Hayter, S.; Kandt, A. Renewable Energy Applications for Existing Buildings; National Renewable Energy Laboratory: Golden, CO, USA, 2011. [Google Scholar]
- Walwil, H.M.; Mukhaimer, A.; Al-Sulaiman, F.A.; Said, S.A. Comparative studies of encapsulation and glass surface modification impacts on PV performance in a desert climate. Sol. Energy 2017, 142, 288–298. [Google Scholar] [CrossRef]
- Emziane, M.; Al Ali, M. Performance assessment of rooftop PV systems in Abu Dhabi. Energy Build. 2015, 108, 101–105. [Google Scholar] [CrossRef]
- Al Ali, M.; Emziane, M. Performance analysis of rooftop PV systems in Abu Dhabi. Energy Procedia 2013, 42, 689–697. [Google Scholar] [CrossRef]
- Radhi, H. Energy analysis of façade-integrated photovoltaic systems applied to UAE commercial buildings. Sol. Energy 2010, 84, 2009–2021. [Google Scholar] [CrossRef]
- Shirazi, A.; Taylor, R.A.; Morrison, G.L.; White, S.D. A comprehensive, multi-objective optimization of solar-powered absorption chiller systems for air-conditioning applications. Energy Convers. Manag. 2017, 132, 281–306. [Google Scholar] [CrossRef]
- Bellos, E.; Tzivanids, C.; Symeou, C.; Antonopoulos, K.A. Energetic, exergetic and financial evaluation of a solar driven absorption chiller—A dynamic approach. Energy Convers. Manag. 2017, 137, 34–48. [Google Scholar] [CrossRef]
- Fong, K.F.; Lee, C.K.; Zhao, T.F. Effective design and operation strategy of renewable cooling and heating system for building application in hot-humid climate. Sol. Energy 2017, 143, 1–9. [Google Scholar] [CrossRef]
- Salem, A.; Hashim, H. A feasibility of geothermal cooling in Middle East. Latest Trends Sustain. Green Dev. 2010, 105–112. [Google Scholar]
- TRNSYS. What Is TRNSYS? Available online: http://www.trnsys.com/ (accessed on 14 February 2017).
- Chargui, R.; Sammouda, H.; Farhat, A. Geothermal heat pump in heating mode: Modeling and simulation on trnsys. Int. J. Refrig. 2012, 35, 1824–1832. [Google Scholar] [CrossRef]
- Cocchi, S.; Castellucci, S.; Tucci, A. Modeling of an air conditioning system with geothermal heat pump for a residential building. Math. Probl. Eng. 2013, 2013, 781231. [Google Scholar] [CrossRef]
- Safa, A.A.; Fung, A.S.; Kumar, R. Heating and cooling performance characterisation of ground source heat pump system by testing and TRNSYS simulation. Renew. Energy 2015, 83, 565–575. [Google Scholar] [CrossRef]
- Florides, G.A.; Kalogirou, S.A.; Tassou, S.A.; Wrobel, L.C. Modelling and simulation of an absorption solar cooling system for Cyprus. Sol. Energy 2002, 72, 43–51. [Google Scholar] [CrossRef]
- Kim, B.; Park, J. Dynamic simulation of a single-effect ammonia—Water absorption chiller. Int. J. Refrig. 2007, 30, 535–545. [Google Scholar] [CrossRef]
- Asim, M.; Dewsbury, J.; Kanan, S. TRNSYS simulation of a solar cooling system for the hot climate of Pakistan. Energy Procedia 2016, 91, 702–706. [Google Scholar] [CrossRef]
- Li, Y.; Jing, D. investigation of the performance of photovoltaic/thermal system by a coupled TRNSYS and CFD simulation. Sol. Energy 2017, 143, 100–112. [Google Scholar] [CrossRef]
- Vuong, E.; Kamel, R.S.; Fung, A.S. Modelling and simulation of BIPV/T in EnergyPlus and TRNSYS. Energy Procedia 2015, 78, 1883–1888. [Google Scholar] [CrossRef]
- Quesada, B.; Sánchez, C.; Cañada, J.; Royo, R.; Payá, J. Experimental results and simulation with TRNSYS of a 7.2 KWp grid-connected photovoltaic system. Appl. Energy 2011, 88, 1772–1783. [Google Scholar] [CrossRef]
- Soussi, M.; Balghouthi, M.; Guizani, A.; Bouden, C. Model performance assessment and experimental analysis of a solar assisted cooling system. Sol. Energy 2017, 143, 43–62. [Google Scholar] [CrossRef]
- Al-Alili, A.; Hwang, Y.; Radermacher, R.; Kubo, I. Optimization of a solar powered absorption cycle under Abu Dhabi’s weather conditions. Sol. Energy 2010, 84, 2034–2040. [Google Scholar] [CrossRef]
- Dai, Y.; Li, X.; Wang, R. Theoretical analysis and case study on solar driven two-stage rotary desiccant cooling system combined with geothermal heat pump. Energy Procedia 2015, 70, 418–426. [Google Scholar] [CrossRef]
- Angrisani, G.; Diglio, G.; Sasso, M.; Calise, F.; d’Accadia, M.D. Design of a novel geothermal heating and cooling system: Energy and economic analysis. Energy Convers. Manag. 2016, 108, 144–159. [Google Scholar] [CrossRef]
- Alchemie. Solar Cells. Available online: http://www.solar-facts-and-advice.com/solar-cells.html (accessed on 13 March 2017).
- Gunerhan, H.; Hepbasli, A. Determination of the optimum tilt angle of solar collectors for building applications. Build. Environ. 2007, 42, 779–783. [Google Scholar] [CrossRef]
- Jafarkazemi, F.; Saadabadi, S.A. Optimum tilt angle and orientation of solar surfaces in Abu Dhabi, UAE. Renew. Energy 2013, 56, 44–49. [Google Scholar] [CrossRef]
- Assi, A.; Jama, M.; Al Kathairi, K.; Al Shehhi, I.; Fattahi, S. Predicting the electrical behavior of grid-tied photovoltaic systems in al ain-uae/model and case study. In Proceedings of the 2008 IEEE International Conference on Sustainable Energy Technologies, Singapore, 24–27 November 2008; pp. 443–447. [Google Scholar]
- Ernst, W.D.; Shaltens, R.K. Automotive Stirling Engine Development Project; Mechanical Technology, Inc.: Latham, NY, USA, 1997. [Google Scholar]
- Kong, X.Q.; Wang, R.Z.; Huang, X.H. Energy efficiency and economic feasibility of CCHP driven by Stirling engine. Energy Convers. Manag. 2004, 45, 1433–1442. [Google Scholar] [CrossRef]
- Syed, A.; Izquierdo, M.; Rodriguez, P.; Maidment, G.; Missenden, J.; Lecuona, A.; Tozer, R. A novel experimental investigation of a solar cooling system in Madrid. Int. J. Refrig. 2005, 28, 859–871. [Google Scholar] [CrossRef]
- Acuña, A.; Lara, F.; Rosales, P.; Suastegui, J.; Velázquez, N.; Ruelas, A. Impact of a vertical geothermal heat exchanger on the solar fraction of a solar cooling system. Int. J. Refrig. 2017, 76, 63–72. [Google Scholar] [CrossRef]
- Lee, K.S. Underground thermal energy storage. In Underground Thermal Energy Storage; Springer: London, UK, 2013; pp. 15–26. [Google Scholar]
- IRENA. District Heating and Cooling; IRENA: Abu Dhabi, UAE, 2017. [Google Scholar]


| System/Criteria | Advantages | Limitations | Performance | Payback Period versus Life Span |
|---|---|---|---|---|
| Photovoltaic system [23] | Annual solar radiation of 2285 kWh/m2, expected energy of 850 kW year/m2). | Dust results in radiation reduction on panel. High temperature results in power losses. | Electrical energy production of 322 kWh/m2-year [24,25]. | Pay-back period: 3–5 years [26] based on unsubsidized tariffs. Lifespan: 25–30 years. |
| Solar absorption cooling system [27,28] | Annual solar radiation of 182,800 kWh/m2. | High initial cost. Dust on collectors results in radiation reduction. High temperature results in power losses. | A cooling energy production of 1059 kWh/m2-year. | Average payback period: 4–10 years. Lifespan: 25–35 years. |
| Geothermal cooling system [20,29] | Ground temperature is used to modulate interior temperature (difference up to 20 °C during summer) | High initial cost. Land required to install the loop. Lower temperature gradient in moderate seasons. | Cooling energy delivered by 46 kWh/year-m length of borehole [30]. | Average payback period: 7–10 years according to the system size. Life span: up to 50 years. |
| System | Peak Capacity (kW) | Annual Energy Consumption (MWh) |
|---|---|---|
| Space cooling (peak months) | 360.5 | 777.6 |
| Heat rejection | 49.4 | 151 |
| Space heating | 79.7 | 0.066 |
| Pumping energy | 42.8 | 105.7 |
| Interior Fans | 304.6 | 276.9 |
| Interior Lighting | 188.3 | 410 |
| Service Water Heating | 200.0 | 231.8 |
| Receptacle/Process Equipment | 167.5 | 252 |
| Total | 1392.9 | 2206 |
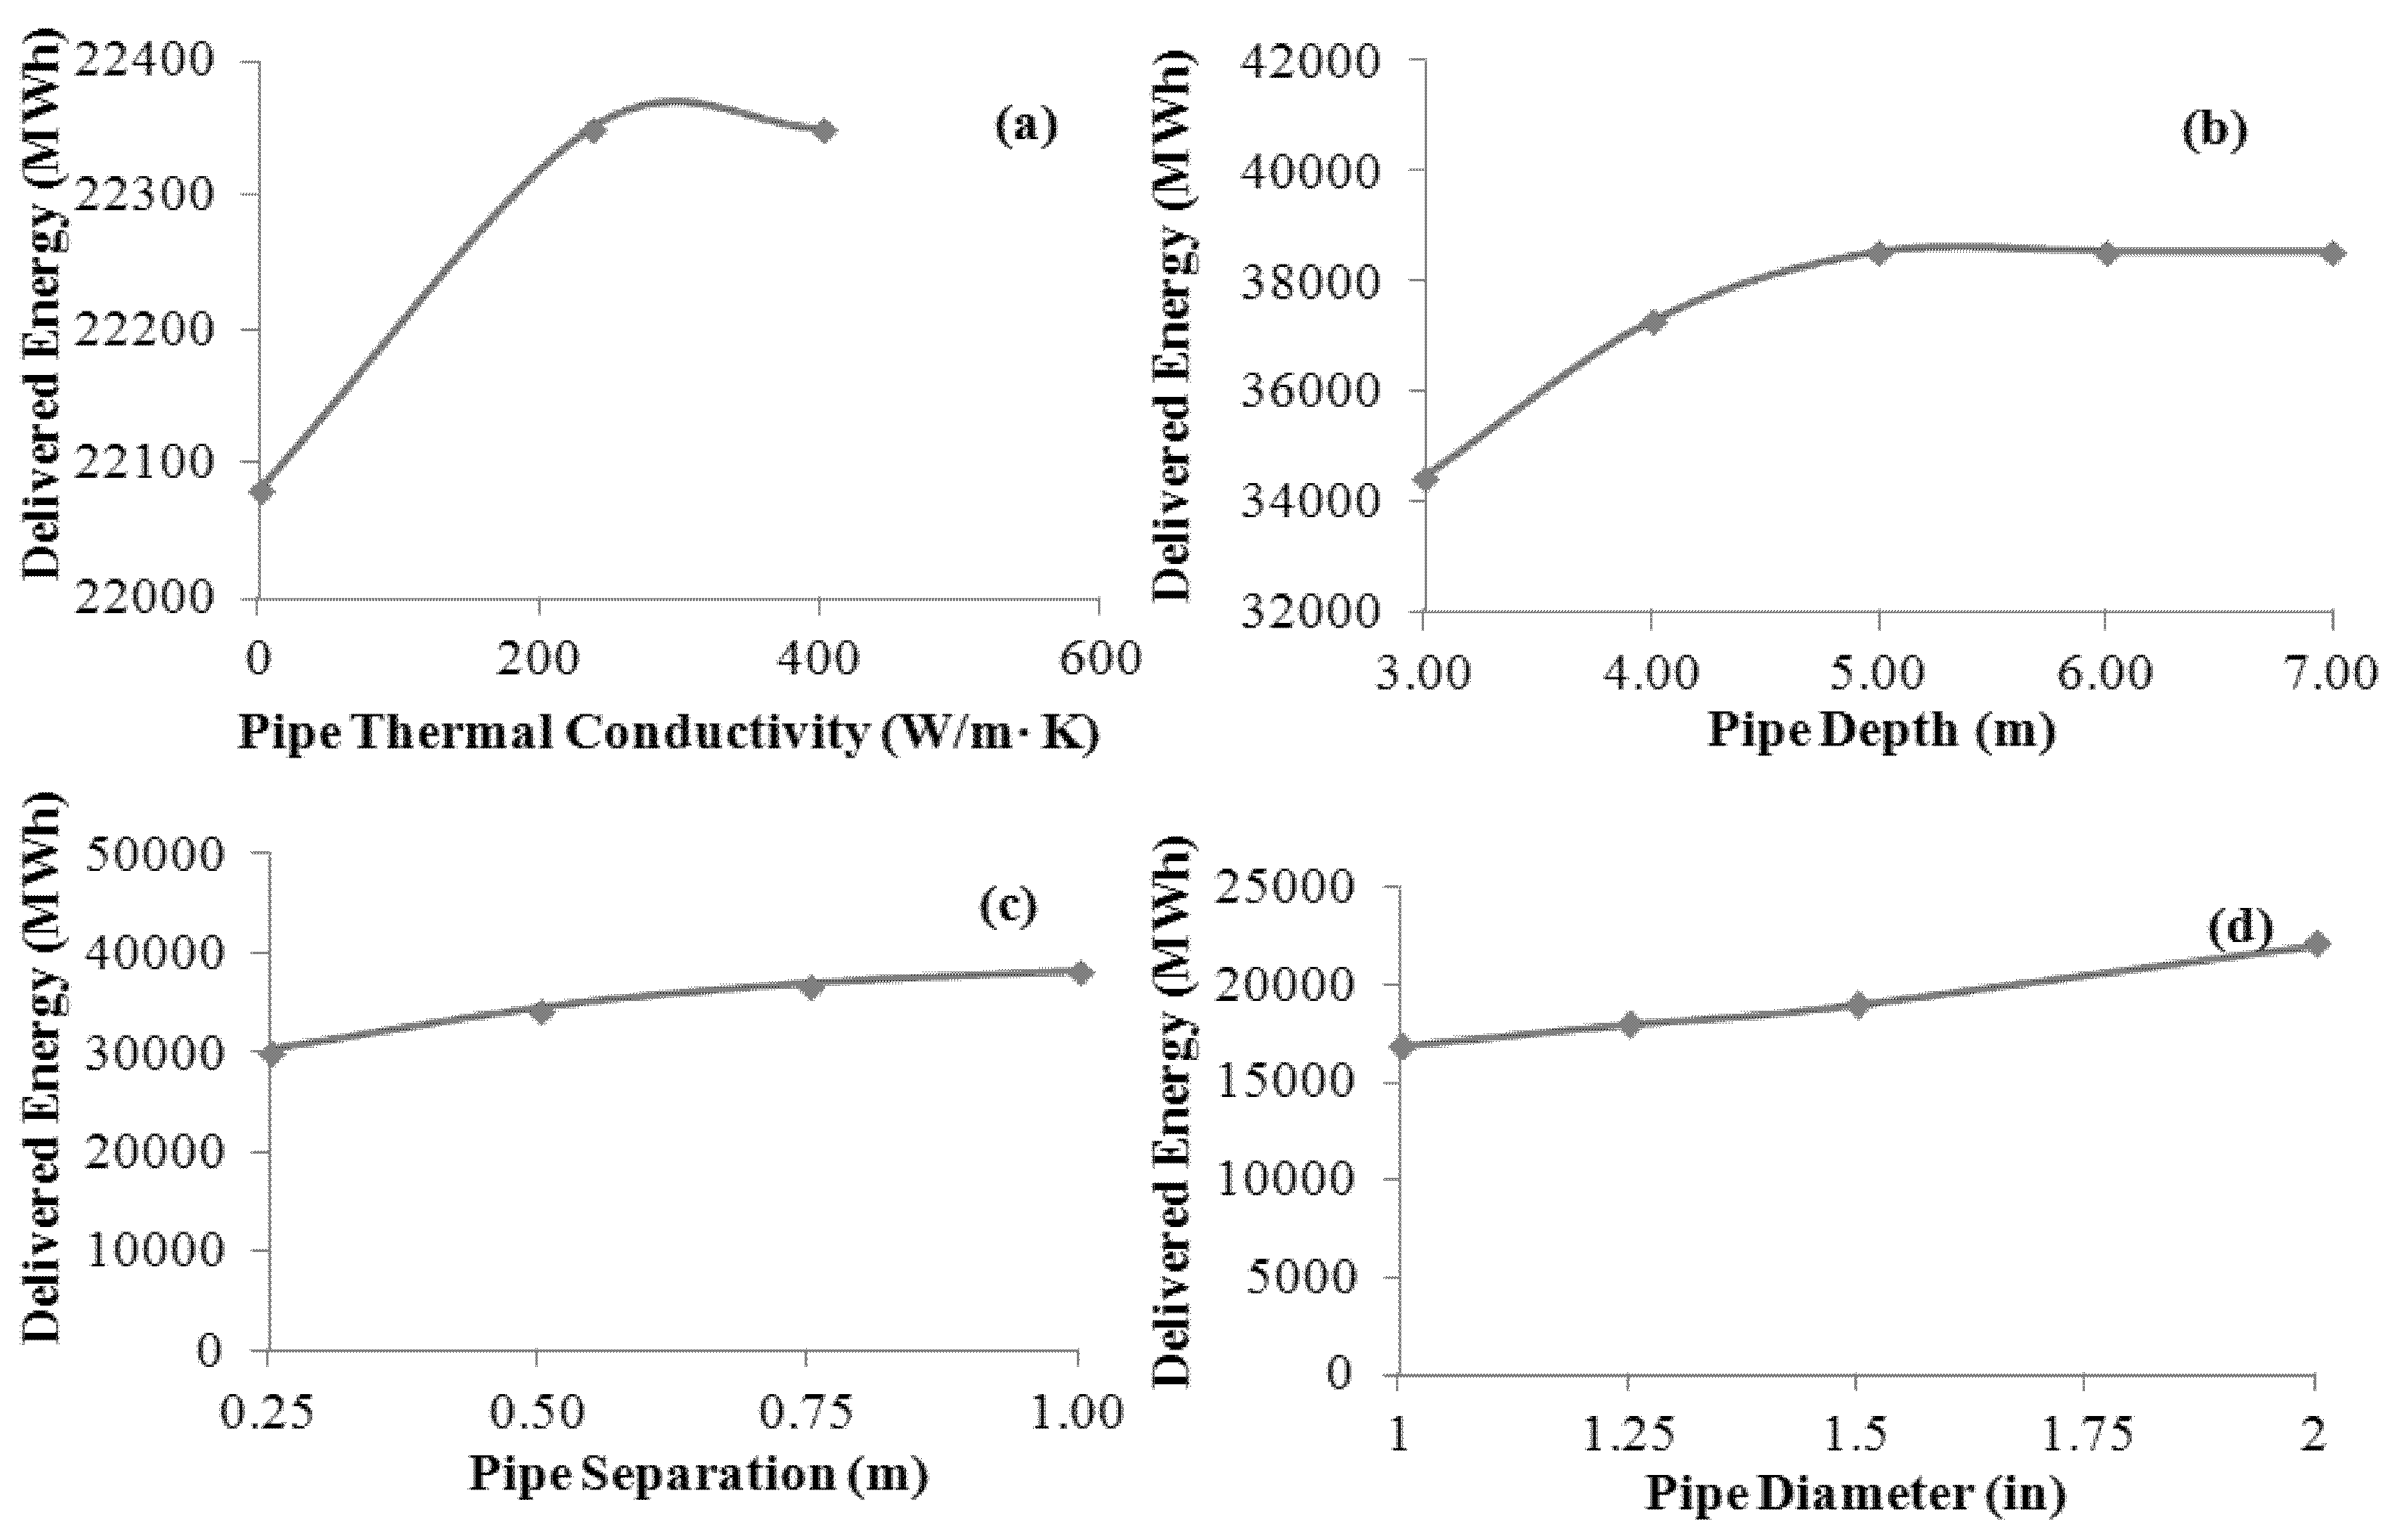
| Parameters | Values |
|---|---|
| Fluid Flow rate | 400–4400 kg/h in increments of 400 kg/h |
| Pipe Length | 200–2800 m in increments of 200 m |
| Pipe Diameter | 1 inch, 1.25 inches, 1.5 inches, 2 inches |
| Pipe Material | Aluminum, Copper, Polyethylene |
| Pipe Depth | 3 m, 4 m, 5 m, 6 m, 7 m |
| Pipe Spacing | 0.25 m, 0.5 m, 0.75 m, 1 m |
© 2018 by the authors. Licensee MDPI, Basel, Switzerland. This article is an open access article distributed under the terms and conditions of the Creative Commons Attribution (CC BY) license (http://creativecommons.org/licenses/by/4.0/).
Share and Cite
Al Dakheel, J.; Tabet Aoul, K.; Hassan, A. Enhancing Green Building Rating of a School under the Hot Climate of UAE; Renewable Energy Application and System Integration. Energies 2018, 11, 2465. https://doi.org/10.3390/en11092465
Al Dakheel J, Tabet Aoul K, Hassan A. Enhancing Green Building Rating of a School under the Hot Climate of UAE; Renewable Energy Application and System Integration. Energies. 2018; 11(9):2465. https://doi.org/10.3390/en11092465
Chicago/Turabian StyleAl Dakheel, Joud, Kheira Tabet Aoul, and Ahmed Hassan. 2018. "Enhancing Green Building Rating of a School under the Hot Climate of UAE; Renewable Energy Application and System Integration" Energies 11, no. 9: 2465. https://doi.org/10.3390/en11092465