Analysis of the Methodology to Obtain Several Key Indicators Performance (KIP), by Energy Retrofitting of the Actual Building to the District Heating Fuelled by Biomass, Focusing on nZEB Goal: Case of Study
Abstract
:1. Introduction
2. Case Study
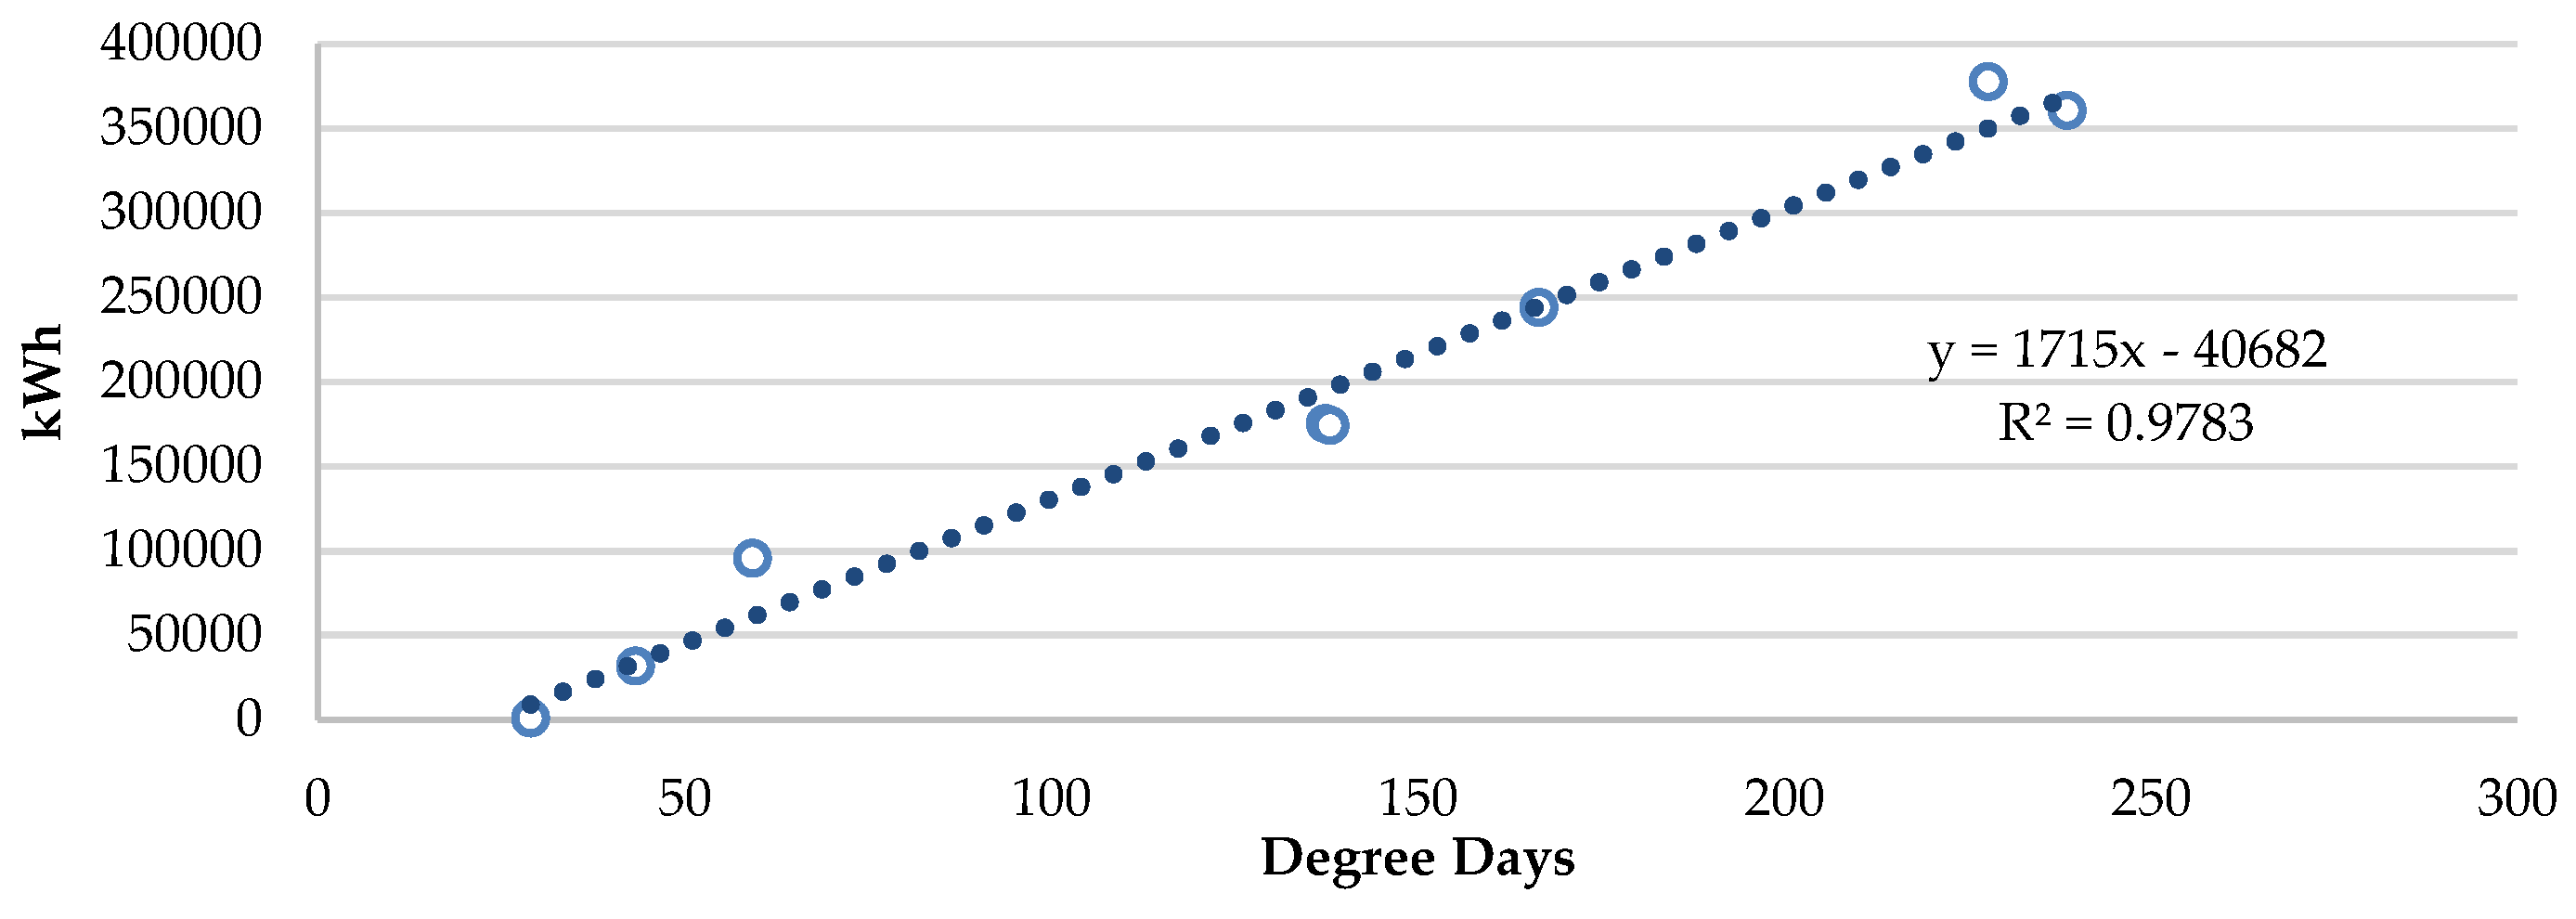
2.1. Thermal Consumption
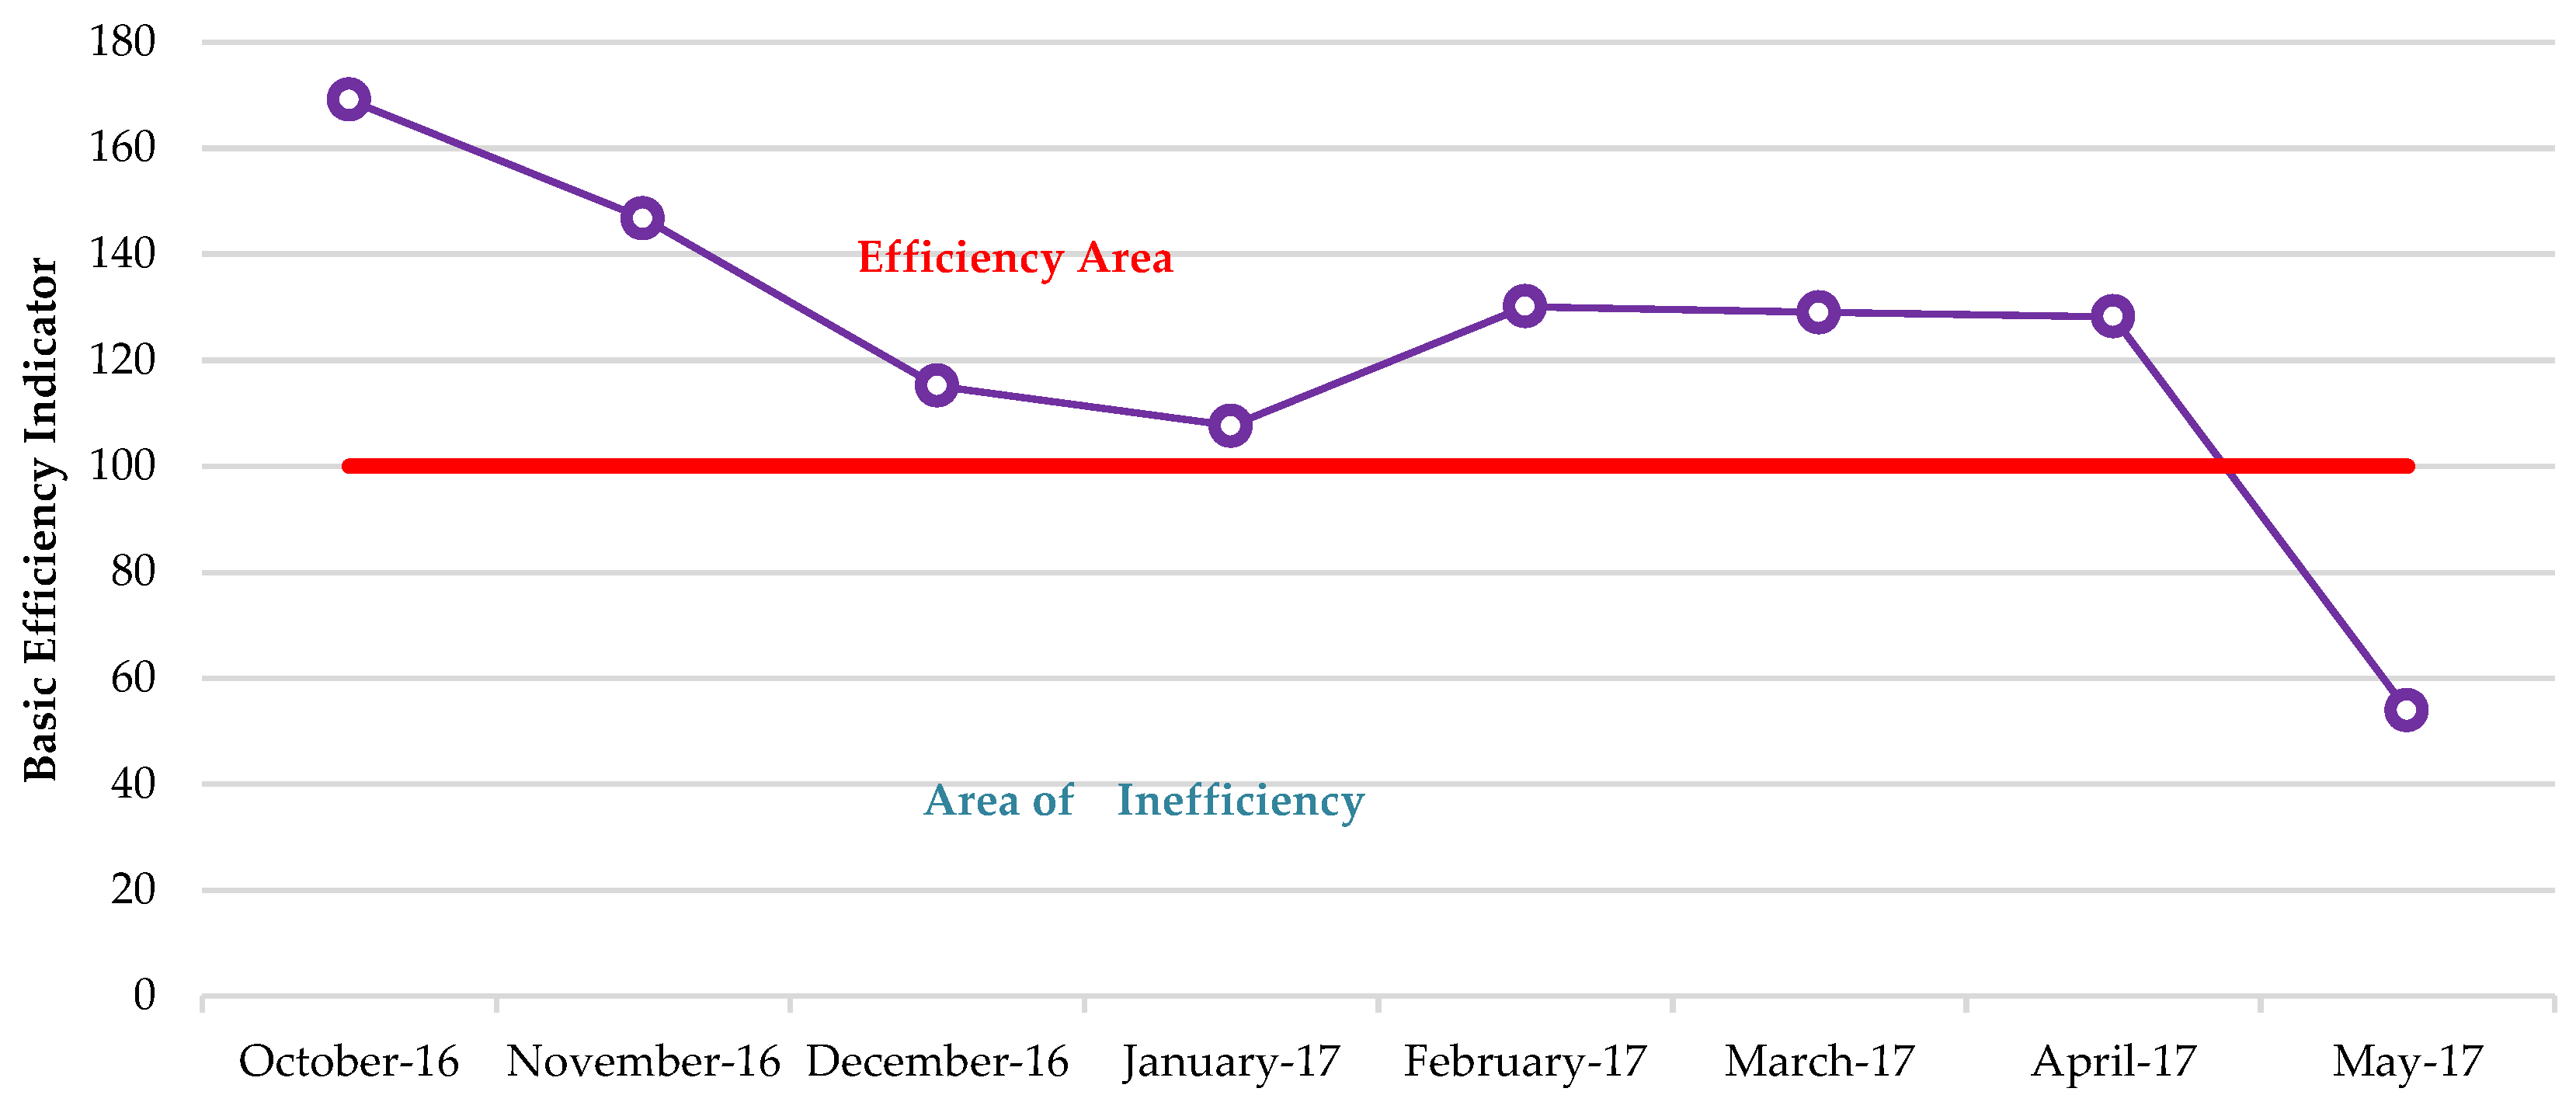
2.1.1. Basic Efficiency Indicator I100
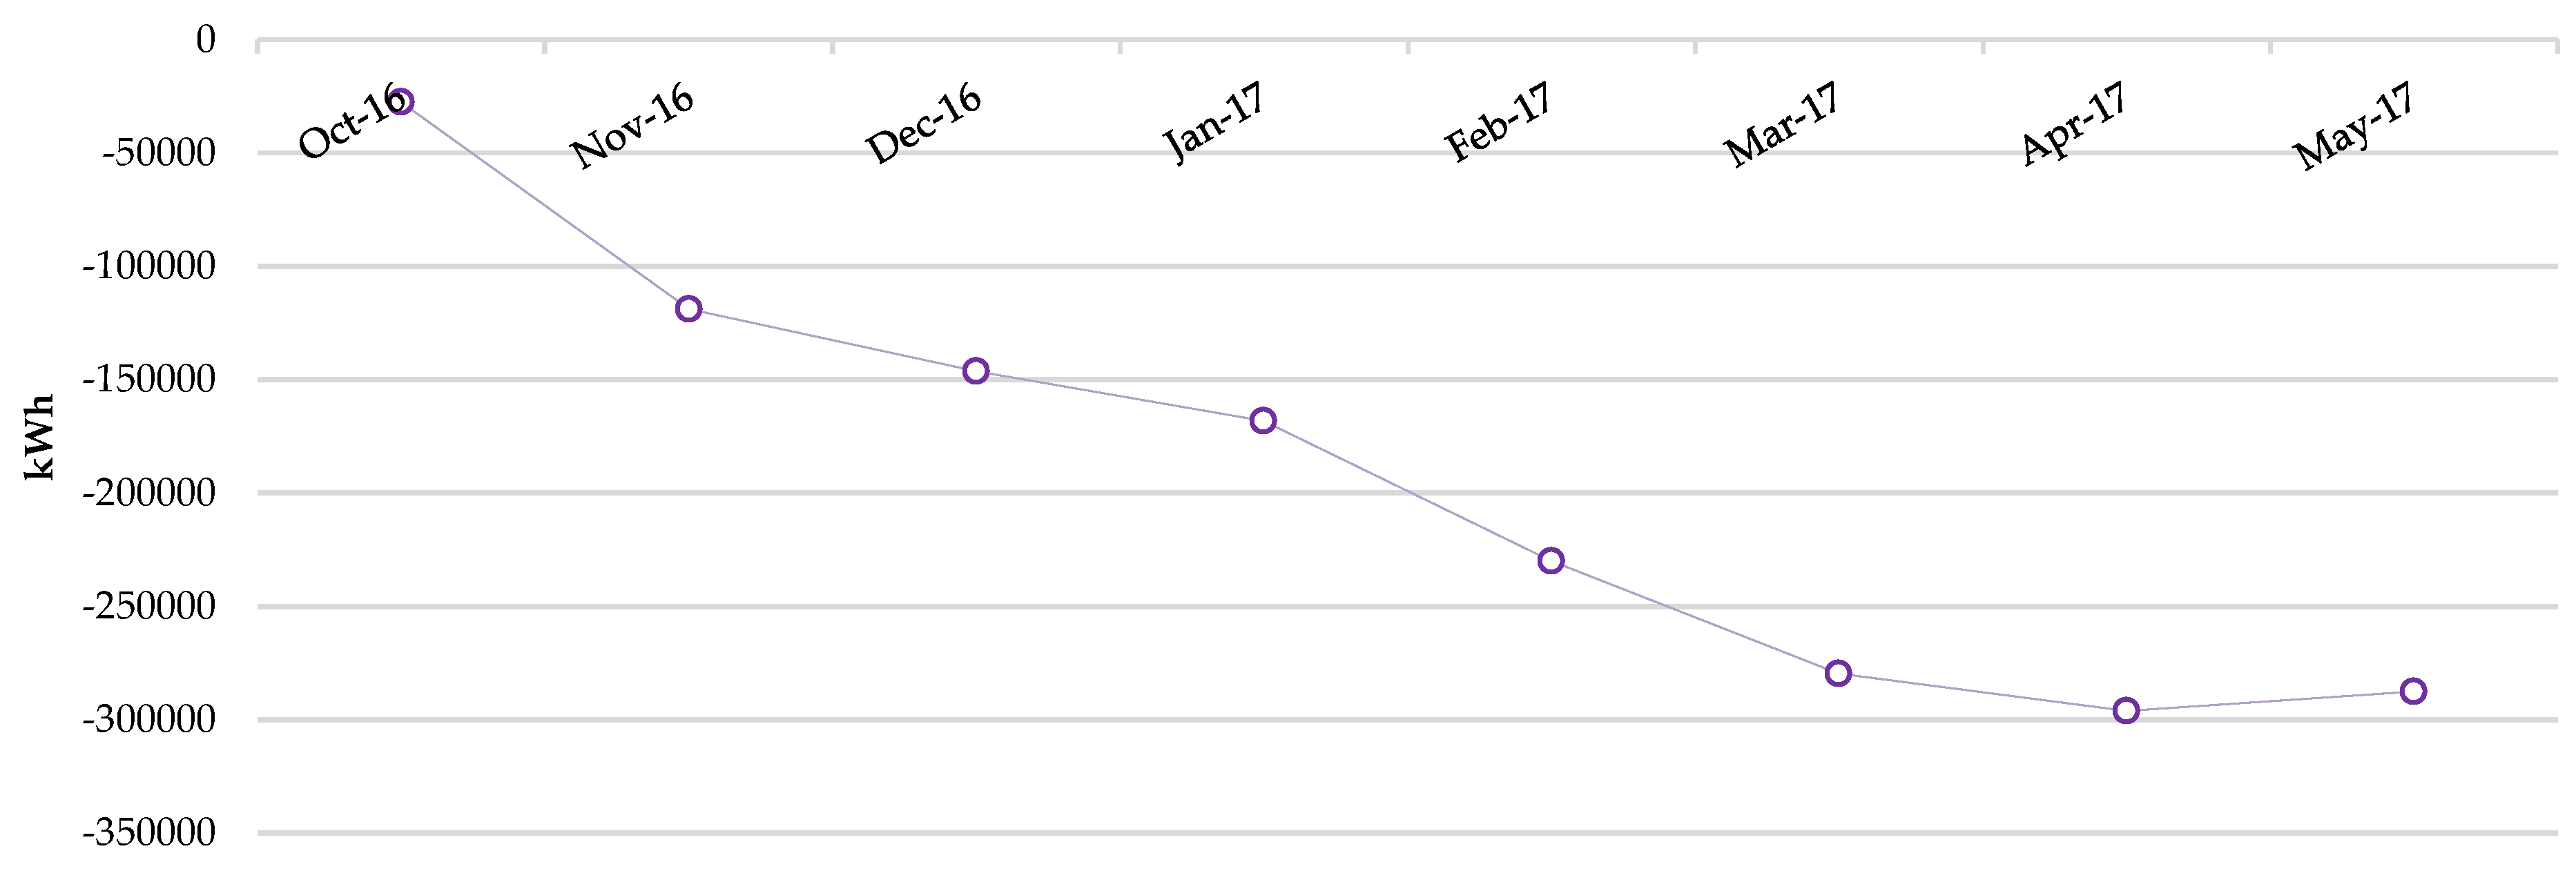
2.1.2. Cusum Indicator
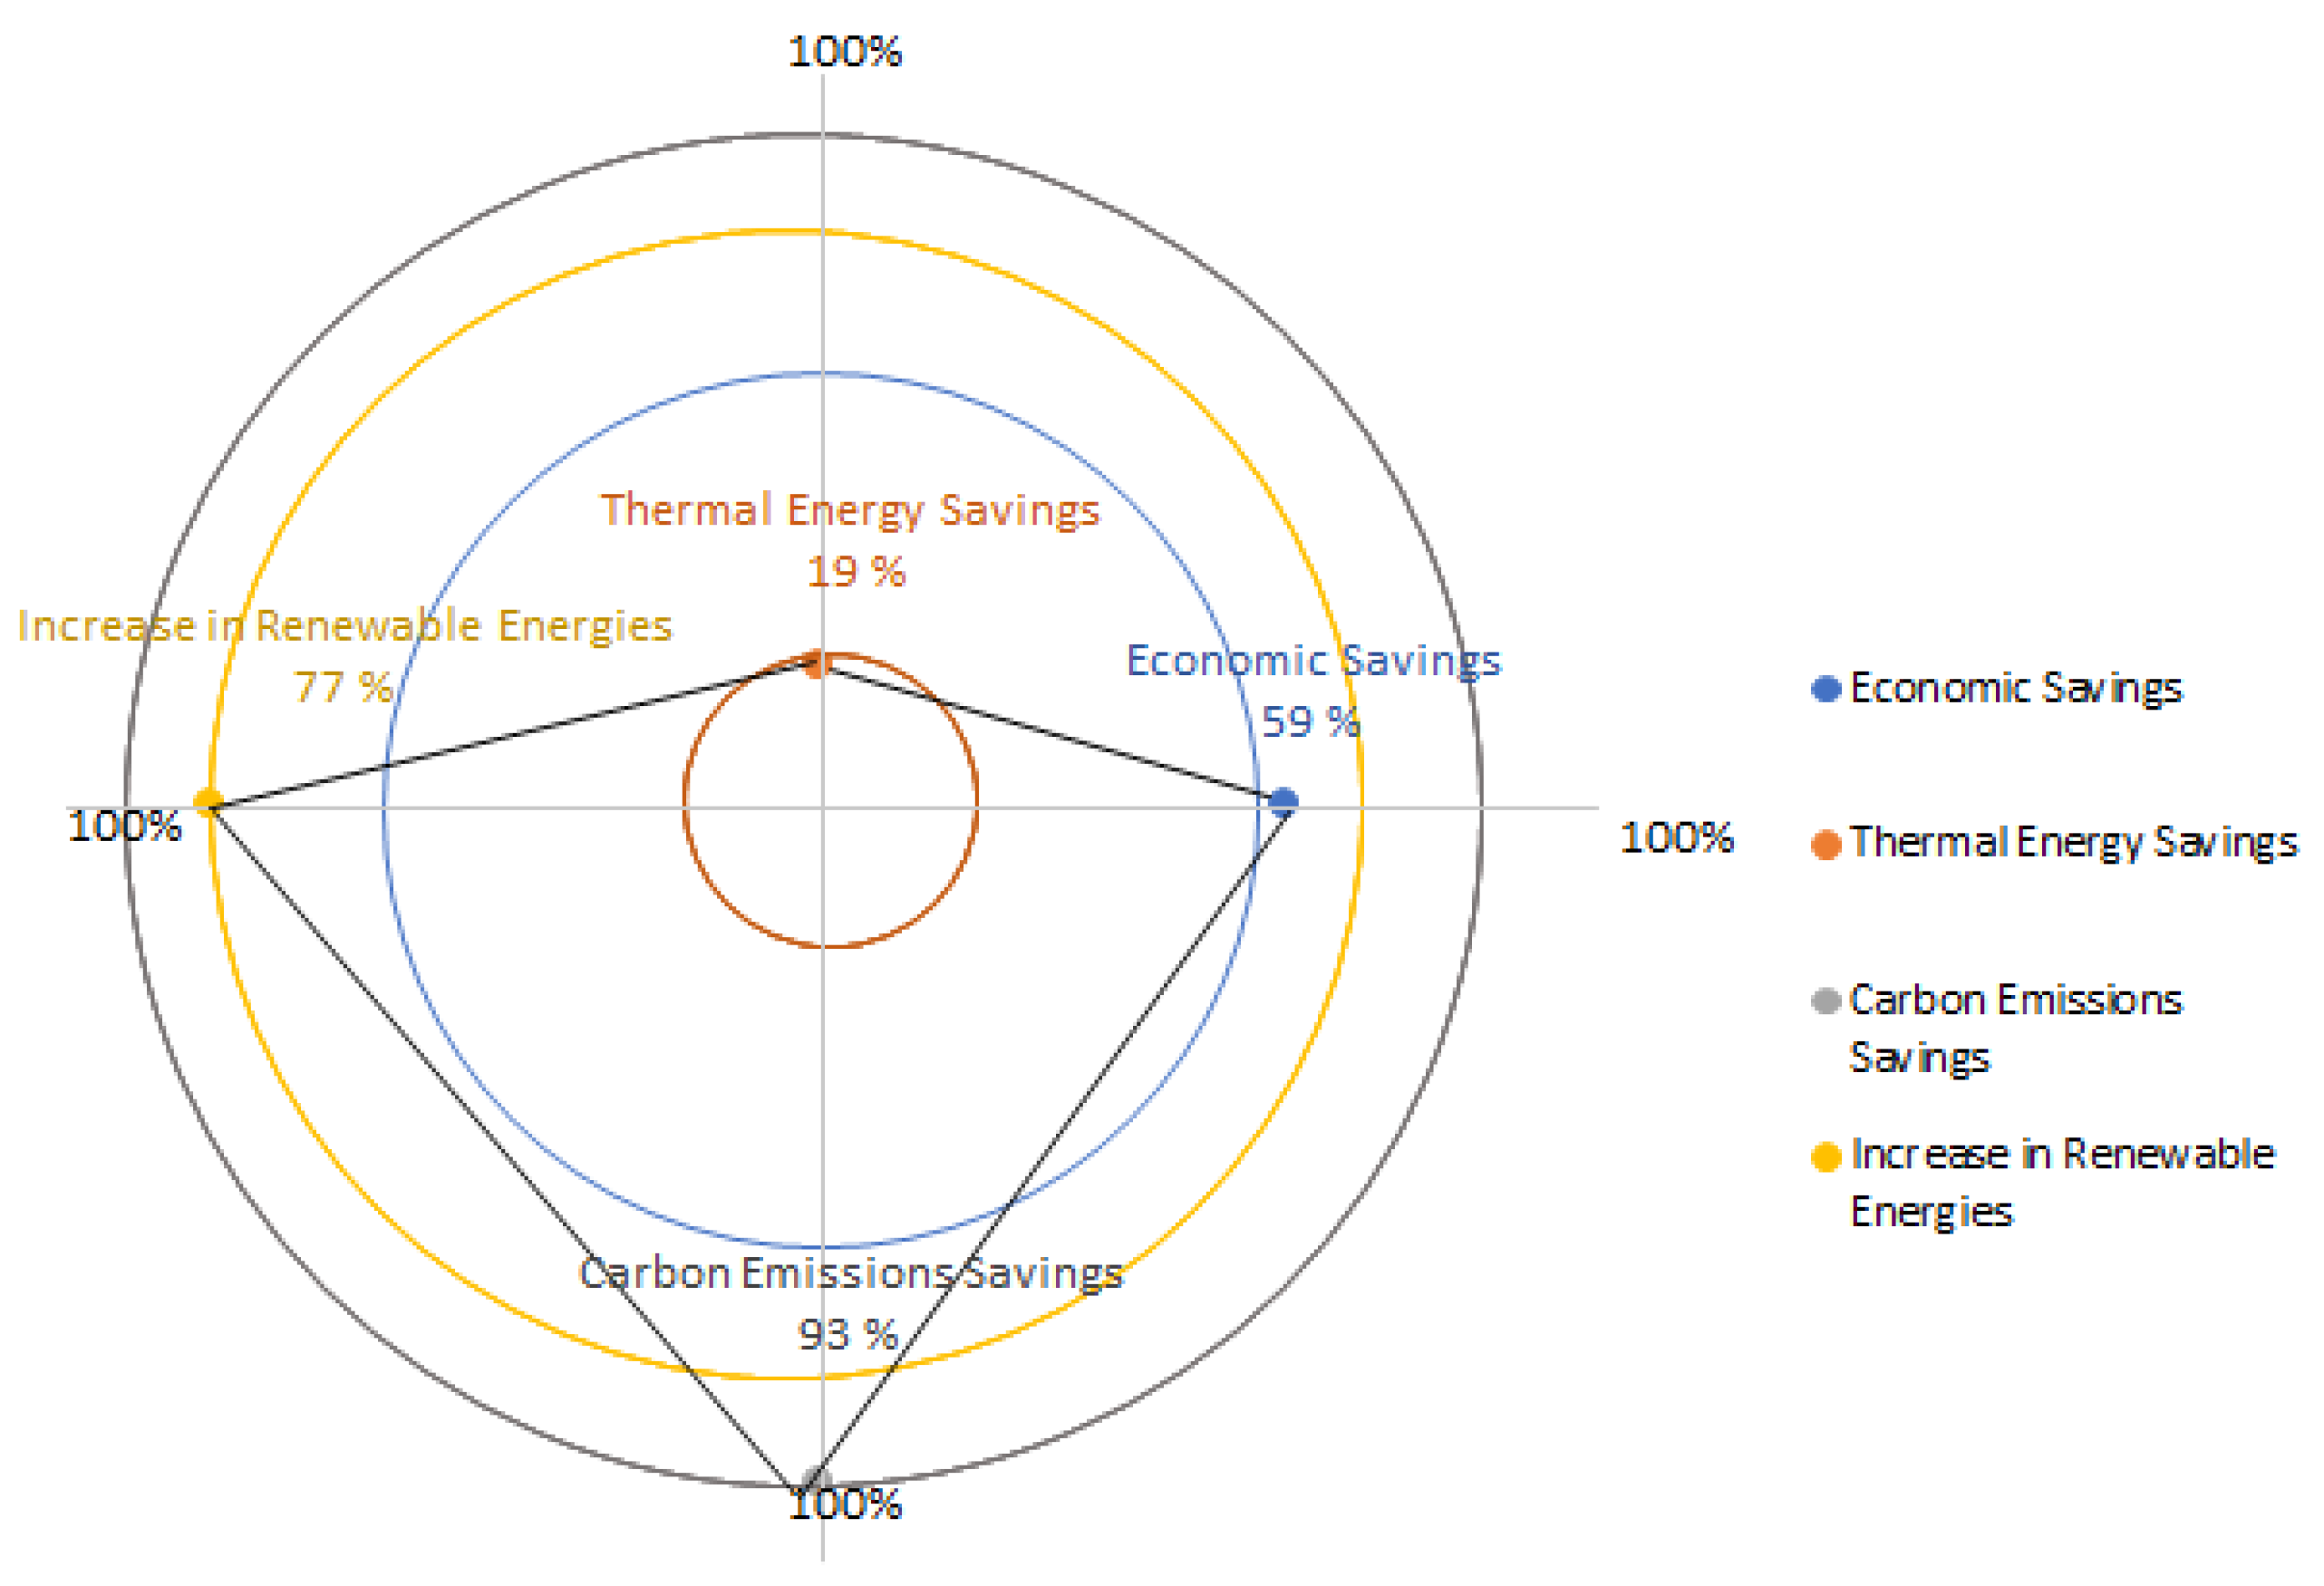
2.1.3. The Primary Energy Indicator
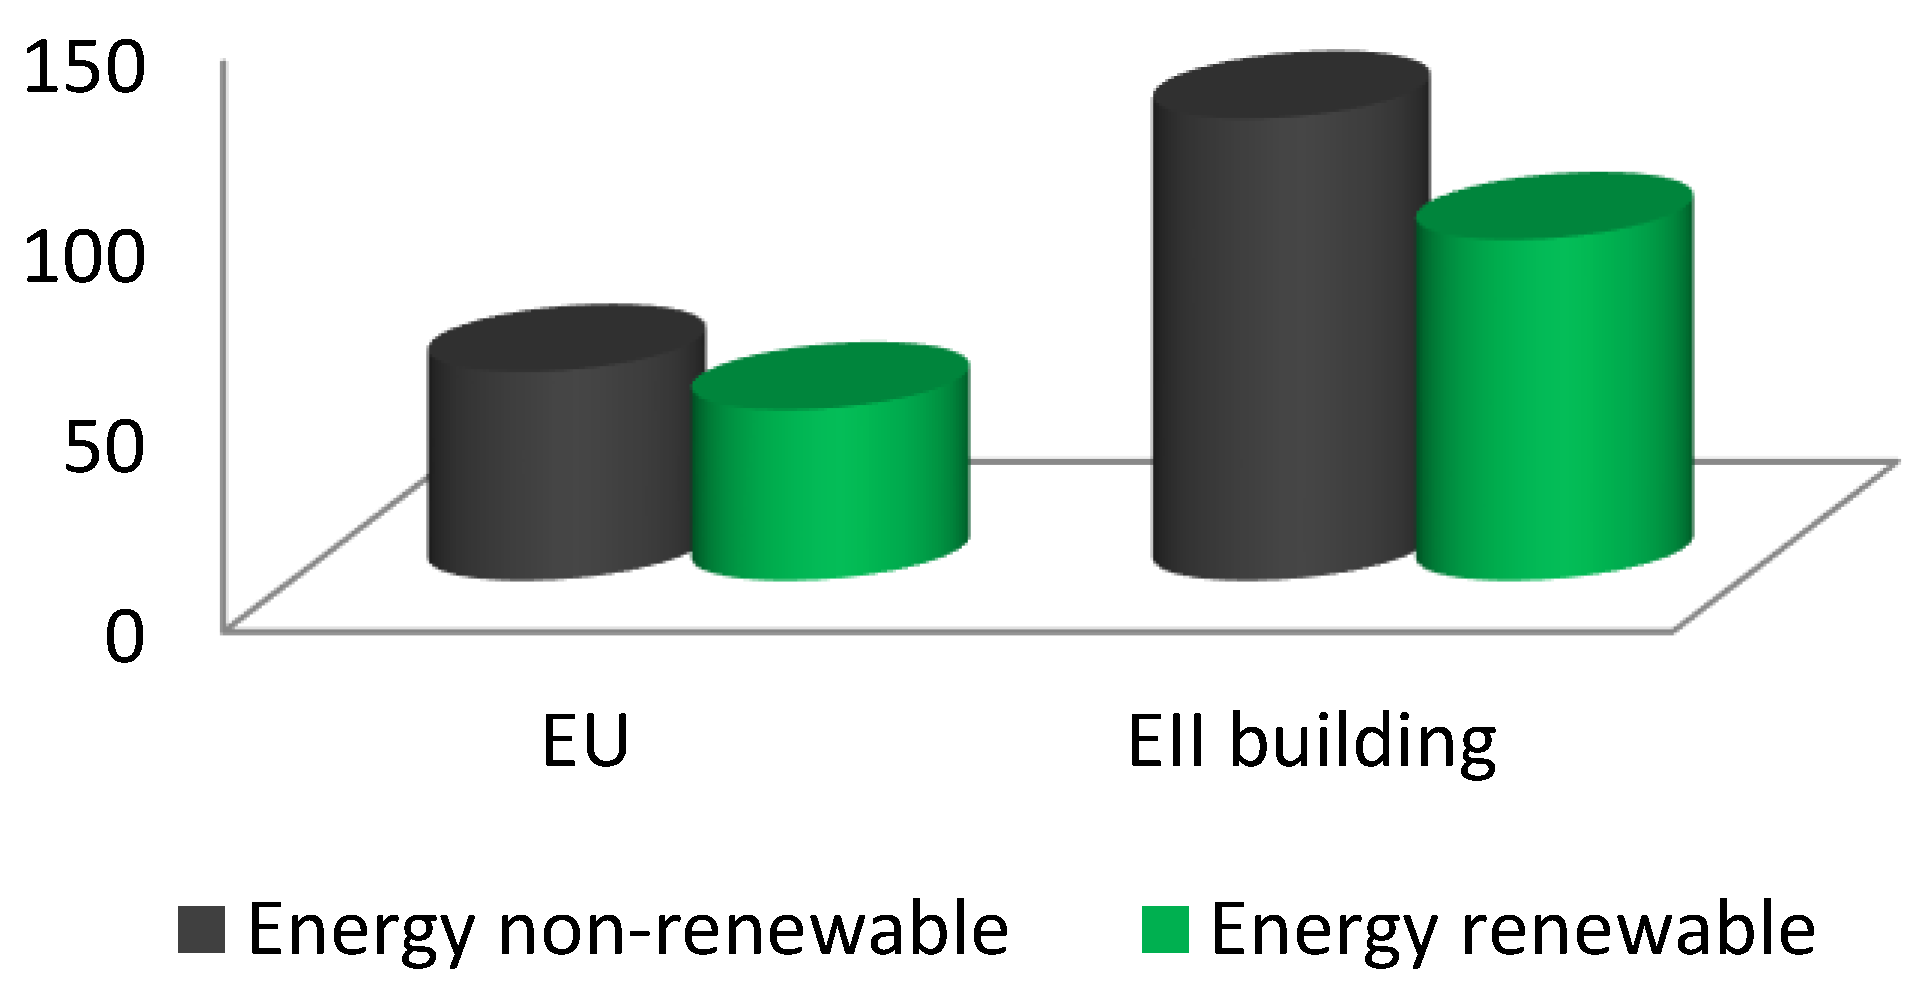
2.1.4. Renewable Energy Ratio
3. Conclusions
Author Contributions
Funding
Acknowledgments
Conflicts of Interest
Abbreviations
| DH: | District Heating. |
| NG: | Natural Gas. |
| DHW: | Domestic Hot Water. |
| EII: | Engineering School of Valladolid. |
| UVa: | University of Valladolid. |
| EMS: | Energy Management System. |
| nZEB: | near Zero Energy Building. |
| IEA: | International Energy Agency. |
| KPI: | Key Performance Indicators. |
| HVAC: | Heat Ventilation Air Conditioning. |
| EEI: | Energy Efficiency Index. |
| EBP: | Environmental Building Performance. |
| LED: | Light Emitting Diode. |
| ISO: | International Organization for Standardization. |
| SCADA: | Supervisory Control And Data Acquisition. |
| EPp: | Primary energy indicator (). |
| Ep,nrem: | Primary Non-renewable energy (). |
| Edel,i: | Energy supplied on-site or around the site (). |
| fdel,exp,i: | Primary Non-renewable energy of energy supplied compensated by export-energy, which is by default the same as the factor of the energy supplied, if not defined at national level otherwise. |
| fdel,nren,i: | Primary Non-renewable energy for the energy supplied. |
| Eexp,i: | Export-Energy on site or around the site (). |
| Anet: | Usable space (). |
| RERp: | Renewable Energy Ratio from primary energy. |
| Eren,i: | Renewable energy generated on-site or around the site, (). |
| fdel,tot,i: | Total primary energy factor for the delivered energy carrier . |
| fexp.tot,i: | Total primary energy factor of the delivered energy compensated by the exported energy for energy carrier . |
References
- Mazhar, A.R.; Liu, S.; Shukla, A. A state of art review on the district heating systems. Renew. Sustain. Energy Rev. 2018, 96, 420–439. [Google Scholar] [CrossRef]
- Gao, L.; Cui, X.; Ni, J.; Lei, W.; Huang, T.; Bai, C.; Yang, J. Technologies in Smart District Heating System. Energy Procedia 2017, 142, 1829–1834. [Google Scholar] [CrossRef]
- Lund, H.; Duic, N.; Østergaard, P.A.; Mathiesen, B.V. Future district heating systems and technologies: On the role of smart energy systems and 4th generation district heating. Energy 2018, 165, 614–619. [Google Scholar] [CrossRef]
- Werner, S. District heating and cooling in Sweden. Energy 2017, 126, 419–429. [Google Scholar] [CrossRef]
- Lygnerud, K.; Werner, S. Risk assessment of industrial excess heat recovery in district heating systems. Energy 2018, 151, 430–441. [Google Scholar] [CrossRef]
- Schmidt, D. Low Temperature District Heating for Future Energy Systems. Energy Procedia 2018, 149, 595–604. [Google Scholar] [CrossRef]
- Turski, M.; Sekret, R. Buildings and a district heating network as thermal energy storages in the district heating system. Energy Build. 2018, 179, 49–56. [Google Scholar] [CrossRef]
- Fallahnejad, M.; Hartner, M.; Kranzl, L.; Fritz, S. Impact of distribution and transmission investment costs of district heating systems on district heating potential. Energy Procedia 2018, 149, 141–150. [Google Scholar] [CrossRef]
- Lidberg, T.; Gustafsson, M.; Myhren, J.A.; Olofsson, T.; Ödlund (former Trygg), L. Environmental impact of energy refurbishment of buildings within different district heating systems. Appl. Energy 2018, 227, 231–238. [Google Scholar] [CrossRef]
- Bücker, D.; Jell, P.; Botsch, R. Performance monitoring of rural district heating systems. Energy Procedia 2018, 149, 5–14. [Google Scholar] [CrossRef]
- Wu, W.; Skye, H.M. Net-zero nation: HVAC and PV systems for residential net-zero energy buildings across the United States. Energy Convers. Manag. 2018, 177, 605–628. [Google Scholar] [CrossRef]
- Zinzi, M.; Pagliaro, F.; Agnoli, S.; Bisegna, F.; Iatauro, D. Assessing the overheating risks in Italian existing school buildings renovated with nZEB targets. Energy Procedia 2017, 142, 2517–2524. [Google Scholar] [CrossRef]
- Nielsen, S.; Möller, B. Excess heat production of future net zero energy buildings within district heating areas in Denmark. Energy 2012, 48, 23–31. [Google Scholar] [CrossRef]
- Sekki, T.; Airaksinen, M.; Saari, A. Effect of energy measures on the values of energy efficiency indicators in Finnish daycare and school buildings. Energy Build. 2017, 139, 124–132. [Google Scholar] [CrossRef]
- Abu Bakar, N.N.; Hassan, M.Y.; Abdullah, H.; Rahman, H.A.; Abdullah, M.P.; Hussin, F.; Bandi, M. Energy efficiency index as an indicator for measuring building energy performance: A review. Renew. Sustain. Energy Rev. 2015, 44, 1–11. [Google Scholar] [CrossRef]
- Maslesa, E.; Jensen, P.A.; Birkved, M. Indicators for quantifying environmental building performance: A systematic literature review. J. Build. Eng. 2018, 19, 552–560. [Google Scholar] [CrossRef]
- International Organization for Standardization (ISO). Available online: https://www.iso.org/ (accessed on 14 September 2018).[Green Version]
- Van der Hoeven, M. Energy Efficiency Indicators: Essentials for Policy Making. Available online: https://webstore.iea.org/energy-efficiency-indicators-essentials-for-policy-making (accessed on 5 November 2018).
- González, A.J.; Castrillón, R.; Quispe, E.C. Energy Efficiency Improvement in the Cement Industry through Energy Management. In Proceedings of the 2012 IEEE-IAS/PCA 54th Cement Industry Technical Conference, San Antonio, TX, USA, 14–17 May 2012. [Google Scholar] [CrossRef]
- Benedetti, M.; Cesarotti, V.; Introna, V. From energy targets setting to energy-aware operations control and back: An advanced methodology for energy efficient manufacturing. J. Clean. Prod. 2017, 167, 1518–1533. [Google Scholar] [CrossRef]
- Al-Saadi, S.N.J.; Ramaswamy, M.; Al-Rashdi, H.; Al-Mamari, M.; Al-Abri, M. Energy Management Strategies for a Governmental Building in Oman. Energy Procedia 2017, 141, 206–210. [Google Scholar] [CrossRef]
- Afroz, Z.; Higgins, G.; Urmee, T.; Shafiullah, G. Technological Advancement of Energy Management Facility of Institutional Buildings: A Case Study. Energy Procedia 2017, 142, 3088–3095. [Google Scholar] [CrossRef]
- Castrillon, R.; González, A. Metodología Para la Planificación Energética a Partir de la Norma ISO 50001; Editorial Universidad Autónoma de Occidente: Cali, Colombia, 2018; ISBN 978-958-8994-59-8. [Google Scholar]
- Rey-Hernández, J.M.; Velasco-Gómez, E.; San José-Alonso, J.F.; Tejero-González, A.; Rey-Martínez, F.J. Energy analysis at a near zero energy building. A case-study in Spain. Energies 2018, 11, 857. [Google Scholar] [CrossRef]
- CTE (Spanish Technical Building Code). Available online: http://www.codigotecnico.org (accessed on 15 September 2018).
- European Directives. Available online: http://eur-lex.europa.eu/ (accessed on 14 September 2018).



| System/Fuel | Lighting: | Heating: | HVAC | Other Equipment | Working Time and Set Point |
|---|---|---|---|---|---|
| Gas Boilers (NG) | LED and fluorescence with electromagnetic ballast T5 | Natural Gas boilers of 540 kW “REMEHA” model “Gas-3B/13-Duo” | Individual Split-type equipment. 19 Air Handling Units (AHU) | Elevators, computers and laptops, printers, laboratory equipment, etc. | Weekdays (8 a.m. to 10 p.m.). Saturdays (9 a.m. to 2 p.m.). Set point (21 °C) |
| DH (Biomass) | LED and fluorescence with electromagnetic ballast T5 | 119,000 L of backup tank DH substation with flat plate heat exchanger Biomass Boilers 19 MW | Individual Split-type equipment 19 Air Handling Units (AHU) | Elevators, computers and laptops, printers, laboratory equipment, etc. | Weekdays (8 a.m. to 10 p.m.) Saturdays (9 a.m. to 2 p.m.) Set point (21 °C) |
| Year | Natural Gas | |
|---|---|---|
| KWh | KWh/m2 | |
| 2006 | 1,264,550 | 75.76 |
| 2007 | 1,415,661 | 84.81 |
| 2008 | 1,632,630 | 97.81 |
| 2009 | 1,585,339 | 94.98 |
| 2010 | 2,569,220 | 153.92 |
| 2011 | 1,639,719 | 98.24 |
| 2012 | 1,805,694 | 108.18 |
| 2013 | 1,510,476 | 90.49 |
| 2014 | 1,229,459 | 73.66 |
| 2015 | 1,131,687 | 67.8 |
| 2016 | 87,716 | 5.26 |
| 2017 | 14,912 | 0.88 |
| Month | 2014 | 2015 | 2016 | 2017 | ||||
|---|---|---|---|---|---|---|---|---|
| kWh | kWh/m2 | kWh | kWh/m2 | kWh | kWh/m2 | kWh | kWh/m2 | |
| January | 258,821 | 15.51 | 377,448 | 22.61 | 33,617 | 2.01 | 2834 | 0.17 |
| February | 276,638 | 16.57 | 360,341 | 21.59 | 2294 | 0.14 | 0 | 0 |
| March | 208,852 | 12.51 | 243,979 | 14.62 | 12,292 | 0.74 | 851 | 0.05 |
| April | 116,325 | 6.97 | 95,293 | 5.71 | 12,395 | 0.74 | 5184 | 0.31 |
| May | 18,881 | 1.13 | 31,520 | 1.89 | 2912 | 0.17 | 4587 | 0.27 |
| June | 0 | 0 | 0 | 0 | 0 | 0 | 0 | 0 |
| July | 0 | 0.02 | 0 | 0 | 0 | 0 | 0 | 0 |
| August | 0 | 0 | 0 | 0 | 0 | 0 | 0 | 0 |
| September | 0 | 0 | 0 | 0 | 574 | 0.03 | 0 | 0 |
| October | 993 | 0.06 | 5905 | 0.35 | 11,345 | 0.68 | 672 | 0.04 |
| November | 173,818 | 10.41 | 13,498 | 0.81 | 8908 | 0.53 | 464 | 0.03 |
| December | 174,875 | 10.48 | 3703 | 0.22 | 3379 | 0.2 | 320 | 0.02 |
| Month | 2015 | 2016 | 2017 | |||
|---|---|---|---|---|---|---|
| KWh | KWh/m2 | KWh | KWh/m2 | KWh | KWh/m2 | |
| January | 0 | 0 | 167,500 | 10.04 | 283,300 | 16.97 |
| February | 0 | 0 | 224,400 | 13.44 | 205,600 | 12.32 |
| March | 0 | 0 | 164,700 | 9.87 | 169,800 | 10.17 |
| April | 0 | 0 | 126,700 | 7.59 | 53,800 | 3.22 |
| May | 0 | 0 | 18,900 | 1.13 | 13,800 | 0.83 |
| June | 0 | 0 | 0 | 0 | 0 | 0 |
| July | 0 | 0 | 0 | 0 | 0 | 0 |
| August | 0 | 0 | 0 | 0 | 0 | 0 |
| September | 0 | 0 | 0 | 0 | 0 | 0 |
| October | 53,000 | 3.18 | 28,700 | 1.72 | 8100 | 0.49 |
| November | 173,200 | 10.38 | 186,100 | 11.15 | 137,100 | 8.21 |
| December | 126,100 | 7.55 | 177,400 | 10.63 | 219,700 | 13.16 |
| Biomass | € | €/m2 | KWh | KWh/m2 |
|---|---|---|---|---|
| 2015 | 28,359.93 | 1.7 | 352,300 | 21.11 |
| 2016 | 88,060.89 | 5.28 | 1,094,400 | 65.57 |
| 2017 | 87,803.40 | 5.26 | 1,091,200 | 65.43 |
| Data | October 2014 | November 2014 | December 2014 | January 2015 | February 2015 | March 2015 | April 2015 | May 2015 |
|---|---|---|---|---|---|---|---|---|
| Degree days | 29 | 138.1 | 137.4 | 227.8 | 238.6 | 166.6 | 59.3 | 43.3 |
| Thermal Consumption of NG (kWh) | 993 | 173,818 | 174,875 | 377,448 | 360,341 | 243,979 | 95,293 | 31,520 |
| € | 198.88 | 10,637.21 | 10,701.12 | 22,492.18 | 21,289.07 | 14,459.23 | 5421.08 | 1882.58 |
| €/m2 | 0.01 | 0.64 | 0.64 | 1.35 | 1.28 | 0.87 | 0.32 | 0.11 |
| €/kWh | 0.2003 | 0.0612 | 0.0612 | 0.0596 | 0.0591 | 0.0593 | 0.0569 | 0.0597 |
| Data | October 2016 | November 2016 | December 2016 | January 2017 | February 2017 | March 2017 | April 2017 | May 2017 |
|---|---|---|---|---|---|---|---|---|
| Degree days | 63.2 | 190.6 | 145.1 | 203.3 | 179.7 | 152.1 | 67.8 | 29.5 |
| Thermal Consumption of NG (kWh) | 67,706 | 286,197 | 208,164.5 | 307,977.5 | 267,503.5 | 220,169.5 | 75,595 | 9910.5 |
| € | 9583 | 41,477 | 35,389 | 53,808 | 22,139 | 56,641 | 10,996 | 1470 |
| Data | October 2016 | November 2016 | December 2016 | January 2017 | February 2017 | March 2017 | April 2017 | May 2017 |
|---|---|---|---|---|---|---|---|---|
| NG Consumption (kWh) | 11,345 | 8908 | 3379 | 2834 | 0 | 851 | 5184 | 4587 |
| € (NG) | 692.99 | 574.22 | 302.57 | 260.61 | 108.66 | 148.5 | 325.05 | 300.78 |
| €/kWh (NG) | 0.06 | 0.06 | 0.09 | 0.09 | 0.00 | 0.17 | 0.06 | 0.07 |
| Biomass (kWh) | 28,700 | 186,100 | 177,400 | 283,300 | 205,600 | 169,800 | 53,800 | 13,800 |
| € (Biomass) | 2309.34 | 14,974.54 | 14,274.49 | 23,445.41 | 17,016.28 | 14,053.33 | 4452.7 | 1142.14 |
| €/kWh (Biomass) | 0.08 | 0.08 | 0.08 | 0.08 | 0.08 | 0.08 | 0.08 | 0.08 |
| €/kWh (TOTAL) | 0.07 | 0.08 | 0.08 | 0.08 | 0.08 | 0.08 | 0.08 | 0.08 |
| Case | IDE | |
|---|---|---|
| 1st Case | IDE = 100 | Measured Consumption equal to projected with the base equation |
| 2nd Case | IDE < 100 | There is a decrease in energy performance since the energy consumption was higher than the baseline. the energy consumed or measured greater than the baseline energy calculated process with overconsumption or inefficient |
| 3rd Case | IDE > 100 | There is an improvement in energy performance since energy consumption was lower than the baseline. |
| Efficiency Indicator | October 2016 | November 2016 | December 2016 | January 2017 | February 2017 | March 2017 | April 2017 | May 2017 |
|---|---|---|---|---|---|---|---|---|
| Actual thermal consumption (2016/2017) | 40,045 | 195,008 | 180,779 | 286,134 | 205,600 | 170,651 | 58,984 | 18,387 |
| Basic consumption (regression model) | 67,706 | 286,197 | 208,164.5 | 307,977.5 | 267,503.5 | 220,169.5 | 75,595 | 9,910.5 |
| Basic Efficiency Indicator | 169.07 | 146.76 | 115.15 | 107.63 | 130.11 | 129.02 | 128.16 | 53.90 |
| Month | Energy Linear Regression 2016/2017 [kWh] | Actual Energy [kWh] | Actual Energy-Energy Linear Regression [kWh] | Cusum [kWh] |
|---|---|---|---|---|
| October 2016 | 67,706 | 40,045 | −27,661 | −27,661 |
| November 2016 | 286,197 | 195,008 | −91,189 | −118,850 |
| December 2016 | 208,164.50 | 180,779 | −27,386 | −146,236 |
| January 2017 | 307,977.50 | 286,134 | −21,844 | −168,079 |
| February 2017 | 267,503.50 | 205,600 | −61,904 | −229,983 |
| March 2017 | 220,169.50 | 170,651 | −49,519 | −279,501 |
| April 2017 | 75,595 | 58,984 | −16,611 | −296,112 |
| May 2017 | 9910.50 | 18,387 | 8477 | −287,636 |
| Energy | Source | Use | ||
|---|---|---|---|---|
| Electricity | Grid | Input | 0.414 | 1.954 |
| Biomass | On-site | Input | 1.003 | 0.034 |
| Natural Gas | On-site | Input | 0.005 | 1.190 |
© 2018 by the authors. Licensee MDPI, Basel, Switzerland. This article is an open access article distributed under the terms and conditions of the Creative Commons Attribution (CC BY) license (http://creativecommons.org/licenses/by/4.0/).
Share and Cite
Castrillón Mendoza, R.; Rey Hernández, J.M.; Velasco Gómez, E.; San José Alonso, J.F.; Rey Martínez, F.J. Analysis of the Methodology to Obtain Several Key Indicators Performance (KIP), by Energy Retrofitting of the Actual Building to the District Heating Fuelled by Biomass, Focusing on nZEB Goal: Case of Study. Energies 2019, 12, 93. https://doi.org/10.3390/en12010093
Castrillón Mendoza R, Rey Hernández JM, Velasco Gómez E, San José Alonso JF, Rey Martínez FJ. Analysis of the Methodology to Obtain Several Key Indicators Performance (KIP), by Energy Retrofitting of the Actual Building to the District Heating Fuelled by Biomass, Focusing on nZEB Goal: Case of Study. Energies. 2019; 12(1):93. https://doi.org/10.3390/en12010093
Chicago/Turabian StyleCastrillón Mendoza, Rosaura, Javier M. Rey Hernández, Eloy Velasco Gómez, Julio F. San José Alonso, and Francisco J. Rey Martínez. 2019. "Analysis of the Methodology to Obtain Several Key Indicators Performance (KIP), by Energy Retrofitting of the Actual Building to the District Heating Fuelled by Biomass, Focusing on nZEB Goal: Case of Study" Energies 12, no. 1: 93. https://doi.org/10.3390/en12010093
APA StyleCastrillón Mendoza, R., Rey Hernández, J. M., Velasco Gómez, E., San José Alonso, J. F., & Rey Martínez, F. J. (2019). Analysis of the Methodology to Obtain Several Key Indicators Performance (KIP), by Energy Retrofitting of the Actual Building to the District Heating Fuelled by Biomass, Focusing on nZEB Goal: Case of Study. Energies, 12(1), 93. https://doi.org/10.3390/en12010093


