Article

Optimal Sizing Procedure for Electric Vehicle Supply Infrastructure Based on DC Microgrid with Station Commitment

Department of Electrical and Information Engineering, Politecnico di Bari, via E. Orabona, 4, 70125 Bari, Italy
*
Author to whom correspondence should be addressed.
Energies 2019, 12(10), 1901; https://doi.org/10.3390/en12101901
Submission received: 21 March 2019 / Revised: 2 May 2019 / Accepted: 5 May 2019 / Published: 18 May 2019
(This article belongs to the Special Issue Optimization of Multicarrier Energy Systems)

Abstract

:
The diffusion of electric vehicles (EVs) can be sustained by the presence of integrated solutions offering parking and clean power supply. The recourse to DC systems allows better integration of EV bidirectional energy exchange, photovoltaic panels, and energy storage. In this paper, a methodology for optimal techno-economic sizing of a DC-microgrid for covering EV mobility needs is carried out. It is based on the definition of different scenarios of operation, according to typical EV usage outlooks and environmental conditions. In each scenario, optimal operation is carried out by means of a specific approach for EV commitment on different stations. The sizing procedure is able to handle the modular structure of microgrid devices. The proposed approach is applied to a case study of an envisaged EV service fleet for the Bari port authority.

1. Introduction

The spreading of electric vehicles (EVs) can represent a powerful means to cope with mobility needs and realize a diversification of transport energy use with a lower carbon footprint [1]. In order to bolster the diffusion of EVs among end-users (e.g., residential, commuters, company fleets), along with selling price reduction, the presence of charging stations represents the most remarkable aspect [2]. However, to avoid demand peaks given by the presence of several EVs at the same time (e.g., at work arrival, or at homecoming), the charge process should be planned, supervised, and controlled through a smart charging strategy, as described in [3,4]. The exploitation of vehicle-to-grid (V2G) is useful to cope with this necessity, where the EVs can act as a mobile energy storage device and even feed one another, implementing vehicle-to-vehicle exchanges as envisaged by [5].
Photovoltaic (PV) technology is particularly suitable for integration with EV charging stations, as reviewed in [6]. A specific realization is obtained by canopies able to host PV panels and provide for shaded vehicle parking, as proposed by [7], whereas, in [8] an analysis on different utilization cases of this system in urban contexts is reported. The integration of PV and EV charging station has been proposed in several works, e.g., charge/discharge models of EVs in the presence of PV are analysed in [9], and in [10] economic models are developed for EV and parking owner perspectives under parking fee policies. Effects on regional basis are analysed in [11]. In order to reduce the EV impact on the network, the integration of energy storage systems (ESS) in EV charging stations can be useful [12], with the aim of shifting power exchange according to price signals, smoothing out time variations [13]. Moreover, smart EV charging points, even integrated in microgrids, can contribute to attaining automation goals of power system structural controllability by proper placement [14] and can take part to monitoring and control structure of distribution networks [15].
The integration of those elements (EVs, charging points with V2G, PV systems, ESS) can constitute an Electric Vehicle Supply Infrastructure (EVSI) with a microgrid outline. This structure, introduced in previous works [16,17], can reveal particular suitability for managing a fleet of corporate EVs, for instance in a small/medium enterprise or in a public entity. Moreover, all the mentioned EVSI components can be directly integrated in a DC-microgrid architecture, reducing AC/DC converter employment, as described in the reviews [18,19]. In this context, proper control strategies should be implemented involving smart charging individuating operation modes of converters as in [20,21], as well as real-time control and robust islanding [22,23].
A research activity is open on the integration of EV-based microgrid, and operation planning strategies are investigated with minimum total cost goal under different vehicle behaviors in [24], whereas the cost of energy circulation in storage system is added in [25]. However, since the investment in EVs and relevant charging systems is still a major concern, a particular care is devoted to the sizing of an EV-based microgrid. This problem has been faced combining PV and EVs in [20], and considering the presence of a single ESS and EVs in [26] where network limits are studied and cost items are detailed for AC and DC configurations. Moreover, in [27] optimal sizing is determined and investment cost sensitivity is analysed, in [28] design criteria are discussed for a fast charging station with ESS and PV for an EV fleet and the operation is tested over a week, and in [29] optimal sizing including probabilistic solar production and queueing model of EVs is carried out.
In this paper, a procedure for techno-economic evaluation for DC microgrid configuration of EVSI is carried out. The procedure is intended to reduce economical efforts for investment and lifetime management of the microgrid. In particular, realistic spatial and technical limitations are taken into account, along with different operating conditions based on EV needs and availability of non-programmable renewable sources. The analysed configuration involves feasible combinations of converters as well as modular PV panels, ESS elements, and EV charging stations, with a proper interface with the low-voltage AC distribution network. The proposed procedure is applied to the sizing of the microgrid that will be realized in the area of the Bari Port Authority (Italy).
The main contributions of the paper with respect to the existing literature can be individuated as follows:
-
A mixed-integer procedure for EV-based microgrid optimal sizing and operation is provided, to cope with the modularity of microgrid components;
-
The individuation of utilization scenarios, according to weather conditions and envisaged EV uses, is adopted, and discounted investment and operation costs are included;
-
A specific EV commitment is developed, in order to plan the station to which each EV should be connected;
-
In order to draw the influence of DC microgrid layout, an accurate configuration is analysed on a realistic test case.
The paper is organized as follows. In Section 2, the proposed DC microgrid configurations are illustrated, and the formulation of the proposed methodology for DC microgrid optimal sizing and operation is described. In Section 3, the input data for the test case are presented. Simulation results are illustrated and discussed in Section 4. Conclusions are reported in Section 5.

2. DC Microgrid Optimal Sizing Methodology

For the complete list of symbols and their meaning, please refer to the Nomenclature at the end of the paper.

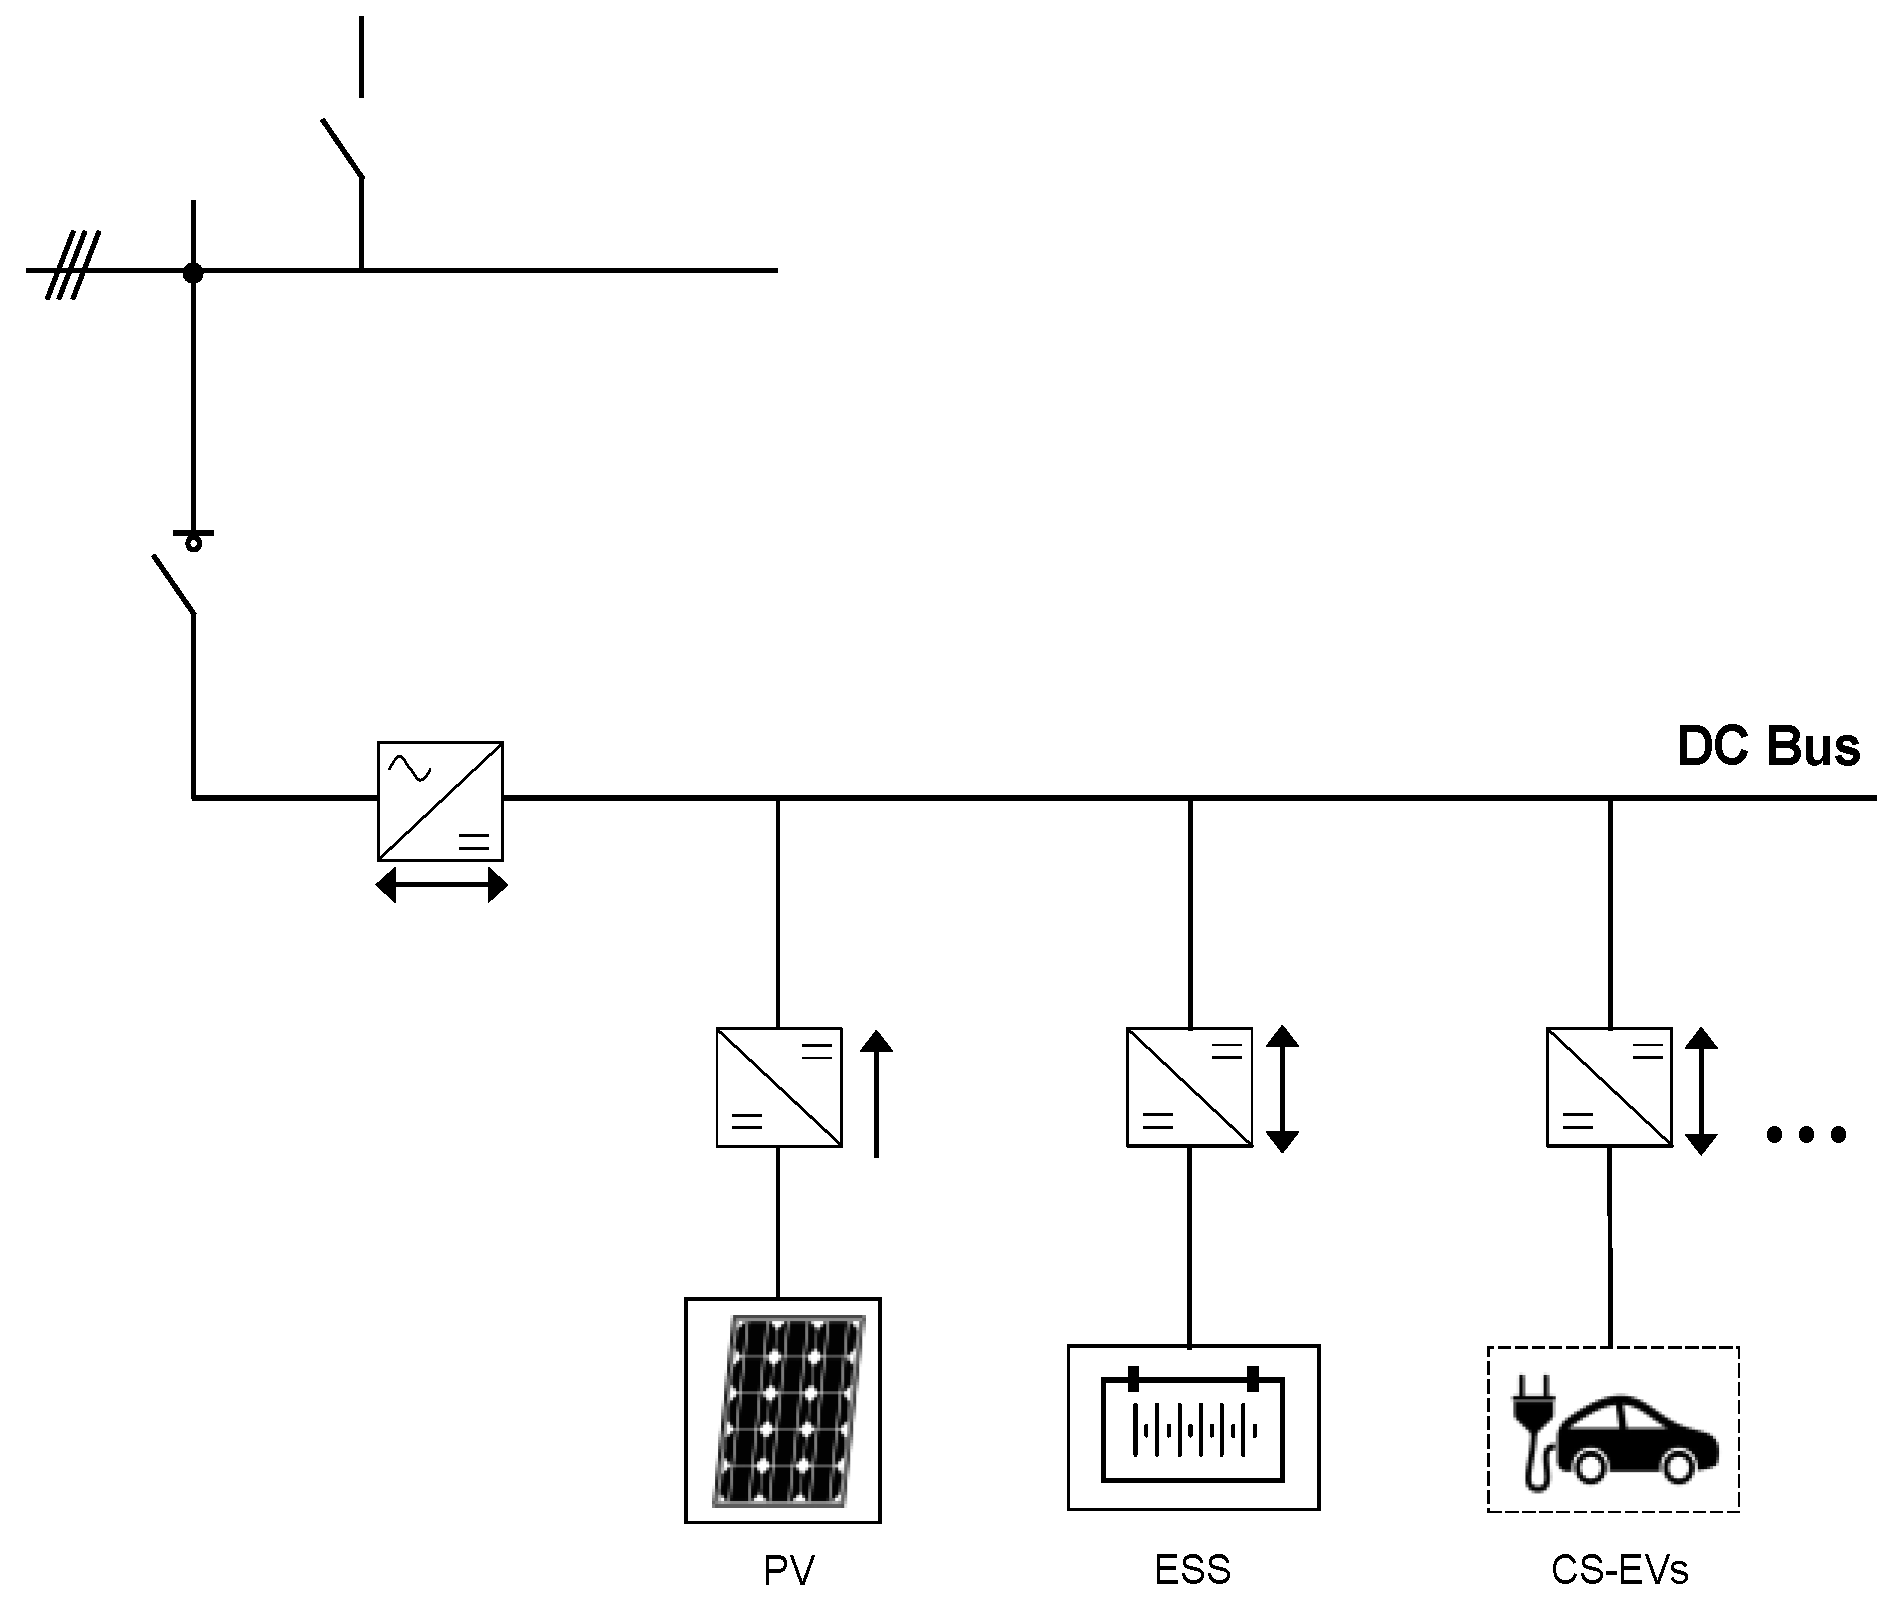
2.1. DC Microgrid Configurations

In order to carry out the sizing procedure, the proposed configurations for the DC microgrid of the EVSI are considered. The configuration, briefly discussed in [17], is depicted in Figure 1. It involves a bidirectional AC/DC converter for grid connection at Point of Common Coupling (PCC), monodirectional DC/DC converter with MPPT functionality for the integration of the PV system, a bidirectional DC/DC converter for the ESS, and different bidirectional DC/DC converters for the EV charging stations, in order to enable V2G performances. All the converters, including relevant protection devices, are connected to a common DC busbar at a proper voltage level. Moreover, suitable internal collection systems for the input of PV panel strings to the converter and for the ESS modules are provided.

2.2. Modeling of EVSI Components

The EVSI can include N p PV technologies and N i ESS technologies, and is able to exchange power with N j EVs through N k stations, where a set of N r standards can be chosen. The behavior of each component is described by proper models for each t-th time step in the s-th scenario.
In order to assess the operation of the microgrid in the presence of different frameworks for vehicle use and generation availability, a scenario-based procedure is considered, analogously to analysis carried out in different contexts of renewable-storage coupling in [30] and in photovoltaic-based nanogrid reliability analysis in [31]. Since solar power production depends on weather conditions and seasons, and storage devices and EVs can show different use in weekdays as well as in subperiods of the year, a certain number N s of scenarios, i.e., typical days, are defined in advance, considering that each s-th scenario can be observed for a given number of times D s during the year. Moreover, due to the limited dimensions of the microgrids, the sizing procedure accounts for power and energy aspects, leaving voltage control to the implementation stage close to real time, even if operation under different scenarios is accounted for.

2.2.1. PV Systems

The power output of the p-th PV system depends on the available solar radiation G p , s , t , installed PV power R p and technological features, by means of the following expression:
P p , s , t = R p η p , s , t G p , s , t η p s t d
In (1), the efficiency of the p-th PV system, η p , s , t , is related to the forecasted weather conditions of the specific time step (i.e., solar radiation and ambient temperature ϑ s , t ) as follows [18]:
η p , s , t = η p s t d [ 1 a p ( ϑ s , t + G p , s , t ϑ p ϑ p N O C T G p N O C T ϑ p s t d ) ]
where η p s t d is the efficiency level at standard conditions (incident radiation 1 kW/m2, temperature ϑ p s t d = 25 °C) and a p is the power coefficient p-th PV system. Moreover, the temperature variation from nominal operating conditions (with reference temperature ϑ p N O C T = 20 °C and reference radiation G p N O C T = 0.8 kW/m²) is related to the normal operating temperature of the PV cell ϑ p . These data can be easily taken from PV panel datasheets.
Since the relation (1) linearly links power output with the installed power R p according to solar radiation G p , s , t , P p , s , t is not included in state variables. The incident solar radiation G p , s , t is estimated with a proper model based on the determination of direct, diffuse, and reflected radiation according to the day, the time of the day, and the PV panel orientation, starting from total radiation forecast on horizontal plane [32].
The PV installation R p is limited by available surface of parking roofs S t o t and should ensure shadowing for all the parking places next to EV charging stations, each requiring an area S k :
k Ω k S k p Ω p R p η p s t d S t o t
Moreover, since the PV system is made up by discrete modules, the installed power of the p-th PV technology to the number n p of PV modules, according to the unit power of the module M p , by the following equality constraint:
R p = n p M p
Finally, the size of PV converter should be not less than the installed power of the PV system, and only one converter per each PV technology has to be installed. Converter sizes W m are determined in order to comply with voltage range variation of PV panel strings under temperature variations.
P p , s , t m Ω m W m b m , p
m Ω m b m , p 1

2.2.2. Energy Storage Systems

The behavior of ESSs is characterized by the energy amount present in the storage device in each time step. However, a high degree of correspondence is observed between energy amount and state-of-charge (SOC), given by the levels of current [33]. The assumption of discarding voltage variations in this procedure further leads to the exploitation of SOC in each time step E i , s , t to define ESS availability in the operation planning [25].
SOC variation over the time step duration Δ t is due to charging/discharging process, with power levels P i , s , t c or P i , s , t d , by proper charge and discharge efficiencies, η i c and η i d . The following relation holds for the t-th time step:
E i , s , t = E i , s , t 1 + Δ t ( η i c P i , s , t c P i , s , t d η i d ) z i R i
where E i , s , t 1 represents the SOC of the i-th ESS in the previous time step of the s-th scenario. For t = 1, E i , s , 0 represents the imposed SOC initial condition. The last term in (7) refers to self-discharge, as a quota z i of installed amount R i . Moreover, the SOC at t = N t is imposed equal to the initial condition, allowing replication of the behavior for consecutive days:
E i , s , N t = E i , s , 0
Technical limits of the i-th ESS are accounted by means of constraints on charge power, discharge power, and SOC, depending on installed amount R i by means of energy-to-power ratios in charge and discharge, φ i c and φ i d , and maximum/minimum SOC levels, e _ i and e ¯ i :
0 P i , s , t c R i φ i c b i , s , t
0 P i , s , t d R i φ i d ( 1 b i , s , t )
e _ i R i E i , s , t e ¯ i R i
The total installation of ESSs is limited by available volume V t o t for hosting the devices:
i Ω i δ i R i V t o t
Analogously to PV system, the following equality constraints link the installed size of the i-th ESS to the number n i of modules, according to the unit size of the chosen battery M i , and to the size of the converter:
R i = n i M i
R i h Ω h W h φ i d b h , i
h Ω h b h , i 1

2.2.3. Electric Vehicles and Stations

EVs are dealt with as storage devices, as long as they are connected to a station. The relation for SOC update is valid for the t-th time step between τ j , s A + 1 and τ j , s L :
E j , s , t = E j , s , t 1 + Δ t ( ρ j c P j , s , t c P j , s , t d ρ j d )
where, at t = τ j , s A + 1 , E j , s , t 1 = E j , s A , as the initial SOC condition at EV arrival, whereas at t = τ j , s L , E j , s , t = E j , s L , the final desired SOC level at EV leaving. It should be remarked that this formulation is based on the assumption that each EV is parked for one interval per day. In the case the daily EV usage pattern includes two (or more) parking intervals, it is dealt with as two (or more) virtual EVs with a single parking interval.
Technical limits of the j-th EV, valid during parking interval, involve constraints on power levels, capped by charge and discharge limits P ¯ j c and P ¯ j d , and on SOC and power levels:
0 P j , s , t c P ¯ j c b j , s , t
0 P j , s , t d P ¯ j d ( 1 b j , s , t )
v _ j E j , s , t v ¯ j
As regards technologies for charging stations, the following relations (20)–(21) link maximum charge/discharge power of the k-th station, P ¯ k c and P ¯ k d respectively, to the power exchange levels admitted by the r-th technology, Ψ r c and Ψ r d , whereas the association of the r-th technology to the k-th station is ensured by (22). It should be noted that the case where the r-th EV station standard would not provide for V2G is modelled by Ψ r d = 0 :
P ¯ k c = r Ω r b r , k Ψ r c
P ¯ k d = r Ω r b r , k Ψ r d
r Ω r b r , k = 1

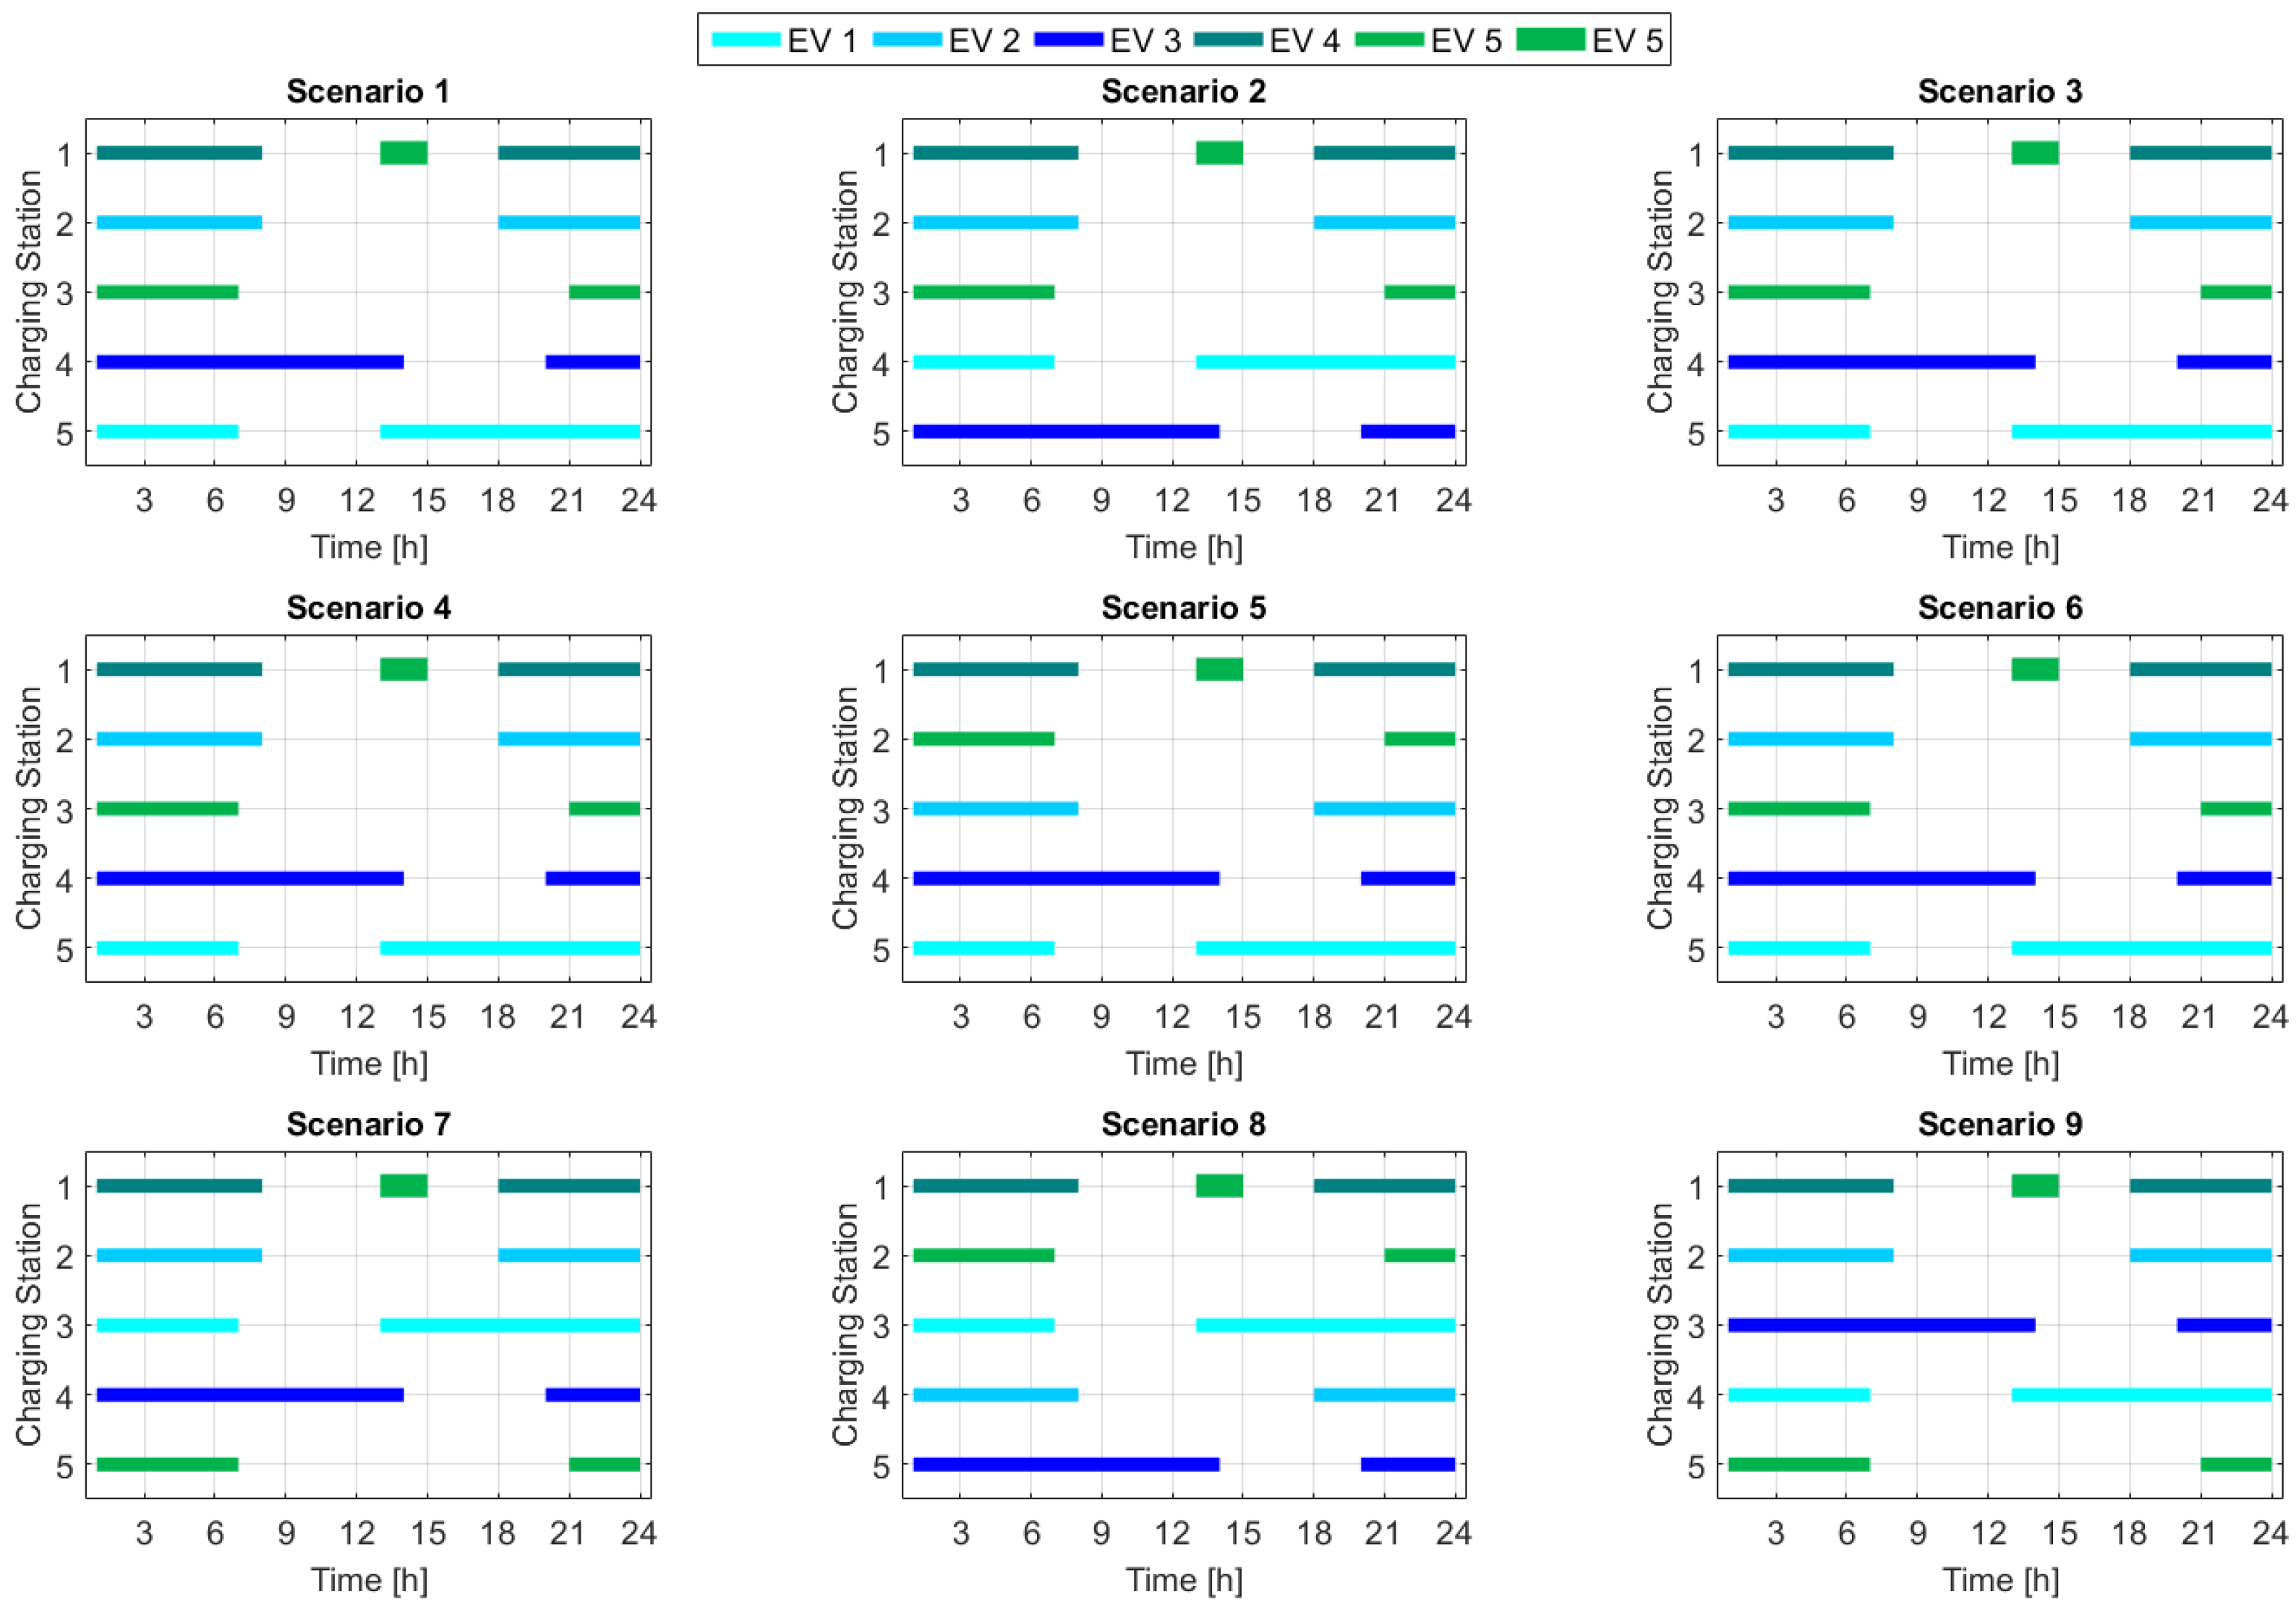
2.2.4. Electric Vehicles Station Commitment

The electric vehicle commitment is aimed at scheduling the station at which each EV should be connected, creating a link between their features.
In the planning stage, the number of stations N k to be included in the EVSI is evaluated. For each time step of each scenario, the number of parked vehicles J s , t is determined starting from information on τ j , s A and τ j , s L . Therefore, for each scenario, the maximum number of EVs parked at the same time is obtained, and the relevant time interval is individuated:
J ¯ s = max t ( J s , t )
τ ¯ s = t J s , t = J ¯ s
The number of EV stations is eventually set to the minimum necessary to cover the maximum amount of EVs parked at the same time in any scenario:
N k = max s J ¯ s
Moreover, EV exploitation is characterized by evaluating, for each EV in each scenario, the average power needed to reach the final state π j , s :
π j , s = | E j , s L E j , s A | τ j , s L τ j , s A
Once N k is determined, for each scenario, the EV commitment starts from the time step τ ¯ s . The J ¯ s EVs parked in this time step are associated to the charging stations according to a list sorted according to the index π j , s : the EV with the highest index is connected to the first station, k = 1, and so on.
After that, the remaining N j J ¯ s EVs are ordered according to the power index π j , s . For each EV in this ranking, starting from the first one, the procedure tries the connection to the first available station, avoiding time superposition with the EVs previously selected.
This procedure can leave in idle state the last stations. In this way, the binary parameter β j , k , s is determined for all EVs, stations, and scenarios.
For purpose of exemplification, an application of the EV station commitment procedure is reported in Appendix A.
Therefore, the amount of charge and discharge power that the j-th EV can exchange depends not only on the EV features, but also on the k-th station it is connected to in the s-th scenario, as follows:
0 P j , s , t c P ¯ k c β j , k , s
0 P j , s , t d P ¯ k d β j , k , s

2.2.5. Microgrid Balance and Power Exchanges

The overall behaviour of the microgrid is governed by power balance relation, where the generation is represented by net PV production, ESS discharge, possible EV discharge, and grid withdrawal, whereas the load includes ESS and EV charge and grid power delivery. Due to limited dimensions, microgrid balance is expressed as a single-bus power balance, considering net power contributions at the DC bus by means of converter efficiency for each device (reducing generation and increasing the load), as reported in (29):
p Ω p ζ M P p , s , t + i Ω i ζ H P i , s , t d + j Ω j ζ K P j , s , t d + ζ F P s , t w = i Ω i 1 ζ H P i , s , t c + j Ω j 1 ζ K P j , s , t c + 1 ζ F P s , t g
The power exchange across the interfacing converter should withstand specific constraints related to the installed converter size R F , as reported in relations (30)–(31):
R F = f Ω f W f b f
f Ω f b f = 1
The power exchange of the DC microgrid with the AC distribution network, in injection P s , t g or in absorption P s , t w , is limited by the following relations, avoiding contemporaneous withdrawal and injection by means of the binary variable b s , t g :
0 P s , t g P ¯ g b s , t g
0 P s , t w P ¯ g ( 1 b s , t g )
where P ¯ g is a conveniently high value.
Moreover, grid exchange levels are bounded by installed converter size R F , therefore the following relations hold:
0 P s , t g R F
0 P s , t w R F

2.3. Objective and Procedure Formulation
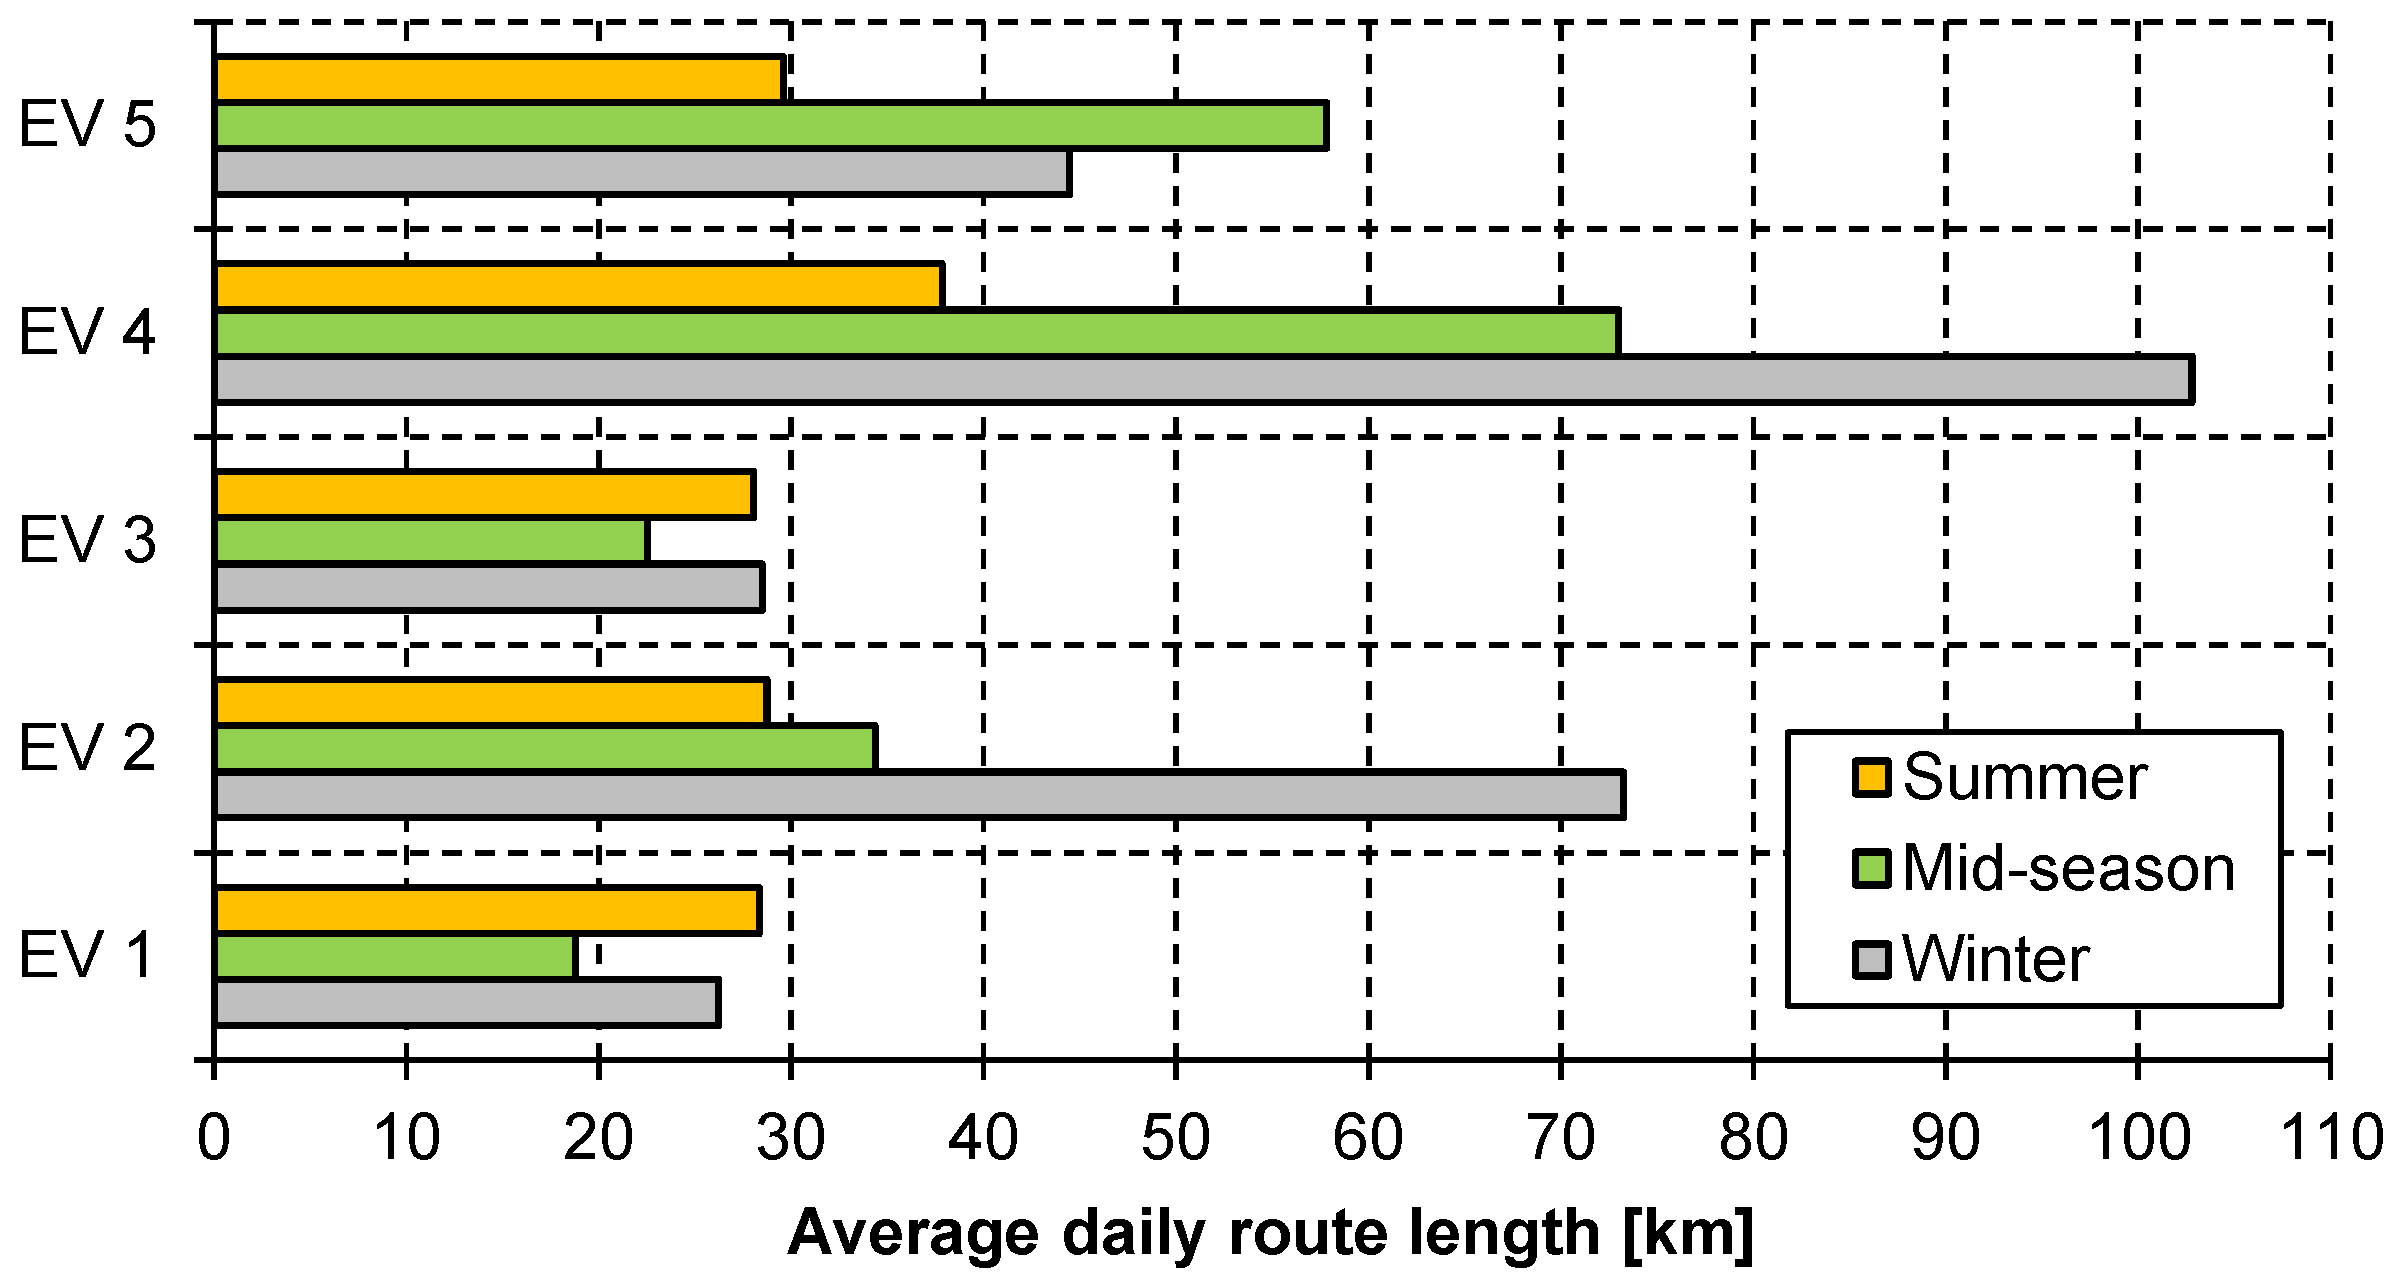
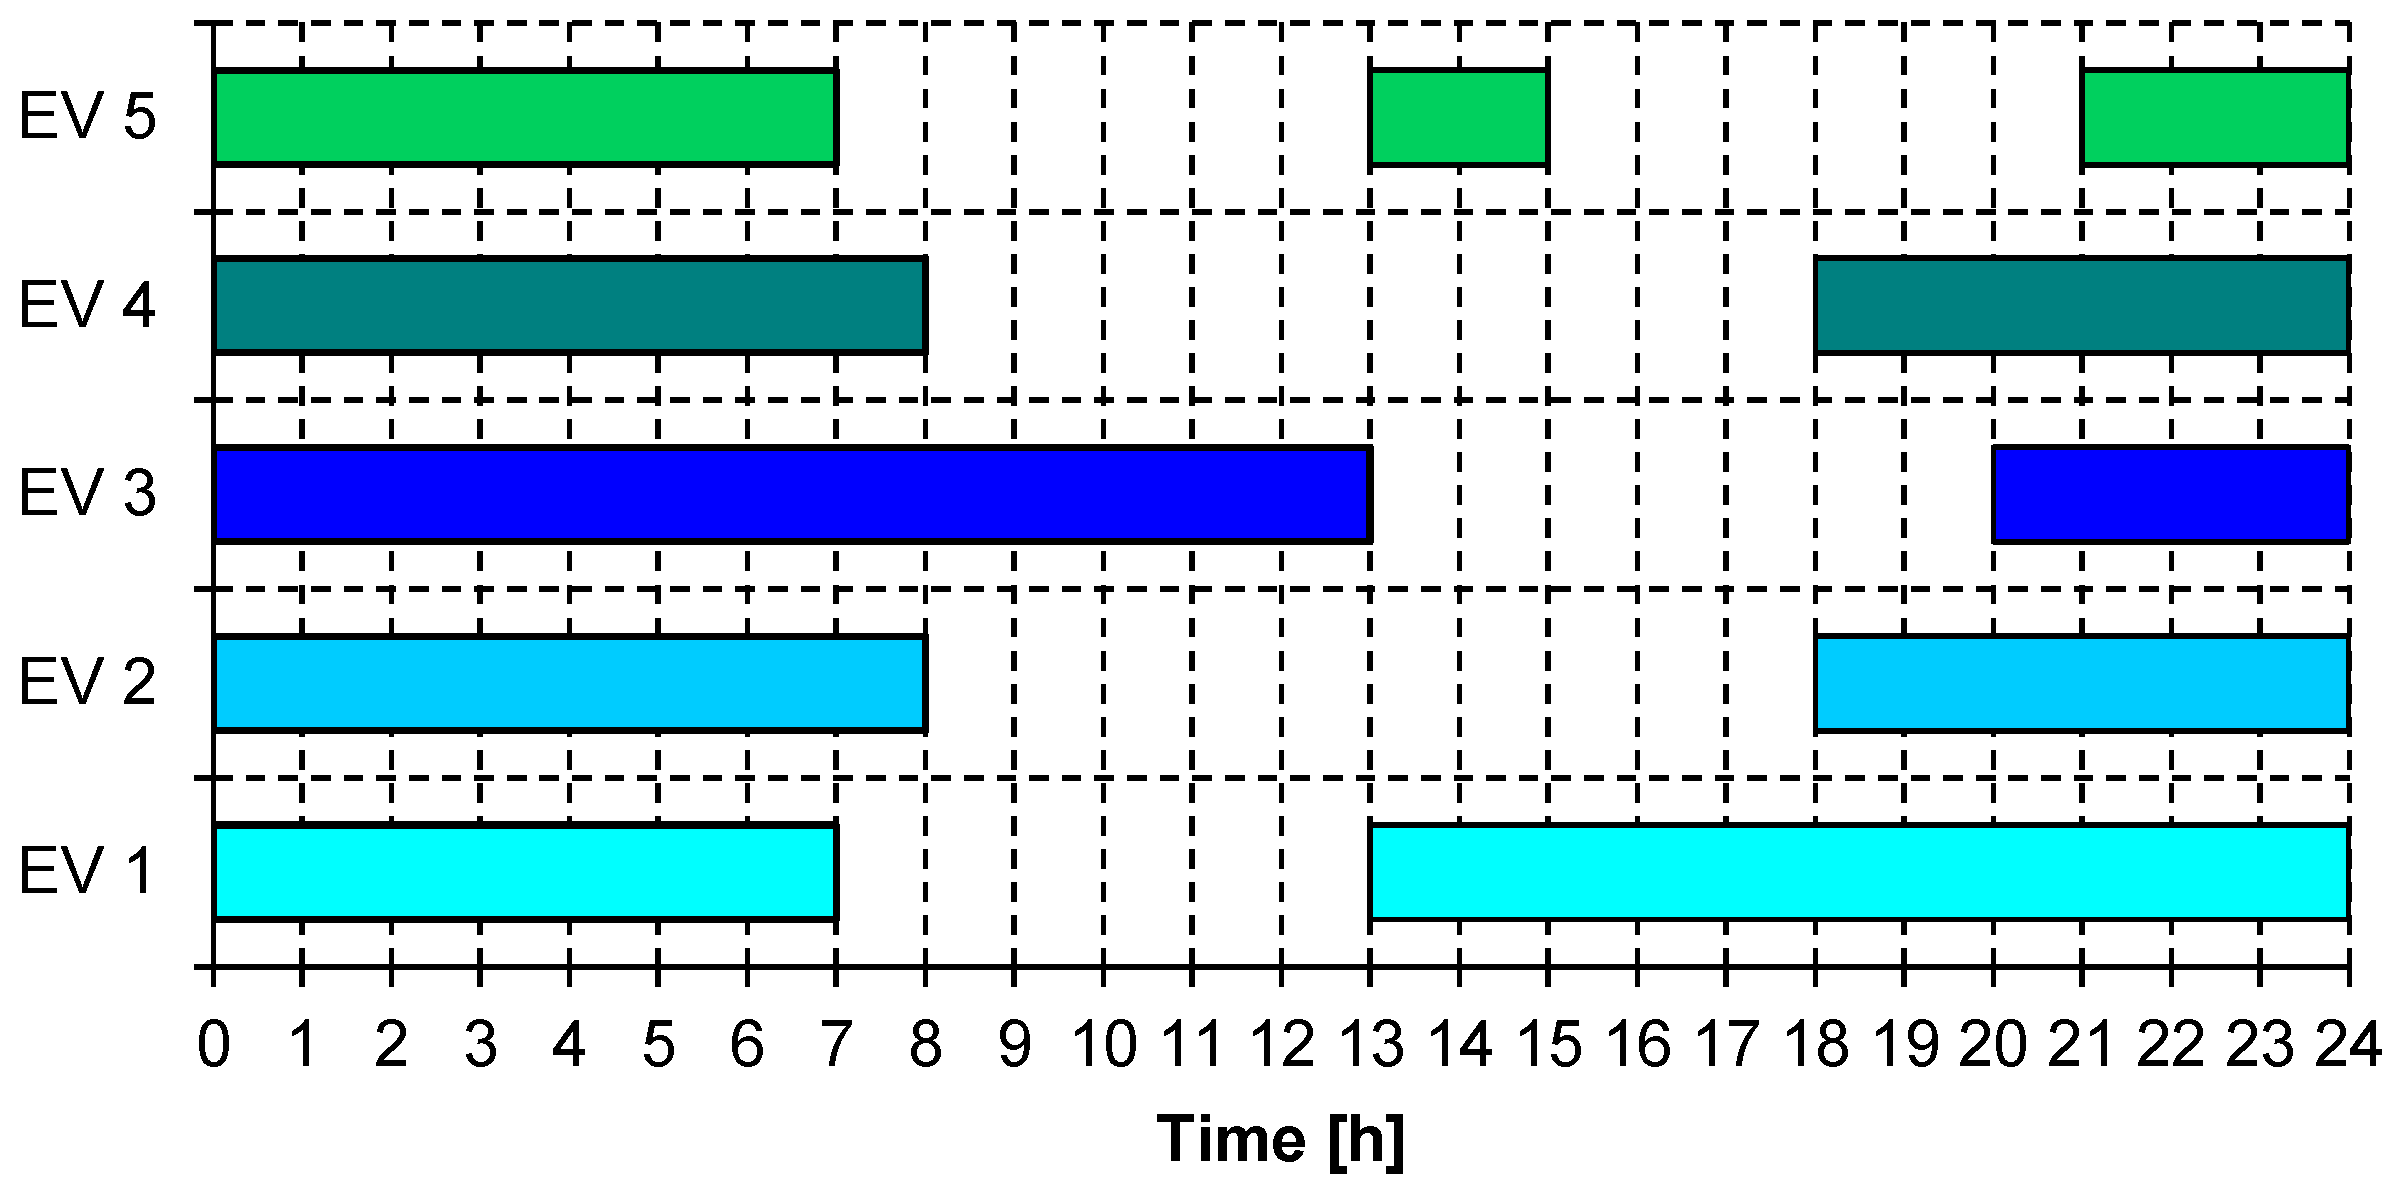
The goal of DC microgrid optimal design under the EV exploitation conditions and space limitations is achieved by minimizing the total lifetime cost C T of the EVSI:
C T = C B + C O .
The lifetime operation cost C O is determined by actualizing the yearly operation cost of the EVSI C O Y , determined by considering the occurrence of the s-th scenario for D s times over one year, as follows:
C O Y = s = 1 N s D s t = 1 N t Δ t [ q s , t w P s , t w γ s , t g P s , t g + j Ω j ( q j , s , t P j , s , t c + γ j , s , t P j , s , t d ) ]
where the terms in square brackets include total cost for electricity purchase from AC network at unit cost q s , t w , total income from power delivery to AC network at unit revenue γ s , t g , total degradation cost for EV charge at rate q j , s , t , and for EV discharge at rate γ j , s , t .
Assuming that the analyzed year replicates along all the lifetime, C O is determined by discounting C O Y by the annuity factor:
C O = 1 ( 1 + α ) N y α C y
The building cost C B is determined as the sum of purchasing and installation costs associated to PVs C B P , ESSs C B I , EV stations C B K , and grid connections C B G , as follows:
C B = C B P + C B I + C B K + C B G
The single contributions are determined by the following (40)–(43), respectively, exploiting unit costs for PV panels c p and ESS modules c i related to total size, whereas costs of PV converters c m , ESS converters c h , EV station technologies c r , grid converter c f , and AC grid connection c g are linked to the values of binary variables for size selection.
C B P = p Ω p ( c p R p + m Ω m c m b m , p )
C B I = i Ω i ( c i R i + h Ω h c h b h , i )
C B K = r Ω r c r k Ω k b r , k
C B G = f Ω f ( c f + c g ) b f
Microgrid optimal design problem can be synthesized in the following Mixed Integer Linear Programming formulation:
min C T ( x ) s . t . { g ( x ) = 0 h ( x ) 0 x _ x x ¯
where equalities g ( x ) = 0 , inequalities h ( x ) 0 , and state variable limits x _ x x ¯ include the relations reported in Section 2.2.

3. Test System

The investigation is based on the expected installation of the proposed system in the area of the Bari Port Authority, Italy, where a fleet of service EV is aimed to serve utility needs. In particular, five EVs, with nominal sizes of 24 kWh and exploitable SOC range of 0.2÷0.9 p.u., are supposed to replace current fuel-based service cars. Their uses are depicted in Figure 2 and Figure 3, in terms of average daily route length and average vehicle parking time, respectively. Each EV leaves the station with a SOC of 0.8 p.u. According to these data, five charging stations are considered in the EVSI since all the EVs are parked at night. It can be noted that EV5 has two parking intervals, therefore they are dealt with separately in the procedure, just as there were six EVs.
Meteorological data are taken from a one-year measurement of a weather station, on an hourly basis [34]. In accordance with data sources, the analysis is carried out with a time step duration Δ t = 1 h.
The collected data on vehicle usage and weather conditions for the reference year are divided in N s = 9 scenarios, according to seasons and weather conditions, as detailed in Table 1 where the numeration and occurrence times D s are reported. Within each scenario, a proper ratio of working days and holidays is applied. Two kinds of PV panels and three battery typologies are exploitable, and their features are synthesized in Table 2 and Table 3, respectively. Available room for their installation is limited by S k = 15 m2, S t o t = 120 m2, V t o t = 2 m3. Moreover, different converter sizes are considered, as reported in Table 4, where efficiency values and installation costs are shown as well. The latter are estimated by proper linear cost functions according to converter size, obtained from an ad hoc market investigation.
The AC grid connection cost c g is fixed at 125 €/kWh. The cost of electricity withdrawal from the grid q s , t w varies for hours and scenarios, in the range 0.14÷0.19 €/kWh, whereas unit revenue for electric energy delivery γ s , t g is in the range 0.025÷0.055 €/kWh [37]. EV charging cost q j , s , t is fixed at 0.05 €/kWh according to values for wearing cost [38], whereas EV discharge is not priced ( γ j , s , t = 0). EVSI lifetime N y is assumed equal to 20 years, with discount rate α equal to 0.05.

4. Results and Discussion

The procedure is implemented in MatLAB2015b® framework, and solved by means of intlinprog function. In particular, a first solution of the linear relaxed problem (without integer constraints on variables) is obtained by interior-point, therefore a cut generation to restrict the linear solution is performed and finally the branch-and-bound technique is applied, generating two subproblems by proper heuristics and evaluating the most suitable solution according to best projection on improving lower or upper bounds [39]. Simulations are carried out on a workstation HP Z440 equipped with Intel Xeon 3.50 GHz processor with 16 GB RAM.
In Table 5, the values of average power π j , s are synthesized. It can be noted that the values are quite low, seldom exceeding 1 kW, therefore the choice of the minimum size for station is expected.
As regards EV-station commitment, the results are illustrated in Figure 4. It can be seen that the 5 EVs are associated to stations according to the order of π j , s , since they are contemporaneously parked during the night. Moreover, since EV4 always has the maximum power demand, it is always associated with the first station. The mid-day parking interval of EV5 is associated with the first available station.
A synthesis of the obtained results is reported in Table 6 for installations, where unexploited technologies among the available ones described in Section 2 are not reported for purpose of brevity. It can be seen that the goal of minimum economic effort is reached by exploiting the lower size of EV stations, polycrystalline PV modules and, where deemed necessary, LiPo batteries. No ESS installation is provided, due to the high installation cost of the converter and to the possibility of exploiting EVs for storage tasks thanks to V2G stations.
Yearly energy exchange levels are reported in Figure 5, where it can be seen that, out of the total value of 19.86 MWh, PV covers 76.1% of production, leaving 16.6% to EV discharge and 7.3% to grid withdrawal. Whereas, total consumption is composed by EV charge for 58.1% grid injection for 35.9% and losses represent 6.0%. Moreover, the ratio of grid withdrawal on grid injection is 0.203, whereas the ratio of EV discharge on EV charge is 0.285, showing a preference to EV as power storage, when present.
Economic results are synthesized in Table 7. It can be noted that the building cost represents almost 93% of the objective function. Operation costs are very limited, reaching 518.5 € yearly.
For sake of exemplification, trends in all the analyzed scenarios of electric power balance, of EV power exchange levels and of state of charge (SOC) of EVs are reported in Figure 6, Figure 7 and Figure 8, respectively. It can be seen that an amount of grid power delivery is observed in all scenarios except rainy days of Scenario 3 and Scenario 6, where the limited PV production is fully exploited to charge EVs. Whereas, grid power withdrawal is registered only in five scenarios, and is not present in summer. A limited amount of EV discharge is observed in all scenarios, mostly related to EV 3 and EV 1 due to their parking time in intervals with higher PV production, allowing SOC increase beyond the final value or a decrease towards the minimum. However, EV discharge is present only to exchange power with other EVs.
As regards computational performances, the whole procedure took 40.0 s to reach the solution.

5. Conclusions

In this paper, a mixed-integer linear optimization methodology has been carried out for techno-economic sizing of a DC-microgrid including PV canopy, EV charging stations with V2G features, and battery-based ESS with the connection to AC distribution network. The procedure is based on the definition of operating scenarios according to weather conditions and EV uses, and involves a specific model for the commitment of EV connection to charging station according to EV planned mobility needs. The proposed approach has been applied to a case study of envisaged EV service fleet for Bari Port Authority. Results have shown that the presence of ESS can be hindered by the higher cost due to dedicated converters. The effectiveness of the EV-station commitment strategy has been verified. Future work will deal with the investigation of further DC microgrid configurations, as well as the influence of reliability figures on the selection of the technical solutions.

Author Contributions

M.D., G.F. and R.S. provided for research framework and literature analysis; B.A., G.F. and M.T. developed the model; M.D., I.F. and R.S. cared for data collection; B.A., I.F. and G.F. set up the program and performed the simulations; B.A., I.F. and M.T. formalized the nomenclature; B.A. and G.F. wrote the paper; M.D. and M.T. edited the paper; M.D. and M.T. cared for relation with funding project.

Funding

This document has been created in the context of the CONNECT project. The CONNECT project has received funding from the ECSEL Joint Undertaking under Grant Agreement n° 737434-2 and from the national programmes/funding authorities of Germany, Italy, Slovakia, Spain, and The Netherlands. The ECSEL JU has no liability in respect of this document, which is merely representing the authors’ view.

Conflicts of Interest

The authors declare no conflict of interest. The funders had no role in the design of the study; in the collection, analyses, or interpretation of data; in the writing of the manuscript, or in the decision to publish the results.

Nomenclature

Indices (subscripts)
tTime step
sScenario
pPhotovoltaic (PV) technology
iEnergy storage system (ESS) technology
jElectric vehicle (EVs)
kEV station
rCharging/V2G technology standard
mPV converter
hESS converter
fAC/DC grid connection converter
Sets and general definitions
N t Total number of time steps
N s Total number of scenarios
Ω p Set of available PV technologies (total number N p )
Ω i Set of available ESS technologies (total number N i )
Ω j Set of EVs (total number N j )
Ω k Set of charging stations (total number N k )
Ω r Set of EV charging/V2G standards (total number N r )
Ω m Set of PV converters (total number N m )
Ω h Set of ESS converters (total number N h )
Ω f Set of AC/DC converters (total number N f )
N y Total number of years of the analysis
α Discount rate
Δ t Duration of each time step [h]
D s Number of occurrences of the s-th scenario in a year
Cost breakdown
C T Total lifetime cost of the microgrid [€]
C B Total building cost of the microgrid [€]
C B P Building cost of the PVs and their connection [€]
C B I Building cost of the ESSs and their connection [€]
C B K Building cost of the EV stations and their connection [€]
C B G Building cost of DC microgrid internal connections and of AC network interface [€]
C O Total operation cost of the microgrid [€]
C O Y Yearly operation cost of the microgrid [€]
PV system parameters
S k parking surface for each charging station [m2]
S t o t total available surface for EV parking roofs [m2]
η p s t d standard efficiency of the p-th PV technology
η p , s , t efficiency of the p-th PV technology in the t-th time step of the s-th scenario
G p , s , t solar radiation on the p-th PV at the t-th time step in the s-th scenario [kW/m2]
ϑ s , t external temperature at the t-th time step in the s-th scenario [°C]
a p power coefficient of the p-th PV technology [1/K]
ϑ p normal operating temperature of the p-th PV technology [°C]
M p Unit power of the p-th PV technology panel [kW]
W m Installed power for the m-th PV converter [kW]
ζ M PV converter efficiency
c p Investment cost of a PV panel of the p-th technology [€/kW]
c m Investment cost of the m-th PV converter [€]
Energy storage system parameters
η i c , η i d charge and efficiency of the i-th ESS
e ¯ i , e _ i maximum and minimum allowable state of charge SOC for the i-th ESS, in p.u. of installed size
E i , s , 0 initial condition of SOC for the i-th ESS in the s-th scenario [kWh]
V t o t total available volume for hosting ESS [m3]
δ i specific energy per unit of volume for the i-th ESS [kWh/m3]
φ i c , φ i d energy-to-power ratio, of the i-th ESS in charge and discharge conditions [kWh/kW]
z i self-discharge rate of the i-th ESS
M i Unit size of the i-th ESS technology module [kWh]
W h Installed power for the h-th ESS converter [kW]
ζ H ESS converter efficiency
c i Investment cost of an ESS module for the i-th technology [€/kWh]
c h Investment cost of the h-th ESS converter [€]
Electric vehicles and stations parameters
ρ j c , ρ j d charge and efficiency of the j-th EV
v ¯ j , v _ j maximum and minimum SOC for the j-th EV
τ j , s A , τ j , s L arrival and leaving time step of the j-th EV at the station in the s-th scenario
E j , s A , E j , s L SOC at arrival and leaving time for the j-th EV in the s-th scenario [kWh]
J s , t number of parked EVs at the t-th time step in the s-th scenario
J ¯ s maximum number of parked EVs in the s-th scenario
τ ¯ s time step with the maximum number of parked EVs in the s-th scenario
P ¯ j c , P ¯ j d maximum charge and discharge power of the j-th EV [kW]
Ψ r c , Ψ r d maximum charge and discharge power of the r-th charging/V2G standard [kW]
π j , s Average power needed to charge the j-th EV in the s-th scenario over the defined parking time
β j , k , s Binary value assigning the connection of the j-th EV at the k-th station in the s-th scenario
ζ K charging station efficiency
c r Investment cost in the r-th technology for vehicle charging/V2G station [€]
q j , s , t , γ j , s , t Cost for EV charge and EV discharge at the t-th time step in the s-th scenario [€/kWh]
Grid connection parameters
W f Nominal power of the f-th AC/DC converter [kW]
ζ F AC/DC converter efficiency
P ¯ g Maximum exchangeable power at PCC, in either injection or withdrawal [kW]
q s , t w Cost for electric energy purchase from the grid at PCC at the t-th time step in the s-th scenario [€/kWh]
γ s , t g Revenue for electric energy delivery to the grid at PCC at the t-th time step in the s-th scenario [€/kWh]
c f Investment cost of the f-th grid converter [€]
c g Investment cost of AC grid connection [€]
Real State Variables
P s , t w Amount of power withdrawal from the distribution grid at the t-th time step in the s-th scenario [kW]
P s , t g Amount of power injected into the distribution grid at the t-th time step in the s-th scenario [kW]
P i , s , t c Charge power for the i-th ESS at the t-th time step in the s-th scenario [kW]
P i , s , t d Discharge power for the i-th ESS at the t-th time step in the s-th scenario [kW]
E i , s , t State of charge (SOC) of the i-th ESS at the t-th time step in the s-th scenario [kWh]
P j , s , t c Charge power for the j-th EV at the t-th time step in the s-th scenario [kW]
P j , s , t d Discharge power for the j-th EV at the t-th time step in the s-th scenario [kW]
E j , s , t State of charge (SOC) of the j-th EV at the t-th time step in the s-th scenario [kWh]
P ¯ k c maximum charge power at k-th station
P ¯ k d maximum discharge power at k-th station
R p Installed power for the p-th PV technology [kW]
R i Installed size for the i-th ESS technology [kWh]
R F Installed power for the grid converter [kW]
Integer State Variables:
b s , t g Variable to select power withdrawal or injection from the AC grid at the t-th time step in the s-th scenario
b i , s , t Variable to select either charge or discharge for the i-th ESS at the t-th time step in the s-th scenario
b j , s , t Variable to select either charge or discharge for the j-th EV at the t-th time step in the s-th scenario
b r , k Variable linking the k-th station to the r-th standard for charging/V2G it is equipped with
n p Number of modules for the p-th PV technology
n i Number of battery modules of the i-th ESS technology
b m , p Binary variable indicating if the m-th PV converter is exploited for the p-th PV technology
b h , i Binary variable indicating if the i-th ESS converter is exploited for the i-th ESS technology
b f Binary variable to select the installation of the f-th two-port AC/DC grid converter

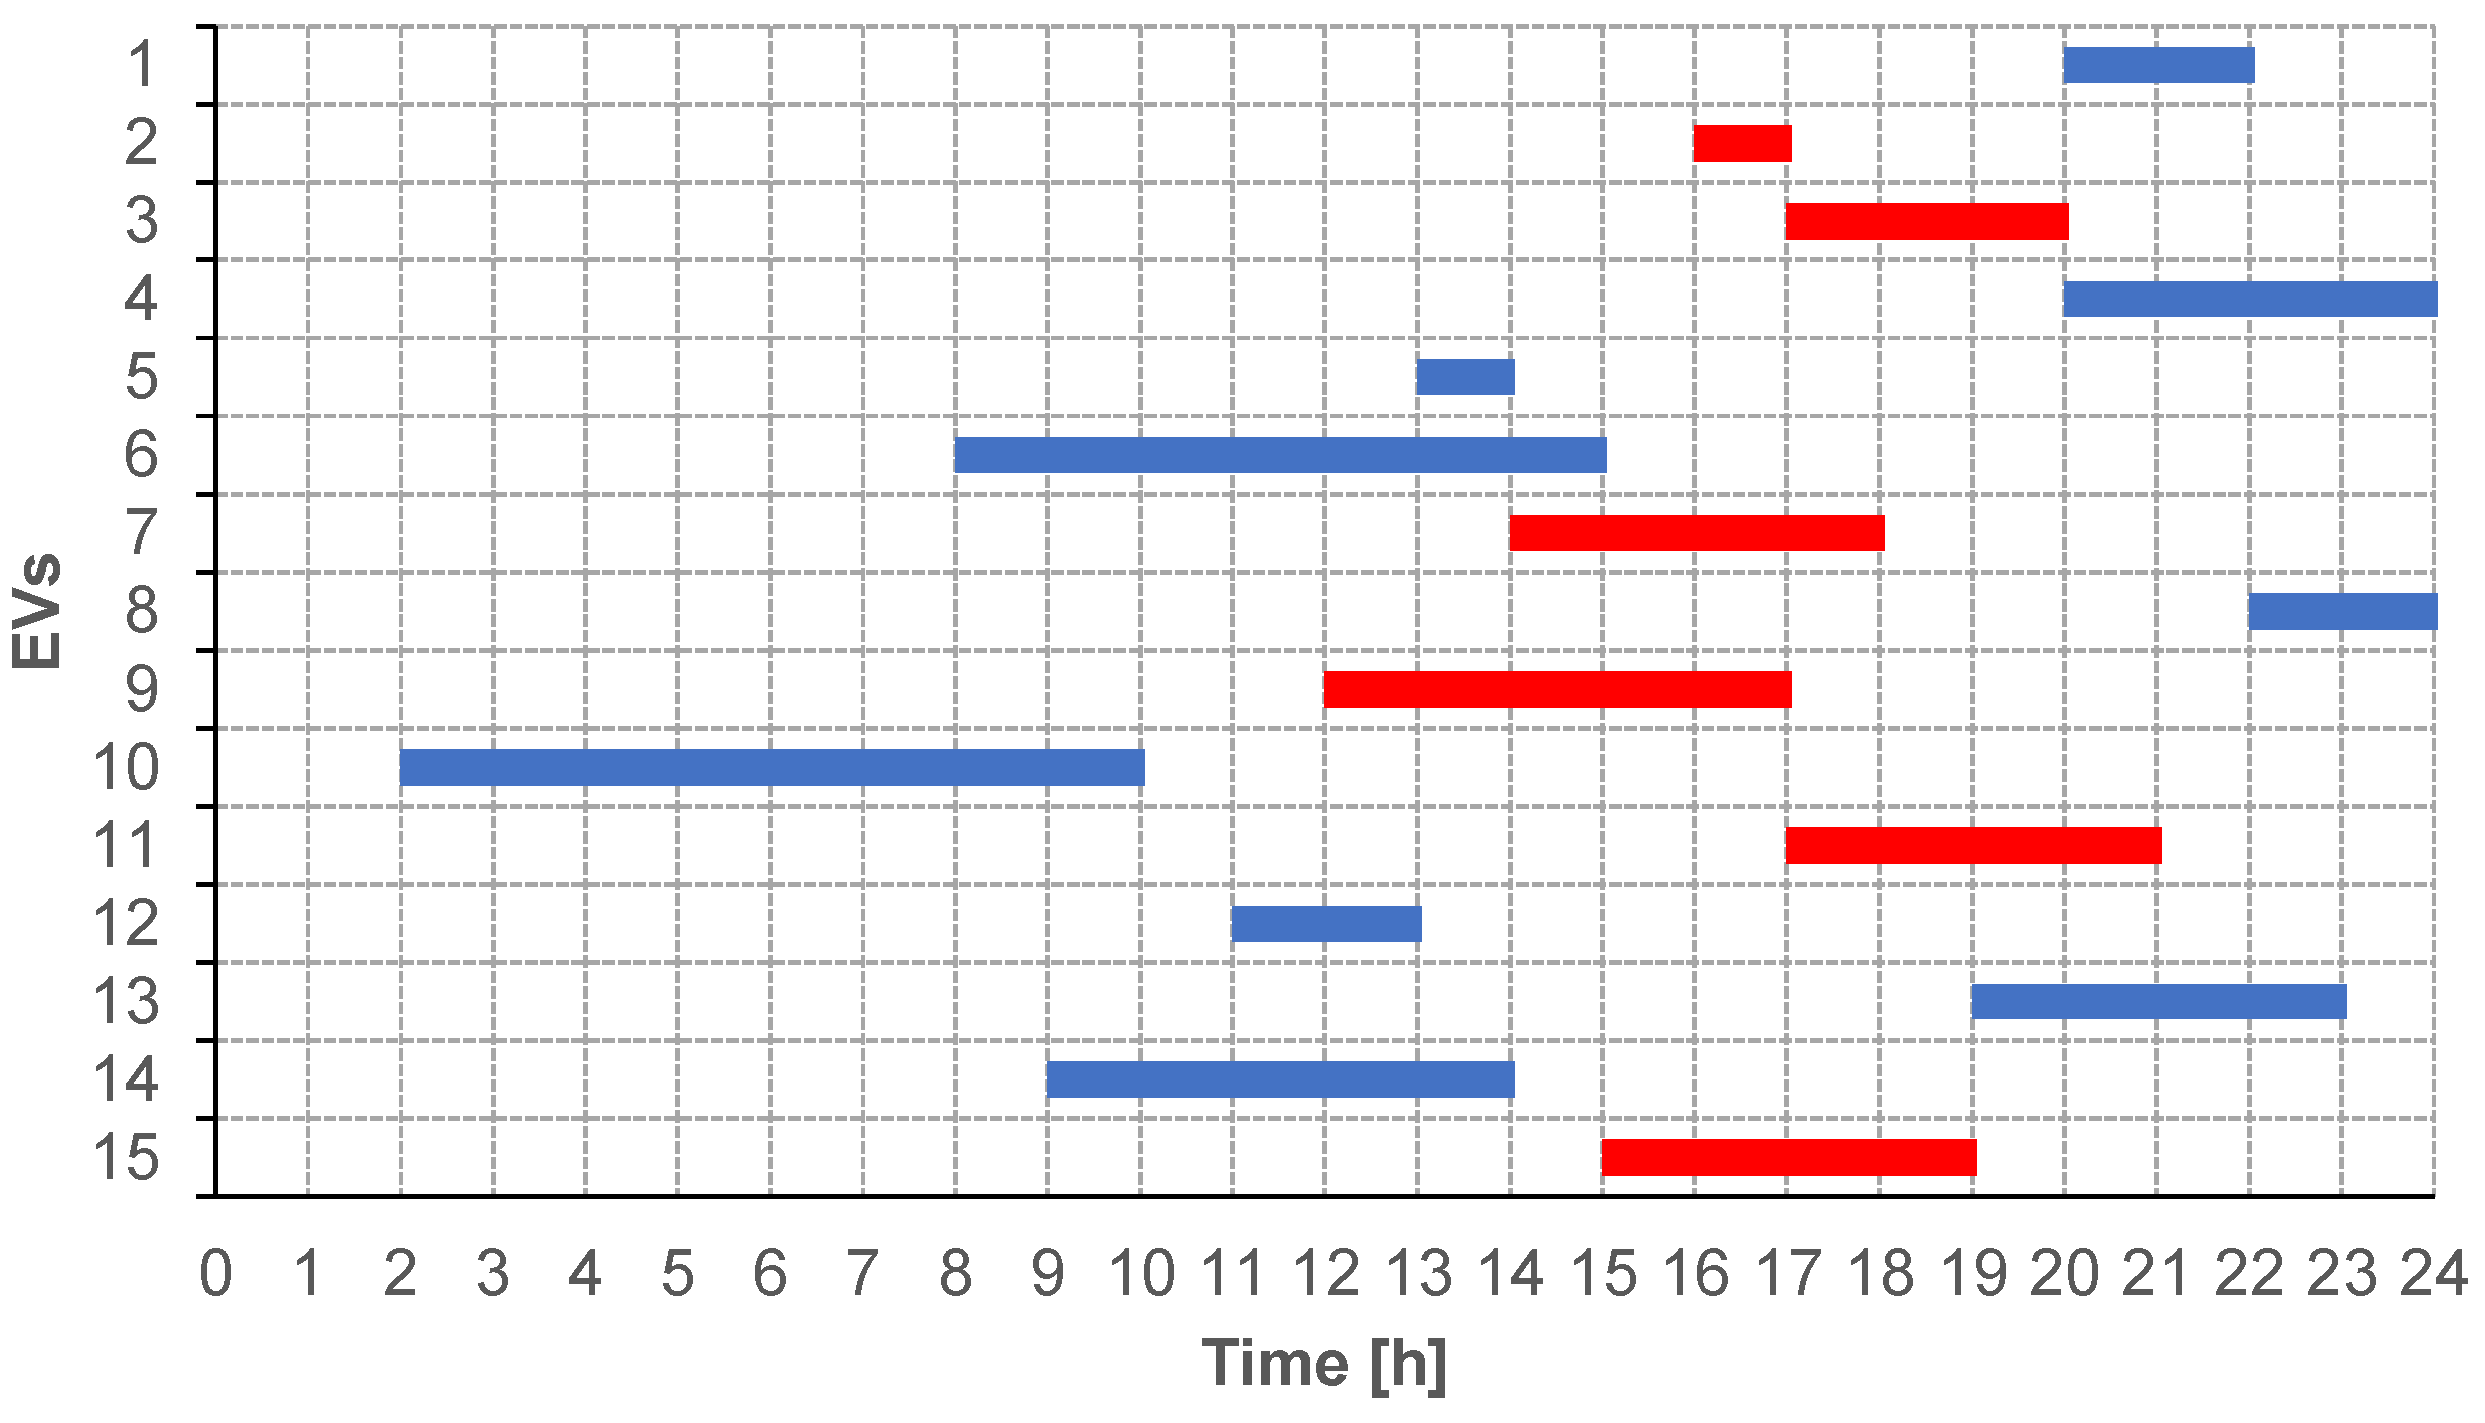
Appendix A. An Example of EV and Station Commitment Procedure

Let us suppose that a group of 15 EVs should be managed by a microgrid including N k = 7 stations, according to a scenario of utilization. In Figure A1, they are numbered according to the power index π j , s and their parking times are represented. It can be seen that, in this case, a maximum of J ¯ s = 6 EVs are contemporaneously parked at τ ¯ s = 17, namely, EVs 2, 3, 7, 9, 11, 15. These EVs are associated to the first six stations in this order.
Figure A1. Example of EV and station commitment. Parking time of 15 EVs; in red, the EVs parked at hour 17.
Energies 12 01901 g0a1
Therefore, the remaining EVs are committed, according to the numbering order. In particular, EV 1 finds station 1 free at its parking time, and is settled there. Whereas, EV 4 cannot be connected to station 1, busy due to the presence of EV 1, nor to station 2, where EV 2 is connected, but it finds station 3 free. Proceeding in this way, the final EV-station commitment is obtained, as reported in Table A1, where bold numbers report EVs parked at hour 17. It can be noted that station 7 is unexploited.
Table A1. Example of EV and station commitment. Allocation of all EVs at microgrid stations.
Hours123456789101112131415161718192021222324
Stations
1 101010101010101010 55 22 111
2 66666666 3333 888
3 12121277777 44444
4 999999 1313131313
5 141414141414 1111111111
6 1515151515
7
In this way, for the selected scenario, the binary parameter β j , k , s is determined as reported in Table A2, where values equal to 0 are not reported for sake of readability.
Table A2. Example of EV and station commitment. Values of the binary parameter EV-station.
EVs123456789101112131415
Stations
111 1 1
2 1 1 1
3 1 1 1
4 1 1
5 1 1
6 1
7

References

  1. Vithayasrichareon, P.; Mills, G.; MacGill, I.F. Impact of electric vehicles and solar PV on future generation portfolio investment. IEEE Trans. Sustain. Energy 2015, 6, 899–908. [Google Scholar] [CrossRef]
  2. Schroeder, A.; Traber, T. The economics of fast charging infrastructure for electric vehicles. Energy Policy 2012, 43, 136–144. [Google Scholar] [CrossRef]
  3. Abousleiman, R.; Scholer, R. Smart charging: System design and implementation for interaction between plug-in electric vehicles and the power grid. IEEE Trans. Transp. Electrif. 2015, 1, 18–25. [Google Scholar] [CrossRef]
  4. Garcia-Villalobos, J.; Zamora, I.; San Martin, J.I.; Asensio, F.J.; Aperribay, V. Plug-in electric vehicles in electric distribution networks: A review of smart charging approaches. Renew. Sustain. Energy Rev. 2014, 38, 717–731. [Google Scholar] [CrossRef]
  5. You, P.; Yang, Z. Efficient optimal scheduling of charging station with multiple electric vehicles via V2V. In Proceedings of the 2014 IEEE International Conference on Smart Grid Communications, Venice, Italy, 3–6 November 2014; pp. 716–721. [Google Scholar] [CrossRef]
  6. Bhatti, R.; Salam, Z.; Aziz, M.J.B.A.; Yee, K.P.; Ashique, R.H. Electric vehicles charging using photovoltaic: Status and technological review. Renew. Sustain. Energy Rev. 2016, 54, 34–47. [Google Scholar] [CrossRef]
  7. Tian, W.; Jiang, W.; Shahidehpour, M.; Krishnamurthy, M. Vehicle charging stations with solar canopy: A realistic case study within a smart grid environment. In Proceedings of the 2014 IEEE Transportation Electrification Conference and Expo, Bejing, China, 31 August–3 September 2014; pp. 1–6. [Google Scholar] [CrossRef]
  8. Brenna, M.; Dolara, A.; Foiadelli, F.; Leva, S.; Longo, M. Urban scale photovoltaic charging stations for electric vehicles. IEEE Trans. Sustain. Energy 2014, 5, 1234–1241. [Google Scholar] [CrossRef]
  9. Chukwu, U.C.; Mahajan, S.M. V2G parking lot with PV rooftop for capacity enhancement of a distribution system. IEEE Trans. Sustain. Energy 2014, 5, 119–127. [Google Scholar] [CrossRef]
  10. Tulpule, P.J.; Marano, V.; Yurkovich, S.; Rizzoni, G. Economic and environmental impacts of a PV powered workplace parking garage charging station. Appl. Energy 2013, 108, 323–332. [Google Scholar] [CrossRef]
  11. Fattori, F.; Anglani, N.; Muliere, G. Combining photovoltaic energy with electric vehicles, smart charging and vehicle-to-grid. Solar Energy 2014, 110, 438–451. [Google Scholar] [CrossRef]
  12. Sbordone, D.; Bertini, I.; Di Pietra, B.; Falvo, M.C.; Genovese, A.; Martirano, L. EV fast charging stations and energy storage technologies: A real implementation in the smart micro grid paradigm. Electr. Power Syst. Res. 2015, 120, 96–108. [Google Scholar] [CrossRef]
  13. Safak Bayram, I.; Michailidis, G.; Devetsikiotis, M.; Bhattacharya, S.; Chakrabortty, A.; Granelli, F. Local energy storage sizing in plug-in hybrid electric vehicle charging stations under blocking probability constraints. In Proceedings of the 2011 IEEE SmartGridComm Conference, Brussels, Belgium, 17–20 October 2011; pp. 78–83. [Google Scholar] [CrossRef]
  14. Pequito, S.; Popli, N.; Kar, S.; Ilic, M.D.; Aguilar, A.P. A framework for actuator placement in large scale power systems: Minimal strong structural controllability. In Proceedings of the 2013 5th IEEE International Workshop on Computational Advances in Multi-Sensor Adaptive Processing (CAMSAP), St. Martin, France, 15–18 December 2013; pp. 416–419. [Google Scholar] [CrossRef]
  15. Bruno, S.; La Scala, M.; Stecchi, U. Monitoring and control of a smart distribution network in extended real time DMS framework. In Proceedings of the CIGRE 2011 Bologna Symposium–The Electric Power System of the Future: Integrating Supergrids and Microgrids, Bologna, Italy, 13–15 September 2011. paper 177. [Google Scholar]
  16. Aluisio, B.; Dicorato, M.; Forte, G.; Trovato, M. A Monte-Carlo based procedure for optimal sizing of integrated electric vehicle supply infrastructure. In Proceedings of the IEEE ISGT Europe 2017 Conference, Turin, Italy, 26–29 September 2017; pp. 1–6. [Google Scholar] [CrossRef]
  17. Aluisio, B.; Dicorato, M.; Ferrini, I.; Forte, G.; Trovato, M. AC and DC solutions for electric vehicle microgrid: Sizing and reliability analysis. In Proceedings of the IEEE 2018 EEEIC/I&CPS Europe International Conference, Palermo, Italy, 12–15 June 2018; pp. 1–6. [Google Scholar] [CrossRef]
  18. Chandra Mouli, G.R.; Bauer, P.; Zeman, M. System design for a solar powered electric vehicle charging station for workplaces. Appl. Energy 2016, 168, 434–443. [Google Scholar] [CrossRef] [Green Version]
  19. Preetham, G.; Shireen, W. Photovoltaic charging station for plug-in hybrid electric vehicles in a smart grid environment. In Proceedings of the 2012 IEEE PES ISGT Conference, Berlin, Germany, 16–20 January 2012; pp. 1–8. [Google Scholar] [CrossRef]
  20. Ashique, R.H.; Salam, Z.; Bin Abdul Aziz, M.J.; Bhatti, A.R. Integrated photovoltaic-grid dc fast charging system for electric vehicle: A review of the architecture and control. Renew. Sustain. Energy Rev. 2017, 69, 1243–1257. [Google Scholar] [CrossRef]
  21. Kaur, S.; Kaur, T.; Khanna, R.; Singh, P. A state of the art of DC microgrids for electric vehicle charging. In Proceedings of the 4th IEEE ISPC 2k17 Conference, Solan, India, 21–23 September 2017; pp. 381–386. [Google Scholar] [CrossRef]
  22. Chen, Y.; Wei, W.; Zhang, F.; Liu, C.; Meng, C. Design of PV hybrid DC/AC microgrid for electric vehicle charging station. In Proceedings of the 2017 ITEC Asia-Pacific Conference, Harbin, China, 7–10 August 2017; pp. 1–6. [Google Scholar] [CrossRef]
  23. Liao, Y.-T.; Lu, C.N. Dispatch of EV charging station energy resources for sustainable mobility. IEEE Trans. Transp. Electrif. 2015, 1, 86–93. [Google Scholar] [CrossRef]
  24. Tushar, W.; Yuen, C.; Huang, S.; Smith, D.B.; Poor, H.V. Cost minimization of charging stations with photovoltaics: An approach with EV classification. IEEE Trans. Intell. Transp. Syst. 2016, 17, 156–169. [Google Scholar] [CrossRef]
  25. Lu, X.; Liu, N.; Chen, Q.; Zhang, J. Multi-objective optimal Scheduling of a DC micro-grid consisted of PV system and EV charging station. In Proceedings of the 2014 IEEE ISGT Asia Conference, Kuala Lumpur, Malaysia, 20–23 May 2014; pp. 487–491. [Google Scholar] [CrossRef]
  26. Marra, F.; Traeholt, C.; Larsen, E. Planning future electric vehicle central charging station connected to low-voltage distribution network. In Proceedings of the 2012 3rd IEEE International Symposium on Power Electronics for Distributed Generation Systems (PEDG), Aalborg, Denmark, 8 January 2012; pp. 636–641. [Google Scholar] [CrossRef]
  27. Corchero, C.; Cruz-Zambrano, M.; Heredia, F.-J.; Caro, J.-I.; Igualada-Gonzalez, L.; Romero-Ortega, A. Optimal sizing of microgrid, a fast charging station case. In Proceedings of the 2012 European Energy market (EEM) Conference, Florence, Italy, 10–12 May 2012; pp. 1–6. [Google Scholar] [CrossRef]
  28. Machiels, N.; Leemput, N.; Van Roy, J.; Geth, F.; Driesen, J. Design criteria for electric vehicle fast charge infrastructure based on Flemish mobility behavior. IEEE Trans. Smart Grid 2014, 5, 320–327. [Google Scholar] [CrossRef]
  29. Ugirumurera, J.; Haas, Z.J. Optimal capacity sizing for completely green charging systems for electric vehicles. IEEE Trans. Transp. Electrif. 2017, 3, 565–577. [Google Scholar] [CrossRef]
  30. Wang, C.; Jiao, B.; Guo, L.; Yuan, K.; Sun, B. Optimal planning of stand-alone microgrids incorporating reliability. J. Mod. Power Syst. Clean Energy 2014, 2, 195–205. [Google Scholar] [CrossRef] [Green Version]
  31. Dominguez, E.X.; Arboleya, P. Reliability assessment in photovoltaic nanogrids by means of principal components analysis. In Proceedings of the IEEE 2016 PES General Meeting, Boston, MA, USA, 17–21 July 2016; pp. 1–5. [Google Scholar] [CrossRef]
  32. Duffie, J.A.; Beckman, W.A. Solar Engineering of Thermal Processes, 4th ed.; John Wiley & Sons: Hoboken, NJ, USA, 2013. [Google Scholar]
  33. Zheng, L.; Zhu, J.; Wang, G.; He, T.; Wei, Y. Novel methods for estimating lithium-ion battery state of energy and maximum available energy. Appl. Energy 2016, 178, 1–8. [Google Scholar] [CrossRef] [Green Version]
  34. Wunderground—Weather Station Network. Available online: www.wunderground.com (accessed on 1 January 2018).
  35. Soloveichik, G.L. Battery technologies for large-scale stationary energy storage. Annu. Rev. Chem. Biomol. Eng. 2011, 2, 503–527. [Google Scholar] [CrossRef]
  36. Fathabadi, H. Novel high efficiency DC/DC boost converter for using in photovoltaic systems. Solar Energy 2016, 125, 22–31. [Google Scholar] [CrossRef]
  37. ARERA, the Italian Regulatory Authority for Energy, Networks and Environment, Electricity Prices for Customers. Available online: https://www.arera.it/it/prezzi.htm# (accessed on 31 October 2018). (In Italian).
  38. Aluisio, B.; Conserva, A.; Dicorato, M.; Forte, G.; Trovato, M. Optimal operation planning of V2G-equipped microgrid in the presence of EV aggregator. Electr. Power Syst. Res. 2017, 152, 295–305. [Google Scholar] [CrossRef]
  39. Nemhauser, G.L.; Wolsey, L.A. Integer and Combinatorial Optimization; John Wiley & Sons: New York, NY, USA, 1999. [Google Scholar]
Figure 1. Configuration for the DC-based microgrid.
Energies 12 01901 g001
Figure 2. Average route length for the considered vehicle fleet.
Energies 12 01901 g002
Figure 3. Average parking time for the considered vehicle fleet.
Energies 12 01901 g003
Figure 4. EV-station commitment for each scenario.
Energies 12 01901 g004
Figure 5. Optimal sizing results: yearly energy exchanges.
Energies 12 01901 g005
Figure 6. Electric power balance for each scenario.
Energies 12 01901 g006
Figure 7. EV power levels for each scenario.
Energies 12 01901 g007
Figure 8. State of charge of EVs for each scenario.
Energies 12 01901 g008
Table 1. Scenario numeration and occurrence times.
SeasonWeather Conditions
SunnyCloudyRainy
Scen. D s Scen. D s Scen. D s
Winter113246331
Mid-season478569635
Summer76482594
Table 2. Photovoltaic (PV) technologies characterization.
Technology M p   [ kW ] η p s t d c p   [ / kW ]
Monocrystalline0.1950.1531514
Polycrystalline0.2450.1481416
Table 3. Energy Storage Systems (ESS) technologies characterization.
Technology M i   [ kWh ] η i c , η i d e ¯ i , e _ i δ i ω i c , ω i d z i   [ % / h ] [35] c i   [ / kWh ]
LiPo3.70.951/0.2561.20.5/0.50.020175
ZEBRA19.80.921/0.2183.00.66/0.660.250250
Li-Ion2.00.951/0.239.20.59/0.590.008300
Table 4. Converter technologies features.
Converter TypeSizes [kW]Efficiency [36]Installation Cost [€]
DC/DC monodir. (PV)5, 10, 20, 30 ζ M = 0.975 c m = 93.247 W m + 9531
DC/DC bidir. (CS)10, 20 ζ K = 0.970 c r = 86.713 Ψ r c + 7104
DC/DC bidir. (ESS)10, 20, 30, 60 ζ H = 0.970 c h = 95.832 W i + 9498
Two-port AC/DC10, 20, 30, 60 ζ F = 0.960 c f = 41.562 W f + 2183
Table 5. Average power needed to cover electric vehicle (EV) mobility needs [kW].
EVsScenarios
123456789
EV10.100.130.080.070.080.070.110.120.09
EV20.430.350.360.170.200.140.130.110.14
EV30.100.080.140.070.110.100.110.050.10
EV40.470.460.550.280.450.360.170.210.23
EV5 (night)0.140.130.150.170.300.130.10.130.07
EV5 (mid-day)0.980.931.061.162.120.890.680.900.47
Table 6. Optimal sizing results: installation sizes.
Device or TechnologyNumberkWkWh
PV polycrystalline modules4611.27
ESS LiPo batteries0 0
Bidirectional EV stations510 (each)
Grid connection110
PV converter120
ESS converter0
Two-port grid converter110
Table 7. Optimal sizing results: economic yields.
Cost ComponentValue [€]
Building cost C B 83,483.6
Yearly operation cost C O Y 518.5
Lifetime operation cost C O Y 6449.8
Total EVSI cost C T 89,933.4

